vulnerability and adaptation of transportation...
TRANSCRIPT

1
Vulnerability and Adaptation of Transportation Infrastructure to Climate Change
Felio, Guy Ph.D. P.Eng. FCSCE, Practice Lead – Special Projects, Engineers Canada
Paper prepared for presentation At the RISK ASSESSMENT AND VULNERABILITY OF MOBILITY Session
Of the 2015 Conference of the Transportation Association of Canada
Charlottetown, PEI

2
Abstract:
It is clear that climate change represents a significant risk to the performance of engineered systems and to public safety in Canada. As such, engineers, asset managers and decision-makers must address climate change adaptation as part of their primary mandate – the protection of the public interest, which includes life, health, property, economic interests and the environment. Vulnerability and risk assessment form the bridge to ensure climate change is considered in engineering design, operations and maintenance of civil infrastructure. Identifying the components of the infrastructure that are highly vulnerable to climate change impacts allows cost-effective engineering, operations and policy solutions to be developed. This paper puts future climate risks in the context of the current condition of Canada’s infrastructure and the impacts of climate change. It presents a high level overview of some of the tools available to decision-makers and infrastructure practitioners to consider climate change impacts, from planning to operations and maintenance. The article focuses on processes and methodologies that have been used by public agencies and municipalities in Canada to identify and quantify risks, as well as develop climate change adaptation solutions. Engineers Canada’s PIEVC Protocol, a methodology used in more than 40 projects across Canada to evaluate the vulnerability of infrastructure is described in more detail. The Protocol has been applied to a wide spectrum of infrastructure: roads, highways, bridges and associated structures; potable water, wastewater and storm water systems; electrical transmission infrastructure and dams; buildings; airports; and coastal infrastructure. The applications cover all regions of Canada. An example of the risk assessment for a section of highway in British Columbia is presented to illustrate the application of the Protocol to a highway transportation system.

3
1 CONTEXT
It is fundamentally clear that climate change represents a profound risk to the performance of engineered systems and to public safety in Canada and around the world. As such, engineers, asset managers and decision-makers must address climate change adaptation as part of their primary mandate – the protection of the public interest, which includes life, health, property, economic interest and the environment. Climate change results in significant modifications of statistical weather patterns and consequently can have impacts on design data. Physical infrastructure systems designed using this inadequate data (i.e., data that is less relevant because actual conditions have changed) are vulnerable to failure, compromising public and economic safety. Engineering vulnerability and risk assessment form the bridge to ensure climate change is considered in engineering design, operations and maintenance of civil infrastructure. Identifying the components of the infrastructure within a system that are highly vulnerable to climate change impacts enables cost-effective engineering, operations and policy solutions to be developed.
1.1 Objectives and Limitations
This paper intends to inform decision-makers and infrastructure practitioners about some of the tools that consider climate change impacts to infrastructure, from planning to operations and maintenance. It offers a brief review of selected methodologies that have been used in Canada to develop integrated community adaptation plans, to assess the climate components in policy, and to evaluate the engineering vulnerability of infrastructure assets and systems. It focuses on processes and methods that have been used by public agencies and municipalities to identify and quantify risks, as well as to develop climate change adaptation solutions. It is not intended to provide an exhaustive list of all the methodologies that have been used or have been published on the subject. The fact that a particular tool is presented in this article does not constitute an endorsement. If a tool has been omitted, it is because of space or scope limitations, and should not be construed as a rejection of the tool as beneficial. The information and statements expressed in this article are those of the author and do not reflect the views, opinions or any official position of Engineers Canada.
1.2 Current and Future Climate
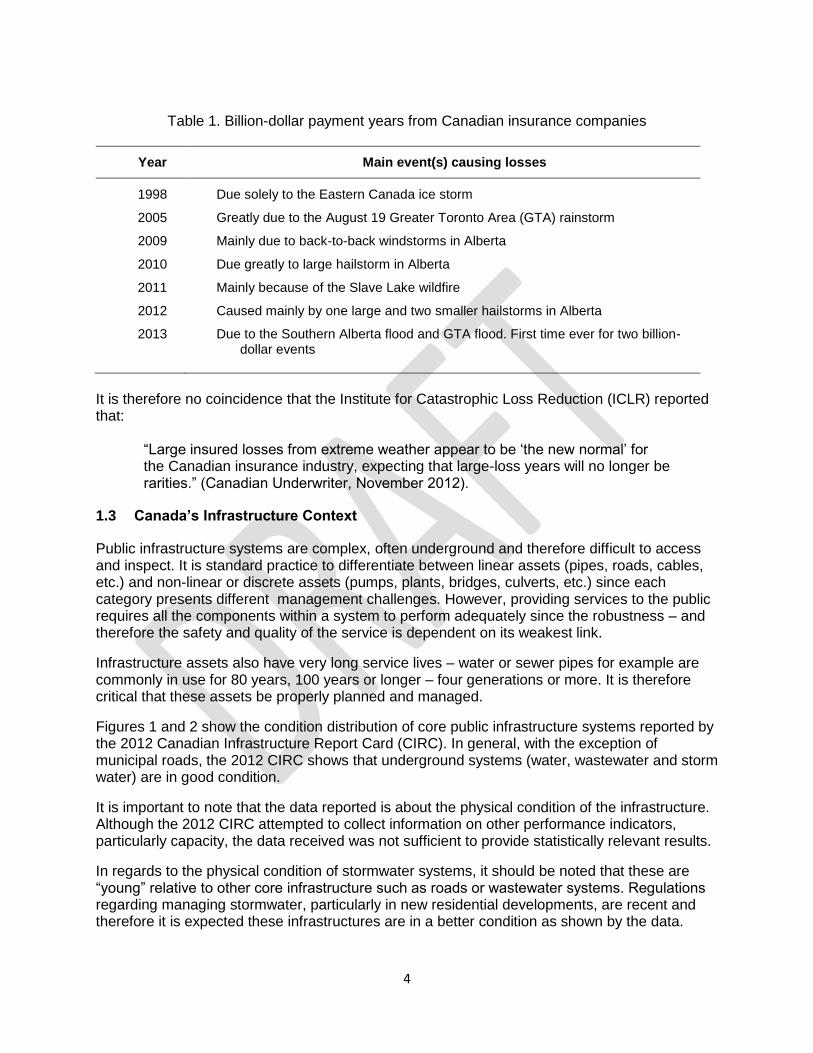
The changes in global climate have been, and continue to be well documented by a number of Canadian and international organizations such as the Intergovernmental Panel on Climate Change (IPCC) which produced its Fifth Assessment Report (AR5) in November 2014. In brief, the report tells policymakers what the scientific community knows about the scientific basis of climate change, its impacts and future risks, and options for adaptation and mitigation. From an infrastructure’s perspective, the story of climate change can be seen in the increasing number of occurrences of extreme weather events and their impacts. Table 1 presents the “billion dollar years” of payouts by Canadian insurers. Of note is the increased frequency of those devastating years, and the fact that 2013 was the first time ever insurance companies paid in excess of two billion dollars for losses.
4
Table 1. Billion-dollar payment years from Canadian insurance companies
Year Main event(s) causing losses
1998
2005
2009
2010
2011
2012
2013
Due solely to the Eastern Canada ice storm
Greatly due to the August 19 Greater Toronto Area (GTA) rainstorm
Mainly due to back-to-back windstorms in Alberta
Due greatly to large hailstorm in Alberta
Mainly because of the Slave Lake wildfire
Caused mainly by one large and two smaller hailstorms in Alberta
Due to the Southern Alberta flood and GTA flood. First time ever for two billion-dollar events
It is therefore no coincidence that the Institute for Catastrophic Loss Reduction (ICLR) reported that:
“Large insured losses from extreme weather appear to be ‘the new normal’ for the Canadian insurance industry, expecting that large-loss years will no longer be rarities.” (Canadian Underwriter, November 2012).
1.3 Canada’s Infrastructure Context
Public infrastructure systems are complex, often underground and therefore difficult to access and inspect. It is standard practice to differentiate between linear assets (pipes, roads, cables, etc.) and non-linear or discrete assets (pumps, plants, bridges, culverts, etc.) since each category presents different management challenges. However, providing services to the public requires all the components within a system to perform adequately since the robustness – and therefore the safety and quality of the service is dependent on its weakest link.
Infrastructure assets also have very long service lives – water or sewer pipes for example are commonly in use for 80 years, 100 years or longer – four generations or more. It is therefore critical that these assets be properly planned and managed.
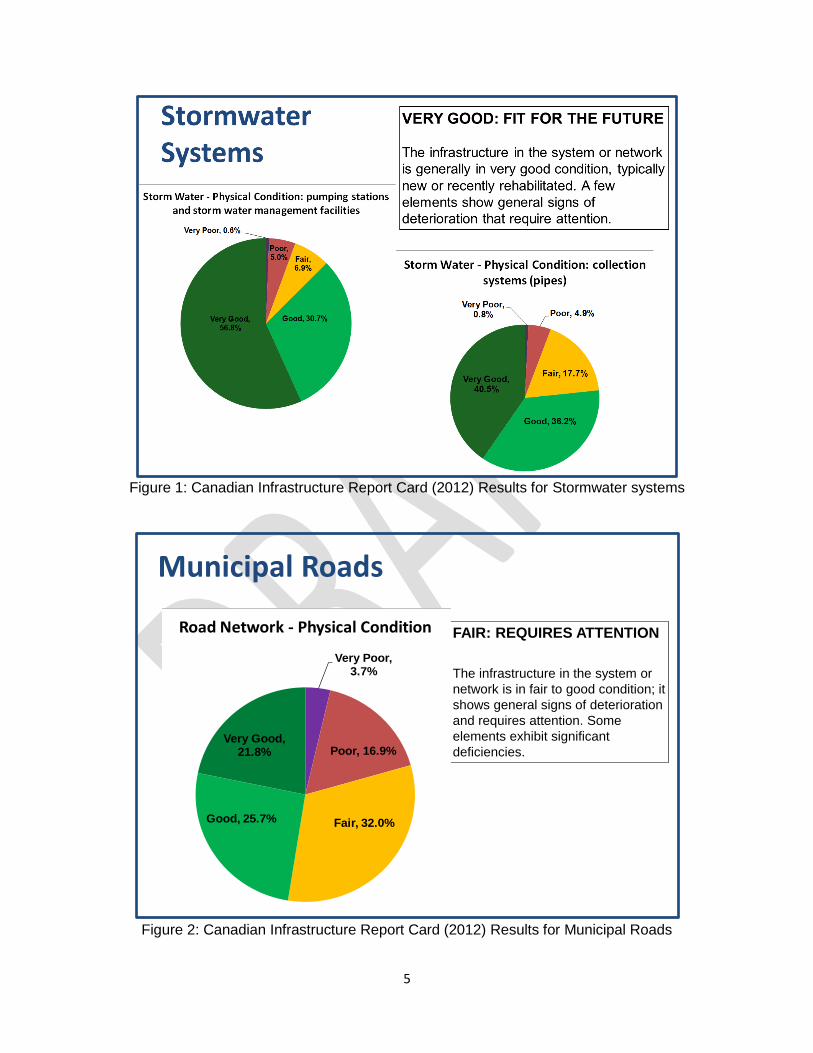
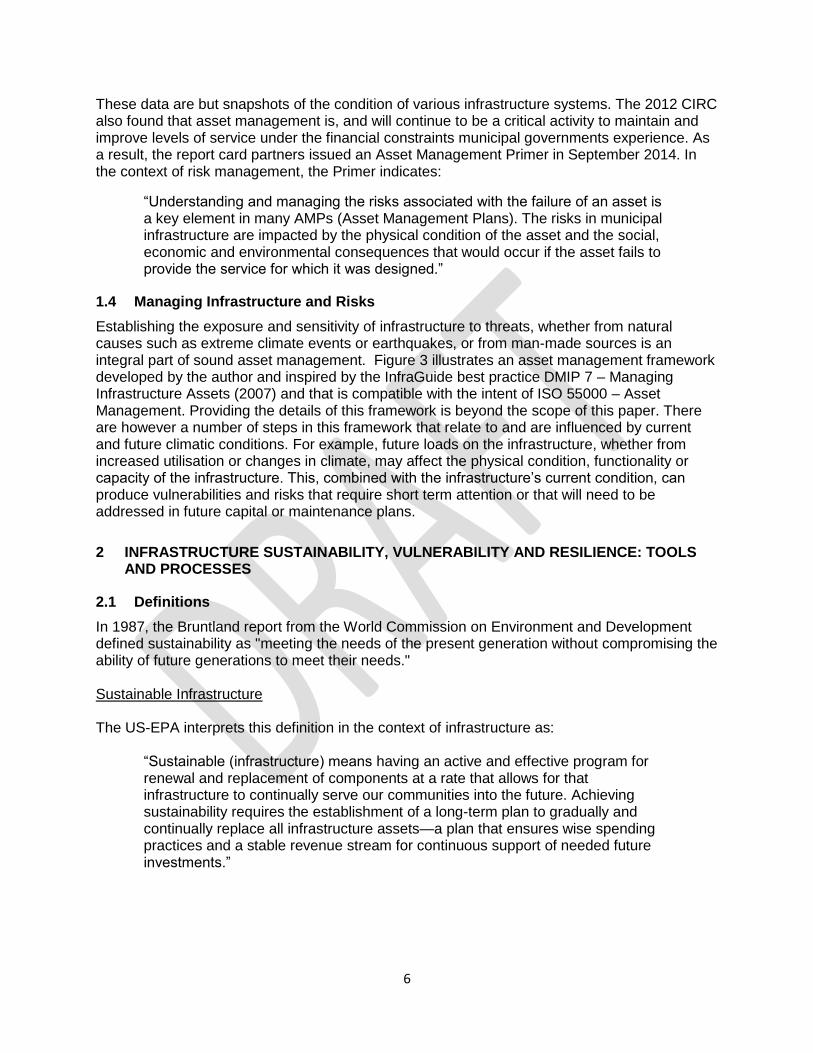
Figures 1 and 2 show the condition distribution of core public infrastructure systems reported by the 2012 Canadian Infrastructure Report Card (CIRC). In general, with the exception of municipal roads, the 2012 CIRC shows that underground systems (water, wastewater and storm water) are in good condition.
It is important to note that the data reported is about the physical condition of the infrastructure. Although the 2012 CIRC attempted to collect information on other performance indicators, particularly capacity, the data received was not sufficient to provide statistically relevant results.
In regards to the physical condition of stormwater systems, it should be noted that these are “young” relative to other core infrastructure such as roads or wastewater systems. Regulations regarding managing stormwater, particularly in new residential developments, are recent and therefore it is expected these infrastructures are in a better condition as shown by the data.
5
Figure 1: Canadian Infrastructure Report Card (2012) Results for Stormwater systems
Figure 2: Canadian Infrastructure Report Card (2012) Results for Municipal Roads
Municipal Roads
FAIR: REQUIRES ATTENTION
The infrastructure in the system or
network is in fair to good condition; it
shows general signs of deterioration
and requires attention. Some
elements exhibit significant
deficiencies.
Very Poor, 3.7%
Poor, 16.9%
Fair, 32.0%Good, 25.7%
Very Good, 21.8%
Road Network - Physical Condition
6
These data are but snapshots of the condition of various infrastructure systems. The 2012 CIRC also found that asset management is, and will continue to be a critical activity to maintain and improve levels of service under the financial constraints municipal governments experience. As a result, the report card partners issued an Asset Management Primer in September 2014. In the context of risk management, the Primer indicates:
“Understanding and managing the risks associated with the failure of an asset is a key element in many AMPs (Asset Management Plans). The risks in municipal infrastructure are impacted by the physical condition of the asset and the social, economic and environmental consequences that would occur if the asset fails to provide the service for which it was designed.”
1.4 Managing Infrastructure and Risks
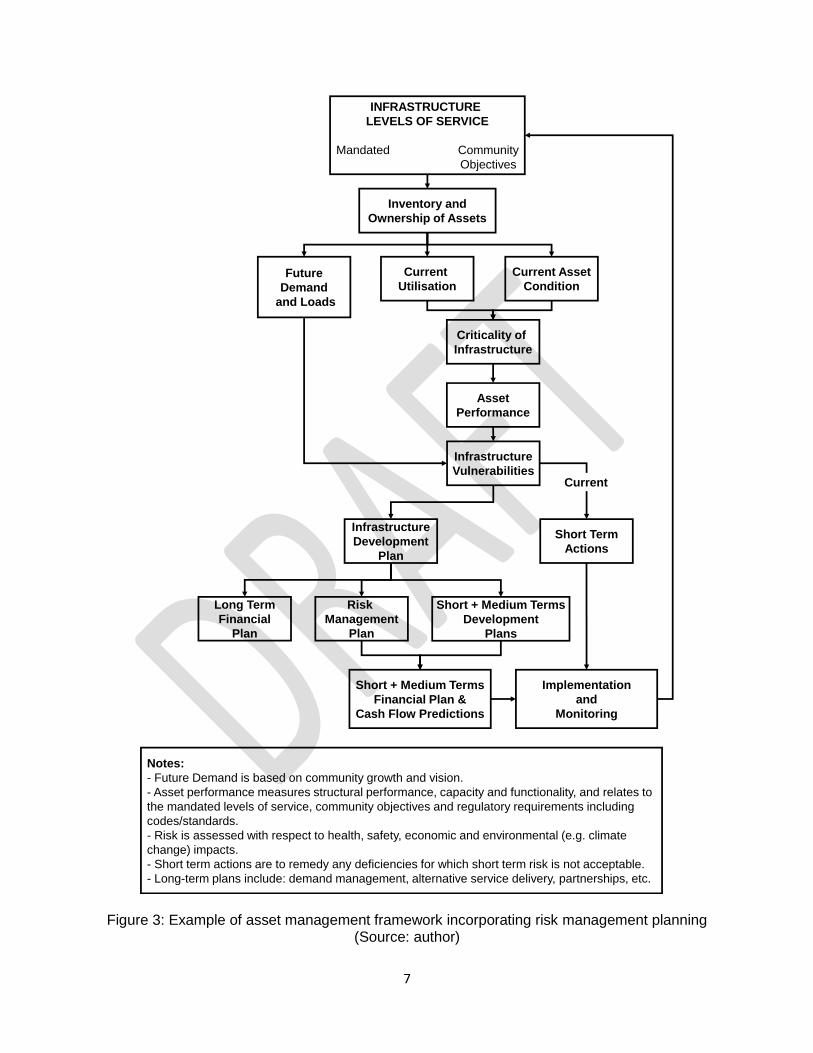
Establishing the exposure and sensitivity of infrastructure to threats, whether from natural causes such as extreme climate events or earthquakes, or from man-made sources is an integral part of sound asset management. Figure 3 illustrates an asset management framework developed by the author and inspired by the InfraGuide best practice DMIP 7 – Managing Infrastructure Assets (2007) and that is compatible with the intent of ISO 55000 – Asset Management. Providing the details of this framework is beyond the scope of this paper. There are however a number of steps in this framework that relate to and are influenced by current and future climatic conditions. For example, future loads on the infrastructure, whether from increased utilisation or changes in climate, may affect the physical condition, functionality or capacity of the infrastructure. This, combined with the infrastructure’s current condition, can produce vulnerabilities and risks that require short term attention or that will need to be addressed in future capital or maintenance plans.
2 INFRASTRUCTURE SUSTAINABILITY, VULNERABILITY AND RESILIENCE: TOOLS AND PROCESSES
2.1 Definitions
In 1987, the Bruntland report from the World Commission on Environment and Development defined sustainability as "meeting the needs of the present generation without compromising the ability of future generations to meet their needs." Sustainable Infrastructure The US-EPA interprets this definition in the context of infrastructure as:
“Sustainable (infrastructure) means having an active and effective program for renewal and replacement of components at a rate that allows for that infrastructure to continually serve our communities into the future. Achieving sustainability requires the establishment of a long-term plan to gradually and continually replace all infrastructure assets—a plan that ensures wise spending practices and a stable revenue stream for continuous support of needed future investments.”
7
Figure 3: Example of asset management framework incorporating risk management planning (Source: author)
INFRASTRUCTURE
LEVELS OF SERVICE
Mandated Community
Objectives
Inventory and
Ownership of Assets
Future
Demand
and Loads
Current
Utilisation
Current Asset
Condition
Criticality of
Infrastructure
Asset
Performance
Infrastructure
Development
Plan
Short Term
Actions
Risk
Management
Plan
Short + Medium Terms
Development
Plans
Long Term
Financial
Plan
Short + Medium Terms
Financial Plan &
Cash Flow Predictions
Notes:
- Future Demand is based on community growth and vision.
- Asset performance measures structural performance, capacity and functionality, and relates to
the mandated levels of service, community objectives and regulatory requirements including
codes/standards.
- Risk is assessed with respect to health, safety, economic and environmental (e.g. climate
change) impacts.
- Short term actions are to remedy any deficiencies for which short term risk is not acceptable.
- Long-term plans include: demand management, alternative service delivery, partnerships, etc.
Implementation
and
Monitoring
Infrastructure
VulnerabilitiesCurrent

8
Infrastructure Vulnerability Engineers Canada’s PIEVC Protocol defines the engineering vulnerability of infrastructure as:
“The degree to which a system is susceptible to, or unable to cope with, adverse effects of climate change, including climate variability and extremes. Vulnerability is a function of the character, magnitude, and rate of climate variation to which a system is exposed, its sensitivity, and its adaptive capacity.”
Engineering vulnerability is a function of:
Character, magnitude and rate of change in the climatic conditions to which infrastructure is predicted to be exposed;
Sensitivities of infrastructure to the changes, in terms of positive or negative consequences of changes in applicable climatic conditions; and
Built-in capacity of infrastructure to absorb any net negative consequences from the predicted changes in climatic conditions.
An engineering vulnerability assessment will therefore require assessing all three elements above. Although this definition is given in the context of climate change, it is applicable to any hazard or threat the infrastructure may be exposed to. Infrastructure Resilience Resilience, on the other hand, is the capacity of the infrastructure to withstand and operate under hazards or threats. The UN International Strategy for Disaster Reduction defines resilience as:
“The ability of a system, community or society exposed to hazards to resist, absorb, accommodate to and recover from the effects of a hazard in a timely and efficient manner, including through the preservation and restoration of its essential basic structures and functions.”
2.2 Community Assessment/Climate Change Adaptation Planning
In Canada, municipalities in some provinces have been required to produce Integrated Community Sustainability Plans (ICSPs) or variations thereof to receive Federal Gas Tax funds. The level of details about infrastructure condition, rehabilitation and replacement needs and long-term plans varies across the country since the requirements were defined under each Federal – Province/Territory agreement. In Nova Scotia, for example, municipalities were required to incorporate climate change into their ICSP beginning in 2013. A Municipal Climate Change Action Plan (MCCAP) Guidebook was developed to provide municipalities with a step-by-step process to follow. It is not known how climate change impacts to infrastructure have been considered in these plans or in other jurisdictions, but should be assessed.
2.2.1 ICLEI: Changing Climate, Changing Communities Framework
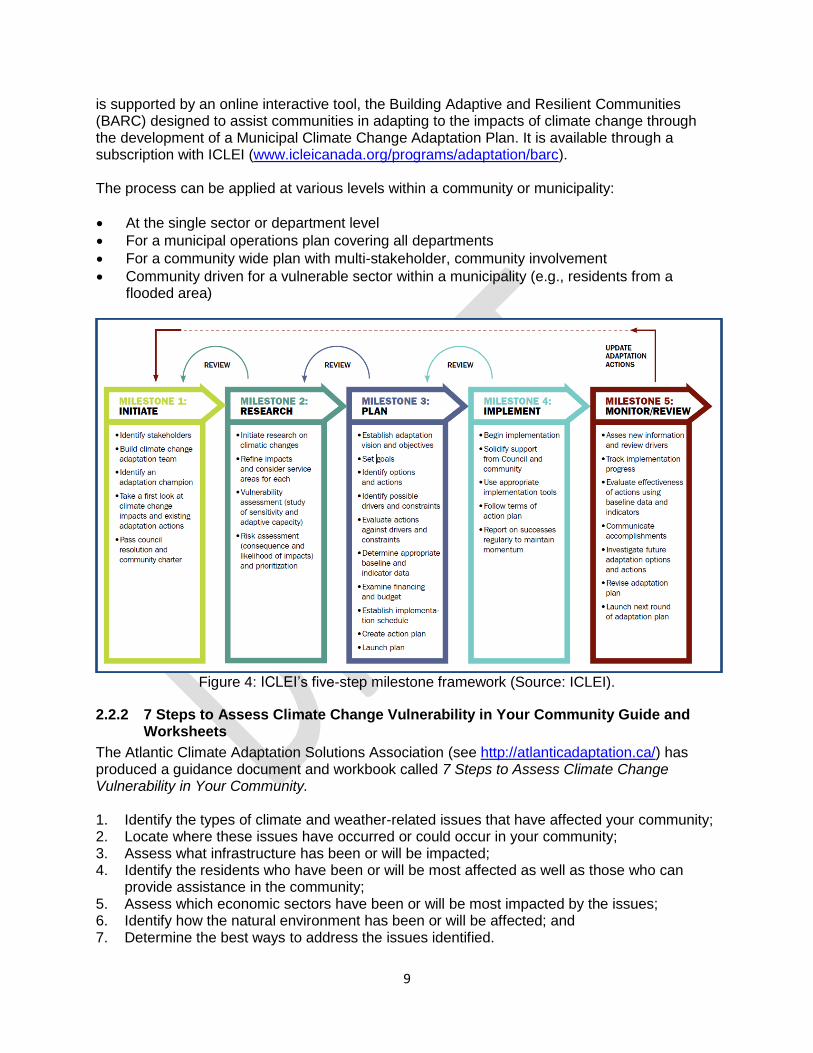
ICLEI has developed a milestone framework, Changing Climate – Changing Communities, to guide local government practitioners through a process of initiation, research, planning, implementation and monitoring for climate adaptation planning. This five step process (Figure 4)
9
is supported by an online interactive tool, the Building Adaptive and Resilient Communities (BARC) designed to assist communities in adapting to the impacts of climate change through the development of a Municipal Climate Change Adaptation Plan. It is available through a subscription with ICLEI (www.icleicanada.org/programs/adaptation/barc). The process can be applied at various levels within a community or municipality:
At the single sector or department level
For a municipal operations plan covering all departments
For a community wide plan with multi-stakeholder, community involvement
Community driven for a vulnerable sector within a municipality (e.g., residents from a flooded area)
Figure 4: ICLEI’s five-step milestone framework (Source: ICLEI).
2.2.2 7 Steps to Assess Climate Change Vulnerability in Your Community Guide and Worksheets
The Atlantic Climate Adaptation Solutions Association (see http://atlanticadaptation.ca/) has produced a guidance document and workbook called 7 Steps to Assess Climate Change Vulnerability in Your Community. 1. Identify the types of climate and weather-related issues that have affected your community; 2. Locate where these issues have occurred or could occur in your community; 3. Assess what infrastructure has been or will be impacted; 4. Identify the residents who have been or will be most affected as well as those who can
provide assistance in the community; 5. Assess which economic sectors have been or will be most impacted by the issues; 6. Identify how the natural environment has been or will be affected; and 7. Determine the best ways to address the issues identified.
10
The workbook produced for Newfoundland for example, includes climate (current, future predictions) information as well as expected trends and impacts from, for example, precipitation (intensity, frequency), temperature (average, extremes) and sea-level rise.
2.3 City of Toronto Climate Change Risk Assessment
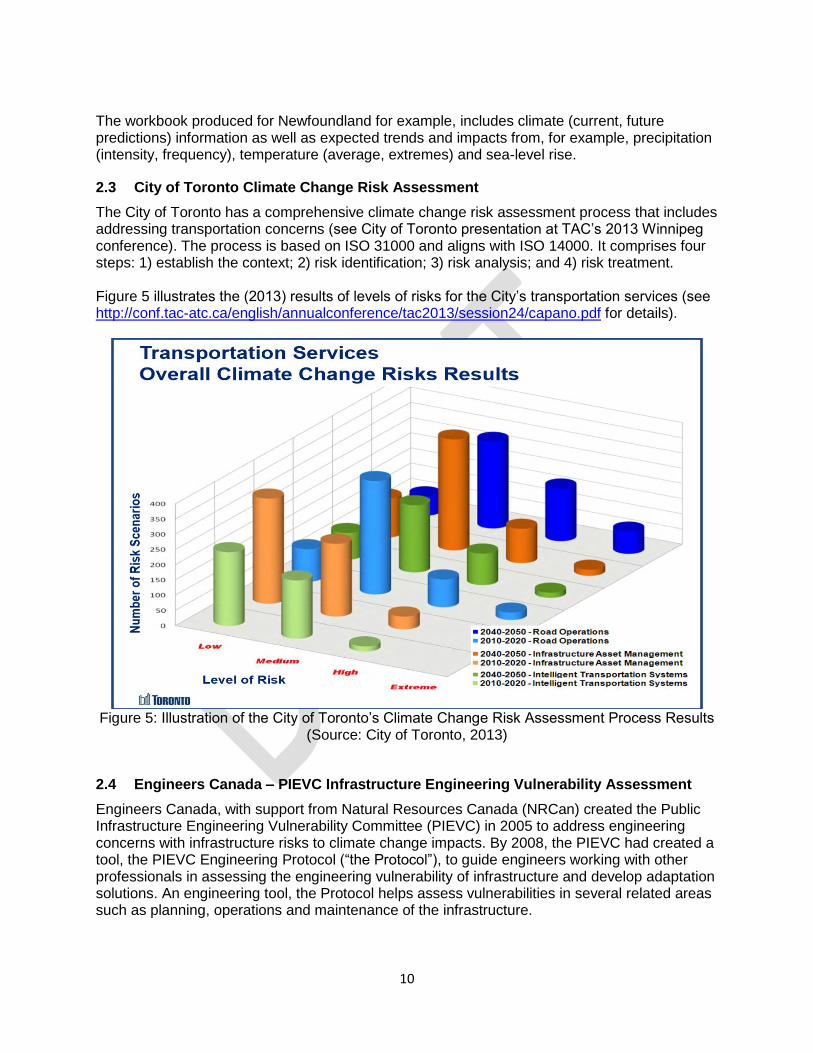
The City of Toronto has a comprehensive climate change risk assessment process that includes addressing transportation concerns (see City of Toronto presentation at TAC’s 2013 Winnipeg conference). The process is based on ISO 31000 and aligns with ISO 14000. It comprises four steps: 1) establish the context; 2) risk identification; 3) risk analysis; and 4) risk treatment. Figure 5 illustrates the (2013) results of levels of risks for the City’s transportation services (see http://conf.tac-atc.ca/english/annualconference/tac2013/session24/capano.pdf for details).
Figure 5: Illustration of the City of Toronto’s Climate Change Risk Assessment Process Results
(Source: City of Toronto, 2013)
2.4 Engineers Canada – PIEVC Infrastructure Engineering Vulnerability Assessment
Engineers Canada, with support from Natural Resources Canada (NRCan) created the Public Infrastructure Engineering Vulnerability Committee (PIEVC) in 2005 to address engineering concerns with infrastructure risks to climate change impacts. By 2008, the PIEVC had created a tool, the PIEVC Engineering Protocol (“the Protocol”), to guide engineers working with other professionals in assessing the engineering vulnerability of infrastructure and develop adaptation solutions. An engineering tool, the Protocol helps assess vulnerabilities in several related areas such as planning, operations and maintenance of the infrastructure.

11
Initially targeted to water resources infrastructure (potable water, wastewater and storm water), roads, bridges, and buildings, the PIEVC Protocol has since been applied to a wider spectrum of infrastructure, including dams, coastal structures, airports and electrical transmission grids and distribution networks. As of April 2015, the Protocol has been or is being used for more than 40 risk evaluations in Canada as shown in Figure 6, and two have been completed outside Canada: Honduras and Costa Rica. There are no known limitations to the type of infrastructure the Protocol can be applied to. It has been used in small (e.g., District of Shelburne, NS – population about 3,000) and large (Toronto, ON) municipalities across Canada.
Figure 6: Locations and Type of Protocol Vulnerability Assessments Completed or in Progress as of February 2013
The Protocol is based on the same principles of risk assessment that are used in assessing other types of risk e.g. business, health, etc., and aligns with ISO 31000 Risk management. The five-step risk screening process systematically reviews historical climate information and projects the nature, severity and likelihood of future climate changes and events. It also establishes the adaptive capacity of an individual infrastructure as determined by its design, operation and maintenance. It includes an estimate of the severity of climate impacts on the components of the infrastructure (i.e. deterioration, damage or destruction) to enable the identification of higher risk components and the nature of the threat from the climate change impact. This information can be used to make informed engineering judgments on what components require adaptation as well as how to adapt them e.g. design adjustments or changes to operational or maintenance procedures.
The Protocol provides a profile of high, medium and low risks to infrastructure from climate impacts at a screening level. It does not require comprehensive and complete data to complete an assessment. Gaps are addressed by professional judgment and experience of the inter-disciplinary team of professionals needed to define the nature and consequence of climate impacts that damage or destroy infrastructure or impede its service to the community it serves.
12
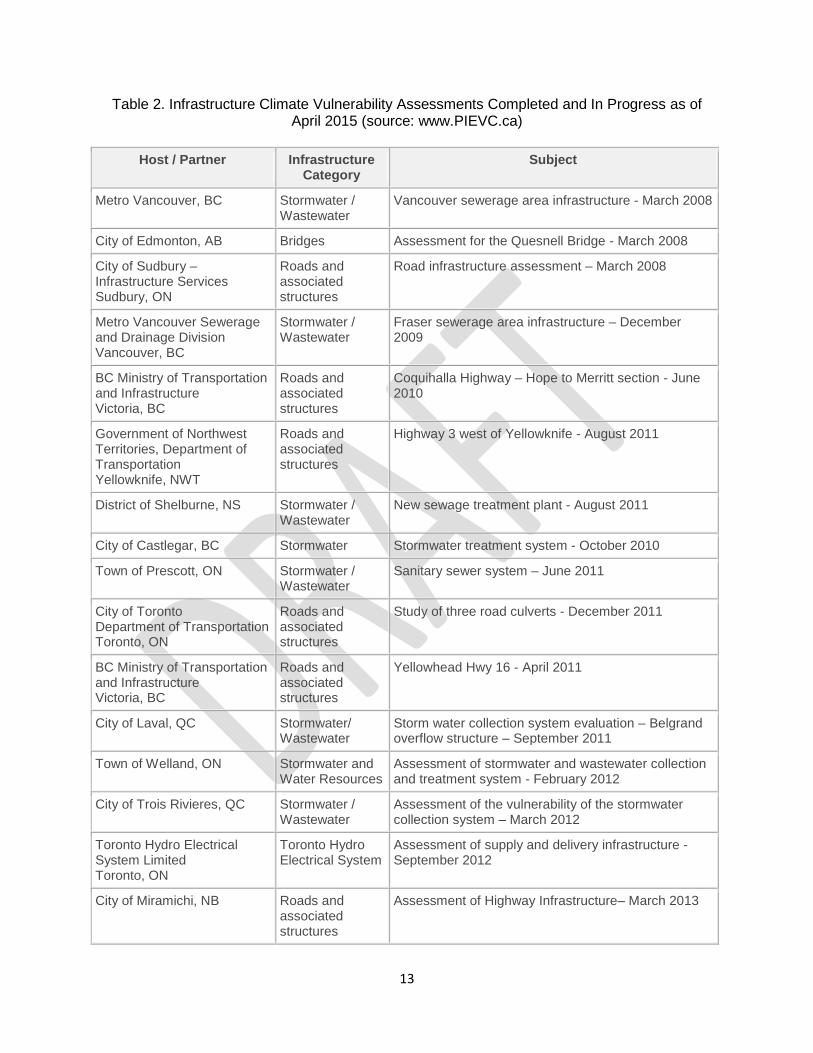
Experience has shown that screening level risk assessment of infrastructure climate risks produces cost-effective and timely evidence at an affordable cost to large and small communities. Recommendations to address the highest risks to improve climate resilience range from collecting more data or more targeted and quantitative engineering analysis to adjustments in operations and maintenance policies and procedures to design improvements that require additional cost information. Table 2 lists a number of completed and ongoing PIEVC Protocol application projects in the areas of transportation and stormwater/wastewater systems of interest to the transportation industry. Engineers Canada has also completed the initial development and testing of a Triple Bottom Line Decision Support Module. This tool evaluates adaptation recommendations from the
Protocol using a multi‐factor analysis that includes social, environment and economic factors. Engineers Canada offers this additional tool as a complement to the Protocol. Following is an illustration of the vulnerability assessment of transportation infrastructure using the PIEVC Protocol. The full report for this and other case studies can be downloaded from www.PIEVC.ca BC Ministry of Transportation and Infrastructure (MoTI) Yellowhead Highway 16 between Vanderhoof and Priestly Hill (March 2011) The Ministry of Transportation and Infrastructure, Province of British Columbia (BC MoTI) worked with Engineers Canada and the PIEVC to assess the engineering vulnerability of a stretch of B.C. Highway 16 between Vanderhoof and Priestly Hill. The principal objective of this case study was to identify those components of the Yellowhead Highway at risk of failure, loss of service, damage and/or deterioration from extreme climatic events or significant changes to baseline climate design values. The nature and relative levels of risk were determined in order to establish priorities for remedial action.
BC MoTI wished to demonstrate an application of the Protocol under different climatic and geographical conditions. Based on this assessment, BC MoTI selected B.C. Yellowhead Highway 16 roughly between Burns Lake and Smithers for the focus of this assessment. The Yellowhead Highway in British Columbia runs from the eastern border with Alberta west through the Cariboo Mountains to Prince George, and through the Fraser Plateau, the Bulkley River Valley and the Skeena River Valley, before reaching the west coast at Prince Rupert. Table 3 below provides a list of the climate parameters and infrastructure indicators selected for the risk assessment; Table 4. Presents the infrastructure components considered in the study. The team identified two time horizons for the assessment: to the year 2050; and to the year 2100. This was based on the notional functional service life of the highway without significant rehabilitation work. The Pacific Climate Impacts Consortium (PCIC) provided climate modeling for the study. PCIC used five Global Climate Models (GCMs) to project future global climatic conditions, and five Regional Climate Models (RCMs) to obtain regional estimates for the area of the Yellowhead Highway.
13
Table 2. Infrastructure Climate Vulnerability Assessments Completed and In Progress as of April 2015 (source: www.PIEVC.ca)
Host / Partner Infrastructure Category
Subject
Metro Vancouver, BC Stormwater / Wastewater
Vancouver sewerage area infrastructure - March 2008
City of Edmonton, AB Bridges Assessment for the Quesnell Bridge - March 2008
City of Sudbury – Infrastructure Services Sudbury, ON
Roads and associated structures
Road infrastructure assessment – March 2008
Metro Vancouver Sewerage and Drainage Division Vancouver, BC
Stormwater / Wastewater
Fraser sewerage area infrastructure – December 2009
BC Ministry of Transportation and Infrastructure Victoria, BC
Roads and associated structures
Coquihalla Highway – Hope to Merritt section - June 2010
Government of Northwest Territories, Department of Transportation Yellowknife, NWT
Roads and associated structures
Highway 3 west of Yellowknife - August 2011
District of Shelburne, NS Stormwater / Wastewater
New sewage treatment plant - August 2011
City of Castlegar, BC Stormwater Stormwater treatment system - October 2010
Town of Prescott, ON Stormwater / Wastewater
Sanitary sewer system – June 2011
City of Toronto Department of Transportation Toronto, ON
Roads and associated structures
Study of three road culverts - December 2011
BC Ministry of Transportation and Infrastructure Victoria, BC
Roads and associated structures
Yellowhead Hwy 16 - April 2011
City of Laval, QC Stormwater/ Wastewater
Storm water collection system evaluation – Belgrand overflow structure – September 2011
Town of Welland, ON Stormwater and Water Resources
Assessment of stormwater and wastewater collection and treatment system - February 2012
City of Trois Rivieres, QC Stormwater / Wastewater
Assessment of the vulnerability of the stormwater collection system – March 2012
Toronto Hydro Electrical System Limited Toronto, ON
Toronto Hydro Electrical System
Assessment of supply and delivery infrastructure - September 2012
City of Miramichi, NB Roads and associated structures
Assessment of Highway Infrastructure– March 2013
14
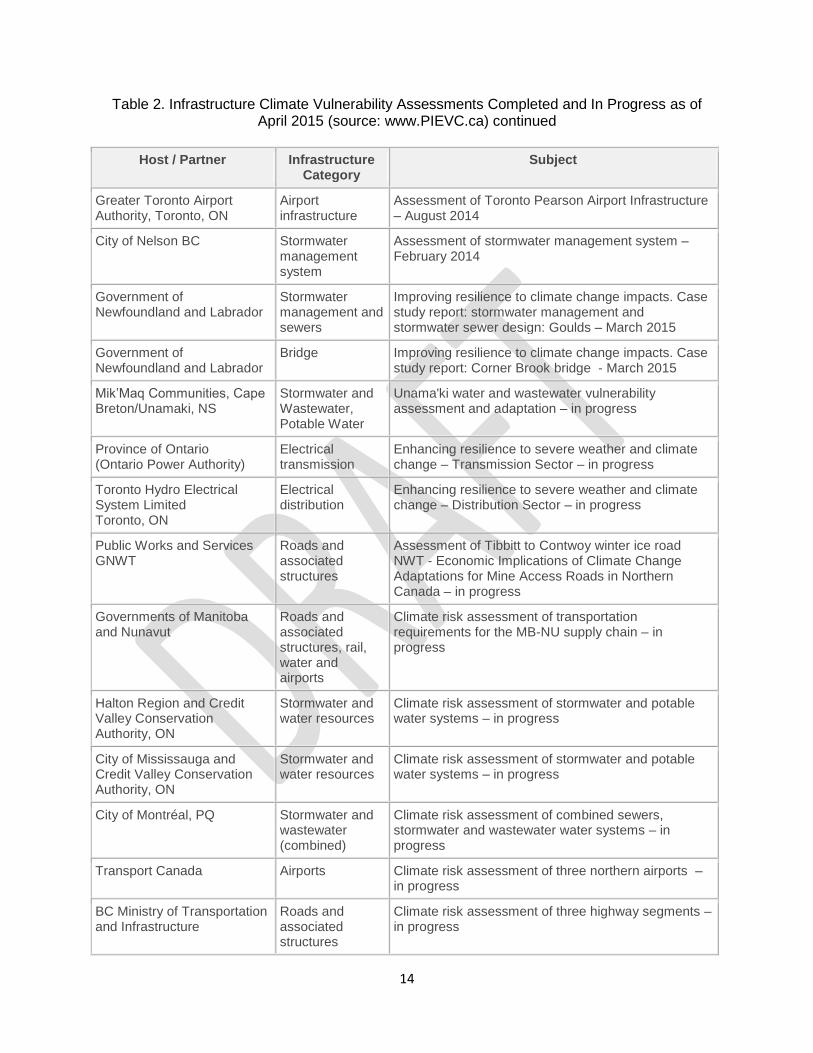
Table 2. Infrastructure Climate Vulnerability Assessments Completed and In Progress as of April 2015 (source: www.PIEVC.ca) continued
Host / Partner Infrastructure Category
Subject
Greater Toronto Airport Authority, Toronto, ON
Airport infrastructure
Assessment of Toronto Pearson Airport Infrastructure – August 2014
City of Nelson BC Stormwater management system
Assessment of stormwater management system – February 2014
Government of Newfoundland and Labrador
Stormwater management and sewers
Improving resilience to climate change impacts. Case study report: stormwater management and stormwater sewer design: Goulds – March 2015
Government of Newfoundland and Labrador
Bridge Improving resilience to climate change impacts. Case study report: Corner Brook bridge - March 2015
Mik’Maq Communities, Cape Breton/Unamaki, NS
Stormwater and Wastewater, Potable Water
Unama'ki water and wastewater vulnerability assessment and adaptation – in progress
Province of Ontario (Ontario Power Authority)
Electrical transmission
Enhancing resilience to severe weather and climate change – Transmission Sector – in progress
Toronto Hydro Electrical System Limited Toronto, ON
Electrical distribution
Enhancing resilience to severe weather and climate change – Distribution Sector – in progress
Public Works and Services GNWT
Roads and associated structures
Assessment of Tibbitt to Contwoy winter ice road NWT - Economic Implications of Climate Change Adaptations for Mine Access Roads in Northern Canada – in progress
Governments of Manitoba and Nunavut
Roads and associated structures, rail, water and airports
Climate risk assessment of transportation requirements for the MB-NU supply chain – in progress
Halton Region and Credit Valley Conservation Authority, ON
Stormwater and water resources
Climate risk assessment of stormwater and potable water systems – in progress
City of Mississauga and Credit Valley Conservation Authority, ON
Stormwater and water resources
Climate risk assessment of stormwater and potable water systems – in progress
City of Montréal, PQ Stormwater and wastewater (combined)
Climate risk assessment of combined sewers, stormwater and wastewater water systems – in progress
Transport Canada Airports Climate risk assessment of three northern airports – in progress
BC Ministry of Transportation and Infrastructure
Roads and associated structures
Climate risk assessment of three highway segments – in progress

15
Table 3. Climate Parameters and Infrastructure Indicators used for the Yellowhead Hwy. 16 Risk Assessment (Source: BC-MoTI report accessed at www.PIEVC.ca)
Climate Parameter Infrastructure Indicator
High Temperature Day(s) with maximum temperature exceeding 35oC
Low Temperature Day(s) with minimum temperature below -35o C
Average Temperature Average maximum temperature over 7 days
Temperature Variability Daily temperature variation of more than 25 o C
Freeze / Thaw 85 or more days where maximum temperature > 0o C and
minimum temperature < 0o C
Frost / Frost Penetration 47 or more consecutive days where minimum temperature < 0
o C
Total Annual Rainfall 406.7 mm
Extreme High Rainfall > 35 mm rain
Sustained Rainfall ≥ 5 consecutive days with > 25 mm rain
Longer Sustained Rainfall ≥ 23 consecutive days with > 10 mm rain
Low Rainfall ≥ 10 consecutive days with precipitation < 0.2 mm
Prolonged Dry Periods (Drought) ≥ 112 consecutive days with precipitation < 0.2 mm
Snow (Frequency) Days with snow fall > 10 cm
Snow Accumulation 5 or more consecutive days with a snow depth > 60 cm
Snow Storm / Blizzard 8 or more days with blowing snow
Rain / Snow / Wind Rain on snow including temperature and wind speed
Rain on Snow 10 or more consecutive days with rain on snow
Hail / Sleet Days with precipitation falling as ice particles
Rain on Frozen Ground Precipitation > 6 mm/3h
Freezing Rain 9 or more days with rain that falls as liquid and freezes on contact
Visibility ≥ 15 hours per year with visibility < 1,000 m
High Wind / Downburst ≥ 8 days with Max winds ≥ 63 km/hr
Rapid Snow Melt Snow melt > 9 mm/3h
Snow Driven Peak Flow Events N/A
Ice / Ice Jams N/A
Ground Freezing Number of days below -5 o C
The results from the PCIC work are summarized below.
The number of frost days will decline sharply from about 200 to approximately 150 by the year 2100
The number of ice days will decrease.
The growing season length will increase from roughly 170 days to nearly 200 days by the end of the century.
Precipitation totals may increase from 500 mm to about 600 mm.
There will be more extreme weather events, overall.

16
The portion of days where the maximum temperature is above the present-day median will increase from 50% to almost 80% by the end of the century
The annual minimum temperature will increase from -25°C to -20°C by 2100.
Annual maximum temperature values, which are presently safely below the 35°C mark relevant to bride and highway design, will start to cross this line by mid-century and even approach and exceed 40°C by the end of the century.
Table 4. Infrastructure Components Listing for the Yellowhead Hwy. 16 Risk Assessment
(Source: BC-MoTI report accessed at www.PIEVC.ca)
Above Ground Below Ground
1 Asphalt - Hot in Place 25 Pavement Structure
2 Asphalt - Seal Coat 26 Catch Basins
3 Pavement Marking 27 Roadway Drainage Appliances
4 Shoulders (Including Gravel) 28 Sub-Drains
5 Barriers 29 Below Ground Third Party Utilities
6 Curb - Concrete 30 Above Ground Third Party Utilities
7 Curb - Asphalt 31 Culverts < 3m
8 Luminaires 32 Culverts ≥ 3m
9 Poles 33 Piping/Culvert - Below Ground Elements.
10 Signs - Sheeting Miscellaneous
11 Signs - Wood or metal bases 35 Winter Maintenance
12 Signage - Side Mounted - Over 3.2 m2 36 Habitat Features
13 Signage - Overhead Guide Signs 37 Routine Maintenance
14 Overhead Changeable Message Signs – Weigh Scale
38 Pavement Marking Repair
15 Ditches 39 Pavement / Curb/ Barrier / Sign Repair
16 Embankments/Cuts
17 Natural Hillsides
18 Engineered Stabilization Works
19 Structures that Cross Streams - Bridges
20 Structures that Cross Roads - Bridges
21 Railways (Drainage Interaction)
22 River Training Works - Rip Rap
23 Retaining Walls - MSE Walls
24 Asphalt Spillway and Associated Piping – Above Ground Elements
The PIEVC Protocol directs the practitioner to confirm the infrastructure owner’s risk tolerance thresholds prior to conducting the risk assessment. The Protocol suggests High, Medium and Low risk thresholds. BC MoTI confirmed their acceptance of the risk thresholds defined by the

17
Protocol for application in this process. Table 5 outlines the risk thresholds used for this risk assessment.
Table 5. Risk Tolerance Thresholds and Colour Codes for the Yellowhead Hwy. 16 Risk Assessment (Source: BC-MoTI report accessed at www.PIEVC.ca)
Risk Range Threshold Response
< 12 Low Risk No immediate action necessary
12 – 36 Medium Risk Action may be required
Engineering analysis may be required
> 36 High Risk Immediate action required
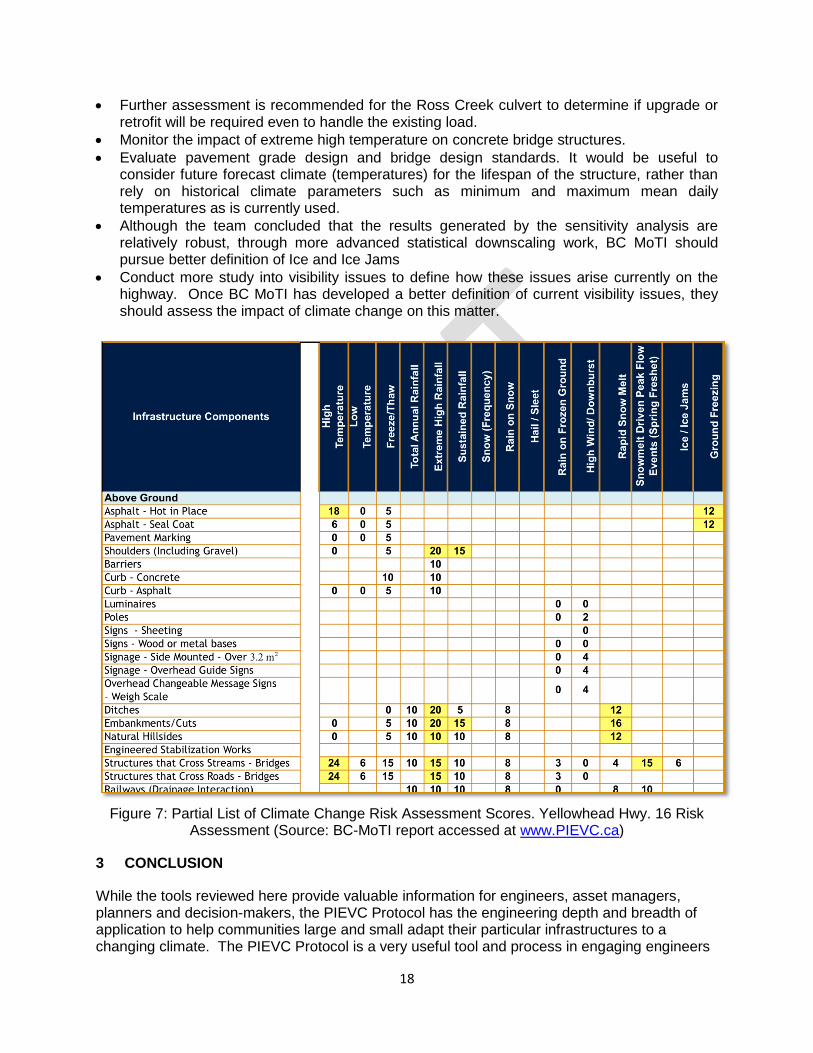
The risk for each interaction climate event – infrastructure component is calculated in two steps. First, PCIC and representatives from the team with climate expertise consulted and assigned probabilities for the climate parameters. Second, at a team workshop, the subject matter experts assigned severity scores for each interaction. Based on the probability and severity scores, the team calculated the risk outcomes using the equation:
R = P × S Where: R = Risk
P = Probability of the interaction S = Severity of the interaction
Each outcome was assigned a high, medium or low risk score based on the defined risk tolerances and color-coded. Figure 7 illustrates the results from this step. Some of the recommendations from the study follow.
Investigate current design reserve capacity of the Yellowhead Highway to handle changing hydrology from increased local extreme rainfall events.
If, due to study findings, infrastructure components require upgrading to accommodate increased rainfall intensity, this should be accomplished as a part of regular design and maintenance activities and not as a separate program - unless a serious situation is identified (as forecast changes are 40+ years into future).
Require contractors to document weather conditions that caused major maintenance issues. Notionally, this would include meteorological data on rainfall, wind, etc. from the nearest weather station. This would link infrastructure problems with climate data and facilitate future monitoring of this interaction.
Develop relevant, practical design parameters and guidelines to help designers account for the future influence of climate change on highway infrastructure designs. For example, it is currently difficult to account for the effect of increased magnitude and frequency of rainfall on extreme stream peak flows as it is not a linear relationship. Future hydrotechnical design may require more complex engineering such as continuous rainfall analysis and watershed modeling.
Further analysis on the vulnerability of culverts < 3m is recommended due to the uncertainties in the climate models and lack of survey information.
18
Further assessment is recommended for the Ross Creek culvert to determine if upgrade or retrofit will be required even to handle the existing load.
Monitor the impact of extreme high temperature on concrete bridge structures.
Evaluate pavement grade design and bridge design standards. It would be useful to consider future forecast climate (temperatures) for the lifespan of the structure, rather than rely on historical climate parameters such as minimum and maximum mean daily temperatures as is currently used.
Although the team concluded that the results generated by the sensitivity analysis are relatively robust, through more advanced statistical downscaling work, BC MoTI should pursue better definition of Ice and Ice Jams
Conduct more study into visibility issues to define how these issues arise currently on the highway. Once BC MoTI has developed a better definition of current visibility issues, they should assess the impact of climate change on this matter.
Figure 7: Partial List of Climate Change Risk Assessment Scores. Yellowhead Hwy. 16 Risk
Assessment (Source: BC-MoTI report accessed at www.PIEVC.ca)
3 CONCLUSION
While the tools reviewed here provide valuable information for engineers, asset managers, planners and decision-makers, the PIEVC Protocol has the engineering depth and breadth of application to help communities large and small adapt their particular infrastructures to a changing climate. The PIEVC Protocol is a very useful tool and process in engaging engineers
19
to work closely with other professionals to support the planning, operation, maintenance, management and use of the infrastructure to the benefit of society. The results inform decision-makers to a level that is adequate and timely enough to develop cost-effective recommendations that adapt the highest risk components to improve their resilience to climate impacts in ways other assessment tools may not.
There are other tools and methodologies that have been developed in other countries. For example, several US Federal agencies including the Federal Highway Administration, have created methodologies for detailed quantitative risk assessments and comprehensive climate change adaptation planning for very large capital-intensive projects. There also exist similar tools developed in Europe and Australia that require quantitative data. It is also important to note that most, if not all methodologies, including those presented here, fit the general ISO 31000 Risk Management principles and framework. In the medium to long-term, compliance of all these methodologies with ISO 31000 would be a desirable outcome.
4 ACKNOWLEDGEMENTS
In addition to the support provided by Engineers Canada and its staff in preparing this paper, the author wishes to acknowledge the Canadian Water Network project Water: A Risky Business and the Credit Valley Conservation Authority for their help in the research and background material used in preparing this paper.

20
5 REFERENCES
Atlantic Climate Adaptation Solutions Association, 7 Steps to Assess Climate Change Vulnerability in your Community – website http://atlanticadaptation.ca/ accessed March 2015 BC Ministry of Transportation and Infrastructure, Climate Change Engineering Vulnerability Assessment - B.C. Yellowhead Highway 16 between Vanderhoof and Priestly Hill, report by Nodelcorp Consulting Inc., 2011 (accessed at www.PIEVC.ca) Brundtland Commission, United Nations Report of the World Commission on Environment and Development: Our Common Future, 1987 Canadian Infrastructure Report Card, Volume 1: 2012 Municipal Roads and Water Systems, 2012 Canadian Infrastructure Report Card - Asset Management Primer, 2014 City of Toronto Climate Change Risk Assessment, presentation at the TAC annual conference, Winnipeg (MB), 2013 Engineers Canada, PIEVC Engineering Protocol - Version 10 Part 1, October 2011 from http://www.pievc.ca/e/index_.cfm accessed March 2015 ICLEI Canada, Building Adaptive and Resilient Communities, website http://icleicanada.org/programs/adaptation accessed March 2015 Intergovernmental Panel on Climate Change (IPCC), Fifth Assessment Report (AR5), 2014 ISO 31000:2009, Risk management – Principles and guidelines (2009) ISO 55000:2014, Asset management — Overview, principles and terminology (2014) McGillivray, G. 2014 The trend to more and larger catastrophic losses in Canada, Presentation at the June 2014 Engineers Canada workshop for policymakers at the Government of Newfoundland and Labrador, St John’s NL National Guide to Sustainable Municipal Infrastructure – InfraGuide: Best Practice for Municipal Infrastructure Asset Management DMIP 7, an FCM/NRCC publication, 2005 UN Office for Disaster Risk Reduction, International Strategy for Disaster Risk Reduction, website http://www.unisdr.org/who-we-are/international-strategy-for-disaster-reduction accessed March 2015 US-EPA Water: Sustainable Infrastructure. Website http://water.epa.gov/infrastructure/sustain/localofficials_looks_like.cfm accessed March 2015