roadmap to a de-fossilized powertrain - bosch media service · 2019-11-20 · source (see figure...
TRANSCRIPT
S E I T E 2 5 7
T E C H N I S C H E R K O N G R E S S 2 0 1 7 · T E C H N I C A L C O N G R E S S 2 0 1 7
Roadmap zum defossilisierten Antrieb
Roadmap to a de-fossilized powertrain
Dipl.-Ing. Ulrich Schulmeister
Vice President Engineering
Robert Bosch GmbH

S E I T E 2 5 8
T E C H N I S C H E R K O N G R E S S 2 0 1 7 · T E C H N I C A L C O N G R E S S 2 0 1 7
Dipl.-Ing. Steffen Eppler
Director Competence Center Alternative Fuels
Robert Bosch GmbH
Co-Authoren

S E I T E 2 5 9
T E C H N I S C H E R K O N G R E S S 2 0 1 7 · T E C H N I C A L C O N G R E S S 2 0 1 7
Abstract
The implementation of the Paris Climate Agreement requires a continuous reduc-
tion of greenhouse gas emissions by defossilizing our energy sources. For numerous
countries throughout the world, it will be impossible to ramp up regenerative energy
production by an order of magnitude needed to establish energy self-sufficiency in
all sectors (power generation, industry, heating and transport). As a result, import-
ing energy from regions with excess regenerative energy will be as commonplace
as importing mineral oil today. For ease of worldwide energy transport, a chemical
energy carrier seems very likely.
The transport sector has to achieve near-complete independence of fossil fuels by
2050 according to International Energy Agency models. In the long term, battery and
fuel cell electric vehicles are essential pillars for decarbonizing the transport sector.
Continuous improvement of vehicle efficiency and a strong increase of hybridization
and electrification will lead to significant reductions in the required energy for the
transport sector. Breakthroughs in battery and fuel cell technology and cost as well
as the ramp-up of the charging/filling infrastructure are challenging but manage-
able. Where locally produced regenerative electrical power is available, electrified
transport will be the preferred approach. However, parts of the transportation sector
will rely on imported renewable energy and may require further powertrain solutions
to avoid an additional energy conversion process. The decision on the right energy
carrier is complex and incorporates various aspects beside efficiency such as techni-
cal feasibility; speed of implementation; and total investment cost for society, indus-
try and individual end users.
While “efficiency defines technology” is the appropriate approach for limited avail-
able local regenerative energy, the “most economic business model” will decide on
the future carrier for imported renewable energy. In this context, imported renewable
synthetic fuels – as required for aviation and navigation – are a feasible candidate for
heavy duty and passenger transportation.
S E I T E 2 6 0
T E C H N I S C H E R K O N G R E S S 2 0 1 7 · T E C H N I C A L C O N G R E S S 2 0 1 7
1. Introduction
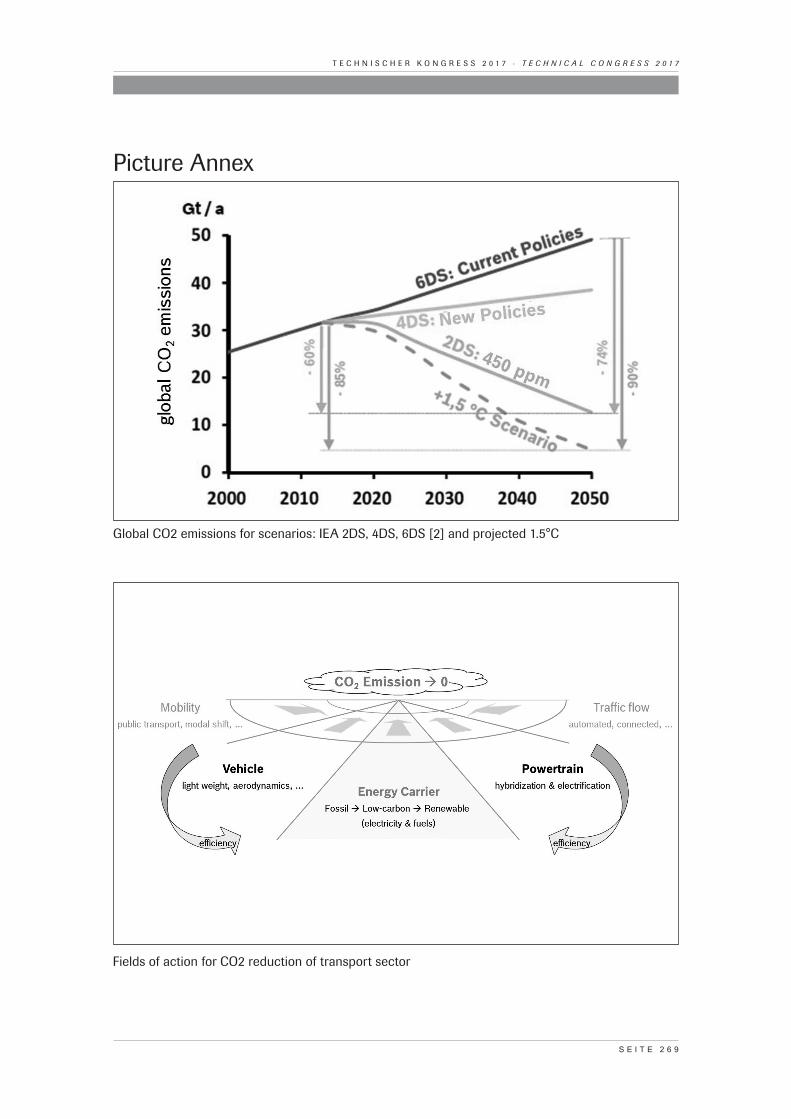
The Paris Climate Agreement (COP21) as entered into force Nov. 4th, 2016 is target-
ing to limit global average temperature increase to no more than +1.5 to +2 °C above
the pre-industrial level. To achieve this challenging target a radical cut of fossil CO2
emissions will be necessary reaching nearly net-zero (fossil) emissions around 2050.
Achieving a 1.5°C scenario will require an 85 percent reduction compared to 2013
CO2 emissions – yet substantially lower than the so far considered “2DS” scenario
of the International Energy Agency (IEA) [1] (see figure 1). Significant reduction
of CO2 emissions will be very challenging for specific sectors. For example, agri-
culture and waste management are expected to demand approximately 2/3 of the
remaining emission budget in Germany in 2050 [2]. The energy supply, industrial,
residential and transportation sectors need to be nearly independent of fossil fuels,
i.e. de-fossilized, by 2050. Alternative CO2 emission reductions such as for example
CCS (Carbon Capturing and Storage) might be useful as an intermediate solution,
but compensate rather than mitigate the use of fossil energy. De-fossilization of the
powertrain is therefore the long-term challenge.
2. Efficiency Potentials
Intelligent traffic systems including automated and connected driving as well as
changing mobility behavior and increasing digitalization have the potential to reduce
the primary energy demand within the transport sector. On the other hand, mobil-
ity demand is still increasing and might offset prior mentioned potentials as it did to
some extent in the past. Reduction of direct vehicle related CO2 emission is therefore
crucial and will require actions at the vehicle level, on the powertrain and on the
energy carriers needed for the propulsion.
S E I T E 2 6 1
T E C H N I S C H E R K O N G R E S S 2 0 1 7 · T E C H N I C A L C O N G R E S S 2 0 1 7
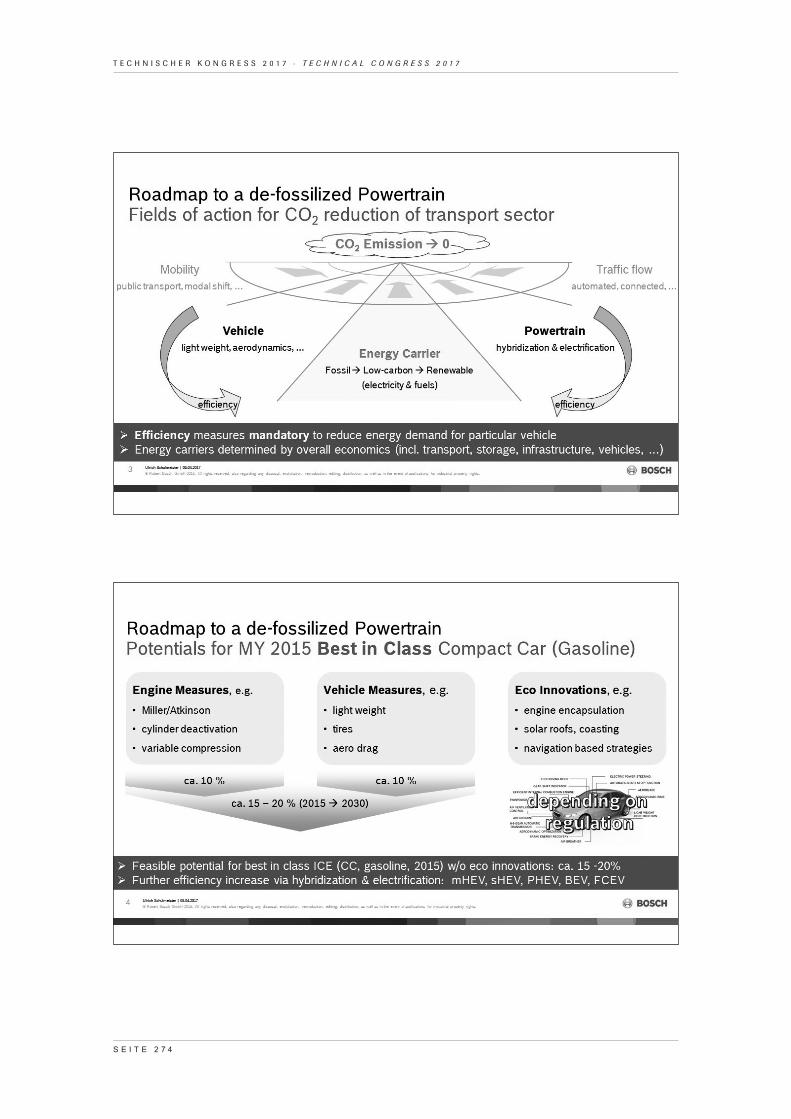
2.1 Eco Innovations, Vehicle Measures and Engine Improvement
Increasing vehicle efficiency requires a holistic approach to the energy use on-
board a vehicle. An increasing share of the energy demand is allocated by comfort
features of the vehicle. To ensure reduced CO2 emissions in real world driving condi-
tions, intensive adoption of eco innovations will be required. Off-cycle credits – in
Europe called eco innovations – are regulative measures that give credit for effi-
ciency improvements of the vehicles beyond homologation procedure. Up to now
sparsely used eco innovations like engine compartment encapsulation, solar roofs,
navigation based operation strategies or coasting will gain more and more relevance
in near future.
Curb weight, aerodynamic drag and rolling resistance are the decisive factors con-
cerning the remaining energy demand for vehicle propulsion. Recent publications
estimate the possible reduction of aerodynamic drag relative to a state-of-the-art
vehicle as high as 25 percent [3]. Lightweight design and continuous advances on
the vehicle’s rolling resistance suggest that a 10 percent total reduction of energy
required at the wheel could be achieved with future best in class vehicles compared
to 2015.
The powertrain providing the energy to the wheels has potential for efficiency
improvements as well. Downsized turbocharged ICE with direct injection have
become the mainstream power source in the compact class. The introduction of
Miller/Atkinson cycle engines in combination with advanced charging concepts for
gasoline engines are a next step. Friction reduction, cylinder deactivation (even for
3-cylinder engines), high specific power concepts with electrical assisted boosting,
maximized thermal efficiency concepts with high or variable compression ratios are
additional technologies that are leading to the assumption of an additional power-
train efficiency improvement of 10 percent based on a best in class engine configu-
rations of 2015. The CO2 reduction potential for a best in class vehicle (status 2015),
with only engine improvements and vehicles measures and without usage of eco-
innovations, may reach 15-20 percent in total by 2030. Since many vehicles do not
S E I T E 2 6 2
T E C H N I S C H E R K O N G R E S S 2 0 1 7 · T E C H N I C A L C O N G R E S S 2 0 1 7
yet utilize all available best in class technologies, the average potential of engine and
vehicle measures for new sales can be higher.
Even though the best technology to reduce the vehicles fuel consumption will have
to stand its ground in the economic competition which is most challenging for small
vehicle classes.
Significant efficiency increase beyond 15-20 percent will be achieved by increasing
the implementation of electrification.
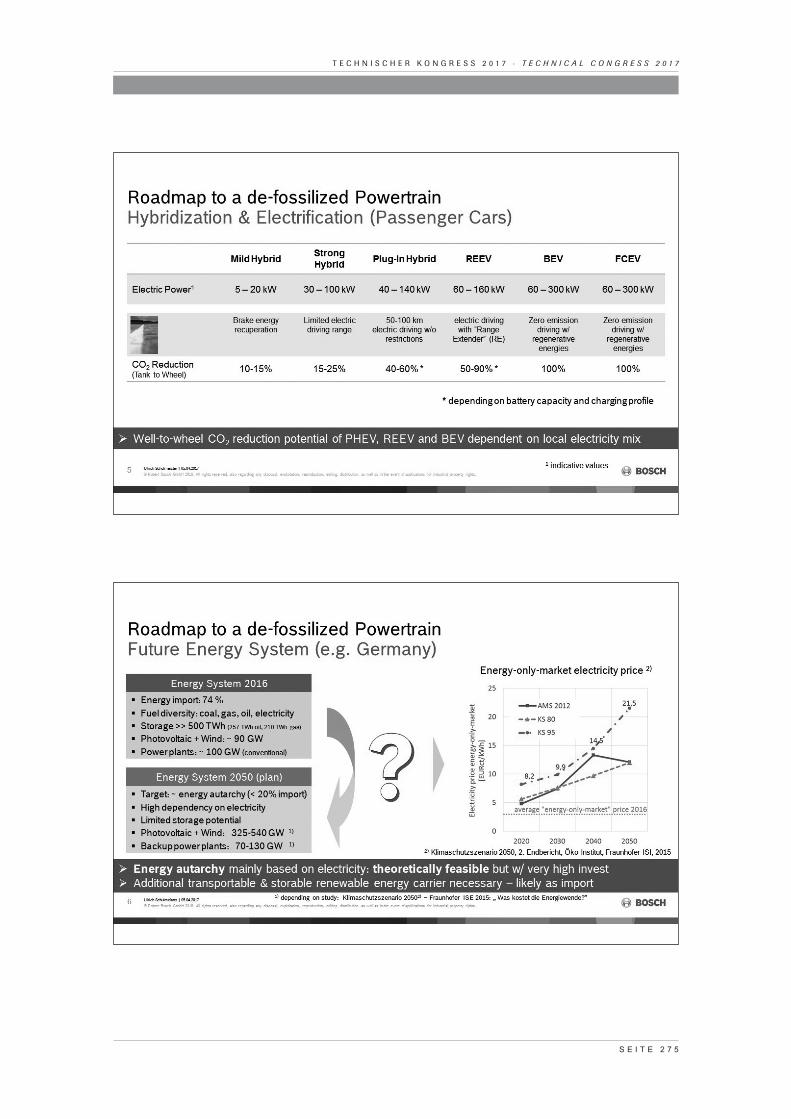
2.2 Electrification
High efficiency of an electric powertrain combined with the potential to recover
energy from deceleration phases (recuperation) reduces the external energy needed
for propulsion. For a combustion engine this results in lower fuel consumption (gas-
oline, diesel or gas). For fully electric vehicles (BEV and FCEV) less electric energy
or hydrogen consumption is the consequence. For PHEV/REEV the CO2 reduction
potential in comparison to a high efficient ICE is related to the available battery
capacity, real life charging behavior and as for BEV in particular to the CO2 footprint
of the local electricity mix.
Forecasts of BEV and FCEV electrification shares in passenger transportation for a
period exceeding 5-10 years strongly depend on the assumptions for future develop-
ment of key technologies (e.g. battery costs and raw material availability), end user
acceptance of new technologies, national incentive programs, available infrastruc-
ture and future emission standards or city restrictions.
All efficiency measures reduce the need of primary energy. To achieve near net zero
CO2 emissions within the transport sector, the energy carrier itself will need to be
fully independent of fossil energy sources (see figure 2). Renewable energy will not
only be the basis for future transportation but also for all sectors. Energy transition
(in Germany “Energiewende”) and especially security of energy supply become a
long-term challenge.
S E I T E 2 6 3
T E C H N I S C H E R K O N G R E S S 2 0 1 7 · T E C H N I C A L C O N G R E S S 2 0 1 7
3. Future Energy System (example Germany)
Renewable energies account for about 32 percent of the electric power generation
and about 15 percent of the total end energy consumption for Germany in 2015. As
of today, about 74 percent of the primary energy demand is based on imports. The
energy system and distribution is diversified (coal, gas, oil, renewables) and provides
more than 500 TWh of storage capacity (e.g. oil: 257 TWh, gas 210 TWh). Installed
photovoltaic and wind power has reached about 90 GW in 2016.
Transition of such a diversified energy system into an energy system primarily based
on local renewable energy sources and the electric grid for distribution is feasi-
ble and challenging at the same time. Due to strongly fluctuating solar and wind
energy collection, extensive built-up of installed photovoltaic and wind power will be
required as well as large investments in storage capacities and backup power plants.
Related studies suggest that the necessary built-up of photovoltaic and wind power
ranges from 325 GW to 540 GW [2,4]. At the same time, the primary energy demand
needs to be halved by 2050 [2].
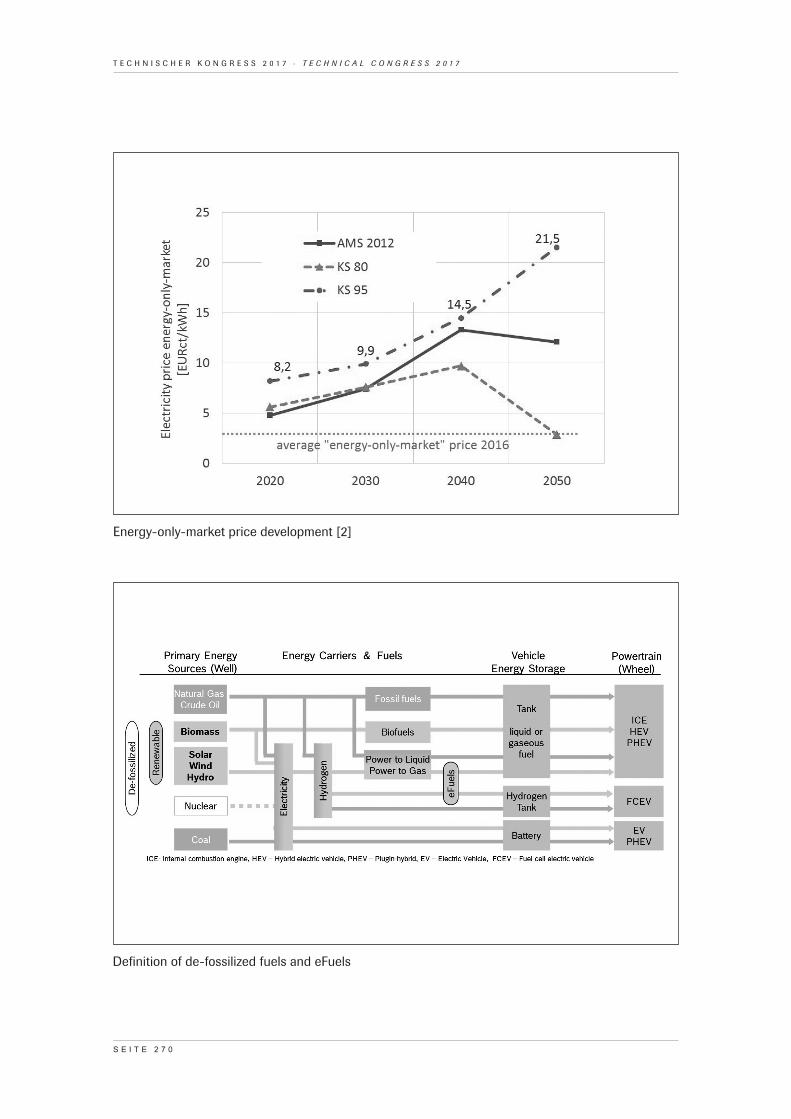
For its strong decarbonization scenario “95” (95 percent CO2 reduction), a
study conducted by Öko Institut and Fraunhofer [2] indicates an increase of the
energy-only-market price for electricity up to 21,5 EURct/kWh in 2050 also due
to necessary backup power plants (see figure 3). For reference: the average
energy-only-market price was about 2,9 EURct/kWh in 2016. At the same time, the
“95” scenario assumes 50 percent of the remaining needed fuel – primarily for avia-
tion and navigation – to be synthetic fuels based on renewable energies. Due to
economics, the synthetic fuels are expected to be produced partially abroad.
A central goal of energy transition scenarios is the reduction of energy imports. As
potentials for local renewable energy is limited and costs for storage and distribution
are high, extreme efficiency and direct use of electricity within all sectors is assumed
to be the primary target. As efficiency of renewable energies in geographically
preferential regions is higher (e.g. about 2.5 times for photovoltaic yield compared
S E I T E 2 6 4
T E C H N I S C H E R K O N G R E S S 2 0 1 7 · T E C H N I C A L C O N G R E S S 2 0 1 7
to Germany) the dedicated production of electricity based synthetic fuels should be
considered as a supplement for the local renewable energy sources.
4. E-Fuels
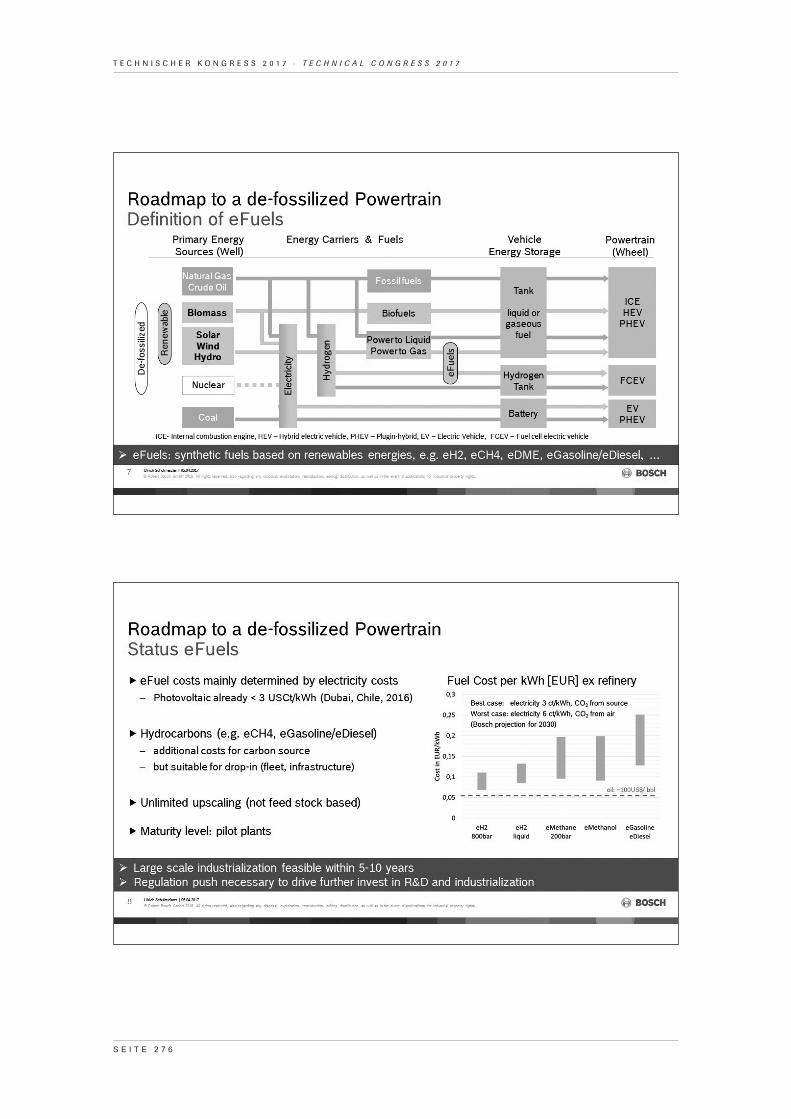
Synthetic fuels based on renewable energy – so-called eFuels (see figure 4) - will be
an important pillar for future fuel supply. Transportable and easy to store chemical
energy carriers are beneficial to solve the target triangle of energy policy: environ-
mental impact, economic viability and security of energy supply. Renewable elec-
tricity in geographical preferential regions dedicated for the production of synthetic
fuels will be the basis for the large scale production of e-hydrogen. The e-hydrogen
can be used for fuel cell vehicles or synthesized by additional conversion steps to
synthetic methane (e-CH4) or synthetic fuels for an increasing blend in the remain-
ing gasoline and diesel fleet, not only for aviation and navigation but also for com-
mercial and passenger vehicles.
As electricity-based synthetic fuels are not relying on food stock nor special climate
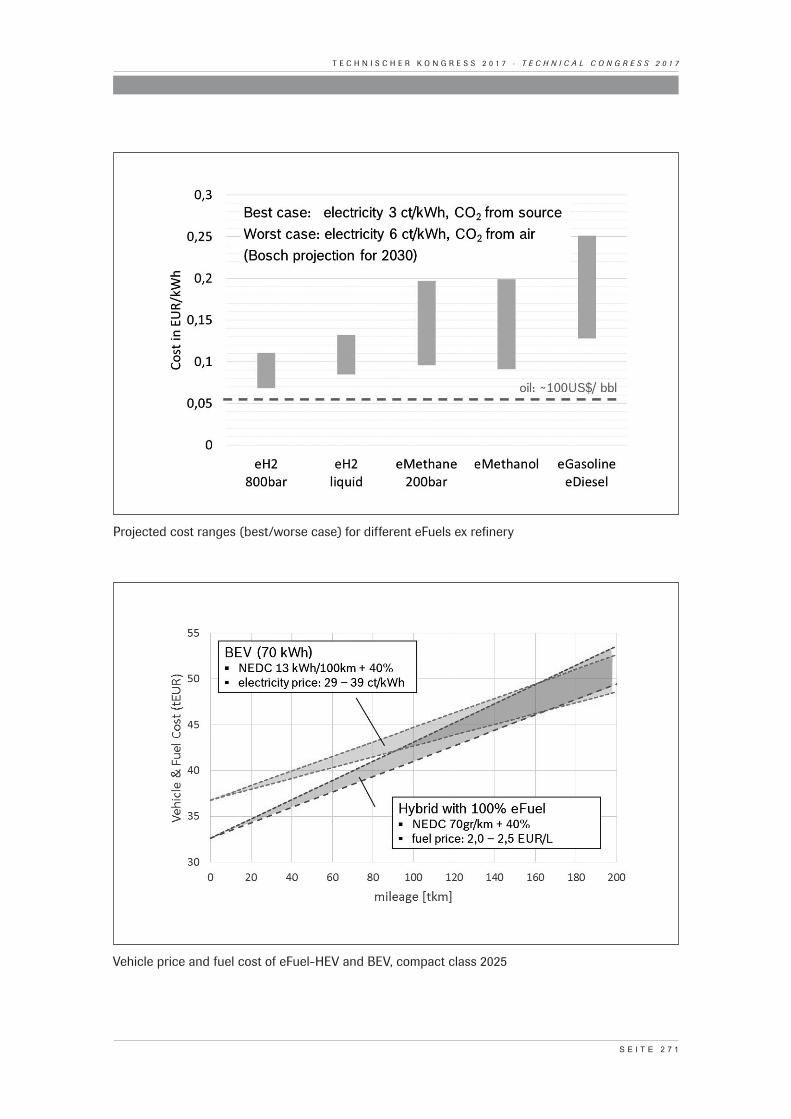
conditions the upscaling of production volume is nearly unlimited. Cost of electric-
ity is the dominating factor for synthetic fuel production driven mainly by electrolysis
and CO2 capturing. With high yield photovoltaic plants already reaching energy costs
per kWh below 3 USct in 2016 (Abu Dhabi 2,42 Ct, Chile 2,91 Ct) [5], synthetic fuels
for direct use in existing car fleets (e.g. eMethan, eMethanol, eGasoline, eDiesel) are
expected to reach a cost level of 10–15 EURct/kWh depending on the complexity of
the energy carrier and available CO2 source (see figure 5). For large scale industriali-
zation, further technology development in the field of high temperature electrolysis
and CO2 capturing is necessary. Demonstration level pilot plants are already “on-
line” today and industrialization is expected to be feasible within 5-10 years.
S E I T E 2 6 5
T E C H N I S C H E R K O N G R E S S 2 0 1 7 · T E C H N I C A L C O N G R E S S 2 0 1 7
5. Economy of eFuel
At today’s oil price, synthetic fuels are of higher costs than fossil fuel. Fossil fuels
need to be replaced within the transport sector in the long term so eFuels will have
to compete economically with alternative powertrain concepts such as battery elec-
tric vehicle. eFuel powered ICE vehicles are considered to be in co-existence with
BEV and FCEV in the market. Though it is obvious that a transition to an alternative
energy carrier such as battery or fuel cell electric vehicle will require a large addi-
tional investment in charging and refueling infrastructure, the additional invest in a
nationwide new infrastructure is not yet considered at this time. The following com-
parison is based on a simplified end customer total cost of ownership (TCO) includ-
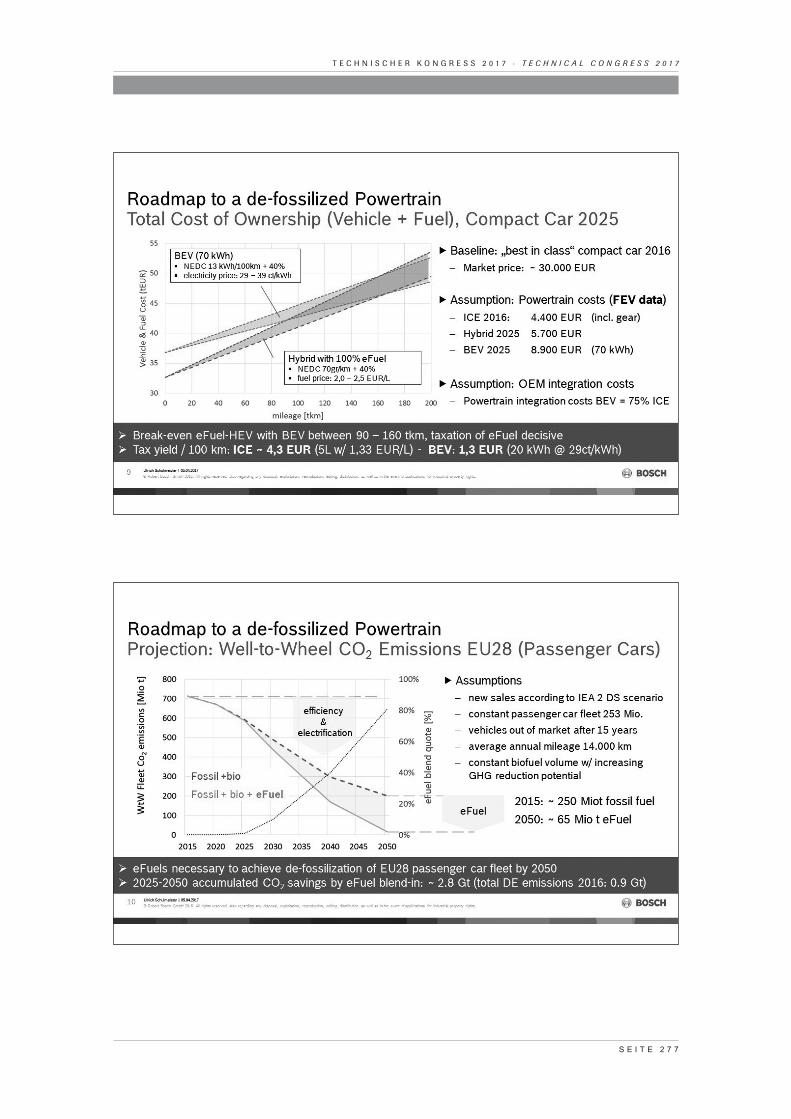
ing only vehicle price and fuel costs. The basis for the comparison is a compact class
vehicle with an end customer price of 30.000 EUR and best in class ICE technology.
The expected end customer range for a battery electric vehicle in real driving condi-
tions is app. 400 km and requires a battery capacity of approximately 70 kWh (15
kWh/100km, 90 percent usable battery swing). A best in class hybrid ICE is assumed
to have a NEDC emission of 70g [6] and fuel consumption in real life condition of 4,2
liter/100km [7].
Vehicle manufacturer technology costs are derived by FEV [8] and the target year
2025 with powertrain costs for BEV of 8.900 EUR and ICE powertrain costs (incl.
hybridization, exhaust measures, etc.) of 5.700 EUR.
A variation of 29-39 EURct/kWh for electricity price is used to represent uncertain-
ties in electricity cost increases and surcharges for public charging.
Pricing of eFuels at the gas station has two major tuning factors: blend rate of eFuel
and taxation - taking into account that electricity has a significantly lower tax contri-
bution within the traffic sector. As of today, the tax contribution of a battery electric
vehicle with a consumption of 20 kWh/100 km (incl. charging losses) is about 1,30
EUR/100km (electricity: 29 EURct/kWh). The tax contribution per 100 km of a 5L
gasoline ICE is about 4,30 EUR (price: 1,33 EUR/Liter).
S E I T E 2 6 6
T E C H N I S C H E R K O N G R E S S 2 0 1 7 · T E C H N I C A L C O N G R E S S 2 0 1 7
For the TCO comparison a 100 percent eFuel is considered with a market price vari-
ation of 2,0-2,5 EUR per liter representing a low and high taxation scenario. In order
to be comparable in a well-to-wheel consideration with a BEV, a fossil-eFuel blend
would still be justified resulting in lower fuel price at the gas station.
Due to the lower vehicle price of HEV, investment and running costs using even an
100 percent eFuel are more favorable up to 90-160 tkm depending on pricing of the
specific energy carriers (see figure 6).
6. Climate Targets
Estimating how near-net-zero emissions could be reached by the European passen-
ger car fleet by 2050 a long-term and energy-based scenario has been considered
[9]. Development of the European passenger car fleet is based on new registration
shares given by the 2-degree scenario model of IEA, constant EU28 fleet size of 250
million passenger cars and 16 million of them replaced every year. The qualitative
projection yields that in 2050 about 60 percent of the vehicle fleet consists of high
efficient hybrids, 36 million PHEV partially operating on ICE, and 55 million vehi-
cles fully electrified. Including a constant volume of approximately 15 million tons of
biofuels with increasing GHG reduction potential, well-to-wheel CO2 emissions of the
EU28 passenger car fleet result in a reduction of approximately 70 percent in 2050
compared to 2013. This estimate is consistent with the overall reduction target given
by the IEA “2DS” scenario.
As the transport sector is targeted to achieve nearly net-zero emissions close to
2050 according to the Paris Agreement targets, de-fossilizing the remaining fuel
becomes inevitable. To achieve near net-zero emissions of the EU28 passenger car
fleet by 2050, additional synthetic fuels need to be brought into the market. With
an assumed blend of 1 percent in 2025, 10 percent in 2030, 40 percent in 2040
and completely replacing the fossil fuel share by 2050 near net-zero emissions are
S E I T E 2 6 7
T E C H N I S C H E R K O N G R E S S 2 0 1 7 · T E C H N I C A L C O N G R E S S 2 0 1 7
achievable. As eFuels will be introduced into the existing fleet, they have a direct
and fast impact on the overall fleet emission (see figure 7). A drop below 200 mil-
lion tons of yearly CO2 emissions can be reached 12 years faster and accumulated
savings of CO2 emissions between 2025 and 2050 would total approximately 2.8 Gt,
representing 3 times the overall emissions of Germany in 2014.
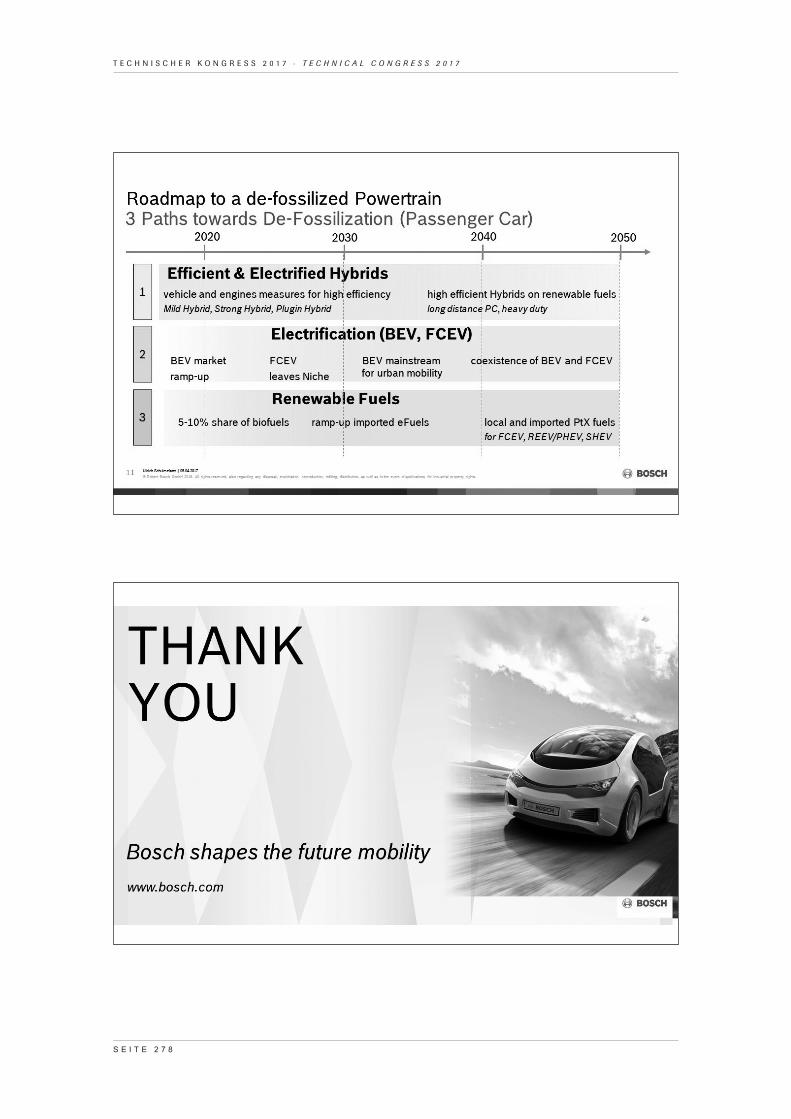
7. Summary / Roadmap
A key element for de-fossilizing the passenger car fleet by 2050 is the improved
power-train efficiency to minimize the demand in overall primary energy. Electrified
hybrids will likely replace “pure” ICE as mainstream before 2030.
With the built-up of charging infrastructure battery electric vehicles will gain signifi-
cant market share with the high potential of becoming mainstream for urban mobil-
ity.
A complete transition of the entire EU passenger car fleet to battery electric vehicles
might be restrained, e.g. by limitations in battery raw material supply. For long range
applications we expect TCO competitiveness for battery electric vehicles, hybrid
vehicles running on synthetic fuels and fuel-cell electric vehicles. All energy carriers
(electricity, hydrogen and hydrocarbon fuels) will need to be de-fossilized by 2050.
For countries with seasonally fluctuating renewable energy, a complete conversion
to a 100 percent electricity-based energy system will be especially challenging and
of high costs. Transportable and storable renewable energy carriers such as hydro-
gen or synthetic hydrocarbon fuels will help to limit the necessary investment costs
for grid extension, storage and complementary power plants. For economic reasons
these renewable energy carriers will be imported from geographically privileged
regions.
The roadmap to a de-fossilized powertrain is therefore a threefold pathway including
highly efficient hybridization, pure electrification and de-fossilization of the utilized
fuels (see figure 8).
S E I T E 2 6 8
T E C H N I S C H E R K O N G R E S S 2 0 1 7 · T E C H N I C A L C O N G R E S S 2 0 1 7
Literature
[1] World Energy Outlook, International Energy Agency, 2015
[2] Klimaschutzszenario 2050, 2. Endbericht, Öko-Institut, Fraunhofer ISI, 2015
[3] Automotive Aerodynamics in 2020, ATZ 12/2016
[4] Was kostet die Energiewende, Fraunhofer-Institut für Solare Energiesysteme
ISE, 2015
[5] http://fortune.com/2016/09/19/world-record-solar-price-abu-dhabi/
[6] Review Of Combustion Engine Efficiency Improvements And The Role Of
Sufficient Standardization, 14th International conference on renewable
mobility
[7] From Laboratory to Road, White Paper, ICCT, Nov. 2016
[8] FEV Study partially published 12/2016, e.g. http://www.faz.net/aktuell/
technik-motor/auto-verkehr/elektroautos-fordern-hersteller-und-zulieferer-
heraus-14547766.html
[9] Roadmap zum de-fossilisierten Antrieb, Bosch, 17. Internationales
Stuttgarter Symposium
Abbreviations
ICE Internal combustion engine
PHEV Plug-in hybrid electric vehicle
SHEV Strong hybrid electric vehicle
REEV Range-extended electric vehicle
FCEV Fuel-cell electric vehicle
S E I T E 2 6 9
T E C H N I S C H E R K O N G R E S S 2 0 1 7 · T E C H N I C A L C O N G R E S S 2 0 1 7
Picture Annex
Fields of action for CO2 reduction of transport sector
Global CO2 emissions for scenarios: IEA 2DS, 4DS, 6DS [2] and projected 1.5°C
S E I T E 2 7 0
T E C H N I S C H E R K O N G R E S S 2 0 1 7 · T E C H N I C A L C O N G R E S S 2 0 1 7
Energy-only-market price development [2]
Definition of de-fossilized fuels and eFuels
S E I T E 2 7 1
T E C H N I S C H E R K O N G R E S S 2 0 1 7 · T E C H N I C A L C O N G R E S S 2 0 1 7
Projected cost ranges (best/worse case) for different eFuels ex refinery
Vehicle price and fuel cost of eFuel-HEV and BEV, compact class 2025

S E I T E 2 7 2
T E C H N I S C H E R K O N G R E S S 2 0 1 7 · T E C H N I C A L C O N G R E S S 2 0 1 7
Qualitative projection of EU28 passenger car fleet CO2 emissions (WtW)
Threefold pathway to a de-fossilized powertrain
S E I T E 2 7 3
T E C H N I S C H E R K O N G R E S S 2 0 1 7 · T E C H N I C A L C O N G R E S S 2 0 1 7
S E I T E 2 7 4
T E C H N I S C H E R K O N G R E S S 2 0 1 7 · T E C H N I C A L C O N G R E S S 2 0 1 7
S E I T E 2 7 5
T E C H N I S C H E R K O N G R E S S 2 0 1 7 · T E C H N I C A L C O N G R E S S 2 0 1 7
S E I T E 2 7 6
T E C H N I S C H E R K O N G R E S S 2 0 1 7 · T E C H N I C A L C O N G R E S S 2 0 1 7
S E I T E 2 7 7
T E C H N I S C H E R K O N G R E S S 2 0 1 7 · T E C H N I C A L C O N G R E S S 2 0 1 7
S E I T E 2 7 8
T E C H N I S C H E R K O N G R E S S 2 0 1 7 · T E C H N I C A L C O N G R E S S 2 0 1 7