rnai-based anti-cancer strategies - targeting the proto ... · rnai-based anti-cancer strategies -...
TRANSCRIPT

RNAi-based anti-cancer strategies -
targeting the proto-oncogene PIM1
and oncogenic miRNAs
Dissertation
zur Erlangung des Doktorgrades
der Naturwissenschaften (Dr. rer. nat.)
dem Fachbereich Pharmazie
der Philipps-Universität Marburg
vorgelegt von
Maren Thomas
aus Freudenberg (Südwestfalen)
Marburg (Lahn) 2013
Dem Fachbereich Pharmazie
der Philipps-Universität Marburg (Hochschulkennziffer 1180)
vorgelegt am 12.03.2013 und
als Dissertation am 23.04.2013 angenommen.
Erstgutachter: Prof. Dr. Roland K. Hartmann
Zweitgutachter: Prof. Dr. Jens Kurreck
Tag der mündlichen Prüfung am 23.04.2013

i
Zusammenfassung
Krebs ist eine chronische Erkrankung, bei der Körperzellen durch Mutationen entarten,
unkontrolliert wachsen und unter bestimmten Voraussetzungen gesundes Gewebe
infiltrieren. Heutzutage zählt Krebs als zweithäufigste Todesursache der westlichen Welt zu
den wichtigsten epidemiologischen Krankheitsbildern unserer Gesellschaft. Neben
klassischen Behandlungsmethoden wie Resektion des Tumorgewebes, Chemo- oder auch
Immuntherapie ist die Entwicklung neuer Therapieoptionen von großer Bedeutung. Eine
mögliche neue therapeutische Alternative ist der Einsatz kleiner, nicht kodierender,
regulatorischer RNAs wie z.B. miRNAs. MiRNAs sind an der Regulation wesentlicher
biologischer Prozesse wie Entwicklung, Differenzierung oder Proliferation beteiligt, indem sie
die Genexpression über den Mechanismus der RNA-Interferenz beeinflussen. Seit ihrer
Entdeckung bestätigte sich die Annahme, dass miRNAs sowohl tumorsuppressive als auch
onkogene Funktionen ausüben, weshalb sie sich nicht nur als diagnostische oder
prognostische Biomarker des Krebsgewebes eignen, sondern auch als Therapeutika selbst
eingesetzt werden könnten. In einer miRNA-Substitutionstherapie wird der Verlust oder die
Herunterregulierung einer miRNA mit tumorsuppressiver Wirkung durch externe Zugabe
ausgeglichen. Eine Antisense-Therapie vermittelt hingegen eine Inhibition onkogener
miRNAs durch komplementäre Oligonukleotide. Eine sichere und effiziente Aufnahme der
RNA-Moleküle zum Wirkort muss in beiden Ansätzen sichergestellt werden. Zurzeit ist die
Entwicklung effizienter Delivery-Systeme der limitierende Faktor für miRNA-basierte
Therapieansätze.
In dieser Arbeit wurde zunächst das Proto-Onkogen PIM1 bezüglich einer möglichen
RNAi-basierten Antikrebstherapie untersucht. Eine Überexpression der PIM1 Kinase wird in
zahlreichen soliden Tumoren oder malignen Entartungen des hämatopoetischen Systems
beobachtet und ist in der Regel mit einem schwerwiegenden Krankheitsverlauf assoziiert.
In vitro-Studien an humanen Leukämie- und Kolonkarzinom-Zelllinien konnten erstmalig
zeigen, dass die zelluläre PIM1 Proteinexpression durch eine miRNA mit tumorsuppressiver
Wirkung, nämlich miR-33a, spezifisch herunterreguliert wird, woraus zusätzlich ein
proliferationsinhibierender Effekt resultiert. Ein erfolgreiches Delivery von nanopartikulären
Vesikeln aus miR-33a Oligonukleotiden und einem nicht toxischen, verzweigtkettigen
Polyethylenimin (PEI F25 LMW) führte in Maus-Tumor-Modellen zu einem antitumorigenen
Effekt, der durch eine Reduktion des Tumorvolumens gezeigt werden konnte. Diese
in vitro- und in vivo-Studien weisen das Proto-Onkogen PIM1 erstmalig als
erfolgversprechendes Zielobjekt für eine miRNA-vermittelte Substitutionstherapie aus.

Zusammenfassung
ii
Der Fokus des zweiten Projektes lag auf der Entwicklung neuartiger LNA-basierter miRNA
Inhibitoren, im Weiteren LNA-Antiseeds genannt, bestehend aus einzelsträngigen
Oligonukleotiden mit sog. Locked Nucleic Acid (LNA)-Modifikationen und einem natürlich
vorkommenden Phosphodiester-Nukleotidrückgrat. Im Allgemeinen erhöht ein LNA-Design
sowohl die Resistenz der Oligonukleotide gegenüber einem Abbau durch zelluläre
Nukleasen als auch ihre Affinität zur Ziel-miRNA, wobei durch komplementäre Bindung an
onkogene miRNAs deren zelluläre Funktionen ausgeschaltet werden. Bereits die
Verwendung geringer Konzentrationen an LNA-Antiseeds zeigte in humanen Krebs-Zelllinien
eine nahezu vollständige Inhibition onkogener miRNAs der miR-106b Familie, die durch eine
Steigerung der endogenen Derepression des Tumorsuppressors P21 gezeigt wurde. Eine
erfolgreiche Verpackung der neuartigen LNA-basierten miRNA Inhibitoren mit dem
verzweigtkettigen Polyethylenimin PEI F25 LMW sowie die funktionelle Aufnahme der
gebildeten Nanopartikel in humane Krebszelllinien konnte in weiteren in vitro-Experimenten
gezeigt werden. Der Einsatz von PEI F25 LMW komplexierten LNA-Antiseed
miRNA-Inhibitoren könnte nun auch in Xenograft-Tumor-Modellen der Maus als ein
erfolgversprechender Ansatz einer Antisense-Therapie getestet werden.
Im dritten Themenkomplex dieser Arbeit wurde die transkriptionelle Regulation des
onkogenen miRNA Clusters miR-17-92 untersucht. Eine Überexpression dieses Clusters ist
mit gesteigerter Proliferation, Angiogenese und verminderter Apoptose assoziiert und wird in
zahlreichen hämatopoetischen und soliden Tumoren beobachtet. Die Transkription von
miR-17-92 wird dabei maßgeblich durch das Onkogen MYC reguliert. In vitro-Experimente in
humanen Krebs-Zelllinien zeigten, dass auch der miR-17-92 Cluster zu jenen 20 % aller
MYC regulierten Gene gehört, dessen Transkription durch einen Synergismus zwischen
MYC und PIM1 gesteuert wird. Weitere Untersuchungen hinsichtlich der transkriptionellen
Regulation von miRNA Promotoren könnten zukünftig dazu beitragen, die Zusammenhänge
zwischen miRNA-Expression und der Entstehung von Krebs näher zu charakterisieren.
iii
Abstract
Cancer is a chronic disease caused by a degeneration of somatic cells due to mutations. In
general cells grow erratic and under certain conditions this leads to an infiltration of even
healthy tissues. To date cancer is the second most common cause of death in the Western
world and belongs to one of the most important epidemiological diseases of our society.
Besides traditional methods in cancer treatment such as resection of tumor tissue, chemo- or
immunotherapy, the development of novel therapeutic strategies is of the highest
importance. One therapeutic option would include the use of small non-coding regulatory
RNAs such as miRNAs. MiRNAs are involved in the regulation of crucial biological processes
such as development, differentiation or proliferation due to the control of the cell’s gene
expression via RNA interference. Since the discovery of miRNAs, evidence has emerged
that they can exert either tumor-suppressive or oncogenic functions. Thus miRNAs are not
only applied as diagnostic or prognostic biomarkers of cancerous tissues, but can also
function as therapeutics. In miRNA replacement therapy a loss or downregulation of a
tumor-suppressive miRNA is adjusted with addition of this single miRNA. On the contrary an
antisense therapy approach mediates the inhibition of oncogenic miRNAs by antisense
oligonucleotides. Safe and efficient delivery of the oligonucleotides has to be guaranteed for
both approaches. Currently the development of such efficient delivery systems is the critical
and limiting factor upon miRNA-based therapy designs.
In this thesis the proto-oncogene PIM1 was considered regarding a putative RNA-based
anti-cancer strategy. Overexpression of PIM1 kinase usually is associated with severe forms
of cancers with bad prognosis in several solid tumors or malign degenerations of the
hematopoietic system. In vitro studies revealed a specific reduction of PIM1 protein levels in
human leukemia and colon carcinoma cell lines due to a miRNA with tumor-suppressive
potential, namely miR-33a. Additionally this decrease in PIM1 resulted in an inhibition of
proliferation. Successful delivery with nanoparticle complexes composed of miR-33a
oligonucleotides and a non-toxic branched polyethylenimine (PEI F25 LMW) showed an
anti-tumor effect in mouse colon carcinoma models that was obtained through a reduction in
tumor size. These in vitro and in vivo studies provide evidence for the first time that the
proto-oncogene PIM1 is a promising target for miRNA replacement therapy.
The second project dealt with the development of novel LNA-based miRNA inhibitors, termed
LNA antiseeds, composed of single-stranded RNA oligonucleotides with locked nucleic acid
(LNA) modifications and a natural phosphodiester backbone. In general an LNA design
enhances the resistance of oligonucleotides against cellular degradation by nucleases.

Abstract
iv
Furthermore affinity of the molecule to the miRNA of interest is increased. Cellular functions
of the targeted oncogenic miRNAs are silenced due to complementary binding to the
inhibitor. A use of minor amounts of LNA antiseeds already revealed an almost complete
inhibition of miRNAs of the miR-106b family in human cancer cell lines which was connected
to an endogenous derepression of the tumor suppressor P21. Successful complex formation
of the novel LNA antiseeds with the branched polyethylenimine PEI F25 LMW has been
proven. Furthermore in vitro experiments confirmed a functional delivery of the resulting
nanoparticles into human cancer cell lines. Application of PEI F25 LMW complexed
LNA antiseed miRNA inhibitors could now be tested as a promising antisense therapy
approach in xenograft tumor mouse models.
The third topic addressed the transcriptional regulation of the oncogenic miRNA cluster
miR-17-92. Overexpression of this miRNA cluster is associated with enhanced proliferation,
sustained angiogenesis and reduced apoptosis in several hematopoietic malignancies and
solid tumors. Transcription of human miR-17-92 is significantly regulated by the oncogene
MYC. In vitro experiments in human cancer cell lines confirmed that miR-17-92 belongs to
one of those 20 % of MYC regulated genes which transcription is controlled by a synergism
of MYC and PIM1. Further investigations regarding transcriptional control of miRNA
promoters could provide profound evidences for a better understanding of a connection
between miRNA expression levels and the development of cancer.

v
Publications
This thesis is based on the following publications which in the text will be referred to by their
Roman numerals:
I Thomas M, Lange-Grünweller K, Weirauch U, Gutsch D, Aigner A, Grünweller A and
Hartmann RK: The proto-oncogene Pim-1 is a target of miR-33a. Oncogene
(2012), 31, 918-928
II Ibrahim AF, Weirauch U, Thomas M, Grünweller A, Hartmann RK and Aigner A:
MicroRNA Replacement Therapy for miR-145 and miR-33a Is Efficacious in a
Model of Colon Carcinoma. Cancer Res (2011), 71, 5214-5224
III Thomas M, Lange-Grünweller K, Dayyoub E, Bakowsky U, Weirauch U, Aigner A,
Hartmann RK and Grünweller A: PEI-complexed LNA antiseeds as miRNA
inhibitors. RNA Biology (2012), 9(8), 1088-1098
IV Thomas M, Lange-Grünweller K, Hartmann D, Golde L, Schlereth J, Aigner A,
Grünweller A and Hartmann RK: Pim-1 Dependent Transcriptional Regulation of
the Human miR-17-92 Cluster. Manuscript in preparation

vi
Contents
1 Introduction ..................................................................................................................... 1
1.1 Cancer ..................................................................................................................... 1
1.1.1 Carcinogenesis ................................................................................................. 2
1.1.2 Treatment of cancer .......................................................................................... 3
1.2 RNA interference and miRNAs ................................................................................ 3
1.2.1 Discovery of miRNAs ........................................................................................ 3
1.2.2 Genomics, biogenesis and mechanism of miRNAs ........................................... 4
1.2.3 MiRNAs associated with cancer ........................................................................ 7
1.3 MiRNAs as cancer therapeutics ............................................................................... 8
1.3.1 Strategies to restore tumor-suppressive miRNAs.............................................. 8
1.3.2 Strategies to inhibit oncogenic miRNAs ............................................................ 9
1.3.3 Delivery and perspective of miRNA-based therapeutics.................................. 10
1.4 Analyzed oncogenes.............................................................................................. 13
1.4.1 The human PIM1 kinase ................................................................................. 13
1.4.2 The human miRNA cluster miR-17-92 ............................................................ 16
1.5 Goal of the project ................................................................................................. 19
2 Materials and Methods .................................................................................................. 21
2.1 Buffers, Media and Solutions ................................................................................. 21
2.2 Oligonucleotides .................................................................................................... 21
2.2.1 DNA oligonucleotides ..................................................................................... 21
2.2.2 RNA oligonucleotides ..................................................................................... 23
2.2.3 LNA-based oligonucleotides ........................................................................... 26
2.3 Antibodies .............................................................................................................. 26
2.4 Size markers .......................................................................................................... 27

Contents
vii
2.5 Bacterial cell culture ............................................................................................... 28
2.5.1 Bacterial strains .............................................................................................. 28
2.5.2 Bacterial growth on agar plates....................................................................... 28
2.5.3 Bacterial cell culture in liquid medium ............................................................. 28
2.5.4 Preparation of chemically competent E. coli DH5α cells ................................. 28
2.5.5 Transformation of bacterial cells ..................................................................... 29
2.6 Eukaryotic cell culture ............................................................................................ 29
2.6.1 Eukaryotic cell culture of suspension cell lines ................................................ 29
2.6.2 Eukaryotic cell culture of adherent cell lines.................................................... 30
2.7 Experimental working with animals ........................................................................ 30
2.7.1 Athymic nude mice ......................................................................................... 31
2.7.2 Subcutaneous xenograft colon carcinoma tumor models ................................ 31
2.7.3 MiRNA tissue uptake in vivo ........................................................................... 31
2.8 Transfection of mammalian cell lines ..................................................................... 31
2.8.1 Transfection procedure of suspension cell lines .............................................. 32
2.8.2 Transfection procedure of adherent cell lines .................................................. 32
2.9 Protein techniques ................................................................................................. 33
2.9.1 SDS PAGE ..................................................................................................... 33
2.9.2 Western Blot ................................................................................................... 34
2.9.3 ELISA ............................................................................................................. 35
2.9.4 Liver enzyme activity assays .......................................................................... 35
2.9.5 Luciferase reporter assay ............................................................................... 36
2.10 Cell cycle analyses ................................................................................................ 36
2.10.1 Cell cycle analyses using nocodazole ............................................................. 36
2.10.2 WST-1 assay .................................................................................................. 37
2.10.3 Cell counting method ...................................................................................... 37

Contents
viii
2.11 Apoptosis assays ................................................................................................... 38
2.11.1 Cell death detection assay .............................................................................. 38
2.11.2 Caspase assay ............................................................................................... 38
2.12 FACS ..................................................................................................................... 39
2.12.1 Cell sorting via propidium iodide staining ........................................................ 39
2.13 Plasmid construction .............................................................................................. 39
2.13.1 Full-length PIM1 cDNA clone .......................................................................... 39
2.13.2 pGL3 control reporter vector ........................................................................... 41
2.13.3 Cloning of different pGL3 reporter vector constructs ....................................... 41
2.14 General nucleic acid techniques ............................................................................ 44
2.14.1 Determination of nucleic acid concentration .................................................... 44
2.14.2 Nucleic acid gel electrophoresis ...................................................................... 45
2.14.3 Staining of nucleic acids ................................................................................. 47
2.15 DNA techniques ..................................................................................................... 49
2.15.1 Plasmid preparation ........................................................................................ 49
2.15.2 Phosphorylation of 5’-OH ends of DNA oligonucleotides................................. 49
2.15.3 Removal of 5’-phosphate groups of plasmid DNA ........................................... 50
2.15.4 Restriction digest of DNA ................................................................................ 50
2.15.5 Ligation of DNA fragments .............................................................................. 51
2.15.6 Human genomic DNA preparation .................................................................. 52
2.15.7 Reverse transcription ...................................................................................... 52
2.15.8 PCR ................................................................................................................ 53
2.15.9 Purification of PCR reactions .......................................................................... 57
2.15.10 DNA sequencing ......................................................................................... 57
2.15.11 ChIP assay .................................................................................................. 57
2.16 RNA techniques ..................................................................................................... 59

Contents
ix
2.16.1 RNA extraction for small RNAs of mammalian cell lines ................................. 59
2.16.2 Total RNA extraction of mammalian cell lines ................................................. 60
2.16.3 Phenol/chloroform extraction of RNA .............................................................. 60
2.16.4 DNaseI digestion ............................................................................................ 61
2.16.5 Radiolabeling of the 5’-end of RNA ................................................................. 61
2.16.6 Determination of PEI complex formation efficacy ............................................ 62
2.17 Atomic force microscopy ........................................................................................ 63
2.18 Bioinformatics and software tools........................................................................... 63
2.18.1 GraFit™ .......................................................................................................... 64
2.18.2 CorelDRAW® Graphics Suite .......................................................................... 64
2.18.3 Statistical analyses ......................................................................................... 64
2.18.4 NCBI ............................................................................................................... 64
2.18.5 TargetScan ..................................................................................................... 65
2.18.6 MiRBase ......................................................................................................... 65
2.18.7 ClustalW and WebLogo .................................................................................. 65
2.18.8 PromPredict .................................................................................................... 66
2.18.9 Neural Network Promoter Prediction ............................................................... 66
2.18.10 McPromoter 006.......................................................................................... 66
2.18.11 Promoter 2.0 Prediction Server ................................................................... 66
2.18.12 CorePromoter ............................................................................................. 66
3 Results and Discussion ................................................................................................. 68
3.1 Project 1: The proto-oncogene PIM1 is a target of miR-33a in vitro ..........................
and in vivo (publication I and II) ............................................................................. 69
3.2 Project 2: Novel seed-directed LNA antimiRs as potent miRNA inhibitors .................
in vitro (publication III) ............................................................................................ 75

Contents
x
3.3 Project 3: Transcriptional regulation of the human ....................................................
miR-17-92 cluster (manuscript in preparation IV) ................................................... 80
4 References ................................................................................................................... 85
APPENDIX ........................................................................................................................ 101
A. Publication I ................................................................................................................ 101
B. Publication II ............................................................................................................... 126
C. Publication III .............................................................................................................. 146
D. Publication IV .............................................................................................................. 161
E. Acronyms and units..................................................................................................... 186
F. Gene nomenclature .................................................................................................... 192
G. List of figures .............................................................................................................. 194
H. List of tables ................................................................................................................ 195
I. List of equations .......................................................................................................... 196
J. Primers for cloning ...................................................................................................... 197
K. Primers for sequencing ............................................................................................... 199
L. MiRNA sequences ...................................................................................................... 200
M. Equipment ................................................................................................................... 201
N. Chemicals ................................................................................................................... 203
O. Enzymes, Kits and Reagents ...................................................................................... 205
P. Vector sequence pCMV-XL4 (OriGene) ...................................................................... 206
Q. Vector sequence pGL3 control (Promega) .................................................................. 209
Acknowledgments .............................................................................................................. 214
Academic achievement ...................................................................................................... 215
Curriculum Vitae ................................................................................................................ 217
Declaration/Erklärung ........................................................................................................ 219

1
1 Introduction
1.1 Cancer
Cancer is defined as a chronic disease (1) and includes more than 100 distinct types and
subtypes of malignancies found within different organs (2). In general cancer is known as a
malignant neoplasm which develops as a clone from one single cell of origin (3) after one or
more oncogenic events have occurred (Figure 1).
Figure 1: Formation of a malignant neoplasm. A malignant neoplasm generates after several oncogenic events have occurred (following Visvader, 2011 (4)).
Since the ancient Egyptian time period, malignant diseases have awoken the interests of
scientists; in particular to clarify their origins and to understand more about molecular
mechanisms, prevention, etiology, pathogenesis and treatment of cancer (5). The treatment
of tumors was described in ancient Egyptian and Greek literature and the histological
diagnosis of cancer in an Egyptian mummy (6) provided evidence that this disease is not
only a current problem. Thus to treat cancer it is important to understand the underlying
molecular mechanisms in order to predict how a neoplasm will evolve. Then we maybe will
have the ability to interfere with and disrupt the clonal evolution of a neoplasm to prevent
cancer formation. Even if initiation of a neoplasm cannot be prevented, early detection and
correct diagnosis of malignant cancer will probably lead to increased cure rates (7).
Therefore it is necessary to classify tumors and differentiate between benign and malignant
instances. Whereas benign tumors are not cancerous and do not spread out in the body,
malignant neoplasms are characterized by their ability to invade nearby tissues and organs,
also known as metastasis (8), (9). In general tumors are classified in various categories
depending on the cell type or tissue they evolve from. For instance a carcinoma is defined as
a tumor beginning in any internal organ, leukemia is a cancer that arises from hematopoietic
cells and a lymphoma or myeloma derives from cells of the immune system (9). In Germany
approximately 470,000 new cases of cancer were estimated in 2008 by the Robert Koch
Institute (10). The causes of cancer are multiple and can be assigned to environmental

Introduction
2
factors like diet or smoking, reproductive and sexual behavior, geophysical factors,
occupational exposures, medicine and/or infections (11), (12).
1.1.1 Carcinogenesis
In literature carcinogenesis is described as the formation and development of cancer. It is
characterized by a progression of changes on genetic and cellular levels. Reprogramming of
a cell leads to uncontrolled cell division, thus forming a malignant neoplasm. The cause of
cancer development is diverse and only in a few cases is it caused by one single factor (2).
In general, 3-12 (or even more) physiological relevant mutations are required to form a
malignant neoplasm (13) (Figure 1). The accumulation of mutations during a cell’s lifetime is
called somatic evolution (3), (7). At the cellular level, a selection benefit exists for increased
cell proliferation and survival for those cells harboring a competitive advantage in at least one
of six essential alterations: (i) self-sufficiency in proliferative signals, (ii) insensitivity to growth
suppressors, (iii) tissue invasion and metastasis, (iv) limitless replicative potential, (v)
sustained angiogenesis and (vi) the evasion of programmed cell death (2) (Figure 2).
Figure 2: Selection benefit of cancer cells. Most cancers have acquired a selection benefit during their development mediated through one of those six mechanistic strategies (following Hanahan & Weinberg, 2011 (1)).
All of the aforementioned biological properties are additionally accelerated by genomic
instability (2). Capabilities such as proliferation and immortality that allow cancer cells to
survive are complemented by the inflammatory state of the cell, autophagy, necrosis or the
reprogramming of the cell’s energy metabolism (1). Furthermore the growth advantage and
increased survival of the tumor is a consequence of chromosomal rearrangements,
mutations and gene amplifications caused by the inactivation of tumor suppressor genes (14)
or the activation of oncogenes (15). A tumor suppressor gene, a so-called anti-oncogene, is
a gene that encodes for a protein which blocks the development of cancer in the cell e.g. by

Introduction
3
the regulation and/or control of cell division or by initiation of apoptosis (16). In contrast an
oncogene is a gene that has the potential to cause cancer and evolves by e.g. the mutation
or overexpression of a proto-oncogene, and thus becomes activated (17). In general
oncogenes can be subdivided into six major groups: (i) chromatin remodelers, (ii)
transcription factors, (iii) growth factors, (iv) growth factor receptors, (v) signal transducers
and (vi) apoptosis regulators (15). Likewise, small non-coding RNAs (ncRNAs), in particular
the class of microRNAs (miRNAs), are associated with tumor development (18). It has been
reported that even half of all annotated miRNAs map within fragile chromosomal regions that
can be linked to human cancer (19).
1.1.2 Treatment of cancer
Due to the fact that cancer is the second most common cause of death (5) in the Western
world, treatment of malignant neoplasms is of the highest importance. Although crude cancer
surgery took place in the ancient Egypt (5), the establishment of radiation by Emil Grubbe in
1957 (20), followed by subsequent research, means that nowadays treatments are much
more focused on individual patients (21). New healing procedures, earlier diagnosis of
cancer and ‘personalized’ therapy are the first steps of translating cancer research into
targeted therapeutics (22). Such molecular techniques (23) include the development of small
molecules, peptide mimetics, monoclonal antibodies (mABs) and antisense oligonucleotides
(24). Several mABs and small molecule compounds have now been approved for cancer
therapy (24). In general mABs show significant promise due to their low toxicity profiles in
clinical studies (25). Moreover they are well-tolerated compared with conventional
chemotherapeutic agents (25). Since miRNA expression profiles are used to classify tumors
(26) based on the tissue type and/or stage of disease (27), (18) one promising therapeutic
strategy is miRNA-based therapy (18) which has been successfully established using in vivo
animal models thus far (28) and already has been tested in clinical trials (29).
1.2 RNA interference and miRNAs
1.2.1 Discovery of miRNAs
RNA interference (RNAi), a form of post-transcriptional gene silencing (30), was first
described in 1998 by Fire and Mello (31) in the worm C. elegans. RNAi, which is thought to
be the oldest and most ubiquitous cellular antiviral defense system, is a biological process in
which small non-coding double-stranded RNA molecules interfere with messenger RNAs
(mRNAs) to inhibit gene expression (32). Before the discovery of RNAi, the gene lin-4 was

Introduction
4
found in 1993 by Ambros and Lee in C. elegans (33). Cel-lin-4 codes for two small transcripts
of ~61 and 22 nt which show complementarity to a sequence located in the 3’-UTR of
Cel-lin-14 (33). Later on the Cel-lethal-7 (Cel-let-7) gene was described. It encodes a 21 nt
long RNA transcript that has been shown to regulate the expression of several genes which
are involved in the timing of developmental transition in C. elegans (34). These findings
preceded a new class of small non-coding regulatory RNAs being described - microRNAs
(miRNAs) (35), (36), (37). To date more than 15,000 miRNA gene loci are annotated and
expressed in over 140 different species and organisms (38). In mammals ~2000 miRNAs
(38) represent about 1 % of the human genome (39). MiRNAs are able to target dozens or
even hundreds of different mRNAs to regulate and fine-tune the cellular expression of about
50 % of all protein-coding genes (40). This regulation takes place in almost all biological
processes and is important for genome functions such as chromosome segregation,
transcription, RNA stability, RNA processing, and translation (41). Furthermore, miRNAs play
crucial roles in cellular processes; they are involved in development, proliferation,
differentiation, the stress response and apoptosis (39).
1.2.2 Genomics, biogenesis and mechanism of miRNAs
In general miRNAs are encoded in the genome and can be subdivided into intergenic,
intronic or exonic genomic organized miRNAs (42) (Figure 3). Intergenic miRNAs are found
in genomic regions which are not part of known functional transcription units (TUs). They are
generally monocistronic or polycistronic and have their own promoter and/or other regulatory
elements (43) and a primary miRNA (pri-miRNA) transcript length of several kb (44). About
50 % of all known miRNA genes are encoded within TUs (45) (either protein-coding or
non-coding (35)), and are termed intronic miRNAs. Intronic miRNAs themselves can be
transcribed either by the host gene promoter or an own promoter element as single or
clustered pri-miRNA transcripts (46). In some special cases, a whole intron acts as a
pri-miRNA transcript and therefore is called mirtron. This pri-miRNA is recognized and
processed by the splicing machinery (47). Exonic located miRNAs are very rare and overlap
with exons of ncRNAs (42). The transcription of miRNA genes is a complex process that until
now has been only poorly understood (48).
The biogenesis and generation of mature miRNAs can be divided into several processing
steps (Figure 3).

Introduction
5
Figure 3: Biogenesis of miRNAs. (i) Transcription of exonic, intergenic or intronic miRNA genes is followed by (iia) nuclear processing of the pri-miRNA transcript by the microprocessor complex (DROSHA/DGCR8) generating the pre-miRNA. (i) Transcription of a mirtron is performed by the spliceosome generating a pre-miRNA transcript. (iib) The pre-miRNA is actively exported into the cytoplasm by Exportin-5 using RAN-GTP. (iic) In the cytoplasm the pre-miRNA is processed by the RNase III enzyme DICER1 into the double-stranded miRNA/miRNA*. (iii) Passenger strand degradation follows the incorporation of the miRNA/miRNA* duplex into the miRISC complex. (iv) After target recognition of the miRNA binding site in the 3’-UTR of an mRNA, translational repression and/or mRNA cleavage occurs mediated by proteins of the AGO family.
Firstly, (i) transcription of the miRNA gene has to occur followed by (ii) several maturation
steps, then (iii) the RNA-induced silencing complex (RISC) assembly has to form (49) before
finally (iv) mRNA cleavage or translational repression can take place. (i) Transcription of
partially long pri-miRNA transcripts (49) is dependent on RNA polymerase II (POLR2) based
on the findings that these primary transcripts contain cap-structures as well as poly(A) tails
(48) which are classical signals for POLR2 transcription maturation. (ii) The first maturation
step in human miRNA processing is initiated by the microprocessor complex (50) composed

Introduction
6
of the nuclear RNase III enzyme DROSHA (51) associated with
DiGeorge syndrome chromosomal region 8 (DGCR8) protein (52). In this step the longer
primary transcript is cleaved into an approximately 70 nt long precursor miRNA (pre-miRNA)
(43) which folds into a defined stem-loop structure (35) harboring a 5’-phosphate and a 2 nt
overhang on the 3’-OH terminus (53). The pre-miRNA afterwards is exported from the
nucleus into the cytoplasm. This active transport process is mediated by the export receptor
XPO5 termed Exportin-5 using RAN-GTP (54), (55) and is triggered by the matured
stem-loop structure (56). The second end of the precursor miRNA is processed in the
cytoplasm by the RNase III endonuclease Dcr-1 homolog (Drosophila) (DICER1) (57), (58),
(51) generating again a 5’-phosphate and a 2 nt overhang on the 3’-OH terminus on the
opposite site (49) of the miRNA. Thus a short (approximately 22 nt long) duplex termed
miRNA/miRNA* is formed (37). (iii) The RISC assembly follows DROSHA cleavage,
nucleocytoplasmic export and cytoplasmic DICER1 cleavage. Several proteins of the
argonaute family (argonaute RISC catalytic component 1-4, AGO 1-4) are part of this
miRNA-induced silencing complex (miRISC) including its catalytic core (59), (60), (61). The
strand of the miRNA duplex with its 5’-end less tightly paired (62) (and thus shows higher
thermodynamic instability) enters the miRISC complex and generates the mature and
functional miRNA (63), (64), (59). The miRNA* strand of the matured duplex is degraded
(65). Subsequently the miRISC complex leads to post-transcriptional gene silencing via
target recognition of mRNAs in the cytoplasm. Post-transcriptional gene silencing can
happen by two different mechanisms depending on the identity of the target: (i) mRNA
cleavage or (ii) translational repression (49). (i) Cleavage of an mRNA occurs if the miRNA
has sufficient complementarity to the mRNA. The cleavage site appears between the
nucleotides pairing to residues 10 and 11 of the miRNA (59). (ii) After the discovery of
miRNAs it was proposed that miRNAs modulate post-transcriptional gene expression via
translational repression (66). The most efficient translational inhibition is provided by a
cooperative mechanism (67) and specific target selection of miRNAs (68). The ability to
translationally repress a target mRNA mostly depends on perfect Watson-Crick base pairing
of the miRNA’s seed region (69), mainly the first 8 nt on the 5’-end of the mature miRNA. In
some cases additional pairing of the 3’-end of the miRNA is needed (69). It was recently
discovered that miRNAs can also target other genomic regions such as 5’-UTRs (70), coding
regions (71) or promoter elements (72) after their import into the nucleus (73). All findings
implicate the important regulatory mechanisms of this class of small non-coding RNAs and
demonstrate the enormous ability of these post-transcriptional gene regulators to intervene in
the pathogenesis of human cancers (74) by targeting either tumor suppressor genes or
oncogenes.
Introduction
7
1.2.3 MiRNAs associated with cancer
Since the discovery of miRNAs, evidence has emerged that miRNAs can function as tumor
suppressors or as oncogenes, by blocking or activating the cell’s malignant potential
respectively, and are therefore referred to as oncomiRs (19), (74). Their role in cancer
development is based on three important observations (75). Firstly, they are involved in cell
proliferation and apoptosis (33) and can affect all other stated hallmarks of cancer such as
tissue invasion or metastasis (74). Secondly, miRNAs are frequently located at fragile
regions of chromosomes (76). Thirdly, miRNA expression is deregulated in several malignant
tumors (77).
In 2002 it was reported for the first time that miRNAs are deregulated and as a result are
involved in the development of human cancer (78). A deletion of a 30 kb region on
chromosome 13q14, encoding the miRNA genes of miR-15a and miR-16-1, or a down
regulation of these miRNAs is associated with B-cell chronic lymphocytic leukemia (B-CLL)
(79). Additionally it has been found that those two miRNAs act as tumor suppressors and
induce apoptosis by targeting the oncogene B-cell lymphoma 2 (BCL2) (80). Ongoing studies
and miRNA profilings of human cancers have revealed cell type and tissue specific
signatures of miRNAs (39). MiRNAs, which had overall higher expression levels, were
identified as oncogenic miRNAs that generally repress tumor suppressor genes. As an
example, miR-155 overexpressed in B-cell lymphomas (81) has been reported to target the
suppressor of cytokine signaling (SOCS) proteins (82). Another miRNA, oncogenic miR-21,
is overexpressed in breast cancer (83) and targets several tumor suppressor genes like
phosphatase and tensin homolog (PTEN) (84), BCL2 (85) and tissue growth factor beta
(TGFB) (86) mediating cell survival, proliferation and differentiation of cells. Further important
oncogenic miRNAs are encoded in the miR-17-92 polycistron (87) and are described to be
involved in several cellular processes such as proliferation or angiogenesis (88). Several
miRNAs are transcriptionally induced by tumor suppressors or oncogenes (78). The
tumor protein 53 (TP53) induces the transcription of the miR-34 family in response to DNA
damage (89), (90) and v-myc myelocytomatosis viral oncogene homolog (avian) (MYC)
protein, a classical oncogene, transcriptionally activates the expression of the oncogenic
miRNAs miR-17-92 (91) or represses the transcription of tumor-suppressive miRNAs like
let-7 (92). An increased risk of cancer formation is also associated with mutations and/or
single nucleotide polymorphisms (SNPs) in miRNA binding sites of oncogenes such as the
Kirsten rat sarcoma viral oncogene homolog (KRAS) protein (93) regulated by miRNA let-7.
These multiple functions of miRNAs in carcinogenesis implicate that miRNAs are
Introduction
8
considerably beneficial as diagnostic and prognostic biomarkers to differentiate between
malignant and benign forms of tumors (77), (94), (95).
1.3 MiRNAs as cancer therapeutics
In the last decade two major findings have established the use of miRNAs as an anti-cancer
therapy: (i) miRNA expression differs in cancerous and normal tissues (79), (96), (81), (97)
and (ii) a change in the cancer’s phenotype can be caused by targeting miRNA expression
(98), (99), (100). As previously mentioned miRNAs are involved in the post-transcriptional
gene regulation of several genes being part of a large cellular regulatory network (100). Thus
an enormous advantage of miRNA-based therapeutic strategies in the cancer treatment is
the ability of miRNAs to target multiple genes which are connected to distinct biological
cellular processes in different molecular pathways such as normal or malignant homeostasis
(89), (101). A modification of the miRNA expression levels in cancer tissues to restore
normal homeostasis is possible because miRNAs show key functions in the coordination of
the whole cancer network (100). To address the pharmacological modulation of
cancer-associated miRNAs there are two possible strategies available: (i) use of drugs that
allow the modulation of miRNA expression e.g. blocking their processing in the cellular
system (102), or (ii) a direct regulation of miRNA expression levels by either the substitution
of less expressed tumor suppressor miRNAs (called miRNA replacement) (103), (28) or the
inhibition of oncogenic miRNAs by antisense oligonucleotides (104).
1.3.1 Strategies to restore tumor-suppressive miRNAs
Restoring a lost or downregulated tumor-suppressive miRNA, which targets an oncogene,
can be modulated by miRNA replacement therapy. An enhanced expression of the miRNA
can either be mediated by (i) virus-associated vector systems or (ii) the introduction of
synthetic oligonucleotides, termed miRNA mimics. (i) In the case of using vector systems the
miRNA gene of interest is packed in the virus and expressed after transduction into cells or
tissues. Viral vector-based systems, including adenovirus-associated (AAV) or
lentivirus-associated vectors (LAV), have a high transduction efficiency of target cells, but
there might be a residual risk of viral infections for treated patients (105). In 2009 it was
shown that an AAV-mediated delivery successfully increased the expression of
tumor-suppressive miR-26a in a murine liver cancer model and suppressed tumorigenesis
without measurable toxicity (106). (ii) MiRNA mimics are usually double-stranded molecules.
The guide strand is identical to the selected miRNA of interest whereas the passenger strand
is chemically modified at the 5’- and 3’-termini to avoid loading into the miRISC complex

Introduction
9
(105). For delivery of miRNA mimics, they have to be formulated for their uptake into cellular
systems. Recently restoring of several downregulated tumor-suppressive miRNAs has been
successfully tested to reduce tumor growth in mouse cancer models (28), (107).
The advantage of miRNA replacement therapy is that a restored miRNA has the same
sequence as the deleted or downregulated miRNA of interest, and thus is expected to target
the identical set of mRNAs (108). As a consequence, miRNA replacement therapy offers the
possibility of recovering those cellular programs which are active in normal cells. Cellular
pathways that are necessary for the generation of a malignant tumor are switched by
re-introduction of tumor-suppressive miRNA mimics (108), hopefully without any side effects.
MiRNA replacement has emerged as a promising therapy in the treatment of cancer,
particularly because of an overall lower expression of miRNAs in tumor versus normal
tissues (77).
1.3.2 Strategies to inhibit oncogenic miRNAs
Effective inhibition of oncogenic miRNAs can be achieved using anti-miRNAs in the
treatment of cancer. In general those anti-miRNAs are single-stranded antisense
oligonucleotides, termed antimiRs, which are complementary to the miRNA of interest.
AntimiRs are used to sequester oncogenic cellular miRNAs leading to their functional
inhibition (109). However the ability of the miRNA to repress endogenous target mRNAs of
e.g. tumor suppressors is prevented by several cellular mechanisms (105). To reach the best
possible resistance against cellular nucleases and to increase the binding affinity to the
miRNA, the antisense oligonucleotides have to be chemically modified including
modifications in (i) the internucleotide linkages and/or (ii) the sugar (109). (i) In
phosphorothioate modified oligonucleotides a sulfur atom replaces one of the non-bridging
oxygen atoms in the phosphate group of the backbone linkage; this modification leads to
improved nuclease stability as well as an increased binding to plasma proteins (110). (ii) The
most commonly used modifications in antimiR design are several variations in the 2’-sugar
position (Figure 4).

Introduction
10
Figure 4: Modifications of antimiRs. Schematic overview of antisense oligonucleotide modifications including a 2’-O-methyl (2’-O-Me), a 2’-O-methoxyethyl (2’-O-MOE), a 2’-fluoro (2’-F), a locked nucleic acid (LNA) or a morpholino modification.
The first sequence-specific inhibition of let-7 miRNA function was demonstrated using a
2’-O-methyl (2’-O-Me) modified antisense oligonucleotide (111). To date several other
modifications have been described such as 2’-O-methoxyethyl (2’-O-MOE), 2’-fluoro (2’-F) or
locked nucleic acid (LNA), a class of bicyclic RNA analogues (112). In LNA the ribose is
locked in a C3’-endo conformation by introduction of a methylene bridge between the
2’-oxygen and the 4’-carbon of the sugar. This modification results in an increased affinity
towards the complementary miRNA of 2 to 8 °C per introduced LNA modification (113),
(114), (115). Morpholino oligomers are another modification. In these uncharged molecules
the ribose moiety is exchanged for a six-membered morpholino ring (116). This antimiR
design has been successfully tested in zebrafish models to target pri-miRNAs and miRNAs.
In this study, morpholino-modified antisense oligonucleotides acted sequence-specific and
non-toxic (117). Beneath an increase of target affinity, all antimiRs with variations in the
ribose moiety show nuclease resistance and delayed degradation in the cellular system
(109). Presently, approaches to block and inhibit oncogenic miRNAs with antimiRs of
different designs hold a lot of promise as anti-cancer drugs. Further establishment of
anti-miRNA treatments may open new ways in combination therapies to modulate or even
cure cancer.
1.3.3 Delivery and perspective of miRNA-based therapeutics
For the establishment of (i) miRNA replacement therapies or (ii) antimiR strategies to inhibit
miRNAs, the delivery of the oligonucleotides into cells, tissues and/or organs is the major
bottleneck. A safe and efficient delivery of these molecules is the critical factor upon
development of miRNA-based therapeutics. (i) In case of miRNA replacement therapy either
viral vector-based systems (107) or formulated, double-stranded miRNA mimics (28) shall
gain the loss of the respective miRNA (Figure 5). To date several studies have implicated the
promising possibility of miRNA replacement therapy in the treatment of cancer. Several
Introduction
11
downregulated tumor-suppressive miRNAs have been successfully re-introduced into cells
and/or tissues to decrease tumor growth in mouse models. MiRNA replacements of the
let-7 miRNA (118) or miR-34 (119) have been described to act as cancer therapeutics in
murine lung cancers; the systemic delivery of miR-16 inhibits the growth of metastatic
prostate tumors (120) and miRNA replacement therapy of miR-145 and miR-33a mimics are
efficacious in a model of colon carcinoma (28). An optimized formulation for efficient and safe
in vivo delivery of miRNA mimics in mouse cancer models has been shown for intravenous
(121), intratumoral (28), intraperitoneal (28) and intranasal (107) application so far (105). The
delivery of miRNAs has been done by using liposome nanoparticles (122), atelocollagen
(120) or polyethyleneimine (28) implicating a formulated antimiR delivery. (ii) To date several
antimiR designs (Figure 5) have been established either in vitro or in vivo (123). In 2005 a
novel class of antisense oligonucleotides, termed antagomiRs, was described (124). These
antagomiRs are 3’-cholesterol-conjugated single-stranded 2’-O-Me oligonucleotides
complementary to the miRNA of interest. Pharmacological inhibition was shown for e.g.
miR-16 or miR-122. Furthermore the cholesterol conjugation was found to improve cellular
uptake of these molecules in vivo (124). Another in vivo delivery approach has been
described for unconjugated, phosphorothioate modified antisense oligonucleotides (125),
(126) targeting oncogenic and liver-specific miR-122. Either longer oligonucleotides which
are comprised of DNA and LNA modifications (125) or short 8-mer tiny LNAs (126) exhibit
good tissue uptake and good pharmacokinetic properties in vivo (105). A recent in vitro study
also described polyethyleneimine formulated 14-meric LNA antiseeds as promising miRNA
inhibitors (104). This approach enables the possibility to target even whole miRNA families
characterized by the same nucleotides in the seed region of the miRNA (104).
Introduction
12
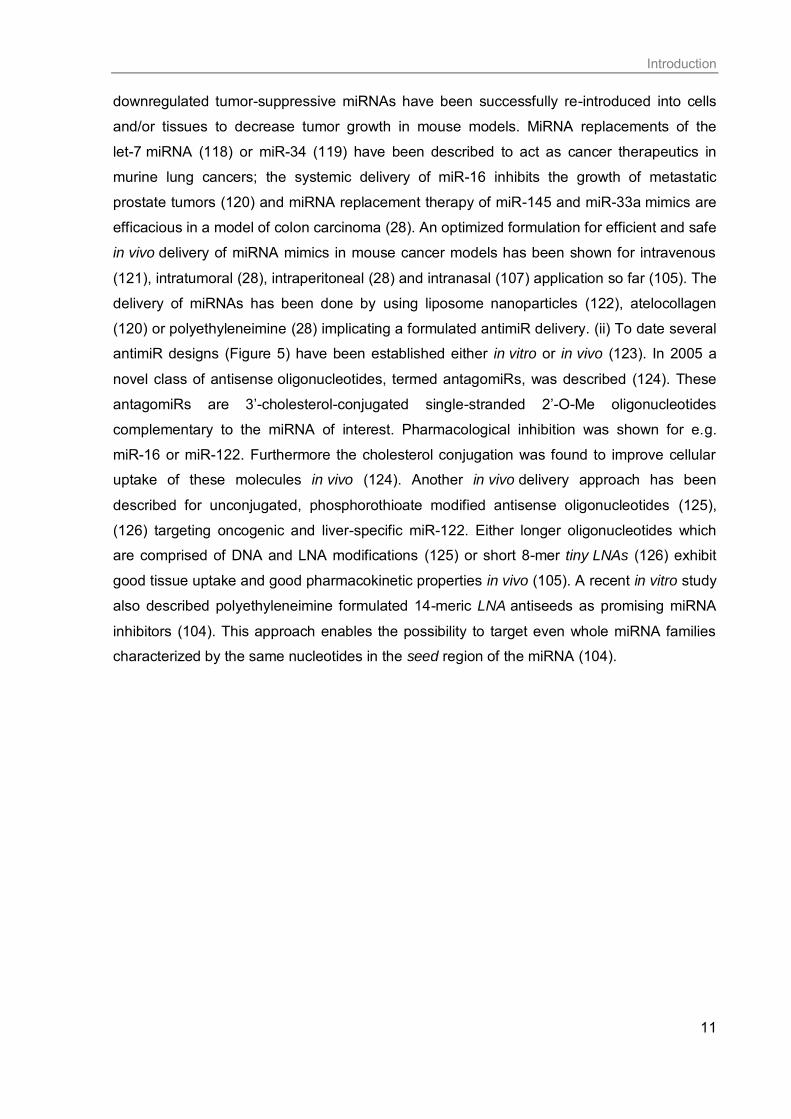
Figure 5: Design of miRNA-based therapeutics. MiRNA-based therapies can be divided into miRNA replacement therapy to restore a loss of a miRNA mediated by viral vector based systems or formulated miRNA mimics (black arrows) or an antimiR design such as antagomiRs, formulated or unformulated antimiRs (red line) to inhibit cellular functions of oncogenic miRNAs.
The development of novel anti-cancer therapeutics holds great promise and the first
miRNA-based therapeutic has reached clinical trials (105). This therapeutic is an
LNA-phosphorothioate-modified miRNA inhibitor against miR-122, termed miravirsen (29).
MiR-122 is specifically expressed in the human liver and plays a role in the modulation of
cholesterol homeostasis (127). Besides it facilitates RNA replication of the hepatitis C virus
(HCV) following infection of humans (128). In 2012 miravirsen was tested in HCV-infected
human patients for the first time. Its application is well-tolerated and shows long-lasting
suppression of viremia (29). The design and development of miRNA-based therapeutics is
opening up new possibilities for the treatment of cancer and may become a powerful
therapeutic strategy in combination therapies if standard treatment approaches are
unsuccessful due to chemo-resistance, metastasis and/or recurrence of the tumor (129).

Introduction
13
1.4 Analyzed oncogenes
1.4.1 The human PIM1 kinase
The PIM1 gene was identified in 1984 as a proto-oncogene in several mouse tumor models.
In murine leukemia virus (MuLV)-induced lymphomas, transcriptional activation of the
PIM1 gene was associated with a proviral insertion into a quite small chromosomal region
(130) within the PIM1 domain. In general the PIM kinases (PIM1, PIM2 and PIM3 (131),
(132)) belong to a family of constitutively active serine/threonine kinases with several cellular
targets (133). They are naturally expressed in several tissues such as bone marrow, thymus,
spleen, prostate or hippocampus (134) being involved in e.g. T-cell activation (135) or fetal
hematopoiesis (136). They play crucial roles in the process of malignant transformation even
in human cancer (137) because they are associated with proliferation, differentiation,
apoptosis and tumorigenesis (138). Overexpression of PIM kinases is correlated with a very
poor prognosis in a wide range of hematopoietic malignancies such as mantle cell lymphoma
or non-Hodgkin’s lymphoma and solid cancers such as prostate cancer (139), (140). To
study the physiological effects of PIM kinases, PIM knockout mice have been generated. It
was shown that PIM1 deficient mice grow almost normally, but show a specific defect in
interleukin (IL)-3 and -7-dependent growth of pre-B-cells and mast cells (141), (142). Triple
knockout mice, with PIM1, PIM2 and PIM3 deficiencies, are viable and fertile, but have
obviously manifested a phenotype showing reduction of body size and moderate defects in
growth factor signaling and T-cell proliferation (132). In humans the PIM1 gene is located on
chromosome 6p21.1-p21.31, a region of approximately 5 kb harboring six exons and five
introns. The mRNA transcript (NM_002648) has a length of 2684 bp (137) and produces two
proteins of 34 and 44 kDa due to an alternative translation initiation at an upstream
CUG codon (143) (Figure 6a). PIM1 expression is tightly controlled by (i) transcriptional,
(ii) post-transcriptional, (iii) translational and (iv) post-translational regulation (138) (Figure
6b). Transcriptional activation of the PIM1 gene is dependent on several growth factors,
hormones or cytokines such as GM-CSF, prolactin and IL-3, -5, -7 or -12 that activate the
signal transducer and activator of transcription 3 and 5 (STAT3/STAT5) (137), (138).
(ii) Post-transcriptional regulation of PIM1 is associated with miRNA binding. It has been
reported that miR-1 (144), miR-33a (103) and miR-328 (145) target the 3’-UTR of
PIM1 mRNA and modulate and/or decrease protein expression. (iii) Translation of the
PIM1 mRNA is shown to be cap-dependent (146) because of long GC-rich destabilizing
regions in the 5’-UTR of PIM1 mRNA. Furthermore it was reported that translation is
regulated by the eukaryotic translation initiation factor 4E (EIF4E) binding to an EIF4E
sensitivity element in the PIM1 3’-UTR which mediates nuclear export and enhances

Introduction
14
translation (147). (iv) The first evidence that the PIM1 protein is post-translationally regulated
arose from variable turnover rates of the different protein isoforms (34 and 44 kDa isoform)
showing half-lives of approximately 1 h and 10 min, respectively (138). PIM1 is able to
activate itself by autophosphorylation on serine 8 and 190 (S8, S190) residues (137). The
kinase is stabilized by heat shock protein 90 (HSP 90) (148); a decrease of PIM1 protein
levels is catalyzed by the protein phosphatase 2A (PP2A) (149), followed by ubiquitination
and degradation of PIM1 in the proteasome. Many phosphorylation targets of PIM1 have
biological functions associated with cell cycle progression and apoptosis (137) such as the
cyclin-dependent kinase inhibitors CDKN1A (in the following termed P21) (150) and
CDKN1B (P27) (151), the cell division cycle 25A (CDC25A) (152) and C (CDC25C) (153)
proteins or the pro-apoptotic protein BCL-2 associated agonist of cell death (BAD) (154).
Another phosphorylation target of PIM1 is the chromobox homolog 3 (CBX3) protein, also
referred to as heterochromatin protein 1 gamma homolog (Drosophila) (HP1G) which is
associated with transcriptional repression via chromatin silencing (155) or gene activation
being localized with elongating POLR2 (156). Furthermore PIM1 phosphorylation mediates
stabilization of the oncogene MYC and thereby enhances transcriptional activity (157). A
strong synergism of MYC and PIM1 has been established in tumorigenesis of transgene
mice (158). MYC was shown to recruit PIM1 to MYC/MYC-associated factor X (MAX)
complexes which are associated with enhancer box elements (E-boxes) in enhancer
segments of euchromatin regions, followed by PIM1 mediated phosphorylation on
histone 3 serine 10 (H3S10) residues to induce gene expression (159).

Introduction
15
Figure 6: Regulatory network of PIM1. (a) PIM1 gene, transcript and proteins. The human PIM1 gene is located on chromosome 6 and encodes six exons (dark blue boxes) with large 5’- and 3’-UTRs containing GC-rich regions (light blue area). The two protein isoforms are synthesized using alternative translation initiation sites (solid and dashed arrows); additional codons are present at the 5’-end of the mRNA (light blue box). PIM proteins have different molecular masses and their kinase domain is indicated by a white box (following Nawijn, Alendar & Berns, 2011 (133)). (b) Involvement of PIM1 in signal transduction pathways. The expression of PIM1 is directly regulated by STAT3/5 induced by growth factors hormones or cytokines (light yellow ovals). Post-transcriptional regulation of PIM1 mRNA is mediated by miRNAs or EIF4E (light green ovals). HSP90 and PP2A post-translationally modify PIM1 protein levels (green ovals). Several phosphorylation targets of PIM1 (yellow P) are indicated (violet ovals) which are involved in various cellular signaling pathways (following Bachmann & Möröy, 2005 (137)).
PIM kinases are promising targets for pharmacological inhibition (133) because they control
several important signaling pathways in cellular processes. If these processes such as
apoptosis, hypoxia or cell cycle control are deregulated, a malignant transformation is
promoted (160). To date several small-molecule PIM kinase inhibitors (161), (162), (163)
have been designed. All of them are ATP-competitive binders within the catalytic
ATP-binding domain of the kinase and prevent PIM-dependent phosphorylation of the
cellular targets (160). Another promising targeting strategy is RNAi to post-transcriptionally
downregulate PIM1 protein levels. So far a PIM1-specific siRNA and one miRNA, namely
Introduction
16
miR-33a, have been successfully used to target PIM1 in a colon carcinoma xenograft mouse
model (28) to inhibit tumor growth.
1.4.2 The human miRNA cluster miR-17-92
The human miRNA cluster miR-17-92 is one of the best characterized polycistronic miRNA
clusters. Known as oncomiR-1, the cluster encodes six miRNAs, namely miR-17, miR-18a,
miR-19a, miR-20a, miR-19b-1 and miR-92-1 (164), deriving from a long primary transcript
(87). In mammals two highly conserved paralogs have been identified: the miR-106a-363
and the miR-106b-25 clusters (164). The miRNAs of these three clusters can be categorized
into four different miRNA families: (i) the miR-17 family which comprises miR-17, miR-20a/b,
miR-93 and miR-106a/b, (ii) the miR-18 family with miR-18a/b, (iii) the miR-19 family which
consists of miR-19a and miR-19b-1 and -2 and (iv) the miR-92 family consisting of miR-25,
miR-92a-1 and -2 and miR-363 (88). The human miR-17-92 cluster can be found at
chromosome 13q31.3 (NG_032702.1) and was identified in 2004 as a novel gene, named
chromosome 13 open reading frame 25 (C13orf25) (Figure 7a) which was amplified in
hematopoietic malignancies (96) and solid tumors (165). The genomic locus consists of four
exons and three introns from which a 5058 bp long non-protein coding RNA transcript
(AB176708.1) is generated (96). The coding sequence of miR-17-92 is located in intron 3
with a primary transcript of about 1 kb in length (164). The sequence upstream of the
cluster’s coding sequence can be subdivided into AT- and GC-rich parts. The host gene
promoter is controlled by the E2F transcription factor 1-3 (E2F1-3) with E2F3 being the main
E2F variant associated with the host gene promoter (166). The core promoter region is found
in exon 1 in the GC-rich part about 3.4 kb apart from the miR-17-92 coding sequence, where
a consensus initiator sequence is located downstream of a non-consensus TATA-box (167),
(166). However, in line with the findings that almost a third of intronic miRNAs show
transcriptional activity, which is independent of a host gene promoter (168), O’Donnell et al.
found highly conserved enhancer box elements (E-boxes) close to the AT-rich sequence
region (91). Additionally at this chromosomal region an intronic TSS was predicted to be
localized approximately 200 bp downstream of E-box 3 (169). These E-box elements are
consensus sequences recognized by the transcriptional activator MYC (91). The results
suggest that transcriptional activity of the miR-17-92 cluster may be generated by two
independent TSSs (91), (169).

Introduction
17
Figure 7: Regulatory network of the human miR-17-92 cluster. (a) Genomic organization of human miR-17-92 on C13orf25. The locus consists of four exons (orange boxes) and the sequence upstream of the cluster can be subdivided in an AT-rich and GC-rich part; the host gene promoter controlled by E2F3 (167) (light green box) is located at the beginning of the GC-rich part, while the functional MYC site E3 (91), (169) (green oval) is close to the intronic AT-rich region. Two transcription start sites (TSS) are indicated (black and dashed arrow) (b) Pleiotropic functions of miR-17-92 achieved by repressing specific targets (light yellow ovals). Transcription of miR-17-92 may be generated by MYC and/or E2F1/2/3 (green and light green boxes) which trans-activate each other. Depending on the physiological context and cell type, miR-17-92 can promote proliferation, increase angiogenesis and inhibit apoptosis (following Olive, Jiang & He, 2010 (88)).
The oncogenic activity of the miR-17-92 cluster was first seen in an in vivo mouse
B-cell lymphoma model in which the cluster cooperated with the oncogene MYC (87) and
accelerated tumorigenesis (Figure 7b). MiR-19 was identified as the key oncogenic miRNA of
the cluster targeting the tumor suppressor protein PTEN (170), (171), thus mediating
repression of apoptosis and promoting tumorigenesis of MYC induced lymphomas. To date
overexpression of the miR-17-92 cluster has been intensely investigated in human cell
culture and several animal models to elucidate its pleiotropic functions during normal
development and/or malignant transformation (88). Thus the pleiotropic functions implicate
that the role of miR-17-92 is manifold and arise from post-transcriptional regulation of several
targets which are part of different physiological contexts, placing miR-17-92 in between a
complex regulatory signaling network (Figure 7b). One important auto-regulatory feedback
loop has been reported between E2F factors, MYC and miR-17-92 expression. In this
network, the miRNAs miR-17 and miR-20a target the pro-apoptotic protein E2F1 and
maintain a homeostasis towards proliferative signals (167). Other targets of miR-17-92 are

Introduction
18
the pro-apoptotic protein BCL2-like 11 apoptosis facilitator (BCL2L11) and the tumor
suppressor PTEN or the cyclin-dependent kinase inhibitor P21. Repression of these specific
targets promotes proliferation and shows less activation-induced cell death in transgenic
mice (172), (173), (174). The angiogenic activity of the miR-17-92 cluster is mediated by
miR-18 and miR-19 which repress the thrombospondin 1 (TSP1) protein and the
connective tissue growth factor (CTGF) (175). However, understanding the functions of
miR-17-92 may help to explore the role of miRNAs in the network of cancer and offers the
possibility to investigate clinical applications of anti-miRNA treatments.

19
1.5 Goal of the project
MiRNAs play crucial roles in important cellular processes such as development, proliferation,
differentiation, the stress response and apoptosis (39). They can be used either as
diagnostic and prognostic biomarkers (77) or as novel anti-cancer strategies to treat
malignant forms of tumors (100).
Figure 8: Goal of the project. (1) The proto-oncogene PIM1 as a target of miR-33a in vitro and in vivo. (2) Establishment of novel miRNA inhibitors, called LNA antiseeds, to scrutinize inhibition of oncogenic miRNAs of the miR-17-92 cluster on the tumor suppressor P21. (3) Investigation of the transcriptional regulation of the human miR-17-92 cluster by E2F3 and MYC considering a putative MYC/PIM1 synergism.
In the first project, the proto-oncogene PIM1 was established as target for miRNAs. PIM1
was chosen because the constitutively active serine/threonine kinase PIM1 is overexpressed
in different cancer types and as a consequence leads to severe forms of cancer associated
with poor prognosis (133). The proto-oncogene PIM1 has been described as an important
cellular target for cancer therapies and to date there has been extensive research into
designing novel and specific inhibitors against PIM kinases. To selectively reduce cellular
levels of PIM1 protein in vitro and in vivo, one focus of the project was to use RNAi to target
PIM1 (Figure 8, 1) which can be mediated either by small interfering RNA (siRNA) or
miR-33a. On condition that PIM1 is a target of miR-33a in vitro in different cell lines, this
tumor-suppressive acting miRNA should be established in miRNA replacement therapy in
subcutaneous colon carcinoma mouse models. Delivery of miR-33a would be mediated by a
branched cationic polyethylenimine (PEI F25 LMW) which in previous studies has been used
as powerful delivery agent for siRNAs (176).
A second project was to develop novel miRNA inhibitors for the use in miRNA-based
therapies (Figure 8, 2). Because overexpression of oncogenic miRNAs is associated with the
Goal of the project
20
development of cancer due to a reprogramming of the cell’s homeostasis, we designed small
LNA-modified oligonucleotides harboring a natural phosphodiester backbone, termed
LNA antiseeds, to block and inhibit oncogenic miRNAs. Delivery of these molecules should
be performed with this polyethylenimine PEI F25 LMW and thus complex formation and
delivery of the nanoparticles has to be established in vitro, initially.
The third project involved the investigation of the transcriptional regulation of the human
miRNA cluster miR-17-92 (Figure 8, 3). MiR-17-92 is one of the best characterized
polycistronic miRNA clusters in humans associated with oncogenic activity. Unfortunately
little is known about its transcriptional regulation. The cluster is placed between a complex
regulatory network of the oncogene MYC and E2F transcription factors (91), (167). Thus
deletion analyses of the AT-rich promoter region should reveal MYC dependence on
transcriptional activation. Furthermore colocalization of the proto-oncogene PIM1 and its
phosphorylation target HP1G were investigated. Analysis of the pri-mir-17-92 expression
levels after RNAi-mediated silencing of MYC, E2F3 and PIM1 proteins should provide
presumption that transcriptional regulation of the miR-17-92 cluster partially is
PIM1-dependent.

21
2 Materials and Methods
2.1 Buffers, Media and Solutions
Individual conditions for buffers, media and solutions which were used throughout the
complete laboratory work are figured out in the single chapters to facilitate their correlation to
the different disciplines. All buffers were generated with double-distilled water (ddH2O) and
sterile filtered if not indicated otherwise. In case of preparing large amounts of media or
solutions they were formulated with demineralized water and autoclaved 121 °C for 20 min
using 1 bar pressure.
2.2 Oligonucleotides
2.2.1 DNA oligonucleotides
All DNA primers used throughout this thesis were purchased from Metabion (Martinsried,
Germany) and ordered as 100 µM stock solutions. For longer time storage the primers were
kept at 4 °C in a refrigerator. All DNA primers were used for PCR reactions and designed
using the software tool Oligo Analyzer 3.1 (Integrated DNA Technologies, Munich,
Germany).
2.2.1.1 Primers for cloning
Primers that were needed for cloning experiments are listed in Appendix J. They were
phosphorylated before usage (2.15.2) or were designed carrying the respective palindromic
sequence for a restriction endonuclease (2.15.4). Primers that were used for mutagenesis
PCR (2.15.8.2) have a much longer nucleotide sequence harboring point mutations in the
middle of the primer sequence.
2.2.1.2 Primers for DNA sequencing
To verify DNA sequences of generated plasmid constructs Sanger sequencing was
performed at eurofins mwgΙoperon (2.15.10) using primer sequences listed in Appendix K.
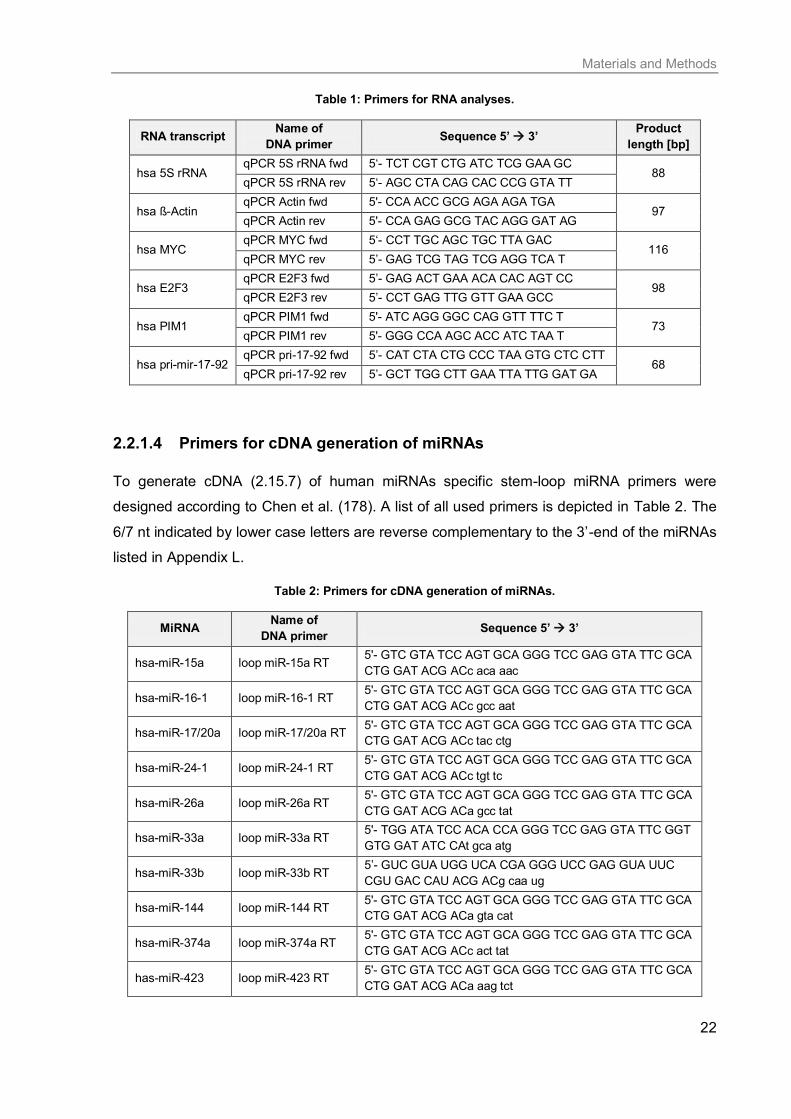
2.2.1.3 Primers for RNA analyses
Quantitative PCR reactions (2.15.8.3) of human mRNA or non-coding RNA levels were done
using primer sequences listed in Table 1.
Materials and Methods
22
Table 1: Primers for RNA analyses.
RNA transcript Name of
DNA primer Sequence 5’ 3’
Product
length [bp]
hsa 5S rRNA qPCR 5S rRNA fwd 5‘- TCT CGT CTG ATC TCG GAA GC
88 qPCR 5S rRNA rev 5‘- AGC CTA CAG CAC CCG GTA TT
hsa ß-Actin qPCR Actin fwd 5'- CCA ACC GCG AGA AGA TGA
97 qPCR Actin rev 5'- CCA GAG GCG TAC AGG GAT AG
hsa MYC qPCR MYC fwd 5‘- CCT TGC AGC TGC TTA GAC
116 qPCR MYC rev 5’- GAG TCG TAG TCG AGG TCA T
hsa E2F3 qPCR E2F3 fwd 5’- GAG ACT GAA ACA CAC AGT CC
98 qPCR E2F3 rev 5’- CCT GAG TTG GTT GAA GCC
hsa PIM1 qPCR PIM1 fwd 5'- ATC AGG GGC CAG GTT TTC T
73 qPCR PIM1 rev 5'- GGG CCA AGC ACC ATC TAA T
hsa pri-mir-17-92 qPCR pri-17-92 fwd 5’- CAT CTA CTG CCC TAA GTG CTC CTT
68 qPCR pri-17-92 rev 5’- GCT TGG CTT GAA TTA TTG GAT GA
2.2.1.4 Primers for cDNA generation of miRNAs
To generate cDNA (2.15.7) of human miRNAs specific stem-loop miRNA primers were
designed according to Chen et al. (178). A list of all used primers is depicted in Table 2. The
6/7 nt indicated by lower case letters are reverse complementary to the 3’-end of the miRNAs
listed in Appendix L.
Table 2: Primers for cDNA generation of miRNAs.
MiRNA Name of
DNA primer Sequence 5’ 3’
hsa-miR-15a loop miR-15a RT 5'- GTC GTA TCC AGT GCA GGG TCC GAG GTA TTC GCA
CTG GAT ACG ACc aca aac
hsa-miR-16-1 loop miR-16-1 RT 5'- GTC GTA TCC AGT GCA GGG TCC GAG GTA TTC GCA
CTG GAT ACG ACc gcc aat
hsa-miR-17/20a loop miR-17/20a RT 5'- GTC GTA TCC AGT GCA GGG TCC GAG GTA TTC GCA
CTG GAT ACG ACc tac ctg
hsa-miR-24-1 loop miR-24-1 RT 5'- GTC GTA TCC AGT GCA GGG TCC GAG GTA TTC GCA
CTG GAT ACG ACc tgt tc
hsa-miR-26a loop miR-26a RT 5'- GTC GTA TCC AGT GCA GGG TCC GAG GTA TTC GCA
CTG GAT ACG ACa gcc tat
hsa-miR-33a loop miR-33a RT 5'- TGG ATA TCC ACA CCA GGG TCC GAG GTA TTC GGT
GTG GAT ATC CAt gca atg
hsa-miR-33b loop miR-33b RT 5’- GUC GUA UGG UCA CGA GGG UCC GAG GUA UUC
CGU GAC CAU ACG ACg caa ug
hsa-miR-144 loop miR-144 RT 5'- GTC GTA TCC AGT GCA GGG TCC GAG GTA TTC GCA
CTG GAT ACG ACa gta cat
hsa-miR-374a loop miR-374a RT 5'- GTC GTA TCC AGT GCA GGG TCC GAG GTA TTC GCA
CTG GAT ACG ACc act tat
has-miR-423 loop miR-423 RT 5'- GTC GTA TCC AGT GCA GGG TCC GAG GTA TTC GCA
CTG GAT ACG ACa aag tct

Materials and Methods
23
2.2.1.5 Primers for qPCR of miRNAs
Quantitative PCR reactions (2.15.8.3) were conducted to determine human miRNA levels in
several cell lines. The primers are based on the human miRNA sequences which are listed in
Appendix L. To obtain roughly the same melting temperature of the individual primers in
subsequent qPCR reactions, a 5’-overhang was designed that is indicated by lower case
letters in Table 3.
Table 3: Primers for qPCR of miRNAs.
MiRNA Name of DNA primer Sequence 5’ 3’ Product
length [bp]
hsa-miR-15a miR-15a QT forward 5'- cgc gcT AGC AGC ACA TAA TG 61
hsa-miR-16-1 miR-16-1 QT forward 5'- cgc gcT AGC AGC ACG TAA AT 61
hsa-miR-17 miR-17 QT forward 5'- cgc gcC AAA GTG CTT ACA GTG 62
hsa-miR-20a miR-20a QT forward 5'- gcc gcg cTA AAG TGC TTA TAG TG 64
hsa-miR-24-1 miR-24-1 QT forward 5'- cgc gcT GGCTCA GTT CAG CAG 62
hsa-miR-26a miR-26a-1 QT forward 5'- cgc gcT TCA AGT AAT CCA GG 61
hsa-miR-33a miR-33a QT forward 5'- cgc gcG TGC ATT GTA GTT G 60
hsa-miR-33b miR-33b QT forward 5’- cgc gcG TGC ATT GCT GTT G 60
hsa-miR-144 miR-144 QT forward 5'- gcg cgc gcT ACA GTA TAG ATG 62
hsa-miR-374a miR-374a QT forward 5'- gcc gcg cTT ATA ATA CAA CCT G 63
has-miR-423 miR-423 QT forward 5'- cTG AGG GGC AGA GAG CG 58
reverse primer miR-33a 5'- CAC CAG GGT CCG AGG T -
reverse primer miR-33b 5‘- CAC GAG GGT CCG AGG TA -
uni reverse primer QT 5'- GTG CAG GGT CCG AGG T -
2.2.2 RNA oligonucleotides
RNA oligonucleotides used in this thesis were purchased from different companies as
indicated in the following chapters. They were ordered lyophilized and diluted in
double-distilled water if not indicated otherwise. For long time storage RNA oligonucleotides
were kept at -20 to -80 °C.
2.2.2.1 SiRNAs
Used siRNAs were purchased from Metabion (Martinsried, Germany), Ambion® Life
Technologies (Darmstadt, Germany) or Dharmacon Thermo Fisher Scienific (Lafayette, CO,
USA) and listed in Table 4. All siRNA oligonucleotides were designed as double-stranded
DICER1 processing products (sense and antisense orientation) with an overhang of two
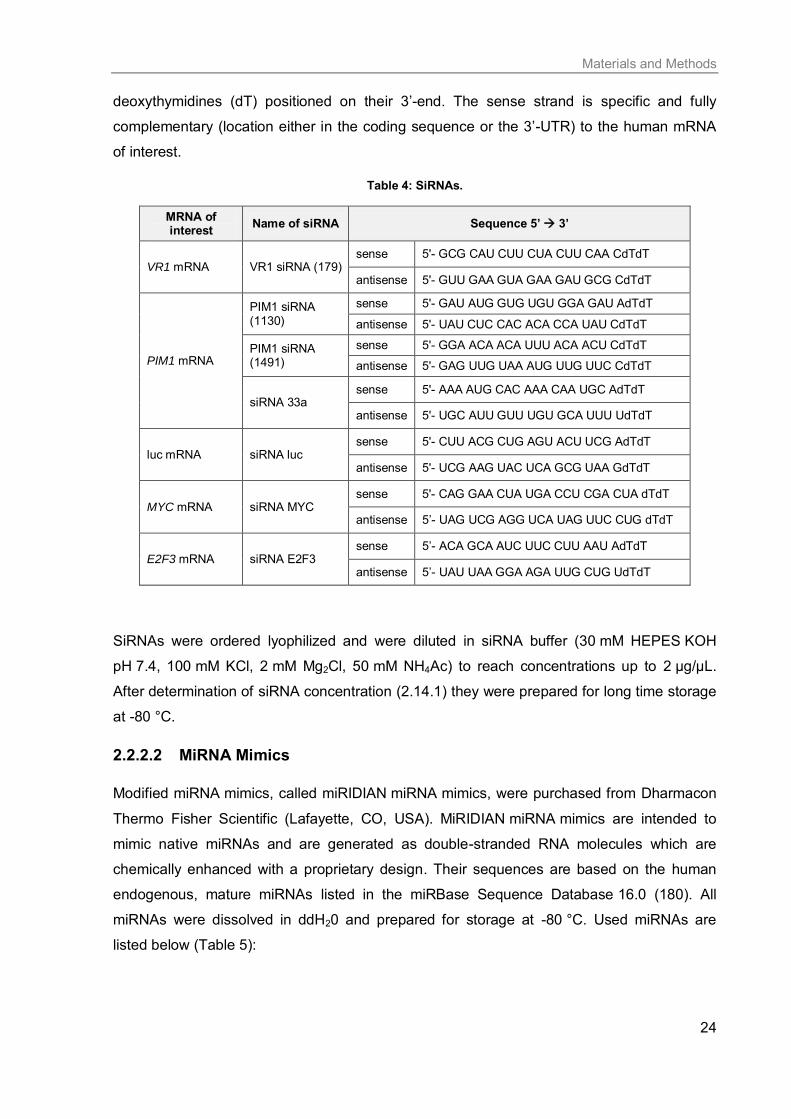
Materials and Methods
24
deoxythymidines (dT) positioned on their 3’-end. The sense strand is specific and fully
complementary (location either in the coding sequence or the 3’-UTR) to the human mRNA
of interest.
Table 4: SiRNAs.
MRNA of interest
Name of siRNA Sequence 5’ 3’
VR1 mRNA VR1 siRNA (179) sense 5'- GCG CAU CUU CUA CUU CAA CdTdT
antisense 5'- GUU GAA GUA GAA GAU GCG CdTdT
PIM1 mRNA
PIM1 siRNA (1130)
sense 5'- GAU AUG GUG UGU GGA GAU AdTdT
antisense 5'- UAU CUC CAC ACA CCA UAU CdTdT
PIM1 siRNA (1491)
sense 5'- GGA ACA ACA UUU ACA ACU CdTdT
antisense 5'- GAG UUG UAA AUG UUG UUC CdTdT
siRNA 33a sense 5'- AAA AUG CAC AAA CAA UGC AdTdT
antisense 5'- UGC AUU GUU UGU GCA UUU UdTdT
luc mRNA siRNA luc sense 5'- CUU ACG CUG AGU ACU UCG AdTdT
antisense 5'- UCG AAG UAC UCA GCG UAA GdTdT
MYC mRNA siRNA MYC sense 5'- CAG GAA CUA UGA CCU CGA CUA dTdT
antisense 5’- UAG UCG AGG UCA UAG UUC CUG dTdT
E2F3 mRNA siRNA E2F3 sense 5’- ACA GCA AUC UUC CUU AAU AdTdT
antisense 5’- UAU UAA GGA AGA UUG CUG UdTdT
SiRNAs were ordered lyophilized and were diluted in siRNA buffer (30 mM HEPES KOH
pH 7.4, 100 mM KCl, 2 mM Mg2Cl, 50 mM NH4Ac) to reach concentrations up to 2 µg/µL.
After determination of siRNA concentration (2.14.1) they were prepared for long time storage
at -80 °C.
2.2.2.2 MiRNA Mimics
Modified miRNA mimics, called miRIDIAN miRNA mimics, were purchased from Dharmacon
Thermo Fisher Scientific (Lafayette, CO, USA). MiRIDIAN miRNA mimics are intended to
mimic native miRNAs and are generated as double-stranded RNA molecules which are
chemically enhanced with a proprietary design. Their sequences are based on the human
endogenous, mature miRNAs listed in the miRBase Sequence Database 16.0 (180). All
miRNAs were dissolved in ddH20 and prepared for storage at -80 °C. Used miRNAs are
listed below (Table 5):

Materials and Methods
25
Table 5: MiRNA mimics.
MiRNA of
interest Order Number Sequence 5’ 3’
hsa-miR-33a (C-300509-07) 5'- GUG CAU UGU AGU UGC AUU GCA
hsa-miR-33b (C-300958-03) 5'- GUG CAU UGC UGU UGC AUU GC
hsa-miR-15a (C-300482-03) 5'- UAG CAG CAC AUA AUG GUU UGU G
hsa-miR-16-1 (C-300483-03) 5'- UAG CAG CAC GUA AAU AUU GGC G
Negative
control mimic #1 (CN-001000-01) no sequence available
hsa-miR-33a - leader 5'- GUG CAU UGU AGU UGC AUU GCA
passenger 5’- TGC AAT GCA ACT ACA ATG CAC
hsa-miR-33b - leader 5'- GUG CAU UGC UGU UGC AUU GC
passenger 5'- CAG UGC CUC GGC AGU GCA GCC C
In case of hsa-miR-33a and -33b the DICER1 processing product of pre-miR-33a and
pre-miR-33b as published in the miRBase Sequence Database 14.0 (2.18.6) was additionally
purchased by eurofins mwg|operon (Table 5), but lacking the 5’-terminal phosphate. The
leader and passenger strand were dissolved in siRNA annealing buffer (30 mM HEPES KOH
pH 7.4, 100 mM KCl, 2 mM Mg2Cl, 50 mM NH4Ac) respectively. After measuring RNA
concentration (2.14.1) equimolar amounts of each strand were mixed and heated to 95 °C.
Annealing of both strands was done for 1 h at 37 °C to receive the double-stranded DICER1
processed miRNA product.
2.2.2.3 MiRNA hairpin inhibitors
MiRNA hairpin inhibitors, called miRIDIAN hairpin inhibitors, were purchased from
Dharmacon Thermo Scientific (Lafayette, CO, USA). MiRIDIAN hairpin inhibitors are
chemically enhanced RNA molecules that are designed to inhibit endogenous miRNA
functions. Thus their purpose is to discover and investigate natural functions of miRNAs
(181). Their sequences are based on the human endogenous mature miRNAs listed in the
miRBase Sequence Database 16.0 (180). All miRIDIAN hairpin inhibitors were dissolved in
double-distilled water and prepared for long-term storage at -80 °C. Used
miRIDIAN hairpin inhibitors are depicted in Table 6:
Table 6: MiRIDIAN hairpin inhibitors.
MiRNA of
interest Order number Sequence 5’ 3’
hsa-let-7a (IH-300473-07) 5'- UGA GGU AGU AGG UUG UAU AGU U
hsa-miR-17 (IH-300485-06) 5'- CAA AGU GCU UAC AGU GCA GGU AG
hsa-miR-20a (IH-300491-05) 5'- UAA AGU GCU UAU AGU GCA GGU AG
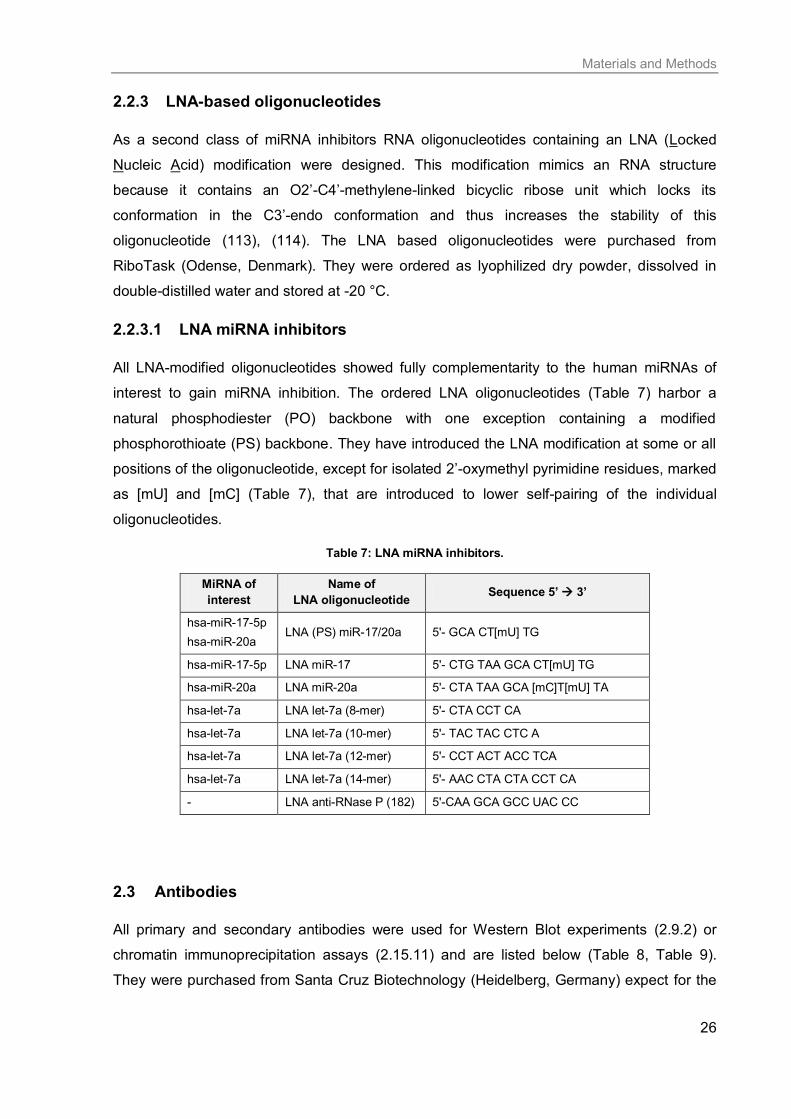
Materials and Methods
26
2.2.3 LNA-based oligonucleotides
As a second class of miRNA inhibitors RNA oligonucleotides containing an LNA (Locked
Nucleic Acid) modification were designed. This modification mimics an RNA structure
because it contains an O2’-C4’-methylene-linked bicyclic ribose unit which locks its
conformation in the C3’-endo conformation and thus increases the stability of this
oligonucleotide (113), (114). The LNA based oligonucleotides were purchased from
RiboTask (Odense, Denmark). They were ordered as lyophilized dry powder, dissolved in
double-distilled water and stored at -20 °C.
2.2.3.1 LNA miRNA inhibitors
All LNA-modified oligonucleotides showed fully complementarity to the human miRNAs of
interest to gain miRNA inhibition. The ordered LNA oligonucleotides (Table 7) harbor a
natural phosphodiester (PO) backbone with one exception containing a modified
phosphorothioate (PS) backbone. They have introduced the LNA modification at some or all
positions of the oligonucleotide, except for isolated 2’-oxymethyl pyrimidine residues, marked
as [mU] and [mC] (Table 7), that are introduced to lower self-pairing of the individual
oligonucleotides.
Table 7: LNA miRNA inhibitors.
MiRNA of
interest
Name of
LNA oligonucleotide Sequence 5’ 3’
hsa-miR-17-5p
hsa-miR-20a LNA (PS) miR-17/20a 5'- GCA CT[mU] TG
hsa-miR-17-5p LNA miR-17 5'- CTG TAA GCA CT[mU] TG
hsa-miR-20a LNA miR-20a 5'- CTA TAA GCA [mC]T[mU] TA
hsa-let-7a LNA let-7a (8-mer) 5'- CTA CCT CA
hsa-let-7a LNA let-7a (10-mer) 5'- TAC TAC CTC A
hsa-let-7a LNA let-7a (12-mer) 5'- CCT ACT ACC TCA
hsa-let-7a LNA let-7a (14-mer) 5'- AAC CTA CTA CCT CA
- LNA anti-RNase P (182) 5'-CAA GCA GCC UAC CC
2.3 Antibodies
All primary and secondary antibodies were used for Western Blot experiments (2.9.2) or
chromatin immunoprecipitation assays (2.15.11) and are listed below (Table 8, Table 9).
They were purchased from Santa Cruz Biotechnology (Heidelberg, Germany) expect for the
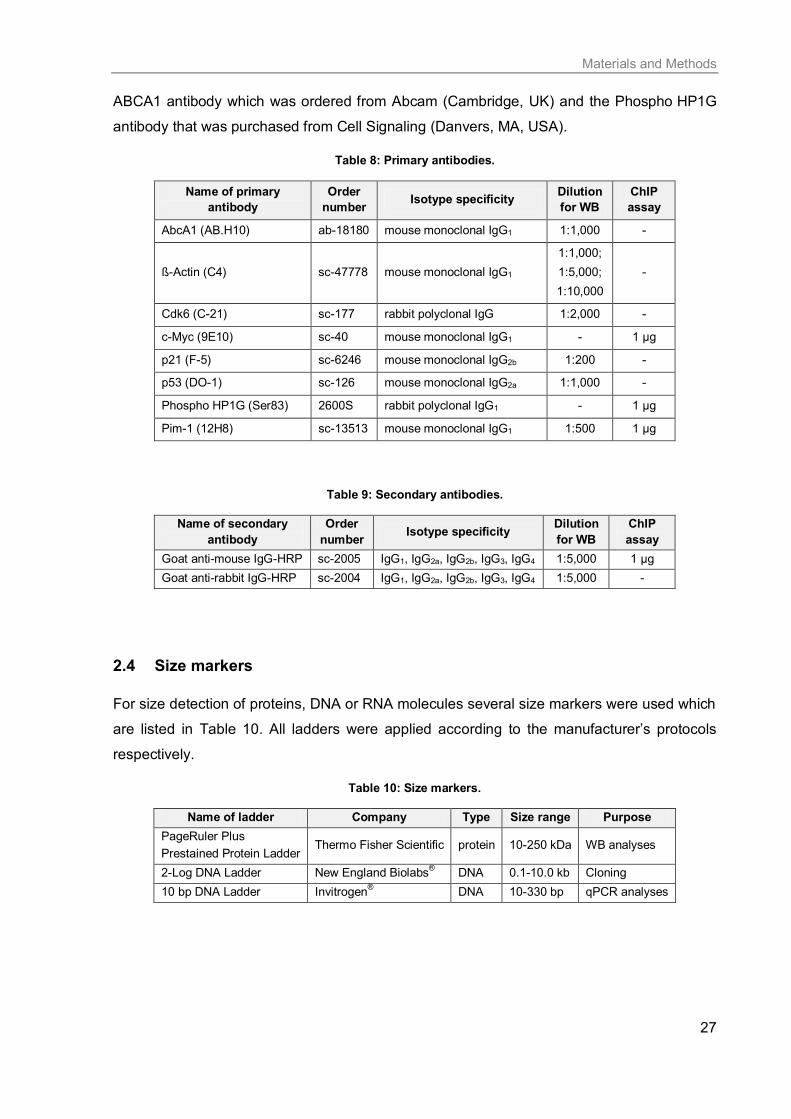
Materials and Methods
27
ABCA1 antibody which was ordered from Abcam (Cambridge, UK) and the Phospho HP1G
antibody that was purchased from Cell Signaling (Danvers, MA, USA).
Table 8: Primary antibodies.
Name of primary
antibody
Order
number Isotype specificity
Dilution
for WB
ChIP
assay
AbcA1 (AB.H10) ab-18180 mouse monoclonal IgG1 1:1,000 -
ß-Actin (C4) sc-47778 mouse monoclonal IgG1
1:1,000;
1:5,000;
1:10,000
-
Cdk6 (C-21) sc-177 rabbit polyclonal IgG 1:2,000 -
c-Myc (9E10) sc-40 mouse monoclonal IgG1 - 1 µg
p21 (F-5) sc-6246 mouse monoclonal IgG2b 1:200 -
p53 (DO-1) sc-126 mouse monoclonal IgG2a 1:1,000 -
Phospho HP1G (Ser83) 2600S rabbit polyclonal IgG1 - 1 µg
Pim-1 (12H8) sc-13513 mouse monoclonal IgG1 1:500 1 µg
Table 9: Secondary antibodies.
Name of secondary
antibody
Order
number Isotype specificity
Dilution
for WB
ChIP
assay
Goat anti-mouse IgG-HRP sc-2005 IgG1, IgG2a, IgG2b, IgG3, IgG4 1:5,000 1 µg
Goat anti-rabbit IgG-HRP sc-2004 IgG1, IgG2a, IgG2b, IgG3, IgG4 1:5,000 -
2.4 Size markers
For size detection of proteins, DNA or RNA molecules several size markers were used which
are listed in Table 10. All ladders were applied according to the manufacturer’s protocols
respectively.
Table 10: Size markers.
Name of ladder Company Type Size range Purpose
PageRuler Plus
Prestained Protein Ladder Thermo Fisher Scientific protein 10-250 kDa WB analyses
2-Log DNA Ladder New England Biolabs® DNA 0.1-10.0 kb Cloning
10 bp DNA Ladder Invitrogen® DNA 10-330 bp qPCR analyses

Materials and Methods
28
2.5 Bacterial cell culture
Microbial cell culture is a standard method in molecular biology. It was used for cloning
experiments to multiply bacteria containing different plasmids of interest. All media, buffer,
flasks or pipets needed for bacterial cell culture were autoclaved for 20 min at 121 °C and
1 bar pressure.
2.5.1 Bacterial strains
For all cloning experiments the bacterial strain E. coli DH5α (genotype: supE44 hsdR17
recA1 endA1 gyrA96 thi-1 relA1, (183)) was used. This strain has an ampicillin resistance
gene to select clones after transformation of plasmids.
2.5.2 Bacterial growth on agar plates
To grow bacterial cells on agar plates, LB medium (Lysogeny Broth, (184); 5 g/L yeast
extract, 10 g/L peptone, 10 g/L NaCl) was supplemented with agar (15 g/L). The agar plates
were stored at 4 °C for up to one month. To amplify E. coli DH5α strains, ampicillin was
added into the agar culture medium with a final concentration of 100 µg/mL and E. coli
strains of interest were spread out on agar plates. After overnight incubation at 37 °C one
single colony was used to inoculate liquid bacterial growth medium.
2.5.3 Bacterial cell culture in liquid medium
E. coli DH5α strains were cultivated in LB medium (5 g/L yeast extract, 10 g/L peptone,
10 g/L NaCl) supplemented with 100 µg/mL ampicillin at 37 °C from 8 h till overnight. For
long time storage of designed constructs and strains, the cultures were diluted 1:1 with sterile
98 % glycerol, frozen with liquid nitrogen and stored at -80 °C. In general grown bacterial cell
cultures were used for plasmid preparation (2.15.1).
2.5.4 Preparation of chemically competent E. coli DH5α cells
To prepare chemically competent E. coli DH5α cells, 150 mL of LB medium were
pre-warmed and inoculated with 3 mL of an overnight culture. Cells were grown at 37 °C and
shaken at 200 rpm in an incubator (GFL 3033) till an optical density OD576 of 0.6 was
reached. After pelleting the cells at 5000 rpm and 4 °C for 7 min, cells were carefully
resuspended in 15 mL of pre-cooled TFB-1 solution (10 mM MOPS pH 7.0, 10 mM RbCl)
and were pelleted again. Afterwards cell pellet was resuspended in 6 mL of pre-cooled
TFB-3 solution (100 mM MOPS pH 6.5, 50 mM CaCl2, 10 mM KCl, 15 % glycerin) and 50 µL

Materials and Methods
29
aliquots were frozen in liquid nitrogen before chemically competent E. coli DH5α cells were
stored at -80 °C.
2.5.5 Transformation of bacterial cells
Transformation of bacterial cells was discovered in 1928 by the bacteriologist Griffith (185)
and is a standard laboratory procedure in molecular biology. Transformation allows uptake,
incorporation and expression of genetic material e.g. plasmid DNA into bacterial cells. First of
all chemically competent E. coli DH5α cells were thawed on ice. After addition of negatively
charged plasmid DNA (up to 1 µg, 2.15.1) or ligation reaction (up to 20 µL, 0), cells were
incubated on ice for 30 min. DNA uptake occurred after pre-cooled cells were heat-shocked
at 42 °C for 45 sec. After incubation of the mixture on ice for 2 min, 300 µL of pre-warmed LB
medium without antibiotic was added. Cells were shaken at 600 g and 37 °C for 30-60 min.
Subsequently the transformation reaction was spread out onto agar plates and incubated as
described above (2.5.2).
2.6 Eukaryotic cell culture
In mammalian cell culture immortalized cell lines of interest can be subcultured under sterile
conditions in a laminar air flow (Thermo Scientific, Schwerte, Germany) and cultivated in a
humidified atmosphere (NuAire, Plymouth, USA) at 37 °C and 5 % CO2. Cell lines derive
from isolated tumors of different organs or tissues. Cultivation of these cells depends on their
method to grow. Suspension cell lines are easily passaged with a small amount of culture
diluted with media, whereas adherent cell cultures have to be detached before only a small
proportion can be seeded into new culture flasks. To allow optimal growth conditions, media
for cultivation of eukaryotic cells have to be supplemented with several nutrients including
Fetal Calf Serum (FCS).
2.6.1 Eukaryotic cell culture of suspension cell lines
2.6.1.1 K562
The chronic myelogenous leukemia cell line K562 was derived from the pleural effusion of a
53-year old female with terminal blast crises by Lozzio and Lozzio (186). This cell line grows
in suspension and is cultured in RPMI 1640 (Roswell Park Memorial Institute) medium
containing 10 % FCS. In general cells were subcultured every 2-3 days with a cell density of
0.25-1 * 106 cells/mL and were incubated in a humidified atmosphere (37 °C, 5 % CO2).

Materials and Methods
30
2.6.2 Eukaryotic cell culture of adherent cell lines
2.6.2.1 HeLa
The adherent cell line HeLa was established in 1951 as the first immortal cell line and
derived from cervical cancer cells of a 51-year-old female named Henrietta Lacks (187).
Cells were cultivated in a humidified atmosphere (37 °C, 5 % CO2) in IMDM medium
(Iscove’s Modified Dulbecco Medium) supplemented with 10 % FCS. HeLa cells were
subcultured twice a week by rinsing the medium, washing cells with PBS and detaching
adherent cells with 2 mL of trypsin/EDTA solution (0,25 % (w/v) trypsin, 0,53 mM EDTA). The
cell suspension was filled up with 8 mL of IMDM medium and cells were seeded in a
subculture ratio of 1:10 or 1:20 in fresh culture vessels.
2.6.2.2 LS174T
LS174T cells were received as a trypsinized variant of the colorectal adenocarcinoma cell
line LS180 which derived from a 58-year-old female patient (188). Multiplication of the cells
was done according to the procedure for HeLa cells, but LS174T cells were seeded into
culture flasks in a ratio of 1:5.
2.6.2.3 Skov-3
The ovarian carcinoma cell line Skov-3 was isolated from a 64-year-old Caucasian female
(189). Cells were cultured in the same manner as described aforementioned. A ratio of 1:3 to
1:5 was used for subcultures.
2.6.2.4 HCT 116
HCT 116 cells, generated from an adult male gender, derive from a colorectal carcinoma cell
line growing as adherent cells. Cells were subcultured as described above and were seeded
in a ratio of 1:5 to 1:8 twice a week.
2.7 Experimental working with animals
For this thesis subcutaneous colon carcinoma xenograft mouse experiments were performed
to establish the first miRNA replacement therapy (28) based on the cationic polyethylenimine
PEI F25 LMW. All studies including keeping, treatment and therapy establishment of mice
were done in the working group of Prof. Dr. Achim Aigner.

Materials and Methods
31
2.7.1 Athymic nude mice
Athymic nude mice (Hsd:Athymic Nude-Foxn1nu, 6-8 weeks old) were obtained from Harlan
Winkelmann (Borchen, Germany) and were kept in tight stages at 23 °C in a humidified
atmosphere with standard rodent chow, water available ad libitum and a 12 hour light/dark
cycle. Animal studies were done according to the national regulations and were approved by
the Regierungspräsidum Gießen (Germany).
2.7.2 Subcutaneous xenograft colon carcinoma tumor models
To generate subcutaneous xenograft mouse models, a total of 1.5 * 106 LS174T or HCT116
cells in a total volume of 150 µL PBS were s.c.-injected into both flanks of the mice. After
establishment of solid tumors and randomizing animals in specific treatment groups, the
treatment with PEI/miRNA or PEI/siRNA complexes was done according to the information
given at Ibrahim et al. (28). Tumor volumes were monitored during the experiment that was
finished by scarification of the mice. Afterwards tumor tissues were prepared for selected
analyses.
2.7.3 MiRNA tissue uptake in vivo
Radioactive determination of miRNA tissue distribution was done with [32P]-end labeled
miRNAs. In mice, subcutaneous tumors were initiated until a size of approximately 8 mm in
diameter was reached (2.7.2). PEI F25 LMW complex formation was performed using
[32P]-end labeled miRNAs of interest (2.8.2.2). Complexes were introduced into the mice via
i.p.- or i.v.-injection and 4 h later they were sacrificed. To quantitate tissue distribution of the
miRNAs, total RNA was isolated from different tissues (more information available at Ibrahim
et al. (28)).
2.8 Transfection of mammalian cell lines
Transfection of mammalian cell lines is a process to introduce nucleic acids such as DNA or
RNA molecules into cells. In general the term transfection is used for non-viral targeting of
eukaryotic cells where transient pores in the cell membrane allow uptake of the material. This
transient pores can be generated by using several techniques. For electroporation the cells
are exposed to a short single electric impulse which transiently increases the permeability of
the cell membrane. A very efficient transfection method is liposome delivery via cationic
polymers such as polyethylenimine. The polycation interacts with the negatively charged
nucleic acids and thus forms liposomes which are taken up via endocytosis.
Materials and Methods
32
2.8.1 Transfection procedure of suspension cell lines
For transfection of the suspension cell line K562 with plasmid DNA, siRNA, miRNA mimics or
LNA-modified antisense oligonucleotides cells were harvested for 5 min at 390 g. Afterwards
cells were washed twice with 10 mL of RPMI 1640 without FCS. 2 * 106 cells, in a total
volume of 100 µL medium, were electroporated in a 4 mm cuvette with a single pulse for
10 ms at 330 V using a Bio-Rad Gene Pulser Xcell (Bio-Rad, Munich, Germany). Per 1 * 106
cells 5 µg of plasmid DNA or 1 µg of siRNA, miRNA mimic or LNA-modified
antisense oligonucleotide was used. After electroporation cells were seeded into 12-well cell
culture plates containing 1.5 mL RPMI 1640 supplemented with 10 % FCS. Cells were
incubated for up to 120 h in a humidified atmosphere (37 °C, 5 % CO2). Subsequently cells
were prepared either for Western Blot analysis, WST-1 assay, luciferase assay or total RNA
extraction (2.9.2, 2.10.2, 2.9.5, 2.16.2).
2.8.2 Transfection procedure of adherent cell lines
Transfection of adherent cell lines was done by liposome delivery using either
LipofectamineTM 2000 (Life Technologies Invitrogen, Darmstadt, Germany) or the cationic
polymer PolyEthyleneImine F25 Low Molecular Weight (PEI F25 LMW; Sigma Aldrich,
Taufkirchen, Germany) prepared and purified as described at Werth et al. (190).
2.8.2.1 Transfection with LipofectamineTM 2000
The adherent cell lines HeLa, LS174T and Skov-3 were transfected with
LipofectamineTM 2000 (Life Technologies Invitrogen, Darmstadt, Germany) according to the
manufacturer’s protocol.
8 * 104 HeLa cells were seeded in a 24-well plate the day before transfection. Transfection
procedure was proceeded in 400 µL IMDM medium without FCS. 0.5 µg of individual
pGL3 reporter construct was diluted in 50 µL of Optimem I (Life Technologies Invitrogen,
Darmstadt, Germany) and for co-transfection mixed with the respective amount of
LNA antiseed, LNA control, siRNA, miRNA mimic or miRNA control. 1.5 µL of
LipofectamineTM 2000 were used per transfection and diluted in 50 µL of Optimem I. After
incubation at room temperature for 5 min both components were mixed and incubated
another 15 min. Afterwards complexes were added to the media. The medium was aspirated
4-6 h later and exchanged by IMDM supplemented with 10 % FCS. 24-96 h after transfection
cells were prepared for luciferase reporter assays, total RNA extractions, WST-1 assays or
Western Blotting experiments (2.9.5, 2.16.2, 2.10.2, 2.9.2).
Materials and Methods
33
To transfect LS174T cells, 0.5 * 106 cells were seeded in a 12-well plate one day prior
treatment. 40 pmol PIM1-specific siRNA, miRNA mimics or controls were used and mixed
with 2 µL of Lipofectamine™ 2000 according to the manufacturer’s protocol. Cells were
incubated 24-96 h in a humidified atmosphere.
For transfection of Skov-3 cells 1 * 105 cells were seeded into a 12-well plate. The day of
co-transfection 2 µL of Lipofectamine™ 2000 were mixed with 25 ng of the PIM1 cDNA
clones (2.13.1) and 20 pmol PIM1-specific siRNA or miRNA mimic according to the
manufacturer’s protocol. After incubation for 48 h in a humidified atmosphere cells were
prepared for Western Blotting experiments (2.9.2).
2.8.2.2 Transfection with PEI F25 LMW
For complexation of miRNA inhibitors with PEI F25 LMW HeLa cells were pre-transfected
with pGL3 control reporter vector DNA using LipofectamineTM 2000 as described above. After
6 h the medium was replaced by IMDM containing 10 % FCS and PEI complexes were
added. For PEI F25 LMW complexation indicated amounts of siRNA, LNA antiseeds or
miRIDIAN hairpin inhibitors were diluted in 50 µL complexation buffer (150 mM NaCl, 10 mM
HEPES pH 7.4) and equilibrated for 5 min at room temperature (RT). In general a
PEI/oligonucleotide mass ratio of 2.5:1 or 5:1 was obtained. A ratio of 5:1 resulted in a
N/P ratio of 33 which had been determined as optimal for siRNA complexation (190), (176).
The N/P ratio is based on a ratio of PEI Nitrogen per nucleic acid Phosphate. After
equilibration of PEI F25 LMW in 50 µL complexation buffer the oligonucleotide and the PEI
solution were mixed and briefly vortexed. An incubation step at room temperature for
30-60 min followed to allow the complexes to form. PEI F25 LMW complexes were added to
the cells. 48 h later cells were lyzed and prepared for reporter assay measurements (2.9.5),
determination of PEI F25 LMW complexation efficacy (2.10.2) or atomic force microscopy
(2.17).
2.9 Protein techniques
2.9.1 SDS PAGE
SDS PAGE (SodiumDodecylSulfate PolyAcrylamide Gel Electrophoresis) is a method to
separate denatured proteins according to their electrophoretic mobility. SDS functions as
detergent and binds to amino acids of linearized proteins what results in a negative charge of
the protein samples. The disc electrophoresis evolved by Ornstein and Davis (191) resulted
in an improvement concerning the sharpness of separated proteins caused by a pH shift in

Materials and Methods
34
the stacking and separating buffer conditions. To prepare 15 % SDS gels the components
depicted in Table 11 were mixed and polymerized between two glass plates.
Table 11: Composition of 15 % SDS PAGE gels.
Ingredient Separating gel Stacking gel
4x separating gel buffer
(1.5 M Tris-HCl pH 8.8, 0.6 % SDS) 4 mL -
4x stacking gel buffer
(0.5 M Tris-HCl pH 6.8, 0.6 % SDS) - 1,8 mL
acrylamide/bisacrylamide
(30 % solution) 8 mL 1 mL
APS (10 % solution) 160 µL 75 µL
TEMED 16 µL 7,5 µL
ddH20 ad 16 mL ad 7,5 mL
SDS PAGE was performed subsequent to fixation of the gel matrix. Protein samples of
interest were resuspended in 100-200 µL of lysis buffer (125 mM Tris-HCl pH 6.8, 4 % SDS,
1.4 M 2-mercaptoethanol, 0.05 % bromophenol blue) and heated to 95 °C for 5 min.
Electrophoresis was performed in a Bio-Rad Mini-PROTEAN® 3 cell mini gel system
(Bio-Rad, Munich, Germany) in 1x running buffer (192 mM glycine, 25 mM Tris-HCl, 0.01 %
SDS) for 1 h at 180 V.
2.9.2 Western Blot
The Western Blot method was devised in 1979 (192) to transfer separated proteins onto a
solid carrier like a PVDF (PolyVinyliDine Fluoride) membrane following polyacrylamide gel
electrophoresis. Immobilized proteins can be probed with specific antibodies and visualized
by chemo-luminescence or colorimetric techniques. After finishing SDS PAGE (2.9.1) the
polyacrylamide gel was incubated in transfer buffer (25 mM Tris-HCl pH 8.3, 192 mM glycine,
10 % methanol) for 30 min to fix the proteins in the gel matrix. Proteins were transferred onto
an ImmobilonTM-P PVDF membrane (Millipore, MA, USA). The membrane was activated in
methanol for 2 min before incubating for 15 min in transfer buffer. Similarly, the blotting paper
was soaked in transfer buffer. Protein transfer was done in a
Trans-Blot® SD Semi-Dry Transfer Cell (Bio-Rad, Munich, Germany) for 30 min at 10 V.
Afterwards the membrane was incubated for 2 h in 5 % milk powder in TBST (10 mM
Tris-HCl pH 7.6, 150 mM NaCl, 0.1 % Tween 20) before overnight incubation with the
primary antibody started. After three washing steps in TBST the incubation with an individual
secondary antibody followed for 1 h. The primary and secondary antibodies which were used

Materials and Methods
35
for Western Blot experiments are depicted in Table 8 and Table 9. After a final washing step
blots were incubated with Amersham ECLTM or ECLplusTM Western Blotting Detection
Reagents according to the manufacturer’s protocol. For detection of chemo-luminescence
Kodak® BioMaxTM light films, Kodak® GBX Developer and Replenisher and GBX Fixer and
Replenisher were used. The exposure time differed between 1 to 15 min depending on the
protein that was detected. To visualize the internal loading control, the blots were treated
with stripping buffer (62.5 mM Tris-HCl pH 6.7, 100 mM 2-mercaptoethanol, 2 % SDS) for
30 min at 50 °C in a hybridization oven (Biometra, Goettingen, Germany), were blocked
again for 1 h in milk powder (5 % solution in TBST) and afterwards were incubated with the
ß-Actin antibody.
2.9.3 ELISA
Enzyme Linked Immunosorbent Assay (ELISA) is a powerful analytical biochemistry assay.
This technique can be used for diagnostic differentiation of protein levels in treated versus
untreated tumor tissues. For this thesis the group of Prof. Dr. Achim Aigner performed a
PIM1-specific ELISA to analyze xenograft colon carcinoma tumor samples in mice which
were treated with PIM1-specific siRNA or a miR-33a-mimic. Furthermore ELISA experiments
were conducted to detect changes in TNFα and LPS levels monitoring unspecific effects of
PEI/miRNA or PEI/siRNA treatment (for detailed information see (28)). After coating the
antibody onto a 96-well plate overnight the supernatant of a tumor sample lysate was added
to the plate the next morning. Several washing steps followed, before the specific detection
antibody was applied to each single well. Detection was performed using a HRP-coated
secondary antibody which was able to turn the offered substrate into a colored product.
Subsequently the rising amounts of colored product were detected in a FLUOstar OPTIMA
micro plate reader (BMG Labtech, NYC, USA).
2.9.4 Liver enzyme activity assays
To determine non-specific and/or toxic effects of PEI/miRNA complexes in mouse
experiments, changes in the activity of the liver enzymes aspartate aminotransferase (AST,
SGOT) and alanine aminotransferase (ALT, SGPT) were determined using an enzyme assay
kit obtained from DiaSys Diagnostic Systems (Holzheim, Germany). Evaluation of the assay
was done 60 min after four consecutive i.p.-injection-treatments. Enzyme activity assays
were performed in Prof. Dr. Achim Aigner group; further information can be found at Ibrahim
et al. (28).

Materials and Methods
36
2.9.5 Luciferase reporter assay
48 h after incubation of K562 or HeLa cells with the respective pGL3 luciferase reporter
plasmids and/or siRNAs, miRNA mimics or LNA-modified antisense oligonucleotides,
luciferase reporter assays were performed using the Promega Luciferase Assay System
(Promega, Mannheim, Germany). K562 were centrifuged (5 min, 390 g, RT), washed with
500 µL of PBS and pelleted before lyzing with 200 µL of 1.2x reporter lysis buffer (Promega,
Mannheim, Germany). The media of HeLa cells or other adherent growing cells was
aspirated and cells were lyzed in 100 µL of 1.2x reporter lysis buffer after a previous washing
step with PBS. Cells were incubated in reporter lysis buffer for 1 h at room temperature,
while shaking at 1,800 rpm. Next assay measurement was performed in a white 96-well
plate. 10 µL of cell lysate were mixed with 10 µL of luciferase substrate. Luminescence was
measured immediately in a Safire2TM micro plate reader (Tecan, Crailsheim, Germany).
Custom settings for measurement were defined as ‘Luminescence’ for measurement mode,
’10 msec’ were set as integration time with a shake duration of ‘3 sec’ and as plate definition
‘GRE96fw.pdf’ was chosen.
2.10 Cell cycle analyses
The cell cycle, also termed cell-division cycle, leads to division and replication of a mother
cell into two daughter cells. In mammalian cells this can be departed into four phases
including two periods, interphase and cell division. Thus the interphase is consisting of
G- and S-phase, in which cells first increase in size, then DNA synthesis starts, replication
occurs and afterwards cell division into two daughter cells can take place in mitosis phase.
Mitosis itself is divided in prophase, prometaphase, metaphase, anaphase and telophase.
The regulation of the cell cycle is strongly controlled in mammalian cellular systems and is
used as a checkpoint for proliferation of cells in tumor studies. Anti-cancer treatments can
store the cell cycle at one distinct point or can delay the proliferation of cells. This has to be
considered using several different experimental methods.
2.10.1 Cell cycle analyses using nocodazole
For cell cycle analyses the chemical nocodazole was used. This anti-neoplastic agent affects
the cytoskeleton and synchronizes cells by blocking a formation of metaphase spindles after
entry into mitosis. Nocodazole was used for cell cycle analyses in K562 and LS174T cells. In
case of K562 cells nocodazole was added 24 h after transfection of siRNAs or miRNAs
(2.8.1, 2.8.2). LS174T cells were treated 48 h after transfection. Nocodazole was applied to
Materials and Methods
37
the medium at a final concentration of 100 ng/mL. A 16 h (LS174T) to 24 h (K562) incubation
step followed in a humidified atmosphere at 37 °C, before cells were washed with PBS and
fresh medium was added to release cells from the mitotic block. Cells were cultivated for
another 48 h before harvesting. Then fixation of the cells was performed to do FACS analysis
(2.12).
2.10.2 WST-1 assay
Before usage of modified RNA oligonucleotides as therapeutic agents it is important to
question whether these molecules cause a growth delay, have cytotoxic effects or influence
cell viability. Thus cell viability of different mammalian cells can be determined with the water
soluble tetrazolium salt WST-1 (Roche Applied Science, Mannheim, Germany). During the
assay the tetrazolium salt is cleaved to a dark red formazan dye by cellular mitochondrial
dehydrogenases that are present in viable cells. Absorbance directly correlates with the
amount of viable and metabolically active cells in the culture. The assay was performed in a
micro titer plate as indicated in the protocol of the manufacturer. Cells of interest (e.g.
0.5 * 104 HeLa cells) were seeded one day prior to transfection. The day of transfection cells
were treated with RNA oligonucleotide complexes of interest (2.8.2). 48 h after transfection a
WST-1 proliferation assay was done using 10 µL of water soluble tetrazolium salt which was
directly given to the cultured cells. Measurement of resulting formazan dye was performed
after a 2 h incubation step at 37 °C in a humidified atmosphere in a Safire2TM
micro plate reader (Tecan, Crailsheim, Germany). Absorbance was determined at 450 nm
choosing a reference wavelength of 650 nm. Cell viability was calculated using a background
control as reference.
2.10.3 Cell counting method
To determine the increase of the total number of viable cells in suspension cell lines, it is
more likely to use cell counting. The enzymatic catalytic reaction of the formazan dye used in
the WST-1 assay is possible, but uniform colorization of the product is limited. Thus cell
counting was performed to consider antiproliferative effects on growth of the suspension cell
line K562 after siRNA, miRNA mimic or LNA antiseed treatment. Cells were cultivated two
days prior to transfection or treatment in the indicated medium (2.8.1) containing only 2 %
FCS to slow down the cell cycle due to serum starvation. The day the experiment was
started, cells were counted and 1 * 106 cells were seeded into a 12-well plate containing
1.5 mL of RPMI 1640 supplemented with 2 % FCS. Every 24 h cells were counted with a
hemocytometer (Marienfeld, Lauda-Königshofen, Germany) and the medium was exchanged

Materials and Methods
38
by pelleting the cells at 2050 rpm for 5 min if necessary. By analyzing the total number of
cells, cell proliferation of untreated versus treated cells was compared.
2.11 Apoptosis assays
Apoptosis is the process of programmed cell death which occurs in multicellular organisms.
Characteristic changes in e.g. the morphology of cells include cell shrinking, nuclear or
chromosomal DNA fragmentation as well as chromatin condensation. These biochemical
events afterwards lead to cell death. The principle of apoptosis was first described in 1842 by
the German scientist Carl Vogt and later studied and further described by a number of
scientists (193). The process of apoptosis can be controlled by either extracellular (e.g.
toxins, cytokines) or intracellular (e.g. glucocorticoids, hypoxia) signals and to date can be
detected via multiple assay systems.
2.11.1 Cell death detection assay
Induction of apoptosis after PIM1-specific siRNA or miR-33a treatment (2.8.1) was
determined in a cell death detection assay. For K562 cells the Cell Death Detection ELISA
(Roche Applied Biosciences, Mannheim, Germany) was used according to the
manufacturer’s protocol. Microtiter plates were pre-coated with an anti-histone antibody
(clone H 11-4) and were incubated with lyzed cells. Addition of an anti-DNA antibody
(clone MCA-33) was followed by an incubation step for 90 min. For detection of mono- and
oligo-nucleosomes 2,2’-Azinobis-3-ethylBenzThiazolin-6-Sulfonic acid (ABTS) substrate
solution was applied. This substrate is cleaved by peroxidases which are bound to the
immune-complexes. The resulting ABTS-radical can be photometrically determined.
Absorbance was measured with a Safire2™ micro plate reader at 405 nm (Tecan,
Crailsheim, Germany).
2.11.2 Caspase assay
To determine the apoptosis rate in LS174T cells, the Caspase-Glo® 3/7 Assay (Promega,
Mannheim, Germany) was used according to the manufacturer’s protocol. The assay
provides a proluminescent caspase-3/-7 substrate which is cleaved to release aminoluciferin.
Thereafter this cleaved product is used by luciferase for the production of light that in the
following can be detected. Briefly 1 * 103 cells per well were seeded in 96-well plates and
transfected with PIM1-specific siRNA or miRNA (2.8.2). After 120 h the
caspase Glo® 3/7 substrate was prepared in serum-free medium and 100 µL were added to

Materials and Methods
39
the cells prior to incubation for 1 h at room temperature. For the detection of caspase activity
luminescence was measured using a FLUOstar OPTIMA micro plate reader (BMG Labtech,
NYC, USA).
2.12 FACS
A powerful biophysical technique to allow cell counting, sorting or protein engineering is flow
cytometry. A specialized type is Fluorescence-Activated Cell Sorting (FACS) which sorts a
heterogeneous mixture of biological cells. Cells are illuminated with a single light impulse and
a number of detectors evaluate combination of scattered and fluorescent light. By this one
single cell at a time is sorted based upon its specific fluorescence or light pattern.
2.12.1 Cell sorting via propidium iodide staining
One defined viability assay is performed by measuring cell membranes integrity. This can be
done via a staining with the fluorescent dye propidium iodide which is an intercalating agent.
Propidium iodide is impermeable for cell membranes of viable cells and thus colours only
DNA fragments of dead cells. For FACS analysis K562 and LS174T cells were harvested
after synchronizing their cell cycle with nocodazole (2.10.1), were fixed in 70 % ethanol in
PBS and incubated for 1 h on ice. After incubation with 50 µg/mL RNase A (Thermo Fisher
Scientific, Schwerte, Germany) at 37 °C for 30 min, cells were stained with 50 µg/mL
propidium iodide solution. Afterwards FACS analyses were done using a
BD FACSCalibur™ system (Becton-Dickinson, Heidelberg, Germany). These analyses were
performed with the help of the working group of Prof. Dr. Achim Aigner.
2.13 Plasmid construction
In general plasmids are DNA molecules that are independent of genomic DNA. Plasmid DNA
mainly is circular and differs in size. In case of genetic engineering plasmids are called
vectors and are a powerful tool in molecular biology to amplify DNA or proteins of interest. All
vectors used in this thesis are designed to allow amplification in eukaryotic cells.
2.13.1 Full-length PIM1 cDNA clone
To obtain ectopic PIM1 expression in PIM1 negative mammalian cell lines, a full-length
PIM1 cDNA clone (Cat. No.: SC110975, Accession No.: NM_002648.2 hsa PIM1 oncogene,
vector pCMV6-XL4; vector sequence imprinted in Appendix P) was purchased from OriGene
(Rockville, MD, USA). The eukaryotic vector has a size of 4.7 kb plus 2.6 kb
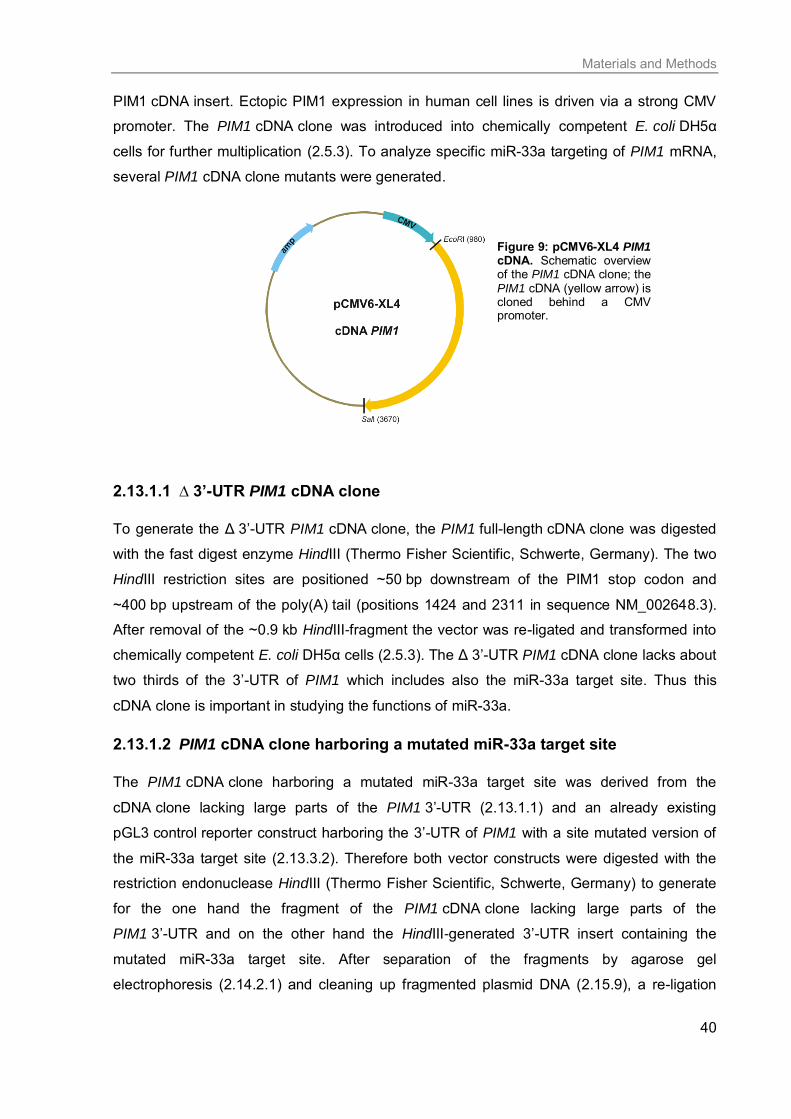
Materials and Methods
40
PIM1 cDNA insert. Ectopic PIM1 expression in human cell lines is driven via a strong CMV
promoter. The PIM1 cDNA clone was introduced into chemically competent E. coli DH5α
cells for further multiplication (2.5.3). To analyze specific miR-33a targeting of PIM1 mRNA,
several PIM1 cDNA clone mutants were generated.
Figure 9: pCMV6-XL4 PIM1 cDNA. Schematic overview of the PIM1 cDNA clone; the PIM1 cDNA (yellow arrow) is cloned behind a CMV promoter.
2.13.1.1 ∆ 3’-UTR PIM1 cDNA clone
To generate the Δ 3’-UTR PIM1 cDNA clone, the PIM1 full-length cDNA clone was digested
with the fast digest enzyme HindIII (Thermo Fisher Scientific, Schwerte, Germany). The two
HindIII restriction sites are positioned ~50 bp downstream of the PIM1 stop codon and
~400 bp upstream of the poly(A) tail (positions 1424 and 2311 in sequence NM_002648.3).
After removal of the ~0.9 kb HindIII-fragment the vector was re-ligated and transformed into
chemically competent E. coli DH5α cells (2.5.3). The Δ 3’-UTR PIM1 cDNA clone lacks about
two thirds of the 3’-UTR of PIM1 which includes also the miR-33a target site. Thus this
cDNA clone is important in studying the functions of miR-33a.
2.13.1.2 PIM1 cDNA clone harboring a mutated miR-33a target site
The PIM1 cDNA clone harboring a mutated miR-33a target site was derived from the
cDNA clone lacking large parts of the PIM1 3’-UTR (2.13.1.1) and an already existing
pGL3 control reporter construct harboring the 3’-UTR of PIM1 with a site mutated version of
the miR-33a target site (2.13.3.2). Therefore both vector constructs were digested with the
restriction endonuclease HindIII (Thermo Fisher Scientific, Schwerte, Germany) to generate
for the one hand the fragment of the PIM1 cDNA clone lacking large parts of the
PIM1 3’-UTR and on the other hand the HindIII-generated 3’-UTR insert containing the
mutated miR-33a target site. After separation of the fragments by agarose gel
electrophoresis (2.14.2.1) and cleaning up fragmented plasmid DNA (2.15.9), a re-ligation
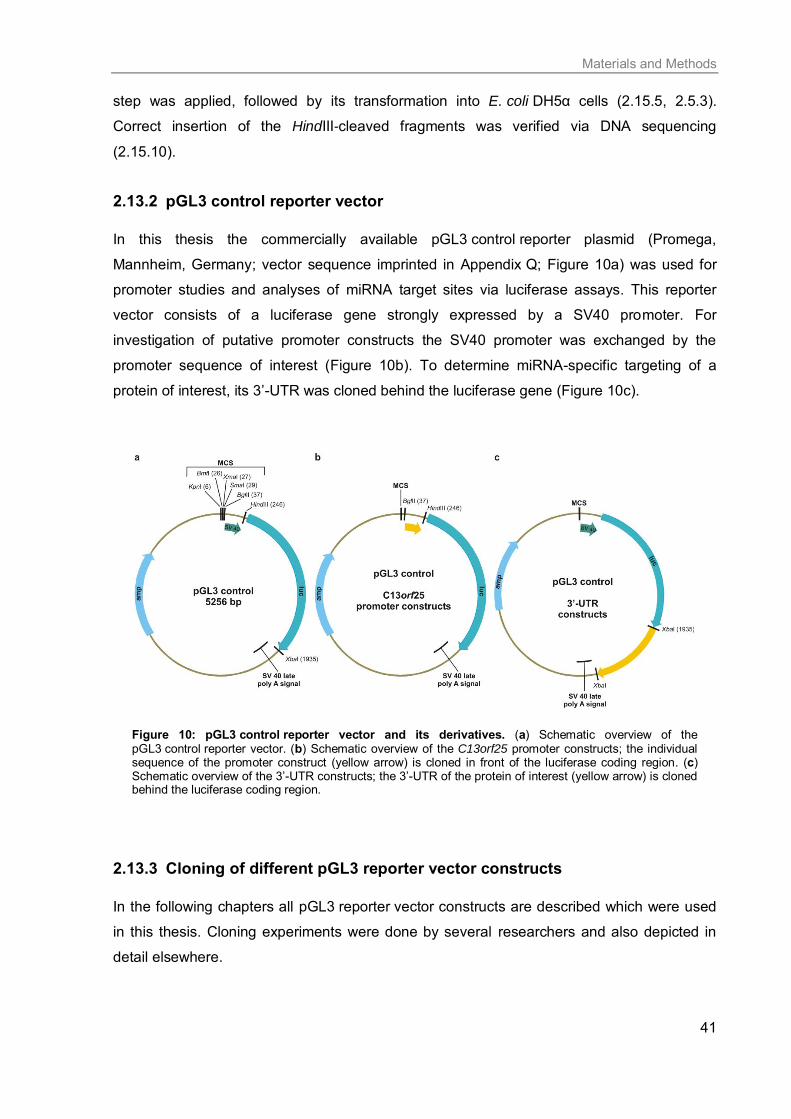
Materials and Methods
41
step was applied, followed by its transformation into E. coli DH5α cells (2.15.5, 2.5.3).
Correct insertion of the HindIII-cleaved fragments was verified via DNA sequencing
(2.15.10).
2.13.2 pGL3 control reporter vector
In this thesis the commercially available pGL3 control reporter plasmid (Promega,
Mannheim, Germany; vector sequence imprinted in Appendix Q; Figure 10a) was used for
promoter studies and analyses of miRNA target sites via luciferase assays. This reporter
vector consists of a luciferase gene strongly expressed by a SV40 promoter. For
investigation of putative promoter constructs the SV40 promoter was exchanged by the
promoter sequence of interest (Figure 10b). To determine miRNA-specific targeting of a
protein of interest, its 3’-UTR was cloned behind the luciferase gene (Figure 10c).
Figure 10: pGL3 control reporter vector and its derivatives. (a) Schematic overview of the pGL3 control reporter vector. (b) Schematic overview of the C13orf25 promoter constructs; the individual sequence of the promoter construct (yellow arrow) is cloned in front of the luciferase coding region. (c) Schematic overview of the 3’-UTR constructs; the 3’-UTR of the protein of interest (yellow arrow) is cloned behind the luciferase coding region.
2.13.3 Cloning of different pGL3 reporter vector constructs
In the following chapters all pGL3 reporter vector constructs are described which were used
in this thesis. Cloning experiments were done by several researchers and also depicted in
detail elsewhere.

Materials and Methods
42
2.13.3.1 pGL3 control PIM1 3’-UTR reporter construct
In the 3’-UTR of human PIM1 one miR-33a target site is located. To determine specific
effects of a miR-33a mimic on PIM1 mRNA, its 3’-UTR was cloned into the
pGL3 control reporter vector. Human PIM1 3’-UTR was amplified from genomic DNA of the
erythroleukemia cell line K562 using the primers listed in Appendix J. Afterwards the
PIM1 3’-UTR was cloned into the unique XbaI site of the pGL3 control reporter vector located
directly behind the luciferase gene. A transformation step into E. coli DH5α cells followed
(2.5.5). Correct insertion of the PIM1 3’-UTR was validated via restriction digest of the
plasmid and DNA sequencing (2.15.4, 2.15.10). The generated reporter construct was
performed by Robert Prinz (194).
2.13.3.2 pGL3 control PIM1 3’-UTR mutated miR-33a target site reporter
construct
To eliminate the miR-33a target site in the pGL3 control PIM1 3’-UTR vector, a mutagenesis
PCR according to Brennecke et al. (195) was performed using primers listed in Appendix J.
DNA sequencing (2.15.10) verified correctness of introduced mutations. This reporter
construct was cloned by Robert Prinz (194).
2.13.3.3 pGL3 control hsa-let-7a target site reporter constructs
To introduce a hsa-let-7a site behind the luciferase coding sequence of the
pGL3 control reporter vector, two complementary DNA oligonucleotides (Appendix J)
encoding the let-7a target sequence (MIMAT0000062) (2.18.6) were annealed in annealing
buffer (30 mM HEPES KOH pH 7.4, 100 mM KCl, 2 mM Mg2Cl, 50 mM NH4Ac) and cleaved
with the restriction enzyme XbaI (2.15.4). Afterwards the DNA fragment was cloned into the
unique XbaI site located immediately downstream of the luciferase gene of the linearized and
dephosphorylated (2.15.2) pGL3 control reporter plasmid. Correct insertion of the
double-stranded DNA oligonucleotide was identified through linearizing of recombinant
plasmids via a unique BlpI site which was introduced with the annealed DNA insert. Cloning
of the insert resulted in two opposite orientations that were identified by DNA sequencing
(2.15.10). These clones, giving rise to RNA transcripts harboring a let-7a target site, were
classified as ‘forward orientation’; those with the opposite insert orientation served as
negative control reporter plasmids, termed as ‘inverted orientation’. Cloning studies were
done by Robert Prinz (194).
Materials and Methods
43
2.13.3.4 pGL3 control P21 3’-UTR reporter construct
The 3’-UTR of human P21 harbors two target sites for members of the human
miR-106b family, namely miR-17-5p and miR-20a. To determine the effects of LNA antiseeds
directed against mature miR-106b family members on P21 protein levels, its 3’-UTR was
cloned into the pGL3 control reporter vector via the XbaI site. Initially the 3’-UTR was
amplified from human genomic DNA of K562 cells using primers listed in Appendix J.
Afterwards the amplicon was subcloned into a pCR™2.1-TOPO® vector
(TOPO® TA Cloning® kit, Invitrogen, Karlsruhe, Germany) prior to insertion into the
pGL3 control vector. Correct introduction of the insert was applied using restriction digest as
well as DNA sequencing (2.15.4, 2.15.10). Creation of the construct was performed by
Robert Prinz (194).
2.13.3.5 pGL3 control P21 3’-UTR mutated miR-106b family target sites reporter
construct
Mutagenesis of the two miR-106b family target sites in the P21 3’-UTR was performed via
mutagenesis PCR (2.15.8.2) of the pGL3 control P21 3’-UTR reporter vector. Primers were
designed according to Brennecke et al. (195) and are listed in Appendix J. The generated
amplicons were cloned into E. coli DH5α cells (2.5.5) and correct insertion of the mutations
was verified via DNA sequencing (2.15.10). This construct was generated by Robert Prinz
(194).
2.13.3.6 pGL3 control C13orf25 promoter constructs
To study the intronic AT-rich region preceding the miR-17-92 cluster, several
C13orf25 promoter constructs were cloned. These constructs include individual segments
which either start ~100 nt or ~200 nt upstream of the miR-17 coding sequence. Therefore the
pGL3 control reporter plasmid was used and the strong SV40 promoter deleted via restriction
digest with the two enzymes BglII and HindIII. At this position the favored
C13orf25 segments were introduced harboring the respective restriction enzyme sites.
Promoter fragments were initially amplified from human genomic K562 DNA using the
primers listed in Appendix J. The amplicons were purified and digested with BglII and HindIII
for re-introduction and ligation into the pGL3 control reporter vector (2.15.5). The vectors
containing a 1.5 kb insert, a shortened insert of 625 bp or a 339 bp insert were generated by
Robert Prinz (194). Similarly some promoter constructs were cloned by Dorothee Hartmann
(196). One construct was designed containing 297 bp of C13orf25, a second one harbored
only 197 bp. Additionally a 250 bp, a 190 bp and a 108 bp construct were cloned. One

Materials and Methods
44
construct comprised an inverted sequence of the 339 bp reporter construct and dealt as in
internal control plasmid. All segments were cloned into E. coli DH5α cells (2.5.5) and were
verified via DNA sequencing (2.15.10).
2.14 General nucleic acid techniques
Nucleic acid techniques can be used either for DNA or RNA oligonucleotides. DNA or RNA
samples were stored at -20 °C for longer periods and dissolved in double-distilled water.
2.14.1 Determination of nucleic acid concentration
Nucleic acids are able to absorb light at a specific wavelength. The aromatic ring of each
base can absorb light at the distinct wavelength of 260 nm. The nucleic acid concentration
can be determined according to the law of Lambert-Beer (Equation 1) which relates the
absorption of light to the properties of a material or solution that light has travelled through.
The concentration of a sample can be determined if the absorbance is measured and the
molar absorptivity as well as the path length of the cuvette are known.
Equation 1: Law of Lambert-Beer.
E = ε * c * l
[E]: extinction
[ε]: molar absorptivity (extinction coefficient) [1/(M * cm)]
[c]: molar concentration [M]
[l]: path length of the cuvette [cm]
During the laboratory work the concentration of nucleic acids was determined using
double-distilled water as solvent. For absorption of 1 at 260 nm (1 A260) and a cuvette path
length of 1 cm following concentrations of nucleic acids can be assumed (Equation 2):
Equation 2: Concentration of nucleic acids.
1 A260 dsDNA → 50 µg/mL
1 A260 ssDNA → 37 µg/mL
1 A260 RNA → 40 µg/mL
The purity of nucleic acids can be estimated by measuring the ratio of A260/A280. The aromatic
amino acids of proteins have their absorbance maximum at 280 nm. If the nucleic acid

Materials and Methods
45
solution is not contaminated with proteins or phenol (2.16.3) its absorbance ratio will be in
between of 1.8 to 2.0 (183).
2.14.2 Nucleic acid gel electrophoresis
In 1955 O. Smithies performed the separation of serum in a gel electrophoresis (197) via
starch gels for the first time. This was the beginning of an enormous and powerful method to
analyze macromolecules, in particular nucleic acids. This technique is used in molecular
biology to separate DNA or RNA molecules depending on their length. Because DNA and/or
RNA oligonucleotides naturally contain a phosphodiester backbone, these molecules are
negatively charged. This charge is a direct proportion to the amount of phosphate groups in
the nucleotide chain. Thus the length of the DNA or RNA of interest can be determined.
2.14.2.1 Agarose gel electrophoresis
Separation of nucleic acids in an agarose gel matrix was established in 1964 and initially
described by Tsanev et al. (198). Negatively charged nucleic acids, commonly DNA
fragments or RNA oligonucleotides with a size larger than 500 nt, are able to migrate in an
electric field towards the anode. During the laboratory work of this thesis analyses of DNA
vectors, PCR reactions and PEI complexes were performed using agarose gel
electrophoresis. To prepare agarose gels, variable amounts of agarose (Table 12) were
diluted in TBE buffer (89 mM Tris-HCl, 89 mM borate, 2 mM EDTA) according to the needed
separation range.
Table 12: Separation range of agarose gels.
% Agarose (w/v) DNA fragment size
(kb)
0.5 1.0-30.0
0.7 0.8-12.0
1.0 0.5-7.0
1.2 0.4-6.0
1.5 0.2-3.0
2.0 0.1-2.0
The indicated amount of agarose was added into 1x TBE buffer and was dissolved by
heating it up in the microwave. After cool down of the solution ethidium bromide was
complemented with a final concentration of 250 ng/mL. The gel solution was tipped into an
agarose gel slide and a comb was applied before gelation of the matrix. DNA samples were
mixed with 5x DNA loading dye (100 mM Tris-HCl pH 7.5, 50 mM EDTA pH 8.0, 70 %

Materials and Methods
46
glycerin (v/v), 0.05 % bromophenol blue (w/v), 0.05 % xylene cyanol blue (w/v)) and then
loaded onto the agarose gel. Gel electrophoresis was done using TBE as running buffer. In
general electrophoresis was run for 1 h at 80 mA in a PerfectBlue gel system Mini S
(PEQLAB Biotechnologie, Erlangen, Germany). PEI complexes were analyzed in 1 %
agarose gels for 2 h at 50 mA, after being dissolved in 5x DNA loading dye.
2.14.2.2 Polyacrylamide gel electrophoresis
PolyAcrylamide Gel Electrophoresis (PAGE) was first described in 1967 (199). The usage of
a polyacrylamid matrix has several advantages in comparison to agarose matrices. The gels
are much thiner, are transparent and beyond more reliable in separating smaller DNA
fragments or RNA oligonucleotides up to 300 nt. In consequence of a radical polymerisation
reaction acrylamide and bisacrylamide are able to cross-link, forming a structured grid that
harbors a defined pore size. Polyacrylamide gel electrophoresis can be performed either in
native or denaturing method and size separation is dependent on the ratio of
acrylamide/bisacrylamide in the matrix (Table 13). The migration speed of single-stranded
DNA can be estimated using two dyes, BromoPhenol Blue (BPB) and Xylene Cyanol Blue
(XCB), during gel electrophoresis.
Table 13: Size fragmentation in PAGE.
Ratio of
polyacrylamide [%]
BPB
[nt]
XCB
[nt]
8 19 70-80
10 12 55
Polyacrylamide gels were poured between two glass plates which were tightened with
several clamps. A comb with the favored number of pockets was introduced between the
plates before the gel solution was fixed. Hardening of the matrix took 30 min. The gel was
placed in between an upper and lower chamber, the comb was removed and the pockets
rinsed with TBE (89 mM Tris-HCl, 89 mM borate, 2 mM EDTA). PAGE was performed in self-
made equipment (University of Lübeck, Germany) using 8-30 mA for 30 min to several hours
depending on the percentage, conditions and size of the prepared gel. During this thesis
native polyacrylamide gel electrophoresis was needed to separate amplified products of
quantitative PCR which have a product length smaller than 100 bp. For this purpose
polyacrylamide gel solution (10 % acrylamide/bisacrylamide (48:2) in TBE) was prepared and
0.01 volume of APS (dissolved as a 10 % solution) and 0.001 volume of TEMED were added
to start radical polymerisation reaction. PCR samples were mixed with required amounts of
5x DNA loading dye (2.15.8) and were loaded onto the gel. Native PAGE was started as

Materials and Methods
47
described above. After finishing electrophoresis DNA fragments were detected using
ethidium bromide (2.14.3.1). Denaturing polyacrylamide gel electrophoresis was performed
to separate RNA. The buffer contains urea to interact with the stacking bases and destroy
hydrogen bonds. This leads to a destabilization of RNA secondary structures. Analyses of
total RNA were performed on 8 % denaturing PAGE (8 % acrylamide/bisacrylamide (48:2),
8 M urea in TBE). Commonly 0.5 to 1 µg of total RNA was used and mixed with
2x denaturing loading buffer (66 % (v/v) formamide, 2.6 M urea, 0.02 % (w/v) bromophenol
blue, 0.02 % (w/v) xylene cyanol blue in 2x TBE). Samples were heated up to 95 °C for 2 min
and were kept on ice until loading on the gel matrix. Denaturing PAGE was done as indicated
above. After finishing electrophoresis RNA was stained using ethidium bromide (2.14.3.1).
2.14.3 Staining of nucleic acids
After gel electrophoresis of nucleic acids these molecules can be visualized using several
staining techniques. Most commonly separated DNA or RNA samples are detected with
small compounds which enable intercalation of the compound between stacked bases of
DNA or RNA molecules respectively. Subsequently these compounds can be exposed to
ultraviolet light (UV light) to generate fluorescence or they are visible themselves.
2.14.3.1 Ethidium bromide staining of nucleic acids
Ethidium bromide is used to detect separated nucleic acids in molecular biology (200). This
fluorescent dye intercalates into double-stranded DNA or partially double-stranded RNA.
When it is exposed to UV light, it shows an orange fluorescence emitting light at a
wavelength of 590 nm. Staining of agarose gels was done following gel electrophoresis,
while ethidium bromide was already included in the gel matrix (2.14.2.1). In case of
polyacrylamide gels (2.14.2.2) DNA or RNA samples were stained after electrophoresis was
finished. Therefore the gel was incubated in an appropriate volume of water containing
5 µg/mL ethidium bromide. After a 10 min shaking step at room temperature DNA or RNA
bands can be detected and visualized using the gel documentation system Gerix 1000
(biostep, Jahnsdorf, Germany). Agarose or polyacrylamide gels were digitalized and
recorded onto an USB flash drive for documentation.
2.14.3.2 Crystal violet staining of DNA
Crystal violet is another dye to stain DNA in agarose gels. The triarylmethane dye can be
used as a non-toxic intercalating agent. It is used for detection of nucleic acids which should
not be exposed to UV light to avoid destruction of DNA helices, especially DNA needed for
in vitro cloning experiments. For staining procedure (2.14.2.1) it is applied directly into the
Materials and Methods
48
agarose gel matrix in a concentration of 10 µg/mL diluted in TBE buffer (89 mM Tris-HCl,
89 mM borate, 2 mM EDTA) and also the running buffer contains crystal violet in the
indicated concentration. After finishing the agarose gel electrophoresis separated and dyed
DNA bands were excised immediately with a sterile scalpel for further application.
2.14.3.3 Silver staining of nucleic acids
In 1973 Kerenyi and Gallyas first described the detection of proteins in gel matrices using
silver ions (201). Nucleic acids are negatively charged. Positive silver ions can be chemically
reduced to a silver coating at their surface and thus nucleic acids are stained. For silver
staining nucleic acids were separated in agarose or polyacrylamide gels and fixed in the gel
matrix using fixating solution (50 % MeOH (v/v), 12 % acetic acid (v/v)) for 15 min at room
temperature on a shaker. Fixation step was repeated three times. Afterwards excessive
amounts of acetic acid were washed out of the matrix with 30 % EtOH solution, again three
times for 5 min at room temperature. Then the gel matrix was incubated for 45 sec in a
freshly prepared coating solution (50 mL ddH20, 33 µL HCHO 35 %, 25 µL Na2S2O3 43 %)
and washed three times for 1 min in double-distilled water. Silver incubation (2 g/L AgNO3
supplemented with 660 µL HCHO 35 %) was performed for 20 min at room temperature
using a shaker. Subsequently excess of silver ions was washed out with double-distilled
water for 1 min. Reduction of silver ions was done using reduction solution (60 g/L Na2CO3,
150 mL were supplemented with 75 µL of HCHO 35 % and 1.5 µL of Na2S2O3 43 %). When
the expected bands had appeared, the gel was rinsed with water. Finally reduction was
stopped using 7 % acetic acid. Gels were stored in 30 % EtOH solution and pictured using a
Bio-Rad GS-800 Calibrated Densitometer (Munich, Germany). Pictures were digitalized onto
an USB flash drive.
2.14.3.4 SYBR® Gold staining of nucleic acids
Detection of single- or double-stranded DNA or RNA oligonucleotides can be performed
using SYBR® gold (Invitrogen™ Life Technologies, Darmstadt, Germany). This most
sensitive fluorescent staining dye is an unsymmetrical cyanine dye that exhibits fluorescence
increase upon binding to nucleic acids using standard ultraviolet transilluminators (202). The
SYBR® Gold staining dye is provided as a 10.000-fold concentrate and was used for staining
of DNA or RNA samples in agarose or polyacrylamide gel systems. The concentrated
staining solution was diluted in TBE buffer (89 mM Tris-HCl, 89 mM borate, 2 mM EDTA) and
protected from light. Gel matrices were incubated for 10-40 min at room temperature in a
dish covered with an appropriate amount of solution. During this incubation step dishes were

Materials and Methods
49
kept in the dark or covered with aluminum foil. Afterwards 1x dilution was stored for up to one
month at 4 °C and SYBR® gold stained nucleic acids were detected in UV light.
2.14.3.5 Autoradiography
Detection of nucleic acids is also possible using [32P]-labeled oligonucleotides.
Autoradiography of the radioactive-labeled sample can be visualized in a phosphor-imaging
analyzer after a separating process in an agarose or a polyacrylamide gel matrix has
occurred. Therefore the gel matrix was wrapped into transparent foil and exposed to an
imaging plate for time periods between 1 min to overnight depending on the amount of
radioactive material. Afterwards the imaging plate was scanned using a
Fuji FLA-3000 R Phosphorimager (Fujifilm, Düsseldorf, Germany). Quantification of the DNA
or RNA samples was calculated using the software AIDA (Version 3.45).
2.15 DNA techniques
2.15.1 Plasmid preparation
Plasmid preparation of overnight cultures (about 3-5 mL of culture medium) was performed
using the GenejetTM Plasmid Miniprep Kit (Thermo Fisher Scientific, Schwerte, Germany)
according to the manufacturer’s protocol. In case of preparing larger amounts of bacterial cell
culture (200-500 mL of culture medium) plasmid DNA was cleaned up using the
NucleoBond® PC 500 purification kit (Macherey-Nagel, Düren, Germany). Recovered
plasmid DNA was diluted in double-distilled H2O before the resulting concentration was
determined in a spectral photometer (Thermo Fisher Scientific, Schwerte, Germany).
2.15.2 Phosphorylation of 5’-OH ends of DNA oligonucleotides
Synthetic DNA primers have to be phosphorylated on the free 5’-OH end to enhance the
efficiency of cloning experiments (2.13). For this purpose a recombinant T4 polynucleotide
kinase from E. coli was obtained from Thermo Fisher Scientific (Schwerte, Germany). This
enzyme is able to confer the gamma-phosphate of ATP to the free 5’-OH to phosphorylate
the 5’-end of single-stranded DNA oligonucleotides. Reaction mixture was mixed as indicated
at the manufacturer’s protocol and is shown in Table 14.
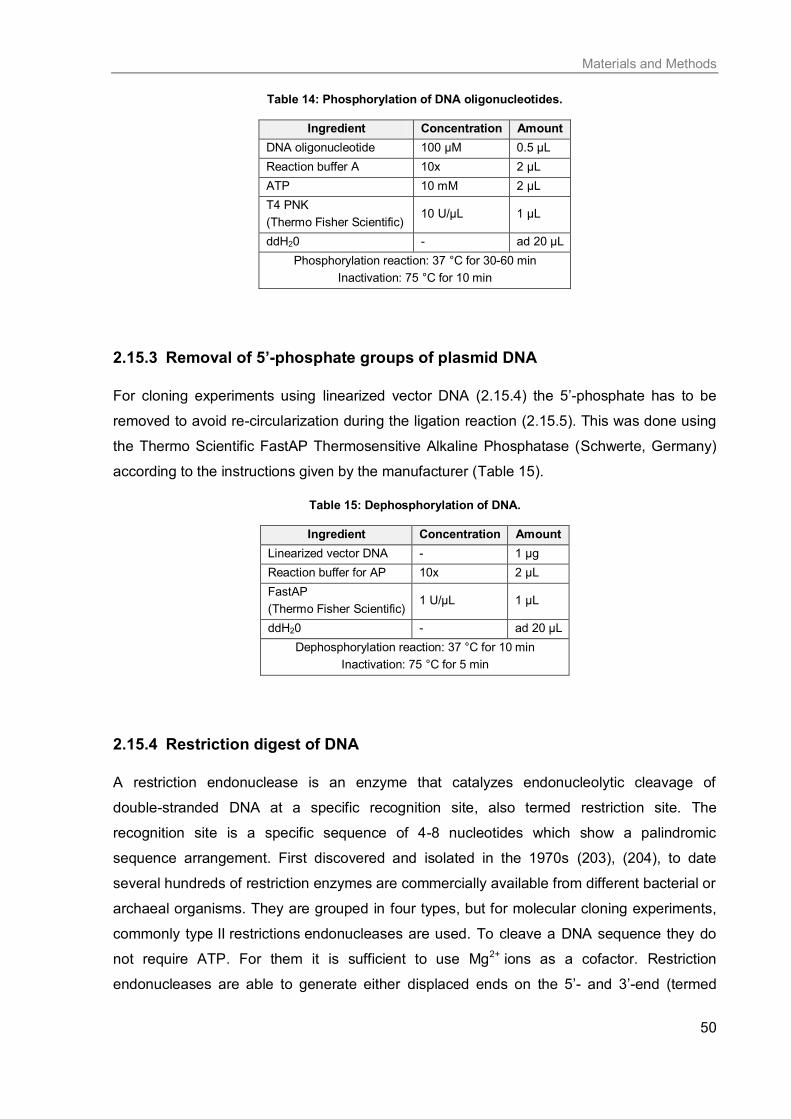
Materials and Methods
50
Table 14: Phosphorylation of DNA oligonucleotides.
Ingredient Concentration Amount
DNA oligonucleotide 100 µM 0.5 µL
Reaction buffer A 10x 2 µL
ATP 10 mM 2 µL
T4 PNK
(Thermo Fisher Scientific) 10 U/µL 1 µL
ddH20 - ad 20 µL
Phosphorylation reaction: 37 °C for 30-60 min
Inactivation: 75 °C for 10 min
2.15.3 Removal of 5’-phosphate groups of plasmid DNA
For cloning experiments using linearized vector DNA (2.15.4) the 5’-phosphate has to be
removed to avoid re-circularization during the ligation reaction (2.15.5). This was done using
the Thermo Scientific FastAP Thermosensitive Alkaline Phosphatase (Schwerte, Germany)
according to the instructions given by the manufacturer (Table 15).
Table 15: Dephosphorylation of DNA.
Ingredient Concentration Amount
Linearized vector DNA - 1 µg
Reaction buffer for AP 10x 2 µL
FastAP
(Thermo Fisher Scientific) 1 U/µL 1 µL
ddH20 - ad 20 µL
Dephosphorylation reaction: 37 °C for 10 min
Inactivation: 75 °C for 5 min
2.15.4 Restriction digest of DNA
A restriction endonuclease is an enzyme that catalyzes endonucleolytic cleavage of
double-stranded DNA at a specific recognition site, also termed restriction site. The
recognition site is a specific sequence of 4-8 nucleotides which show a palindromic
sequence arrangement. First discovered and isolated in the 1970s (203), (204), to date
several hundreds of restriction enzymes are commercially available from different bacterial or
archaeal organisms. They are grouped in four types, but for molecular cloning experiments,
commonly type II restrictions endonucleases are used. To cleave a DNA sequence they do
not require ATP. For them it is sufficient to use Mg2+ ions as a cofactor. Restriction
endonucleases are able to generate either displaced ends on the 5’- and 3’-end (termed

Materials and Methods
51
sticky end generation) or cut DNA strands at the same position (termed blunt end
generation). For analytical purposes and cloning experiments several restriction enzymes
were used which are listed in Table 16.
Table 16: Restriction enzymes.
Restriction enzyme Recognition sequence
5’ 3’
FastDigest BglII
(Thermo Fisher Scientific) 5’- A↓GATCT
FastDigest BlpI
(Thermo Fisher Scientific) 5’- GC↓TNAGC
FastDigest HindIII
(Thermo Fisher Scientific) 5’- A↓AGCTT
FastDigest XbaI
(Thermo Fisher Scientific) 5’- T↓CTAGA
Restriction digestion reactions were performed according to the manufacturer’s instructions
(Table 17). If possible FastDigest restriction enzymes (Thermo Fisher Scientific, Schwerte,
Germany) were used. Digestion reactions were incubated for up to 30 min at 37 °C followed
by a heating step to denature the enzyme. Samples were analyzed on an agarose gel
(2.14.2.1) and stained with ethidium bromide. All digestion reactions needed for further
cloning experiments were separated for preparative purposes and stained either with
ethidium bromide or crystal violet (2.14.3.1, 2.14.3.2). After finishing gel electrophoresis DNA
fragments were cut and cleaned up (2.15.9).
Table 17: Restriction digest.
Ingredient Concentration
Amount
Analytical
digest Cloning
DNA - 500 ng up to 5 µg
Restriction buffer 10x 1 µL 5 µL
FD restriction enzyme
(Thermo Fisher Scientific) 1 FDU 0.5 µL up to 5 µL
ddH20 - ad 10 µL ad 50 µL
Digestion: 5-30 min at 37 °C
Heat inactivation: as indicated by the manufacturer
2.15.5 Ligation of DNA fragments
In molecular biology ligation of DNA fragments is an enzymatic linking of a 5’-phosphate and
a 3’-hydroxyl termini of one or two DNA fragment(s) to form a new phosphodiester bond. This

Materials and Methods
52
reaction is catalyzed by the enzyme T4 DNA ligase (205). For cloning experiments either
DNA vectors or amplified DNA of PCR reactions were digested with the favored restriction
enzymes to generate a distinct 5’- or 3’-end. Afterwards two fragments having the same
restricted ends, blunt ends or sticky ends, were incubated for up to 4 h at room temperature
with T4 DNA ligase (Thermo Fisher Scientific, Schwerte, Germany) as shown in Table 18.
The ligation reaction was used for transformation reactions into bacterial E. coli DH5α cells
(2.5.3).
Table 18: Ligation reaction.
Ingredients Concentration Amount
Plasmid DNA - 1-100 ng
Insert DNA - 500 ng
Reaction buffer 10x 2 µL
T4 DNA ligase
(Thermo Fisher Scientific) 5 Weiss U/µL 2 µL
ddH20 - ad 20 µL
Ligation: 1-4 hours, RT
2.15.6 Human genomic DNA preparation
Human genomic DNA (gDNA) was prepared for cloning experiments of respective
pGL3 control vector constructs. Therefore the human erythroleukemia cell line K562 was
used. Preparation of human total DNA was done with the DNeasy® Blood & Tissue Kit
(Quiagen, Hilden, Germany). 5 * 106 K562 cells were centrifuged and washed with PBS until
the total DNA was prepared according to the manufacturer’s protocol using the
‘Spin-Column Protocol’ for purification of total DNA from human cells. After elution of total
DNA its concentration was determined in a spectral photometer (Thermo Fisher Scientific,
Schwerte, Germany) and DNA was prepared for following PCR amplification reactions
(2.15.8.1). The preparation of human genomic DNA was performed by Robert Prinz (194).
2.15.7 Reverse transcription
Reverse transcriptase (RT) is an RNA-dependent DNA polymerase which allows generation
of complementary DNA (cDNA) from an RNA template. Reverse transcriptase is needed for
the replication of retroviruses. In 1970 two independent researchers (206), (207) found this
enzyme. Since this discovery the door was open to create single-stranded DNA from RNA
templates to further study the transcriptome of different organisms. For this thesis cDNA was
arisen from total RNA or RNA, which was enriched for RNA transcripts smaller than 200 nt.

Materials and Methods
53
Therefore the RevertAid H Minus reverse transcriptase (Thermo Fisher Scientific, Schwerte,
Germany) was used. This transcriptase is a recombinant variant of the M-MuLV RT lacking
the RNaseH activity to increase the yield of full-length cDNA. In general 250-1000 ng of RNA
were transcribed using 5-10 pmol of a specific reverse primer or 100 pmol of random
hexamer primer according to the manufacturer’s protocol (Table 19). In addition a negative
control for each RNA sample in the absence of reverse transcriptase was produced to check
for DNA contamination of the samples.
Table 19: Reverse transcription.
Ingredient Concentration Amount +RT Amount -RT
RNA - 250-1000 ng 250-1000 ng
Primer
gene-specific 10 µM 0.5 µL 0.5 µL
random hexamer
(Thermo Fisher Scientific) 100 µM 1 µL 1 µL
ddH20 - ad 11 µL ad 12 µL
Heating Step: 80 °C for 10 min
place samples on ice
RT buffer
(Thermo Fisher Scientific) 5x 4 µL 4 µL
dNTPs 10 mM
(2.5 mM each) 2 µL 2 µL
ddH20 - 2 µL 2 µL
RevertAid H Minus
reverse transcriptase
(Thermo Fisher Scientific)
200 U/µL 1 µL -
reverse transcription: 42 °C for 60 min
inactivation of RT: 70 °C for 10 min
In the following the samples were prepared for quantitative real-time PCR measurements
(2.15.8.3). The cDNA sample was diluted 1:5 or 1:10 with double-distilled water depending
on the number of RNA transcripts that should be detected. QPCR was performed either
straight after cDNA synthesis or samples were stored at -20 °C until usage.
2.15.8 PCR
PCR (Polymerase Chain Reaction) has been developed in 1983 by Kary Mullis (208). It is a
technique to amplify DNA in an exponential manner. Used as a common procedure in
molecular biology e. g. for cloning experiments, to date it can also be used for quantifying
multiplied DNA sequences.

Materials and Methods
54
2.15.8.1 Amplification of genomic DNA
Purified human genomic DNA (gDNA) of K562 cells was used for amplification of the
PIM1 3’-UTR, the P21 3’-UTR or the C13orf25 promoter region. The primers needed for
amplification reaction of the respective constructs are depicted in Appendix J. The reaction
set up was mixed (Table 20) and after multiplication of gDNA (Table 21) the products are
used for cloning into the pGL3 control vector (194).
Table 20: Reaction mixture gDNA.
Ingredient Concentration Amount
gDNA (K562) - 300 ng
Taq buffer with KCl 10x 5 µL
dNTP mix 2.5 mM each 1 µL
Primer fwd 100 µM 0.5 µL
Primer rev 100 µM 0.5 µL
MgCl2 25 mM 2 µL
Taq DNA polymerase
(Thermo Fisher Scientific) 5 U/µL 0.5 µL
ddH20 - ad 50 µL
Table 21: Amplification gDNA.
Step Temperature
[°C]
Time
[sec] Repeat
Denaturation 94 300 1
Amplification
cycle
94 45
30 56 60
72 90
Fill up cycle 72 420 1
Cooling 10 ∞ -
2.15.8.2 Mutagenesis PCR for cloning experiments
To generate mutations into the seed region of miRNA target sequences in the
pGL3 3’-UTR constructs mutagenesis PCR was performed. Therefore primers were
designed according to Brennecke et al. (195) in case of mutating miRNA target sequences or
by hand for all other introduced mutations. Nucleotides which should be exchanged in
mutagenesis PCR were introduced in the forward primer sequence (Appendix J). Additionally
a fully complementary reverse primer was designed (Appendix J). Mutations are positioned
in the middle of the primer and flanked by approximately 10-15 nt on each site. As a template
individual pGL3 control 3’-UTR or C13orf25 promoter constructs were used for PCR reaction
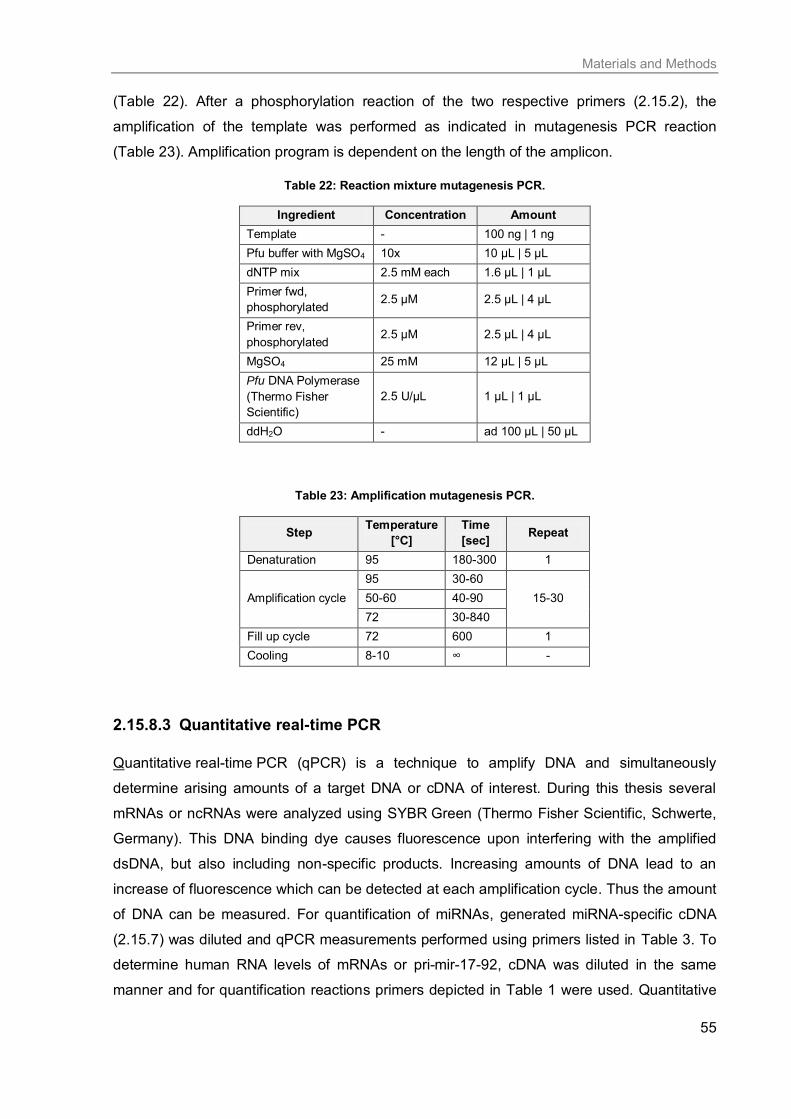
Materials and Methods
55
(Table 22). After a phosphorylation reaction of the two respective primers (2.15.2), the
amplification of the template was performed as indicated in mutagenesis PCR reaction
(Table 23). Amplification program is dependent on the length of the amplicon.
Table 22: Reaction mixture mutagenesis PCR.
Ingredient Concentration Amount
Template - 100 ng | 1 ng
Pfu buffer with MgSO4 10x 10 µL | 5 µL
dNTP mix 2.5 mM each 1.6 µL | 1 µL
Primer fwd,
phosphorylated 2.5 µM 2.5 µL | 4 µL
Primer rev,
phosphorylated 2.5 µM 2.5 µL | 4 µL
MgSO4 25 mM 12 µL | 5 µL
Pfu DNA Polymerase
(Thermo Fisher
Scientific)
2.5 U/µL 1 µL | 1 µL
ddH2O - ad 100 µL | 50 µL
Table 23: Amplification mutagenesis PCR.
Step Temperature
[°C]
Time
[sec] Repeat
Denaturation 95 180-300 1
Amplification cycle
95 30-60
15-30 50-60 40-90
72 30-840
Fill up cycle 72 600 1
Cooling 8-10 ∞ -
2.15.8.3 Quantitative real-time PCR
Quantitative real-time PCR (qPCR) is a technique to amplify DNA and simultaneously
determine arising amounts of a target DNA or cDNA of interest. During this thesis several
mRNAs or ncRNAs were analyzed using SYBR Green (Thermo Fisher Scientific, Schwerte,
Germany). This DNA binding dye causes fluorescence upon interfering with the amplified
dsDNA, but also including non-specific products. Increasing amounts of DNA lead to an
increase of fluorescence which can be detected at each amplification cycle. Thus the amount
of DNA can be measured. For quantification of miRNAs, generated miRNA-specific cDNA
(2.15.7) was diluted and qPCR measurements performed using primers listed in Table 3. To
determine human RNA levels of mRNAs or pri-mir-17-92, cDNA was diluted in the same
manner and for quantification reactions primers depicted in Table 1 were used. Quantitative

Materials and Methods
56
PCR reactions were applied as described in Table 24 using freshly prepared or frozen cDNA
samples. Amplification was done using either a LightCycler® 2.0 from Roche (Mannheim,
Germany) or a MyiQ™5 Real-Time PCR Detection System (Bio-Rad, Munich, Germany)
according to the instructions depicted in Table 25 and Table 26. Analyses of generated data
was performed with the applied software iQ™5 (version 2.0) and 2-Cp, 2-ΔCp and 2-ΔΔCp values
evaluated according to Schmittgen and Livak (209).
Table 24: Quantitative real-time PCR.
Ingredient Concentration Amount
cDNA 1:5 or 1:10
dilution 4 µL
Absolute qPCR
SYBR Green Mix
(Thermo Fisher
Scientific)
2x 10 µL
Primer fwd 5 µM 0.5 µL
Primer rev 5 µM 0.5 µL
ddH2O - 5 µL
Table 25: Amplification qPCR of mRNAs.
Step Temperature
[°C]
Time
[sec] Repeat
Initial
Denaturation 95 900 1
Amplification
cycle
95 10
55 55 10
72 10
Melting Curve 55 95 15 1 °C per
sec
Cooling 40 30 -
Table 26: Amplification qPCR of miRNAs.
Step Temperature
[°C]
Time
[sec] Repeat
Initial
Denaturation 95 900 1
Amplification
cycle
95 10
55 60 20
72 12
Melting Curve 55 95 10 1 °C per
sec
Cooling 40 10 -

Materials and Methods
57
2.15.9 Purification of PCR reactions
Purification of PCR reactions was applied to remove remaining template DNA, primers
and/or dNTPs which were used in the amplification reaction. This either can be performed
after the amplification step of the PCR reaction (2.15.8) or can be done after separation of
the amplified PCR product in an agarose gel (2.14.2.1). The Wizard® SV Gel and
PCR Clean-Up System (Promega, Mannheim, Germany) was used for purification. In case of
purifying the PCR reaction the whole volume of PCR mixture was incubated with the
indicated amount of Membrane Binding Solution before binding to the silica membrane of the
Wizard® SV Minicolumns. If the amplicon was initially separated in an agarose gel, the band
of interest was excised and dissolved in Membrane Binding Solution according to the
manufacturer’s protocol. In both cases DNA was eluted from the columns in a centrifugation
step and used for further experiments.
2.15.10 DNA sequencing
DNA sequencing reactions were sent out and performed at eurofins mwg|operon (Ebersberg,
Germany). Samples were prepared according to the company’s instructions. Purified plasmid
DNA was diluted in double-distilled water to a volume of 15 µL possessing a concentration of
about 50-100 ng/µL. In some cases a specific primer (2 pmol/µL in a minimum volume of
15 µL) was sent out together with the sample (Appendix K). Several days later the
sequencing analyses could be checked at the web page of eurofins (www.eurofinsdna.com)
and data could be aligned to the vector sequence for validity and integrity.
2.15.11 ChIP assay
Chromatin ImmunoPrecipitation (ChIP) is a method to determine interactions between
specific proteins and specific genomic regions such as promoter elements or DNA binding
sites. Cross-linked ChIP (ChIPX) is mainly suited for mapping of the DNA target of
chromatin-associated proteins. Thus proteins are reversibly cross-linked to their associated
chromatin regions via formaldehyde or UV-light. These temporarily bonded DNA/protein
complexes are shared and the protein of interest is selectively immunoprecipitated. After
purification of the associated DNA fragments their sequences can be determined and be
referred to the respective chromatin region. For this thesis, chromatin immunoprecipitation
was performed according to a protocol from the Or Gozani lab
(http://www.stanford.edu/group/gozani) at Stanford University with some modifications.
2 * 107 K562 cells in 13 mL RPMI medium were cross-linked with 1 % formaldehyde for
10 min at 37 °C. Reactions were stopped by adjusting to 0.125 M glycine and cells were

Materials and Methods
58
collected by centrifugation at 400 g for 5 min at room temperature. For cell lysis cells were
resuspended in 750 µL RIPA-buffer (10 mM Tris-HCl pH 7.4, 150 mM NaCl, 1 %
deoxycholate, 1 % NP-40, 0.1 % SDS, 0.2 mM PMSF) supplemented with the
cOmplete Mini Protease Inhibitor Cocktail from Roche (Mannheim, Germany) according to
the manufacturer’s instructions. Lyzed cells were sonicated in a Branson Sonifier 250 (duty
cycle 50 %, output control 2, for 3.5 min on ice water) (Heinemann, Schwäbisch Gmünd,
Germany) and centrifuged at maximum speed (13.000 rpm, 10 min at 4 °C). The supernatant
was pre-cleared with 10 µL of blocked Staphylococcus aureus cells (PANSORBIN® Cells,
Calbiochem/Merck, Darmstadt, Germany) for 15 min at 4 °C on a rotor wheel. After a second
centrifugation step (13.0000 rpm, 5 min, RT), the supernatant was split into two samples
(each ~350 µL, representing + and - specific antibody (AB)) which were adjusted to buffer D
(16.7 mM Tris-HCl pH 8.1, 167 mM NaCl, 1.2 mM EDTA, 1.1 % Triton-X 100, 0.01 % SDS)
and a total volume of 500 µL. 1 µg (1 to 5 µL) of the respective antibody was added to
+ AB samples, whereas the same volume buffer D was added to - AB samples. At this point
also the mock control was prepared, consisting of 500 µL buffer D. + AB, - AB and mock
samples were then incubated for at least 3 h at 4 °C. The following antibodies were used:
monoclonal anti-c-Myc (sc-40), anti-Pim-1 (sc-13513) and anti-phospho-HP1G (Ser83)
antibody (2600S); Table 8). In the case of mouse monoclonal antibodies samples were
additionally incubated for 1 h with a second monoclonal goat anti-mouse IgG antibody
(sc-2005, Table 9). Immunoprecipitation was initiated by adding 10 µL of Pansorbin® cells to
the + AB, - AB and mock samples, followed by incubation for 15 min at room temperature.
Samples were centrifuged (13.0000 rpm, 3 min, RT); the supernatant of the - AB sample was
saved, later serving as the input control. Pellets were washed twice with dialysis buffer
(50 mM Tris-HCl pH 8.0, 2 mM EDTA) and four times with IP-wash buffer (100 mM Tris-HCl
pH 9.0, 500 mM LiCl, 1 % NP40, 1 % deoxycholate). Antibody-bound material was eluted
from Pansorbin® cells by adding 150 µL elution buffer (50 mM NaHCO3, 1 % SDS), vortexing
and centrifugation (13.000 rpm, 3 min, RT). The supernatant was collected and the
procedure was repeated. Reverse cross-linking and RNA digestion was performed in 280 µL
buffer (0.3 M NaCl, and 1 µL RNaseA (10 mg/mL, Thermo Fisher Scientific, Schwerte,
Germany)) for 5 h at 67 °C in a hybridization oven (Biometra, Goettingen, Germany).
Chromatin was precipitated with 2.5 volumes of ethanol, followed by a ProteinaseK (Thermo
Fisher Scientific, Schwerte, Germany) digest that was done according to the manufacturer’s
protocol. DNA was purified by phenol/chloroform extraction (2.16.3) and ethanol precipitation
in the presence of 0.3 M NaOAc pH 5.2. PCR amplification using Taq DNA polymerase and
the co-immunoprecipitated DNA as template was done under the following conditions: 2 min

Materials and Methods
59
at 95 °C in the absence of enzyme, followed by 35 amplification cycles of 45 sec at 95 °C,
45 sec at 60 °C, 45 sec at 72 °C using primers listed in Table 27.
Table 27: Primers for ChIP assay.
Name of
Primer Sequence 5’ 3’
Product
length
[bp]
A1 forward 5’- AAA GGC AGG CTC GTC GTT G 93
A1 reverse 5’- CGG GAT AAA GAG TTG TTT CTC CAA
A2 forward 5’- ACA TGG ACT AAA TTG CCT TTA AAT G 367
A2 reverse 5’- AAT CTT CAG TTT TAC AAG GTG ATG
A3 forward 5’- ACT GCA GTG AAG GCA CTT GT 167
A3 reverse 5’- TGC CAG AAG GAG CAC TTA GG
A4 forward 5’- CCA ATA ATT CAA GCC AAG CAA 137
A4 reverse 5’- AAA TAG CAG GCC ACC ATC AG
A5 forward 5’- GCC CAA TCA AAC TGT CCT GT 212
A5 reverse 5’- CGG GAC AAG TGC AAT ACC AT
2.16 RNA techniques
2.16.1 RNA extraction for small RNAs of mammalian cell lines
Characterization of small RNAs such as miRNAs has been raised in the last decades.
Playing important roles in gene regulation and developmental processes, these small
non-coding RNAs are of enormous interest in many research topics. For this thesis isolation
of small RNA molecules was done using the mirVana™ miRNA Isolation Kit purchased from
Ambion (Life Technologies, Darmstadt, Germany). All extractions were done according to the
given manufacturer’s protocol. Small RNA isolation was performed with about 5 * 106 cells
growing in suspension or under adherent conditions. After a washing step with PBS cells
were lyzed in about 500 µL Lysis/Binding Solution supplemented in the Isolation Kit. An acid
phenol/chloroform extraction followed which provides a robust purification to remove large
amounts of DNA (210). Therefore one volume of Acid Phenol:Chloroform solution was
added, the mixture vortexed and centrifuged. The upper aqueous phase was loaded onto a
glass-fiber filter and after a centrifugation step, a second filter was included and enriched
small RNAs were eluted in 10-20 µL ddH2O. Afterwards concentration of RNA was
determined in a spectral photometer (Thermo Fisher Scientific, Schwerte, Germany) and
small RNAs were used to generate cDNA for quantification of miRNA levels (2.15.7).

Materials and Methods
60
2.16.2 Total RNA extraction of mammalian cell lines
Total RNA extraction of different mammalian cell lines was applied to quantitate the cellular
activity at different time points or after different treatments of the cells. Thus different levels in
gene expression and regulation can be determined. For this purpose total cellular RNA of
mammalian cells was purified using a variation of the
guanidinium thiocyanate-phenol-chloroform extraction method described in 1987 by Piotr
Chomczynski and Nicoletta Sacchi (210). For purification about 5 * 106 cells were counted
and washed with PBS. Afterwards they were lyzed by pipetting up and down in 750 µL of
Tri-lysing buffer (0.8 M guanidinium thiocyanate, 0.4 M ammonium thiocyanate, 0.1 M
sodium acetate pH 5.0, 5 % glycerin, 48 % aqua-phenol pH < 5.0). The solution was
incubated for 5 min at room temperature and 200 µL of chloroform was added. A shaking
step for 30 sec using a vortex mixer followed. Subsequently the solution was incubated for
10 min at room temperature and organic and aqueous phase separated via a centrifugation
step for 20 min at room temperature and 13.300 rpm. The upper aqueous phase was shaken
out a second time with one volume of chloroform to enrich purity of RNA and to discard as
much DNA and protein contamination as possible. After the solution was shaken out for
15 sec using a vortex mixer the sample was separated again and spun down at 13.300 rpm
for 5 min. In the following the aqueous phase was transferred into a new tube and total RNA
precipitated with one to two volume(s) of isopropanol for 10-30 min at room temperature.
Total RNA was pelleted via centrifugation at 13.300 rpm for 30 min at 4 °C and the pellet
washed with 75 % ethanol. Finally RNA concentration was measured in a spectral
photometer (Thermo Fisher Scientific, Schwerte, Germany) following either a DNaseI
treatment (2.16.4) or total RNA was prepared for quantitative PCR measurements (2.15.8.3).
2.16.3 Phenol/chloroform extraction of RNA
DNaseI digested total RNA extracts (2.16.4) have to be purified via phenol/chloroform
extraction to get rid of protein and salt impurity. Sample material after DNaseI digestion was
formulated in a volume of 200 µL which is the minimum amount of starting volume. This
solution was mixed with one volume of aqua-phenol pH < 5.0 for RNA preparation. The
sample was shaken vigorously for 30-60 sec and then incubated for 5 min at room
temperature. Subsequently the sample was centrifuged for 5 min at 13.000 rpm using a
centrifuge and the upper aqueous phase transferred to a new tube. One volume of
chloroform was added and again the sample was shaken for 15 sec using a vortex mixer.
Another centrifugation step follows (5 min, 13.000 rpm, RT). Once again the upper aqueous
phase was pipetted into a new tube. RNA was precipitated by adding 1-2.5 volume(s) of

Materials and Methods
61
isopropanol right after sodium acetate had been added to the sample to reach a final
concentration of 0.3 M NaAc. Precipitation was performed for 10 min at room temperature
and RNA pelleted for 30 min at 4 °C and 13.000 rpm. To free the RNA pellet of salt ions, a
washing step with 75 % EtOH was included, followed by another centrifugation step. RNA
pellet was dried for 5 min and dissolved in 10-20 µL of double-distilled water. RNA
concentration was determined and calculated in a spectral photometer (Thermo Fisher
Scientific, Schwerte, Germany).
2.16.4 DNaseI digestion
To get rid of any DNA contamination, extracted total RNA (2.16.2) was digested with DNaseI
(Thermo Fisher Scientific, Schwerte, Germany). RNase-free DNaseI is able to digest
single- and double-stranded DNA by hydrolyzing phosphodiester bonds. Enzymatic activity
and thus cleavage efficiency is dependent on Ca2+ ions. For digestion of DNA in total RNA
prepared samples 1 µg of RNA was mixed with 1 U DNaseI and incubated for 30 min at
37 °C as described by the manufacturer’s protocol (Table 28). Afterwards DNaseI enzyme
was heat deactivated and an additional DNaseI digestion step was included, followed by
another phenol/chloroform extraction (2.16.3) to remove hydrolyzed DNA fragments, DNaseI
enzyme and salt ions.
Table 28: DNaseI digestion.
Ingredient Concentration Amount
RNA - 1 µg
DNaseI buffer 10x 10 µL
DNaseI, RNase-free
(Thermo Fisher Scientific) 50 U/µL 1 U
ddH20 - ad 100 µL
DNA digestion: 37 °C for 30 min
Inactivation of DNaseI: 65 °C for 10 min
DNaseI buffer 1x 25 µL
DNaseI, RNase-free
(Thermo Fisher Scientific) 50 U/µL 1 U
ddH20 - ad 250 µL
DNA digestion: 37 °C for 30 min
Phenol/chloroform extraction
2.16.5 Radiolabeling of the 5’-end of RNA
5’-end labeling of double-stranded siRNA or small single-stranded RNA oligonucleotides
(Table 29) was performed using the T4 polynucleotide kinase (Thermo Fisher Scientific,

Materials and Methods
62
Schwerte, Germany) isolated from E. coli T4 bacteriophage. This enzyme catalyzes the
transfer of a gamma-phosphate from [γ-32P]-ATP to the 5’-OH end of single- or
double-stranded nucleic acids.
Table 29: Oligonucleotides for 5’-end labeling.
Name of oligonucleotide Sequence 5’ 3’
VR1 siRNA (179) sense 5’- GCG CAU CUU CUA CUU CAA CdTdT
antisense 5’- GUU GAA GUA GAA GAU GCG CdTdT
pRNA 14-mer (211) 5’- GUU CGG UCA AAA CU
pRNA 8-mer (212) 5’- GUU CGG UC
The phosphorylation mixture was prepared as indicated in Table 30 using radiolabeled ATP
purchased at Hartmann Analytic GmbH (Braunschweig, Germany).
Table 30: Radiolabeling mixture.
Ingredient Concentration Amount
RNA oligonucleotide - 30 pmol
Reaction buffer A 10x 2 µL
[γ-32
P]-ATP 3000 Ci/mmol 3 µL
T4 PNK
(Thermo Fisher Scientific) 10 U/µL 1.5 µL
ddH20 - ad 20 µL
Phosphorylation reaction: 37 °C for 60 min
Purification: illustra MicroSpin G-25 spin columns
Afterwards the phosphorylation reaction was purified from unincorporated nucleotides using
illustra MicroSpin G-25 spin columns (GE Healthcare Life Sciences, Freiburg, Germany)
according to the manufacturer’s protocol. The radiolabeled RNA was eluted and the amount
of radioactivity and the efficiency of labeling reaction were measured in a
1900 CA TRI-CARB® Liquid Scintillation Analyzer (Perkin Elmer, MA, USA). Radiolabeled
RNA oligonucleotides were used to perform radioactive studies on PEI complexes (2.8.2.2,
2.16.6).
2.16.6 Determination of PEI complex formation efficacy
To determine the efficacy of PEI F25 LMW complex formation with nucleic acids or
LNA antiseeds, a radioactive assay was employed as described previously (213). 500 ng of
single-stranded RNA, 14- or 8-meric, or double-stranded siRNA were used, mixed with trace
amounts (104 Cerenkov cpm) of 5’-[32P]-end labeled siRNA, RNA 14-mer or RNA 8-mer

Materials and Methods
63
(Table 29) respectively. Complex formation was performed with the indicated amounts of
PEI F25 LMW (2.8.2.2). Samples were mixed with 5x DNA loading dye (10 mM Tris-HCl
pH 7.6), 80 % glycerol, 0.03 % bromophenol blue, 0.03 % xylene cyanol blue) and analyzed
in agarose gel electrophoresis (2.14.2.1). Complex formation was analyzed by
autoradiography (2.14.3.5) of the agarose gel for 3 h using a
Fuji FLA-3000 R Phosphorimager (Fujifilm, Germany). The ratio of free to partially and fully
complexed RNA was calculated using AIDA software (Version 3.45).
2.17 Atomic force microscopy
Atomic Force Microscopy (AFM) is a high-resolution type of scanning probe microscopy first
described in the 1980s by Binnig and Rohrer (214) as a technique to detect surfaces at an
atomic level. The technique uses piezoelectric elements that are able to facilitate tiny and
precise movements. This enables a very powerful and accurate measurement.
PEI/LNA complexes were analyzed by atomic force microscopy and were done with the help
of the working team of Prof. Dr. Bakowsky at the Institute of Pharmaceutical Technology and
Biopharmaceutics, Philipps-Universität Marburg, Germany. Complexes were prepared
(2.8.2.2) with 500 ng of LNA 14-mer 17-5p or LNA 8-mer (PS) and increasing amounts of
PEI F25 LMW. Complexes were directly transferred onto a silicon chip by dipping the chip
into the complex solution. AFM was performed on a vibration-damped NanoWizard (JPK
instruments, Berlin, Germany) as described in detail elsewhere (215). Commercially
available pyramidal Si3N4 tips (NSC16 AIBS, Micromasch, Estonia) mounted to a cantilever
with a length of 230 µm. A resonance frequency of about 170 kHz and a nominal force
constant of about 40 N/m were used. To avoid damage of the sample surface,
measurements were performed in intermitted contact. The scan speed was proportional to
the scan size and the scan frequency was between 0.5 and 1.5 Hz. Images were obtained by
displaying the amplitude signal of the cantilever in the trace direction and the height signal in
the retrace direction, both signals were simultaneously recorded. The complexes were
visualized either in height or in amplitude mode (512 x 512 pixels).
2.18 Bioinformatics and software tools
In this chapter important bioinformatical methods and software tools are listed which were
used throughout the complete work for this thesis.

Materials and Methods
64
2.18.1 GraFit™
The program GraFit™ (Version 5.0) is a data analysis software for Microsoft© Windows™
and was needed for creating scientific graphs depicted in most figures. GraFit™ is
programed by Robin J. Leatherbarrow (216) for Erithacus Software Ltd. (Horley, U.K.) and
provides the experimental scientist with a tool for visualization and analyses of existing data.
2.18.2 CorelDRAW® Graphics Suite
CorelDRAW® Graphics Suite is a graphic and image editing collection of the
Corel™ Corporation (Ottawa, Canada). In 1989 version 1.2 was released for
Microsoft© Windows™ computer systems and for this thesis version CorelDRAW®
release 11.0 was used. The software is based on vector graphics construction and was
applied for figure drawing.
2.18.3 Statistical analyses
2.18.3.1 R
Since 1993 the open source programming language R is available to use it for statistical
computing. This software was used to generate two-sided t-test analyses to identify
significant data in between the obtained values.
2.18.3.2 GraphPad Prism®
Another software program used for statistical analyses was GraphPad Prism® (Version 4.0)
available for Microsoft© Windows™. This tool was used by the group of Prof. Dr. Achim
Aigner to calculate Student’s t-test, 1-way ANOVA/Tukey’s multiple comparison posttests
and 2-way ANOVA/Bonferroni posttests.
2.18.4 NCBI
The National Center for Biotechnology Information (NCBI) was founded in 1988 through
legislation and harbors relevant information to biotechnology such as an index of biomedical
research articles in PubMed or PubMed Central, the genome sequencing data or the
GenBank. All researchers working in the field of biotechnology or molecular biochemistry use
the different information tools offered by the NCBI (http://www.ncbi.nlm.nih.gov/). Another
important tool being part of the NCBI is the BLAST sequence alignment tool. Designed in
1990 the Basic Local Alignment Search Tool (BLAST) (217) is a powerful program to search
for local alignments in different organisms comparing protein or DNA sequences which are
Materials and Methods
65
part of the GenBank with those being experimentally validated. To date it is the most often
used software tool worldwide analyzing biological data of sequenced material.
2.18.5 TargetScan
MiRNA target sites were predicted using the online software tool TargetScan Release 5.1
(http://www.targetscan.org/vert_50/) which is provided by the
Massachusetts Institute of Technology. The search page of TargetScan is available for
searching target sites in mammals or mouse sequences, but is also at hand for worm, fly and
fish based data search. Therefore the software is searching for the presence of conserved
8- or 7-mer nucleotide sites which match the seed region of individual miRNAs (218). The
program also includes the identification of seed sequences that have included mismatch
positions, but only if this mismatches can be compensated by a conserved 3’-pairing of the
miRNA (219). For searching in mammals the program ranks hits based on the predicted
efficacy of targeting which is calculated by using the context score of the sites including
site-type, 3’-pairing, local AU and position contribution (69). The software is permanently
improved and now version 6.2 is available.
2.18.6 MiRBase
The bioinformatical software program miRBase is available as an archive of microRNA
sequences and annotations (http://www.mirbase.org/). The biological database is hosted and
maintained at the University of Manchester and had been set up by the microRNA registry of
Sam Griffiths-Jones in 2004 (180). The miRBase registry provides the inclusion of novel
miRNA genes and helps to assign names (220). MiRBase can be used to search for
annotated miRNAs, while each entry represents a predicted hairpin of a miRNA transcript,
giving information about the location and sequence of the mature miRNA. This software tool
was used to search for mammalian miRNAs of interest e.g. to establish primer design for
miRNA quantification.
2.18.7 ClustalW and WebLogo
The Clustal series is a software tool for doing multiple sequence alignments of three or more
protein or DNA sequences (221). Started in 2003 ClustalW can be used to generate
phylogenetic trees and is available at the webserver of the European Bioinformatics Institute
(http://www.ebi.ac.uk/Tools/msa/clustalw2/). For the purpose needed in this thesis ClustalW
was used to generate multiple sequence alignments of promoter regions or of selected
3’-UTRs of different organisms to check sequence conservation of miRNA target sites. To

Materials and Methods
66
create a defined picture of conserved regions a WebLogo (222) was compiled. The
WebLogo software is designed to make sequence logos as easy as possible. They are
pictured as a graphical representation of amino acids or nucleic acids. In the WebLogo the
stack of each symbol and its corresponding height is dependent on the conservation of the
amino acid or nucleotide in the respective alignment.
2.18.8 PromPredict
To identify putative promoter sequence elements within the AT-rich region of C13orf25, the
software tool PromPredict (http://nucleix.mbu.iisc.ernet.in/prompredict/prompredict.html) was
used. This tool was designed in the Manju Bansal lab (223) to identify promoter regions in
genomic DNA sequences based on differences in DNA stability between neighboring
regions.
2.18.9 Neural Network Promoter Prediction
The Neural Network Promoter Prediction software tool is a program of the
Berkeley Drosophila Genome Project (http://www.fruitfly.org/seq_tools/promoter.html). In
2001 the software was generated by M.G. Reese (224). For this thesis the program was
used for promoter predictions of the AT-rich region within C13orf25 and helps to find putative
promoter elements.
2.18.10 McPromoter 006
McPromoter 006 is a statistical tool for the prediction of transcription start sites in eukaryotic
DNA and was initially developed by Uwe Ohler (225) in 1999
(http://tools.genome.duke.edu/generegulation/McPromoter/). The software tool was used to
predict intronic promoter regions within C13orf25.
2.18.11 Promoter 2.0 Prediction Server
Promoter 2.0 predicts is a software tool to predict transcription start sites of vertebrates
(http://www.cbs.dtu.dk/services/Promoter/) that was developed in 1998 by Steen Knudsen
(226) and was used search for transcription start sites within C13orf25.
2.18.12 CorePromoter
CorePromoter is a prediction program for transcription start sites based on a Quadratic
Discrimination Analysis of human core-promoters. The software tool was developed in 1998

Materials and Methods
67
by Michael Zhang (227) and the web-based software
(http://rulai.cshl.org/tools/genefinder/CPROMOTER/human.htm) was used to search for
promoter elements within the human C13orf25 AT-rich intronic region.

68
3 Results and Discussion
The following section is a summary of the scientific publications resulting from my research
work. The publications will be briefly resumed by topic in single chapters including a short
discussion about the results obtained. Detailed information concerning the results, materials,
and methods are given in the respective publications.
Results and Discussion
69
3.1 Project 1: The proto-oncogene PIM1 is a target of miR-33a in vitro and
in vivo (publication I and II)
Introduction
The PIM1 kinase belongs to a family of constitutively active serine/threonine kinases (133)
which fulfills important functions in cellular processes that are involved in malignant
transformation of cells (137) and as a consequence PIM1 is classified as a proto-oncogene.
Overexpression of this kinase is correlated with a poor prognosis in almost all hematopoietic
malignancies and solid cancers (133), in our study represented by the chronic myelogenous
leukemia cell line K562 and the colorectal adenocarcinoma cell line LS174T. PIM1 is a
promising target for therapeutic strategies in the treatment of cancer (133) because a large
number of PIM1 targets are involved in proliferation, differentiation and apoptosis to promote
tumorigenesis (138). To date small molecular compounds which compete for ATP-binding
have been designed to mediate post-translational regulation of the PIM1 kinase (160).
In our study, we revealed to use RNAi-mediated protein knockdown of PIM1 through
PIM1-specific siRNA and miRNA as a novel therapeutic approach for targeting PIM1 at the
mRNA level.
Results
For this purpose, we initially performed in silico screenings using bioinformatical tools to
search for putative miRNA binding sites within the PIM1 3’-UTR and indeed several of such
sites could be identified for the binding of e.g. the miRNAs miR-15a, miR-16-1 and miR-33a.
These three miRNAs have been further considered in the following in vitro experiments
because (i) miR-15a and miR-16-1, which are characterized by the same seed sequence,
are known as tumor suppressors via targeting of the anti-apoptotic B-cell lymphoma 2
(BCL2) protein and thus inducing apoptosis (80) and (ii) the highest conservation within the
putative miRNA binding sites in the PIM1 3’-UTR was shown for miR-33a including the seed
region as well as nt 13-17 of the miRNA.
Low expression levels of miR-33a in normal and cancer cell lines such as K562, LS174T,
Skov-3, HEK293, HUH7 or HepG2 do not refer to a direct correlation between a
tumor-suppressive function of endogenously expressed miR-33a in the regulation of PIM1
mRNA. However the high conservation of the miR-33a binding site in the PIM1 3’-UTR and
the overall low expression levels of this miRNA in the tested cancer cell lines suggested the
possibility to reduce PIM1 levels in tumor cells by transfection of commercially available

Results and Discussion
70
miRNA mimics (Dharmacon/Thermo Fisher Scientific). Indeed the transfection of
miR-33a mimics decreased PIM1 protein levels in the two tested cell lines K562 and LS174T
about 40-60 %, whereas miR-15a and miR-16-1 miRNA mimics failed in the downregulation
of PIM1 (Figure 11a).
Another highly ranked putative target of miR-33a is the cell cycle regulator
cyclin dependent kinase 6 (CDK6) harboring two conserved putative miR-33a binding sites
within the PIM1 3’-UTR. CDK6 is associated with D-type cyclins and involved in cell cycle
progression by regulating G1/S transition (228). We asked if CDK6 is also regulated by
miR-33a, but we could not validate CDK6 as a target of miR-33a in K562 cells (Figure 11b).
In a mouse system, the tumor suppressor p53 (TP53) (229) was found to be a target of
miR-33a. However we could not confirm this result in LS174T cells (Figure 11c). Another
published target of miR-33a is the ATP-binding cassette transporter A1 (ABCA1) (230),
(231). Reduction of ABCA1 protein levels could not be tested in the two cell lines due to an
overall too low endogenous expression of ABCA1 protein.
Figure 11: Human PIM1 is a target of miR-33a. (a) In K562 cells PIM1 is downregulated by a miR-33a mimic, while miR-15a and miR-16-1 mimics as well as the control mimic have no measurable effects on PIM1 protein expression levels. ß-Actin serves as an internal loading control. (b) Knockdown efficacy of a miR-33a mimic after transfection into K562 cells. PIM1 expression levels are substantial decreased, whereas no effect was detected for the highly predicted target CDK6. ß-Actin serves as an internal loading control. (c) In LS174T cells knockdown efficacy of a miR-33a mimic was detected. A substantial decrease of protein expression was observed for PIM1. Although TP53 was reported to be a target of miR-33a in the mouse system (229), we were unable to detect a significant repression of human TP53. ß-Actin serves as an internal loading control.

Results and Discussion
71
The specificity of miR-33a binding to the 3’-UTR of PIM1 was shown (i) by luciferase reporter
assays as well as (ii) ectopic PIM1 expression in PIM1 negative cells. (i) A reporter vector
containing the PIM1 3’-UTR behind a firefly luciferase showed substantial downregulation of
luciferase activity after co-transfection with a miR-33a mimic, whereas the repression effects
were abrogated when using a seed-mutagenized variant of the reporter (Figure 12a).
(ii) Ectopic PIM1 expression was performed in the ovarian carcinoma cell line Skov-3 to
further substantiate that miR-33a specifically and directly represses PIM1 expression. In fact,
Western Blot experiments confirmed downregulation of ectopic expressed PIM1 protein
levels by miR-33a. A loss of responsiveness was seen either for a seed-mutagenized
construct or a PIM1 cDNA clone lacking large parts of the PIM1 3’-UTR (Figure 12b).
Figure 12: MiR-33a-specific regulation of PIM1 expression. (a) K562 cells were co-transfected with the control mimic or a miR-33a mimic and a reporter plasmid containing the PIM1 3’-UTR or a seed-mutagenized variant fused to the luciferase coding region respectively. Data represent mean values derived from at least three independent experiments (+/- S.E.M.). (b) Effects of the miR-33a mimic and a PIM1-specific siRNA on ectopic PIM1 expression were detected in Western Blot experiments. Therefore a full-length PIM1 cDNA clone, a miR-33a target site mutagenized variant (seed mut) or a vector lacking large parts of the 3’-UTR of PIM1 (Δ 3’-UTR) were co-transfected with a control siRNA (si con.), a PIM1-specific siRNA (si PIM1), a control mimic (c-mimic) or a miR-33a mimic into Skov-3 cells. ß-Actin serves as an internal loading control.

Results and Discussion
72
To further characterize the miR-33a-dependent downregulation of PIM1 protein levels, we
compared the observed effect with a knockdown mediated by a PIM1-specific siRNA.
Although the siRNA transfection resulted in an even more efficient knockdown of PIM1, the
time-dependent decrease of protein levels of miR-33a and a PIM1-specific siRNA in K562
cells were similar and still present after 96 h post-transfection (Figure 13).
Figure 13: Long-term effects of PIM1 knockdown by the miR-33a mimic. Comparison of the PIM1 knockdown persistence for the miR-33a mimic versus the PIM1-specific siRNA detected 24, 72 and 96 h post-transfection.
As it has been reported that PIM1 is involved in the regulation of cell proliferation in K562
cells (157), we hypothesized that a negative effect on proliferation might be associated with
the biological relevance of the observed miR-33a effects. Indeed an anti-proliferative effect
could be verified in the two investigated cell lines K562 and LS174T either for a
PIM1-specific siRNA or the miR-33a mimic (data not shown).
So far we have established PIM1 as a target of miR-33a, thus opening up the possibility to
further investigate the proto-oncogene PIM1 in an anti-cancer approach using the
tumor-suppressive miR-33a for miRNA replacement therapy. For this reason we started
formulation of miR-33a with the cationic branched polyethylenimine PEI F25 LMW which has
been previously established as excellent in vivo delivery agent for siRNAs in mouse tumor
models (176). To assess the therapeutic anti-tumor activity of miR-33a, a subcutaneous
LS174T colon carcinoma xenograft mouse model was generated and treated by systemic
injection of the PEI/miR-33a complexes. The systemic PEI/miR-33a replacement therapy
resulted in a significant reduction in tumor growth of about 40 % (Figure 14a,c). Consistent
with the inhibition of tumor growth, a reduction of PIM1 protein levels could be determined
during the analysis of the tumors after termination of the experiment (Figure 14b). During the
experimental period of PEI/miR-33a treatment no reduction in body weight of the mice was

Results and Discussion
73
detectable. Furthermore induction of immune responses, any hepatotoxicity or other
unwanted side effects of miR-33a replacement therapy was not observed.
Figure 14: Antitumor effects of systemic PEI/miR-33a treatment in LS174T tumor xenografts. (a) Inhibition of tumor growth of systemically injected PEI/miR-33a complexes compared with negative control treated mice. (b) Analysis of the tumor xenografts upon termination of the experiment reveals a reduction of PIM1 protein levels upon PEI/miR-33a treatment in comparison to a control treatment. (c) Representative examples of treated mice.
Discussion
In our study miR-33a has been established as a miRNA being implicated in tumor
progression in vitro and in vivo. It was shown in luciferase reporter assays as well as in
Western Blot experiments that the oncogenic kinase PIM1 is a specific target of
tumor-suppressive miR-33a. Likewise transfection of miR-33a mimics decelerated
proliferation and polyethylenimine-based miRNA replacement therapy successfully reduced
tumor growth without unwanted side effects in a xenograft mouse model of colon cancer.
Human miR-33a and related miR-33b are encoded in the intron of human
sterol regulatory element binding protein 2 (SREBP2) on chromosome 22 and SREBP1 on
chromosome 17 and are transcribed together with the host gene respectively. SREBPs are
key regulators in lipid metabolism and homeostasis. Recently it was reported that both,
miR-33a and miR-33b, are involved in the regulation of cholesterol biosynthesis and uptake,
repressing proteins like ABCA1 (230), (231) which is involved in cholesterol efflux.
Antagonism of miR-33a/b with antisense oligonucleotides has been shown to mediate
reverse cholesterol transport and regression of atherosclerosis in mice (232). In non-human

Results and Discussion
74
primates a study was initiated to establish a therapeutic approach against dyslipidemia in
cardiovascular disease risk. After inhibition of miR-33a/b with a 2’-F/MOE modified
phosphorothioate antisense oligonucleotide, plasma high-density lipoprotein (HDL) levels of
the monkeys were raised and very-low-density-lipoprotein (VLDL) triglycerides were lowered
(233). However a long-term antimiR-33 study in high-fat, high-cholesterol-fed Ldlr-/- mice
failed to prevent progression of atherosclerosis (234), maybe due to the absence of miR-33b
in rodents.
In our study we have demonstrated that PIM1 is a genuine target of miR-33a, although we
have not yet identified the biological constellation(s) under which miR-33a levels are
overexpressed to directly repress endogenous PIM1. Expression of miR-33a/b is generally
low (230) either in normal or cancer tissues and is associated with SREBP transcription.
Therefore a linkage between cholesterol homeostasis and cell proliferation seems to be the
most obvious constellation to identify a natural context of miR-33a-dependent PIM1
regulation. There are also other biological circumstances where PIM1 is upregulated. For
example PIM1 has cardioprotective effects which are mediated through an overexpression in
cardiac progenitor cells (235), (236). As another example PIM1 is induced during the
development of monocytes to macrophages (own observations). However miR-33a has not
been analyzed under these conditions. The tumor suppressor activity of miR-33a/b has also
been shown for the regulation of the oncogene MYC (237). In medulloblastoma cells a
statin-induced upregulation of miR-33b substantially decreased cellular MYC protein levels
and for this reason presents a promising therapeutic option against cancers involving MYC
overexpression (237). SREBP expression has also been implicated in the regulation of the
cell cycle (238) and thus a connection between miR-33a and cell cycle progression has been
reported in the liver cell line HUH7. In this context CDK6 and cyclin D1 (CCND1) have been
established as targets of miR-33a reducing cell proliferation and arresting the cell cycle in
G1 phase (239).
Taken together, these findings emphasize an essential role of miR-33a in the cellular
connection of several molecular pathways. In addition cell-type and tissue-specific regulatory
pathways as well as expression levels of miR-33a seem to be crucial and regulation of
miR-33a/b in therapeutic approaches has to be well-balanced. However our PEI/miR-33a
replacement strategy showed antitumor effects in vivo and an accumulation of delivered
miRNAs in tumor tissues has been shown (28). Ultimately personalized therapy and targeted
delivery is preferable in order to reduce side effects and extensive research in this field
should be promoted.

Results and Discussion
75
3.2 Project 2: Novel seed-directed LNA antimiRs as potent miRNA inhibitors
in vitro (publication III)
Introduction
MiRNA expression differs in normal and cancer tissues (39) and overexpression of
oncogenic miRNAs is often associated with malignant transformation and tumorigenesis
(100). One important oncogenic miRNA cluster is the miR-17-92 cluster that can promote
proliferation and is involved in the inhibition of apoptosis (88). MiRNAs of this cluster, miR-17
and miR-20a, have been reported to post-transcriptionally control the cell cycle regulator P21
(240), an important and well-characterized cyclin-dependent kinase inhibitor with tumor
suppressor activity (241). The inhibition of oncogenic miRNAs to modulate oncogenic
pathways is a promising therapeutic strategy in the prevention and treatment of cancer.
AntimiR design is a challenging task because there are several chemical modifications
available to enhance resistance against cellular nucleases and to increase the binding affinity
to the target miRNA of interest (109). To date a safe and efficient delivery of antimiRs is still
the main bottleneck. Successful in vivo delivery of antagomiRs (124) which are conjugated
with cholesterol to improve their cellular uptake has been reported. Moreover tiny LNAs (126)
which harbor a phosphorothioate (PS) backbone can also be delivered without any
formulation in a mouse tumor model. A formulated delivery of unconjugated antimiRs has not
been explored so far.
In our study we scrutinized a novel class of potent miRNA inhibitors: single-stranded short
LNA oligonucleotides harboring a natural phosphodiester backbone (PO), henceforth termed
LNA antiseeds (PO). We tested length-dependent miRNA inhibition of several LNA antiseeds
to explore even miRNA family targeting. Furthermore we established complex and
nanoparticle formation of the LNA antiseeds with the cationic branched polyethylenimine
PEI F25 LMW to enable the delivery into a broad spectrum of tissues and organs.
Results
As a first experimental approach we determined the minimum LNA antiseed (PO) length
which is needed for the inhibition of miRNA function. Thus we investigated inhibitory effects
of 8-, 10-, 12-, and 14-meric LNA antiseeds (PO) against miRNA let-7a. For this purpose we
cloned a hsa-let-7a target sequence in the 3’-UTR of a luciferase reporter gene (Promega);
as a control we replaced the sequence by an inverted hsa-let-7a target sequence. The
inhibitory effect of miRNA let-7a in HeLa cells was shown by a derepression of the luciferase

Results and Discussion
76
activity. Only weak effects were obtained with the 8- or 10-meric LNA antiseeds (PO) (data
not shown), whereas 12- and 14-meric LNA antiseeds (PO) efficiently derepressed the
luciferase reporter even in low concentration ranges of 1-20 nM (Figure 15). As a negative
control we used an unspecific and unrelated 14-mer LNA oligonucleotide directed against
bacterial RNaseP (182). A commercially available antimiR against let-7a, designed as a
miRNA hairpin inhibitor (181), served as in internal positive control for derepression of the
reporter system (Figure 15).
Figure 15: LNA antiseeds (PO) as miRNA inhibitors. Comparison of 12- and 14-meric LNA antiseeds (PO) with a commercially available hairpin inhibitor (hp inhib.) targeting a hsa-let-7a luciferase reporter at the indicated concentrations. As a control an unrelated LNA 14-mer (LNA con.) was used. Values are derived from at least three independent experiments (+/- S.E.M.) after co-transfection into HeLa cells.
In a second approach we determined derepression activity of LNA antiseeds (PO) by the
investigation of an endogenously expressed target gene. Therefore derepression of basal
protein levels of the tumor suppressor P21 was analyzed in the erythroleukemia cell line
K562. This cell line expresses P21 mRNA, but protein levels are barely sufficient for the
detection in Western Blot experiments. Recently it has been reported that P21 is
post-transcriptionally regulated by miRNAs of the miR-106b family (240) e.g. miR-17 and
miR-20a. We therefore hypothesized that miR-17 and miR-20a, which are overexpressed in
K562 cells (103), repress endogenous P21 protein levels in the indicated cell line. To test
this, 14-meric LNA antiseeds (PO) directed against the two miRNAs were transfected into
K562 cells, and indeed caused substantial increase of P21 protein levels in comparison to an
unrelated LNA control. The effect of raised P21 protein levels mediated by the
LNA antiseeds (PO) was persistent and could still be detected 120 h after a single
transfection of the LNA antiseeds (PO) (Figure 16a). The specificity of the observed
LNA antiseed (PO) effect was analyzed with a luciferase reporter vector (Promega). For this
purpose, the 3’-UTR of P21 and a seed-mutagenized variant were cloned behind the firefly

Results and Discussion
77
luciferase of the reporter vector. As a positive control, commercially available miRNA hairpin
inhibitors (181) were compared with the LNA antiseeds (PO). At a concentration of 10 nM the
derepression of luciferase activity was not as substantial as it was observed with the
LNA antiseeds (PO) directed against miR-17 and miR-20a. Moreover the combination of
equimolar concentrations of the hairpin inhibitors enhanced derepression of the reporter that
was now comparable to the effect of the single LNA antiseeds (PO) (Figure 16b). These
findings implied that LNA antiseeds (PO) are able to inhibit and block miRNAs of the same
family, whereas miRNA inhibitors are more specific to a single miRNA. As a further positive
control, we tested a tiny LNA directed against the seed region of miR-17/20a, and indeed
found highly efficient derepression of the reporter system (Figure 16b), but also a slight
increase in luciferase activity for the seed-mutagenized reporter construct (Figure 16c)
implicating slight non-specific effects.
Figure 16: Specific inhibitory effects of LNA antiseeds (PO) against the miR-106b family. (a) Duration of P21 derepression by LNA antiseeds (PO) versus hairpin inhibitors (hp inhib.). Expression of basal P21 protein levels were analyzed by Western Blot after transfection of the antimiRs into K562 cells. (b) Specific derepression activity of the indicated miRNA inhibitors after co-transfection with the P21 3’-UTR luciferase reporter into HeLa cells. Luciferase activity values are derived from at least three independent experiments (+/- S.E.M.). (c) Effects of the indicated miRNA inhibitors on luciferase expression using the seed-mutated version of the reporter in HeLa cells. Values are derived from at least three independent experiments (+/- S.E.M.).
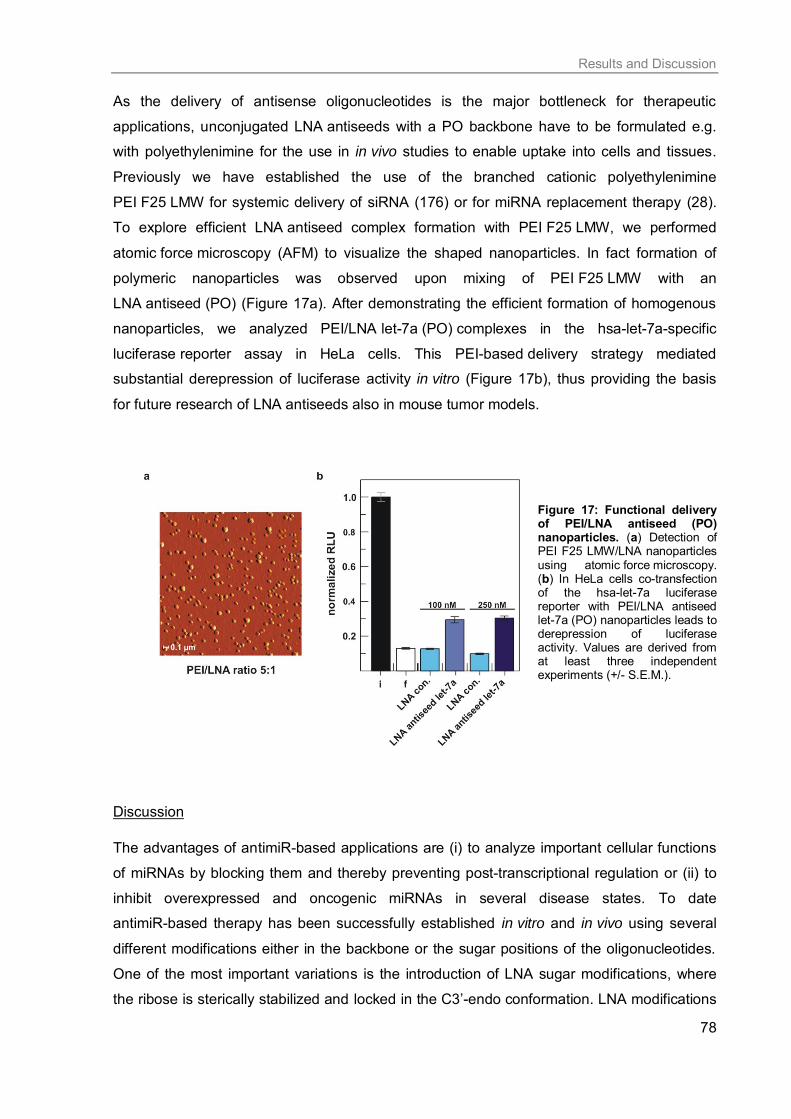
Results and Discussion
78
As the delivery of antisense oligonucleotides is the major bottleneck for therapeutic
applications, unconjugated LNA antiseeds with a PO backbone have to be formulated e.g.
with polyethylenimine for the use in in vivo studies to enable uptake into cells and tissues.
Previously we have established the use of the branched cationic polyethylenimine
PEI F25 LMW for systemic delivery of siRNA (176) or for miRNA replacement therapy (28).
To explore efficient LNA antiseed complex formation with PEI F25 LMW, we performed
atomic force microscopy (AFM) to visualize the shaped nanoparticles. In fact formation of
polymeric nanoparticles was observed upon mixing of PEI F25 LMW with an
LNA antiseed (PO) (Figure 17a). After demonstrating the efficient formation of homogenous
nanoparticles, we analyzed PEI/LNA let-7a (PO) complexes in the hsa-let-7a-specific
luciferase reporter assay in HeLa cells. This PEI-based delivery strategy mediated
substantial derepression of luciferase activity in vitro (Figure 17b), thus providing the basis
for future research of LNA antiseeds also in mouse tumor models.
Figure 17: Functional delivery of PEI/LNA antiseed (PO) nanoparticles. (a) Detection of PEI F25 LMW/LNA nanoparticles using atomic force microscopy. (b) In HeLa cells co-transfection of the hsa-let-7a luciferase reporter with PEI/LNA antiseed let-7a (PO) nanoparticles leads to derepression of luciferase activity. Values are derived from at least three independent experiments (+/- S.E.M.).
Discussion
The advantages of antimiR-based applications are (i) to analyze important cellular functions
of miRNAs by blocking them and thereby preventing post-transcriptional regulation or (ii) to
inhibit overexpressed and oncogenic miRNAs in several disease states. To date
antimiR-based therapy has been successfully established in vitro and in vivo using several
different modifications either in the backbone or the sugar positions of the oligonucleotides.
One of the most important variations is the introduction of LNA sugar modifications, where
the ribose is sterically stabilized and locked in the C3’-endo conformation. LNA modifications

Results and Discussion
79
enable an increase of target affinity by enhancing the melting temperature (Tm) of the
oligonucleotide (115),(242). It has been reported that the dissociation constant of LNA/RNA
hybrids, which can be determined as koff value, is dramatically reduced (243), and thus
LNA oligonucleotides are very efficient and persistent in blocking RNA functionality. A better
resistance against cellular nucleases has been shown that is further increased by the
introduction of phosphorothioate linkages (105), (244). Despite this advantage, a
phosphorothioate modified antisense oligonucleotide has some disadvantages such as a
non-specific binding to cellular proteins associated with toxic side effects (245), (244).
Preferentially oligonucleotides harboring a natural phosphodiester backbone should be used
for systemic application because they show no toxicity or any side effects (28), (244).
However antimiRs with a phosphorothioate backbone can be delivered unconjugated;
nevertheless a formulation of the LNA antiseeds (PO) with the cationic branched
polyethyleneimine PEI F25 LMW has many advantages. PEI polymers are able to (i) protect
the incorporated nucleic acids against nucleases, (ii) mediate the cellular uptake and
(iii) trigger the release of the oligonucleotides into the cytoplasm via a proton/sponge effect
(246). Furthermore in miRNA replacement therapy the cationic branched PEI F25 LMW has
proven a targeted delivery of the nucleic acids into tumor tissues causing neither toxicity nor
an increase of hepatic enzymes or any immunostimulatory effects (28). Thus
polyethyleneimine formulated miRNA-based LNA antiseed (PO) therapy is a promising
option to inhibit oncogenic miRNAs and should be further investigated in in vivo tumor mouse
models of different cancer types.

Results and Discussion
80
3.3 Project 3: Transcriptional regulation of the human miR-17-92 cluster
(manuscript in preparation IV)
Introduction
The oncogenic miRNA cluster miR-17-92 is one of the best characterized human miRNA
clusters and encodes six miRNAs, namely miR-17, miR-18a, miR-19a, miR-20a, miR-19b
and miR-92a. Also referred to as oncomiR-1 or C13orf25, miR-17-92 is associated with
hematopoietic malignancies and solid cancers (96). Overexpression of the cluster promotes
proliferation, inhibits apoptosis and accelerates angiogenesis (88). Analyses to study
transcriptional regulation of miRNAs or miRNA clusters are necessary and relevant to
develop novel strategies aiming at cancer prevention. Unfortunately only few miRNA
promoters have been identified or closer characterized to date (169). Transcription of the
polycistronic miR-17-92 cluster has been shown to be in part controlled by an E2F-regulated
host gene promoter with E2F3 being the main E2F variant associated with the host gene
promoter (167), (166). Additionally transcription originates from an intronic AT-rich region
directly upstream of the miRNA coding region (169) which had been determined by
nucleosome mapping combined with chromatin signatures to identify transcriptionally active
promoters (247), (248), (249). Cluster expression originating from the intronic AT-rich region
is activated by the transcription factor MYC that binds to a conserved E-box element (E3)
approximately 1.5 kb upstream of the miR-17-92 coding sequence (87), (91), (248).
In our study we scrutinized promoter activity emanating from the intronic AT-rich region. ChIP
experiments identified the proto-oncogene PIM1 and one of its phosphorylation targets
HP1G (155) to be associated with the chromatin region comprising the functional
MYC-binding site. SiRNA-mediated knockdown of PIM1 protein resulted in decreased levels
of pri-mir-17-92 transcript levels. Both results provide evidence that the miR-17-92 cluster
belongs to those 20 % of all MYC regulated genes that show a synergism with the oncogenic
kinase PIM1 (159).
Results
As a first experimental approach we analyzed MYC-dependent transcriptional activation of
the intronic AT-rich sequence. Therefore we cloned several pGL3 control luciferase reporter
constructs (Promega) that were generated from the intronic AT-rich promoter region (Figure
18a). After transfection into K562 and HeLa cells, expressing the miR-17-92 cluster at very
high and high levels (data not shown), we evaluated transcriptional activity of this putative

Results and Discussion
81
promoter region. Indeed we showed MYC-dependent transcriptional activity emanating from
the intronic AT-rich region (1.5 kb construct). A knockdown of MYC protein levels (K562
cells) or a truncated reporter variant lacking the functional MYC binding site E3 (625 bp
construct) caused substantial downregulation of luciferase activity of about 4.5-fold in K562
and almost 20-fold in HeLa (Figure 18b). This finding supports the assumption that MYC
binding to the E3 site plays a central role in activating transcription of miR-17-92. We further
shortened the promoter constructs including elements with their 3’-boundary approximately
290 bp upstream of the mature miR-17-5p coding sequence due to basal promoter activity
obtained with the 625 bp construct. As controls we included the pGL3 control reporter vector
lacking the SV40 promoter sequence as well as a construct with comparable AT-content
(inverted 339 bp construct) (Figure 18a,b). In contrast to the inverted 339 bp construct all
fragments which are shorter than ~340 bp conferred residual promoter activity indicating that
parts of the intronic promoter region promote specific transcriptional activity (Figure 18b).
Figure 18: MYC-dependent intronic transcriptional activity of the human C13orf25 locus. (a) Schematic representation of different C13orf25 segments fused to the luciferase gene. The functional MYC binding site (E3) is indicated in the 1.5 kb construct (white box). (b) Promoter activities of the different promoter reporter constructs in K562 and HeLa cells. Obtained luciferase activities were normalized to the pGL3 control vector (Promega). RLU values of the individual constructs were derived from 5 to 16 experiments (+/- S.E.M.).
Next we considered if other factors beyond MYC may be involved in transcriptional regulation
of the human miR-17-92 cluster. Indeed ChIP assays of the functional MYC binding site in
the AT-rich promoter region confirmed not only association of MYC to this chromosomal
area. Further we identified the oncogenic kinase PIM1 as well as its phosphorylation target
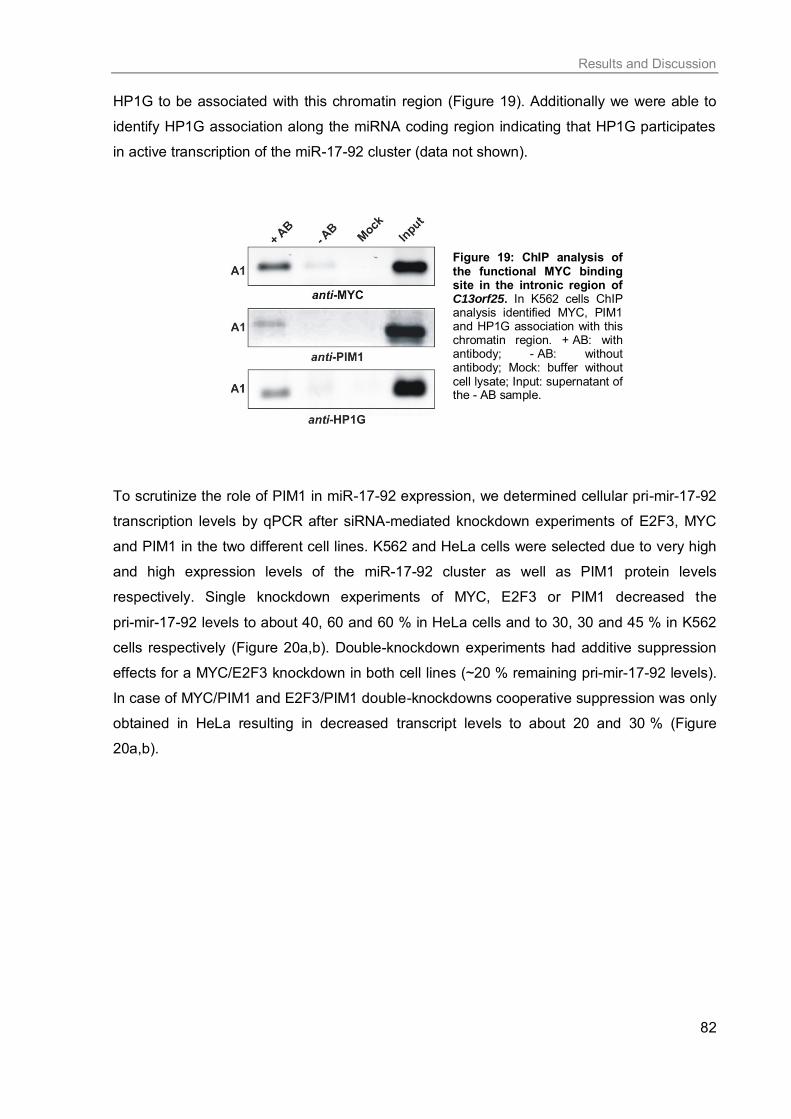
Results and Discussion
82
HP1G to be associated with this chromatin region (Figure 19). Additionally we were able to
identify HP1G association along the miRNA coding region indicating that HP1G participates
in active transcription of the miR-17-92 cluster (data not shown).
Figure 19: ChIP analysis of the functional MYC binding site in the intronic region of C13orf25. In K562 cells ChIP analysis identified MYC, PIM1 and HP1G association with this chromatin region. + AB: with antibody; - AB: without antibody; Mock: buffer without cell lysate; Input: supernatant of the - AB sample.
To scrutinize the role of PIM1 in miR-17-92 expression, we determined cellular pri-mir-17-92
transcription levels by qPCR after siRNA-mediated knockdown experiments of E2F3, MYC
and PIM1 in the two different cell lines. K562 and HeLa cells were selected due to very high
and high expression levels of the miR-17-92 cluster as well as PIM1 protein levels
respectively. Single knockdown experiments of MYC, E2F3 or PIM1 decreased the
pri-mir-17-92 levels to about 40, 60 and 60 % in HeLa cells and to 30, 30 and 45 % in K562
cells respectively (Figure 20a,b). Double-knockdown experiments had additive suppression
effects for a MYC/E2F3 knockdown in both cell lines (~20 % remaining pri-mir-17-92 levels).
In case of MYC/PIM1 and E2F3/PIM1 double-knockdowns cooperative suppression was only
obtained in HeLa resulting in decreased transcript levels to about 20 and 30 % (Figure
20a,b).

Results and Discussion
83
Figure 20: Transcriptional activity of the human miR-17-92 cluster after RNAi-mediated knockdown of regulatory proteins. (a) Quantitative PCR of pri-mir-17-92 levels in HeLa cells after single- and double-knockdown experiments of MYC, E2F3 and PIM1. 2^-ΔΔpri-mir-17-92 values were normalized against 5S rRNA and an internal control siRNA (179) and were obtained from at least three independent experiments (+/- S.E.M.). Statistical analyses were done using the software R (250). (b) Transcription levels of pri-mir-17-92 levels in K562 after single- and double-knockdown experiments of the respective proteins. QPCR results were normalized against 5S rRNA and an internal control siRNA (179) and were obtained from at least three independent experiments (+/- S.E.M.). Statistical analysis was done using the software R (250).
Discussion
In our study the intronic AT-rich region preceding the miR-17-92 cluster was scrutinized in
more detail than it was done in previous work (169), (248), (249) additionally regarding an
siRNA-mediated knockdown of MYC protein on transcription. The obtained effect was similar
to the one observed after truncation of the functional MYC binding site E3. These findings
substantiate the conception that the E3 site plays an important role in activating transcription
emanating from the intronic promoter region of C13orf25. However even smaller promoter
fragments still showed substantial, but specific transcriptional activation being independent of
the functional MYC site. This MYC-independent activation was more pronounced in K562
cells due to the particularly high miR-17-92 cluster expression indicating cell type-specific
differences in cluster expression. Our reporter assay data suggest multiple TSSs within this
AT-rich region, although the predicted transcription initiation region approximately 0.2 kb
downstream of the E3 box (169) may well be the major one.
Colocalization of MYC, the proto-oncogene PIM1 and its phosphorylation target HP1G to the
chromatin region harboring the functional MYC binding site was shown in ChIP analysis.
Importantly it has been reported that PIM1-catalyzed phosphorylation of H3S10 at MYC

Results and Discussion
84
activated target genes is required for MYC-dependent oncogenic transformation (251). Three
paralogs of HP1 proteins in mammals regulate heterochromatin formation, gene silencing or
gene activation (252), (156). The role of HP1G has not been fully understand, but it has been
reported that HP1G is found in association with euchromatin (253), active genes (156) and
can further be recruited to inducible promoters where it replaces HP1B to induce a switch
from the repressive to the active transcriptional state (254). The replacement by HP1G
requires H3 phospho-acetylation and a transient phosphorylation of H3S10 via aurora kinase
B (AURKB) was shown to be essential for dissociation of HP1 proteins from chromatin during
M-phase of the cell cycle (255). Our ChIP data of HP1G provide evidence for an activating
role of HP1G during transcription. The identification of HP1G along the miR-17-92 coding
region is to our knowledge the first indication that HP1G is involved in the activation of
miRNA gene transcription. Recently it has been reported that HP1G can also be localized
within coding regions of protein genes together with elongating RNA polymerase II (POLR2)
(254).
Association of PIM1 with the E3 site in the intronic chromosomal region of C13orf25 gave
rise to the assumption that PIM1 plays a crucial role in transcriptional activation of the
miR-17-92 cluster. RNAi-mediated knockdown experiments including MYC, PIM1 and E2F3
downregulation indicate that all three proteins are important for cluster expression.
Transcription is affected either from the host gene promoter by E2F3 or the intronic promoter
region regulated by MYC and PIM1. Of course, we cannot exclude indirect effects that have
contributed as well such as effects originating from inhibition of cell proliferation (PIM1),
changes in the kinetics of miRNA processing and global changes in transcriptional networks
or mutual transactivation (E2F3 and MYC) (256), (257), (258). Besides it has been reported
that miR-17-5p and miR-20a are negative regulators of E2F1-3 mRNAs (91), (166). A major
finding of our study is the involvement of the oncogenic kinase PIM1 in the regulation of
miR-17-92 expression. This is inferred from its MYC-dependent recruitment to the E3 site in
the intronic promoter region and a strong negative effect of a PIM1 knockdown on
endogenous cluster expression. Moreover double-knockdown experiments revealed a
synergistic effect compared to individual MYC and PIM1 knockdowns in HeLa cells.
Further investigations and extended research regarding transcriptional control of miRNA
promoters could provide profound evidences for better understanding the complex network
between miRNA expression and the development of cancer.

85
4 References
1. Hanahan, D. and Weinberg, R. A. (2011) Hallmarks of cancer: the next generation. Cell 144, 646–74
2. Hanahan, D. and Weinberg, R. A. (2000) The Hallmarks of Cancer. Cell 100, 57–70
3. Nowell, P. C. (1976) The clonal evolution of tumor cell populations. Science 194, 23–8
4. Visvader, J. E. (2011) Cells of origin in cancer. Nature 469, 314–22
5. David, A. R. and Zimmerman, M. R. (2010) Cancer: an old disease, a new disease or something in between? Nature Reviews.Cancer 10, 728–33
6. Sandison, A. T. (1967) Diseases in Anitquity. American Journal of Physical Anthropology, 105–106
7. Merlo, L. M. F., Pepper, J. W., Reid, B. J. and Maley, C. C. (2006) Cancer as an evolutionary and ecological process. Nature Reviews.Cancer 6, 924–35
8. Lazebnik, Y. (2010) What are the hallmarks of cancer? Nature Reviews.Cancer 10, 232–233
9. www.cancer.gov
10. Krebs in Deutschland 2007/2008 8. Ausgabe (2012) Robert Koch Institut; Gesellschaft der epidemiologischen Krebsregister in Deutschland e.V.
11. Doll, R. and Peto, R. (1981) The causes of cancer: quantitative estimates of avoidable risks of cancer in the United States today. Journal of the National Cancer Institute 66, 1191–308
12. Colditz, G. A., Sellers, T. A. and Trapido, E. (2006) Epidemiology - identifying the causes and preventability of cancer? Nature Reviews.Cancer 6, 75–83
13. Renan, M. J. (1993) How many mutations are required for tumorigenesis? Implications from human cancer data. Molecular Carcinogenesis 7, 139–46
14. Hollstein, M., Sidransky, D., Vogelstein, B. and Harris, C. C. (1991) p53 Mutations in Human Cancers. Science 253, 49–53
15. Croce, C. M. (2008) Oncogenes and cancer. The New England Journal of Medicine 358, 502–11
16. http://www.enzyklo.de/Begriff/Tumorsuppressorgene
17. http://www.krebsgesellschaft.de/krebsentstehung
18. Kasinski, A. L. and Slack, F. J. (2011) MicroRNAs en route to the clinic: progress in validating and targeting microRNAs for cancer therapy. Nature Reviews.Cancer 11,
849–64
19. Esquela-Kerscher, A. and Slack, F. J. (2006) Oncomirs - microRNAs with a role in cancer. Nature Reviews.Cancer 6, 259–69
20. Grubbe, E. (1957) Pioneer in X-ray therapy. Science 125, 18–19
21. Cao, Y., DePinho, R. A., Ernst, M. and Vousden, K. (2011) Cancer research: past, present and future. Nature Reviews.Cancer 11, 749–54
22. De Bono, J. S. and Ashworth, A. (2010) Translating cancer research into targeted therapeutics. Nature 467, 543–9
23. Sawyers, C. (2004) Targeted cancer therapy. Nature 432, 294–7
24. Imai, K. and Takaoka, A. (2006) Comparing antibody and small-molecule therapies for cancer. Nature Reviews.Cancer 6, 714–27
25. Scott, A. M., Wolchok, J. D. and Old, L. J. (2012) Antibody therapy of cancer. Nature Reviews.Cancer 12, 278–87

References
86
26. Lu, J., Getz, G., Miska, E. A., Alvarez-Saavedra, E., Lamb, J., Peck, D., Sweet-Cordero, A., Ebert, B. L., Mak, R. H., Ferrando, A. A., Downing, J. R., Jacks, T., Horvitz, H. R. and Golub, T. R. (2005) MicroRNA expression profiles classify human cancers. Nature 435, 834–8
27. Ryan, B. M., Robles, A. I. and Harris, C. C. (2010) Genetic variation in microRNA networks: the implications for cancer research. Nature Reviews.Cancer 10, 389–402
28. Ibrahim, A. F., Weirauch, U., Thomas, M., Grünweller, A., Hartmann, R. K. and Aigner, A. (2011) MicroRNA replacement therapy for miR-145 and miR-33a is efficacious in a model of colon carcinoma. Cancer Research 71, 5214–24
29. Lindow, M. and Kauppinen, S. (2012) Discovering the first microRNA-targeted drug. The Journal of Cell Biology 199, 407–12
30. He, L. and Hannon, G. J. (2004) MicroRNAs: small RNAs with a big role in gene regulation. Nature Reviews.Genetics 5, 522–31
31. Fire, A., Xu, S., Montgomery, M. K., Kostas, S. A., Driver, S. E. and Mello, C. C. (1998) Potent and specific genetic interference by double-stranded RNA in Caenorhabitis elegans. Nature 391, 806–811
32. Sharp, P. A. (2001) RNA interference - 2001. Genes & Development 15, 485–90
33. Lee, R. C., Feinbaum, R. L. and Ambros, V. (1993) The C. elegans heterochronic gene lin-4 encodes small RNAs with antisense complementarity to lin-14. Cell 75,
843–54
34. Reinhart, B. J., Slack, F. J., Basson, M., Pasquinelli, A. E., Bettinger, J. C., Rougvie, A. E., Horvitz, H. R. and Ruvkun, G. (2000) The 21-nucleotide let-7 RNA regulates developmental timing in Caenorhabditis elegans. Nature 403, 901–6
35. Lagos-Quintana, M., Rauhut, R., Lendeckel, W. and Tuschl, T. (2001) Identification of novel genes coding for small expressed RNAs. Science 294, 853–8
36. Lee, R. C. and Ambros, V. (2001) An extensive class of small RNAs in Caenorhabditis elegans. Science 294, 862–4
37. Lau, N. C., Lim, L. P., Weinstein, E. G. and Bartel, D. P. (2001) An abundant class of tiny RNAs with probable regulatory roles in Caenorhabditis elegans. Science 294,
858–62
38. Kozomara, A. and Griffiths-Jones, S. (2011) miRBase: integrating microRNA annotation and deep-sequencing data. Nucleic Acids Research 39, D152–7
39. Iorio, M. V and Croce, C. M. (2009) MicroRNAs in cancer: small molecules with a huge impact. Journal of Clinical Oncology 27, 5848–56
40. Krol, J., Loedige, I. and Filipowicz, W. (2010) The widespread regulation of microRNA biogenesis, function and decay. Nature Reviews.Genetics 11, 597–610
41. Carthew, R. W. and Sontheimer, E. J. (2009) Origins and Mechanisms of miRNAs and siRNAs. Cell 136, 642–55
42. Rodriguez, A., Griffiths-Jones, S., Ashurst, J. L. and Bradley, A. (2004) Identification of Mammalian microRNA Host Genes and Transcription Units. Genome Research 14, 1902–1910
43. Lee, Y., Jeon, K., Lee, J.-T., Kim, S. and Kim, V. N. (2002) MicroRNA maturation: stepwise processing and subcellular localization. The EMBO Journal 21, 4663–70
44. Saini, H. K., Griffiths-Jones, S. and Enright, A. J. (2007) Genomic analysis of human microRNA transcripts. Proceedings of the National Academy of Sciences of the United States of America 104, 17719–17724
45. Griffiths-Jones, S., Saini, H. K., Van Dongen, S. and Enright, A. J. (2008) miRBase: tools for microRNA genomics. Nucleic Acids Research 36, D154–8

References
87
46. Mourelatos, Z., Dostie, J., Paushkin, S., Sharma, A., Charroux, B., Abel, L., Rappsilber, J., Mann, M. and Dreyfuss, G. (2002) miRNPs: a novel class of ribonucleoproteins containing numerous microRNAs. Genes & Development 16, 720–8
47. Okamura, K., Hagen, J. W., Duan, H., Tyler, D. M. and Lai, E. C. (2007) The mirtron pathway generates microRNA-class regulatory RNAs in Drosophila. Cell 130, 89–100
48. Lee, Y., Kim, M., Han, J., Yeom, K.-H., Lee, S., Baek, S. H. and Kim, V. N. (2004) MicroRNA genes are transcribed by RNA polymerase II. The EMBO Journal 23, 4051–
60
49. Bartel, D. P. (2004) MicroRNAs: Genomics, Biogenesis, Mechanism, and Function. Cell 116, 281–297
50. Denli, A. M., Tops, B. B. J., Plasterk, R. H. A., Ketting, R. F. and Hannon, G. J. (2004) Processing of primary microRNAs by the Microprocessor complex. Nature 432, 231–5
51. Lee, Y., Ahn, C., Han, J., Choi, H., Kim, J., Yim, J., Lee, J., Provost, P., Rådmark, O., Kim, S. and Kim, V. N. (2003) The nuclear RNase III Drosha initiates microRNA processing. Nature 425, 415–9
52. Landthaler, M., Yalcin, A. and Tuschl, T. (2004) The Human DiGeorge Syndrome Critical Region Gene 8 and Its D . melanogaster Homolog Are Required for miRNA Biogenesis. Current Biology 14, 2162–2167
53. Basyuk, E. (2003) Human let-7 stem-loop precursors harbor features of RNase III cleavage products. Nucleic Acids Research 31, 6593–6597
54. Yi, R., Qin, Y., Macara, I. G. and Cullen, B. R. (2003) Exportin-5 mediates the nuclear export of pre-microRNAs and short hairpin RNAs. Genes & Development 17, 3011–6
55. Lund, E., Güttinger, S., Calado, A., Dahlberg, J. E. and Kutay, U. (2004) Nuclear export of microRNA precursors. Science 303, 95–8
56. Gwizdek, C., Ossareh-Nazari, B., Brownawell, A. M., Doglio, A., Bertrand, E., Macara, I. G. and Dargemont, C. (2003) Exportin-5 mediates nuclear export of minihelix-containing RNAs. The Journal of Biological Chemistry 278, 5505–8
57. Hutvágner, G., McLachlan, J., Pasquinelli, A. E., Bálint, E., Tuschl, T. and Zamore, P. D. (2001) A cellular function for the RNA-interference enzyme Dicer in the maturation of the let-7 small temporal RNA. Science 293, 834–8
58. Ketting, R. F., Fischer, S. E., Bernstein, E., Sijen, T., Hannon, G. J. and Plasterk, R. H. (2001) Dicer functions in RNA interference and in synthesis of small RNA involved in developmental timing in C. elegans. Genes & Development 15, 2654–9
59. Hutvágner, G. and Zamore, P. D. (2002) A microRNA in a multiple-turnover RNAi enzyme complex. Science 297, 2056–60
60. Yan, K. S., Yan, S., Farooq, A., Han, A., Zeng, L. and Zhou, M.-M. (2003) Structure and conserved RNA binding of the PAZ domain. Nature 426, 468–74
61. Song, J.-J., Liu, J., Tolia, N. H., Schneiderman, J., Smith, S. K., Martienssen, R. A., Hannon, G. J. and Joshua-Tor, L. (2003) The crystal structure of the Argonaute2 PAZ domain reveals an RNA binding motif in RNAi effector complexes. Nature Structural Bology 10, 1026–32
62. Khvorova, A., Reynolds, A. and Jayasena, S. D. (2003) Functional siRNAs and miRNAs Exhibit Strand Bias. Cell 115, 209–216
63. Hammond, S. M., Bernstein, E., Beach, D. and Hannon, G. J. (2000) An RNA-directed nuclease mediates post-transcriptional gene silencing in Drosophila cells. Nature 404,
293–6
64. Bernstein, E., Caudy, A. A., Hammond, S. M. and Hannon, G. J. (2001) Role for a bidentate ribonuclease in the initiation step of RNA interference. Nature 409, 363–6
References
88
65. Maniataki, E. and Mourelatos, Z. (2005) A human, ATP-independent, RISC assembly machine fueled by pre-miRNA. Genes & Development 19, 2979–90
66. Wightman, B., Ha, I. and Ruvkun, G. (1993) Posttranscriptional regulation of the heterochronic gene lin-14 by lin-4 mediates temporal pattern formation in C. elegans. Cell 75, 855–62
67. Doench, J. G., Petersen, C. P. and Sharp, P. A. (2003) siRNAs can function as miRNAs. Genes & Development 17, 438–42
68. Doench, J. G. and Sharp, P. A. (2004) Specificity of microRNA target selection in translational repression. Genes & Development 18, 504–11
69. Grimson, A., Farh, K. K.-H., Johnston, W. K., Garrett-Engele, P., Lim, L. P. and Bartel, D. P. (2007) MicroRNA targeting specificity in mammals: determinants beyond seed pairing. Molecular Cell 27, 91–105
70. Lytle, J. R., Yario, T. A. and Steitz, J. A. (2007) Target mRNAs are repressed as efficiently by microRNA-binding sites in the 5’ UTR as in the 3' UTR. Proceedings of the National Academy of Sciences of the United States of America 104, 9667–72
71. Tay, Y., Zhang, J., Thomson, A. M., Lim, B. and Rigoutsos, I. (2008) MicroRNAs to Nanog, Oct4 and Sox2 coding regions modulate embryonic stem cell differentiation. Nature 455, 1124–8
72. Place, R. F., Li, L.-C., Pookot, D., Noonan, E. J. and Dahiya, R. (2008) MicroRNA-373 induces expression of genes with complementary promoter sequences. Proceedings of the National Academy of Sciences of the United States of America 105, 1608–13
73. Hwang, H.-W., Wentzel, E. A. and Mendell, J. T. (2007) A hexanucleotide element directs microRNA nuclear import. Science 315, 97–100
74. Kunej, T., Godnic, I., Horvat, S., Zorc, M. and Calin, G. A. (2012) Cross talk between microRNA and coding cancer genes. Cancer Journal 18, 223–31
75. Sassen, S., Miska, E. A. and Caldas, C. (2008) MicroRNA: implications for cancer. Virchows Archiv: an international Journal of Pathology 452, 1–10
76. Calin, G. A., Sevignani, C., Dumitru, C. D., Hyslop, T., Noch, E., Yendamuri, S., Shimizu, M., Rattan, S., Bullrich, F., Negrini, M. and Croce, C. M. (2004) Human microRNA genes are frequently located at fragile sites and genomic regions involved in cancers. Proceedings of the National Academy of Sciences of the United States of America 101, 2999–3004
77. Calin, G. A. and Croce, C. M. (2006) MicroRNA signatures in human cancers. Nature Reviews.Cancer 6, 857–66
78. Kong, Y. W., Ferland-McCollough, D., Jackson, T. J. and Bushell, M. (2012) microRNAs in cancer management. The Lancet Oncology 13, e249–58
79. Calin, G. A., Dumitru, C. D., Shimizu, M., Bichi, R., Zupo, S., Noch, E., Aldler, H., Rattan, S., Keating, M., Rai, K., Rassenti, L., Kipps, T., Negrini, M., Bullrich, F. and Croce, C. M. (2002) Frequent deletions and down-regulation of micro- RNA genes miR15 and miR16 at 13q14 in chronic lymphocytic leukemia. Proceedings of the National Academy of Sciences of the United States of America 99, 15524–9
80. Cimmino, A., Calin, G. A., Fabbri, M., Iorio, M. V, Ferracin, M., Shimizu, M., Wojcik, S. E., Aqeilan, R. I., Zupo, S., Dono, M., Rassenti, L., Alder, H., Volinia, S., Liu, C., Kipps, T. J., Negrini, M. and Croce, C. M. (2005) miR-15 and miR-16 induce apoptosis by targeting BCL2. Proceedings of the National Academy of Sciences of the United States of America 102, 13944–13949

References
89
81. Calin, G. A., Ferracin, M., Cimmino, A., Di Leva, G., Shimizu, M., Wojcik, S. E., Iorio, M. V, Visone, R., Sever, N. I., Fabbri, M., Iuliano, R., Palumbo, T., Pichiorri, F., Roldo, C., Garzon, R., Sevignani, C., Rassenti, L., Alder, H., Volinia, S., Liu, C., Kipps, T. J., Negrini, M. and Croce, C. M. (2005) A MicroRNA signature associated with prognosis and progression in chronic lymphocytic leukemia. The New England Journal of Medicine 353, 1793–801
82. Kohlhaas, S., Garden, O. A., Scudamore, C., Turner, M., Okkenhaug, K. and Vigorito, E. (2009) Cutting edge: the Foxp3 target miR-155 contributes to the development of regulatory T cells. Journal of Immunology 182, 2578–82
83. Iorio, M. V, Ferracin, M., Liu, C.-G., Veronese, A., Spizzo, R., Sabbioni, S., Magri, E., Pedriali, M., Fabbri, M., Campiglio, M., Ménard, S., Palazzo, J. P., Rosenberg, A., Musiani, P., Volinia, S., Nenci, I., Calin, G. A., Querzoli, P., Negrini, M. and Croce, C. M. (2005) MicroRNA gene expression deregulation in human breast cancer. Cancer Research 65, 7065–70
84. Meng, F., Henson, R., Wehbe-Janek, H., Ghoshal, K., Jacob, S. T. and Patel, T. (2007) MicroRNA-21 regulates expression of the PTEN tumor suppressor gene in human hepatocellular cancer. Gastroenterology 133, 647–58
85. Wickramasinghe, N. S., Manavalan, T. T., Dougherty, S. M., Riggs, K. A., Li, Y. and Klinge, C. M. (2009) Estradiol downregulates miR-21 expression and increases miR-21 target gene expression in MCF-7 breast cancer cells. Nucleic Acids Research 37, 2584–95
86. Kim, Y. J., Hwang, S. J., Bae, Y. C. and Jung, J. S. (2009) MiR-21 regulates adipogenic differentiation through the modulation of TGF-beta signaling in mesenchymal stem cells derived from human adipose tissue. Stem Cells (Dayton, Ohio) 27, 3093–102
87. He, L., Thomson, J. M., Hemann, M. T., Hernando-Monge, E., Mu, D., Goodson, S., Powers, S., Cordon-Cardo, C., Lowe, S. W., Hannon, G. J. and Hammond, S. M. (2005) A microRNA polycistron as a potential human oncogene. Nature 435, 828–33
88. Olive, V., Jiang, I. and He, L. (2010) mir-17-92, a cluster of miRNAs in the midst of the cancer network. The international Journal of Biochemistry & Cell Biology 42, 1348–54
89. Chang, T.-C., Wentzel, E. A., Kent, O. A., Ramachandran, K., Mullendore, M., Lee, K. H., Feldmann, G., Yamakuchi, M., Ferlito, M., Lowenstein, C. J., Arking, D. E., Beer, M. A., Maitra, A. and Mendell, J. T. (2007) Transactivation of miR-34a by p53 broadly influences gene expression and promotes apoptosis. Molecular Cell 26, 745–52
90. Corney, D. C., Flesken-Nikitin, A., Godwin, A. K., Wang, W. and Nikitin, A. Y. (2007) MicroRNA-34b and MicroRNA-34c are targets of p53 and cooperate in control of cell proliferation and adhesion-independent growth. Cancer Research 67, 8433–8
91. O’Donnell, K. A., Wentzel, E. A., Zeller, K. I., Dang, C. V and Mendell, J. T. (2005) c-Myc-regulated microRNAs modulate E2F1 expression. Nature 435, 839–43
92. Chang, T.-C., Zeitels, L. R., Hwang, H.-W., Chivukula, R. R., Wentzel, E. A., Dews, M., Jung, J., Gao, P., Dang, C. V, Beer, M. A., Thomas-Tikhonenko, A. and Mendell, J. T. (2009) Lin-28B transactivation is necessary for Myc-mediated let-7 repression and proliferation. Proceedings of the National Academy of Sciences of the United States of America 106, 3384–9
93. Chin, L. J., Ratner, E., Leng, S., Zhai, R., Nallur, S., Babar, I., Muller, R.-U., Straka, E., Su, L., Burki, E. A., Crowell, R. E., Patel, R., Kulkarni, T., Homer, R., Zelterman, D., Kidd, K. K., Zhu, Y., Christiani, D. C., Belinsky, S. A., Slack, F. J. and Weidhaas, J. B. (2008) A SNP in a let-7 microRNA complementary site in the KRAS 3’ untranslated region increases non-small cell lung cancer risk. Cancer Research 68, 8535–40

References
90
94. Blenkiron, C., Goldstein, L. D., Thorne, N. P., Spiteri, I., Chin, S.-F., Dunning, M. J., Barbosa-Morais, N. L., Teschendorff, A. E., Green, A. R., Ellis, I. O., Tavaré, S., Caldas, C. and Miska, E. A. (2007) MicroRNA expression profiling of human breast cancer identifies new markers of tumor subtype. Genome Biology 8, R214
95. Karim, B. O., Ali, S. Z., Landolfi, J. A., Mann, J. F., Liu, G., Christian, A., Dicello, J. F., Rosenthal, D. L. and Huso, D. L. (2008) Cytomorphologic differentiation of benign and malignant mammary tumors in fine needle aspirate specimens from irradiated female Sprague–Dawley rats. Veterinary Clinical Pathology 37, 229–236
96. Ota, A., Tagawa, H., Karnan, S., Tsuzuki, S., Karpas, A., Kira, S., Yoshida, Y. and Seto, M. (2004) Identification and Characterization of a Novel Gene, C13orf25, as a Target for 13q31-q32 Amplification in Malignant Lymphoma. Cancer Research 64,
3087–3095
97. Garzon, R., Garofalo, M., Martelli, M. P., Briesewitz, R., Wang, L., Fernandez-Cymering, C., Volinia, S., Liu, C.-G., Schnittger, S., Haferlach, T., Liso, A., Diverio, D., Mancini, M., Meloni, G., Foa, R., Martelli, M. F., Mecucci, C., Croce, C. M. and Falini, B. (2008) Distinctive microRNA signature of acute myeloid leukemia bearing cytoplasmic mutated nucleophosmin. Proceedings of the National Academy of Sciences of the United States of America 105, 3945–50
98. Akao, Y., Nakagawa, Y. and Naoe, T. (2006) let-7 MicroRNA Functions as a Potential Growth Suppressor in Human Colon Cancer Cells. Biological & Pharmaceutical Bulletin 29, 903–906
99. Radisky, D. C. (2011) miR-200c at the nexus of epithelial-mesenchymal transition, resistance to apoptosis, and the breast cancer stem cell phenotype. Breast Cancer Research 13, 110
100. Garzon, R., Marcucci, G. and Croce, C. M. (2010) Targeting microRNAs in cancer: rationale, strategies and challenges. Nature Reviews.Drug Discovery 9, 775–89
101. Chang, T.-C., Yu, D., Lee, Y.-S., Wentzel, E. A., Arking, D. E., West, K. M., Dang, C. V, Thomas-Tikhonenko, A. and Mendell, J. T. (2008) Widespread microRNA repression by Myc contributes to tumorigenesis. Nature Genetics 40, 43–50
102. Gumireddy, K., Young, D. D., Xiong, X., Hogenesch, J. B., Huang, Q. and Deiters, A. (2008) Small-molecule inhibitors of microrna miR-21 function. Angewandte Chemie 47, 7482–4
103. Thomas, M., Lange-Grünweller, K., Weirauch, U., Gutsch, D., Aigner, A., Grünweller, A. and Hartmann, R. K. (2012) The proto-oncogene Pim-1 is a target of miR-33a. Oncogene 31, 918–28
104. Thomas, M., Lange-Grünweller, K., Dayyoub, E., Bakowsky, U., Weirauch, U., Aigner, A., Hartmann, R. K. and Grünweller, A. (2012) PEI-complexed LNA antiseeds as miRNA inhibitors. RNA Biology 9, 1088–98
105. Thorsen, S. B., Obad, S., Jensen, N. F., Stenvang, J. and Kauppinen, S. (2012) The therapeutic potential of microRNAs in cancer. Cancer Journal 18, 275–84
106. Kota, J., Chivukula, R. R., O’Donnell, K. A., Wentzel, E. A., Montgomery, C. L., Hwang, H.-W., Chang, T.-C., Vivekanandan, P., Torbenson, M., Clark, K. R., Mendell, J. R. and Mendell, J. T. (2009) Therapeutic microRNA delivery suppresses tumorigenesis in a murine liver cancer model. Cell 137, 1005–17
107. Trang, P., Medina, P. P., Wiggins, J. F., Ruffino, L., Kelnar, K., Omotola, M., Homer, R., Brown, D., Bader, A. G., Weidhaas, J. B. and Slack, F. J. (2010) Regression of murine lung tumors by the let-7 microRNA. Oncogene 29, 1580–7
108. Bader, A. G., Brown, D. and Winkler, M. (2010) The promise of microRNA replacement therapy. Cancer Research 70, 7027–30
109. Stenvang, J., Petri, A., Lindow, M., Obad, S. and Kauppinen, S. (2012) Inhibition of microRNA function by antimiR oligonucleotides. Silence 3, 1

References
91
110. Geary, R. S., Watanabe, T. A., Truong, L., Freier, S., Lesnik, E. A., Sioufi, N. B., Sasmor, H., Manoharan, M. and Levin, A. A. (2001) Pharmacokinetic properties of 2’-O-(2-methoxyethyl)-modified oligonucleotide analogs in rats. The Journal of Pharmacology and Experimental Therapeutics 296, 890–7
111. Hutvágner, G., Simard, M. J., Mello, C. C. and Zamore, P. D. (2004) Sequence-specific inhibition of small RNA function. PLoS Biology 2, E98
112. Davis, S., Lollo, B., Freier, S. and Esau, C. (2006) Improved targeting of miRNA with antisense oligonucleotides. Nucleic Acids Rresearch 34, 2294–304
113. Koshkin, A. A., Singh, S. K., Nielsen, P., Rajwanshi, V. K., Kumar, R., Meldgaard, M., Olsen, C. E. and Wengel, J. (1998) LNA (Locked Nucleic Acids): Synthesis of the Adenine, Cytosine, Guanine, 5-Methylcytosine, Thymine and Uracil Bicyclonucleoside Monomers, Oligomerisation, and Unprecedented Nucleic Acid Recognition. Tetrahedron 54, 3607–3630
114. Koshkin, A. A., Rajwanshi, V. K. and Wengel, J. (1998) Novel Convenient Syntheses of LNA [2.2.1] Bicyclo Nueleosides. Tetrahedron 39, 4381–4384
115. Braasch, D. A. and Corey, D. R. (2001) Locked nucleic acid (LNA): fine-tuning the recognition of DNA and RNA. Chemistry & Biology 8, 1–7
116. Summerton, J. and Weller, D. (1997) Morpholino Antisense Oligomers: Design, Preparation, and Properties. Antisense & Nucleic Acid Drug Development 7, 187–195
117. Flynt, A. S., Li, N., Thatcher, E. J., Solnica-Krezel, L. and Patton, J. G. (2007) Zebrafish miR-214 modulates Hedgehog signaling to specify muscle cell fate. Nature Genetics 39, 259–63
118. Esquela-Kerscher, A., Trang, P., Wiggins, J. F., Patrawala, L., Cheng, A., Ford, L., Weidhaas, J. B., Brown, D., Bader, A. G. and Slack, F. J. (2008) The let-7 microRNA reduces tumor growth in mouse models of lung cancer. Cell Cycle 7, 759–764
119. Wiggins, J. F., Ruffino, L., Kelnar, K., Omotola, M., Patrawala, L., Brown, D. and Bader, A. G. (2010) Development of a lung cancer therapeutic based on the tumor suppressor microRNA-34. Cancer Research 70, 5923–30
120. Takeshita, F., Patrawala, L., Osaki, M., Takahashi, R., Yamamoto, Y., Kosaka, N., Kawamata, M., Kelnar, K., Bader, A. G., Brown, D. and Ochiya, T. (2010) Systemic delivery of synthetic microRNA-16 inhibits the growth of metastatic prostate tumors via downregulation of multiple cell-cycle genes. Molecular Therapy 18, 181–7
121. Kitade, Y. and Akao, Y. (2010) MicroRNAs and Their Therapeutic Potential for Human Diseases: MicroRNAs, miR-143 and -145, Function as Anti-oncomirs and the Application of Chemically Modified miR-143 as an Anti-cancer Drug. Journal of Pharmacological Sciences 114, 276–280
122. Pramanik, D., Campbell, N. R., Karikari, C., Chivukula, R., Kent, O. A., Mendell, J. T. and Maitra, A. (2011) Restitution of tumor suppressor microRNAs using a systemic nanovector inhibits pancreatic cancer growth in mice. Molecular Cancer Therapeutics 10, 1470–80
123. Esau, C. C. (2008) Inhibition of microRNA with antisense oligonucleotides. Methods 44, 55–60
124. Krützfeldt, J., Rajewsky, N., Braich, R., Rajeev, K. G., Tuschl, T., Manoharan, M. and Stoffel, M. (2005) Silencing of microRNAs in vivo with “antagomirs”. Nature 438, 685–
9
125. Elmén, J., Lindow, M., Schütz, S., Lawrence, M., Petri, A., Obad, S., Lindholm, M., Hedtjärn, M., Hansen, H. F., Berger, U., Gullans, S., Kearney, P., Sarnow, P., Straarup, E. M. and Kauppinen, S. (2008) LNA-mediated microRNA silencing in non-human primates. Nature 452, 896–9

References
92
126. Obad, S., Dos Santos, C. O., Petri, A., Heidenblad, M., Broom, O., Ruse, C., Fu, C., Lindow, M., Stenvang, J., Straarup, E. M., Hansen, H. F., Koch, T., Pappin, D., Hannon, G. J. and Kauppinen, S. (2011) Silencing of microRNA families by seed-targeting tiny LNAs. Nature Genetics 43, 371–8
127. Esau, C., Davis, S., Murray, S. F., Yu, X. X., Pandey, S. K., Pear, M., Watts, L., Booten, S. L., Graham, M., McKay, R., Subramaniam, A., Propp, S., Lollo, B. A., Freier, S., Bennett, C. F., Bhanot, S. and Monia, B. P. (2006) miR-122 regulation of lipid metabolism revealed by in vivo antisense targeting. Cell Metabolism 3, 87–98
128. Jopling, C. L., Yi, M., Lancaster, A. M., Lemon, S. M. and Sarnow, P. (2005) Modulation of hepatitis C virus RNA abundance by a liver-specific MicroRNA. Science 309, 1577–81
129. Ji, Q., Hao, X., Zhang, M., Tang, W., Yang, M., Li, L., Xiang, D., Desano, J. T., Bommer, G. T., Fan, D., Fearon, E. R., Lawrence, T. S. and Xu, L. (2009) MicroRNA miR-34 inhibits human pancreatic cancer tumor-initiating cells. PloS One 4, e6816
130. Cuypers, H. T., Selten, G., Quint, W., Zijlstra, M., Maandag, E. R., Boelens, W., Van Wezenbeek, P., Melief, C. and Berns, A. (1984) Murine leukemia virus-induced T-cell lymphomagenesis: integration of proviruses in a distinct chromosomal region. Cell 37,
141–50
131. Allen, J. D. and Berns, A. (1996) Complementation tagging of cooperating oncogenes in knockout mice. Seminars in Cancer Biology 7, 299–306
132. Mikkers, H., Nawijn, M., Allen, J., Verhoeven, E., Jonkers, J., Berns, A. and Brouwers, C. (2004) Mice Deficient for All PIM Kinases Display Reduced Body Size and Impaired Responses to Hematopoietic Growth Factors. Molecular and Cellular Biology 24, 6101–6115
133. Nawijn, M. C., Alendar, A. and Berns, A. (2011) For better or for worse: the role of Pim oncogenes in tumorigenesis. Nature Reviews.Cancer 11, 23–34
134. Eichmann, A., Yuan, L., Bréant, C., Alitalo, K. and Koskinen, P. J. (2000) Developmental expression of pim kinases suggests functions also outside of the hematopoietic system. Oncogene 19, 1215–24
135. Wingett, D., Long, A., Kelleher, D. and Magnuson, N. S. (1996) Pim-1 Proto-Oncogene Expression in Anti-CD3-Mediated T Cell Activation Is Associated with Protein Kinase C Activation and Is Independent of Raf-1. Journal of Immunology 156,
549–557
136. Amson, R., Sigaux, F., Przedborski, S., Flandrin, G., Givol, D. and Telerman, A. (1989) The human protooncogene product p33pim is expressed during fetal hematopoiesis and in diverse leukemias. Proceedings of the National Academy of Sciences of the United States of America 86, 8857–61
137. Bachmann, M. and Möröy, T. (2005) The serine/threonine kinase Pim-1. The international Journal of Biochemistry & Cell Biology 37, 726–30
138. Wang, Z., Bhattacharya, N., Weaver, M., Petersen, K., Meyer, M., Gapter, L. and Magnuson, N. S. (2001) Pim-1: a serine/threonine kinase with a role in cell survival, proliferation, differentiation and tumorigenesis. Journal of Veterinary Science 2, 167–
79
139. Alizadeh, A. A., Eisen, M. B., Davis, R. E., Ma, C., Lossos, I. S., Rosenwald, A., Boldrick, J. C., Sabet, H., Tran, T., Yu, X., Powell, J. I., Yang, L., Marti, G. E., Moore, T., Jr, J. H., Lu, L., Lewis, D. B., Tibshirani, R., Sherlock, G., Chan, W. C., Greiner, T. C., Weisenburger, D. D., Armitage, J. O., Warnke, R., Levy, R., Wilson, W., Grever, M. R., Byrd, J. C., Botstein, D., Brown, P. O. and Staudt, L. M. (2000) Distinct types of diffuse large B-cell lymphoma identified by gene expression profiling. Nature 403,
503–511
References
93
140. Ayala, G. E., Dai, H., Ittmann, M., Li, R., Powell, M., Frolov, A., Wheeler, T. M., Thompson, T. C. and Rowley, D. (2004) Growth and survival mechanisms associated with perineural invasion in prostate cancer. Cancer Research 64, 6082–90
141. Domen, J., Van der Lugt, N. M., Laird, P. W., Saris, C. J., Clarke, A. R., Hooper, M. L. and Berns, A. (1993) Impaired interleukin-3 response in Pim-1-deficient bone marrow-derived mast cells. Blood 82, 1445–52
142. Domen, J., Van der Lugt, N. M. T., Acton, D., Laird, P. W., Linders, K. and Berns, A. (1993) Pim-1 Levels Determine the Size o f Early B Lymphoid Compartments in Bone Marrow. The Journal of Experimental Medicine 178, 1665–1673
143. Saris, C. J. M., Domen, J. and Berns, A. (1991) The pim-1 oncogene encodes two related protein-serine/threonine kinases by alternative initiation at AUG and CUG. The EMBO Journal 10, 655–664
144. Nasser, M. W., Datta, J., Nuovo, G., Kutay, H., Motiwala, T., Majumder, S., Wang, B., Suster, S., Jacob, S. T. and Ghoshal, K. (2008) Down-regulation of micro-RNA-1 (miR-1) in lung cancer. Suppression of tumorigenic property of lung cancer cells and their sensitization to doxorubicin-induced apoptosis by miR-1. The Journal of Biological Chemistry 283, 33394–405
145. Eiring, A. M., Harb, J. G., Neviani, P., Garton, C., Oaks, J. J., Spizzo, R., Liu, S., Schwind, S., Santhanam, R., Hickey, C. J., Becker, H., Chandler, J. C., Andino, R., Cortes, J., Hokland, P., Huettner, C. S., Bhatia, R., Roy, D. C., Liebhaber, S. A., Caligiuri, M. A., Marcucci, G., Garzon, R., Croce, C. M., Calin, G. A. and Perrotti, D. (2010) miR-328 functions as an RNA decoy to modulate hnRNP E2 regulation of mRNA translation in leukemic blasts. Cell 140, 652–65
146. Hoover, D. S., Wingett, D. G., Zhang, J., Reeves, R. and Magnuson, N. S. (1997) Pim-1 Protein Expression Is Regulated by Its 5’-Untranslated Region and Translation Initiation Factor eIF-4E. Cell Growth & Differentiation 8, 1371–1380
147. Culjkovic, B., Topisirovic, I., Skrabanek, L., Ruiz-Gutierrez, M. and Borden, K. L. B. (2006) eIF4E is a central node of an RNA regulon that governs cellular proliferation. The Journal of Cell Biology 175, 415–26
148. Mizuno, K., Shirogane, T., Shinohara, A., Iwamatsu, A., Hibi, M. and Hirano, T. (2001) Regulation of Pim-1 by Hsp90. Biochemical and Biophysical Research Communications 281, 663–9
149. Losman, J. A., Chen, X. P., Vuong, B. Q., Fay, S. and Rothman, P. B. (2003) Protein phosphatase 2A regulates the stability of Pim protein kinases. The Journal of Biological Chemistry 278, 4800–5
150. Wang, Z., Bhattacharya, N., Mixter, P. F., Wei, W., Sedivy, J. and Magnuson, N. S. (2002) Phosphorylation of the cell cycle inhibitor p21 Cip1/WAF1 by Pim-1 kinase. Biochimica et Biophysica ACTA 1593, 45–55
151. Morishita, D., Katayama, R., Sekimizu, K., Tsuruo, T. and Fujita, N. (2008) Pim kinases promote cell cycle progression by phosphorylating and down-regulating p27Kip1 at the transcriptional and posttranscriptional levels. Cancer Research 68,
5076–85
152. Mochizuki, T., Kitanaka, C., Noguchi, K., Muramatsu, T., Asai, A. and Kuchino, Y. (1999) Physical and Functional Interactions between Pim-1 Kinase and Cdc25A Phosphatase. The Journal of Biological Chemistry 274, 18659–18666
153. Bachmann, M., Hennemann, H., Xing, P. X., Hoffmann, I. and Möröy, T. (2004) The oncogenic serine/threonine kinase Pim-1 phosphorylates and inhibits the activity of Cdc25C-associated kinase 1 (C-TAK1): a novel role for Pim-1 at the G2/M cell cycle checkpoint. The Journal of Biological Chemistry 279, 48319–28

References
94
154. Aho, T. L. T., Sandholm, J., Peltola, K. J., Mankonen, H. P., Lilly, M. and Koskinen, P. J. (2004) Pim-1 kinase promotes inactivation of the pro-apoptotic Bad protein by phosphorylating it on the Ser112 gatekeeper site. FEBS Letters 571, 43–9
155. Koike, N., Maita, H., Taira, T., Ariga, H. and Iguchi-Ariga, S. M. M. (2000) Identification of heterochromatin protein 1 ( HP1 ) as a phosphorylation target by Pim-1 kinase and the effect of phosphorylation on the transcriptional repression function of HP1. FEBS Letters 467, 17–21
156. Vakoc, C. R., Mandat, S. A., Olenchock, B. A. and Blobel, G. A. (2005) Histone H3 lysine 9 methylation and HP1gamma are associated with transcription elongation through mammalian chromatin. Molecular Cell 19, 381–91
157. Zhang, Y., Wang, Z., Li, X. and Magnuson, N. S. (2008) Pim kinase-dependent inhibition of c-Myc degradation. Oncogene 27, 4809–19
158. Verbeek, S., Van Lohuizen, M., Van der Valk, M., Domen, J., Kraal, G. and Berns, A. (1991) Mice bearing the E mu-myc and E mu-pim-1 transgenes develop pre-B-cell leukemia prenatally. Molecular and Cellular Biology 11, 1176–9
159. Zippo, A., De Robertis, A., Serafini, R. and Oliviero, S. (2007) PIM1-dependent phosphorylation of histone H3 at serine 10 is required for MYC-dependent transcriptional activation and oncogenic transformation. Nature Cell Biology 9, 932–44
160. Merkel, A. L., Meggers, E. and Ocker, M. (2012) PIM1 kinase as a target for cancer therapy. Expert Opinion on Investigational Drugs 21, 425–36
161. Bullock, A. N., Debreczeni, J. E., Fedorov, O. Y., Nelson, A., Marsden, B. D. and Knapp, S. (2005) Structural basis of inhibitor specificity of the human protooncogene proviral insertion site in moloney murine leukemia virus (PIM-1) kinase. Journal of Medicinal Chemistry 48, 7604–14
162. Bregman, H. and Meggers, E. (2006) Ruthenium half-sandwich complexes as protein kinase inhibitors: an N-succinimidyl ester for rapid derivatizations of the cyclopentadienyl moiety. Organic Letters 8, 5465–8
163. Nishiguchi, G. A., Atallah, G., Bellamacina, C., Burger, M. T., Ding, Y., Feucht, P. H., Garcia, P. D., Han, W., Klivansky, L. and Lindvall, M. (2011) Discovery of novel 3,5-disubstituted indole derivatives as potent inhibitors of Pim-1, Pim-2, and Pim-3 protein kinases. Bioorganic & Medicinal Chemistry Letters 21, 6366–9
164. Tanzer, A. and Stadler, P. F. (2004) Molecular evolution of a microRNA cluster. Journal of Molecular Biology 339, 327–35
165. Volinia, S., Calin, G. A., Liu, C.-G., Ambs, S., Cimmino, A., Petrocca, F., Visone, R., Iorio, M., Roldo, C., Ferracin, M., Prueitt, R. L., Yanaihara, N., Lanza, G., Scarpa, A., Vecchione, A., Negrini, M., Harris, C. C. and Croce, C. M. (2006) A microRNA expression signature of human solid tumors defines cancer gene targets. Proceedings of the National Academy of Sciences of the United States of America 103, 2257–61
166. Sylvestre, Y., De Guire, V., Querido, E., Mukhopadhyay, U. K., Bourdeau, V., Major, F., Ferbeyre, G. and Chartrand, P. (2007) An E2F/miR-20a autoregulatory feedback loop. The Journal of Biological Chemistry 282, 2135–43
167. Woods, K., Thomson, J. M. and Hammond, S. M. (2007) Direct regulation of an oncogenic micro-RNA cluster by E2F transcription factors. The Journal of Biological Chemistry 282, 2130–4
168. Matsubara, H., Takeuchi, T., Nishikawa, E., Yanagisawa, K., Hayashita, Y., Ebi, H., Yamada, H., Suzuki, M., Nagino, M., Nimura, Y., Osada, H. and Takahashi, T. (2007) Apoptosis induction by antisense oligonucleotides against miR-17-5p and miR-20a in lung cancers overexpressing miR-17-92. Oncogene 26, 6099–105
169. Ozsolak, F., Poling, L. L., Wang, Z., Liu, H., Liu, X. S., Roeder, R. G., Zhang, X., Song, J. S. and Fisher, D. E. (2008) Chromatin structure analyses identify miRNA promoters. Genes & Development 22, 3172–83

References
95
170. Olive, V., Bennett, M. J., Walker, J. C., Ma, C., Jiang, I., Cordon-Cardo, C., Li, Q.-J., Lowe, S. W., Hannon, G. J. and He, L. (2009) miR-19 is a key oncogenic component of mir-17-92. Genes & Development 23, 2839–49
171. Mu, P., Han, Y.-C., Betel, D., Yao, E., Squatrito, M., Ogrodowski, P., De Stanchina, E., D’Andrea, A., Sander, C. and Ventura, A. (2009) Genetic dissection of the miR-17~92 cluster of microRNAs in Myc-induced B-cell lymphomas. Genes & Development 23, 2806–11
172. Xiao, C., Srinivasan, L., Calado, D. P., Patterson, H. C., Zhang, B., Wang, J., Henderson, J. M., Kutok, J. L. and Rajewsky, K. (2008) Lymphoproliferative disease and autoimmunity in mice with increased miR-17-92 expression in lymphocytes. Nature Immunology 9, 405–14
173. Ventura, A., Young, A. G., Winslow, M. M., Lintault, L., Meissner, A., Erkeland, S. J., Newman, J., Bronson, R. T., Crowley, D., Stone, J. R., Jaenisch, R., Sharp, P. A. and Jacks, T. (2008) Targeted deletion reveals essential and overlapping functions of the miR-17 through 92 family of miRNA clusters. Cell 132, 875–86
174. Petrocca, F., Vecchione, A. and Croce, C. M. (2008) Emerging role of miR-106b-25/miR-17-92 clusters in the control of transforming growth factor beta signaling. Cancer Research 68, 8191–4
175. Dews, M., Homayouni, A., Yu, D., Murphy, D., Sevignani, C., Wentzel, E., Furth, E. E., Lee, W. M., Enders, G. H., Mendell, J. T. and Thomas-Tikhonenko, A. (2006) Augmentation of tumor angiogenesis by a Myc-activated microRNA cluster. Nature Genetics 38, 1060–5
176. Höbel, S., Koburger, I., John, M., Czubayko, F., Hadwiger, P., Vornlocher, H.-P. and Aigner, A. (2010) Polyethylenimine / small interfering RNA-mediated knockdown of vascular endothelial growth factor in vivo exerts anti-tumor effects synergistically with Bevacizumab. The Journal of Gene Medicine 12, 287–300
177. Fernandez, P. C., Frank, S. R., Wang, L., Schroeder, M., Liu, S., Greene, J., Cocito, A. and Amati, B. (2003) Genomic targets of the human c-Myc protein. Genes & Development 17, 1115–29
178. Chen, C., Ridzon, D. A., Broomer, A. J., Zhou, Z., Lee, D. H., Nguyen, J. T., Barbisin, M., Xu, N. L., Mahuvakar, V. R., Andersen, M. R., Lao, K. Q., Livak, K. J. and Guegler, K. J. (2005) Real-time quantification of microRNAs by stem-loop RT-PCR. Nucleic Acids Research 33, e179
179. Grünweller, A., Gillen, C., Erdmann, V. A. and Kurreck, J. (2003) Cellular uptake and localization of a Cy3-labeled siRNA specific for the serine/threonine kinase Pim-1. Oligonucleotides 13, 345–52
180. Griffiths-Jones, S. (2004) The microRNA Registry. Nucleic Acids Research 32, D109–11
181. Vermeulen, A., Robertson, B., Dalby, A. B., Marshall, W. S., Karpilow, J. O. N., Leake, D., Khvorova, A. and Baskerville, S. (2007) Double-stranded regions are essential design components of potent inhibitors of RISC function. RNA 13, 723–730
182. Gruegelsiepe, H., Brandt, O. and Hartmann, R. K. (2006) Antisense inhibition of RNase P: mechanistic aspects and application to live bacteria. The Journal of Biological Chemistry 281, 30613–20
183. Sambrook, J., Fritsch, E. and Maniatis, T. (1989) Molecular Cloning. A laboratory manual., Cold Spring Harbor Laboratory, Cold Spring Harbor, N.Y.
184. Bertani, G. (1951) Studies on lysogenesis. The mode of phage liberation by lysogenic Escherichia coli. Journal of Bacteriology 62, 293–300
185. Griffith, F. (1928) The significance of Pneumococcal Types. Journal of Hygiene XXVII,
113–159
References
96
186. Lozzio, C. B. and Lozzio, B. B. (1975) Human chronic myelogenous leukemia cell-line with positive Philadelphia chromosome. Blood 45, 321–34
187. Gey, G. O., Coffman, W. D. and Kubicek, M. T. (1952) Tissue culture studies of the proliferative capacity of cervical carcinoma and normal epithelium. Cancer Research 12, 264–265
188. Tom, B. H., Rutzky, L. P., Oyasu, R., Tomlta, J. T., Goldenberg, D. M. and Barry, D. (1977) Human Colon Adenocarcinoma Cells. Journal of the National Cancer Institute 58, 1507–1512
189. Fogh, J., Fogh, J. M. and Orfeo, T. (1977) One hundred and twenty-seven cultured human tumor cell lines producing tumors in nude mice. Journal of the National Cancer Institute 59, 221–6
190. Werth, S., Urban-Klein, B., Dai, L., Höbel, S., Grzelinski, M., Bakowsky, U., Czubayko, F. and Aigner, A. (2006) A low molecular weight fraction of polyethylenimine (PEI) displays increased transfection efficiency of DNA and siRNA in fresh or lyophilized complexes. Journal of Controlled Release 112, 257–70
191. Tulchin, N., Ornstein, L. and Davis, B. J. (1976) A microgel system for disc electrophoresis. Analytical Biochemistry 72, 485–90
192. Towbin, H., Staehelin, T. and Gordon, J. (1992) Electrophoretic transfer of proteins from polyacrylamide gels to nitrocellulose sheets: procedure and some applications. 1979. Biotechnology 24, 145–9
193. Kerr, J. F. R., Wyllie, A. H. and Currie, A. R. (1972) APOPTOSIS: A BASIC BIOLOGICAL PHENOMENON WITH WIDE-RANGING IMPLICATIONS IN TISSUE KINETICS. British Journal of Cancer 26, 239–257
194. Prinz, R. (2009) Regulation of proto-oncogenic Pim-1 kinase and miR-17-92 microRNA cluster in the human leukemia cell line K562.
195. Brennecke, J., Stark, A., Russell, R. B. and Cohen, S. M. (2005) Principles of microRNA-target recognition. PLoS Biology 3, e85
196. Hartmann, D. (2010) Transkriptionelle Regulation des microRNA-Clusters miR-17-92 in Tumorzelllinien unter Berücksichtigung der onkogenen Kinase Pim-1.
197. Smithies, O. (1955) Zone electrophoresis in starch gels: group variations in the serum proteins of normal human adults. The Biochemical Journal 61, 629–41
198. Tsanev, R. (1964) Direct spectropeotometric analysis of ribonucleic acid fractionation by agar-gelelectrophoresis. Biochimica et Biophysica ACTA 3, 374–382
199. Loening, U. E. (1967) The fractionation of high-molecular-weight ribonucleic acid by polyacrylamide-gel electrophoresis. The Biochemical Journal 102, 251–7
200. Sharp, P. A., Sugden, B. and Sambrook, J. (1973) Detection of Two Restriction Endonuclease Activities in Haemophilus parainfluenzae Using Analytical Agarose-Ethidium Bromide Electrophoresis. Biochemistry 12, 3055–3063
201. Kerenyi, L. and Gallyas, F. (1973) Über Probleme der quantitativen Auswertung der mit physikalischer Entwicklung versilberten Agarelektrophoretogramme. Clinica Chimica Acta 47, 425–436
202. Tuma, R. S., Beaudet, M. P., Jin, X., Jones, L. J., Cheung, C. Y., Yue, S. and Singer, V. L. (1999) Characterization of SYBR Gold nucleic acid gel stain: a dye optimized for use with 300-nm ultraviolet transilluminators. Analytical Biochemistry 268, 278–88
203. Smith, H. O. and Wilcox, K. W. (1970) A Restriction Enzyme from Hemophilus influenzae. Journal of Molecular Biology 51, 379–391
204. Danna, K. and Nathans, D. (1971) Specific cleavage of simian virus 40 DNA by restriction endonuclease of Hemophilus influenzae. 1971. Reviews in Medical Virology 9, 75–81

References
97
205. Pheiffer, B. H. and Zimmerman, S. B. (1983) Polymer-stimulated ligation: enhanced blunt- or cohesive-end ligation of DNA or deoxyribooligonucleotides by T4 DNA ligase in polymer solutions. Nucleic Acids Research 11, 7853–7871
206. Temin, H. M. and Mizutani, S. (1970) RNA-dependent DNA Polymerase in Virions of Rous Sarcoma Virus. Nature 226, 1211–1213
207. Baltimore, D. (1970) Viral RNA-dependent DNA Polymerase. Nature 226, 1209–1211
208. Saiki, R. K., Scharf, S., Faloona, F., Mullis, K. B., Horn, G. T., Erlich, H. A. and Arnheim, N. (1985) Enzymatic amplification of beta-globin genomic sequences and restriction site analysis for diagnosis of sickle cell anemia. 1985. Science 230, 1350–
1354
209. Schmittgen, T. D. and Livak, K. J. (2008) Analyzing real-time PCR data by the comparative CT method. Nature Protocols 3, 1101–1108
210. Chomczynski, P. (1987) Single-Step Method of RNA Isolation by Acid Guanidinium Extraction. 159, 156–159
211. Beckmann, B. M., Grünweller, A., Weber, M. H. W. and Hartmann, R. K. (2010) Northern blot detection of endogenous small RNAs (approximately14 nt) in bacterial total RNA extracts. Nucleic Acids Research 38, e147
212. Beckmann, B. M., Hoch, P. G., Marz, M., Willkomm, D. K., Salas, M. and Hartmann, R. K. (2012) A pRNA-induced structural rearrangement triggers 6S-1 RNA release from RNA polymerase in Bacillus subtilis. The EMBO Journal 31, 1727–38
213. Malek, A., Czubayko, F. and Aigner, A. (2008) PEG grafting of polyethylenimine (PEI) exerts different effects on DNA transfection and siRNA-induced gene targeting efficacy. Journal of Drug Targeting 16, 124–39
214. Binnig, G. and Rohrer, H. (1986) Scanning tunneling microscopy. IBM J. Res. Dev. 30,
355–369
215. Sitterberg, J., Ozcetin, A., Ehrhardt, C. and Bakowsky, U. (2010) Utilising atomic force microscopy for the characterisation of nanoscale drug delivery systems. European Journal of Pharmaceutics and Biopharmaceutics 74, 2–13
216. Leatherbarrow, R. J. (2001) GraFit Version 5, Erithacus Software Ltd.
217. Altschul, S. F., Gish, W., Miller, W., Myers, E. W. and Lipman, D. J. (1990) Basic local alignment search tool. Journal of Molecular Biology 215, 403–10
218. Lewis, B. P., Burge, C. B. and Bartel, D. P. (2005) Conserved seed pairing, often flanked by adenosines, indicates that thousands of human genes are microRNA targets. Cell 120, 15–20
219. Friedman, R. C., Farh, K. K.-H., Burge, C. B. and Bartel, D. P. (2009) Most mammalian mRNAs are conserved targets of microRNAs. Genome Research 19, 92–
105
220. Griffiths-Jones, S., Grocock, R. J., Van Dongen, S., Bateman, A. and Enright, A. J. (2006) miRBase: microRNA sequences, targets and gene nomenclature. Nucleic Acids Research 34, D140–4
221. Chenna, R. (2003) Multiple sequence alignment with the Clustal series of programs. Nucleic Acids Research 31, 3497–3500
222. Crooks, G. E., Hon, G., Chandonia, J. and Brenner, S. E. (2004) WebLogo : A Sequence Logo Generator. Genome Research 14, 1188–1190
223. Rangannan, V. and Bansal, M. (2009) Relative stability of DNA as a generic criterion for promoter prediction: whole genome annotation of microbial genomes with varying nucleotide base composition. Molecular BioSystem 5, 1758–1769
224. Reese, M. G. (2001) Application of a time-delay neural network to promoter annotation in the Drosophila melanogaster genome. Computers & Chemistry 26, 51–6

References
98
225. Ohler, U. (2006) Identification of core promoter modules in Drosophila and their application in accurate transcription start site prediction. Nucleic Acids Research 34,
5943–50
226. Knudsen, S. (1999) Promoter2.0: for the recognition of PolII promoter sequences. Bioinformatics 15, 356–61
227. Zhang, M. Q. (1998) Identification of human gene core promoters in silico. Genome Research 8, 319–26
228. Meyersono, M. and Harlow, E. (1994) Identification of G1 Kinase Activity for cdk6 , a Novel Cyclin D Partner. Molecular and Cellular Biology 14, 2077–2086
229. Herrera-Merchan, A., Cerrato, C., Luengo, G., Dominguez, O., Piris, M. A., Serrano, M. and Gonzalez, S. (2010) miR-33-mediated downregulation of p53 controls hematopoietic stem cell self-renewal. Cell Cycle 9, 3277–85
230. Najafi-Shoushtari, S. H., Kristo, F., Li, Y., Shioda, T., Cohen, D. E., Gerszten, R. E. and Näär, A. M. (2010) MicroRNA-33 and the SREBP host genes cooperate to control cholesterol homeostasis. Science 328, 1566–9
231. Rayner, K. J., Suárez, Y., Dávalos, A., Parathath, S., Fitzgerald, M. L., Tamehiro, N., Fisher, E. A., Moore, K. J. and Fernández-Hernando, C. (2010) MiR-33 contributes to the regulation of cholesterol homeostasis. Science 328, 1570–3
232. Rayner, K. J., Sheedy, F. J., Esau, C. C., Hussain, F. N., Temel, R. E., Parathath, S., Gils, J. M. Van, Rayner, A. J., Chang, A. N., Suarez, Y., Fernandez-Hernando, C., Fisher, E. A. and Moore, K. J. (2011) Antagonism of miR-33 in mice promotes reverse cholesterol transport and regression of atherosclerosis. The Journal of Clinical Investigation 121, 2921–31
233. Rayner, K. J., Esau, C. C., Hussain, F. N., McDaniel, A. L., Marshall, S. M., Van Gils, J. M., Ray, T. D., Sheedy, F. J., Goedeke, L., Liu, X., Khatsenko, O. G., Kaimal, V., Lees, C. J., Fernandez-Hernando, C., Fisher, E. a, Temel, R. E. and Moore, K. J. (2011) Inhibition of miR-33a/b in non-human primates raises plasma HDL and lowers VLDL triglycerides. Nature 478, 404–7
234. Marquart, T. J., Wu, J., Lusis, A. J. and Baldán, A. (2013) AntimiR-33 Therapy Does Not Alter the Progression of Atherosclerosis in Low-Density Lipoprotein Receptor-Deficient Mice. Arteriosclerosis, Thrombosis, and Vascular Biology 33
235. Muraski, J. A., Rota, M., Misao, Y., Fransioli, J., Cottage, C., Gude, N., Esposito, G., Delucchi, F., Arcarese, M., Alvarez, R., Siddiqi, S., Emmanuel, G. N., Wu, W., Fischer, K., Martindale, J. J., Glembotski, C. C., Leri, A., Kajstura, J., Magnuson, N., Berns, A., Beretta, R. M., Houser, S. R., Schaefer, E. M., Anversa, P. and Sussman, M. A. (2007) Pim-1 regulates cardiomyocyte survival downstream of Akt. Nature Medicine 13, 1467–75
236. Cottage, C. T., Bailey, B., Fischer, K. M., Avitable, D., Collins, B., Tuck, S., Quijada, P., Gude, N., Alvarez, R., Muraski, J. and Sussman, M. A. (2010) Cardiac progenitor cell cycling stimulated by pim-1 kinase. Circulation Research 106, 891–901
237. Takwi, A. A. L., Li, Y., Becker Buscaglia, L. E., Zhang, J., Choudhury, S., Park, A. K., Liu, M., Young, K. H., Park, W.-Y., Martin, R. C. G. and Li, Y. (2012) A statin-regulated microRNA represses human c-Myc expression and function. EMBO Molecular Medicine 145, 1–14
238. Slack, F. J. (2012) A role of miR-33 for cell cycle progression and cell proliferation. Cell cycle 11, 1057–1058
239. Cirera-Salinas, D., Pauta, M., Allen, R. M., Salerno, A. G., Ramírez, C. M., Chamorro-Jorganes, A., Wanschel, A. C., Lasunción, M. A., Morales-Ruiz, M., Suárez, Y., Baldán, Á., Esplugues, E. and Fernández-Hernando, C. (2012) Mir-33 regulates cell proliferation and cell cycle progression. Cell cycle 11, 922–933

References
99
240. Ivanovska, I., Ball, A. S., Diaz, R. L., Magnus, J. F., Kibukawa, M., Schelter, J. M., Kobayashi, S. V, Lim, L., Burchard, J., Jackson, A. L., Linsley, P. S. and Cleary, M. A. (2008) MicroRNAs in the miR-106b family regulate p21/CDKN1A and promote cell cycle progression. Molecular and Cellular Biology 28, 2167–74
241. Gartel, A. L. and Radhakrishnan, S. K. (2005) Lost in transcription: p21 repression, mechanisms, and consequences. Cancer Research 65, 3980–5
242. Kurreck, J., Wyszko, E., Gillen, C. and Erdmann, V. A. (2002) Design of antisense oligonucleotides stabilized by locked nucleic acids. Nucleic Acids Research 30, 1911–
8
243. Christensen, U., Jacobsen, N., Rajwanshi, V. K., Wengel, J. and Koch, T. (2001) Stopped-flow kinetics of locked nucleic acid (LNA)-oligonucleotide duplex formation: studies of LNA-DNA and DNA-DNA interactions. Biochemical Journal 354, 481–484
244. Wahlestedt, C., Salmi, P., Good, L., Kela, J., Johnsson, T., Ho, T., Broberger, C., Porreca, F., Lai, J., Ren, K., Ossipov, M., Koshkin, A., Jakobsen, N., Skouv, J., Oerum, H., Jacobsen, M. H. and Wengel, J. (2000) Potent and nontoxic antisense oligonucleotides containing locked nucleic acids. PNAS 97, 5633–5638
245. Brown, D. A., Kang, S. H., Gryaznov, S. M., DeDionisio, L., Heidenreich, O., Sullivan, S., Xu, X. and Nerenberg, M. I. (1994) Effect of phosphorothioate modification of oligodeoxynucleotides on specific protein binding. The Journal of Biological Chemistry 269, 26801–5
246. Boussif, O., Lezoualc’h, F., Zanta, M. A., Mergny, M. D., Scherman, D., Demeneix, B. and Behr, J. P. (1995) A versatile vector for gene and oligonucleotide transfer into cells in culture and in vivo: polyethylenimine. Proceedings of the National Academy of Sciences of the United States of America 92, 7297–301
247. Guenther, M. G., Levine, S. S., Boyer, L. A., Jaenisch, R. and Young, R. A. (2007) A Chromatin Landmark and Transcription Initiation at Most Promoters in Human Cells. Cell 130, 77–88
248. Ji, M., Rao, E., Ramachandrareddy, H., Shen, Y., Jiang, C., Chen, J., Hu, Y., Rizzino, A., Chan, W. C., Fu, K. and McKeithan, T. W. (2011) The miR-17-92 microRNA cluster is regulated by multiple mechanisms in B-cell malignancies. The American Journal of Pathology 179, 1645–56
249. Pospisil, V., Vargova, K., Kokavec, J., Rybarova, J., Savvulidi, F., Jonasova, A., Necas, E., Zavadil, J., Laslo, P. and Stopka, T. (2011) Epigenetic silencing of the oncogenic miR-17-92 cluster during PU.1-directed macrophage differentiation. The EMBO Journal 30, 4450–64
250. R Core Team (2012) R: A Language and Environment for Statistical Computing. R Foundation for Statistical Computing
251. Venturini, L., Battmer, K., Castoldi, M., Schultheis, B., Hochhaus, A., Muckenthaler, M. U., Ganser, A., Eder, M. and Scherr, M. (2007) Expression of the miR-17-92 polycistron in chronic myeloid leukemia (CML) CD34+ cells. Blood 109, 4399–405
252. Kwon, S. H. and Workman, J. L. (2011) HP1c casts light on dark matter. Cell Cycle 10,
625–630
253. Minc, E., Allory, Y., Worman, H. J., Courvalin, J. and Buendia, B. (1999) Localization and phosphorylation of HP1 proteins during the cell cycle in mammalian cells. Chromosoma 108, 220–234
254. Mateescu, B., Bourachot, B., Rachez, C., Ogryzko, V. and Muchardt, C. (2008) Regulation of an inducible promoter by an HP1beta-HP1gamma switch. EMBO Reports 9, 267–72

References
100
255. Fischle, W., Tseng, B. S., Dormann, H. L., Ueberheide, B. M., Garcia, B. A., Shabanowitz, J., Hunt, D. F., Funabiki, H. and Allis, C. D. (2005) Regulation of HP1-chromatin binding by histone H3 methylation and phosphorylation. Nature 438, 1116–22
256. Adams, M. R., Sears, R., Nuckolls, F., Leone, G. and Nevins, J. R. (2000) Complex Transcriptional Regulatory Mechanisms Control Expression of the E2F3 Locus. Molecular and Cellular Biology 20, 3633–3639
257. Thalmeier, K., Synovzik, H., Mertz, R., Winnacker, E. L. and Lipp, M. (1989) Nuclear factor E2F mediates basic transcription and trans-activation by E1a of the human MYC promoter. Genes & Development 3, 527–536
258. Wong, J. V., Dong, P., Nevins, J. R., Mathey-Prevot, B. and You, L. (2011) Network calisthenics: Control of E2F dynamics in cell cycle entry. Cell Cycle 10, 3086–3094
259. Wain, H. M., Bruford, E. A., Lovering, R. C., Lush, M. J., Wright, M. W. and Povey, S. (2002) Guidelines for human gene nomenclature. Genomics 79, 464–70

101
APPENDIX
A. Publication I
The proto-oncogene Pim-1 is a target of miR-33a.
Oncogene (2012), 31, 918-928
Impact Factor 2011: 6.37*
*2011 Journal Citation Reports (Thomson Reuters, 2012)
Author contributions:
Research design: 35 %
Experimental work: 65 %
Data analysis and evaluation: 70 %
Manuscript writing: 30 %

ORIGINAL ARTICLE
The proto-oncogene Pim-1 is a target of miR-33a
M Thomas1, K Lange-Grunweller1, U Weirauch2, D Gutsch2, A Aigner2, A Grunweller1
and RK Hartmann1
1Institute of Pharmaceutical Chemistry, Faculty of Pharmacy, Philipps-University Marburg, Marburg, Germany and 2Instituteof Pharmacology, Faculty of Medicine, Philipps-University Marburg, Marburg, Germany
The constitutively active serine/threonine kinase Pim-1 isupregulated in different cancer types, mainly based on theaction of several interleukines and growth factors at thetranscriptional level. So far, a regulation of oncogenicPim-1 by microRNAs (miRNAs) has not been reported.Here, we newly establish miR-33a as a miRNA withpotential tumor suppressor activity, acting throughinhibition of Pim-1. A screen for miRNA expression inK562 lymphoma, LS174T colon carcinoma and severalother cell lines revealed generally low endogenous miR-33a levels relative to other miRNAs. Transfection of K562and LS174T cells with a miR-33a mimic reduced Pim-1levels substantially. In contrast, the cell-cycle regulatorcyclin-dependent kinase 6 predicted to be a conservedmiR-33a target, was not downregulated by the miR-33amimic. Seed mutagenesis of the Pim-1 30-untranslatedregion in a luciferase reporter construct and in a Pim-1cDNA expressed in Pim-1-deficient Skov-3 cells demon-strated specific and direct downregulation of Pim-1 by themiR-33a mimic. The persistence of this effect wascomparable to that of a small interfering RNA-mediatedknockdown of Pim-1, resulting in decelerated cellproliferation. In conclusion, we demonstrate the potentialof miR-33a to act as a tumor suppressor miRNA, whichsuggests miR-33a replacement therapy through delivery ofmiR mimics as a novel therapeutic strategy.Oncogene (2012) 31, 918–928; doi:10.1038/onc.2011.278;published online 11 July 2011
Keywords: Pim-1; microRNA; miR-33a; proliferation;RNAi; siRNA
Introduction
MicroRNAs (miRNAs) are important regulators ofgene expression, controlling developmental processeslike embryonic stem cell differentiation, several meta-bolic pathways, cell proliferation, apoptosis and stressresponses (for reviews see Bartel, 2004; Gangaraju and
Lin, 2009). Like small interfering RNAs (siRNAs),miRNAs are loaded into Argonaute-containing ‘RNA-induced silencing complexes’ called miRNA ribonucleo-protein complexes (miRNPs) (Wang et al., 2009). Ingeneral, miRNAs have partial complementarity to theirtarget mRNAs leading to translational inhibition ordegradation of the respective mRNA in P-bodies (Liuet al., 2005; Rehwinkel et al., 2005). A prerequisite formiRNA interaction with mRNA targets is the so-called‘seed region’ covering nucleotides (nt) 2–8 of the maturemiRNA strand. This region usually forms a continuousduplex with the target followed by an unpaired regionand a second less stringent base-pairing interaction(Lewis et al., 2005; Grimson et al., 2007; Bartel, 2009).
Many miRNAs have been identified to be involvedin the development of cancer or metastasis, forexample miR-21, members of the miR-17-92 cluster ormiR-155, and are therefore called oncogenic miRNAs(Esquela-Kerscher and Slack, 2006). These miRNAscan downregulate targets that are involved in theregulation of apoptosis or cell-cycle progression, suchas the phosphatase and tensin homolog (Pten), thetranscription factor E2F1 or the apoptotic regulatorBim (for review see Croce, 2009). On the other hand,certain oncogenes like the transcription factor c-Mycare involved in the transcriptional regulation ofmiRNAs (O’Donnell et al., 2005).
Other miRNAs, for example miR-15a, miR-16-1, let-7a and miR-145, have been reported to be able to exerttumor suppressor activity by controlling targets that caninhibit apoptosis or promote cell-cycle progression. Thetumor suppressor function of miRNAs is mainly directedagainst classical oncogenes, including the small G-proteinRas, the transcription factor c-Myc, Bcl-2, or cell cycle-dependent kinases like Cdk4 and Cdk6 (Cimmino et al.,2005; Iorio et al., 2005; Johnson et al., 2005; Croce, 2009).Consequently, in several tumors, these miRNAs aredownregulated or not expressed at all (Garzon et al.,2009). For example, miR-15a and miR-16-1 are encodedin the chromosomal region 13q14.3 and loss of this regionis the most common genomic aberration in chroniclymphocytic leukemia (Calin et al., 2002). Likewise,downregulation or loss of expression of these twomiRNAs are frequently observed in prostata carcinomas(Bonci et al., 2008).
Beyond Cdk4 and Cdk6, we are not aware of anyother examples of oncogenic kinases regulated bymiRNAs, despite the fact that the activities of oncogenic
Received 14 July 2010; revised 2 June 2011; accepted 4 June 2011;published online 11 July 2011
Correspondence: Dr A Grunweller or Professor RK Hartmann,Institute of Pharmaceutical Chemistry, Philipps-University Marburg,Marbacher Weg 6, AG Hartmann, Marburg 35037 Germany.E-mails: [email protected] [email protected]
Oncogene (2012) 31, 918–928& 2012 Macmillan Publishers Limited All rights reserved 0950-9232/12
www.nature.com/onc
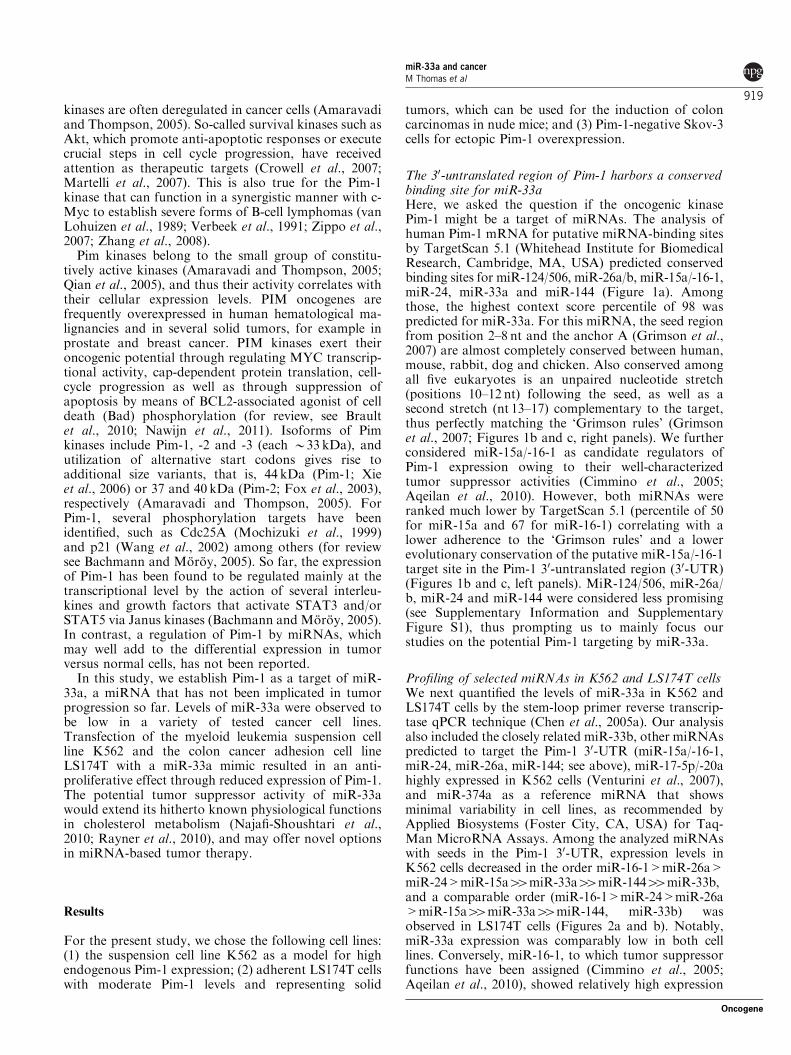
kinases are often deregulated in cancer cells (Amaravadiand Thompson, 2005). So-called survival kinases such asAkt, which promote anti-apoptotic responses or executecrucial steps in cell cycle progression, have receivedattention as therapeutic targets (Crowell et al., 2007;Martelli et al., 2007). This is also true for the Pim-1kinase that can function in a synergistic manner with c-Myc to establish severe forms of B-cell lymphomas (vanLohuizen et al., 1989; Verbeek et al., 1991; Zippo et al.,2007; Zhang et al., 2008).
Pim kinases belong to the small group of constitu-tively active kinases (Amaravadi and Thompson, 2005;Qian et al., 2005), and thus their activity correlates withtheir cellular expression levels. PIM oncogenes arefrequently overexpressed in human hematological ma-lignancies and in several solid tumors, for example inprostate and breast cancer. PIM kinases exert theironcogenic potential through regulating MYC transcrip-tional activity, cap-dependent protein translation, cell-cycle progression as well as through suppression ofapoptosis by means of BCL2-associated agonist of celldeath (Bad) phosphorylation (for review, see Braultet al., 2010; Nawijn et al., 2011). Isoforms of Pimkinases include Pim-1, -2 and -3 (each B33 kDa), andutilization of alternative start codons gives rise toadditional size variants, that is, 44 kDa (Pim-1; Xieet al., 2006) or 37 and 40 kDa (Pim-2; Fox et al., 2003),respectively (Amaravadi and Thompson, 2005). ForPim-1, several phosphorylation targets have beenidentified, such as Cdc25A (Mochizuki et al., 1999)and p21 (Wang et al., 2002) among others (for reviewsee Bachmann and Moroy, 2005). So far, the expressionof Pim-1 has been found to be regulated mainly at thetranscriptional level by the action of several interleu-kines and growth factors that activate STAT3 and/orSTAT5 via Janus kinases (Bachmann and Moroy, 2005).In contrast, a regulation of Pim-1 by miRNAs, whichmay well add to the differential expression in tumorversus normal cells, has not been reported.
In this study, we establish Pim-1 as a target of miR-33a, a miRNA that has not been implicated in tumorprogression so far. Levels of miR-33a were observed tobe low in a variety of tested cancer cell lines.Transfection of the myeloid leukemia suspension cellline K562 and the colon cancer adhesion cell lineLS174T with a miR-33a mimic resulted in an anti-proliferative effect through reduced expression of Pim-1.The potential tumor suppressor activity of miR-33awould extend its hitherto known physiological functionsin cholesterol metabolism (Najafi-Shoushtari et al.,2010; Rayner et al., 2010), and may offer novel optionsin miRNA-based tumor therapy.
Results
For the present study, we chose the following cell lines:(1) the suspension cell line K562 as a model for highendogenous Pim-1 expression; (2) adherent LS174T cellswith moderate Pim-1 levels and representing solid
tumors, which can be used for the induction of coloncarcinomas in nude mice; and (3) Pim-1-negative Skov-3cells for ectopic Pim-1 overexpression.
The 30-untranslated region of Pim-1 harbors a conservedbinding site for miR-33aHere, we asked the question if the oncogenic kinasePim-1 might be a target of miRNAs. The analysis ofhuman Pim-1 mRNA for putative miRNA-binding sitesby TargetScan 5.1 (Whitehead Institute for BiomedicalResearch, Cambridge, MA, USA) predicted conservedbinding sites for miR-124/506, miR-26a/b, miR-15a/-16-1,miR-24, miR-33a and miR-144 (Figure 1a). Amongthose, the highest context score percentile of 98 waspredicted for miR-33a. For this miRNA, the seed regionfrom position 2–8 nt and the anchor A (Grimson et al.,2007) are almost completely conserved between human,mouse, rabbit, dog and chicken. Also conserved amongall five eukaryotes is an unpaired nucleotide stretch(positions 10–12 nt) following the seed, as well as asecond stretch (nt 13–17) complementary to the target,thus perfectly matching the ‘Grimson rules’ (Grimsonet al., 2007; Figures 1b and c, right panels). We furtherconsidered miR-15a/-16-1 as candidate regulators ofPim-1 expression owing to their well-characterizedtumor suppressor activities (Cimmino et al., 2005;Aqeilan et al., 2010). However, both miRNAs wereranked much lower by TargetScan 5.1 (percentile of 50for miR-15a and 67 for miR-16-1) correlating with alower adherence to the ‘Grimson rules’ and a lowerevolutionary conservation of the putative miR-15a/-16-1target site in the Pim-1 30-untranslated region (30-UTR)(Figures 1b and c, left panels). MiR-124/506, miR-26a/b, miR-24 and miR-144 were considered less promising(see Supplementary Information and SupplementaryFigure S1), thus prompting us to mainly focus ourstudies on the potential Pim-1 targeting by miR-33a.
Profiling of selected miRNAs in K562 and LS174T cellsWe next quantified the levels of miR-33a in K562 andLS174T cells by the stem-loop primer reverse transcrip-tase qPCR technique (Chen et al., 2005a). Our analysisalso included the closely related miR-33b, other miRNAspredicted to target the Pim-1 30-UTR (miR-15a/-16-1,miR-24, miR-26a, miR-144; see above), miR-17-5p/-20ahighly expressed in K562 cells (Venturini et al., 2007),and miR-374a as a reference miRNA that showsminimal variability in cell lines, as recommended byApplied Biosystems (Foster City, CA, USA) for Taq-Man MicroRNA Assays. Among the analyzed miRNAswith seeds in the Pim-1 30-UTR, expression levels inK562 cells decreased in the order miR-16-1>miR-26a>miR-24>miR-15a44miR-33a44miR-14444miR-33b,and a comparable order (miR-16-1>miR-24>miR-26a>miR-15a44miR-33a44miR-144, miR-33b) wasobserved in LS174T cells (Figures 2a and b). Notably,miR-33a expression was comparably low in both celllines. Conversely, miR-16-1, to which tumor suppressorfunctions have been assigned (Cimmino et al., 2005;Aqeilan et al., 2010), showed relatively high expression
miR-33a and cancerM Thomas et al
919
Oncogene
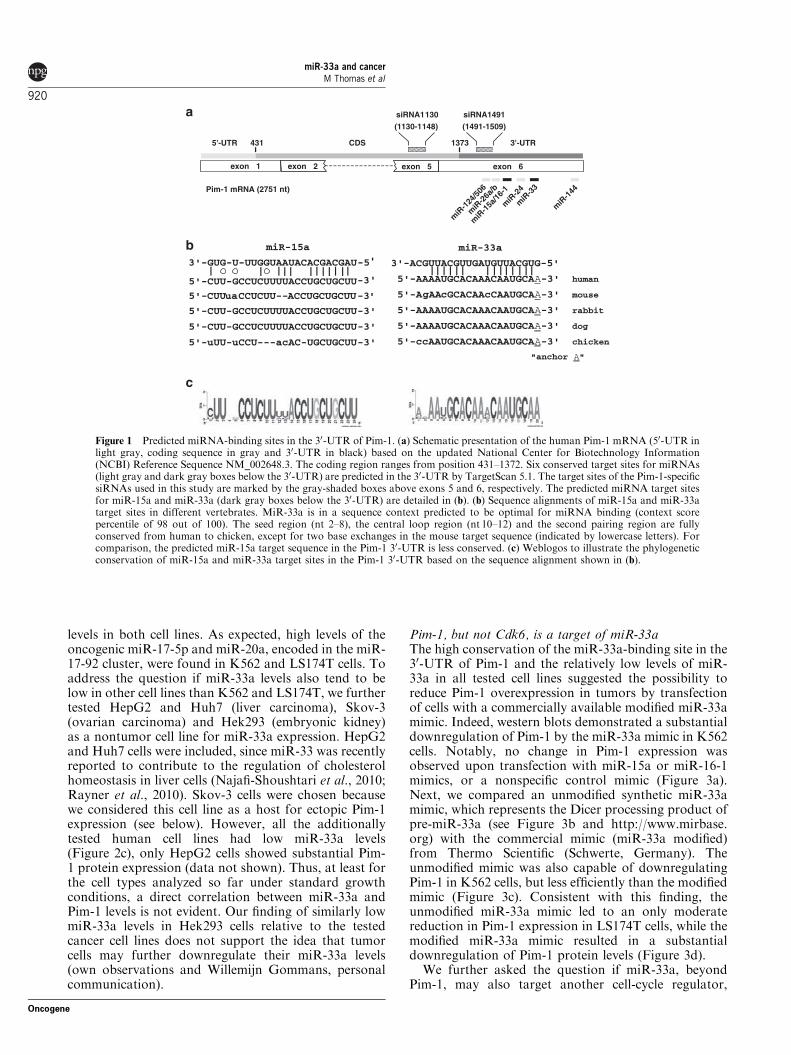
levels in both cell lines. As expected, high levels of theoncogenic miR-17-5p and miR-20a, encoded in the miR-17-92 cluster, were found in K562 and LS174T cells. Toaddress the question if miR-33a levels also tend to below in other cell lines than K562 and LS174T, we furthertested HepG2 and Huh7 (liver carcinoma), Skov-3(ovarian carcinoma) and Hek293 (embryonic kidney)as a nontumor cell line for miR-33a expression. HepG2and Huh7 cells were included, since miR-33 was recentlyreported to contribute to the regulation of cholesterolhomeostasis in liver cells (Najafi-Shoushtari et al., 2010;Rayner et al., 2010). Skov-3 cells were chosen becausewe considered this cell line as a host for ectopic Pim-1expression (see below). However, all the additionallytested human cell lines had low miR-33a levels(Figure 2c), only HepG2 cells showed substantial Pim-1 protein expression (data not shown). Thus, at least forthe cell types analyzed so far under standard growthconditions, a direct correlation between miR-33a andPim-1 levels is not evident. Our finding of similarly lowmiR-33a levels in Hek293 cells relative to the testedcancer cell lines does not support the idea that tumorcells may further downregulate their miR-33a levels(own observations and Willemijn Gommans, personalcommunication).
Pim-1, but not Cdk6, is a target of miR-33aThe high conservation of the miR-33a-binding site in the30-UTR of Pim-1 and the relatively low levels of miR-33a in all tested cell lines suggested the possibility toreduce Pim-1 overexpression in tumors by transfectionof cells with a commercially available modified miR-33amimic. Indeed, western blots demonstrated a substantialdownregulation of Pim-1 by the miR-33a mimic in K562cells. Notably, no change in Pim-1 expression wasobserved upon transfection with miR-15a or miR-16-1mimics, or a nonspecific control mimic (Figure 3a).Next, we compared an unmodified synthetic miR-33amimic, which represents the Dicer processing product ofpre-miR-33a (see Figure 3b and http://www.mirbase.org) with the commercial mimic (miR-33a modified)from Thermo Scientific (Schwerte, Germany). Theunmodified mimic was also capable of downregulatingPim-1 in K562 cells, but less efficiently than the modifiedmimic (Figure 3c). Consistent with this finding, theunmodified miR-33a mimic led to an only moderatereduction in Pim-1 expression in LS174T cells, while themodified miR-33a mimic resulted in a substantialdownregulation of Pim-1 protein levels (Figure 3d).
We further asked the question if miR-33a, beyondPim-1, may also target another cell-cycle regulator,
exon 1 exon 2
5'-UTR 431 CDS 1373 3'-UTR
Pim-1 mRNA (2751 nt)
siRNA1130
(1130-1148)
exon 5 exon 6
miR
-124
/506
miR
-26a
/b
miR
-15a
/16-1
miR
-24
miR
-33
miR
-144
siRNA1491
(1491-1509)
3'-GUG-U-UUGGUAAUACACGACGAU -5'
5'-CUU-GCCUCUUUUACCUGCUGCUU-3'
5'-CUUuaCCUCUU--ACCUGCUGCUU-3'
5'-CUU-GCCUCUUUUACCUGCUGCUU-3'
5'-CUU-GCCUCUUUUACCUGCUGCUU-3'
5'-uUU-uCCU---acAC-UGCUGCUU-3'
3'-ACGUUACGUUGAUGUUACGUG-5'
5'-AAAAUGCACAAACAAUGCAA-3' human
5'-AgAAcGCACAAcCAAUGCAA-3' mouse
5'-AAAAUGCACAAACAAUGCAA-3' rabbit
5'-AAAAUGCACAAACAAUGCAA-3' dog
5'-ccAAUGCACAAACAAUGCAA-3' chicken
"anchor A"
miR-15ab miR-33a
c
a
Figure 1 Predicted miRNA-binding sites in the 30-UTR of Pim-1. (a) Schematic presentation of the human Pim-1 mRNA (50-UTR inlight gray, coding sequence in gray and 30-UTR in black) based on the updated National Center for Biotechnology Information(NCBI) Reference Sequence NM_002648.3. The coding region ranges from position 431–1372. Six conserved target sites for miRNAs(light gray and dark gray boxes below the 30-UTR) are predicted in the 30-UTR by TargetScan 5.1. The target sites of the Pim-1-specificsiRNAs used in this study are marked by the gray-shaded boxes above exons 5 and 6, respectively. The predicted miRNA target sitesfor miR-15a and miR-33a (dark gray boxes below the 30-UTR) are detailed in (b). (b) Sequence alignments of miR-15a and miR-33atarget sites in different vertebrates. MiR-33a is in a sequence context predicted to be optimal for miRNA binding (context scorepercentile of 98 out of 100). The seed region (nt 2–8), the central loop region (nt 10–12) and the second pairing region are fullyconserved from human to chicken, except for two base exchanges in the mouse target sequence (indicated by lowercase letters). Forcomparison, the predicted miR-15a target sequence in the Pim-1 30-UTR is less conserved. (c) Weblogos to illustrate the phylogeneticconservation of miR-15a and miR-33a target sites in the Pim-1 30-UTR based on the sequence alignment shown in (b).
miR-33a and cancerM Thomas et al
920
Oncogene

cyclin-dependent kinase 6 (Cdk6), since Targetscan 5.1had ranked Cdk6 position three among putative miR-33a targets owing to the presence of two conservedtarget sites in its 30-UTR (Supplementary Figure S2);
the context score percentile was 98 for target site 1and 20 for site 2). For comparison, Pim-1 was rankedposition 56. Cdk6, as Cdk4, promotes the G1/Stransition of the cell cycle in conjunction with D-typecyclins through phosphorylation and thus inactiva-tion of the tumor suppressor protein Rb (Meyersonand Harlow, 1994). Western blot analysis after transfec-tion of K562 cells with the modified and unmodi-fied miR-33a mimics, however, provided no evidencefor downregulation of Cdk6 by miR-33a mimics(Figure 3c). Recently, p53 and ATP-binding cassettetransporter A1 (ABCA1) were published as targets ofmiR-33a (Herrera-Merchan et al., 2010; Najafi-Shoush-tari et al., 2010; Rayner et al., 2010). Since K562 isa p53-deficient cell line (Zhang et al., 1993), we wereonly able to test if p53 may also be downregulatedby miR-33a mimics in LS174T cells. However, transfec-tion of miR-33a mimics in several independent experi-ments provided no evidence for a downregulation ofp53 in LS174T cells (Figure 3d). This observationdeviates from the findings of Herrera-Merchan et al.(2010) obtained in the mouse system, but is consistentwith the fact that, in the human system, the twopredicted target sites of miR-33a in the p53 30-UTR(Herrera-Merchan et al., 2010) would each include twoseed mismatches when paired to miR-33a. Unfortu-nately, the ABCA1 transporter was hardly detectable in K562 and LS174T cells (data not shown),which also disfavored the use of ABCA1 as a straight-forward second model target to demonstrate inhibitionby miR-33a in K562 cells.
Pim-1 knockdown by the miR-33a mimic versus siRNANext, we compared the miR-33a-dependent downregu-lation of Pim-1 with the knockdown mediated by aPim-1-specific siRNA (siRNA1130 directed againstexon 5, Figure 1a). While the siRNA transfectionresulted in a very efficient knockdown of Pim-1 (Figures4a and b), the reduction in Pim-1 protein levels mediatedby the modified miR-33a mimic was less profound(Figure 4b). However, the time dependence of Pim-1knockdown was similar for the Pim-1-specific siRNAand the miR-33a mimic, with decreased protein levelsalready visible after 24 h, a maximum reduction beingreached after 72 h and lower Pim-1 levels still presentat 96 h posttransfection of K562 cells (Figure 4b).A weaker knockdown by the modified miR-33a mimicis consistent with the general trend of miRNAs torepress expression of individual targets more moderatelythan siRNAs (Selbach et al., 2008). To evaluate if themiR-33a target site in the Pim-1 30-UTR can also beaccessed by an siRNA to possibly enhance the Pim-1knockdown effect relative to miR-33a, we further testedsiRNA 33a fully complementary to the miR-33a targetsite. Knockdown efficacy was similar to that causedby the modified miR-33a mimic, as inferred fromwestern blot signal intensities (Figure 4c, cf. lanes 2and 3). We also tested a modified miR-33b mimic but wewere unable to detect any Pim-1 downregulation (datanot shown).
0.1
1
10
2-Cp (
x 10
6 )
miR
-15a
miR
-16-
1
miR
-17
miR
-20a
miR
-24
miR
-26a
miR
-33a
miR
-33b
miR
-144
miR
-374
a
LS174T
0.1
1
miR
-15a
10
1002-C
p (
x 10
6 )
miR
-16-
1
miR
-17
miR
-20a
miR
-24
miR
-26a
miR
-33a
miR
-33b
miR
-144
miR
-374
a
K562
2-Cp (
x 10
6 )
K562
LS174T
HEK293
HUH7
Skov-
3
HepG2
1
0.1
Figure 2 miRNA profiling in K562 and LS174T cells.(a) Expression profiling of 10 human miRNAs in K562 cells usingthe stem-loop primer reverse transcriptase qPCR technique. Valuesare based on Cp values (see Supplementary Information) derivedfrom three independent experiments each performed in triplicate(±s.e.m.). (b) Expression profiling for the same set of miRNAs inLS174T cells. (c) Levels of miR-33a in a set of selected cell lines,demonstrating its generally low expression.
miR-33a and cancerM Thomas et al
921
Oncogene

Specificity of miR-33a binding to the Pim-1 30-UTRTo further analyze the repression of Pim-1 expressionby the miR-33a mimic (Figures 3 and 4), we cloned the30-UTR of Pim-1 into a luciferase reporter vector (pGL3control). K562 cells were cotransfected with thisconstruct and either the modified miR-33a mimic,siRNA 33a targeting the same Pim-1 mRNA sequenceor the modified control mimic. A significant >50%reduction of luciferase activity was determined for the
modified miR-33a mimic relative to the modified controlmimic (Figure 5, open bars). Compared with the westernblot analysis (Figure 4c), the siRNA 33a was moreefficient than the modified miR-33a mimic in thisreporter assay. This may suggest that either theluciferase reporter assay is more sensitive than westernblot analysis, or the reporter assay system may some-what differently respond to targeting by RNAi machi-neries than the Pim-1 30-UTR in its natural context.
Figure 3 Human Pim-1 is a target for miR-33a. (a) Pim-1 is downregulated by a miR-33a mimic transfected into K562 cells, whilemiR-15a and miR-16-1 mimics as well as the control mimic have no measurable effects on Pim-1 expression levels. Total cellularprotein preparations were separated on 15% sodium dodecyl sulfate-polyacrylamide gels and analyzed by western blotting withantibodies specific to Pim-1 or b-actin used as a loading control. (b) Structure of the unmodified miR-33a mimic tested in (c) next to amodified mimic obtained from Thermo Scientific Dharmacon; the unmodified miR-33a mimic corresponds to the natural Dicerprocessing product of pre-miR-33a, but lacking the 50-phosphates; the miRNA strand is marked by gray letters; open circles indicateG-U wobble base pairs. (c) Pim-1 knockdown efficacy of the unmodified miR-33a mimic (miR-33a unmod.) was compared with that ofa modified miR-33a mimic and the control mimic by western blotting using total protein extracts from K562 cells. After detection of b-actin, the membrane was again stripped to detect Cdk6 in the identical samples. The miR-33a mimics had no effect on Cdk6 expressionlevels although two miR-33a-binding sites are predicted in the Cdk6 30-UTR by TargetScan 5.1 (Supplementary Figure S2). For furtherdetails, see (a). (d) Western blot analysis performed as in (c), but using LS174T cells. As another control of the miR-33a effect on Pim-1, the same protein samples were analyzed for the level of p53 recently reported to be a target of miR-33 in mice (Herrera-Merchanet al., 2010). However, we were unable to detect a significant repression of p53 by miR-33a in LS174T cells, as inferred from severalindependent experiments.
Figure 4 Comparison of Pim-1 knockdown by the miR-33a mimic versus a Pim-1-specific siRNA in K562 cells. (a) Knockdownefficacy of the Pim-1-specific siRNA1130 (Figure 1a) over mock-transfected (—) cells or negative control siRNA (VR1 siRNA), seeSupplementary Information. (b) Comparison of the Pim-1 knockdown persistence for the modified miR-33a mimic versus the Pim-1siRNA, measured 24, 72 and 96 h posttransfection. (c) Comparison of Pim-1 knockdown efficacy upon transfection with the modifiedmiR-33a mimic (lane 2), the siRNA directed against the miR-33a target site (lane 3) or the Pim-1 siRNA1130 (lane 4). In all threepanels, western blot experiments were conducted with an antibody specific to human Pim-1, and an antibody against b-actin was usedas loading control.
miR-33a and cancerM Thomas et al
922
Oncogene

We further scrutinized the specificity of the observedmiR-33a effect on Pim-1 expression by mutating themiR-33a seed region in the Pim-1-derived 30-UTRof the luciferase reporter (from 50-ACAATGCA to50-ACAGTGCG). Indeed, the repression effects obser-ved for the modified miR-33a mimic or siRNA 33a wereessentially abrogated in the presence of a mutated seedregion (Figure 5, gray bars).
Ectopic expression of Pim-1 in Skov-3 cellsTo further substantiate that miR-33a specifically anddirectly represses Pim-1 expression, we transfected thePim-1-deficient ovarian cancer cell line Skov-3 with ahuman Pim-1 full-length cDNA. Pim-1 overexpressionin Skov-3 cells resulted in Pim-1 western blot signalscomparable to those observed in K562 cells (this alsoholds true for transfection of Hek293 cells with the samecDNA; data not shown). Cotransfection of the Pim-1-specific siRNA and the modified miR-33a mimic, butnot the control mimic, resulted in Pim-1 downregulation(Figure 6a). However, a Pim-1 cDNA variant harboringa mutagenized miR-33a seed (see legend to Figure 5)remained responsive to the siRNA whose target site wasnot affected by the seed mutations, but lost itsresponsiveness to the miR-33a mimic (Figure 6b). Like-
wise, a deletion of the entire Pim-1 30-UTR abolishedthe observed miR-33a-dependent Pim-1 downregulation(Figure 6c). Taken together, these findings furthersupport our conclusion that miR-33a is able tospecifically and directly suppress Pim-1 mRNAutilization via the identified miR-33a target site in thePim-1 30-UTR.
A miR-33a mimic decelerates tumor cell proliferationTo address the biological relevance of the observed miR-33a effects on Pim-1 expression, we hypothesized that
contro
l mim
ic
mim
ic 33
a
siRNA 33
a
contro
l mim
ic
mim
ic 33
a
siRNA 33
a0
0.2
0.4
0.6
0.8
1.0
1.2
1.4
1.6
no
rmal
ized
RL
Uwt seed mutant seed
Figure 5 MiR-33a-specific regulation of Pim-1 expression.Reporter assay using a plasmid-based luciferase coding regionfused to the 30-UTR of Pim-1, either containing the wild-typemiR-33a target sequence (wt seed 50-ACAAUGCA, open bars) or amutated miR-33a target site (mutant seed 50-ACAGUGCG, graybars). K562 cells were cotransfected with the control mimic,modified miR-33a mimic or siRNA 33a fully complementary to themir-33a seed plus 11 nt upstream in the Pim-1 30-UTR. Datarepresent mean values derived from at least three independentexperiments; RLU, relative light units (±s.e.m.), normalized tothose obtained with extracts from cells expressing the reportermRNA with the wt seed and cotransfected with the control mimic(first bar on the left).
Figure 6 Effects of the miR-33a mimic and Pim-1 siRNA1491 onectopic Pim-1 expression in Skov-3 cells. (a) A full-length Pim-1cDNA (25–50 ng) was transfected into Pim-1-negative Skov-3 cellsand overexpression of Pim-1 was detected by western blotting.Cotransfection of the modified miR-33a mimic or Pim-1 siR-NA1491 (targeting exon 6 in the 30-UTR of Pim-1; see Figure 1a)resulted in Pim-1 downregulation; con. siRNA, VR1 siRNA;C-mimic, modified control mimic. (b) Mutagenesis of the miR-33atarget site (mutant seed 50-ACAGUGCG) in the 30-UTR of thefull-length Pim-1 cDNA abrogated Pim-1 downregulation by themodified miR-33a mimic, but did not interfere with suppression bythe Pim-1-specific siRNA1491; for further details, see (a); foruniformity, the control and Pim-1 siRNA lanes were interchangedin position relative to the original western blot, which is indica-ted by vertical lines. (c) Deletion of the 30-UTR except for the30-terminal B400 nt in the Pim-1 cDNA, which removes thebinding site for miR-33a, resulted in a loss of Pim-1 down-regulation by the modified miR-33a mimic; for further details, see(a); none, no effector siRNA or miRNA transfected. Western blotexperiments in (a–c) were conducted with an antibody specific tohuman Pim-1, and an antibody against b-actin was used as loadingcontrol. The same western blot illustrating endogenous Pim-1 levelsin K562 cells is shown in all panels for comparison on the left;minus sign (c), no transfection with Pim-1 cDNA plasmid; plussign, transfected with the Pim-1 cDNA plasmid.
miR-33a and cancerM Thomas et al
923
Oncogene

miR-33a may negatively affect cell proliferation throughreduction of Pim-1, since a previous study (Zhang et al.,2008) had suggested a direct role of Pim-1 in regulatingK562 cell proliferation. Indeed, under reduced serumconditions (2% fetal calf serum (FCS)), but not in thepresence of 10% FCS (Supplementary Figure S3a), ananti-proliferative effect of the miR-33a mimic wasobserved in K562 cells (Figure 7a). Consistently, Pim-1levels in untreated K562 cells were reduced under theseserum starvation conditions (2% FCS; SupplementaryFigure S3b, left two lanes). This may suggest that Pim-1levels need to fall below a threshold concentration, and/or that growth factors need to be lacking in the medium,to make the cells more sensitive towards miR-33a-mediated Pim-1 repression and thus to allow thedetection of anti-proliferative effects in this cell line. InLS174T cells, reduced proliferation upon transfectionwith the modified miR-33a mimic was already seen inthe presence of 10% FCS (Figure 7b). Again, this couldbe attributed to the already lower expression levels ofPim-1 in LS174T relative to K562 cells (SupplementaryFigure S3b). In line with the more moderate miRNAeffects observed above (see Figure 4b), analysis of K562and LS174T cell proliferation upon transfection withPim-1-specific siRNAs revealed more pronouncedeffects relative to those obtained with the modifiedmiR-33a mimic. This was indicated by strong siRNA-mediated inhibition of cell proliferation in LS174T cells
(Figures 7d versus b) and in K562 cells already under10% FCS conditions (Figure 7c).
Cell-cycle analysis after miR-33a- or siRNA-mediatedPim-1 knockdown in K562 and LS174T cells providedevidence that a downregulation of Pim-1 results in adelay of cycle progression at the stage of the G2 to Mphase transition (data not shown), which is in line with aprevious study (Bachmann et al., 2004). This effect wasmore pronounced for K562 relative to LS174T cells,without any effects on apoptosis in both cell lines(Supplementary Figure S4).
Discussion
In this study, we newly establish miR-33a as a miRNAwith potential tumor suppressor activity and demon-strate by western blot analysis and reporter assays(Figures 3–6) that the oncogenic kinase Pim-1 is anevolutionarily highly conserved, specific and directtarget of miR-33a. Likewise, transfection of a miR-33amimic decelerates proliferation in colon cancer andleukemia cells, and exerts similar effects as Pim-1-specific siRNAs.
Notably, miR-33a had not been implicated in tumorprogression so far. In the human system, miR-33a andthe second family member miR-33b are encoded in
10080604020
0.3
0.2
0.1abso
rban
ce 4
50 n
m
abso
rban
ce 4
50 n
m1601208040
2
1
0
100806040
80
60
40
20
time after transfection (h)
cells
x 1
0-4
K562 (2% FCS)a b
c d
miR-33a mod.control mimicuntreated
K562 (10% FCS)
Pim-1 siRNAcontrol siRNA
time after transfection (h)
LS174T (10% FCS)
LS174T (10% FCS)
time after transfection (h)
miR-33a mod.control mimicuntreated
Pim-1 siRNAcontrol siRNA
abso
rban
ce 4
50 n
m
2
1
01601208040
time after transfection (h)
Figure 7 Anti-proliferative effects of a miR-33a- or siRNA-mediated Pim-1 knockdown. (a) Proliferation of untreated K562 cellscompared with K562 cells transfected with the modified miR-33a mimic or the control mimic. Cells were cultivated in the presence of2% FCS. Here, microscopic cell number counts are presented because in this case cell counting gave more reliable results than theWST-1 assay (Roche Applied Science, Mannheim, Germany). (b) Proliferation analysis of LS174T cells grown in the presence of 10%FCS. The amount of viable cells was determined by the WST-1 assay. (c) Proliferation of K562 cells in the presence of 10% FCS aftertransfection with the Pim-1-specific siRNA1130. Cell viability was determined by the WST-1 assay. (d) Proliferation of LS174T cells inthe presence of 10% FCS after transfection with the Pim-1-specific siRNA1491. Data shown in (a–d) represent mean values (±s.e.m.)derived from at least three independent experiments.
miR-33a and cancerM Thomas et al
924
Oncogene

introns of hSREBP-2 (chromosome 22) and hSREBP-1(chromosome 17), respectively. Both are key transcrip-tion regulators of genes involved in cholesterol biosynth-esis and uptake. Recently, it has been reported in twoindependent studies that miR-33a/b posttranscription-ally repress ABCA1, an important positive regulatorof high-density lipoprotein synthesis and reversecholesterol transport (Najafi-Shoushtari et al., 2010;Rayner et al., 2010). Tissue-specific miR-33a/b andhSREBP RNA levels were found to be tightly corre-lated, indicating that both intronic miRNAs arecoordinatedly expressed with the pre-mRNA they residein (Najafi-Shoushtari et al., 2010). In this context, anta-gonists of endogenous miR-33 were suggested as apotential therapeutic strategy to mitigate cardiometa-bolic diseases.
We have demonstrated that endogenous Pim-1 levelscan be reduced in K562 and LS174T cells by a miR-33amimic, siRNA 33a fully complementary to the miR-33atarget site, and most efficiently, by two different siRNAstargeting other regions of the Pim-1 mRNA. Theknockdown efficiency correlated with the strength ofthe inhibitory effect on cell proliferation (‘gene doseeffect,’ see Figures 3, 4 and 7). Thus, these resultsconfirm previous studies, which had shown that thereduction of endogenous Pim-1 levels by RNAi nega-tively affects the proliferation capacity of the humanlung carcinoma cell line H1299, of the prostate cancercell line PC-3 and of K562 cells (Zhang et al., 2007,2008, 2010).
Pim kinases have partially overlapping functions withthe survival kinase Akt (Amaravadi and Thompson,2005) since (1) both kinases directly phosphorylate andinactivate the pro-apoptotic Bad protein (Datta et al.,1997; Aho et al., 2004), (2) both contribute tomaintaining a high rate of protein translation throughphosphorylation and inactivation of the translationalrepressor 4EBP1, either directly in the case of Pim-1(Chen et al., 2005b; Xia et al., 2009), or indirectly viaTsc2 phosphorylation by Akt, which triggers 4EBP1phosphorylation via the mTOR complex 1 (Huang andManning, 2009); (3) Akt and Pim kinases can activatenuclear factor-kB-dependent transcription includingthat of an array of anti-apoptotic genes (reviewed inAmaravadi and Thompson, 2005). Thus, Pim kinasesmay act at some points as a cellular backup systemfor Akt, while supplementing Akt in other pathwaysto maintain cell proliferation and survival, such asduring cardioprotection where Pim-1 acts downstreamof Akt signaling (Muraski et al., 2007). We havedemonstrated that the miR-33a target site in the Pim-130-UTR is evolutionary strictly conserved, and Pim-1suppression by miR-33a is direct and specific. This is aclear indication that Pim-1 is a genuine target of miR-33a, although we have not yet identified the biologicalconstellation(s) under which endogenous miR-33a levelsincrease to an extent where they effectively repress Pim-1expression. As discussed before, expression of miR-33ais rather low and uniform in the cancerous humancell lines tested here (Figure 2), as it is in various humannormal and cancerous tissues (Najafi-Shoushtari et al.,
2010; Willemijn Gommans, personal communication).This is also consistent with our finding that miR-33alevels in human colon samples (matching pairs ofnormal and tumor tissue) were very similar betweennormal and tumorous tissue (data not shown). Thisraises the question under which conditions miR-33a willbe substantially upregulated. Since miR-33a expressionis coupled to hSREBP-2 expression, a key transcriptionregulator of genes involved in cholesterol biosynthesisand uptake, it is not unlikely that cellular miR-33aupregulation may link cholesterol metabolism to cellproliferation via miR-33a-mediated repression ofPim-1. It is conceivable that miR-33a-mediatedsuppression of Pim-1 may be relevant in a specializedbiological context such as cardioprotection or embryo-nic development.
Pim-1 is overexpressed to different extents in tumorcell lines, for example K562 or LS174T, where cellproliferation critically depends on the presence of Pim-1.Furthermore, Pim kinases are overexpressed in a seriesof human hematological malignancies and in severalsolid tumors. In the normal cellular context, Pim-1 isweakly or not at all expressed and appears to belargely dispensable, as inferred from the fact thatknockout mice with a deletion of all three Pim isoforms(Pim-1, -2, -3) showed only moderate phenotypes(Mikkers et al., 2004). This qualifies Pim-1 as apromising target for anti-tumor strategies, for examplethrough RNAi, since side effects on healthy tissues areexpected to be moderate. In contrast, single knockoutsof Akt isoforms (Akt-1, -2, -3) in mice resulted insevere phenotypes (Yang et al., 2004). This suggeststhat Pim-1 may be a more attractive target than Akt intumor therapy.
Beyond the inhibition of Pim-1 on the protein level bysmall inhibitors or knockdown via siRNAs, we demon-strate in this paper that a therapeutic effect may also beachieved through miR-33a-mediated downregulation ofPim-1. MiRNAs are estimated to have, on average, upto 200 targets, which also opens the perspective toexploit synergistic effects on various targets to efficientlyinduce apoptosis and/or cell-cycle arrest in tumor cells.Indeed, the concept of miRNA replacement therapy hasrecently been successfully applied to the tumor suppres-sing miR-26a in a mouse model of hepatocellularcarcinoma (Kota et al., 2009). This was the first proof-of-concept study demonstrating that miRNAs can beused as general anti-cancer compounds. Recently, theSlack group demonstrated the therapeutic potential oflet-7 (Trang et al., 2009), a miRNA family whosemembers map to chromosomal regions frequentlydeleted in lung cancer (Calin et al., 2004), providinganother example of miRNA replacement therapy incancer treatment. Still, miRNA mimic or anti-miRstrategies may also result in adverse effects, arising fromthe capacity of miRNAs to regulate multiple targets.This may also be true for miR-33a mimics which,beyond the anti-tumor effect via Pim-1 shown in thisstudy, may well elicit aberrations of cholesterol meta-bolism (Najafi-Shoushtari et al., 2010; Rayner et al.,2010) or exert additional effects on so far unknown
miR-33a and cancerM Thomas et al
925
Oncogene

targets. Thus, while we firmly establish the miR-33a/Pim-1 axis, the suitability of miR-33a mimics as thera-peutic molecules remains to be shown and is currentlyunder investigation in our laboratory. In fact, wealready have experimental data obtained in a s.c. coloncarcinoma xenograft model, showing a significantreduction in tumor growth upon nanoparticle-mediateddelivery of miR-33a (Ibrahim et al., 2011).
Materials and methods
cDNAThe full-length human Pim-1 cDNA was purchased fromOriGene (Rockville, MD, USA).
miRNA mimicsModified miRNA mimics (exact structure and modificationpattern not disclosed) were purchased from Thermo Scientificand were based on the sequence of the natural mature miRNAsingle strands:
miR-33a: 50-GUG CAU UGU AGU UGC AUU GCAmiR-15a: 50-UAG CAG CAC AUA AUG GUU UGU GmiR-16-1: 50-UAG CAG CAC GUA AAU AUU GGC Gnegative control mimic (C-mimic) sold by Thermo Scientific forthis purpose: 50-UCA CAA CCU CCU AGA AAG AGU AGAmiR-33b: 50-GUG CAU UGC UGU UGC AUU GCUnmodified miR-33a and miR-33b mimics were purchased
from MWG (Eurofins MWG Operon, Ebersberg, Germany).Both represent the double-stranded Dicer processing productof pre-miR-33a and pre-miR-33b as published in miRBase/release14 (http://www.mirbase.org), but lacking the 50-terminalphosphates.
siRNAssiRNAs were purchased from Thermo Scientific:
Pim-1 siRNA1130: 50-GAU AUG GUG UGU GGA GAUAdTdT (sense) and 50-UAU CUC CAC ACA CCA UAUCdTdT (antisense);Pim-1 siRNA1491: 50-GGA ACA ACA UUU ACA ACUCdTdT (sense) and 50-GAG UUG UAA AUG UUG UUCCdTdT (antisense);VR1 siRNA (VsiRNA1; Grunweller et al., 2003) as negativecontrol siRNA: 50-GCG AUC UUC UAU UCA ACdT dT(sense) and 50-GUU GAA GUA GAA GAU GCG CdTdT(antisense);siRNA 33a (siRNA directed against the miR-33a target site inthe Pim-1 30-UTR): 50-AAA AUG CAC AAA CAA UGCAdT dT (sense) and 50-UGC AUU GUU UGU GCAUUU UdTdT (antisense).Negative control siRNAs for transfection of LS174T cells: a)siRNA-luc (targets luciferase mRNA): 50 -CUU ACG CUGAGU ACU UCG AdTdT (sense) and 50-UCG AAG UACUCA GCG UAA GdTdT (antisense).
AntibodiesAntibodies against Pim-1 (sc-13513), b-actin (sc-47778), Cdk6(sc-177), p53 (sc-126), ABCA1 (ab-18180) as well as thesecondary antibodies (sc-2004: goat anti-rabbit IgG HRP-conjugated; sc-2005: goat anti-mouse IgG HRP-conjugated)were from Santa Cruz Biotechnology (Heidelberg, Germany)except for the ABCA1 antibody purchased from Abcam(Cambridge, UK).
Plasmid construction, seed mutagenesis and luciferase reporterassayThe full-length Pim-1 cDNA clone was purchased fromOriGene (Cat. No.: SC110975, Accession No.: NM_002648.2hsa Pim-1 oncogene, vector pCMV6-XL4, vector size 4.7 kbplus 2.6 kb Pim-1 insert DNA). To construct the plasmidlacking two thirds of the 30-UTR (including the miR-33a targetsite), 1mg of full-length Pim-1 cDNA was digested with theHindIII fast digest enzyme (Fermentas, St Leon-Roth,Germany) to remove the B0.9 kbp HindIII/HindIII fragmentof the 30-UTR, followed by vector religation. HindIII cleavesB50 bp downstream of the Pim-1 stop codon (position1424 in sequence NM_002648.3, see Figure 1a) and B400 bpupstream of the poly(A) tail (position 2311). The Pim-1 cDNAclone containing the mutation in the miRNA-33a target sitewas derived from the existing ‘pGL3 control Pim-1 30-UTRmut 33a plasmid’ (see below). For this purpose, thelatter plasmid was also digested with HindIII, and the B0.9kbp HindIII/HindIII fragment containing the mutation inthe miRNA-33a site was cloned into the Pim-1 cDNAclone (from OriGene, see above). The 30-proximal 450 nt(including the miR-33a seed region) of all Pim-1 cDNAconstructs (full-length wild-type, Pim-1 D 30-UTR and full-length cDNA with mutated miR-33a seed) were verified byDNA sequencing.The 30-UTR of human Pim-1 was cloned into the pGL3
control luciferase reporter vector (Promega, Mannheim,Germany) via its XbaI site. The 30-UTR was initially amplifiedfrom K562 genomic DNA with the forward primer 50-GCTCTA GAG CTG TCA GAT GCC CGA GGG and reverseprimer 50-GCT CTA GAG CAA TAA GAT CTC TTT TATTCC CCT GT (XbaI sites underlined). Two G-C base pairswere introduced beyond the XbaI sites for more efficient XbaIdigestion of the PCR product. PCR mutagenesis of themiRNA-33a target site was carried out according to Brenneckeet al. (2005) using the following primers (sites of mutationunderlined): 50-AAA AAA TGC ACA AAC AGT GCG ATCAAC AGA AAA GCT; 50-AGC TTT TCT GTT GAT CGCACT GTT TGT GCA TTT TTT. Mutations were verified byDNA sequencing.A total of 5mg of pGL3 derivatives were cotransfected with
1mg of miRNA mimics per 1� 106 K562 cells. After 48 h,luciferase assays were performed using the Promega LuciferaseAssay System. Briefly, cells were lysed in 100ml lysis buffer,and 10ml of lysate was mixed with 25 ml substrate solution andimmediately measured with a Safire2 microplate reader(Tecan, Crailsheim, Germany) in 96-well plates.
Conflict of interest
The authors declare no conflict of interest.
Acknowledgements
We thank Robert Prinz, Dorothee Hartmann, Dennis Streng,Meike Thomas and Heide Marika Genau for technicalsupport. This study was supported by the Fritz ThyssenStiftung (reference no. 10.06.1.186 to AG and RKH), theDeutsche Krebshilfe (reference no. 109260 to AG, RKH andAA, and reference no. 106992 to AA) and DFG Forscher-gruppe Nanohale (AI 24/6-1).
miR-33a and cancerM Thomas et al
926
Oncogene

References
Aho TL, Sandholm J, Peltola KJ, Mankonen HP, Lilly M, KoskinenPJ. (2004). Pim-1 kinase promotes inactivation of the pro-apoptoticBad protein by phosphorylating it on the Ser112 gatekeeper site.FEBS Lett 571: 43–49.
Amaravadi R, Thompson CB. (2005). The survival kinases Aktand Pim as potential pharmacological targets. J Clin Invest 115:2618–2624.
Aqeilan RI, Calin GA, Croce CM. (2010). miR-15a and miR-16-1 incancer: discovery, function and future perspectives. Cell Death
Differ 17: 215–220.Bachmann M, Hennemann H, Xing PX, Hoffmann I, Moroy T.
(2004). The oncogenic serine/threonine kinase Pim-1 phosphorylatesand inhibits the activity of Cdc25C-associated kinase 1 (C-TAK1): anovel role for Pim-1 at the G2/M cell cycle checkpoint. J Biol Chem
279: 48319–48328.Bachmann M, Moroy T. (2005). The serine/threonine kinase Pim-1. Int
J Biochem Cell Biol 37: 726–730.Bartel DP. (2004). MicroRNAs: genomics, biogenesis, mechanism, and
function. Cell 116: 281–297. Review.Bartel DP. (2009). MicroRNAs: target recognition and regulatory
functions. Cell 136: 215–233. Review.Bonci D, Coppola V, Musumeci M, Addario A, Giuffrida R,
Memeo L et al. (2008). The miR-15a-miR-16-1 cluster controlsprostate cancer by targeting multiple oncogenic activities. Nat Med
14: 1271–1277.Brault L, Gasser C, Bracher F, Huber K, Knapp S, Schwaller J. (2010).
PIM serine/threonine kinases in the pathogenesis and therapy ofhematologic malignancies and solid cancers. Haematologica 95:1004–1015. Review.
Brennecke J, Stark A, Russell RB, Cohen SM. (2005). Principles ofmicroRNA-target recognition. PLoS Biol 3: e85.
Calin GA, Dumitru CD, Shimizu M, Bichi R, Zupo S, Noch E et al.(2002). Frequent deletions and down-regulation of micro- RNAgenes miR15 and miR16 at 13q14 in chronic lymphocytic leukemia.Proc Natl Acad Sci USA 99: 15524–21559.
Calin GA, Sevignani C, Dumitru CD, Hyslop T, Noch E, YendamuriS et al. (2004). Human microRNA genes are frequently located atfragile sites and genomic regions involved in cancers. Proc Natl
Acad Sci USA 101: 2999–3004.Chen C, Ridzon DA, Broomer AJ, Zhou Z, Lee DH, Nguyen JT et al.
(2005a). Real-time quantification of microRNAs by stem-loop RT-PCR. Nucleic Acids Res 33: e179.
Chen WW, Chan DC, Donald C, Lilly MB, Kraft AS. (2005b). Pimfamily kinases enhance tumor growth of prostate cancer cells. Mol
Cancer Res 3: 443–451.Cimmino A, Calin GA, Fabbri M, Iorio MV, Ferracin M, Shimizu M
et al. (2005). miR-15 and miR-16 induce apoptosis by targetingBCL2. Proc Natl Acad Sci USA 102: 13944–13949.
Croce CM. (2009). Causes and consequences of microRNA dysregula-tion in cancer. Nat Rev Genet 10: 704–714. Review.
Crowell JA, Steele VE, Fay JR. (2007). Targeting the AKT proteinkinase for cancer chemoprevention. Mol Cancer Ther 6: 2139–2148.
Datta SR, Dudek H, Tao X, Masters S, Fu H, Gotoh Y et al. (1997).Akt phosphorylation of BAD couples survival signals to the cell-intrinsic death machinery. Cell 91: 231–241.
Esquela-Kerscher A, Slack FJ. (2006). Oncomirs – microRNAs with arole in cancer. Nat Rev Cancer 6: 259–269. Review.
Fox CJ, Hammerman PS, Cinalli RM, Master SR, Chodosh LA,Thompson CB. (2003). The serine/threonine kinase Pim-2is a transcriptionally regulated apoptotic inhibitor. Genes Dev 17:1841–1854.
Gangaraju VK, Lin H. (2009). MicroRNAs: key regulators of stemcells. Nat Rev Mol Cell Biol 10: 116–125.
Garzon R, Calin GA, Croce CM. (2009). MicroRNAs in cancer. Annu
Rev Med 60: 167–179.Grimson A, Farh KK, Johnston WK, Garrett-Engele P, Lim LP,
Bartel DP. (2007). MicroRNA targeting specificity in mammals:determinants beyond seed pairing. Mol Cell 27: 91–105.
Grunweller A, Wyszko E, Bieber B, Jahnel R, Erdmann VA,Kurreck J. (2003). Comparison of different antisense strategies inmammalian cells using locked nucleic acids, 20-O-methyl RNA,phosphorothioates and small interfering RNA. Nucleic Acids Res
31: 3185–3193.Herrera-Merchan A, Cerrato C, Luengo G, Dominguez O, Piris MA,
Serrano M et al. (2010). miR-33-mediated downregulationof p53 controls hematopoietic stem cell self-renewal. Cell Cycle
15: 3277–3285.Huang J, Manning BD. (2009). A complex interplay between
Akt, TSC2 and the two mTOR complexes. Biochem Soc Trans 37:217–222.
Ibrahim AF, Weirauch U, Thomas M, Grunweller A, Hartmann RK,Aigner A et al. (2011). MiRNA replacement therapy through PEI-mediated in vivo delivery of miR-145 or miR-33a in coloncarcinoma. Cancer Res (doi:10.1158/0008-5472.CAN-10-4645).
Iorio MV, Ferracin M, Liu CG, Veronese A, Spizzo R, Sabbioni Set al. (2005). MicroRNA gene expression deregulation in humanbreast cancer. Cancer Res 65: 7065–7070.
Johnson SM, Grosshans H, Shingara J, Byrom M, Jarvis R, Cheng Aet al. (2005). RAS is regulated by the let-7 microRNA family. Cell
120: 635–647.Kota J, Chivukula RR, O’Donnell KA, Wentzel EA, Montgomery
CL, Hwang HW et al. (2009). Therapeutic microRNA deliverysuppresses tumorigenesis in a murine liver cancer model. Cell 137:1005–1017.
Lewis BP, Burge CB, Bartel DP. (2005). Conserved seed pairing, oftenflanked by adenosines, indicates that thousands of human genes aremicroRNA targets. Cell 120: 15–20.
Liu J, Valencia-Sanchez MA, Hannon GJ, Parker R. (2005).MicroRNA-dependent localization of targeted mRNAs to mamma-lian P-bodies. Nat Cell Biol 7: 719–723.
Martelli AM, Tazzari PL, Evangelisti C, Chiarini F, Blalock WL, BilliAM et al. (2007). Targeting the phosphatidylinositol 3-kinase/Akt/mammalian target of rapamycin module for acute myelogenousleukemia therapy: from bench to bedside. Curr Med Chem 14:2009–2023.
Meyerson M, Harlow E. (1994). Identification of G1 kinase activity forcdk6, a novel cyclin D partner. Mol Cell Biol 14: 2077–2086.
Mikkers H, Nawijn M, Allen J, Brouwers C, Verhoeven E, Jonkers Jet al. (2004). Mice deficient for all PIM kinases display reduced bodysize and impaired responses to hematopoietic growth factors. Mol
Cell Biol 24: 6104–6115.Mochizuki T, Kitanaka C, Noguchi K, Muramatsu T, Asai A,
Kuchino Y. (1999). Physical and functional interactions betweenPim-1 kinase and Cdc25A phosphatase. Implications for the Pim-1-mediated activation of the c-Myc signaling pathway. J Biol Chem
274: 18659–18666.Muraski JA, Rota M, Misao Y, Fransioli J, Cottage C, Gude N et al.
(2007). Pim-1 regulates cardiomyocyte survival downstream of Akt.Nat Med 13: 1467–1475.
Najafi-Shoushtari SH, Kristo F, Li Y, Shioda T, Cohen DE,Gerszten RE et al. (2010). MicroRNA-33 and the SREBP hostgenes cooperate to control cholesterol homeostasis. Science 328:1566–1569.
Nawijn MC, Alendar A, Berns A. (2011). For better or for worse: therole of Pim oncogenes in tumorigenesis. Nat Rev Cancer 11: 23–34.Review.
O’Donnell KA, Wentzel EA, Zeller KI, Dang CV, Mendell JT. (2005).c-Myc-regulated microRNAs modulate E2F1 expression. Nature
435: 839–843.Qian KC, Wang L, Hickey ER, Studts J, Barringer K, Peng C et al.
(2005). Structural basis of constitutive activity and a uniquenucleotide binding mode of human Pim-1 kinase. J Biol Chem
280: 6130–6137.Rayner KJ, Suarez Y, Davalos A, Parathath S, Fitzgerald ML,
Tamehiro N et al. (2010). miR-33 contributes to the regulation ofcholesterol homeostasis. Science 328: 1570–1573.
miR-33a and cancerM Thomas et al
927
Oncogene

Rehwinkel J, Behm-Ansmant I, Gatfield D, Izaurralde E. (2005).A crucial role for GW182 and the DCP1:DCP2 decapping complexin miRNA-mediated gene silencing. RNA 11: 1640–1647.
Selbach M, Schwanhausser B, Thierfelder N, Fang Z, Khanin R,Rajewsky N. (2008). Widespread changes in protein synthesisinduced by microRNAs. Nature 455: 58–63.
Trang P, Medina PP, Wiggins JF, Ruffino L, Kelnar K, Omotola Met al. (2009). Regression of murine lung tumors by the let-7microRNA. Oncogene 29: 1580–1587.
van Lohuizen M, Verbeek S, Krimpenfort P, Domen J, Saris C,Radaszkiewicz T et al. (1989). Predisposition to lymphomagenesis inpim-1 transgenic mice: cooperation with c-myc and N-myc inmurine leukemia virus-induced tumors. Cell 56: 673–682.
Venturini L, Battmer K, Castoldi M, Schultheis B, Hochhaus A,Muckenthaler MU et al. (2007). Expression of the miR-17-92polycistron in chronic myeloid leukemia (CML) CD34+cells. Blood
109: 4399–4405.Verbeek S, van Lohuizen M, van der Valk M, Domen J, Kraal G,
Berns A. (1991). Mice bearing the E mu-myc and E mu-pim-1transgenes develop pre-B-cell leukemia prenatally. Mol Cell Biol 11:1176–1179.
Wang HW, Noland C, Siridechadilok B, Taylor DW, Ma E,Felderer K et al. (2009). Structural insights into RNA processingby the human RISC-loading complex. Nat Struct Mol Biol 16:1148–1153.
Wang Z, Bhattacharya N, Mixter PF, Wei W, Sedivy J, Magnuson NS.(2002). Phosphorylation of the cell cycle inhibitor p21Cip1/WAF1by Pim-1 kinase. Biochim Biophys Acta 1593: 45–55.
Xia Z, Knaak C, Ma J, Beharry ZM, McInnes C, Wang W et al.(2009). Synthesis and evaluation of novel inhibitors of Pim-1 andPim-2 protein kinases. J Med Chem 52: 74–86.
Xie Y, Xu K, Dai B, Guo Z, Jiang T, Chen H et al. (2006).The 44 kDa Pim-1 kinase directly interacts with tyrosine kinaseEtk/BMX and protects human prostate cancer cells fromapoptosis induced by chemotherapeutic drugs. Oncogene 25:70–78.
Yang ZZ, Tschopp O, Baudry A, Dummler B, Hynx D, HemmingsBA. (2004). Physiological functions of protein kinase B/Akt.Biochem Soc Trans 32: 350–354. Review.
Zhang T, Zhang X, Ding K, Yang K, Zhang Z, Xu Y. (2010). PIM-1gene RNA interference induces growth inhibition and apoptosis ofprostate cancer cells and suppresses tumor progression in vivo. J
Surg Oncol 101: 513–519.Zhang W, Shay JW, Deisseroth A. (1993). Inactive p53 mutants may
enhance the transcriptional activity of wild-type p53. Cancer Res 15:4772–4775.
Zhang Y, Wang Z, Li X, Magnuson NS. (2008). Pim kinase-dependentinhibition of c-Myc degradation. Oncogene 27: 4809–4481.
Zhang Y, Wang Z, Magnuson NS. (2007). Pim-1 kinase-depen-dent phosphorylation of p21Cip1/WAF1 regulates its stabilityand cellular localization in H1299 cells. Mol Cancer Res 5:909–922.
Zippo A, De Robertis A, Serafini R, Oliviero S. (2007). PIM1-dependent phosphorylation of histone H3 at serine 10 is required forMYC-dependent transcriptional activation and oncogenic transfor-mation. Nat Cell Biol 9: 932–944.
Supplementary Information accompanies the paper on the Oncogene website (http://www.nature.com/onc)
miR-33a and cancerM Thomas et al
928
Oncogene
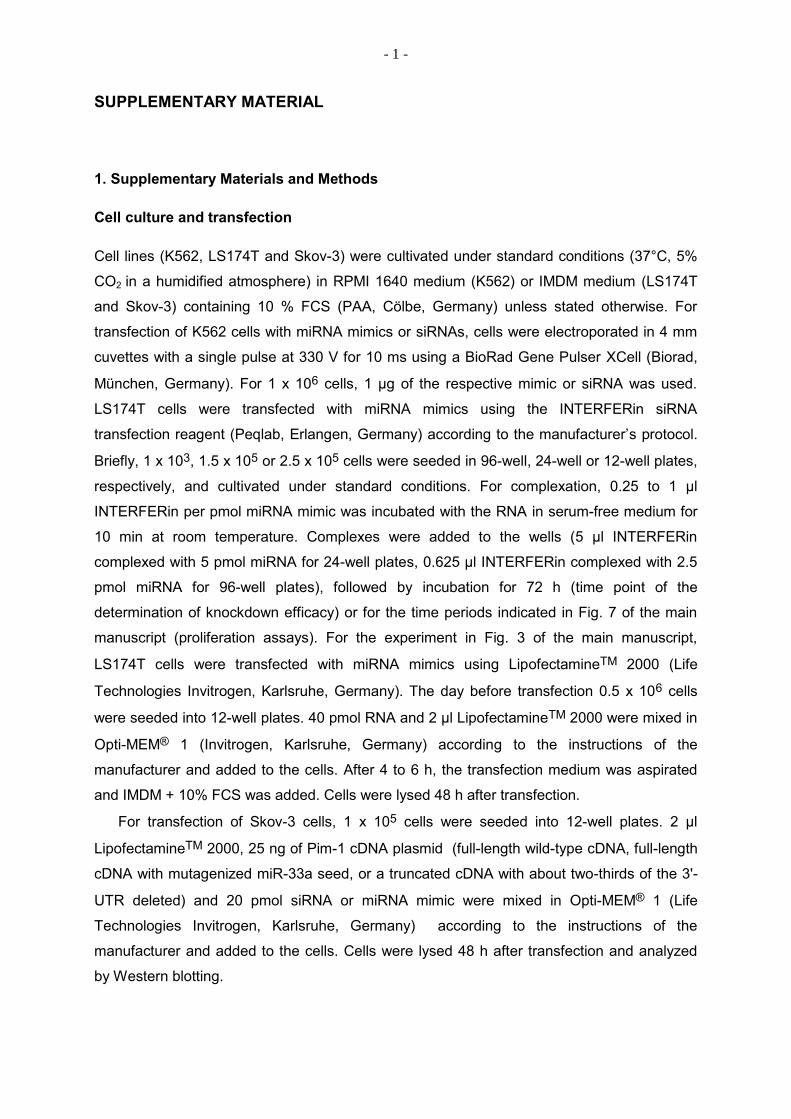
- 1 -
SUPPLEMENTARY MATERIAL
1. Supplementary Materials and Methods
Cell culture and transfection
Cell lines (K562, LS174T and Skov-3) were cultivated under standard conditions (37°C, 5%
CO2 in a humidified atmosphere) in RPMI 1640 medium (K562) or IMDM medium (LS174T
and Skov-3) containing 10 % FCS (PAA, Cölbe, Germany) unless stated otherwise. For
transfection of K562 cells with miRNA mimics or siRNAs, cells were electroporated in 4 mm
cuvettes with a single pulse at 330 V for 10 ms using a BioRad Gene Pulser XCell (Biorad,
München, Germany). For 1 x 10⁶ cells, 1 µg of the respective mimic or siRNA was used.
LS174T cells were transfected with miRNA mimics using the INTERFERin siRNA
transfection reagent (Peqlab, Erlangen, Germany) according to the manufacturer’s protocol.
Briefly, 1 x 10³, 1.5 x 10⁵ or 2.5 x 10⁵ cells were seeded in 96-well, 24-well or 12-well plates,
respectively, and cultivated under standard conditions. For complexation, 0.25 to 1 µl
INTERFERin per pmol miRNA mimic was incubated with the RNA in serum-free medium for
10 min at room temperature. Complexes were added to the wells (5 µl INTERFERin
complexed with 5 pmol miRNA for 24-well plates, 0.625 µl INTERFERin complexed with 2.5
pmol miRNA for 96-well plates), followed by incubation for 72 h (time point of the
determination of knockdown efficacy) or for the time periods indicated in Fig. 7 of the main
manuscript (proliferation assays). For the experiment in Fig. 3 of the main manuscript,
LS174T cells were transfected with miRNA mimics using LipofectamineTM 2000 (Life
Technologies Invitrogen, Karlsruhe, Germany). The day before transfection 0.5 x 10⁶ cells
were seeded into 12-well plates. 40 pmol RNA and 2 µl LipofectamineTM 2000 were mixed in
Opti-MEM® 1 (Invitrogen, Karlsruhe, Germany) according to the instructions of the
manufacturer and added to the cells. After 4 to 6 h, the transfection medium was aspirated
and IMDM + 10% FCS was added. Cells were lysed 48 h after transfection.
For transfection of Skov-3 cells, 1 x 10⁵ cells were seeded into 12-well plates. 2 µl
LipofectamineTM 2000, 25 ng of Pim-1 cDNA plasmid (full-length wild-type cDNA, full-length
cDNA with mutagenized miR-33a seed, or a truncated cDNA with about two-thirds of the 3'-
UTR deleted) and 20 pmol siRNA or miRNA mimic were mixed in Opti-MEM® 1 (Life
Technologies Invitrogen, Karlsruhe, Germany) according to the instructions of the
manufacturer and added to the cells. Cells were lysed 48 h after transfection and analyzed
by Western blotting.

- 2 -
Quantitative RT-PCR for miRNA profiling
Small RNAs (< 200 nt) were isolated using the mirVanaTM miRNA isolation kit from Ambion
(Applied Biosystems, Darmstadt, Germany). For RT-PCR experiments, 100 ng of a mirVana
RNA preparation was used. Reverse transcription was conducted using the Fermentas
RevertAidTM H Minus First Strand cDNA Synthesis Kit (Fermentas, St. Leon-Roth, Germany)
with 100 ng of a mirVanaTM RNA preparation. Quantitative PCR (55 cycles) was performed
in duplicate in a LightCycler®2.0 from Roche (Mannheim, Germany) with the AbsoluteTM
QPCR SYBR® Green Capillary Mix (Thermo Scientific, Hamburg, Germany). All procedures
and reactions were carried out according to the protocols provided by the manufacturers.
For the reverse transcription step, a miRNA-specific stem-loop primer (= looped
primer) was used (5 pmol in 20 µl reaction volume) to generate the cDNA according to Chen
et al. (2005). Stem-loop primers carried a 3’-overhang of 6 or 7 nucleotides complementarity
to the 3'-portion of the respective mature miRNA sequence. In the quantitative PCR (qPCR)
following reverse transcription (see above), 1/100 of the cDNA reaction was amplified in a
LightCycler® 2.0 (Roche Applied Biosciences, Mannheim, Germany), using the AbsoluteTM
QPCR SYBR® Green Capillary Mix (Thermo Scientific, Hamburg, Germany) and 10 pmol of
each primer (10 µl reaction volume). Primers, including the stem-loop primers (see above),
were obtained from Metabion (Metabion, Martinsried, Germany) and designed with Universal
ProbeLibrary (Roche Applied Biosciences, Mannheim, Germany) according to Chen et al.
(2005). The qPCR forward primer was a DNA mimic of the respective miRNA sequence
(www.mirbase.org), but lacking the 3’-terminal 6 or 7 miRNA nucleotides to avoid
hybridization with the stem-loop primer. The forward primer’s 5’-end was extended by a
variable number of G and C nucleotides to equalize the Tm values of PCR products to ~
60°C. Quantitative PCR assays were conducted as follows: Thermo-StartTM DNA polymerase
was activated for 15 min at 95°C followed by 40 amplification cycles with a denaturation step
for 10 s, primer annealing for 20 s at 60°C and amplification at 72°C for 12 s. Subsequently,
a melting curve was generated for the PCR products; samples were cooled from 95°C to
65°C (20°C per s), kept at 65°C for 15 s, followed by heating in steps of 0.1°C per second up
to 98°C. Data were evaluated by determining the crossing point Cp value (= CT value, cycle
of threshold). This value is defined as the PCR cycle (specified with two decimals) at which
the fluorescent signal of the reporter dye crosses an arbitrarily placed threshold. Data are
presented as 2-Cp according to Schmittgen and Livak (2008); to enable the reader to
reconstruct the data shown in Fig. 2 of the main manuscript, we have added the raw data
below (Table S1).
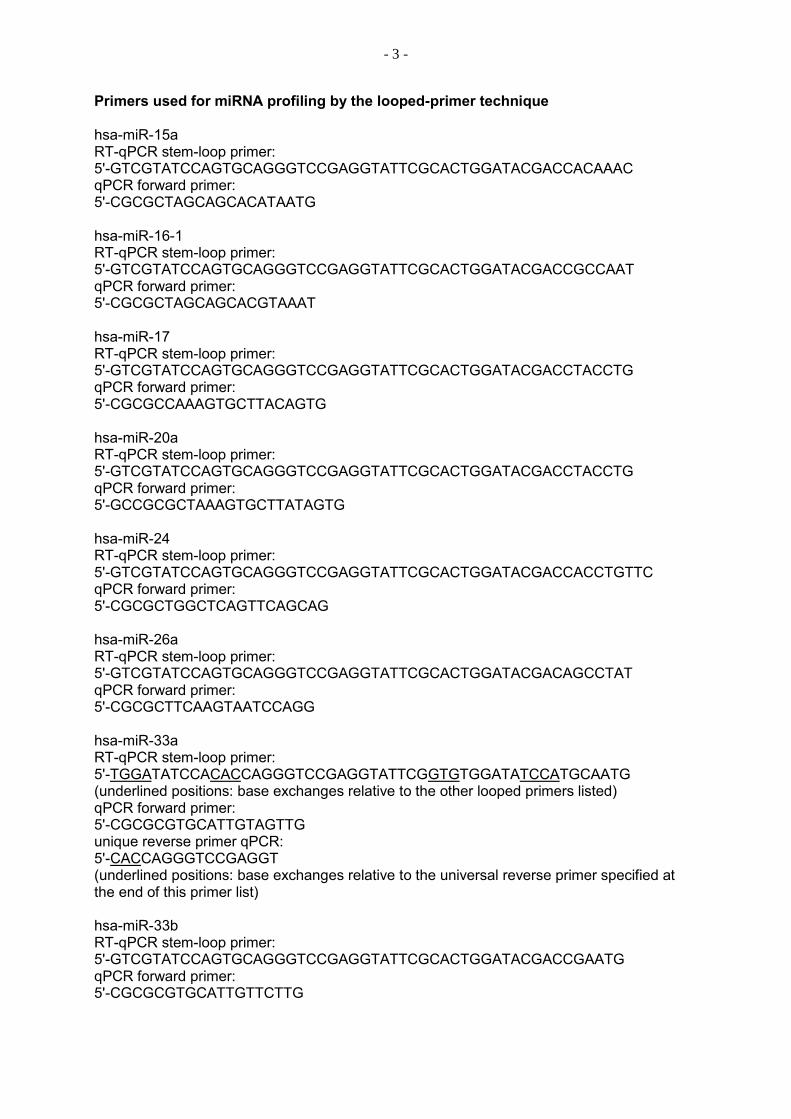
- 3 -
Primers used for miRNA profiling by the looped-primer technique hsa-miR-15a RT-qPCR stem-loop primer: 5'-GTCGTATCCAGTGCAGGGTCCGAGGTATTCGCACTGGATACGACCACAAAC qPCR forward primer: 5'-CGCGCTAGCAGCACATAATG hsa-miR-16-1 RT-qPCR stem-loop primer: 5'-GTCGTATCCAGTGCAGGGTCCGAGGTATTCGCACTGGATACGACCGCCAAT qPCR forward primer: 5'-CGCGCTAGCAGCACGTAAAT hsa-miR-17 RT-qPCR stem-loop primer: 5'-GTCGTATCCAGTGCAGGGTCCGAGGTATTCGCACTGGATACGACCTACCTG qPCR forward primer: 5'-CGCGCCAAAGTGCTTACAGTG hsa-miR-20a RT-qPCR stem-loop primer: 5'-GTCGTATCCAGTGCAGGGTCCGAGGTATTCGCACTGGATACGACCTACCTG qPCR forward primer: 5'-GCCGCGCTAAAGTGCTTATAGTG hsa-miR-24 RT-qPCR stem-loop primer: 5'-GTCGTATCCAGTGCAGGGTCCGAGGTATTCGCACTGGATACGACCACCTGTTC qPCR forward primer: 5'-CGCGCTGGCTCAGTTCAGCAG hsa-miR-26a RT-qPCR stem-loop primer: 5'-GTCGTATCCAGTGCAGGGTCCGAGGTATTCGCACTGGATACGACAGCCTAT qPCR forward primer: 5'-CGCGCTTCAAGTAATCCAGG hsa-miR-33a RT-qPCR stem-loop primer: 5'-TGGATATCCACACCAGGGTCCGAGGTATTCGGTGTGGATATCCATGCAATG (underlined positions: base exchanges relative to the other looped primers listed) qPCR forward primer: 5'-CGCGCGTGCATTGTAGTTG unique reverse primer qPCR: 5'-CACCAGGGTCCGAGGT (underlined positions: base exchanges relative to the universal reverse primer specified at the end of this primer list) hsa-miR-33b RT-qPCR stem-loop primer: 5'-GTCGTATCCAGTGCAGGGTCCGAGGTATTCGCACTGGATACGACCGAATG qPCR forward primer: 5'-CGCGCGTGCATTGTTCTTG

- 4 -
hsa-miR-144 RT-qPCR stem-loop primer: 5'-GTCGTATCCAGTGCAGGGTCCGAGGTATTCGCACTGGATACGACAGTACAT qPCR forward primer: 5'-GCGCGCGCTACAGTATAGATG hsa-miR-374a RT-qPCR stem-loop primer: 5'-GTCGTATCCAGTGCAGGGTCCGAGGTATTCGCACTGGATACGACCACTTAT qPCR forward primer: 5'-GCCGCGCTTATAATACAACCTG universal reverse primer qPCR: 5'-GTGCAGGGTCCGAGGT
Western blotting
Cells were resuspended in lysis buffer (125 mM Tris-HCl pH 6.8, 4 % SDS, 1.4 M 2-
mercaptoethanol, 0.05 % bromophenol blue) and heated at 95°C for 5 min. Lysed samples
were directly loaded onto 15% SDS-polyacrylamide gels using the BioRad Mini-PROTEAN®
3 cell mini gel system (BioRad, München, Germany) and run for 1 h at 180 V. Proteins were
transferred to an ImmobilonTM-P PVDF membrane (Millipore, MA, USA) for 90 min at 1 mA
per cm2 of membrane area using an EBU-4000 Semi-Dry Blotting System CE (C.B.S.
Scientific, CA, USA). Primary and secondary antibodies were diluted in TBST (10 mM Tris-
HCl, pH 7.6, 150 mM NaCl, 0.1% Tween 20) 1:500 (Pim-1), 1:2000 (Cdk6), 1:10000 or
1:1000 (ß-Actin), 1:1000 (p53), 1:1000 (ABCA1) and 1:5000 (secondary antibodies). After a
final washing step, blots were incubated with Amersham ECLTM or ECLplusTM Western
Blotting Detection Reagents according to the manufacturer’s protocol. For detection of
chemiluminescence, Kodak® BioMaxTM light films, Kodak GBX Developer and Replenisher
and GBX Fixer and Replenisher were used.
Proliferation assays
To determine the number of viable K562 cells as a measure of cell proliferation, 1 x 10⁴ cells
were seeded in 1.5 ml RPMI 1640 (plus 10% FCS) and cultivated under standard conditions.
At the time points indicated, cells were pelleted and resuspended in 100 µl PBS, and 10 µl of
the tetrazolium salt WST-1 were added to determine the activity of mitochondrial
dehydrogenases. After incubation at 37°C for 2 h, absorbance was measured at 450 nm with
600 nm as reference wavelength using a Safire2TM microplate reader. Alternatively, K562
cells (0.1 –0.5 x 10⁶ cells/ml) were counted at the indicated time points in a Neubauer
chamber (Lauda-Königshofen, Germany).
For the assessment of LS174T cell proliferation, 1 x 10³ cells per well were seeded in 96-
well plates and transfected using INTERFERin as described above. At the time points
indicated, the medium was aspirated and 50 µl WST-1, diluted 1:10 in serum-free medium,

- 5 -
was added to the cells. After incubation for 1 h at 37°C, absorbance at 450 nm was
measured using a Dynex MRX microplate reader (Pegasus Scientific Inc., Rockville, MD,
USA).
Apoptosis assays
For K562 cells, the Cell Death Detection ELISA (Roche Applied Biosciences, Mannheim,
Germany) was utilized. Microtiter plates were pre-coated with an anti-histone antibody (clone
H 11-4), incubated with lysed cells, followed by the addition of an anti-DNA antibody (clone
MCA–33) and incubation for 90 min. For detection of mono- and oligonucleosomes, an 2,2'-
Azinobis-3-ethylbenzthiazolin-6-sulfonic acid (ABTS) substrate solution was applied.
Absorbance was measured with a Safire2TM microplate reader at 405 nm.
To determine the apoptosis in LS174T cells, the Caspase-Glo® 3/7 Assay (Promega,
Mannheim, Germany) was used acccording to the manufacturer’s protocol. Briefly, 1 x 10³
cells per well were seeded in 96-well plates and transfected as described above. After 120 h,
the caspase Glo® 3/7 substrate was diluted 1+1 in serum-free medium and 100 µl were
added to the cells prior to incubating for 1 h at room temperature. For the detection of
caspase activity, luminescence was measured using a FLUOstar OPTIMA microplate reader
(BMG Labtech, NYC, USA). Readings from caspase 3/7 measurements were normalized to
cell densities.
2. Supplementary Results
Other potential miRNA binding sites in the Pim-1 3’-UTR
We excluded miR-124/506 as a serious candidate for regulation of Pim-1 mRNA translation
in K562 and LS174T cells, because miR-124 is mainly expressed in the brain and involved in
neurogenesis and neuronal differentiation (Cheng et al. 2009; Makeyev et al., 2007).
Additionally, the miR-124 target site in Pim-1 is not well conserved upstream of the seed
region between vertebrates (human to chicken) (see Fig. S1). Likewise, we disregarded miR-
26a/b because the loop adjacent to the seed pairing as well as the second pairing region
deviate from the Grimson rules (Fig. S1), although the target site is well conserved and the
context score percentile was relative high (88 for miR-26a relative to 98 for miR-33a);
however, Pim-1 was ranked (total context score -0.31) by TargetScan 5.1 below the most
favorable 200 conserved targets of miR-26a. miR-24, reported to suppress translation of the
tumor suppressor p16 (Lal et al., 2008), was not considered either as a primary candidate for
Pim-1 suppression based on the relatively low context score percentile (77) and an overall
weak conservation of its target site (Fig. S1). miR-144 (percentile 93) was not further

- 6 -
considered because target site conservation included mouse, rabbit and dog, but not
chicken.
3. Supplementary Figure Legends
Figure S1: Phylogenetic conservation of predicted miRNA binding sites in the 3‘-UTR of
Pim-1. The phylogenetic conservation based on alignment of sequences from human,
mouse, rabbit, dog and chicken (except for miR-144, where the chicken sequence was
excluded because of low conservation) is illustrated by weblogos. For comparison, weblogos
for two established conserved miRNA target sites are shown at the bottom (let-7a in the
Lin28 3’-UTR, and miR-15/16 in the Bcl2 3’-UTR). For miR-26a/b, although showing strong
target site conservation based on the weblogo, the sequence alignment on the right revealed
no clearly unpaired region adjacent to the seed.
Figure S2: miR-33a target sites in the Cdk6 3‘-UTR as predicted by TargetScan 5.1 with
context score percentiles of 98 and 20 respectively. Both sites are only moderately
conserved in the region immediately upstream of the seed. For details, see legend to Fig. 1
B, C of the main manuscript.
Figure S3: (A) Two independent experiments monitoring the growth of K562 cells in the
presence of 10% FCS after transfection with the modified miR-33a mimic relative to the
control mimic and untreated cells. No inhibitory effect of the miR-33a mimic was observed
under these conditions. (B) Cultivation of K562 cells in the presence of 2% FCS leads to
reduced expression levels of Pim-1 compared to cells grown under normal growth factor
conditions (10% FCS). For comparison, Pim-1 levels in LS174T cells grown in the presence
of 10% FCS are shown. ß-Actin was used as a loading control. For details on Western blot
methodology, see Supplementary Materials and Methods above.
Figure S4: (A) Test for changes in apoptosis (inferred from quantitation of DNA
fragmentation) upon Pim-1 knockdown (24 h posttransfection) in K562 cells. Cells were
transfected with the Pim-1-specific siRNA1130 (Fig 1 A), a sequence-unrelated control
siRNA (VR1 siRNA) or without any siRNA. No substantial changes in apoptosis were
observed up to 96 h posttransfection (data not shown). (B) Test for changes in apoptosis
(inferred from caspase activity) upon Pim-1 knockdown (120 h posttransfection) in LS174T
cells. Caspase activity was normalized to values measured for cells transfected with the
control siRNA. Values in panels A and B represent the mean (± SEM) of three (panel A) or
nine (panel B) independent experiments.

- 7 -
Supplementary References
Chen C, Ridzon DA, Broomer AJ, Zhou Z, Lee DH, Nguyen JT et al. (2005a). Real-time
quantification of microRNAs by stem-loop RT-PCR. Nucleic Acids Res. 33: e179.
Cheng LC, Pastrana E, Tavazoie M, Doetsch F. (2009). miR-124 regulates adult
neurogenesis in the subventricular zone stem cell niche. Nat Neurosci. 12: 399-408.
Lal A, Kim HH, Abdelmohsen K, Kuwano Y, Pullmann R Jr, Srikantan S, Subrahmanyam R,
Martindale JL, Yang X, Ahmed F, Navarro F, Dykxhoorn D, Lieberman J, Gorospe M. (2008).
p16(INK4a) translation suppressed by miR-24. PLoS One. 3: e1864.
Makeyev EV, Zhang J, Carrasco MA, Maniatis T. (2007). The MicroRNA miR-124 promotes
neuronal differentiation by triggering brain-specific alternative pre-mRNA splicing. Mol Cell.
27: 435-448.
Schmittgen TD, Livak KJ. (2008) Analyzing real-time PCR data by the comparative C(T)
method. Nat Protoc. 3: 1101-1108.
miRNA profilings (MV = mean value; NTC = non-template control = no RNA added; no
RT = omission of Reverse Transcriptase)
K562
miRNA MV 1 Cp
MV 2 Cp
MV 3 Cp
MV Cp
SEM Cp
no RT NTC
hsa-miR-15a
20.25 19.59 19.55 19.80 0.227 - >35
hsa-miR-16-
1 18.07 17.54 17.81 17.81 0.153 >35 33.5
hsa-miR-17
15.03 15.00 15.13 15.05 0.039 24.32 28.58
hsa-miR-20a
16.11 15.14 14.44 15.23 0.484 - -
hsa-miR-24-
1 18.73 19.38 20.16 19.42 0.413 26.53 27.6

- 8 -
hsa-miR-26a
19.39 18.72 19.34 19.15 0.216 31.77 31.45
hsa-miR-33a
23.27 21.59 21.72 22.19 0.540 - >35
hsa-miR-33b
- - - - - - -
hsa-miR-144
25.56 24.67 23.54 24.59 0.585 - -
hsa-miR-374a
23.59 22.49 22.61 22.89 0.348 30.97 30.63
LS 174T
miRNA MV 1 Cp
MV 2 Cp
MV 3 Cp
MV Cp
SEM Cp
no RT NTC
hsa-miR-15a
20.77 19.35 21.56 20.56 0.647 - -
hsa-miR-16-
1 17.51 17.18 18.81 17.83 0.498 - 34.63
hsa-miR-17
17.69 17.12 18.37 17.73 0.361 27.97 27.58
hsa-miR-20a
18.68 17.96 19.63 18.76 0.484 >35 -
hsa-miR-24-
1 18.04 18 19.54 18.53 0.507 28.35 27.84
hsa-miR-26a
19.91 19.1 20.73 19.91 0.471 25.69 26.33
hsa-miR-33a
23.18 21.41 22.62 22.40 0.522 - -
hsa-miR-33b
- - - - - - -
hsa-miR-144
- - - - - - -

- 9 -
hsa-miR-374a
24.17 23.68 25.66 24.5 0.595 31.84 30.55
data miR-33a, different cell lines
cell line
MV 1 Cp
MV 2 Cp
MV 3 Cp
MV Cp
SEM Cp
no RT NTC
HEK 293
24.30 22.84 23.60 23.58 0.419 - -
Skov-3 22.55 21.43 21.61 21.86 0.347 - -
HUH 7 21.77 22.91 21.22 21.97 0.498 - -
HepG2 21.34 23.61 22.78 22.58 0.663 - -


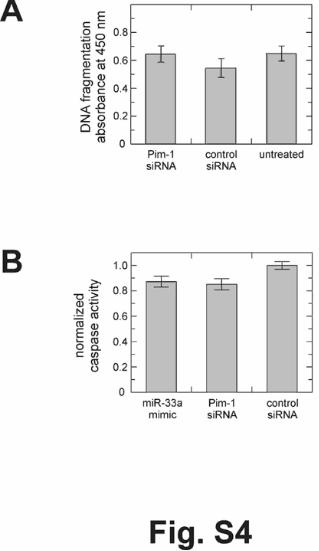

Appendix
126
B. Publication II
MicroRNA Replacement Therapy for miR-145 and miR-33a Is Efficacious in a Model of
Colon Carcinoma.
Cancer Res (2011), 71, 5214-5224
Impact Factor: 7.86*
*2011 Journal Citation Reports (Thomson Reuters, 2012)
Author contributions:
Research design: 5 %
Experimental work: 5 %
Data analysis and evaluation: 5 %
Manuscript writing: 5 %
Therapeutics, Targets, and Chemical Biology
MicroRNA Replacement Therapy for miR-145 and miR-33aIs Efficacious in a Model of Colon Carcinoma
Ahmed Fawzy Ibrahim1, Ulrike Weirauch1, Maren Thomas2, Arnold Gr€unweller2, Roland K. Hartmann2, andAchim Aigner1
AbstractMicroRNAs (miRNA) aberrantly expressed in tumors may offer novel therapeutic approaches to treatment.
miR-145 is downregulated in various cancers including colon carcinoma in which in vitro studies haveestablished proapoptotic and antiproliferative roles. miR-33a was connected recently to cancer through itscapacity to downregulate the oncogenic kinase Pim-1. To date, miRNA replacement therapy has been hamperedby the lack of robust nonviral delivery methods for in vivo administration. Here we report a method of miRNAdelivery by using polyethylenimine (PEI)-mediated delivery of unmodified miRNAs, using miR-145 and miR-33ato preclinically validate the method in a mouse model of colon carcinoma. After systemic or local application oflow molecular weight PEI/miRNA complexes, intact miRNA molecules were delivered into mouse xenografttumors, where they caused profound antitumor effects. miR-145 delivery reduced tumor proliferation andincreased apoptosis, with concomitant repression of c-Myc and ERK5 as novel regulatory target of miR-145.Similarly, systemic injection of PEI-complexed miR-33a was validated as a novel therapeutic targeting methodfor Pim-1, with antitumor effects comparable with PEI/siRNA-mediated direct in vivo knockdown of Pim-1 in themodel. Our findings show that chemically unmodified miRNAs complexed with PEI can be used in an efficientand biocompatible strategy of miRNA replacement therapy, as illustrated by efficacious delivery of PEI/miR-145and PEI/miR-33a complexes in colon carcinoma. Cancer Res; 71(15); 5214–24. �2011 AACR.
Introduction
MicroRNAs (miRNA) are highly conserved, small 17 to 25nucleotide (nt) noncoding RNA molecules which specificallyinteract with target mRNAs, thus inhibiting translation orleading to mRNA cleavage and degradation (1). It is estimatedfrom in silico analyses that miRNAs can control the expressionof approximately 30% of all proteins in humans (2), and it hasbecome clear that miRNAs regulate various cellular processes.Many miRNAs are aberrantly expressed in pathologies such ascancer, leading to the identification of "miRNA signatures"characteristic of certain tumors (3). Tumor-specific miRNAexpression profiles are also functionally relevant becausemany miRNAs act as tumor suppressors or, to the contrary,as oncogenes (oncomiRs). For many miRNAs, target genes
have been identified which are relevant in tumorigenesis,tumor growth, tumor angiogenesis, and metastasis (see ref.4 for review). Crucial for miRNA specificity is the "seed region"(nt 2–8); however, owing to this limited sequence, comple-mentarity miRNAs are capable of simultaneously targetingdifferent genes. In fact, it is estimated that some miRNAs mayhave more than 100 target genes. This translates into acomplex pattern of control of gene expression and suggestspotentially increased efficacies of miRNAs by acting throughdifferent genes and pathways.
The observation of pathologically decreased levels of cer-tain miRNAs acting as tumor suppressors has led to theconcept of miRNA replacement therapy. Indeed, the reintro-duction of miR-26a in a liver cancer mouse model by using anadeno-associated viral vector resulted in the inhibition ofcancer cell proliferation, induction of tumor-specific apopto-sis, and protection from disease progression (5). In line withthis, the adenovirus-mediated delivery of a plasmid coding formiRNA let-7 reduced lung tumor formation in an orthotopiclung cancer mouse model (6). Likewise, intranasal adminis-tration of a lentiviral let-7 miRNA construct led to reducedtumor burden in an autochthonous non–small cell lungcarcinoma tumor mouse model (7). This study also exploredsynthetic, formulated let-7 oligonucleotides which, uponintratumoral (i.t.) injection, led to reduced tumor growth(7). Local and/or systemic delivery in non–small lung cancerxenografts showed antitumor effects upon application of miR-34 formulated with a lipid-based delivery reagent (8). The
Authors' Affiliations: 1Institute of Pharmacology, Faculty of Medicine; and2Institute of Pharmaceutical Chemistry, Philipps-University, Marburg,Germany
Note: Supplementary data for this article are available at Cancer ResearchOnline (http://cancerres.aacrjournals.org/).
A.F. Ibrahim and U. Weirauch contributed equally to the work.
Corresponding Author: Achim Aigner, Institute of Pharmacology, Facultyof Medicine, Philipps-University Marburg, Karl-von-Frisch-Strasse 1,D–35032 Marburg, Germany. Phone: 49-6421-286-2262; Fax: 49-6421-286-5600; E-mail: [email protected]
doi: 10.1158/0008-5472.CAN-10-4645
�2011 American Association for Cancer Research.
CancerResearch
Cancer Res; 71(15) August 1, 20115214
American Association for Cancer Research Copyright © 2011 on March 7, 2013cancerres.aacrjournals.orgDownloaded from
Published OnlineFirst June 20, 2011; DOI:10.1158/0008-5472.CAN-10-4645

same miRNA exhibited survivin downregulation and reducedmetastatic tumor load in the lung when delivered in a lipo-somal nanoparticle formulation (9). In prostate tumorsinitiated in the bones of mice, intravenously (i.v.) injectedatelocollagen-complexedmiR-16mimics led to reduced tumorgrowth (10). Finally, in colorectal carcinoma xenografts, i.t. ori.v. injection of miR-143 formulated in cationic liposomesresulted in antitumor effects in the case of modified (forincreased nuclease resistance) miR-143, but not unmodifiedmiR-145 (11). This so far limited number of studies that arenot based on viruses indicates that applications aiming atmiRNA replacement therapy critically depend on the devel-opment of miRNA delivery tools. Because viral delivery mayraise several issues including potential safety problemsbecause of the application of recombinant DNA, inductionof toxic immune responses, and possible changes in geneexpression upon random integration of DNA in the hostgenome, nonviral strategies would be preferable.Colon carcinoma is the third most common form of cancer
and the second leading cause of cancer-related death in theWestern world. Despite a favorable prognosis when detectedat early stages, it is associated with limited survival whenmetastatic disease is present, which indicates the need fornovel treatment strategies. In colon carcinoma, decreasedlevels of miRNA-145 are observed (see ref. 12), and previousin vitro studies have established a proapoptotic and antipro-liferative role of miR-145 (13). In contrast, the functionalrelevance of miR-33a in cancer has only recently been estab-lished. It was shown that miR-33a can repress the proto-oncogene Pim-1 to act as a tumor suppressor inhibiting cell-cycle progression (14). Thus, both miRNA-145 and miR-33amay represent attractive candidates for miRNA replacementtherapy that have not been explored so far.Polyethylenimines (PEI) are linear or branched polymers
which are partially protonated under physiologic conditions,thus allowing the formation of complexes with nucleic acids(15). PEIs have been used previously for the delivery of DNAplasmids (15) and other DNA or RNA molecules includingribozymes (16) and siRNAs (17). PEI-based complexes (poly-plexes) are able to enter the cells via caveolae- or clathrin-dependent routes and, once internalized, the high efficiency ofPEI polyplexes is governed by their facilitated release fromendosomes due to the so called "proton sponge effect" (18).This is the first study to explore the therapeutic effects of
PEI/miRNA complexes. We introduce the low molecularweight branched PEI F25-LMW (19, 20) as a delivery platformfor nonmodified miRNAs in miRNA replacement therapy andshow antitumor effects of PEI/miRNA complexes upon theirlocal or systemic application.
Materials and Methods
miRNAs, siRNAs, tissue culture, and animalsChemically synthesized miRNAs and siRNAs without mod-
ifications were purchased from MWG (Eurofins MWGOperon) or from Thermo Scientific. The used miRNAs repre-sent the double-stranded Dicer processing product as pub-lished in miRBase/release14 (21), but lacking the 50-terminal
phosphates. Additional details and sequences can be found inthe Supplementary Methods.
All cell lines were obtained from the American type culturecollection and authenticated by the vendor. Cells were culti-vated in a humidified incubator under standard conditions(37�C, 5% CO2) in keratinocyte-SFM medium (InvitrogenGmbH) supplemented with 20 to 30 mg/mL bovine pituitaryextract, 0.1 to 0.2 ng/mL rEGF, and 10% fetal calf serum (FCS;PAA; 1205LU cells) or IMDM/10% FCS (all other cell lines).Athymic nude mice (nu/nu) were purchased from HarlanWinkelmann and kept at 23�C in a humidified atmospherewith food and water ad libitum. Animal studies were doneaccording to the national regulations and approved by theRegierungspr€asidium Giessen, Germany.
PEI complexation of RNAsPEI F25-LMW/miRNA complexes were prepared essentially
as described previously for siRNAs (20, 22). Briefly, 10 mgmiRNA was dissolved in 75 mL 10 mmol/L HEPES/150mmol/L NaCl, pH 7.4, and incubated for 10 minutes. Tenmicroliters of PEI F25-LMW (5 mg/mL) (19) was dissolved in 75mL of the same buffer, and after 10 minutes, pipetted to themiRNA solution. This resulted in an N/P ratio ¼ 33 which hadbeen determined as optimal for siRNAs (20). For in vivoexperiments, the mixture was divided into aliquots and storedfrozen (23). Prior to use, complexes were thawed and incu-bated for 1 hour at room temperature. jetPEI complexationwas done in 1 mol/L HEPES/150 mmol/L NaCl, pH 7.4 atN/P ¼ 5 as described previously (22).
miRNA tissue uptake in vivoFor the radioactive determination of miRNA tissue distri-
bution, 0.6 mg (0.05 nmol) miRNA were [32P] end–labeled atboth strands by using T4 polynucleotide kinase (New EnglandBiolabs) and g-[32P] ATP (GE Healthcare), prior to purificationby microspin columns (Bio-Rad) to remove unbound radio-activity and complexation as described above. A total of 1.5 �106 LS174T cells in 150 mL PBS were injected s.c. into bothflanks of athymic nude mice (nu/nu) and grown until theyreached a size of approximately 8 mm in diameter. Thecomplexes, or noncomplexed labeled miRNAs as negativecontrol, were dissolved in 200 mL or 100 mL PBS for intraper-itoneal (i.p.) or i.v. injection, respectively. After 4 hours, micewere sacrificed, organs were removed, and subjected to RNApreparation as described above. The total RNA was dissolvedin 200 mL DEPC-treated water, and 10-mL samples were mixedwith loading buffer, heat denatured, and subjected to agarosegel electrophoresis before blotting and autoradiography (Bio-max; Eastman-Kodak). Quantitation was done by phosphor-imager analysis.
PEI F25-LMW/miRNA treatment in subcutaneous tumormodels
Athymic nudemice (Hsd:Athymic Nude-Foxn1nu, 6–8 weeksof age) were used and kept in tight cages with standard rodentchow and water available ad libitum, and a 12-hour light/darkcycle. A total of 1.5 � 106 LS174T or HCT116 cells in 150 mLPBS were injected s.c. into both flanks of the mice. When solid
Therapeutic PEI/miRNA Delivery
www.aacrjournals.org Cancer Res; 71(15) August 1, 2011 5215
American Association for Cancer Research Copyright © 2011 on March 7, 2013cancerres.aacrjournals.orgDownloaded from
Published OnlineFirst June 20, 2011; DOI:10.1158/0008-5472.CAN-10-4645
tumors were established, mice were randomized into specifictreatment, negative control treatment, and nontreatmentgroups (n ¼ 12 tumors per group). Treatment with PEI/miRNA or PEI/siRNA complexes was done by i.p. injectionof 0.77 nmol (10 mg) or i.t. injection of 0.3 nmol (4 mg) PEI F25-LMW-complexed specific or nonspecific siRNA at the timepoints indicated in the figures. Tumor volumes were mon-itored every 2 to 3 days as indicated in the figures and, upontermination of the experiment, mice were sacrificed andtumors removed. Pieces of each s.c. tumor were immediatelyfixed in 10% paraformaldehyde for paraffin embedding orsnap-frozen for RNA preparation or Western blot analysis.
Proliferation and soft agar assaysFor the assessment of anchorage-dependent proliferation,
cells were seeded 24 hours prior to transfection in 96-wellplates at 1,000 (LS174T) or 300 (HCT-116) cells per well.Transfections were done by the addition of the specific ornonspecific PEI F25-LMW/miRNA or jetPEI/miRNA com-plexes corresponding to 10 pmol miRNA per well. At thetime points indicated, the numbers of viable cells in 8 wellswere determined by using a colorimetric assay according tothe manufacturer's protocol (Cell Proliferation ReagentWST-1; Roche).
Anchorage-independent proliferation was studied in softagar assays essentially as described previously (24). A total of1� 105 cells per well were transfected in 6-well plates with 100nmol/L PEI-complexed miRNAs or nonspecific control siRNAand 24 hours after transfection, trypsinized and counted. Atotal of 20,000 cells in 0.35% agar (Bacto Agar; Becton Dick-inson) were layered on top of 1 mL of a solidified 0.6% agarlayer in a 35-mm dish. Growth media with 2% FCS wereincluded in both layers. After 2 to 3 weeks of incubation,colonies more than 50 mm in diameter were counted by atleast 2 independent blinded investigators.
Caspase assay and fluorescein isothiocyanate–Annexinassay
To test for apoptosis in vitro, a commercially availablebioluminescent caspase-3/7 assay (Caspase-Glo 3/7 assay;Promega) was applied. The Caspase-Glo 3/7 assay was con-ducted in 96-wells with cells transfected as described above,and luminescence was measured after 1 hour incubation at27�C in the dark by using a Fluostar Optima reader (BMGLabtec). To normalize for differences in cell densities, a WST-1assay was carried out in parallel on the same plate, and theresults of caspase activity were adjusted to cell numbers of thedifferent cell lines.
To distinguish between early and late apoptosis, a fluor-escein isothiocyanate (FITC)–Annexin assay was done (Bec-ton Dickinson). LS174T cells were transfected with 100 nmol/LmiRNAs in 6-well plates by using jetPEI as described above.After 120 hours, the cells were harvested by trypsinization,washed twice with cold PBS, and resuspended in 1� bindingbuffer (0.01 mol/L HEPES (pH 7.4), 140 mmol/L NaCl, and 2.5mmol/L CaCl2) at a concentration of 106 cells/mL. A total of100 mL of the cell suspension were transferred to a newEppendorf tube, 5 mL FITC–Annexin and then 5 mL propidium
iodide were added, the mixture was gently vortexed andincubated for 15 minutes at room temperature in the dark.Directly before measurement, 400 mL 1� binding buffer wasadded to the mixture and samples were measured by FACS(FACSCalibur; Becton-Dickinson) within 1 hour.
RNA preparation and quantitative RT-PCR for mRNAand miRNA dectection
Total RNA from tumor cells was isolated by using the Trizolreagent (Sigma) according to the manufacturer's protocol. Fortissue homogenization prior to RNA preparation, tissues weremixed with 200 mL Trizol reagent and homogenized. Reversetranscription (RT) by using the RevertAid H Minus FirstStrand cDNA Synthesis Kit from Fermentas and quantitativePCR in a LightCycler from Roche by using the QuantiTectSYBR Green PCR kit (Qiagen) were done according to themanufacturers’ protocols and as described previously (20). Tonormalize for equal cDNA amounts, PCR reactions with ERK5-specific and with actin-specific primer sets were run in parallelfor each sample, and ERK5 levels were determined by theformula 2CP(actin)/2CP(ERK5) with CP ¼ cycle number at the cross-ing point (0.3).
To isolate miRNA, the mirVana miRNA isolation kit wasused according to the manufacturer's protocol (Applied Bio-systems). Adherent cells from a 6-well plate were trypsinizedand washed in PBS, prior to adding 300 to 600 mL lysis bindingbuffer and vigorous vortexing. In case of tumor tissue, the lysisbinding buffer was added as 10 volumes of the tumor weight.For miRNA RT, specific stem-looped RT primers were used asdescribed previously (25). The RT product was diluted 1:10 innuclease-free water and used as a template for quantitativereal-time PCR (see Supplementary Methods for primersequences) under the following conditions: 95�C for 15 min-utes followed by 55 cycles comprising 95�C for 10 seconds,55�C for 10 seconds, and 72�C for 10 seconds. Levels weredetermined as described above.
Western blots and immunohistochemistryLS174T cells from 6-well plates were scraped at 96 hours
posttransfection, lysed in 200 mL denaturating lysis buffer, andsonicated for 20 seconds, prior to incubation on ice for 30minutes and centrifugation at 13,000 rpm for 25 minutes.Tumor tissue was homogenized in radioimmunoprecipitationassay buffer [25 mmol/L Tris-HCl (pH 7.6), 150 mmol/L NaCl,1% NP-40, 1% sodium deoxycholate, 0.1% SDS] by using aDounce homogenizer. After centrifugation and determinationof the protein concentration in the supernatant, samples wereanalyzed byWestern blotting (see Supplementary Methods fordetails).
Immunohistochemical staining of paraffin-embedded sec-tions for proliferating cell nuclear antigen (PCNA) was doneessentially as described previously (ref. 20; see Supplemen-tary Methods for details). For the assessment of prolifera-tion, the PCNA staining intensity after diaminobenzidinedevelopment was evaluated in at least 5 fields per section byrating as 0 (no staining), 1 (weak staining), 2 (intermediatestaining), and 3 (strong staining), and expressed as PCNAscore.
Ibrahim et al.
Cancer Res; 71(15) August 1, 2011 Cancer Research5216
American Association for Cancer Research Copyright © 2011 on March 7, 2013cancerres.aacrjournals.orgDownloaded from
Published OnlineFirst June 20, 2011; DOI:10.1158/0008-5472.CAN-10-4645

ELISAFor the quantitation of Pim-1 by sandwich ELISA, the "Pim-
1 Total Antibody Pair" and buffers (Invitrogen) were used. Theprocedure was done according to manufacturer's protocol(see Supplementary Methods), with 100 mL supernatant from atumor sample (homogenized in PBS and centrifuged at 13,000rpm) being analyzed per well.
StatisticsStatistical analyses were done by Student's t test, 1-way
ANOVA/Tukey's multiple comparison posttests or 2-wayANOVA/Bonferroni posttests by using GraphPad Prism4,and significance levels were *, P < 0.05, **, P < 0.01, ***, P <0.001, #, not significant.
Results
Analysis of miR-145 levels in tumor cellsLevels of miR-145 were assessed in various tumor cell lines
and compared with the nontumor fibroblast cell line NIH/3T3(Supplementary Fig. S1). Although our data confirm previousstudies about the downregulation of miR-145 in tumors (12,26, 27), we also show that miR-145 levels depend on the cellline. This is particularly true for prostate carcinoma cells withlevels being very low in DU-145 cells, whereas in PC-3 cells,almost normal levels were observed. Likewise, 1205LU mela-noma cells showed high miR-145 expression almost in therange of nontumor cells. Notably, all 7 colon carcinoma celllines tested displayed low miR-145 levels, indicating that miR-145 downregulation is a general feature in colon carcinomaand relevant to the pathologic state of such tumors. Forsubsequent experiments, the tumorigenic colon carcinomacell line LS174T and the particularly aggressive cell line HCT-116 were selected.
PEI-mediated miRNA delivery in vitroTo explore whether PEI is able to deliver miRNAs into cells,
PEI complexes based on linear jetPEI or branched PEI F25-LMW were prepared. Transfection of LS174T cells with PEI/miRNA complexes led to more than 10-fold increase inintracellular miR-145 levels, indicating that the intact miRNAis efficiently delivered into the cells (Fig. 1A). JetPEI was usedin these experiments, because in vitro, it displays highertransfection efficacy in this cell line than the branched PEIF25-LMW (data not shown). More importantly, PEI-mediatedmiRNA transfection led to markedly more than 60% reducedcell proliferation as compared with nontransfected or negativecontrol transfected cells (Fig. 1B). As negative control, a smalldsRNA molecule with length, structure, and GC contentsimilar to that of the miRNAs studied here and directedagainst an irrelevant gene (luciferase) was employed, andcomplexed with PEI under identical conditions. The specificinhibition of cell proliferation confirms the biological rele-vance of miR-145 in colon carcinoma cells in vitro and showsthat PEI-complexed miRNAs are functionally active. Resultswere confirmed in soft agar assays which monitor anchorage-independent cell growth. Again, a marked reduction in cellproliferation, as indicated by fewer and smaller colonies, was
observed upon PEI-mediated miRNA delivery (Fig. 1C). Thecomparison between nontransfected and negative controltransfected cells also shows the absence of nonspecific PEIeffects on proliferation (Fig. 1B and C).
The tumor cell inhibition resulting from the PEI-mediatedmiR-145 delivery was studied in more detail on the cellularand molecular level. In a fluorescence-activated cell sorting(FACS)-based FITC–Annexin assay, a more than 2-foldincrease in early-stage and late-stage apoptotic cells wasobserved upon PEI/miR-145 treatment as compared withnegative controls (Fig. 1D). The parallel increase in cas-pase-3/-7 activation (Fig. 1E) indicated that this inductionof apoptosis relied on a caspase-3/-7–dependent pathway. Inaddition, PEI/miR-145 treatment interfered with downstreamsignal transduction relevant to proliferation. More specifically,a decrease in ERK5 protein expression was observed; a parallelreduction in ERK5 mRNA levels was less pronounced andlacked statistical significance (Fig. 1F). Although miR-143 (seebelow) has been shown previously to directly target ERK5 (28),this establishes for the first time that ERK5 is modulated bymiR-145 as well.
miR-143 belongs to the samemiRNA family as miR-145 andhas been shown to be downregulated along with miR-145 intumors including colon carcinoma (29). Indeed, when mon-itoring anchorage-independent growth in soft agar assays,PEI-mediated delivery of miR-143 inhibited colony formationsimilar tomiR-145 (Supplementary Fig. S2, right). Anchorage-dependent proliferation, however, was not impaired by miR-143 (Supplementary Fig. S2, left). Thus, whereas miR-143exerts some tumor cell–inhibiting effects as well, our findingsindicate differences between both miRNAs with regardto biological effects and targeted pathways as suggestedpreviously (27). Because of its more universal antitumoreffects, miR-145 was selected for subsequent in vivoexperiments.
Antitumor effects upon systemic application ofPEI/miR-145 complexes
LS174T colon carcinoma cells were s.c. injected into athy-mic nude mice, and upon establishment of tumor xenografts,mice were randomized into treatment and negative controlgroups. In untreated controls and in mice which were i.p.injected with PEI/nonspecific RNA complexes as negativecontrols, rapid tumor growth was detected, with an approxi-mately 15-fold increase in tumor volume over 23 days. Incontrast, i.p. injection of 10 mg PEI-complexed miR-145 threetimes per week resulted in a statistically significant, almost50% decrease in tumor growth (Fig. 2A). Upon termination ofthe experiment, tumors (see representative examples inFig. 2A, right panel) were analyzed for ERK5, which has beenshown in vitro to be downregulated by miR-145 (see above).Indeed, a statistically significant, that is, approximately 50%decrease in ERK5 protein levels was detected in the tumors(Fig. 2B, left), whereas, again comparable with the in vitrosituation, ERK5 mRNA levels remained largely unchanged(data not shown). This indicates that PEI-delivered miR-145exerts antitumor effects through inhibition of ERK5 transla-tion. Strikingly, the PEI/miR-145 effects on c-Myc, another
Therapeutic PEI/miRNA Delivery
www.aacrjournals.org Cancer Res; 71(15) August 1, 2011 5217
American Association for Cancer Research Copyright © 2011 on March 7, 2013cancerres.aacrjournals.orgDownloaded from
Published OnlineFirst June 20, 2011; DOI:10.1158/0008-5472.CAN-10-4645

1.0
0.8
8
10
12wt (nontransfected)PEI/miR-145PEI/-ctrl. RNA
CBA
3.0
3.5
4.0 *** ***
0
0.2
0.6
0.4
miR
-145 le
vels
norm
. for
U6
(arb
itrary
units
± S
EM
)
0
2
4
6
8
Cell
pro
lifera
tion
(x-f
old
ove
r tr
ansf
ect
ion s
tart
± S
EM
)
0
0.5
2.5
2.0
1.5
1.0
Ave
rage n
um
ber
of co
lonie
sper
field
± S
EM
***
wt (non-transfected)
PEI/miR-145
12080604020 180160140100 wt (non-transf.)
PEI/miR-145
PEI/ -ctrl.RNA
wt (non-transf.)
PEI/miR-145
PEI/ -ctrl.RNA
wt (non-transf.)
PEI/miR-145
PEI/ -ctrl.RNA
wt (non-transf.)
PEI/miR-145
PEI/ -ctrl.RNA
wt (non-transf.)
PEI/miR-145
PEI/ -ctrl.RNA
wt (non-transf.)
PEI/miR-145
PEI/ -ctrl.RNA
wt (non-transf.)
PEI/miR-145
PEI/ -ctrl.RNA
Time (h)
1,200
1,000
350
300
Early-stage apoptotic cells Late-stage apoptotic cellsD
wt (non-transfected)
PEI/miR-145
PEI/ -ctrl.RNA
Num
ber
of apopto
tic c
ells
200
800
600
400
0
250
200
150
100
50
0
2.5
3.0
E
1
1.2
F
0.8 ** **** **
0
0.5
2.0
1.5
1.0Casp
ase
act
ivity
(arb
itr. u
nits
± S
EM
)
0
0.2
1.0
0.8
0.6
0.4
ER
K5 p
rote
in le
vels
(art
ibr.
units
± S
EM
)
0
0.2
0.6
0.4
ER
K5 m
RN
A le
vels
(art
ibr.
units
x 1
0 ±
SE
M)
0
ERK5
β-Actin
Figure 1. In vitro effects of PEI-mediated delivery of miR-145 in LS174T colon carcinoma cells. A, miR-145 levels are markedly upregulated upon PEI/miR-145transfection as shown by qRT-PCR. PEI/miR-145 transfection reduces anchorage-dependent growth (B) and anchorage-independent soft agar colonyformation (C). Increased apoptosis upon PEI-mediated miR-145 delivery is observed, as indicated by early-stage (D) and late-stage (E) apoptotic cells, and bycaspase-3/-7 activation (E). ERK5 is established as novel target for miR-145, being downregulated on protein (F, right), but not on mRNA levels (F, left).
Ibrahim et al.
Cancer Res; 71(15) August 1, 2011 Cancer Research5218
American Association for Cancer Research Copyright © 2011 on March 7, 2013cancerres.aacrjournals.orgDownloaded from
Published OnlineFirst June 20, 2011; DOI:10.1158/0008-5472.CAN-10-4645

established target for miR-145 (30), were even more profoundwith approximately 80% decreased c-Myc protein levels ascompared with negative controls (Fig. 2B, middle). Concomi-tantly, an approximately 50% reduction in tumor cell prolif-eration was observed in the specific treatment group (Fig. 2B,right).Radioactive biodistribution experiments confirmed that the
observed effects were indeed based on the PEI-mediateddelivery of intact miRNA molecules. Upon i.p. injection ofPEI complexes containing [32P]-labeled miRNA, total RNAswere prepared from tissues and analyzed by gel electrophor-esis and autoradiography. This revealed substantial uptake of
miRNA in liver and kidney, among others, and to a lesserextent in spleen (Fig. 2C, top right panel). Particularly highlevels of intact, full-lengthmiRNAwere observed in the tumorxenografts (Fig. 2C, top right panel). In contrast, nakedmiRNAwas detectable, though, at very low levels in the testedtissues, indicating the necessity for miRNA formulation withPEI (Fig. 2C, top right panel). The quantitation of miRNAbands and normalization for protein content confirmed thePEI-mediated miRNA delivery into the xenografts (Fig. 2C,left). To the contrary, i.v. injection resulted in strong signals inliver and spleen, but not in s.c. tumor xenografts, andwas thusnot employed in our experiments (Fig. 2C, bottom right
Figure 2. Antitumor effects of PEI/miR-145 treatment in s.c. LS174Tcolon carcinoma xenograft mousemodels. A, systemic injection ofPEI/miR-145 complexes results inreduced tumor growth ascompared with untreated or PEI/RNA negative control–treatedmice. Right: representativeexamples of mice after terminationof the experiment. B, tumor-inhibitory effects of PEI/miR-145complexes are mirrored byreduced protein levels of ERK5(left) and c-Myc (middle), and bydecreased cell proliferation in thetumor tissue as determined byimmunohistochemical staining forPCNA (right). Representativeexamples of the Western blot dataand of the immunohistochemicalpictures are given. C, gelelectrophoresis andautoradiography of [32P]end–labeled miRNA reveals thedelivery of intact full-lengthmiRNAmolecules to various tissuesincluding liver (Li), kidney (Ki),spleen (Sp), and tumors (right).Differences in the biodistributionare observed between i.p. (top)and i.v. injection (bottom), withparticularly efficient miRNAdelivery into tumors upon i.p.administration. The delivery ofintact miRNA is dependent on PEIcomplexation because no signalsare observed upon injection ofnaked [32P] end–labeled miRNAs.Left: quantitation of miRNA levels,on the basis of phosphoimaging,after i.p. injection.
A
B
Untreated
PEI/miR-145PEI/-ctrl. RNA
14
16
18
20
22
Untreated
Tum
or
gro
wth
(x-f
old
ove
r tr
eatm
ent
start
± S
EM
)
4
6
8
10
12
PEI/ miR-145
PEI/-ctrl.RNA
**
Time (d)
0
2
20151050 25
C
1,000
800
600
400
ERK5 PCNA
2.0
1.5
2.5
*#
c-MycERK5β-Actin β-Actin
200
150
100
c-Myc
200
0PEI/
-ctrl.RNA PEI/
-ctrl.RNA PEI/
miR-145PEI/
miR-145
0ER
K 5
pro
tein
leve
ls(a
rbitr
.units
± S
EM
)
c-M
yc p
rote
in le
vels
(arb
itr.u
nits
± S
EM
)
1.0
0.5
0Untreated PEI/
-ctrl.RNA PEI/
miR-145Untreated
PC
NA
sco
re
(arb
itr.u
nits
± S
EM
)
50 *
200,000
150,000
300,000
250,000TumorsSpKiLi KiLi– PEI+ PEI
Naked
[32P] miRNA
[32P] miRNA
[32P] miRNA
[32P] miRNA
Complexed miRNA (i.p. injection)
TumorSpleenKidneyLiver0
50,000dpu/m
g t
issu
e ±
SE
M
100,000
TumorsLi Ki
miRNA(i.p.)
Complexed miRNA (i.v. injection)
TumorsSpKiLi KiLi
TumorsKiLi
NakedmiRNA(i.v.)
Therapeutic PEI/miRNA Delivery
www.aacrjournals.org Cancer Res; 71(15) August 1, 2011 5219
American Association for Cancer Research Copyright © 2011 on March 7, 2013cancerres.aacrjournals.orgDownloaded from
Published OnlineFirst June 20, 2011; DOI:10.1158/0008-5472.CAN-10-4645

panel). This also indicates that the mode of administrationintroduces at least some tissue preference of the complexes,even in the absence of an active ligand-mediated targeting. Bycomparing the datawith nakedmiRNAs (Fig. 2C, bottom rightpanel), the i.v. injection also confirmed that the detection ofintact miRNAs in a given tissue is dependent on PEI com-plexation.
Antitumor effects upon local application ofPEI/miR-145 complexes
To further explore the therapeutic applicability of PEI/miR-145 complexes, a local treatment regimen was testednext. In these experiments, the particularly tumorigeniccolon carcinoma cell line HCT-116 was selected. Pre-experi-ments in vitro confirmed that PEI-mediated delivery of miR-145 exerts antiproliferative effects also in this cell line, asseen by a less profound, although still statistically significant
approximately 25% to 30% decrease in colony growth in softagar assays (Supplementary Fig. S3). Again, the treatment 3times per week was started after the establishment of tumorxenografts; however, because PEI complexes were appliedlocally, miRNA amounts were reduced to 4 mg. No unwantedside effects in terms of change in mouse body weight(Supplementary Fig. S4A, right), behavioral alterations orother signs of discomfort were observed. Untreated tumorsshowed a rapid growth with an approximately 8-foldincrease over 2.5 weeks (Fig. 3A). Reduced tumor growthwas observed in the PEI/negative control RNA group, indi-cating some nonspecific effects of the PEI complexes uponlocal injection (Fig. 3A). A control experiment confirmed thenonspecific reduction of tumor growth also upon injectionof naked negative control RNA or PEI alone, indicating thepossibility of some local effects of the components of the PEIcomplexes (Fig. 3B). Notably, however, the i.t. application of
A
UntreatedPEI/-ctrl. RNA350
400
PEI/miR-145
300
***250
Tum
or
volu
me (
mm
3 ±
SE
M)
Tum
or
volu
me (
mm
3 ±
SE
M)
PC
NA
sco
re (
arb
itr. u
nits
± S
EM
)
100
200
*150
PE
I/m
iR-1
45
Untr
eate
d
PE
I/-c
trl.R
NA
016121020 1814864
50
C
2.5
3.0** *
2.0
1.5
1.0
0.5
0 PE
I/m
iR-1
45
PE
I/-ctrl. R
NA
Untre
ate
d
Time (d)
1,000
800
B
Untreated
PEI–ctrl. RNA
600
400
#
#
0
200
Time (d)
16121020 201814864
Figure 3. Tumor-inhibitory effectsof PEI/miR-145 complexes in s.c.HCT-116 colon carcinomaxenografts upon i.t. injection. A,the local administration leads tosome nonspecific effects of PEI/negative control RNA complexesas compared with untreatedcontrols; more profound effects,however, are observed in the PEI/miR-145 treatment group. B,moderate nonspecific reduction oftumor growth upon injection ofnaked negative control RNA or PEIalone, indicating the possibility ofsome local effects of thecomponents of the PEIcomplexes. C, specific antitumoreffects are reflected by reducedtumor cell proliferation in thexenografts as determined byimmunohistochemical staining forPCNA (right).
Ibrahim et al.
Cancer Res; 71(15) August 1, 2011 Cancer Research5220
American Association for Cancer Research Copyright © 2011 on March 7, 2013cancerres.aacrjournals.orgDownloaded from
Published OnlineFirst June 20, 2011; DOI:10.1158/0008-5472.CAN-10-4645

PEI/miR-145 complexes resulted in a very profound tumorgrowth inhibition, with tumor volumes in the treatmentgroup being reduced to approximately 40% or 60% of theuntreated or negative control–treated tumors, respectively(Fig. 3A). After termination of the experiment, the immu-nohistochemical analysis of the tumors revealed a markedantiproliferative effect of the PEI/miR-145 treatment(Fig. 3C).
Antitumor effects by systemic administration ofPEI/miR-33a complexesTo further substantiate the concept of PEI-mediated
miRNA replacement therapy, we selected a second miRNA,miR-33a, which we showed more recently to be relevant in thecontext of the oncogenic kinase Pim-1 (14). Pim-1 is upregu-lated in various cancers including lymphoma and coloncarcinoma, is a marker of poor prognosis in prostate carci-nomas, and has been implicated in early transformation andtumor progression (31, 32). Importantly, Pim-1 is negativelyregulated by miR-33a. Luciferase assays based on reporterconstructs comprising the luciferase gene and the Pim-1 30-UTR (untranslated region) revealed a direct effect of miR-33aon the Pim-1 30-UTR, as indicated by a approximately 50%inhibition of luciferase activity (Supplementary Fig. S5A, leftpanel). This effect was abolished upon miR-33a seed muta-genesis in the reporter construct (Supplementary Fig. S5A,right panel), confirming the specificity of this effect. So far,miR-33a has only been implicated with posttranscriptionalrepression of the ATP-binding cassette transporter A1(ABCA1) resulting in inhibition of cholesterol efflux frommacrophages and maintenance of cholesterol homeostasis
(33, 34). However, PEI-based in vitro transfection of miR-33a resulted in decreased cell proliferation in colon carcinomacells, comparable with PEI/siRNA-mediated Pim-1 knock-down (Supplementary Fig. S5B). Thus, this establishes anantiproliferative role of miR-33a and makes it an attractivecandidate miRNA for replacement therapy.
To assess the therapeutic antitumor activity of miR-33ain vivo, mice bearing s.c. LS174T tumor xenografts weretreated by i.p. injection of PEI/miR-33a complexes. Thesystemic PEI/miR-33a treatment starting upon establish-ment of the tumors at day 7 after cell injection resultedin a statistically significant, that is, approximately 40%reduction of tumor growth as compared with negativecontrol PEI/RNA-treated mice (Fig. 4A). Similar results wereobtained upon PEI-mediated delivery of a Pim-1–specificsiRNA (Fig. 4B; see Fig. 4C for representative mice). Con-comitantly, the analysis of the tumors upon termination ofthe experiment revealed an approximately 40% downregula-tion of Pim-1 in both treatment groups (Fig. 4D). Theanalysis of the mouse body weights during the whole treat-ment period revealed no changes (Supplementary S4A, left),and no other unwanted side effects in terms of behavioralalterations or other signs of discomfort were observed. Upontermination of the experiment, the determination of TNFaserum levels showed no induction of TNFa, indicating theabsence of an immune response upon PEI/miRNA treatment(Supplementary Fig. S4B). Likewise, no increase in theactivity of the liver enzymes aspartate aminotransferase(AST; Supplementary Fig. S4C, left) or alanine aminotrans-ferase (ALT; Supplementary Fig. S4C, right) were detected,thus confirming the absence of hepatotoxicity.
1,200PEI/-ctrl. RNA
CBA D
1,000PEI/miR-33aPEI/-ctrl. RNA
PEI/Pim-1 siRNAPEI/-ctrl. RNA
0.8
1.0
1.2 ***
1,000
1,200
600
800PEI/miR-33a*
0.6
0.4
0.2
600
800
200
400
PEI/Pim-1 siRNA 0 PE
I/miR
-33
a
PE
I/-ctrl. RN
A
PE
I/Pim
-1 siR
NA
Pim
-1 p
rote
in le
vels
(a
rbitr
.un
its ±
SE
M)
200
400
Tum
or
volu
me
(m
m3 ±
SE
M)
Time (d)
02420121086 22181614
Time (d)
2420121086 221816140
Figure 4. Antitumor effects of systemic PEI/miR-33a treatment in LS174T tumor xenografts as compared with PEI/siRNA-mediated knockdown of Pim-1.A, systemically injected PEI/miR-33a complexes result in inhibition of tumor growth as compared with negative control–treated mice. B, similar antitumoreffects are observed upon PEI/siRNA treatment for Pim-1 knockdown. C, representative examples of mice. D, analysis of the tumor xenografts upontermination of the experiment reveals a comparable reduction of Pim-1 levels upon PEI/miR-33a or PEI/Pim-1 siRNA treatment as compared withnegative control treatment.
Therapeutic PEI/miRNA Delivery
www.aacrjournals.org Cancer Res; 71(15) August 1, 2011 5221
American Association for Cancer Research Copyright © 2011 on March 7, 2013cancerres.aacrjournals.orgDownloaded from
Published OnlineFirst June 20, 2011; DOI:10.1158/0008-5472.CAN-10-4645

Discussion
With the discovery of RNA interference (RNAi), knockdownstrategies have gained increasing interest for the specificinhibition of pathologically upregulated genes. More recently,particular miRNAs were found to be aberrantly expressed inseveral tumors, favoring tumor development (see ref. 3). Thefunctional relevance of miRNA dysregulation is supported bythe fact that the repression or reintroduction of a singlemiRNA is able to substantially contribute to tumorigenesis,tumor progression, and/or tumor metastasis, and can corre-late with tumor differentiation, stage, and prognosis (forreview, see refs. 4, 35). Thus, in the case of upregulation,miRNAs represent interesting target molecules for inhibitionthrough miRNA antagonists such as antagomiRs or antimiRs(36, 37). However, miRNAs are more frequently downregulatedin tumors (38). Although this indicates the usefulness ofmiRNA replacement therapy, only a very few studies haveexplored this strategy so far. Although the literature onmiRNAfunctionality suggests that miRNA effects on a given gene maybe less pronounced than siRNA-mediated knockdown throughRNAi, the major advantage may lie in the fact that a givenmiRNA targets many, possibly hundreds of genes, and con-sequently induces more widespread changes in proteinexpression (39). In fact, it is the inherent mechanism ofmiRNAs to repress a large number of mRNAs, also in thecase of less than 100% complementarity to the mRNA withhigh specificity. Thus, the therapeutic application of a tumorsuppressor miRNA, which is downregulated in tumors, mayindeed entail multiple antitumor effects by specifically inter-fering with several oncogenic pathways, thus making it moredifficult for tumor cells to activate escape mechanisms. Onefeature of this interference is the rather modest effects on anygiven single gene, whichmay actually be an advantage becausethe subtle regulation of genes is the natural mechanismand therefore particularly attractive also from a therapeuticviewpoint.
Our results establish, for the first time, miR-33a as tumor-relevant miRNA suited for miRNA replacement therapy.Although miR-33a was previously shown to repress ABCA1,an important positive regulator of high-density lipoproteinsynthesis and reverse cholesterol transport (33, 34), we haverecently shown that it is able to repress the proto-oncogenePim-1, thereby acting as a tumor suppressor (14). Here, weshow antitumor effects of miR-33a delivery in vivo; however, itwill have to be seen if a prolonged treatment may lead tounwanted other effects related to the other functions of miR-33a. Future studies with the goal to identify and verify othermiR-33a target genes will help to further scrutinize the suit-ability of miR-33a for miRNA replacement therapy. To thisend, in silico predictions are insufficient because we foundthat, for example Cdk6, although identified by TargetScan 5.1as another high probability target, is not regulated by miR-33a(14). Consequently, experimental confirmation is alwaysneeded to firmly establish any regulatory mechanism ofmiRNAs. This is also true for miR-145, although several targetgenes have already been confirmed (see ref. 13), including c-Myc. Notably, we newly identify ERK5, which so far had only
been reported as a target for the related miRNA miR-143 (40),as being directly or indirectly regulated by miR-145.
Still, major limitations of siRNA-mediated therapeuticknockdown strategies also apply to miRNAs: their protectionupon systemic injection in vivo, efficient delivery to the targetorgan, cellular uptake, and intracellular release into the rightcompartment. Although certain PEIs have been used pre-viously for the delivery of other nucleic acids including smallRNA molecules in vitro and in vivo (see refs. 41, 42 for review),this article establishes for the first time a PEI-based miRNAreplacement therapy. Notably, although several, if not all PEIsare able to complex and protect nucleic acids, efficient PEI/miRNA-mediated gene targeting in vivo relies on the sufficientstability of the complexes as well as favorable pharmacoki-netic properties and high biocompatibility. Our biodistribu-tion data show the PEI-dependent delivery of unmodifiedmiRNAs into the tumors, where intact full-length miRNAsaccumulate. No chemical modifications of the miRNAs arenecessary and thus we avoid the term "miRNA mimics" toindicate that it is in fact the naturally occurring miRNAemployed here.
The bioactivity and specificity of PEI/miRNA complexes isshown by their antitumor effects and their inhibition ofspecific targets (i.e., downregulation of c-Myc, ERK5, andPim-1). The previously observed biocompatibility of PEIF25-LMW–based complexes (20), even upon repeated injec-tion, was confirmed in this study also for PEI/miRNA com-plexes. Notably, they can be stored frozen for a prolongedtime, thus allowing their standardized preparation and injec-tion as efficient and stable ready-to-use formulations withoutthe need of processing prior to administration.
The observed antitumor effects and the fact that nounwanted side effects were detected indicate that the clini-cally more relevant systemic delivery rather than an only localdelivery (i.t. injection) can be pursued.
Interestingly, we observed that PEI-mediatedmiR-33a deliv-ery versus PEI/siRNA-induced Pim-1 knockdown led to similarantitumor effects. This was true despite the fact that onco-genic lesions commonly result in the simultaneous repressionof many miRNAs (ref. 43), suggesting that more than onemiRNA might be needed for a successful therapeutic inter-vention. However, previous studies indicated as well that thedelivery of just one miRNA already exerts tumor-inhibitoryeffects (5–8, 10, 11). Nevertheless, it should be noted that thenonviral delivery of miRNAs through PEI complexes easilyallows the combination of several miRNAs, which may resultin additive or synergistic effects. This may well lead to thedevelopment of more personalized treatment strategies byprecisely analyzing miRNA expression profiles in a giventumor prior to selectively combining miRNAs identified asbeing downregulated.
Although miRNA replacement therapy seems to be rathermild and biocompatible, yet specific and efficient as atherapeutic strategy, it still requires the careful monitoringof unwanted specific or nonspecific effects. On the basis ofthe rather highly abundant delivery of miRNAs, any miRNAreplacement therapy will have to be tested for RISC satura-tion, competition with other endogenous miRNAs, or
Ibrahim et al.
Cancer Res; 71(15) August 1, 2011 Cancer Research5222
American Association for Cancer Research Copyright © 2011 on March 7, 2013cancerres.aacrjournals.orgDownloaded from
Published OnlineFirst June 20, 2011; DOI:10.1158/0008-5472.CAN-10-4645

overstimulation of a given pathway. Notably, however, thesaturation of various cellular factors, which are required forthe processing of small RNAs and whose saturation canresult in lethal effects (44), is not an issue here becausechemically synthesized mature miRNAs do not require cel-lular processing prior to RISC incorporation. Thus, miRNAsmay provide better tools than DNA-based expression sys-tems, as seen already in the case of small RNAs for geneknockdown (45). Still, any off-target effects of miRNA deliv-ery will have to be monitored in preclinical studies.Although, in principal, nonspecific effects are rather unlikelybecause the applied miRNA is identical to the physiologicallyoccurring one and is thus targeting the same mRNAs (asopposed to siRNAs which do not have natural counterparts),it has also been shown that off-target effects induced bycertain sequence motifs of synthetic RNAs can be dosedependent (46). However, the literature on miRNA replace-ment approaches so far (5, 6, 8, 10), as well as our resultseven after prolonged treatment, do not support adverseeffects. The fact that miRNAs exert only moderate effectson their target genes and are already present and functionalunder normal physiologic conditions may account for that.This may be particularly true for unmodified miRNAs, whichare preferable because they preclude any potentially adverseeffects resulting from chemical modification. Even more,however, this requires the development of powerful deliverytechniques like PEI complexation which work for unmodi-fied miRNAs.Taken together, the PEI-based therapeutic application of
unmodified miRNAs without any chemical modificationscombines several favorable properties: (i) the miRNAs are
identical to their naturally occurring counterparts (i.e., theyare not just "biosimilars," but "bioidenticals") and, simulta-neously, (ii) they are easy to produce via chemical synthesis.Previous studies (iii) have established the biocompatibility oflow molecular weight PEIs, which in their linear form arealready employed in clinical studies. The fact that (iv) no DNA-based expression constructs are employed, avoids safetyissues, for example, related to insertional mutagenesis uponviral or nonviral delivery of DNAs or overloading of the cellulardsRNA processing system, and (v) the ability of miRNAs totarget multiple oncogenic pathways predestines them for thetherapy of cancer as a "pathway disease" (47).
Disclosure of Potential Conflicts of Interest
No potential conflicts of interest were disclosed.
Acknowledgments
We thank Andrea W€ustenhagen for expert technical assistance.
Grant Support
This work was supported by grants from the German Cancer Aid (DeutscheKrebshilfe, grants 106992 and 109260 to A. Gr€unweller, R.K. Hartmann, andA. Aigner) and the Deutsche Forschungsgemeinschaft (Forschergruppe ‘Nano-hale’ AI 24/6-1 to A. Aigner), as well as by a Ph.D. fellowship grant from theYoussef Jameel Foundation to A.F. Ibrahim.
The costs of publication of this article were defrayed in part by the paymentof page charges. This article must therefore be hereby marked advertisement inaccordance with 18 U.S.C. Section 1734 solely to indicate this fact.
Received January 3, 2011; revised May 19, 2011; accepted June 1, 2011;published OnlineFirst June 20, 2011.
References1. Bartel DP. MicroRNAs: genomics, biogenesis, mechanism, and func-
tion. Cell 2004;116:281–97.2. Lewis BP, Burge CB, Bartel DP. Conserved seed pairing, often flanked
by adenosines, indicates that thousands of human genes are micro-RNA targets. Cell 2005;120:15–20.
3. Calin GA, Croce CM.MicroRNA signatures in human cancers. Nat RevCancer 2006;6:857–66.
4. Aigner A. MicroRNAs (miRNAs) in cancer invasion and metastasis:therapeutic approaches based on metastasis-related miRNAs. J MolMed 2011;89:445–57.
5. Kota J, Chivukula RR, O’Donnell KA, Wentzel EA, Montgomery CL,Hwang HW, et al. Therapeutic microRNA delivery suppresses tumor-igenesis in a murine liver cancer model. Cell 2009;137:1005–17.
6. Esquela-Kerscher A, Trang P, Wiggins JF, Patrawala L, Cheng A, FordL, et al. The let-7 microRNA reduces tumor growth in mousemodels oflung cancer. Cell cycle 2008;7:759–64.
7. Trang P, Medina PP,Wiggins JF, Ruffino L, Kelnar K, Omotola M, et al.Regression of murine lung tumors by the let-7 microRNA. Oncogene2010;29:1580–7.
8. Wiggins JF, Ruffino L, Kelnar K, Omotola M, Patrawala L, Brown D,et al. Development of a lung cancer therapeutic based on the tumorsuppressor microRNA-34. Cancer Res 2010;70:5923–30.
9. Chen Y, Zhu X, Zhang X, Liu B, Huang L. Nanoparticles modified withtumor-targeting scFv deliver siRNA and miRNA for cancer therapy.Mol Ther 2010;18:1650–6.
10. Takeshita F, Patrawala L, Osaki M, Takahashi RU, Yamamoto Y,Kosaka N, et al. Systemic delivery of synthetic microRNA-16 inhibitsthe growth of metastatic prostate tumors via downregulation of multi-ple cell-cycle genes. Mol Ther 2010;18:181–7.
11. Akao Y, Nakagawa Y, Hirata I, Iio A, Itoh T, Kojima K, et al. Role of anti-oncomirs miR-143 and -145 in human colorectal tumors. CancerGene Ther 2010;17:398–408.
12. Slaby O, Svoboda M, Fabian P, Smerdova T, Knoflickova D, Bed-narikova M, et al. Altered expression of miR-21, miR-31, miR-143 andmiR-145 is related to clinicopathologic features of colorectal cancer.Oncology 2007;72:397–402.
13. Sachdeva M, Mo YY. miR-145-mediated suppression of cell growth,invasion and metastasis. Am J Transl Res 2010;2:170–80.
14. Thomas M, Lange-Gr€unweller K, Weirauch U, Gutsch D, Aigner A,Gr€unweller A, et al. The proto-oncogene Pim-1 is a target of miR-33a.Oncogene 2011 (in press).
15. Boussif O, Lezoualc'h F, Zanta MA, Mergny MD, Scherman D, Deme-neix B, et al. A versatile vector for gene and oligonucleotide transferinto cells in culture and in vivo: polyethylenimine. Proc Natl Acad SciU S A 1995;92:7297–301.
16. Aigner A, Fischer D, Merdan T, Brus C, Kissel T, Czubayko F. Deliveryof unmodified bioactive ribozymes by an RNA-stabilizing polyethyle-nimine (LMW-PEI) efficiently down-regulates gene expression. GeneTher 2002;9:1700–7.
17. Urban-Klein B, Werth S, Abuharbeid S, Czubayko F, Aigner A. RNAi-mediated gene-targeting through systemic application of polyethyle-nimine (PEI)-complexed siRNA in vivo. Gene Ther 2005;12:461–6.
18. Behr JP. The proton sponge: a trick to enter cells the viruses did notexploit. Chimia 1997;51:34–6.
19. Werth S, Urban-Klein B, Dai L, Hobel S, Grzelinski M, Bakowsky U,et al. A low molecular weight fraction of polyethylenimine (PEI)displays increased transfection efficiency of DNA and siRNA in freshor lyophilized complexes. J Control Release 2006;112:257–70.
Therapeutic PEI/miRNA Delivery
www.aacrjournals.org Cancer Res; 71(15) August 1, 2011 5223
American Association for Cancer Research Copyright © 2011 on March 7, 2013cancerres.aacrjournals.orgDownloaded from
Published OnlineFirst June 20, 2011; DOI:10.1158/0008-5472.CAN-10-4645

20. Hobel S, Koburger I, John M, Czubayko F, Hadwiger P, VornlocherHP, et al. Polyethylenimine/small interfering RNA-mediated knock-down of vascular endothelial growth factor in vivo exerts anti-tumoreffects synergistically with Bevacizumab. J Gene Med 2010;12:287–300.
21. www.mirbase.org.22. Grzelinski M, Urban-Klein B, Martens T, Lamszus K, Bakowsky U,
Hobel S, et al. RNA interference-mediated gene silencing of pleio-trophin through polyethylenimine-complexed small interfering RNAsin vivo exerts antitumoral effects in glioblastoma xenografts. HumGene Ther 2006;17:751–66.
23. Hobel S, Prinz R, Malek A, Urban-Klein B, Sitterberg J, Bakowsky U,et al. Polyethylenimine PEI F25-LMW allows the long-term storage offrozen complexes as fully active reagents in siRNA-mediated genetargeting and DNA delivery. Eur J Pharm Biopharm 2008;70:29–41.
24. Wellstein A, Lupu R, Zugmaier G, Flamm SL, Cheville AL, Delli Bovi P,et al. Autocrine growth stimulation by secreted Kaposi's fibroblastgrowth factor but not by endogenous basic fibroblast growth factor.Cell Growth Differ 1990;1:63–71.
25. Chen C, Ridzon DA, Broomer AJ, Zhou Z, Lee DH, Nguyen JT, et al.Real-time quantification of microRNAs by stem-loop RT-PCR. NucleicAcids Res 2005;33:e179.
26. Motoyama K, Inoue H, Takatsuno Y, Tanaka F, Mimori K, Uetake H,et al. Over- and under-expressed microRNAs in human colorectalcancer. IntJ Oncol 2009;34:1069–75.
27. Arndt GM, Dossey L, Cullen LM, Lai A, Druker R, Eisbacher M, et al.Characterization of global microRNA expression reveals oncogenicpotential of miR-145 in metastatic colorectal cancer. BMC cancer2009;9:374.
28. Clape C, Fritz V, Henriquet C, Apparailly F, Fernandez PL, Iborra F,et al. miR-143 interferes with ERK5 signaling, and abrogates prostatecancer progression in mice. PLoS One 2009;4:e7542.
29. Iio A, Nakagawa Y, Hirata I, Naoe T, Akao Y. Identification of non-coding RNAs embracing microRNA-143/145 cluster. Mol Cancer2010;9:136.
30. Sachdeva M, Zhu S, Wu F, Wu H, Walia V, Kumar S, et al. p53represses c-Myc through induction of the tumor suppressor miR-145.Proc Natl Acad Sci U S A 2009;106:3207–12.
31. Bachmann M, Moroy T. The serine/threonine kinase Pim-1. Int JBiochem Cell Biol 2005;37:726–30.
32. Shah N, Pang B, Yeoh KG, Thorn S, Chen CS, Lilly MB, et al. Potentialroles for the PIM1 kinase in human cancer - a molecular and ther-apeutic appraisal. Eur J Cancer 2008;44:2144–51.
33. Najafi-Shoushtari SH, Kristo F, Li Y, Shioda T, Cohen DE, GersztenRE, et al. MicroRNA-33 and the SREBP host genes cooperate tocontrol cholesterol homeostasis. Science 2010;328:1566–9.
34. Rayner KJ, Suarez Y, Davalos A, Parathath S, Fitzgerald ML, TamehiroN, et al. MiR-33 contributes to the regulation of cholesterol home-ostasis. Science 2010;328:1570–3.
35. Lee YS, Dutta A. MicroRNAs in cancer. Annu Rev Pathol 2009;4:199–227.
36. Elmen J, Lindow M, Schutz S, Lawrence M, Petri A, Obad S, et al.LNA-mediated microRNA silencing in non-human primates. Nature2008;452:896–9.
37. Krutzfeldt J, Rajewsky N, Braich R, Rajeev KG, Tuschl T, ManoharanM, et al. Silencing of microRNAs in vivo with ‘antagomirs’. Nature2005;438:685–9.
38. Lu J, Getz G, Miska EA, Alvarez-Saavedra E, Lamb J, Peck D, et al.MicroRNA expression profiles classify human cancers. Nature 2005;435:834–8.
39. Selbach M, Schwanhausser B, Thierfelder N, Fang Z, Khanin R,Rajewsky N. Widespread changes in protein synthesis induced bymicroRNAs. Nature 2008;455:58–63.
40. Akao Y, Nakagawa Y, Iio A, Naoe T. Role of microRNA-143 in Fas-mediated apoptosis in human T-cell leukemia Jurkat cells. Leuk Res2009;33:1530–8.
41. Aigner A. Nonviral in vivo delivery of therapeutic small interferingRNAs. Curr Opin Mol Ther 2007;9:345–52.
42. Gunther M, Lipka J, Malek A, Gutsch D, Kreyling W, Aigner A.Polyethylenimines for RNAi-mediated gene targeting in vivo andsiRNA delivery to the lung. Eur J Pharm Biopharm 2011;77:438–49.
43. Chang TC, Yu D, Lee YS, Wentzel EA, Arking DE, West KM, et al.Widespread microRNA repression by Myc contributes to tumorigen-esis. Nat Genet 2008;40:43–50.
44. GrimmD, Streetz KL, Jopling CL, Storm TA, Pandey K, Davis CR, et al.Fatality in mice due to oversaturation of cellular microRNA/shorthairpin RNA pathways. Nature 2006;441:537–41.
45. McBride JL, Boudreau RL, Harper SQ, Staber PD, Monteys AM,Martins I, et al. Artificial miRNAs mitigate shRNA-mediated toxicityin the brain: implications for the therapeutic development of RNAi.Proc Natl Acad Sci U S A 2008;105:5868–73.
46. Judge AD, Sood V, Shaw JR, Fang D, McClintock K, MacLachlan I.Sequence-dependent stimulation of the mammalian innate immuneresponse by synthetic siRNA. Nat Biotechnol 2005;23:457–62.
47. Bader AG, Brown D, Winkler M. The promise of microRNA replace-ment therapy. Cancer Res 2010;70:7027–30.
Ibrahim et al.
Cancer Res; 71(15) August 1, 2011 Cancer Research5224
American Association for Cancer Research Copyright © 2011 on March 7, 2013cancerres.aacrjournals.orgDownloaded from
Published OnlineFirst June 20, 2011; DOI:10.1158/0008-5472.CAN-10-4645

1
Supplementary Materials and Methods
MiRNAs, siRNAs and primers for miRNA quantitation
Chemically synthesized miRNAs and siRNAs without modifications were purchased from MWG
(Eurofins MWG Operon, Ebersberg, Germany) or from Thermo Scientific (Schwerte, Germany). The
used miRNAs represent the double-stranded Dicer processing product as published in miRBase/
release14 (1), but lacking the 5’-terminal phosphates, and had the following sequences:
miR-33a sense strand: 5'-CAAUGUUUCCACAGUGCAUCAC-3´
antisense strand: 5’-GUGCAUUGUAGUUGCAUUGCA-3';
miR-143 sense strand: 5'-GGUGCAGUGCUGCAUCUCUGGU-3';
antisense strand: 5'-UGAGAUGAAGCACUGUAGCUC-3'
miR-145 sense strand: 5'-GUCCAGUUUUCCCAGGAAUCCCU-3';
antisense strand: 5'-GGAUUCCUGGAAAUACUGUUCU-3'
Pim-1 siRNA sense: 5’-GGAACAACAUUUACAACUCdTdT-3';
antisense strand 5’-GAGUUGUAAAUGUUGUUCCdTdT-3´.
An siRNA directed against an irrelevant gene (luciferase) was obtained from Thermo Scientific and
used as negative control
sense strand: 5'-CUUACGCUGAGUACUUCGAdTdT-3';
antisense strand: 5’-UCGAAGUACUCAGCGUAAGdTdT-3'.
For miRNA reverse transcription, specific stem-looped RT primers were used as described previously
(2). For quantitation, specific forward and universal primers were used:
miR-145 forward: 5'-CGCGCGTTCCAGTTTTCCCAGG-3';
miR-143 forward: CGCGCGTGAGATGAAGCACT-3';
universal reverse PCR primer: 5'-GTGCAGGGTCCGAGGT-3'.
Western blots and immunohistochemistry
Samples containing 100 μg protein were separated by SDS-PAGE (15% polyacrylamide gel) and
transferred onto a nitrocellulose membrane (Protran Nitrocellulose Transfer Membrane 0.45 µm
Schleicher&Schuell, Dassel, Germany). Membranes were blocked with 5% milk powder in Tris-
buffered saline + Tween (TBST; 20 mM Tris, pH 7.5, 150 mM NaCl, and 0.1% Tween-20) and
incubated with rabbit polyclonal primary antibodies (anti-c-Myc, 1:500 (Santa Cruz Biotechnology,
CA, USA), anti-ERK5, 1:1000 (Cell Signalling), or, as loading control, anti--Actin, 1:5000 (Santa
Cruz Biotechnology)). The blots were then washed in TBST and incubated for 1 h at RT with a
horseradish peroxidase-coupled donkey anti-rabbit IgG secondary antibody (GE Healthcare Bio-
Sciences, Uppsala, Sweden), diluted 1:2000 in TBST. After washing in TBST, bound antibodies were
visualized by chemiluminescence (ECL SuperSignal West Pico Kit, Thermo Fisher Scientific,
2
Rockford, IL, USA). Bands were scanned and quantitated using ImageJ (National Institutes of Health,
Maryland, USA).
Immunohistochemical staining of paraffin-embedded sections for PCNA was performed essentially as
described previously (3). After deparaffinization with xylene and rehydration with graded alcohols,
sections were boiled in 1% acetic acid in PBS for 10 min and endogenous peroxidases were
inactivated with 0.3% hydrogen peroxide at 4°C for 30 min. After blocking with 10% normal horse
serum in PBST/2% BSA for 1 h at RT, the slides were incubated overnight with mouse monoclonal
anti-PCNA (proliferating cell nuclear antigen) antibodies (Dako, Hamburg, Germany), diluted 1:200
in PBST, at RT in a wet chamber. For detection, biotinylated goat anti-(mouse-IgG) antibody (Vector
Laboratories, Burlingame, CA, 1:500) was applied for 1 h, and immunoreactivity on the sections was
visualized using a streptavidin-biotin-peroxidase complex (ABC kit, Vector Laboratories) and the
peroxidase substrate diaminobenzidine (brownish colour) according to the manufacturer's instructions.
ELISA
The “Pim-1 Total Antibody Pair” and buffers (Invitrogen) were used and the procedure was performed
according to manufacturer’s protocol. Round bottom Maxisorp 96-well microtiter plates (Nunc) where
coated overnight at 4°C with 100 µl coating antibody, diluted 1:250 in Coating Buffer B. After
washing with Washing Buffer and blocking for 1 h at RT with Assay Buffer, 100 µl supernatant from
a tumor sample (homogenized in PBS and centrifuged at 13,000 rpm) was added per well, followed by
incubation for 2 h at RT. Wells were then washed five times with Washing Buffer prior to addition of
100 µl Pim-1 detection antibody, diluted 1:250 in Assay Buffer, followed by incubation for 1 h at RT.
After another five times washing as above, anti-rabbit-IgG-HRP (1:1000 in Assay Buffer) was added
and samples were incubated for 30 min at RT. After five times washing, the signal was developed with
TMB-substrate (R&D) and after 30 min the reaction was stopped with 2N H2SO4. Absorbance was
measured in a microplate reader at 450 nm with the reference absorbance at 630 nm.
References
1. www.mirbase.org.
2. Chen C, Ridzon DA, Broomer AJ, Zhou Z, Lee DH, Nguyen JT, et al. Real-time quantification of
microRNAs by stem-loop RT-PCR. Nucleic Acids Res 2005;33:e179.
3. Hobel S, Koburger I, John M, Czubayko F, Hadwiger P, Vornlocher HP, et al.
Polyethylenimine/small interfering RNA-mediated knockdown of vascular endothelial growth
factor in vivo exerts anti-tumor effects synergistically with Bevacizumab. J Gene Med
2010;12:287-300.

0,12
0,14
U6
0,08
0,10
s no
rmal
ized
to U
units
+/-
SE
M)
0,04
0,06
miR
-145
leve
ls(a
rbitr
ary
colon carcinoma
K56
2
KO
V3
CAR
3
W62
0
HT2
9
LS18
0
W48
0
S174
T
lo20
1
CT1
16
LoV
o
U14
5
PC3
A54
9
U87
05LU
H/3
T3
0,00
0,02
SK
OV
C
SW L SW
LS Co
HC D 12 NIH
Cell line
Ibrahim et al., Suppl. Fig. 1 - revised

M)
8
10
12wt (non-transfected)PEI / miR-143PEI / neg.ctrl. RNA
ectio
n st
art +
/-SE
M
3.0
3.5
4.0
er fi
eld
+/-S
EM
*** ***
4
6
8
x-fo
ld o
ver t
rans
fe
2.5
2.0
1.5
ber o
f col
onie
s pe
0
2
20 60 80 120100 140 160 180Cel
l pro
lifer
atio
n (x
0
0.5
1.0
t ( PEI / PEI /
Ave
rage
num
wt (non-transfected)
PEI /miR-143
PEI / -ctrl.RNA
4020 60 80 120100 140 160 180C wt (non-transfected)
PEI /miR-143
PEI / -ctrl.RNA
40
Ibrahim et al., Suppl. Fig. 2 - revised
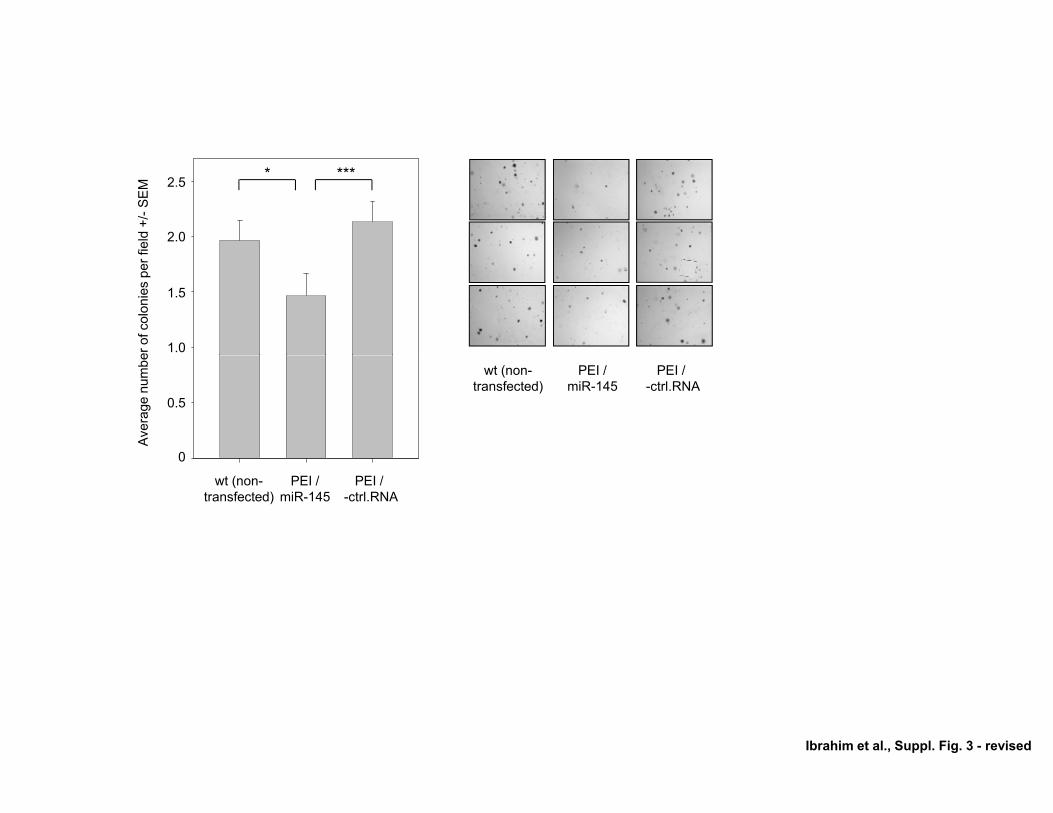
2.5
2.0
field
+/-
SE
M
* ***
1.5
1.0er o
f col
onie
s pe
r f
0
0.5
Ave
rage
num
be wt (non-transfected)
PEI /miR-145
PEI / -ctrl.RNA
0
wt (non-transfected)
PEI /miR-145
PEI / -ctrl.RNA
Ibrahim et al., Suppl. Fig. 3 - revised

A
/-SE
M)
25
30
35
/-SE
M)
30
35
40
ouse
wei
ghts
(g +
/
10
15
20
25
ouse
wei
ghts
(g +
/
15
20
25
Mea
n m
o
0
5
10
6 8 10 12 20 242214 16 18 0 2 10 12 164 6 8 14 18
Mea
n m
o
0
5
10untreated
PEI / miR-145PEI / -ctrl. RNA
PEI / miR-33a
PEI / -ctrl. RNAPEI / Pim-1 siRNA
B
M)
C
Time (d); treatment start at day 7 Time after treatment start (d)
)
TNFα
er u
ntre
ated
+/-
SE
M
4
3
2 nzym
e ac
tiviti
es
r unt
reat
ed +
/-S
EM 4
3
2T(-f
old
chan
ge o
ve
u p
1
2
0 P
AS
T / A
LT e
n(-f
old
chan
ge o
ver
1
2
0 u P u P
Ibrahim et al., Suppl. Fig. 4 - revised
unreated
pos.ctrl. (LPS
)
PEI / m
iRN
A
unreated
PEI / m
iRN
A
unreated
PEI / m
iRN
A

A B
)
18PEI / t l RNAM
)
120 * #
10
12
erat
ion
tion
star
t +/-
SEM
)
14
16PEI / -ctrl. RNAPEI / Pim-1 siRNAPEI / miR-33a
f neg
.ctrl
. +/-
SEM
100
80
120 #
**
4
6
8
10
Cel
l pro
life
fold
ove
r tra
nsfe
ct
rase
act
ivity
(% o
f
60
40
***
2
40 60 80 120100 140 160
(x-f
Time (h)
020
Luci
fe
PE
I / -ct
PEI / mi
PE
I / -ct
PEI / mi
20
0
Pim-1 3‘-UTR
trl.RN
A
R-33a
trl.RN
A
R-33a
Pim-1 3‘-UTR mut
Ibrahim et al., Suppl. Fig. 5 - revised
1
Suppl. Figure 1. Expression of miR-145 in various tumor cell lines. All eight tested colon carcinoma
cell lines display low miR-145 levels as compared to non-tumorous NIH3T3 or some other tumor cell
lines.
Suppl. Figure 2. In vitro effects of PEI-mediated delivery of miR-143 in LS174T colon carcinoma
cells. Upon PEI/miR-143 transfection no inhibition of anchorage-dependent proliferation is observed
(A) while anchorage-independent colony formation in soft agar is reduced by ~ 50% (B).
Suppl. Figure 3. Inhibition of anchorage-independent growth of HCT-116 colon carcinoma cells upon
PEI-mediated delivery of miR-145, as determined by colony formation in soft agar.
Suppl. Figure 4. Absence of non-specific effects upon PEI/miRNA treatment of mice. (A) Monitoring
of tumor weights of mice upon repeated i.p. (left) or i.t. injection (right), referring to the experiments
shown in Figs. 4 and 3, respectively, over the whole duration of the treatment. (B) Change in TNFα
serum levels at 60 min after PEI/miRNA or lipopolysaccharide (LPS, positive control) treatment, as
determined by ELISA according to the manufacturer's protocol (ELISA Development Kits from
Preprotech, Rocky Hill, NJ). (C) Changes in the activity of liver enzymes aspartate aminotransferase
(AST, SGOT; left) and alanine aminotransferase (ALT, SGPT; right) after four consecutive
PEI/miRNA treatments (days 1, 3, 5, 8), as determined by enzyme assays (DiaSys Diagnostic
Systems, Holzheim, Germany) 60 min after the last i.p. injections.
Suppl. Figure 5. Tumor cell-inhibitory effects of miR-33a mediated through Pim-1 inhibition. (A)
Direct inhibititory effect of miR-33a on the Pim-1 3'-UTR. The transfection of the cells with PEI/miR-
33a inhibits luciferase expression in the reporter construct containing the 3'-UTR of Pim-1 (left), but
not upon miR-33a seed mutagenesis (right). Luciferase activities were determined 24 h after the co-
transfection of 200 ng reporter plasmid and 1 pmol miRNA or negative control RNA into 100,000
LS174T cells in 24-well plates, using 1.5 µl jetPrime (Polyplus). (B) Anti-proliferative effects in
anchorage-dependent growth of LS174T cells upon PEI/miR-33a or PEI/Pim-1 siRNA transfection.

Appendix
146
C. Publication III
PEI-complexed LNA antiseeds as miRNA inhibitors.
RNA Biology (2012), 9(8), 1088-1098
Impact Factor: 5.56*
*RNA Biology (2011), 8(1)
Author contributions:
Research design: 40 %
Experimental work: 60 %
Data analysis and evaluation: 70 %
Manuscript writing: 30 %

©2
01
2 L
an
de
s B
ioscie
nce
. D
o n
ot d
istr
ibu
te
RNA Biology 9:8, 1088-1098; August 2012; © 2012 Landes Bioscience
ReseARch pApeR
1088 RNA Biology Volume 9 Issue 8
*Correspondence to: Roland K. Hartmann and Arnold Grünweller; Email: [email protected] and [email protected]: 12/30/11; Revised: 04/24/12; Accepted: 06/19/12http://dx.doi.org/10.4161/rna.21165
Introduction
Small non-coding RNAs (sRNA), such as miRNAs, are involved in the regulation of virtually all essential cellular processes, and their deregulation has important implications in pathogen-esis. The impact of miRNAs on human diseases has been well established e.g., in the cancer field (for a review see ref. 1), where several miRNAs are either overexpressed in tumors (oncogenic miRNAs) or show reduced levels (miRNAs with tumor suppres-sor activity). This results in the downregulation of tumor sup-pressor genes or in the upregulation of cellular proto-oncogenes, respectively.2 A well characterized and important cellular tumor suppressor is the cell cycle regulator p21, which is post-transcrip-tionally regulated by miRNAs of the oncogenic miR-17–92 clus-ter.3 Oncogenic miRNAs or miRNA clusters are often found in chromosomal regions that are amplified in tumor cells, which promotes their overexpression.4,5 For example, the miR-17–92 cluster is overexpressed in lymphoma as well as in a wide range of human solid tumors.6 MiRNAs of this cluster (mainly miR-17–5p, miR-19 and miR-20a) inhibit apoptosis, promote prolif-eration and induce tumor angiogenesis.7,8
Antisense inhibition of oncogenic or other disease-related miRNAs and miRNA families in vivo may provide novel therapeutic strategies. however, this approach relies on the development of potent miRNA inhibitors and their efficient delivery into cells. here, we introduce short seed-directed LNA oligonucleotides (12- or 14-mer antiseeds) with a phosphodiester backbone (pO) for efficient miRNA inhibition. We have analyzed such LNA (pO) antiseeds using a let-7a-controlled luciferase reporter assay and identified them as active miRNA inhibitors in vitro. Moreover, LNA (pO) 14-mer antiseeds against ongogenic miR-17–5p and miR-20a derepress endogenous p21 expression more persistently than corresponding miRNA hairpin inhibitors, which are often used to inhibit miRNA function. Further analysis of the antiseed-mediated derepression of p21 in luciferase reporter constructs - containing the 3'-UTR of p21 and harboring two binding sites for miRNAs of the miR-106b family - provided evidence that the LNA antiseeds inhibit miRNA families while hairpin inhibitors act in a miRNA-specific manner. The derepression caused by LNA antiseeds is specific, as demonstrated via seed mutagenesis of the miR-106b target sites. Importantly, we show functional delivery of LNA (pO) 14-mer antiseeds into cells upon complexation with polyethylenimine (peI F25-LMW), which leads to the formation of polymeric nanoparticles. In contrast, attempts to deliver a functional seed-directed tiny LNA 8-mer with a phosphorothioate backbone (ps) by formulation with peI F25-LMW remained unsuccessful. In conclusion, LNA (pO) 14-mer antiseeds are attractive miRNA inhibitors, and their peI-based delivery may represent a promising new strategy for therapeutic applications.
PEI-complexed LNA antiseeds as miRNA inhibitorsMaren Thomas,1 Kerstin Lange-Grünweller,1 eyas Dayyoub,2 Udo Bakowsky,2 Ulrike Weirauch,3 Achim Aigner,3 Roland K.
hartmann1,* and Arnold Grünweller1,*
1Institut für pharmazeutische chemie, philipps-Universität Marburg; Marburg, Germany; 2Institut für pharmazeutische Technologie und Biopharmazie, philipps-Universität Marburg; Marburg, Germany; 3Rudolf-Boehm-Institut für pharmakologie und Toxikologie, Universität Leipzig; Leipzig, Germany
Keywords: miRNA, miR-17-92, let-7a, antimiR, antiseed, LNA, PEI, p21, cancer
Abbreviations: PO, phosphodiester; 3'-UTR, 3'-untranslated region; LNA, locked nucleic acid; PEI, polyethylenimine; PS, phosphorothioate; PEI F25-LMW, polyethylenimine F25 low molecular weight; RLU, relative light units; FCS, fetal calf serum;
WST-1, water soluble tetrazolium salt 1
Several strategies have been developed to block cellular miRNA function, including the use of miRNA sponges, mask-ing of the mRNA target site or inhibition of miRNAs by anti-sense oligonucleotides (generally termed antimiRs; for a review see ref. 9). For therapeutic intervention the use of antisense strat-egies against miRNAs has been established in mice and non-human primates.10,11 However, efficient delivery of antimiRs is still the main bottleneck for therapeutic applications. Several efforts have been made to deliver antimiRs into cells and tis-sues, e.g., the conjugation of modified antimiRs with cholesterol, which were termed antagomiRs.12 Moreover, important improve-ments with regard to antimiR efficacy, stability and delivery have been achieved by the incorporation of modified nucleotides (for a review see ref. 13). In particular, 2'-fluor (2'-F), 2'-oxymethyl (2'-OMe), 2'-methoxyethyl (2'-MOE) and locked nucleic acid (LNA) modifications have been incorporated into antimiRs for in vivo applications. So far, the most efficient variants are 2'-F/2'-MOE mixmers directed against the complete miRNA guide strand,11,14 15- or 16-mer LNA/DNA mixmers with 2'-OMe cytosines and a phosphorothioate (PS)10,15,16 or phosphodiester (PO) backbone,17 and tiny LNA 8-mers with a PS backbone.18,19 All these antimiRs
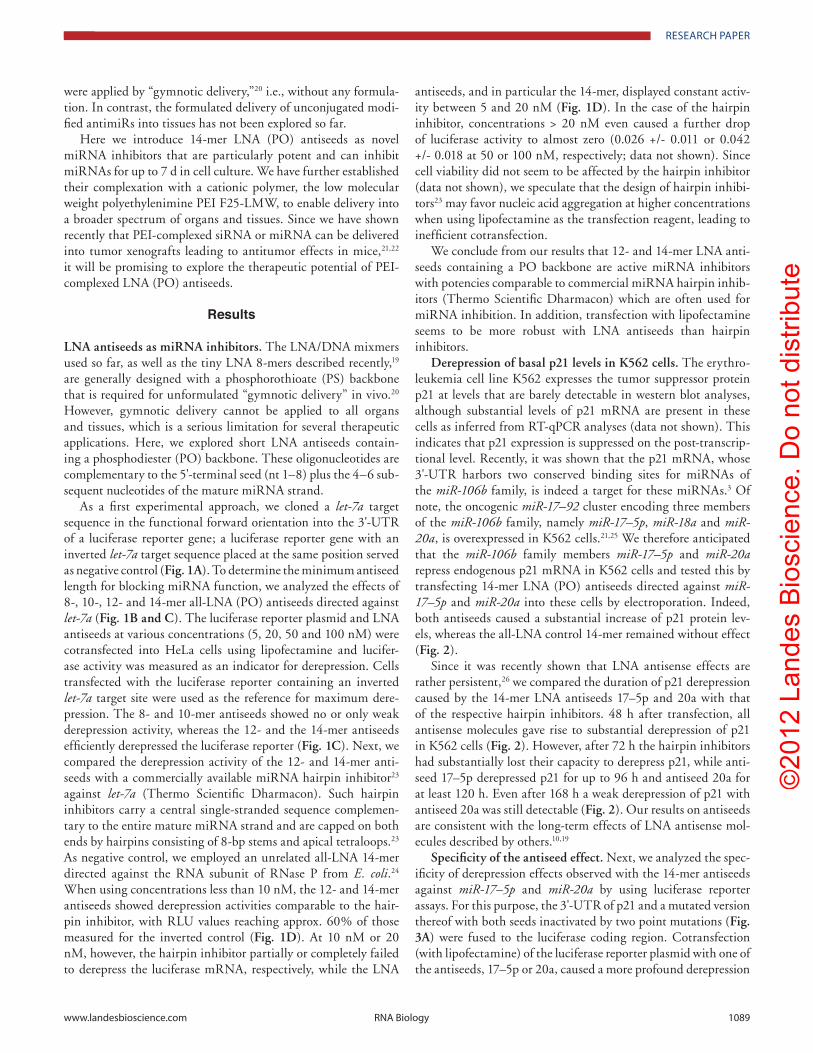
©2
01
2 L
an
de
s B
ioscie
nce
. D
o n
ot d
istr
ibu
te
www.landesbioscience.com RNA Biology 1089
ReseARch pApeR ReseARch pApeR
antiseeds, and in particular the 14-mer, displayed constant activ-ity between 5 and 20 nM (Fig. 1D). In the case of the hairpin inhibitor, concentrations > 20 nM even caused a further drop of luciferase activity to almost zero (0.026 +/- 0.011 or 0.042 +/- 0.018 at 50 or 100 nM, respectively; data not shown). Since cell viability did not seem to be affected by the hairpin inhibitor (data not shown), we speculate that the design of hairpin inhibi-tors23 may favor nucleic acid aggregation at higher concentrations when using lipofectamine as the transfection reagent, leading to inefficient cotransfection.
We conclude from our results that 12- and 14-mer LNA anti-seeds containing a PO backbone are active miRNA inhibitors with potencies comparable to commercial miRNA hairpin inhib-itors (Thermo Scientific Dharmacon) which are often used for miRNA inhibition. In addition, transfection with lipofectamine seems to be more robust with LNA antiseeds than hairpin inhibitors.
Derepression of basal p21 levels in K562 cells. The erythro-leukemia cell line K562 expresses the tumor suppressor protein p21 at levels that are barely detectable in western blot analyses, although substantial levels of p21 mRNA are present in these cells as inferred from RT-qPCR analyses (data not shown). This indicates that p21 expression is suppressed on the post-transcrip-tional level. Recently, it was shown that the p21 mRNA, whose 3'-UTR harbors two conserved binding sites for miRNAs of the miR-106b family, is indeed a target for these miRNAs.3 Of note, the oncogenic miR-17–92 cluster encoding three members of the miR-106b family, namely miR-17–5p, miR-18a and miR-20a, is overexpressed in K562 cells.21,25 We therefore anticipated that the miR-106b family members miR-17–5p and miR-20a repress endogenous p21 mRNA in K562 cells and tested this by transfecting 14-mer LNA (PO) antiseeds directed against miR-17–5p and miR-20a into these cells by electroporation. Indeed, both antiseeds caused a substantial increase of p21 protein lev-els, whereas the all-LNA control 14-mer remained without effect (Fig. 2).
Since it was recently shown that LNA antisense effects are rather persistent,26 we compared the duration of p21 derepression caused by the 14-mer LNA antiseeds 17–5p and 20a with that of the respective hairpin inhibitors. 48 h after transfection, all antisense molecules gave rise to substantial derepression of p21 in K562 cells (Fig. 2). However, after 72 h the hairpin inhibitors had substantially lost their capacity to derepress p21, while anti-seed 17–5p derepressed p21 for up to 96 h and antiseed 20a for at least 120 h. Even after 168 h a weak derepression of p21 with antiseed 20a was still detectable (Fig. 2). Our results on antiseeds are consistent with the long-term effects of LNA antisense mol-ecules described by others.10,19
Specificity of the antiseed effect. Next, we analyzed the spec-ificity of derepression effects observed with the 14-mer antiseeds against miR-17–5p and miR-20a by using luciferase reporter assays. For this purpose, the 3'-UTR of p21 and a mutated version thereof with both seeds inactivated by two point mutations (Fig. 3A) were fused to the luciferase coding region. Cotransfection (with lipofectamine) of the luciferase reporter plasmid with one of the antiseeds, 17–5p or 20a, caused a more profound derepression
were applied by “gymnotic delivery,”20 i.e., without any formula-tion. In contrast, the formulated delivery of unconjugated modi-fied antimiRs into tissues has not been explored so far.
Here we introduce 14-mer LNA (PO) antiseeds as novel miRNA inhibitors that are particularly potent and can inhibit miRNAs for up to 7 d in cell culture. We have further established their complexation with a cationic polymer, the low molecular weight polyethylenimine PEI F25-LMW, to enable delivery into a broader spectrum of organs and tissues. Since we have shown recently that PEI-complexed siRNA or miRNA can be delivered into tumor xenografts leading to antitumor effects in mice,21,22 it will be promising to explore the therapeutic potential of PEI-complexed LNA (PO) antiseeds.
Results
LNA antiseeds as miRNA inhibitors. The LNA/DNA mixmers used so far, as well as the tiny LNA 8-mers described recently,19 are generally designed with a phosphorothioate (PS) backbone that is required for unformulated “gymnotic delivery” in vivo.20 However, gymnotic delivery cannot be applied to all organs and tissues, which is a serious limitation for several therapeutic applications. Here, we explored short LNA antiseeds contain-ing a phosphodiester (PO) backbone. These oligonucleotides are complementary to the 5'-terminal seed (nt 1–8) plus the 4–6 sub-sequent nucleotides of the mature miRNA strand.
As a first experimental approach, we cloned a let-7a target sequence in the functional forward orientation into the 3'-UTR of a luciferase reporter gene; a luciferase reporter gene with an inverted let-7a target sequence placed at the same position served as negative control (Fig. 1A). To determine the minimum antiseed length for blocking miRNA function, we analyzed the effects of 8-, 10-, 12- and 14-mer all-LNA (PO) antiseeds directed against let-7a (Fig. 1B and C). The luciferase reporter plasmid and LNA antiseeds at various concentrations (5, 20, 50 and 100 nM) were cotransfected into HeLa cells using lipofectamine and lucifer-ase activity was measured as an indicator for derepression. Cells transfected with the luciferase reporter containing an inverted let-7a target site were used as the reference for maximum dere-pression. The 8- and 10-mer antiseeds showed no or only weak derepression activity, whereas the 12- and the 14-mer antiseeds efficiently derepressed the luciferase reporter (Fig. 1C). Next, we compared the derepression activity of the 12- and 14-mer anti-seeds with a commercially available miRNA hairpin inhibitor23 against let-7a (Thermo Scientific Dharmacon). Such hairpin inhibitors carry a central single-stranded sequence complemen-tary to the entire mature miRNA strand and are capped on both ends by hairpins consisting of 8-bp stems and apical tetraloops.23 As negative control, we employed an unrelated all-LNA 14-mer directed against the RNA subunit of RNase P from E. coli.24 When using concentrations less than 10 nM, the 12- and 14-mer antiseeds showed derepression activities comparable to the hair-pin inhibitor, with RLU values reaching approx. 60% of those measured for the inverted control (Fig. 1D). At 10 nM or 20 nM, however, the hairpin inhibitor partially or completely failed to derepress the luciferase mRNA, respectively, while the LNA
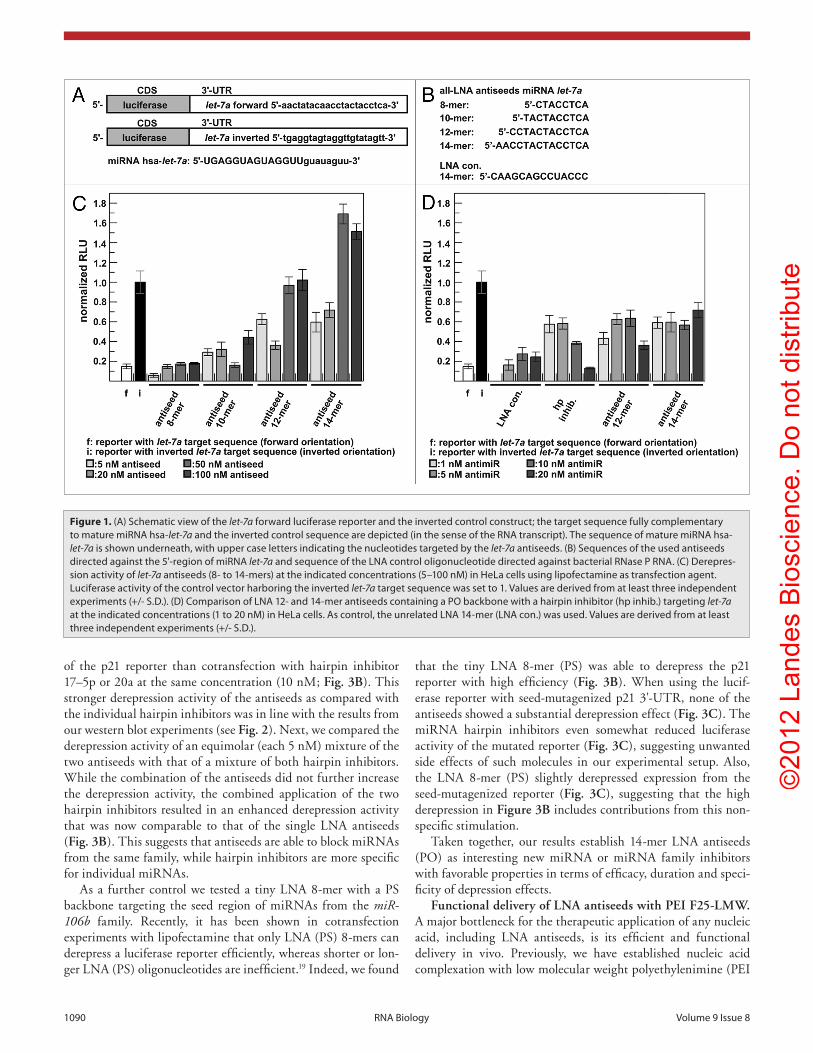
©2
01
2 L
an
de
s B
ioscie
nce
. D
o n
ot d
istr
ibu
te
1090 RNA Biology Volume 9 Issue 8
that the tiny LNA 8-mer (PS) was able to derepress the p21 reporter with high efficiency (Fig. 3B). When using the lucif-erase reporter with seed-mutagenized p21 3'-UTR, none of the antiseeds showed a substantial derepression effect (Fig. 3C). The miRNA hairpin inhibitors even somewhat reduced luciferase activity of the mutated reporter (Fig. 3C), suggesting unwanted side effects of such molecules in our experimental setup. Also, the LNA 8-mer (PS) slightly derepressed expression from the seed-mutagenized reporter (Fig. 3C), suggesting that the high derepression in Figure 3B includes contributions from this non-specific stimulation.
Taken together, our results establish 14-mer LNA antiseeds (PO) as interesting new miRNA or miRNA family inhibitors with favorable properties in terms of efficacy, duration and speci-ficity of depression effects.
Functional delivery of LNA antiseeds with PEI F25-LMW. A major bottleneck for the therapeutic application of any nucleic acid, including LNA antiseeds, is its efficient and functional delivery in vivo. Previously, we have established nucleic acid complexation with low molecular weight polyethylenimine (PEI
of the p21 reporter than cotransfection with hairpin inhibitor 17–5p or 20a at the same concentration (10 nM; Fig. 3B). This stronger derepression activity of the antiseeds as compared with the individual hairpin inhibitors was in line with the results from our western blot experiments (see Fig. 2). Next, we compared the derepression activity of an equimolar (each 5 nM) mixture of the two antiseeds with that of a mixture of both hairpin inhibitors. While the combination of the antiseeds did not further increase the derepression activity, the combined application of the two hairpin inhibitors resulted in an enhanced derepression activity that was now comparable to that of the single LNA antiseeds (Fig. 3B). This suggests that antiseeds are able to block miRNAs from the same family, while hairpin inhibitors are more specific for individual miRNAs.
As a further control we tested a tiny LNA 8-mer with a PS backbone targeting the seed region of miRNAs from the miR-106b family. Recently, it has been shown in cotransfection experiments with lipofectamine that only LNA (PS) 8-mers can derepress a luciferase reporter efficiently, whereas shorter or lon-ger LNA (PS) oligonucleotides are inefficient.19 Indeed, we found
Figure 1. (A) schematic view of the let-7a forward luciferase reporter and the inverted control construct; the target sequence fully complementary to mature miRNA hsa-let-7a and the inverted control sequence are depicted (in the sense of the RNA transcript). The sequence of mature miRNA hsa-let-7a is shown underneath, with upper case letters indicating the nucleotides targeted by the let-7a antiseeds. (B) sequences of the used antiseeds directed against the 5'-region of miRNA let-7a and sequence of the LNA control oligonucleotide directed against bacterial RNase p RNA. (c) Derepres-sion activity of let-7a antiseeds (8- to 14-mers) at the indicated concentrations (5–100 nM) in heLa cells using lipofectamine as transfection agent. Luciferase activity of the control vector harboring the inverted let-7a target sequence was set to 1. Values are derived from at least three independent experiments (+/- s.D.). (D) comparison of LNA 12- and 14-mer antiseeds containing a pO backbone with a hairpin inhibitor (hp inhib.) targeting let-7a at the indicated concentrations (1 to 20 nM) in heLa cells. As control, the unrelated LNA 14-mer (LNA con.) was used. Values are derived from at least three independent experiments (+/- s.D.).
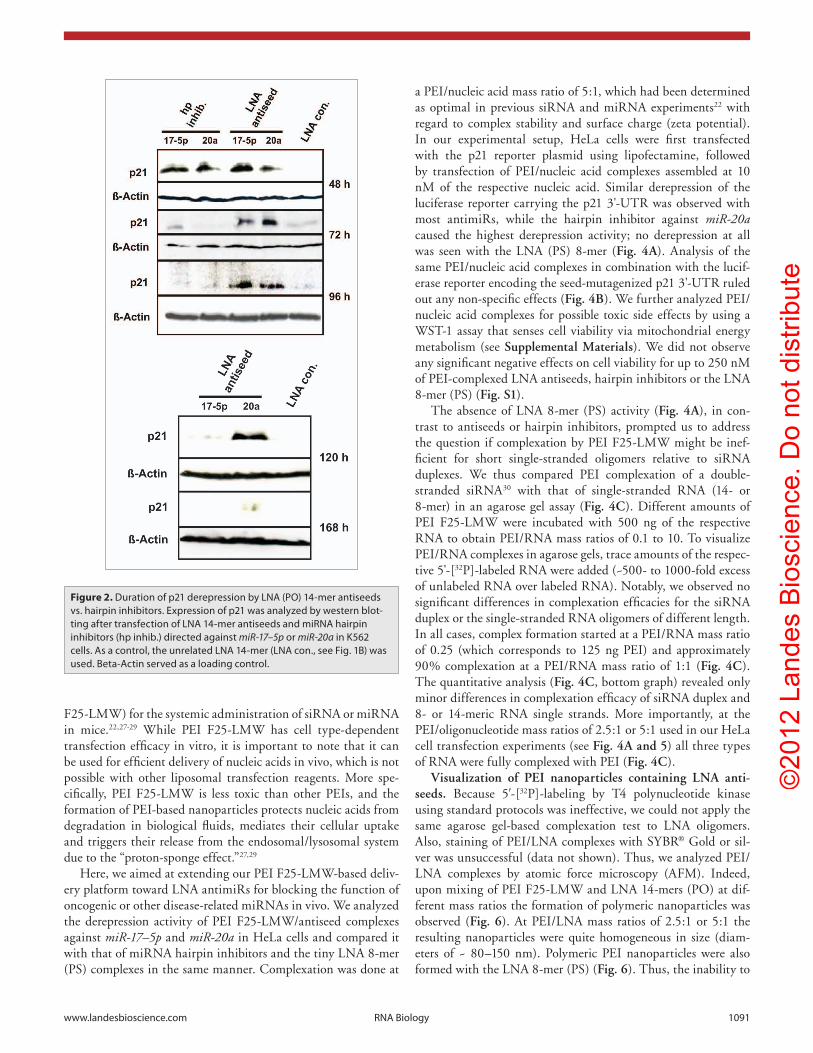
©2
01
2 L
an
de
s B
ioscie
nce
. D
o n
ot d
istr
ibu
te
www.landesbioscience.com RNA Biology 1091
a PEI/nucleic acid mass ratio of 5:1, which had been determined as optimal in previous siRNA and miRNA experiments22 with regard to complex stability and surface charge (zeta potential). In our experimental setup, HeLa cells were first transfected with the p21 reporter plasmid using lipofectamine, followed by transfection of PEI/nucleic acid complexes assembled at 10 nM of the respective nucleic acid. Similar derepression of the luciferase reporter carrying the p21 3'-UTR was observed with most antimiRs, while the hairpin inhibitor against miR-20a caused the highest derepression activity; no derepression at all was seen with the LNA (PS) 8-mer (Fig. 4A). Analysis of the same PEI/nucleic acid complexes in combination with the lucif-erase reporter encoding the seed-mutagenized p21 3'-UTR ruled out any non-specific effects (Fig. 4B). We further analyzed PEI/nucleic acid complexes for possible toxic side effects by using a WST-1 assay that senses cell viability via mitochondrial energy metabolism (see Supplemental Materials). We did not observe any significant negative effects on cell viability for up to 250 nM of PEI-complexed LNA antiseeds, hairpin inhibitors or the LNA 8-mer (PS) (Fig. S1).
The absence of LNA 8-mer (PS) activity (Fig. 4A), in con-trast to antiseeds or hairpin inhibitors, prompted us to address the question if complexation by PEI F25-LMW might be inef-ficient for short single-stranded oligomers relative to siRNA duplexes. We thus compared PEI complexation of a double-stranded siRNA30 with that of single-stranded RNA (14- or 8-mer) in an agarose gel assay (Fig. 4C). Different amounts of PEI F25-LMW were incubated with 500 ng of the respective RNA to obtain PEI/RNA mass ratios of 0.1 to 10. To visualize PEI/RNA complexes in agarose gels, trace amounts of the respec-tive 5'-[32P]-labeled RNA were added (~500- to 1000-fold excess of unlabeled RNA over labeled RNA). Notably, we observed no significant differences in complexation efficacies for the siRNA duplex or the single-stranded RNA oligomers of different length. In all cases, complex formation started at a PEI/RNA mass ratio of 0.25 (which corresponds to 125 ng PEI) and approximately 90% complexation at a PEI/RNA mass ratio of 1:1 (Fig. 4C). The quantitative analysis (Fig. 4C, bottom graph) revealed only minor differences in complexation efficacy of siRNA duplex and 8- or 14-meric RNA single strands. More importantly, at the PEI/oligonucleotide mass ratios of 2.5:1 or 5:1 used in our HeLa cell transfection experiments (see Fig. 4A and 5) all three types of RNA were fully complexed with PEI (Fig. 4C).
Visualization of PEI nanoparticles containing LNA anti-seeds. Because 5′-[32P]-labeling by T4 polynucleotide kinase using standard protocols was ineffective, we could not apply the same agarose gel-based complexation test to LNA oligomers. Also, staining of PEI/LNA complexes with SYBR® Gold or sil-ver was unsuccessful (data not shown). Thus, we analyzed PEI/LNA complexes by atomic force microscopy (AFM). Indeed, upon mixing of PEI F25-LMW and LNA 14-mers (PO) at dif-ferent mass ratios the formation of polymeric nanoparticles was observed (Fig. 6). At PEI/LNA mass ratios of 2.5:1 or 5:1 the resulting nanoparticles were quite homogeneous in size (diam-eters of ~ 80–150 nm). Polymeric PEI nanoparticles were also formed with the LNA 8-mer (PS) (Fig. 6). Thus, the inability to
F25-LMW) for the systemic administration of siRNA or miRNA in mice.22,27-29 While PEI F25-LMW has cell type-dependent transfection efficacy in vitro, it is important to note that it can be used for efficient delivery of nucleic acids in vivo, which is not possible with other liposomal transfection reagents. More spe-cifically, PEI F25-LMW is less toxic than other PEIs, and the formation of PEI-based nanoparticles protects nucleic acids from degradation in biological fluids, mediates their cellular uptake and triggers their release from the endosomal/lysosomal system due to the “proton-sponge effect.”27,29
Here, we aimed at extending our PEI F25-LMW-based deliv-ery platform toward LNA antimiRs for blocking the function of oncogenic or other disease-related miRNAs in vivo. We analyzed the derepression activity of PEI F25-LMW/antiseed complexes against miR-17–5p and miR-20a in HeLa cells and compared it with that of miRNA hairpin inhibitors and the tiny LNA 8-mer (PS) complexes in the same manner. Complexation was done at
Figure 2. Duration of p21 derepression by LNA (pO) 14-mer antiseeds vs. hairpin inhibitors. expression of p21 was analyzed by western blot-ting after transfection of LNA 14-mer antiseeds and miRNA hairpin inhibitors (hp inhib.) directed against miR-17–5p or miR-20a in K562 cells. As a control, the unrelated LNA 14-mer (LNA con., see Fig. 1B) was used. Beta-Actin served as a loading control.
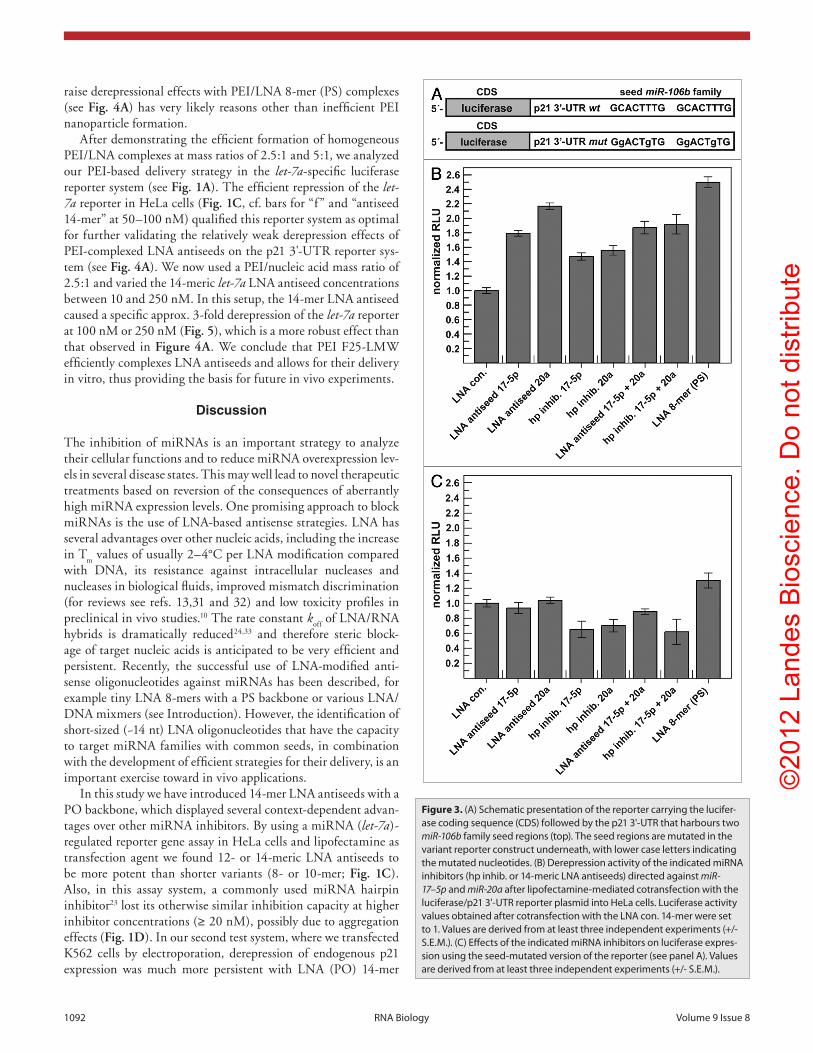
©2
01
2 L
an
de
s B
ioscie
nce
. D
o n
ot d
istr
ibu
te
1092 RNA Biology Volume 9 Issue 8
raise derepressional effects with PEI/LNA 8-mer (PS) complexes (see Fig. 4A) has very likely reasons other than inefficient PEI nanoparticle formation.
After demonstrating the efficient formation of homogeneous PEI/LNA complexes at mass ratios of 2.5:1 and 5:1, we analyzed our PEI-based delivery strategy in the let-7a-specific luciferase reporter system (see Fig. 1A). The efficient repression of the let-7a reporter in HeLa cells (Fig. 1C, cf. bars for “f” and “antiseed 14-mer” at 50–100 nM) qualified this reporter system as optimal for further validating the relatively weak derepression effects of PEI-complexed LNA antiseeds on the p21 3'-UTR reporter sys-tem (see Fig. 4A). We now used a PEI/nucleic acid mass ratio of 2.5:1 and varied the 14-meric let-7a LNA antiseed concentrations between 10 and 250 nM. In this setup, the 14-mer LNA antiseed caused a specific approx. 3-fold derepression of the let-7a reporter at 100 nM or 250 nM (Fig. 5), which is a more robust effect than that observed in Figure 4A. We conclude that PEI F25-LMW efficiently complexes LNA antiseeds and allows for their delivery in vitro, thus providing the basis for future in vivo experiments.
Discussion
The inhibition of miRNAs is an important strategy to analyze their cellular functions and to reduce miRNA overexpression lev-els in several disease states. This may well lead to novel therapeutic treatments based on reversion of the consequences of aberrantly high miRNA expression levels. One promising approach to block miRNAs is the use of LNA-based antisense strategies. LNA has several advantages over other nucleic acids, including the increase in T
m values of usually 2–4°C per LNA modification compared
with DNA, its resistance against intracellular nucleases and nucleases in biological fluids, improved mismatch discrimination (for reviews see refs. 13,31 and 32) and low toxicity profiles in preclinical in vivo studies.10 The rate constant k
off of LNA/RNA
hybrids is dramatically reduced24,33 and therefore steric block-age of target nucleic acids is anticipated to be very efficient and persistent. Recently, the successful use of LNA-modified anti-sense oligonucleotides against miRNAs has been described, for example tiny LNA 8-mers with a PS backbone or various LNA/DNA mixmers (see Introduction). However, the identification of short-sized (~14 nt) LNA oligonucleotides that have the capacity to target miRNA families with common seeds, in combination with the development of efficient strategies for their delivery, is an important exercise toward in vivo applications.
In this study we have introduced 14-mer LNA antiseeds with a PO backbone, which displayed several context-dependent advan-tages over other miRNA inhibitors. By using a miRNA (let-7a)-regulated reporter gene assay in HeLa cells and lipofectamine as transfection agent we found 12- or 14-meric LNA antiseeds to be more potent than shorter variants (8- or 10-mer; Fig. 1C). Also, in this assay system, a commonly used miRNA hairpin inhibitor23 lost its otherwise similar inhibition capacity at higher inhibitor concentrations (≥ 20 nM), possibly due to aggregation effects (Fig. 1D). In our second test system, where we transfected K562 cells by electroporation, derepression of endogenous p21 expression was much more persistent with LNA (PO) 14-mer
Figure 3. (A) schematic presentation of the reporter carrying the lucifer-ase coding sequence (cDs) followed by the p21 3'-UTR that harbours two miR-106b family seed regions (top). The seed regions are mutated in the variant reporter construct underneath, with lower case letters indicating the mutated nucleotides. (B) Derepression activity of the indicated miRNA inhibitors (hp inhib. or 14-meric LNA antiseeds) directed against miR-17–5p and miR-20a after lipofectamine-mediated cotransfection with the luciferase/p21 3'-UTR reporter plasmid into heLa cells. Luciferase activity values obtained after cotransfection with the LNA con. 14-mer were set to 1. Values are derived from at least three independent experiments (+/- s.e.M.). (c) effects of the indicated miRNA inhibitors on luciferase expres-sion using the seed-mutated version of the reporter (see panel A). Values are derived from at least three independent experiments (+/- s.e.M.).
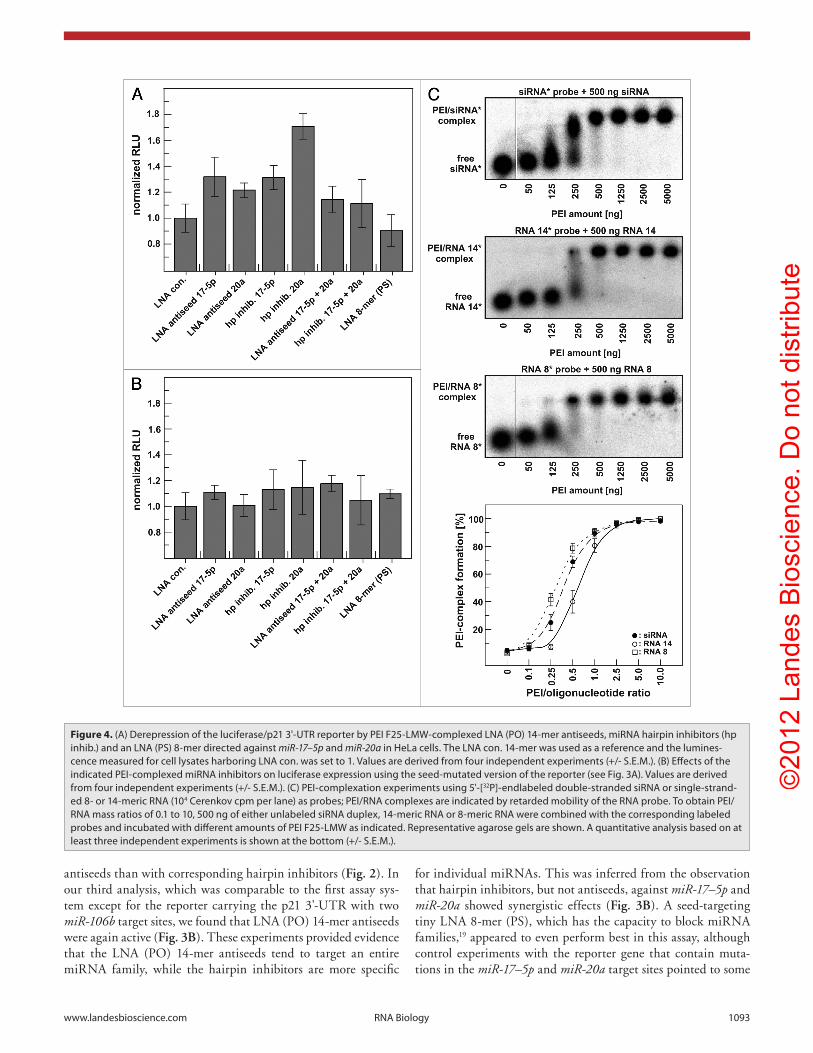
©2
01
2 L
an
de
s B
ioscie
nce
. D
o n
ot d
istr
ibu
te
www.landesbioscience.com RNA Biology 1093
for individual miRNAs. This was inferred from the observation that hairpin inhibitors, but not antiseeds, against miR-17–5p and miR-20a showed synergistic effects (Fig. 3B). A seed-targeting tiny LNA 8-mer (PS), which has the capacity to block miRNA families,19 appeared to even perform best in this assay, although control experiments with the reporter gene that contain muta-tions in the miR-17–5p and miR-20a target sites pointed to some
antiseeds than with corresponding hairpin inhibitors (Fig. 2). In our third analysis, which was comparable to the first assay sys-tem except for the reporter carrying the p21 3'-UTR with two miR-106b target sites, we found that LNA (PO) 14-mer antiseeds were again active (Fig. 3B). These experiments provided evidence that the LNA (PO) 14-mer antiseeds tend to target an entire miRNA family, while the hairpin inhibitors are more specific
Figure 4. (A) Derepression of the luciferase/p21 3'-UTR reporter by peI F25-LMW-complexed LNA (pO) 14-mer antiseeds, miRNA hairpin inhibitors (hp inhib.) and an LNA (ps) 8-mer directed against miR-17–5p and miR-20a in heLa cells. The LNA con. 14-mer was used as a reference and the lumines-cence measured for cell lysates harboring LNA con. was set to 1. Values are derived from four independent experiments (+/- s.e.M.). (B) effects of the indicated peI-complexed miRNA inhibitors on luciferase expression using the seed-mutated version of the reporter (see Fig. 3A). Values are derived from four independent experiments (+/- s.e.M.). (c) peI-complexation experiments using 5'-[32p]-endlabeled double-stranded siRNA or single-strand-ed 8- or 14-meric RNA (104 cerenkov cpm per lane) as probes; peI/RNA complexes are indicated by retarded mobility of the RNA probe. To obtain peI/RNA mass ratios of 0.1 to 10, 500 ng of either unlabeled siRNA duplex, 14-meric RNA or 8-meric RNA were combined with the corresponding labeled probes and incubated with different amounts of peI F25-LMW as indicated. Representative agarose gels are shown. A quantitative analysis based on at least three independent experiments is shown at the bottom (+/- s.e.M.).
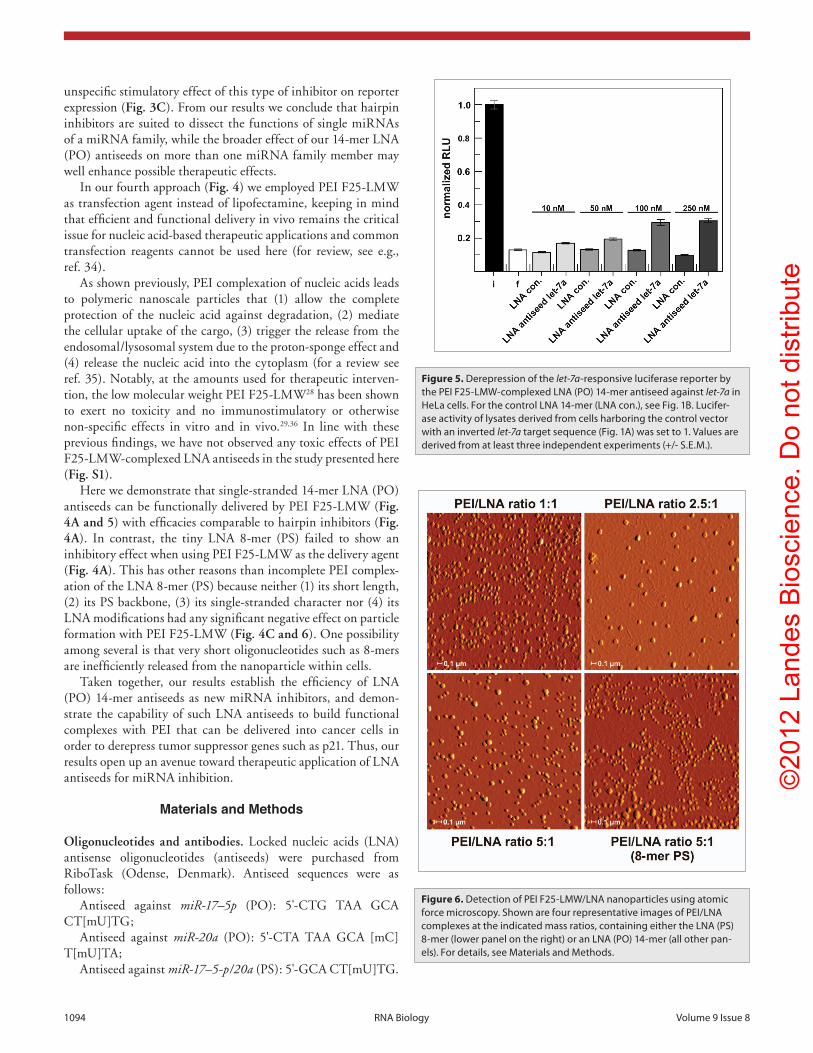
©2
01
2 L
an
de
s B
ioscie
nce
. D
o n
ot d
istr
ibu
te
1094 RNA Biology Volume 9 Issue 8
unspecific stimulatory effect of this type of inhibitor on reporter expression (Fig. 3C). From our results we conclude that hairpin inhibitors are suited to dissect the functions of single miRNAs of a miRNA family, while the broader effect of our 14-mer LNA (PO) antiseeds on more than one miRNA family member may well enhance possible therapeutic effects.
In our fourth approach (Fig. 4) we employed PEI F25-LMW as transfection agent instead of lipofectamine, keeping in mind that efficient and functional delivery in vivo remains the critical issue for nucleic acid-based therapeutic applications and common transfection reagents cannot be used here (for review, see e.g., ref. 34).
As shown previously, PEI complexation of nucleic acids leads to polymeric nanoscale particles that (1) allow the complete protection of the nucleic acid against degradation, (2) mediate the cellular uptake of the cargo, (3) trigger the release from the endosomal/lysosomal system due to the proton-sponge effect and (4) release the nucleic acid into the cytoplasm (for a review see ref. 35). Notably, at the amounts used for therapeutic interven-tion, the low molecular weight PEI F25-LMW28 has been shown to exert no toxicity and no immunostimulatory or otherwise non-specific effects in vitro and in vivo.29,36 In line with these previous findings, we have not observed any toxic effects of PEI F25-LMW-complexed LNA antiseeds in the study presented here (Fig. S1).
Here we demonstrate that single-stranded 14-mer LNA (PO) antiseeds can be functionally delivered by PEI F25-LMW (Fig. 4A and 5) with efficacies comparable to hairpin inhibitors (Fig. 4A). In contrast, the tiny LNA 8-mer (PS) failed to show an inhibitory effect when using PEI F25-LMW as the delivery agent (Fig. 4A). This has other reasons than incomplete PEI complex-ation of the LNA 8-mer (PS) because neither (1) its short length, (2) its PS backbone, (3) its single-stranded character nor (4) its LNA modifications had any significant negative effect on particle formation with PEI F25-LMW (Fig. 4C and 6). One possibility among several is that very short oligonucleotides such as 8-mers are inefficiently released from the nanoparticle within cells.
Taken together, our results establish the efficiency of LNA (PO) 14-mer antiseeds as new miRNA inhibitors, and demon-strate the capability of such LNA antiseeds to build functional complexes with PEI that can be delivered into cancer cells in order to derepress tumor suppressor genes such as p21. Thus, our results open up an avenue toward therapeutic application of LNA antiseeds for miRNA inhibition.
Materials and Methods
Oligonucleotides and antibodies. Locked nucleic acids (LNA) antisense oligonucleotides (antiseeds) were purchased from RiboTask (Odense, Denmark). Antiseed sequences were as follows:
Antiseed against miR-17–5p (PO): 5'-CTG TAA GCA CT[mU]TG;
Antiseed against miR-20a (PO): 5'-CTA TAA GCA [mC]T[mU]TA;
Antiseed against miR-17–5-p/20a (PS): 5'-GCA CT[mU]TG.
Figure 5. Derepression of the let-7a-responsive luciferase reporter by the peI F25-LMW-complexed LNA (pO) 14-mer antiseed against let-7a in heLa cells. For the control LNA 14-mer (LNA con.), see Fig. 1B. Lucifer-ase activity of lysates derived from cells harboring the control vector with an inverted let-7a target sequence (Fig. 1A) was set to 1. Values are derived from at least three independent experiments (+/- s.e.M.).
Figure 6. Detection of peI F25-LMW/LNA nanoparticles using atomic force microscopy. shown are four representative images of peI/LNA complexes at the indicated mass ratios, containing either the LNA (ps) 8-mer (lower panel on the right) or an LNA (pO) 14-mer (all other pan-els). For details, see Materials and Methods.

©2
01
2 L
an
de
s B
ioscie
nce
. D
o n
ot d
istr
ibu
te
www.landesbioscience.com RNA Biology 1095
Specificity of p21 derepression in HeLa cells. The transfection of HeLa cells was performed using LipofectamineTM 2000 (Life Technologies Invitrogen). One day prior to transfection, 4 × 10⁴ cells were seeded into 24-well plates; for co-complexation, 1 μl LipofectamineTM 2000 was combined with 10 nM LNA antiseed, LNA control or hairpin inhibitor and 0.5 μg of vector DNA (plasmid “pGL3 control” containing the p21 3'-UTR or the mutated p21 3'-UTR) in Opti-MEM® 1 medium according to the instructions of the manufacturer; the mixture was added to the cells, proceeding as described above (see Reporter assays using let-7a antimiRs in HeLa cells).
PEI complexation and delivery. Using the p21 reporter system. For complexation of miRNA inhibitors with PEI F25-LMW, cells were pre-transfected with vector DNA (“pGL3 control” plasmid containing the p21 3'-UTR or the mutated p21 3'-UTR) using LipofectamineTM 2000 as described above (see Specificity of p21 derepression in HeLa cells). After 6 h, the medium was replaced with IMDM/10% FCS, and PEI complexes were added. For PEI F25-LMW complexation, LNA antiseeds, LNA control oligo-nucleotide, tiny LNA 8-mer with PS backbone or hairpin inhibi-tors were diluted in complexation buffer (150 mM NaCl, 10 mM HEPES pH 7.4). To gain a final concentration of 10 nM, 18 ng of LNA 8-mer (PS), 28.5 ng of LNA 14-mers (control, antiseed 17–5p or antiseed 20a) and 80 ng of hairpin inhibitors 17–5p or 20a were diluted in 50 μl complexation buffer and equilibrated 5 min at room temperature. To obtain a PEI / oligonucleotide mass ratio of 5:1, 90 ng PEI was used for complexation of the LNA 8-mer (PS), 142.5 ng PEI for complexation of the LNA antiseeds and LNA 14-mer control, and 390 ng PEI was required for the hairpin inhibitor complexes. After equilibration of PEI to room temperature in complexation buffer, the oligonucleotide and the PEI solution were mixed, briefly vortexed and incubated for 30–60 min at room temperature to allow complex formation. PEI F25-LMW complexes were then added to the cells (see above), and 48 h later cells were lysed and prepared for reporter assay measurements.
Using the let-7a reporter system. Cells were pre-transfected with vector DNA (“pGL3 control” plasmid containing the let-7a forward or inverted target sequence) using LipofectamineTM 2000 as described above (see Reporter assays using let-7a anti-miRs in HeLa cells). After 6 h, the medium was replaced with IMDM/2% FCS, and PEI complexes were added. For PEI F25-LMW complexation, the let-7a LNA 14-mer and the LNA con-trol 14-mer were diluted in complexation buffer (150 mM NaCl, 10 mM HEPES pH 7.4). To gain a final oligonucleotide concen-tration of 10, 50, 100 or 250 nM, 115, 575, 1,150 or 2,875 ng of the LNA 14-mers were diluted in 50 μl complexation buffer and equilibrated to room temperature. PEI F25-LMW was used at a final PEI / oligonucleotide mass ratio of 2.5:1; therefore 288, 1,440, 2,880 or 7,200 ng of PEI was diluted in 50 μl complex-ation buffer and also equilibrated 5 min at room temperature. Complexation was initiated by mixing PEI and oligonucleotide solutions, followed by incubation at room temperature for 30 - 60 min. PEI / LNA complexes were finally added to the cells and luciferase reporter measurements were performed 48 h posttransfection.
All residues were LNA, except for isolated 2'-oxymethyl pyrim-idines marked as [mU] and [mC]. These changes are expected to reduce self-pairing without disturbing target binding.
LNA antiseeds directed against hsa-let-7a were of different lengths (14- to 8-mers):
Antiseed let7a-14-mer: 5'-AAC CTA CTA CCT CA;Antiseed let7a-12-mer: 5'-CCT ACT ACC TCA;Antiseed let7a-10-mer: 5'-TAC TAC CTC A;Antiseed let7a-8-mer: 5'-CTA CCT CA.Escherichia coli RNase P RNA 5'-CAA GCA GCC UAC CC24
was used as negative control.The sequence of the RNA 14-mer, which was used for PEI-
complexation studies, is: 5'-GUU CGG UCA AAA CUThe sequence of the RNA 8-mer, which was used for PEI-
complexation studies, is:5'-GUU CGG UCThe sequence of the VR1 siRNA, which was used for PEI-
complexation studies, is:5'-GCG AUC UUC UAU UCA ACdTdT (sense)and 5'-GUU GAA GUA GAA GAU GCG CdTdT
(antisense)30
MiRIDIAN hairpin inhibitors against hsa-let-7a, hsa-miR-17–5-p and hsa-miR-20a were purchased from Dharmacon (Thermo Scientific, Langenselbold, Germany).
Antibodies against p21 (sc-6246) and β-Actin (sc-47778) as well as the secondary antibody (sc-2005) were purchased from Santa Cruz Biotechnology (Heidelberg, Germany).
Cell culture. Cells (K562 and HeLa) were cultured under standard conditions (37°C, 5% CO
2 in a humidified atmo-
sphere) in RPMI 1640 (K562) or IMDM (HeLa), supplemented with 10% FCS (PAA, Cölbe, Germany).
Transfection procedures. Reporter assays using let-7a antimiRs in HeLa cells. HeLa cells were transfected with the LNA antiseeds, controls or the hairpin inhibitors using LipofectamineTM 2000 (Life Technologies Invitrogen, Darmstadt, Germany) according to the manufacturer’s protocol. One day before transfection, 8 × 10⁴ cells were seeded into 24-well plates and cultivated under standard conditions. Twenty-four hours after seeding, cells were cotransfected with 0.5 μg of vector DNA (plasmid “pGL3 con-trol” with a let-7a or an inverted let-7a target sequence) and with 0, 10, 20, 50 or 100 nM of the LNA antiseed, LNA control or hairpin inhibitor, respectively, according to the manufacturer’s protocol. Co-complexation was performed in Opti-MEM® 1 medium (Life Technologies Invitrogen). After 4 to 6 h, the trans-fection medium without serum was aspirated and replaced by Iscove’s modified Dulbecco’s medium (IMDM) containing 10% FCS. Forty-eight hours after transfection, cells were lysed and prepared for reporter assay measurements.
p21 derepression in K562 cells. For transfection experiments, 1 × 10⁶ K562 cells were electroporated in 4 mm cuvettes with a single pulse at 330 V for 10 ms using a BioRad GenePulser XCell (Biorad, München, Germany). Cells were transfected with 1 μg LNA antiseeds, LNA controls or hairpin inhibitors. Forty-eight hours after transfection, cells were lysed and lysates were ana-lyzed in western blot experiments.

©2
01
2 L
an
de
s B
ioscie
nce
. D
o n
ot d
istr
ibu
te
1096 RNA Biology Volume 9 Issue 8
5'-GCT CTA GAG CGC TGA GCA ACT ATA CAA CCT ACT ACC TCA GCT CTA GAG C-3'
(XbaI and BlpI sites underlined and the hsa-let-7a sense sequence in italics).
To determine the effects of LNA antiseeds that are directed against mature miR-106 family members on the expression of the p21 protein, the 3'-untranslated region (3'-UTR) of p21 was cloned into the pGL3 control luciferase reporter vector (Promega, Mannheim, Germany) via its XbaI site. The 3'-UTR was initially amplified from K562 genomic DNA with the forward primer 5'-TCT AGA CCT CAA AGG CCC GCT CTA-3' and the reverse primer 5'-TCT AGA GGA GGA GCT GTG AAA GAC ACA-3'; the amplicon was subcloned into a pCR 2.1-TOPO vec-tor (TOPO TA Cloning® kit, Invitrogen, Karlsruhe, Germany) prior to insertion into the pGL3 vector. PCR mutagenesis of the two miRNA seed target sites was done according to Brennecke et al.40 The following primers were used for mutagenesis (sites of mutation underlined):
5'-target site forward: 5'-GAA GTA AAC AGA TGG GAC TGT GAA GGG GCC TCA CC-3',
5'- target site reverse: 5'-GGT GAG GCC CCT TCA CAG TCC CAT CTG TTT ACT TC-3',
3'-target site forward: 5'-CTC CCC AGT TCA TTG GAC TGT GAT TAG CAG CGG AA-3',
3'-target site reverse: 5'-TTC CGC TGC TAA TCA CAG TCC AAT GAA CTG GGG AG-3'. Mutations were verified by DNA sequencing.
Luciferase reporter assays. Luciferase reporter assays were performed using the Promega Luciferase Assay System (Promega, Mannheim, Germany). After aspirating the media, cells were washed with PBS and lysed in 100 μl reporter lysis buffer. In a 96-well plate, 10 μl lysate were mixed with 10 μl substrate, and the luminescence was measured immediately in a Safire2 TM microplate reader (Tecan, Crailsheim, Germany). In the case of the let-7a-responsive reporter assay, the measured lumines-cence was normalized to that of lysates from cells harboring the inverted target vector (which was set to 1), yielding the normal-ized “relative light units” (RLU). In the case of the reporter with p21 3'-UTR, RLU were normalized to the luminescence of the reporter in the presence of the control LNA 14-mer (set to 1) to illustrate the relative weak derepression effects of PEI-complexed oligonucleotides.
Western blotting. Cells were lysed in lysis buffer (125 mM Tris/HCl pH 6.8, 4% SDS, 1.4 M 2-mercaptoethanol, 0.05% bromophenol blue) and heated at 95°C for 5 min. Samples were loaded onto 15% SDS-polyacrylamide gels (Mini-PROTEAN® 3 cell mini gel system, BioRad) and run for 1 h at 180 V. Proteins were transferred onto an ImmobilonTM-P PVDF membrane for 30 min at 10 V using a Trans-Blot® SD Semi-Dry Transfer Cell (BioRad), followed by blocking of the membrane with 5% milk powder dissolved in TBST [10 mM Tris/HCL (pH 7.6), 150 mM NaCl, 0,1% Tween 20]. Primary and secondary antibod-ies were diluted in TBST 1:200 (p21), 1:5000 (β-Actin) and 1:5000 (goat anti-mouse IgG-HRP, secondary antibody). After a final washing step, blots were incubated with Amersham ECLTM or ECLplusTM Western Blotting Detection Reagents according
Determination of PEI complexation efficacy. To determine the complexation efficacy of PEI F25-LMW, a radioactive assay was employed as described previously.37 For this purpose, 500 ng of single-stranded 14- or 8-meric RNA or double-stranded siRNA were used, mixed with trace amounts (104 Cerenkov cpm) of 5'-[32P]-endlabeled RNA 14-mer, RNA 8-mer or siRNA, respec-tively. Complexation was performed with the indicated amounts of PEI (see “PEI complexation and delivery” above and Fig. 4C). Samples were mixed with DNA loading buffer (10 mM Tris/HCl (pH 7.6), 80% glycerol, 0.03% bromophenol blue, 0.03% xylene cyanol blue) and analyzed by 1% agarose gel electrophoresis, run at 50 mA for 2 h (PEQLAB Biotechnologie). Complex formation was analyzed by autoradiography of the agarose gel for 3 h using a Fuji FLA-3000 R Phosphorimager (Fujifilm); the ratio of free to partially and fully complexed RNA was calculated using the software AIDA (Version 3.45).
Atomic force microscopy. PEI/LNA complexes were analyzed by atomic force microscopy (AFM). Complexes were prepared as described above with 500 ng of LNA 14-mer 17–5p (PO) or LNA 8-mer (PS) and the indicated amounts of PEI F25-LMW (see Fig. 6). Complexes were directly transferred onto a silicon chip by dipping the chip into the complex solution. AFM was performed on a vibration-damped NanoWizard (JPK instru-ments, Berlin, Germany) as described in detail elsewhere.38,39 Commercially available pyramidal Si
3N
4 tips (NSC16 AIBS,
Micromasch, Estonia) mounted to a cantilever with a length of 230 μm, a resonance frequency of about 170 kHz and a nominal force constant of about 40 N/m were used. To avoid damage of the sample surface, measurements were performed in intermitted contact. The scan speed was proportional to the scan size, and the scan frequency was between 0.5 and 1.5 Hz. Images were obtained by displaying the amplitude signal of the cantilever in the trace direction, and the height signal in the retrace direc-tion, both signals being simultaneously recorded. The complexes were visualized either in height or in amplitude mode (512 × 512 pixel).
Plasmid construction and seed mutagenesis. To introduce a hsa-let-7a site, two complementary DNA oligonucleotides encoding the let-7a target sequence (MIMAT0000062) were annealed, cleaved with XbaI, and cloned into the unique XbaI site of the reporter plasmid pGL3-Control (Promega, Mannheim, Germany); the XbaI cleavage site is located immediately down-stream of the luciferase coding sequence. Insertion of the frag-ment was identified through linearizing of recombinant plasmids via the unique BlpI site introduced with the insert (see below). Cloning of the insert resulted in two opposite orientations, which were identified by DNA sequencing. Clones giving rise to RNA transcripts with a let-7a target site were classified as “forward ori-entation”; clones with the opposite insert orientation were clas-sified as “inverted orientation” and were used as controls for the absence of a let-7a target site in the RNA transcript. The two annealed DNA oligonucleotides had the following sequences:
let-7a sense XbaI:5'-GCT CTA GAG CTG AGG TAG TAG GTT GTA TAG
TTG CTC AGC GCT CTA GAG C-3'let-7a antisense XbaI:

©2
01
2 L
an
de
s B
ioscie
nce
. D
o n
ot d
istr
ibu
te
www.landesbioscience.com RNA Biology 1097
fruitful discussions. This work was supported by grants from the German Cancer Aid (Deutsche Krebshilfe, grants 106992 and 109260 to A.G., R.K.H. and A.A.) and the Deutsche Forschungsgemeinschaft (Forschergruppe ‘Nanohale’ AI 24/6–1 to A.A.)
Supplemental Materials
Supplemental materials may be found here: www.landesbiosci-ence.com/journals/rnabiology/article/21165
to the manufacturer’s protocol. For detection of chemilumines-cence, Kodak® BioMaxTM light films, Kodak GBX Developer and Replenisher and GBX Fixer and Replenisher were used.
Disclosure of Potential Conflicts of Interest
No potential conflicts of interest were disclosed.
Acknowledgements
We are grateful to Andrea Wüstenhagen and Dominik Helmecke for technical assistance and Markus Gössringer for
References1. Garzon R, Marcucci G, Croce CM. Targeting microR-
NAs in cancer: rationale, strategies and challenges. [Review]. Nat Rev Drug Discov 2010; 9:775-89; PMID:20885409; http://dx.doi.org/10.1038/nrd3179.
2. Kasinski AL, Slack FJ. Epigenetics and genetics. MicroRNAs en route to the clinic: progress in vali-dating and targeting microRNAs for cancer therapy. Nat Rev Cancer 2011; 11:849-64; PMID:22113163; http://dx.doi.org/10.1038/nrc3166.
3. Ivanovska I, Ball AS, Diaz RL, Magnus JF, Kibukawa M, Schelter JM, et al. MicroRNAs in the miR-106b family regulate p21/CDKN1A and promote cell cycle progression. Mol Cell Biol 2008; 28:2167-74; PMID:18212054; http://dx.doi.org/10.1128/MCB.01977-07.
4. O’Donnell KA, Wentzel EA, Zeller KI, Dang CV, Mendell JT. c-Myc-regulated microRNAs modu-late E2F1 expression. Nature 2005; 435:839-43; PMID:15944709; http://dx.doi.org/10.1038/nature03677.
5. Ambs S, Prueitt RL, Yi M, Hudson RS, Howe TM, Petrocca F, et al. Genomic profiling of microRNA and messenger RNA reveals deregulated microRNA expres-sion in prostate cancer. Cancer Res 2008; 68:6162-70; PMID:18676839; http://dx.doi.org/10.1158/0008-5472.CAN-08-0144.
6. Volinia S, Calin GA, Liu CG, Ambs S, Cimmino A, Petrocca F, et al. A microRNA expression sig-nature of human solid tumors defines cancer gene targets. Proc Natl Acad Sci U S A 2006; 103:2257-61; PMID:16461460; http://dx.doi.org/10.1073/pnas.0510565103.
7. He L, Thomson JM, Hemann MT, Hernando-Monge E, Mu D, Goodson S, et al. A microRNA polycistron as a potential human oncogene. Nature 2005; 435:828-33; PMID:15944707; http://dx.doi.org/10.1038/nature03552.
8. Olive V, Bennett MJ, Walker JC, Ma C, Jiang I, Cordon-Cardo C, et al. miR-19 is a key oncogenic component of mir-17-92. Genes Dev 2009; 23:2839-49; PMID:20008935; http://dx.doi.org/10.1101/gad.1861409.
9. Small EM, Olson EN. Pervasive roles of microR-NAs in cardiovascular biology. [Review]. Nature 2011; 469:336-42; PMID:21248840; http://dx.doi.org/10.1038/nature09783.
10. Elmén J, Lindow M, Schütz S, Lawrence M, Petri A, Obad S, et al. LNA-mediated microRNA silenc-ing in non-human primates. Nature 2008; 452:896-9; PMID:18368051; http://dx.doi.org/10.1038/nature06783.
11. Rayner KJ, Esau CC, Hussain FN, McDaniel AL, Marshall SM, van Gils JM, et al. Inhibition of miR-33a/b in non-human primates raises plasma HDL and lowers VLDL triglycerides. Nature 2011; 478:404-7; PMID:22012398; http://dx.doi.org/10.1038/nature10486.
12. Krützfeldt J, Rajewsky N, Braich R, Rajeev KG, Tuschl T, Manoharan M, et al. Silencing of microRNAs in vivo with ‘antagomirs’. Nature 2005; 438:685-9; PMID:16258535; http://dx.doi.org/10.1038/nature04303.
13. Kurreck J. Antisense technologies. Improvement through novel chemical modifications. [Review]. Eur J Biochem 2003; 270:1628-44; PMID:12694176; http://dx.doi.org/10.1046/j.1432-1033.2003.03555.x.
14. Davis S, Propp S, Freier SM, Jones LE, Serra MJ, Kinberger G, et al. Potent inhibition of microRNA in vivo without degradation. Nucleic Acids Res 2009; 37:70-7; PMID:19015151; http://dx.doi.org/10.1093/nar/gkn904.
15. Corsten MF, Miranda R, Kasmieh R, Krichevsky AM, Weissleder R, Shah K. MicroRNA-21 knock-down disrupts glioma growth in vivo and displays synergistic cytotoxicity with neural precursor cell delivered S-TRAIL in human gliomas. Cancer Res 2007; 67:8994-9000; PMID:17908999; http://dx.doi.org/10.1158/0008-5472.CAN-07-1045.
16. Worm J, Stenvang J, Petri A, Frederiksen KS, Obad S, Elmén J, et al. Silencing of microRNA-155 in mice dur-ing acute inflammatory response leads to derepression of c/ebp Beta and down-regulation of G-CSF. Nucleic Acids Res 2009; 37:5784-92; PMID:19596814; http://dx.doi.org/10.1093/nar/gkp577.
17. Kocerha J, Faghihi MA, Lopez-Toledano MA, Huang J, Ramsey AJ, Caron MG, et al. MicroRNA-219 modu-lates NMDA receptor-mediated neurobehavioral dys-function. Proc Natl Acad Sci U S A 2009; 106:3507-12; PMID:19196972; http://dx.doi.org/10.1073/pnas.0805854106.
18. Patrick DM, Montgomery RL, Qi X, Obad S, Kauppinen S, Hill JA, et al. Stress-dependent car-diac remodeling occurs in the absence of microR-NA-21 in mice. J Clin Invest 2010; 120:3912-6; PMID:20978354; http://dx.doi.org/10.1172/JCI43604.
19. Obad S, dos Santos CO, Petri A, Heidenblad M, Broom O, Ruse C, et al. Silencing of microRNA families by seed-targeting tiny LNAs. Nat Genet 2011; 43:371-8; PMID:21423181; http://dx.doi.org/10.1038/ng.786.
20. Stein CA, Hansen JB, Lai J, Wu S, Voskresenskiy A, Høg A, et al. Efficient gene silencing by delivery of locked nucleic acid antisense oligonucleotides, unas-sisted by transfection reagents. Nucleic Acids Res 2010; 38:e3; PMID:19854938; http://dx.doi.org/10.1093/nar/gkp841.
21. Thomas M, Lange-Grünweller K, Weirauch U, Gutsch D, Aigner A, Grünweller A, et al. The proto-oncogene Pim-1 is a target of miR-33a. Oncogene 2012; 31:918-28; PMID:21743487; http://dx.doi.org/10.1038/onc.2011.278.
22. Ibrahim AF, Weirauch U, Thomas M, Grünweller A, Hartmann RK, Aigner A. MicroRNA replace-ment therapy for miR-145 and miR-33a is effica-cious in a model of colon carcinoma. Cancer Res 2011; 71:5214-24; PMID:21690566; http://dx.doi.org/10.1158/0008-5472.CAN-10-4645.
23. Vermeulen A, Robertson B, Dalby AB, Marshall WS, Karpilow J, Leake D, et al. Double-stranded regions are essential design components of potent inhibitors of RISC function. RNA 2007; 13:723-30; PMID:17400817; http://dx.doi.org/10.1261/rna.448107.
24. Gruegelsiepe H, Brandt O, Hartmann RK. Antisense inhibition of RNase P: mechanistic aspects and appli-cation to live bacteria. J Biol Chem 2006; 281:30613-20; PMID:16901906; http://dx.doi.org/10.1074/jbc.M603346200.
25. Venturini L, Battmer K, Castoldi M, Schultheis B, Hochhaus A, Muckenthaler MU, et al. Expression of the miR-17-92 polycistron in chronic myeloid leuke-mia (CML) CD34+ cells. Blood 2007; 109:4399-405; PMID:17284533; http://dx.doi.org/10.1182/blood-2006-09-045104.
26. Soifer HS, Koch T, Lai J, Hansen B, Hoeg A, Oerum H, et al. Silencing of gene expression by gymnotic delivery of antisense oligonucleotides. Methods Mol Biol 2012; 815:333-46; PMID:22131003; http://dx.doi.org/10.1007/978-1-61779-424-7_25.
27. Urban-Klein B, Werth S, Abuharbeid S, Czubayko F, Aigner A. RNAi-mediated gene-targeting through systemic application of polyethylenimine (PEI)-complexed siRNA in vivo. Gene Ther 2005; 12:461-6; PMID:15616603; http://dx.doi.org/10.1038/sj.gt.3302425.
28. Werth S, Urban-Klein B, Dai L, Höbel S, Grzelinski M, Bakowsky U, et al. A low molecular weight fraction of polyethylenimine (PEI) displays increased transfec-tion efficiency of DNA and siRNA in fresh or lyophi-lized complexes. J Control Release 2006; 112:257-70; PMID:16574264; http://dx.doi.org/10.1016/j.jcon-rel.2006.02.009.
29. Höbel S, Koburger I, John M, Czubayko F, Hadwiger P, Vornlocher HP, et al. Polyethylenimine/small inter-fering RNA-mediated knockdown of vascular endo-thelial growth factor in vivo exerts anti-tumor effects synergistically with Bevacizumab. J Gene Med 2010; 12:287-300; PMID:20052738.
30. Grünweller A, Wyszko E, Bieber B, Jahnel R, Erdmann VA, Kurreck J. Comparison of different antisense strategies in mammalian cells using locked nucleic acids, 2'-O-methyl RNA, phosphorothioates and small interfering RNA. Nucleic Acids Res 2003; 31:3185-93; PMID:12799446; http://dx.doi.org/10.1093/nar/gkg409.
31. Grünweller A, Hartmann RK. Locked nucleic acid oligonucleotides: the next generation of antisense agents? [Review]. BioDrugs 2007; 21:235-43; PMID:17628121.
32. Veedu RN, Wengel J. Locked nucleic acid as a novel class of therapeutic agents. [Review]. RNA Biol 2009; 6:321-3; PMID:19458498; http://dx.doi.org/10.4161/rna.6.3.8807.
33. Christensen U, Jacobsen N, Rajwanshi VK, Wengel J, Koch T. Stopped-flow kinetics of locked nucleic acid (LNA)-oligonucleotide duplex formation: studies of LNA-DNA and DNA-DNA interactions. Biochem J 2001; 354:481-4; PMID:11237851; http://dx.doi.org/10.1042/0264-6021:3540481.

©2
01
2 L
an
de
s B
ioscie
nce
. D
o n
ot d
istr
ibu
te
1098 RNA Biology Volume 9 Issue 8
39. Oberle V, Bakowsky U, Zuhorn IS, Hoekstra D. Lipoplex formation under equilibrium condi-tions reveals a three-step mechanism. Biophys J 2000; 79:1447-54; PMID:10969006; http://dx.doi.org/10.1016/S0006-3495(00)76396-X.
40. Brennecke J, Stark A, Russell RB, Cohen SM. Principles of microRNA-target recognition. PLoS Biol 2005; 3:e85; PMID:15723116; http://dx.doi.org/10.1371/journal.pbio.0030085.
37. Malek A, Czubayko F, Aigner A. PEG grafting of polyethylenimine (PEI) exerts different effects on DNA transfection and siRNA-induced gene targeting effica-cy. J Drug Target 2008; 16:124-39; PMID:18274933; http://dx.doi.org/10.1080/10611860701849058.
38. Sitterberg J, Ozcetin A, Ehrhardt C, Bakowsky U. Utilising atomic force microscopy for the characterisa-tion of nanoscale drug delivery systems. Eur J Pharm Biopharm 2010; 74:2-13; PMID:19755155; http://dx.doi.org/10.1016/j.ejpb.2009.09.005.
34. Aigner A. Cellular delivery in vivo of siRNA-based therapeutics. [Review]. Curr Pharm Des 2008; 14:3603-19; PMID:19075737; http://dx.doi.org/10.2174/138161208786898815.
35. Aigner A. Nonviral in vivo delivery of therapeutic small interfering RNAs. [Review]. Curr Opin Mol Ther 2007; 9:345-52; PMID:17694447.
36. Beyerle A, Höbel S, Czubayko F, Schulz H, Kissel T, Aigner A, et al. In vitro cytotoxic and immuno-modulatory profiling of low molecular weight poly-ethylenimines for pulmonary application. Toxicol In Vitro 2009; 23:500-8; PMID:19444927; http://dx.doi.org/10.1016/j.tiv.2009.01.001.

Supplemental Material to: Maren Thomas, Kerstin Lange-Grünweller, Eyas Dayyoub, Udo Bakowsky, Ulrike Weirauch, Achim Aigner, et al. PEI-complexed LNA antiseeds as miRNA inhibitors. RNA Biology 2012; 8(9); DOI: 10.4161/rna.21165; http://www.landesbioscience.com/journals/rnabiology/article/21165/

Supplementary Material Toxicity studies using the WST-1 assay
WST-1 assays were performed to analyze for toxicity of the PEI/LNA
complexes (Roche, Mannheim, Germany). HeLa cells (0.5 x 10⁴) were seeded into a
96-well plate and cultivated under standard conditions. 24 h after seeding, PEI F25-
LMW complexes (PEI/nucleic acid mass ratio of 5:1 at the indicated nucleic acid
concentrations, see Fig. S1) were added to the cells. 48 h after cultivating in medium
containing 2 % FCS, WST-1 assays were performed as described by manufacturer.
Absorbance was measured in a Tecan Safire2 plate reader at a fixed wavelength of
450 nm and at 600 nm as background control. Measurements were done at 0.5, 1, 2
and 4 h to determine cell viability.
Supplementary Figure Figure Legend Figure S1: WST-1 cell viability assay of HeLa cells transfected with the 14-mer LNA
antiseed 17-5p, the hairpin inhibitor 20a and the 8-mer LNA (PS). Oligonucleotides
were complexed with PEI F25-LMW at the indicated concentrations using a
PEI/oligonucleotide mass ratio of 5:1. After 48 h, WST-1 activity was measured at
450 nm with an incubation period of 2 h. Untransfected HeLa cells grown in 2% FCS
were used as a control and their activity was set to 1 for normalization. Values are
derived from three independent experiments (+/- S.E.M.).

Fig. S1
1.0
1.2
1.4
0.8
0.6
0.4
0.2norm
alized
abso
rbanc
e [450
nm]
HeLa cellsLNA antiseed17-5p hp inhib.20a LNA8-mer (PS)
:1 nM antimiR:10 nM antimiR :100 nM antimiR:50 nM antimiR :250 nM antimiR

Appendix
161
D. Publication IV
Pim-1 Dependent Transcriptional Regulation of the Human miR-17-92 Cluster.
Manuscript in preparation
Author contributions:
Research design: 35 %
Experimental work: 60 %
Data analysis and evaluation: 65 %
Manuscript writing: 50 %

Transcriptional regulation of human miR-17-92
1
Pim-1 Dependent Transcriptional Regulation of the Human miR-17-92 Cluster*
Maren Thomas1,+
, Kerstin Lange-Grünweller1,+
, Dorothee Hartmann1, Lara Golde
1, Julia Schlereth
1,
Achim Aigner2, Arnold Grünweller
1,# and Roland K. Hartmann
1,#
1Institut für Pharmazeutische Chemie, Philipps-Universität Marburg; Marburg, Germany
2Medizinische Fakultät, Rudolf-Boehm-Institut für Pharmakologie und Toxikologie, Universität
Leipzig; Leipzig, Germany +The authors contribute equally to this work.
*Running title: Transcriptional regulation of human miR-17-92
#To whom correspondence should be addressed: Roland K. Hartmann and Arnold Grünweller,
Philipps-Universität Marburg, Institut für Pharmazeutische Chemie, Marbacher Weg 6, 35037
Marburg, Tel.: +49-6421-28-25553; Fax: +49-6421-28-25854; E-mail: [email protected]
marburg.de and [email protected]
Keywords: miRNA, miR-17-92 cluster, Pim-1, miRNA promoter, c-Myc, HP1, RNAi
Background: Expression of the human miR-
17-92 cluster is driven from a host gene
promoter located within a CpG island and from
an intronic A/T-rich region located directly
upstream of the first miRNA 17-5p.
Results: Substantial transcriptional activity
from the A/T-rich region relies on c-Myc
binding to a functional E-box element (E3 site)
and involves a synergism between c-Myc and
the protooncogene Pim-1.
Conclusion: Pim-1 is part of the
transcriptional network that regulates
expression of the human miR-17-92 cluster.
Significance: Little is known about promoters
of oncogenic miRNAs or miRNA clusters.
Understanding the regulation of oncogenic
miRNA expression opens up new perspectives
for the prevention of cancer.
SUMMARY
The human polycistronic miRNA cluster
miR-17-92 is frequently overexpressed in
hematopoietic malignancies and cancers. Its
transcription is in part controlled by an
E2F-regulated host gene promoter. An
intronic A/T-rich region directly upstream
of the miRNA coding region also contributes
to cluster expression. Deletion analysis of
the A/T-rich region revealed a strong
dependence on c-Myc binding to the
functional E3 site. Yet, constructs lacking
the 5’-proximal ~1.3 kb or 3’-distal ~0.1 kb
of the 1.5 kb A/T-rich region still retained
residual specific promoter activity,
suggesting multiple transcription start sites
(TSS) in this region. Furthermore, the
protooncogenic kinase Pim-1, its
phosphorylation target HP1 and c-Myc
colocalize to the E3 region, as inferred from
chromatin immunoprecipitation. Analysis of
pri-mir-17-92 expression levels in K562 and
HeLa cells revealed that silencing of E2F3,
c-Myc or Pim-1 negatively affects cluster
expression, with a synergistic effect caused
by c-Myc/Pim-1 double knockdowns in
HeLa cells. Thus, we show for the first time,
that Pim-1 is part of the transcriptional
network that regulates the human miR-17-
92 cluster.
MicroRNAs (miRNAs) are important post-
transcriptional riboregulators of gene
expression with high relevance to cancer
formation and metastasis (1). In general,
miRNAs are derived from RNA polymerase II
(RNAPII) primary transcripts (pri-miRNA)
that are further processed to ~70 nt precursors
(pre-miRNA) and after nuclear export to
mature miRNAs by the activity of the two
endonucleases DROSHA/DGCR8 and DICER
(2-5). MiRNAs are incorporated into the
miRNA-induced silencing complex (miRISC)
and act as repressors of translation by
imperfect base-pairing to their target sites in
mRNAs (3). The majority of miRNAs is
encoded in intronic regions, either individually
or as “polycistronic” miRNA clusters that are
cotranscribed (3,6).
Several deregulated miRNAs or miRNA
clusters are involved in tumorigenesis,

Transcriptional regulation of human miR-17-92
2
accounting for their designation as oncogenic
miRNAs (7). Such miRNAs can downregulate
targets involved in the regulation of apoptosis
or cell cycle progression (1). One well-
characterized polycistronic cluster is the miR-
17-92 cluster, also known as OncomiR-1 or
C13orf25. This cluster encodes six miRNAs
belonging to four different seed families: (i)
the miR-17 family with miR-17 and miR-20a,
(ii) the miR-18 family with miR-18a, (iii) the
miR-19 family with miR-19a and miR-19b-1,
and (iv) the miR-92 family (8-11). The human
miR-17-92 cluster is encoded in the
chromosomal region 13q31.3 and is amplified
in several solid tumors as well as in some
hematopoietic malignancies (8,12). Because of
numerous known targets of its individual
miRNAs, the miR-17-92 locus exerts
pleiotropic functions during development,
proliferation, apoptosis and angiogenesis in
different cell systems (13-15). In mice,
deletion of the cluster prevents normal B-cell
development as a consequence of premature
cell death (14). In a mouse B-cell lymphoma
model, simultaneous overexpression of c-Myc
and the miR-17-92 cluster accelerated
lymphomagenesis (9). This oncogenic effect
could later be assigned primarily to miR-19a/b
which dampens expression of the tumor
suppressor PTEN, thereby repressing apoptosis
(13,15).
Analyses of transcriptional regulation of
oncogenic miRNAs and miRNA clusters are of
great importance for strategies aiming at
cancer prevention. Unfortunately, most
miRNA promoters have not been characterized
or identified yet (16). In case of the miR-17-92
cluster, expression is thought to be promoted
from a host gene promoter region upstream of
exon 1, with transcription starting at a
consensus initiator sequence downstream of a
non-consensus TATA box (17,18).
Additionally, this core promoter region
contains functional E2F transcription factor
binding sites. E2F1-3 were shown to activate
C13orf25 expression from this promoter and
chromatin immunoprecipitation assays (ChIP)
identified E2F3 to be the main E2F variant
associated with the host gene promoter (17,
18). No E2F binding was detected in the region
between the host gene promoter and the miR-
17-92 cluster (18). Furthermore, nucleosome
mapping combined with chromatin signatures
for transcriptionally active promoters (19-21)
indicated that transcriptional activity of the
miR-17-92 cluster also originates from the
intronic A/T-rich region directly upstream of
the miRNA coding sequences (16). This is in
line with the finding that cluster expression is
activated by c-Myc binding to a conserved E-
box element (E3) ~1.5 kb upstream of the
miRNA coding sequence (9,10,20). Indeed,
luciferase reporter assays confirmed that both,
the host gene promoter and the intronic region,
confer transcriptional activity (16,21).
Here, we subjected the intronic A/T-rich
region to deletion analysis using luciferase
reporter constructs. Transcription was found to
strongly depend on c-Myc, but even shorter
fragments (< 0.3 kb) of sequences directly
preceding the miR-17-92 coding sequence still
promoted residual, but substantial and specific
transcriptional activity. Furthermore, we
identified the protooncogene Pim-1 and one of
its phosphorylation targets HP1 (22) to be
associated with the chromatin region
containing the E3 site, suggesting that the
human C13orf25 locus belongs to the set of
genes that are synergistically regulated by c-
Myc and Pim-1 (23,24). SiRNA-mediated
Pim-1 knockdown indeed resulted in reduced
pri-mir-17-92 levels, as did a knockdown of c-
Myc or E2F3. In Hela cells, a double
knockdown of c-Myc/Pim-1 decreased the pri-
mir-17-92 levels more than single
knockdowns, providing further evidence for a
synergism of c-Myc and Pim-1 at the intronic
C13orf25 promoter.
EXPERIMENTAL PROCEDURE
Oligonucleotides - Small interfering RNAs
(siRNAs) were purchased from Dharmacon
(Boulder, USA):
VR1 siRNA (25) was used as an unrelated
negative control, with the following sequences
of sense and antisense strand:.
VR1 siRNA sense 5'-GCG CAU CUU CUA
CUU CAA CdTdT and antisense 5'-GUU
GAA GUA GAA GAU GCG CdTdT.
The sequences of all other siRNAs used in this
study are:
Pim-1 siRNA sense 5'-GAU AUG GUG UGU
GGA GAU AdTdT and antisense 5'-UAU
CUC CAC ACA CCA UAU CdTdT; Pim-1
siRNA 2 sense 5'-GGA ACA ACA UUU
ACA ACU CdTdT and antisense 5'-GAG
UUG UAA AUG UUG UUC CdTdT; c-Myc
siRNA sense 5'-CAG GAA CUA UGA CCU
CGA CUA dTdT and antisense 5'-UAG UCG
AGG UCA UAG UUC CUG dTdT; E2F3
siRNA sense 5'- ACA GCA AUC UUC CUU

Transcriptional regulation of human miR-17-92
3
AAU AdTdT and antisense 5'- UAU UAA
GGA AGA UUG CUG UdTdT.
Antibodies - Antibodies against c-Myc (sc-
40) and Pim-1 (sc-13513) as well as the
secondary antibody (sc-2005: goat anti-mouse
IgG HRP conjugated) were purchased from
Santa Cruz Biotechnology (Heidelberg,
Germany) except for the Phospho HP1
(Ser83) antibody (2600S), which was obtained
from Cell Signaling Technology (Danvers,
MA, USA).
Plasmid construction and seed mutagenesis
For the construction of promoter-luciferase
fusions, the SV40 promoter of plasmid “pGL3
control” (Promega, Mannheim, Germany) was
removed via digestion with BglII and HindIII
(Thermo Fisher Scientific, Schwerte,
Germany) and replaced with fragments derived
from the intronic A/T-rich region of C13orf25
(reference nucleotide sequence NG_032702.1).
Promoter fragments were amplified from
genomic DNA of the human cell line K562
using primers specified in Supplementary
Material. PCR products were purified using the
Wizard® SV Gel and PCR Clean-Up System
(Promega, Mannheim, Germany) and digested
with BglII and HindIII for insertion into pGL3.
All constructs were cloned in E. coli DH5
cells and verified via DNA sequencing. The
pGL3 vector lacking the SV40 promoter as
well as the pGL3 construct carrying the
C13orf25-derived 339 bp fragment in inverse
orientation (pGL3 339 bp inv) were used as
negative controls.
Transfection procedures and Luciferase
reporter assays - Assays are described in detail
in Supplementary Material.
Chromatin immunoprecipitation -
Chromatin immunoprecipitation (ChIP) was
performed according to a protocol from the Or
Gozani lab at Stanford University
(http://www.stanford.edu/group/gozani), with
some modifications. For details, see
Supplementary Material.
RESULTS
C-Myc-dependent intronic transcriptional
activity within the human miR-17-92 locus –
The 3.4 kb upstream genomic region of the
miR-17-92 coding sequence can be subdivided
into a G/C-rich and an A/T-rich part. The
former is a CpG island (~1.9 kb, 78 % GC
content; see http://genome.ucsc.edu,
GRCh37/hg19 assembly) that has its 5’-
boundary ~0.4 kb upstream of the TSS of the
host gene promoter (20) and its 3’-boundary
~1.4 kb upstream of the miR-17-5p coding
sequence, representing the 5’-terminal miRNA
of the cluster. The A/T-rich region (~64 % A/T
content) following the CpG island begins
immediately downstream of a functional and
highly conserved c-Myc binding site (5’-
CATGTG, E-box E3) which is localized ~1.5
kb upstream of the miR-17-5p coding sequence
(10) (Fig. 1A, S1).
We have analyzed the intronic region of
C13orf25, including the preceding functional
c-Myc box E3 (20) and truncated segments of
the A/T-rich region (Fig. 1B), for independent
transcriptional activity and c-Myc dependence.
For this purpose, luciferase reporter constructs
were transfected into K562 and HeLa cells. We
selected these two cell lines because they
express the miR-17-92 cluster at very high
(K562) and high (HeLa) levels (26, Fig. S2).
The ~1.5 kb reporter construct, comprising
c-Myc box E3 (Fig. 1A, S1) and the A/T-rich
region except for the 113 bp preceding the
mature miR-17-5p coding sequence, showed
substantial transcriptional activity, amounting
to 30-35 % in both cell lines relative to the
pGL3 control plasmid harboring an SV40
promoter (Fig. 1C). This is in line with results
of a similar study of the mouse miR-17-92
locus (21). Furthermore, Ozsolak et al. (16)
predicted an intronic TSS to be localized ~0.2
kb downstream of the E3 site. Indeed,
truncating the 1.5 kb fragment to 625 bp,
which deletes the E3 site, strongly reduced
reporter activity, ~4.5-fold in K562 and almost
20-fold in HeLa cells compared to the activity
of the ~1.5 kb construct (Fig. 1C). To
substantiate this finding, we tested the ~1.5 kb
construct in K562 cells under conditions of an
siRNA-mediated knockdown of c-Myc. This
reduced reporter expression to a similar extent
as the truncation to 625 bp, supporting the
notion that c-Myc binding to the E3 site plays
a key role in activating transcription from this
intronic region (Fig. 1C). As the 625 bp
fragment still conferred basal promoter
activity, we further shortened this region to
~340 bp, ~280 bp and ~200 bp. Additionally,
we included short fragments with their 3’-
boundary ~290 bp upstream of the mature
miR-17-5p coding sequence (250, 190 and 108
bp in Fig. 1B). We also inversed the
orientation of the ~340 bp fragment in front of
the luciferase gene (Fig. 1C, 339 bp inv) to
include a control fragment with comparable
A/T content. This inversed fragment conferred
reporter activity 5.3-fold (K562) or 2.4-fold

Transcriptional regulation of human miR-17-92
4
(HeLa) higher than that of the pGL3 control
vector lacking the SV40 promoter (SV40,
Fig. 1C).
All the fragments ≤ 340 bp conferred
residual promoter activity, some clearly to a
higher extent than the inverted 339 bp
fragment in both cell lines (see the 279 and
197 bp fragments, Fig. 1 C). This indicates
that parts of the intronic A/T-rich region
promote specific transcriptional activity, the
extent partly differing between the two cell
lines (Fig. 1 C). Unfortunately, we were unable
to identify any convincing correlation between
fragment activity and promoter elements
predicted in this region using a variety of web-
based promoter prediction tools (see Suppl.
Material). In K562 cells, the smaller
fragments, including the 625 bp fragment,
showed an overall trend towards stronger
expression relative to HeLa cells.
Pim-1 and HP1 are associated with the
intronic c-Myc binding site - We next asked if
other factors beyond c-Myc may be involved
in human miR-17-92 cluster expression from
the A/T-rich region. Transcriptional regulation
by c-Myc is associated with Pim-1-dependent
H3S10 phosphorylation in about 20 % of all
genes regulated by c-Myc (24). Moreover,
Pim-1 and c-Myc act synergistically in severe
forms of B-cell lymphomas, and Pim-1 as well
as the miR-17-92 cluster are overexpressed in
the myeloid leukemia suspension cell line
K562 (27). We performed ChIP assays to test
whether c-Myc and Pim-1 localize to the
internal promoter region of the miR-17-92
cluster. For this analysis, we amplified a ~90
bp DNA fragment (segment A1 in Fig. 2A) 0.1
kb downstream of the functional c-Myc E3
site. The same DNA segment was analyzed in
a previous study (10). Our ChIP analysis
revealed that not only c-Myc, as expected, but
also Pim-1 localizes to this genomic region
(Fig. 2B, upper and middle panels). Indeed,
this is consistent with the finding that Pim-1-
catalyzed H3S10 phosphorylation is required
for c-Myc-dependent transcriptional activation
(24). We further analyzed another known
phosphorylation target of Pim-1, the
heterochromatin protein-1 gamma (HP1) (22),
for its association with the E3 region. HP1
localized to this genomic area as well (Fig. 2B,
lower panel). Moreover, we were able to
identify an association of HP1 along the
miRNA coding region which is indicative of
active transcription (see Fig. S3 and
Discussion section).
Transcriptional activity of the human miR-
17-92 cluster depends on c-Myc and Pim-1 -
To further substantiate the role of Pim-1 in
miR-17-92 cluster expression we quantified
the cellular pri-mir-17-92 levels by qRT-PCR
after siRNA-mediated Pim-1 knockdown
relative to a c-Myc knockdown in K562 and
HeLa cells. Since combined ChIP and reporter
gene assays suggested that transcription factor
E2F3 is a major activator of transcription
initiated at the host gene promoter (17,18), we
included E2F3 in our knockdown experiments
as a possible measure for the contribution of
the host gene promoter to miR-17-92
expression. We also quantified the levels of c-
Myc, E2F3 and Pim-1 mRNAs after
knockdown by qRT-PCR to evaluate
knockdown efficiencies (Table S1). For Pim-1,
we have shown good correlation between
mRNA and protein levels (27). In the study
presented here, only experiments with a
knockdown efficiency > 50 % were considered
(Table S1). Single knockdowns of either c-
Myc, E2F3 or Pim-1 decreased the pri-mir-17-
92 levels in HeLa cells to ~35, 60 and 60 %,
respectively, relative to the control siRNA
(Fig. 3B), and to ~30, 30 and 45 %,
respectively, in K562 cells (Fig. 3C). Double
knockdowns had additive suppression effects
on pri-mir-17-92 levels in the case of c-
Myc/E2F3 (HeLa and K562), c-Myc/Pim-1
(Hela) and E2F3/Pim-1 (HeLa).
DISCUSSION
Transcription of the oncogenic miR-17-92
cluster is thought to originate from two
different TSSs: one is localized in close
proximity to the host gene promoter element
(17) (Fig. S1), and the other TSS was predicted
to map to the region ~200 bp downstream of
the functional c-Myc site E3 (Fig. 1A, S1). The
latter prediction was based on nucleosome
mapping and chromatin signatures for active
promoters. The derived algorithm identified
175 human promoters proximal to miRNA
coding sequences, and was reported to
correctly predict transcription initiation regions
to a resolution of 150 bp with high sensitivity
and specificity. The majority of predictions
were also consistent with known “expressed
sequence tag” (EST) TSSs or cDNA 5’-ends
(16).
Here, we investigated the intronic A/T-rich
region preceding the human miR-17-92 cluster
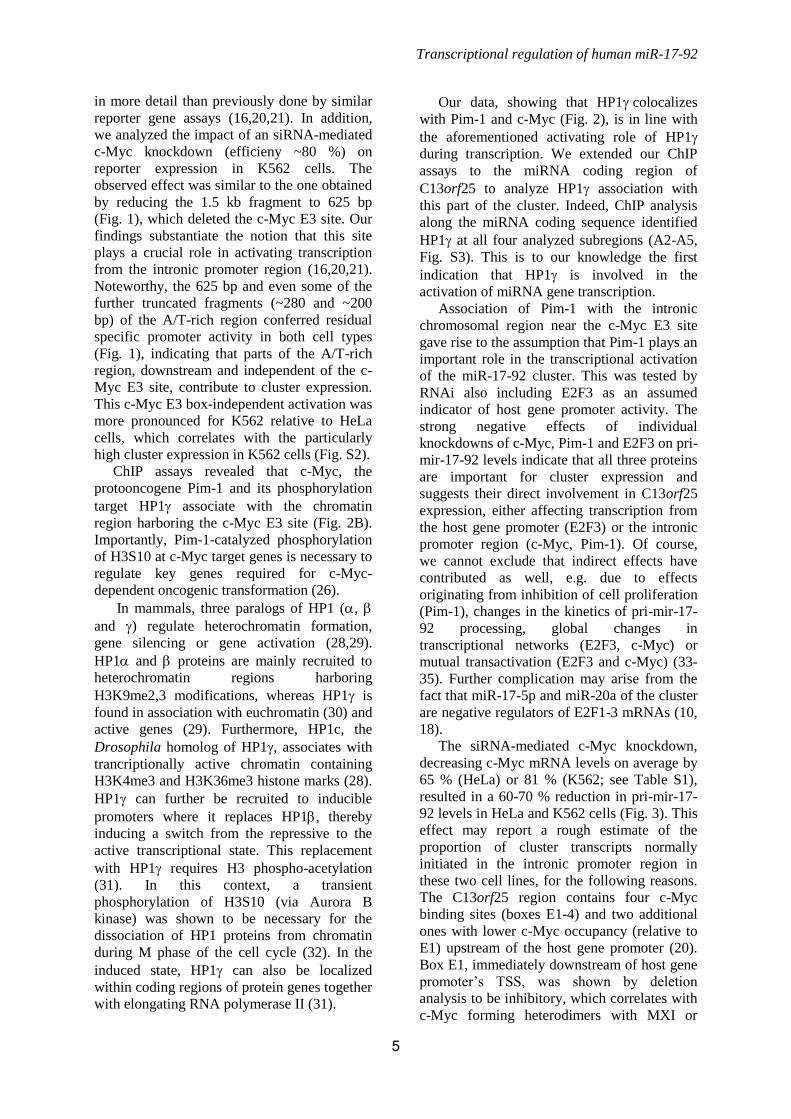
Transcriptional regulation of human miR-17-92
5
in more detail than previously done by similar
reporter gene assays (16,20,21). In addition,
we analyzed the impact of an siRNA-mediated
c-Myc knockdown (efficieny ~80 %) on
reporter expression in K562 cells. The
observed effect was similar to the one obtained
by reducing the 1.5 kb fragment to 625 bp
(Fig. 1), which deleted the c-Myc E3 site. Our
findings substantiate the notion that this site
plays a crucial role in activating transcription
from the intronic promoter region (16,20,21).
Noteworthy, the 625 bp and even some of the
further truncated fragments (~280 and ~200
bp) of the A/T-rich region conferred residual
specific promoter activity in both cell types
(Fig. 1), indicating that parts of the A/T-rich
region, downstream and independent of the c-
Myc E3 site, contribute to cluster expression.
This c-Myc E3 box-independent activation was
more pronounced for K562 relative to HeLa
cells, which correlates with the particularly
high cluster expression in K562 cells (Fig. S2).
ChIP assays revealed that c-Myc, the
protooncogene Pim-1 and its phosphorylation
target HP1 associate with the chromatin
region harboring the c-Myc E3 site (Fig. 2B).
Importantly, Pim-1-catalyzed phosphorylation
of H3S10 at c-Myc target genes is necessary to
regulate key genes required for c-Myc-
dependent oncogenic transformation (26).
In mammals, three paralogs of HP1 (,
and ) regulate heterochromatin formation,
gene silencing or gene activation (28,29).
HP1 and proteins are mainly recruited to
heterochromatin regions harboring
H3K9me2,3 modifications, whereas HP1 is
found in association with euchromatin (30) and
active genes (29). Furthermore, HP1c, the
Drosophila homolog of HP1, associates with
trancriptionally active chromatin containing
H3K4me3 and H3K36me3 histone marks (28).
HP1 can further be recruited to inducible
promoters where it replaces HP1, thereby
inducing a switch from the repressive to the
active transcriptional state. This replacement
with HP1 requires H3 phospho-acetylation
(31). In this context, a transient
phosphorylation of H3S10 (via Aurora B
kinase) was shown to be necessary for the
dissociation of HP1 proteins from chromatin
during M phase of the cell cycle (32). In the
induced state, HP1 can also be localized
within coding regions of protein genes together
with elongating RNA polymerase II (31).
Our data, showing that HP1colocalizes
with Pim-1 and c-Myc (Fig. 2), is in line with
the aforementioned activating role of HP1
during transcription. We extended our ChIP
assays to the miRNA coding region of
C13orf25 to analyze HP1 association with
this part of the cluster. Indeed, ChIP analysis
along the miRNA coding sequence identified
HP1 at all four analyzed subregions (A2-A5,
Fig. S3). This is to our knowledge the first
indication that HP1 is involved in the
activation of miRNA gene transcription.
Association of Pim-1 with the intronic
chromosomal region near the c-Myc E3 site
gave rise to the assumption that Pim-1 plays an
important role in the transcriptional activation
of the miR-17-92 cluster. This was tested by
RNAi also including E2F3 as an assumed
indicator of host gene promoter activity. The
strong negative effects of individual
knockdowns of c-Myc, Pim-1 and E2F3 on pri-
mir-17-92 levels indicate that all three proteins
are important for cluster expression and
suggests their direct involvement in C13orf25
expression, either affecting transcription from
the host gene promoter (E2F3) or the intronic
promoter region (c-Myc, Pim-1). Of course,
we cannot exclude that indirect effects have
contributed as well, e.g. due to effects
originating from inhibition of cell proliferation
(Pim-1), changes in the kinetics of pri-mir-17-
92 processing, global changes in
transcriptional networks (E2F3, c-Myc) or
mutual transactivation (E2F3 and c-Myc) (33-
35). Further complication may arise from the
fact that miR-17-5p and miR-20a of the cluster
are negative regulators of E2F1-3 mRNAs (10,
18).
The siRNA-mediated c-Myc knockdown,
decreasing c-Myc mRNA levels on average by
65 % (HeLa) or 81 % (K562; see Table S1),
resulted in a 60-70 % reduction in pri-mir-17-
92 levels in HeLa and K562 cells (Fig. 3). This
effect may report a rough estimate of the
proportion of cluster transcripts normally
initiated in the intronic promoter region in
these two cell lines, for the following reasons.
The C13orf25 region contains four c-Myc
binding sites (boxes E1-4) and two additional
ones with lower c-Myc occupancy (relative to
E1) upstream of the host gene promoter (20).
Box E1, immediately downstream of host gene
promoter’s TSS, was shown by deletion
analysis to be inhibitory, which correlates with
c-Myc forming heterodimers with MXI or

Transcriptional regulation of human miR-17-92
6
MNT at this site to repress transcription (20).
Thus, host gene promoter activity may even
somewhat increase under conditions of a c-
Myc knockdown, although such an effect
could in turn be neutralized by reduced c-Myc-
mediated transactivation of E2F (35). ChIP-
Seq data for K562 and HeLa-S3 cells revealed
the by far highest c-Myc occupancy at site E3
(little at E2 and E4), where c-Myc forms
heterodimers with MAX to activate
transcription (20). A straightforward
interpretation of the additive effect of a c-
Myc/E2F3 double knockdown in Hela and
K562 cells is that this combination negatively
affected transcription from the host gene and
intronic promoter regions.
A major finding of our study is the
involvement of the oncogenic kinase Pim-1 in
miR-17-92 expression, as inferred from its
recruitment to the intronic c-Myc E3 site (Fig.
2) and the strong negative effect of a Pim-1
knockdown on cluster expression (Fig. 3B and
C). Moreover, double knockdown experiments
in HeLa cells revealed a synergistic effect
relative to individual c-Myc and Pim-1
knockdowns (Fig. 3B). This was not seen for
K562 cells, attributable to the extremely high
expression of Pim-1 in this cell line (27) which
makes it more difficult to deplete Pim-1 in
K562 cells below a crititcal threshold.
Furthermore, the siRNA-mediated reduction of
c-Myc and Pim-1 mRNAs were on average 86
% and 77 % in HeLa and 86 % and 52 %,
respectively, in K562 cells (Table S1). The
somewhat weaker suppression of Pim-1 in the
c-Myc/Pim-1 double knockdown context (cf.
with single knockdowns, Table S1) in K562
versus HeLa cells may have contributed to the
absence of a clear additive effect upon c-
Myc/Pim-1 double knockdown in K562 cells.
In conclusion, we report here that miR-17-
92 cluster expression from the intronic A/T-
rich promoter region, although critically
depending on c-Myc binding, includes a c-
Myc-independent specific contribution of
sequences within 0.7 kb upstream of the
mature miR-17-5p coding sequence. Our
reporter expression data suggest multiple TSSs
within this A/T-rich region, although the
transcription initiation region predicted by
Ozsolak et al. (16), 0.2 kb downstream of the
c-Myc E3 box, may well be the major one. C-
Myc-independent transcription initiation
within 0.7 kb upstream of the mature miR-17-
5p coding sequence was more pronounced in
K562 versus HeLa cells (Fig. 1), indicating
cell type-specific differences in cluster
expression from the intronic promoter region.
Our RNAi results are consistent with E2F3
activating the C13orf25 host gene promoter
and Pim-1 acting in concert with c-Myc at the
E3 site to activate transcription from the
intronic promoter region.
REFERENCES
1. Iorio, M. V, and Croce, C. M. (2009) MicroRNAs in cancer: small molecules with a huge
impact. Journal of Clinical Oncology 27, 5848–56
2. Krol, J., Loedige, I., and Filipowicz, W. (2010) The widespread regulation of microRNA
biogenesis, function and decay. Nature Reviews. Genetics 11, 597–610
3. Bartel, D. P. (2004) MicroRNAs: Genomics, Biogenesis, Mechanism, and Function. Cell 116,
281–297
4. Denli, A. M., Tops, B. B. J., Plasterk, R. H. a, Ketting, R. F., and Hannon, G. J. (2004)
Processing of primary microRNAs by the Microprocessor complex. Nature 432, 231–5
5. Yi, R., Qin, Y., Macara, I. G., and Cullen, B. R. (2003) Exportin-5 mediates the nuclear export
of pre-microRNAs and short hairpin RNAs. Genes & Development 17, 3011–6
6. Lee, Y., Jeon, K., Lee, J.-T., Kim, S., and Kim, V. N. (2002) MicroRNA maturation: stepwise
processing and subcellular localization. The EMBO Journal 21, 4663–70
7. Esquela-Kerscher, A., and Slack, F. J. (2006) Oncomirs - microRNAs with a role in cancer.
Nature Reviews. Cancer 6, 259–69
8. Ota, A., Tagawa, H., Karnan, S., Tsuzuki, S., Karpas, A., Kira, S., Yoshida, Y., and Seto, M.
(2004) Identification and Characterization of a Novel Gene, C13orf25, as a Target for 13q31-
q32 Amplification in Malignant Lymphoma. Cancer Research 64, 3087–3095
9. He, L., Thomson, J. M., Hemann, M. T., Hernando-Monge, E., Mu, D., Goodson, S., Powers,
S., Cordon-Cardo, C., Lowe, S. W., Hannon, G. J., and Hammond, S. M. (2005) A microRNA
polycistron as a potential human oncogene. Nature 435, 828–33

Transcriptional regulation of human miR-17-92
7
10. O’Donnell, K. A., Wentzel, E. A., Zeller, K. I., Dang, C. V, and Mendell, J. T. (2005) c-Myc-
regulated microRNAs modulate E2F1 expression. Nature 435, 839–43
11. Tanzer, A., and Stadler, P. F. (2004) Molecular evolution of a microRNA cluster. Journal of
Molecular Biology 339, 327–35
12. Lu, J., Getz, G., Miska, E. A., Alvarez-Saavedra, E., Lamb, J., Peck, D., Sweet-Cordero, A.,
Ebert, B. L., Mak, R. H., Ferrando, A. A., Downing, J. R., Jacks, T., Horvitz, H. R., and Golub,
T. R. (2005) MicroRNA expression profiles classify human cancers. Nature 435, 834–8
13. Olive, V., Bennett, M. J., Walker, J. C., Ma, C., Jiang, I., Cordon-Cardo, C., Li, Q.-J., Lowe, S.
W., Hannon, G. J., and He, L. (2009) miR-19 is a key oncogenic component of mir-17-92.
Genes & Development 23, 2839–49
14. Ventura, A., Young, A. G., Winslow, M. M., Lintault, L., Meissner, A., Erkeland, S. J.,
Newman, J., Bronson, R. T., Crowley, D., Stone, J. R., Jaenisch, R., Sharp, P. A., and Jacks, T.
(2008) Targeted deletion reveals essential and overlapping functions of the miR-17 through 92
family of miRNA clusters. Cell 132, 875–86
15. Mu, P., Han, Y.-C., Betel, D., Yao, E., Squatrito, M., Ogrodowski, P., De Stanchina, E.,
D’Andrea, A., Sander, C., and Ventura, A. (2009) Genetic dissection of the miR-17~92 cluster
of microRNAs in Myc-induced B-cell lymphomas. Genes & Development 23, 2806–11
16. Ozsolak, F., Poling, L. L., Wang, Z., Liu, H., Liu, X. S., Roeder, R. G., Zhang, X., Song, J. S.,
and Fisher, D. E. (2008) Chromatin structure analyses identify miRNA promoters. Genes &
Development 22, 3172–83
17. Woods, K., Thomson, J. M., and Hammond, S. M. (2007) Direct regulation of an oncogenic
micro-RNA cluster by E2F transcription factors. The Journal of Biological Chemistry 282,
2130–4
18. Sylvestre, Y., De Guire, V., Querido, E., Mukhopadhyay, U. K., Bourdeau, V., Major, F.,
Ferbeyre, G., and Chartrand, P. (2007) An E2F/miR-20a autoregulatory feedback loop. The
Journal of Biological Chemistry 282, 2135–43
19. Guenther, M. G., Levine, S. S., Boyer, L. A., Jaenisch, R., and Young, R. A. (2007) A
Chromatin Landmark and Transcription Initiation at Most Promoters in Human Cells. Cell 130,
77–88
20. Ji, M., Rao, E., Ramachandrareddy, H., Shen, Y., Jiang, C., Chen, J., Hu, Y., Rizzino, A.,
Chan, W. C., Fu, K., and McKeithan, T. W. (2011) The miR-17-92 microRNA cluster is
regulated by multiple mechanisms in B-cell malignancies. The American Journal of Pathology
179, 1645–56
21. Pospisil, V., Vargova, K., Kokavec, J., Rybarova, J., Savvulidi, F., Jonasova, A., Necas, E.,
Zavadil, J., Laslo, P., and Stopka, T. (2011) Epigenetic silencing of the oncogenic miR-17-92
cluster during PU.1-directed macrophage differentiation. The EMBO Journal 30, 4450–64
22. Koike, N., Maita, H., Taira, T., Ariga, H., and Iguchi-Ariga, S. M. M. (2000) Identification of
heterochromatin protein 1 ( HP1 ) as a phosphorylation target by Pim-1 kinase and the effect of
phosphorylation on the transcriptional repression function of HP1. FEBS Letters 467, 17–21
23. Nawijn, M. C., Alendar, A., and Berns, A. (2011) For better or for worse: the role of Pim
oncogenes in tumorigenesis. Nature Reviews. Cancer 11, 23–34
24. Zippo, A., De Robertis, A., Serafini, R., and Oliviero, S. (2007) PIM1-dependent
phosphorylation of histone H3 at serine 10 is required for MYC-dependent transcriptional
activation and oncogenic transformation. Nature Cell Biology 9, 932–44
25. Grünweller, A., Gillen, C., Erdmann, V. A., and Kurreck, J. (2003) Cellular uptake and
localization of a Cy3-labeled siRNA specific for the serine/threonine kinase Pim-1.
Oligonucleotides 13, 345–52
26. Venturini, L., Battmer, K., Castoldi, M., Schultheis, B., Hochhaus, A., Muckenthaler, M. U.,
Ganser, A., Eder, M., and Scherr, M. (2007) Expression of the miR-17-92 polycistron in
chronic myeloid leukemia (CML) CD34+ cells. Blood 109, 4399–405
27. Thomas, M., Lange-Grünweller, K., Weirauch, U., Gutsch, D., Aigner, A., Grünweller, A., and
Hartmann, R. K. (2012) The proto-oncogene Pim-1 is a target of miR-33a. Oncogene 31, 918–
28
28. Kwon, S.H., and Workman, J.L. (2011) HP1c casts light on dark matter. Cell Cycle 15, 625-30

Transcriptional regulation of human miR-17-92
8
29. Vakoc, C. R., Mandat, S. A., Olenchock, B. A., and Blobel, G. A. (2005) Histone H3 lysine 9
methylation and HP1gamma are associated with transcription elongation through mammalian
chromatin. Molecular Cell 19, 381–91
30. Minc, E., Allory, Y., Worman, H. J., Courvalin, J., and Buendia, B. (1999) Localization and
phosphorylation of HP1 proteins during the cell cycle in mammalian cells. Chromosoma 108,
220–234
31. Mateescu, B., Bourachot, B., Rachez, C., Ogryzko, V., and Muchardt, C. (2008) Regulation of
an inducible promoter by an HP1beta-HP1gamma switch. EMBO Reports 9, 267–72
32. Fischle, W., Tseng, B. S., Dormann, H. L., Ueberheide, B. M., Garcia, B. A., Shabanowitz, J.,
Hunt, D. F., Funabiki, H., and Allis, C. D. (2005) Regulation of HP1-chromatin binding by
histone H3 methylation and phosphorylation. Nature 438, 1116–22
33. Adams, M.R., Sears, R., Nuckolls, F., Leone, G., and Nevins, J.R. (2000) Complex
transcriptional regulatory mechanisms control expression of the E2F3 locus. Mol Cell Biol. 20,
3633-9
34. Thalmeier, K., Synovzik, H., Mertz, R., Winnacker, E.L., and Lipp, M. (1989) Nuclear factor
E2F mediates basic transcription and trans-activation by E1a of the human MYC promoter.
Genes Dev. 3, 527-36
35. Wong, J.V., Dong, P., Nevins, J.R., Mathey-Prevot, B., and You, L. (2011) Network
calisthenics: control of E2F dynamics in cell cycle entry. Cell Cycle. 15, 3086-94
Conflict of Interest - The authors declare no conflict of interest.
Acknowledgments - We are grateful to Lisa Schemberger, Nicole Bürger and Moana Klein for
technical assistance, Marcus Lechner for statistical analyses, and Dr. Markus Gößringer for fruitful
discussions. The work was supported by grants of the German Cancer Aid (Deutsche Krebshilfe,
grants 106992 and 109260 to A.G., R.K.H. and A.A.).
FOOTNOTES
*This work was supported by grants of the German Cancer Aid (Deutsche Krebshilfe, grants 106992
and 109260 to A.G., R.K.H. and A.A.). 1To whom correspondence should be addressed:
Roland K. Hartmann and Arnold Grünweller,
Philipps-Universität Marburg, Institut für Pharmazeutische Chemie, Marburg, Germany, Tel.: +49-
6421-28-25553; Fax: +49-6421-28-25854; E-mail: [email protected] and
[email protected] 2Medizinische Fakultät, Rudolf-Boehm-Institut für Pharmakologie und Toxikologie, Universität
Leipzig; Leipzig, Germany 3The abbreviations used are: AB (antibody), bp (base pair), C13orf25 (chromosome 13 open reading
frame 25), ChIP (chromatin immunoprecipitation), FCS (fetal calf serum), kb (= kbp; kilo base pair),
miRISC (miRNA-induced silencing complex), miRNA (microRNA), mRNA (messenger RNA), nt
(nucleotide), pre-miRNA (precursor miRNA), pri-miRNA (primary miRNA), qRT-PCR (quantitative
real-time polymerase chain reaction), RLU (relative light units), RNAi (RNA interference), siRNA
(small interfering RNA), TSS (transcription start site)

Transcriptional regulation of human miR-17-92
9

Transcriptional regulation of human miR-17-92
10

Transcriptional regulation of human miR-17-92
11

Transcriptional regulation of human miR-17-92
12
FIGURE LEGENDS
FIGURE 1. (A) Genomic organization of C13orf25. The locus consists of four exons and three
introns; the six miRNAs of the miR-17-92 cluster are encoded in intron 3. Sequences upstream of the
cluster can be subdivided into a G/C-rich CpG island and an A/T-rich downstream part. The host gene
promoter thought to be activated by E2F3 is located in the CpG island about 3.4 kb upstream of the
miR-17-5p coding sequence. The functional c-Myc site (E3) is located 1.5 kb upstream of miR-17-
5p. Sequence numbering is based on the NCBI reference sequence NG_032702.1 and the
GRCh37/hg19 assembly (http://genome.ucsc.edu). Note that previous related studies referred to the
numbering system of the previous hg18 assembly (16,17,20,21). The numbering of the hg18 and hg19
assemblies is correlated as follows: nt 92,002,872 (0 kb in Fig. 1A) of hg19 is nt 90,800,873 of hg18.
(B) Schematic representation of the different C13orf25 portions fused to the luciferase structural gene.
The functional E3 box for c-Myc binding is indicated in the 1.5 kb construct (white vertical line). (C)
Promoter activities of the different luciferase reporter constructs in K562 and HeLa cells. Obtained
luciferase activities were normalized to the pGL3 control plasmid carrying the SV40 promoter
(Promega). A reporter construct lacking the SV40 promoter as well as a construct harboring the 339
bp fragment of the A/T-rich intronic region in inverted orientation were used as controls. RLU values
of the individual constructs were derived from 5 to 16 experiments (+/- S.E.M.).
FIGURE 2. (A) Schematic representation of the intronic A/T-rich region preceding the miR-17-92
coding sequence. The region A1 defines the genomic sequence 0.1 kb downstream of the functional c-
Myc binding site (E3 box) that was amplified in ChIP analyses. (B) ChIP analysis of the intronic
region A1 in K562 cells, using antibodies specific for c-Myc, Pim-1 and HP1. + AB: with antibody; -
AB: without antibody; Mock: buffer only without cell lysate; Input: supernatant of the - AB-sample
after immunoprecipitation and centrifugation (for details, see Supplementary Material).
FIGURE 3. (A) Illustration of the primers (arrows) used for the qRT-PCR quantification of pri-mir-
17-92 transcript levels. (B) Quantitative RT-PCR of pri-mir-17-92 transcript levels in HeLa cells after
siRNA-mediated knockdown of c-Myc, E2F3 or Pim-1and after combined knockdown of c-
Myc/E2F3, c-Myc/Pim-1 or E2F3/Pim-1. 2^-pri-17-92 values were normalized against 5S rRNA
and an internal control siRNA (si VR1), representing mean values from at least three independent
experiments (+/- S.E.M.). Statistical analyses were done using the software R. (C) Same as in panel B,
but using K562 instead of HeLa cells.

1
SUPPLEMENTARY MATERIAL
Supplementary methods
Cell culture - Cells (K562 and HeLa) were cultivated under standard conditions in a
humidified atmosphere (37 °C, 5 % CO2) supplemented with RPMI 1640 (K562) or IMDM
(HeLa) containing 10 % FCS (PAA, Cölbe, Germany).
Chromatin immunoprecipitation (ChIP) - 2 • 107 K562 cells in 13 mL RPMI medium were
crosslinked with 1 % formaldehyde for 10 min at 37 °C. Reactions were stopped by adjusting
to 0.125 M glycine, and cells were collected by centrifugation at 400 g for 5 min at room
temperature. For cell lysis, cells were resuspended in 750 µL RIPA-buffer (10 mM Tris-HCl
pH 7.4, 150 mM NaCl, 1 % deoxycholate, 1 % NP40, 0.1 % SDS, 0.2 mM PMSF)
supplemented with the cOmplete Mini Protease Inhibitor Mix from Roche (Mannheim,
Germany) according to the manufacturer’s instructions. Lysed cells were sonicated in a
Branson Sonifier 250 (duty cycle 50 %, output control 2, for 3.5 min, on ice water)
(Heinemann, Schwäbisch Gmünd, Germany) and centrifuged at 16.000 g for 10 min at 4 °C.
The supernatant was pre-cleared with 10 µL of blocked Staphylococcus aureus cells
(Pansorbin® Cells, Calbiochem/Merck, Darmstadt, Germany) for 15 min at 4 °C on a rotor
wheel. After a second centrifugation step (16.000 g, 5 min, room temperature), the
supernatant was split into two samples (each ~350 µL, representing + and – specific antibody
(AB)), which were adjusted to buffer D (16.7 mM Tris-HCl pH 8.1, 167 mM NaCl, 1.2 mM
EDTA, 1.1 % Triton-X 100, 0.01 % SDS) and a total volume of 500 µL. 1 µg (1 to 5 µL) of
the respective antibody was added to “+ AB” samples, whereas the same volume buffer D
was added to “- AB” samples. At this point, also the “Mock” control was prepared, consisting
of 500 µL buffer D. “+ AB”, “- AB” and “Mock” samples were then incubated for at least 3 h
at 4 °C. The following antibodies were used: monoclonal anti-c-Myc (sc-40) and anti-Pim-1
(sc-13513) (Santa Cruz Biotechnology (Heidelberg, Germany), anti-Phospho HP1 (Ser83)
polyclonal antibody (2600S) (Cell Signaling Technology, Danvers, MA, USA). In the case of
mouse monoclonal antibodies (c-Myc and Pim-1), samples were additionally incubated for 1
h with a second monoclonal goat anti-mouse IgG antibody (sc-2005, Santa Cruz
Biotechnology, Heidelberg, Germany). Immunoprecipitation was initiated by adding 10 µL of
Pansorbin® cells (see above) to the “+ AB”, “- AB” and “Mock” samples, followed by
incubation for 15 min at room temperature. Samples were centrifuged (16.000 g, 3 min, room
temperature); the supernatant of the “- AB” sample was saved, later serving as the input

2
control. Pellets were washed twice with dialysis buffer (50 mM Tris-HCl pH 8.0, 2 mM
EDTA) and four times with IP-wash buffer (100 mM Tris-HCl pH 9.0, 500 mM LiCl, 1 %
NP40, 1 % deoxycholate). Antibody-bound material was eluted from Pansorbin® cells by
adding 150 µL elution buffer (50 mM NaHCO3, 1 % SDS), vortexing for 3 s, and
centrifugation (16.000 g, 3 min, room temperature). The supernatant was collected and the
procedure was repeated. Reverse crosslinking and RNA digestion was performed in 280 µL
buffer (0.3 M NaCl, and 1 µL RNase A (10 mg/mL)) for 5 h at 67 °C. Chromatin was
precipitated with ethanol, followed by a Proteinase K digest (Thermo Fisher Scientific). DNA
was purified by phenol/chloroform extraction and ethanol precipitation in the presence of 0.3
M NaOAc, pH 5.2. PCR amplification using Taq DNA polymerase and the co-
immunoprecipitated DNA as template was done under the following conditions: 2 min at 95
°C in the absence of enzyme, followed by 35 amplification cycles of 45 s at 95 °C / 45 s at 60
°C / 45 s at 72 °C using the following primers:
A1 forward 5’-AAA GGC AGG CTC GTC GTT G
A1 reverse 5’-CGG GAT AAA GAG TTG TTT CTC CAA
A2 forward 5’-ACA TGG ACT AAA TTG CCT TTA AAT G
A2 reverse 5’-AAT CTT CAG TTT TAC AAG GTG ATG
A3 forward 5’-ACT GCA GTG AAG GCA CTT GT
A3 reverse 5’-TGC CAG AAG GAG CAC TTA GG
A4 forward 5’-CCA ATA ATT CAA GCC AAG CAA
A4 reverse 5’-AAA TAG CAG GCC ACC ATC AG
A5-forward 5’-GCC CAA TCA AAC TGT CCT GT
A5-reverse 5’-CGG GAC AAG TGC AAT ACC AT
Transfection of reporter constructs - For transfection of the suspension cell line K562,
cells were washed in medium without serum, followed by electroporation in a BioRad Gene
Pulser XCell (München, Germany) with a single pulse in a 4 mm cuvette, using 5 µg of the
respective pGL3 derivative plasmid per million cells. 48 h after transfection, cells were
washed in PBS, lysed and prepared for luciferase reporter assay measurements.
Transfection of siRNAs - Transfection of the suspension cell line K562 was performed by
electroporation. After a washing step in medium without serum, 106 cells were mixed with 1
µg of siRNA (VR1 siRNA, Pim-1 siRNA, c-Myc siRNA or E2F3 siRNA). For the double
knockdown experiments, 1 µg of each siRNA, respectively, was used. Cells were
electroporated at 330 V with a single pulse in a BioRad Gene Pulser XCell (München,
Germany) using a 4 mm cuvette. After electroporation, K562 cells were resuspended in

3
medium containing 10 % FCS and cultivated in a humidified atmosphere at 37 °C for 24 h.
Cells were washed with PBS and prepared for total RNA extraction.
Transfection of HeLa cells was done using the transfection agent LipofectamineTM
2000
(Life Technologies Invitrogen, Darmstadt, Germany). One day before transfection, 8 • 104
cells were seeded into 24-well plates and cultivated under standard conditions. SiRNA
complexes (VR1 siRNA, Pim-1 siRNA, c-Myc siRNA or E2F3 siRNA) were prepared
according to the manufacturer's protocol. To perform single knockdown experiments, 40 pmol
of the respective siRNA were used. In case of the double knockdown experiments, 20 pmol of
each siRNA were mixed in Opti-MEM® 1 (Life Technologies Invitrogen, Darmstadt,
Germany). 4 to 6 h after transfection, the medium was replaced with IMDM containing 10 %
FCS. Cells were cultivated 48 h under standard conditions until preparation for total RNA
extraction.
RNA preparation and quantitative real-time PCR – For total RNA isolation, transfected
cells (K562 or HeLa) were lysed (vortexing or mixing by pipetting up and down) in 750 µL
lysis solution (0.8 M guanidinium-thiocyanate, 0.4 M ammonium-thiocyanate, 0.1 M sodium
acetate pH 5.0, 5 % glycerin, 38 % phenol pH 4.5-5.0 [Roth®-Aqua-Phenol, Roth, Karlsruhe,
Germany], 1 pellet 8-hydroxychinolin). Then, 200 µL of chloroform was added and phases
were separated by centrifugation. The aqueous phase was mixed with 2 volumes of
isopropanol, followed by incubation for 15 min at room temperature and centrifugation. The
air-dried RNA pellet was dissolved in RNase-free water and incubated for 30 min at 37 °C
with 1 U DNase I per µg RNA in 100 µL 1 x DNase I buffer (DNase I, Thermo Fisher
Scientific, Schwerte, Germany) according to the manufacturer’s instructions. Then, another
identical aliquot of DNase I was added, followed by incubation at 37 °C for another 30 min.
Samples were extracted with an equal volume of Roth®-Aqua-Phenol (see above), followed
by extraction of the aqueous phase with chloroform and isopropanol precipitation as above.
RNA pellets were finally washed with 75 % ethanol, air-dried and redissolved in 10 µL
RNase-free water. 0.5 to 1 µg of total RNA were reverse-transcribed with RevertAid H Minus
RT Polymerase (Thermo Fisher Scientific) according to the manufacturer's protocol. For
determination of KD efficiencies a random hexamer primer was used to generate cDNA
samples. In case of calculating pri-mir-17-92 levels the gene-specific reverse primer specified
below was used for cDNA synthesis. Quantitative RT-PCR was performed in duplicate in a
BioRad iQTM
5 (BioRad, München, Germany) with the Absolute qPCR SYBR Green
Capillary Mix (Thermo Scientific AbGene, Hamburg, Germany); cDNAs were diluted 1:5 or
1:10 and 4 µL of the reaction mixture used for determining RNA transcription levels.
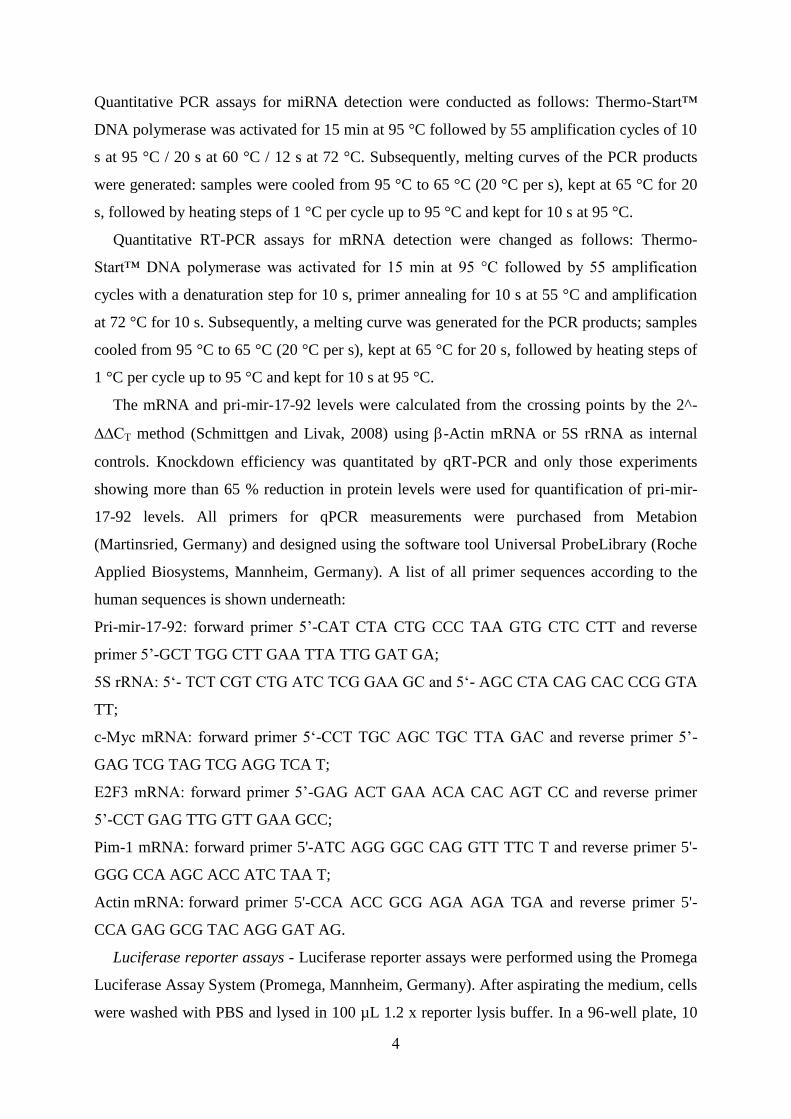
4
Quantitative PCR assays for miRNA detection were conducted as follows: Thermo-Start™
DNA polymerase was activated for 15 min at 95 °C followed by 55 amplification cycles of 10
s at 95 °C / 20 s at 60 °C / 12 s at 72 °C. Subsequently, melting curves of the PCR products
were generated: samples were cooled from 95 °C to 65 °C (20 °C per s), kept at 65 °C for 20
s, followed by heating steps of 1 °C per cycle up to 95 °C and kept for 10 s at 95 °C.
Quantitative RT-PCR assays for mRNA detection were changed as follows: Thermo-
Start™ DNA polymerase was activated for 15 min at 95 °C followed by 55 amplification
cycles with a denaturation step for 10 s, primer annealing for 10 s at 55 °C and amplification
at 72 °C for 10 s. Subsequently, a melting curve was generated for the PCR products; samples
cooled from 95 °C to 65 °C (20 °C per s), kept at 65 °C for 20 s, followed by heating steps of
1 °C per cycle up to 95 °C and kept for 10 s at 95 °C.
The mRNA and pri-mir-17-92 levels were calculated from the crossing points by the 2^-
∆∆CT method (Schmittgen and Livak, 2008) using -Actin mRNA or 5S rRNA as internal
controls. Knockdown efficiency was quantitated by qRT-PCR and only those experiments
showing more than 65 % reduction in protein levels were used for quantification of pri-mir-
17-92 levels. All primers for qPCR measurements were purchased from Metabion
(Martinsried, Germany) and designed using the software tool Universal ProbeLibrary (Roche
Applied Biosystems, Mannheim, Germany). A list of all primer sequences according to the
human sequences is shown underneath:
Pri-mir-17-92: forward primer 5’-CAT CTA CTG CCC TAA GTG CTC CTT and reverse
primer 5’-GCT TGG CTT GAA TTA TTG GAT GA;
5S rRNA: 5‘- TCT CGT CTG ATC TCG GAA GC and 5‘- AGC CTA CAG CAC CCG GTA
TT;
c-Myc mRNA: forward primer 5‘-CCT TGC AGC TGC TTA GAC and reverse primer 5’-
GAG TCG TAG TCG AGG TCA T;
E2F3 mRNA: forward primer 5’-GAG ACT GAA ACA CAC AGT CC and reverse primer
5’-CCT GAG TTG GTT GAA GCC;
Pim-1 mRNA: forward primer 5'-ATC AGG GGC CAG GTT TTC T and reverse primer 5'-
GGG CCA AGC ACC ATC TAA T;
Actin mRNA: forward primer 5'-CCA ACC GCG AGA AGA TGA and reverse primer 5'-
CCA GAG GCG TAC AGG GAT AG.
Luciferase reporter assays - Luciferase reporter assays were performed using the Promega
Luciferase Assay System (Promega, Mannheim, Germany). After aspirating the medium, cells
were washed with PBS and lysed in 100 µL 1.2 x reporter lysis buffer. In a 96-well plate, 10

5
µL of the respective cell lysate were mixed with 10 µL of luciferase substrate.
Chemiluminescence was measured immediately in a Safire2 TM
micro-plate reader (Tecan,
Crailshaim, Germany).
Plasmid construction and seed mutagenesis - All primers, which were used for plasmid
construction and seed mutagenesis, are listed below (restriction sites in italics):
pGL3 1.5 kb: 5’-ATA TAG ATC TTG CCG CCG GGA AAC GGG TT and reverse primer
R1 5’-ATA TAA GCT TCC ATA CAA ATT CAG CAT AAT CCC TAA TGG;
pGL3 625 bp: 5’-ATA TAG ATC TCT TTA GAC AAT GTA CCT TTT CTG and reverse
primer R1 (see above);
pGL3 339 bp: 5'-ATA TAG ATC TGT GGA AGC CAG AAG AGG AGG A and reverse
primer R1 (see above);
pGL3 279 bp: 5'-ATA TAG ATC TGG TAC ACA TGG ACT AAA TTG CC and reverse
primer R1 (see above);
pGL3 197 bp: 5’-ATA TAG ATC TCT CTA TGT GTC AAT CCA TTT GGG AG and reverse
primer R1 (see above);
pGL3 250 bp: 5‘-ATA TAG ATC TGT GGA AGC CAG AAG AGG AGG A and reverse
primer R3 5’- ATA TAA GCT TGC CTT AAG AAT TCT TTA CAG AAG GC;
pGL3 190 bp: 5‘-ATA TAG ATC TGG TAC ACA TGG ACT AAA TTG CC and reverse
primer R3 (see above);
pGL3 108 bp: 5’-ATA TAG ATC TCT CTA TGT GTC AAT CCA TTT GGG AG and reverse
primer R3 (see above);
pGL3 339 inv: 5’-ATA TAA GCT TGT GGA AGC CAG AAG AGG AGG A and 5’-ATA
TAG ATC TCC ATA CAA ATT CAG CAT AAT CCC TAA TGG.
Bioinformatical promoter analysis - For promoter analyses of the intronic A/T-rich region,
a sequence of 1490 bp (human), beginning at the functional c-Myc site (E3) and ending at the
5’-end of the first mature miRNA sequence, miR-17-5p (for details, see Fig. S1), was
analyzed with several web-based promoter prediction tools. The following tools were used to
predict promoter elements or putative TSSs:
Neural Network promoter prediction: (Reese, 2001)
(http://www.fruitfly.org/seq_tools/promoter.html);
McPromoter006: (Ohler, 2006)
(http://tools.genome.duke.edu/generegulation/McPromoter/);
Promoter 2.0 Prediction Server: (Knudsen, 1999) (http://www.cbs.dtu.dk/services/Promoter/);
PromPredict: (Rangannan and Bansal, 2009)

6
(http://nucleix.mbu.iisc.ernet.in/prompredict/prompredict.html).
Putative TSSs were predicted and calculated using the software available at
http://rulai.cshl.org/tools/genefinder/CPROMOTER/human.htm (Zhang, 1998).
All promoter prediction tools predicted several different promoter elements in the 1.5 kb
region upstream of miR-17-5p and only the web-based tool Promoter 2.0 failed. The
calculated promoter predictions of the indicated tools did not match in any sequence region,
giving the assumption that the A/T-rich 1.5 kb intronic region in front of the miR-17-92
coding sequence has only weak promoter activity itself. Due to the fact that this intronic
region has an overall high A/T-content, nearly all software programs were able to detect
putative promoter regions.
Statistical analysis - Statistical analyses were done using the software R (R Core Team,
2012). P-values were calculated with the Welch Two Sample Test.
References
Knudsen, S. (1999) Promoter2.0: for the recognition of PolII promoter sequences.
Bioinformatics 15, 356–361.
Ohler, U. (2006) Identification of core promoter modules in Drosophila and their application
in accurate transcription start site prediction. Nucleic Acids Research 34, 5943–5950.
Rangannan, V., and Bansal, M. (2009) Relative stability of DNA as a generic criterion for
promoter prediction: whole genome annotation of microbial genomes with varying nucleotide
base composition. Molecular BioSystem 5, 1758–1769.
R Core Team (2012) R: A Language and Environment for Statistical Computing. R
Foundation for Statistical Computing
Reese, M. G. (2001) Application of a time-delay neural network to promoter annotation in the
Drosophila melanogaster genome. Computers & Chemistry 26, 51–6.
Schmittgen, T. D., and Livak, K. J. (2008) Analyzing real-time PCR data by the comparative
CT method. Nature Protocols 3, 1101–1108.
Zhang, M. Q. (1998) Identification of human gene core promoters in silico. Genome Res. 8,
319–326.

7
Supplementary figure legends
Fig. S1: Relevant sequence region of C13orf25, including the CpG island harboring the host
gene promoter, the A/T-rich region, and the miR-17-92 cluster; sequence and position of the
last exon 4 of C13orf25 is indicated at the end. Shown sequences are based on the NCBI
reference sequence NG_032702.1 and the GRCh37/hg19 assembly (http://genome.ucsc.edu).
The boundaries of the CpG island, important previously identified regulatory elements,
mature miRNA coding sequences and relevant primer sequences are highlighted in the
sequence and annotated at the margins.
Fig S2. Quantitative RT-PCR of the pri-mir-17-92 transcription levels in the human cell lines
K562, HeLa and HUH7. 2^-pri-mir-17-92 values are normalized against 5S rRNA and
obtained from at least 3 independent experiments (+/- S.E.M.). The amount of pri-mir-17-92
transcript in K562 cells was set to 1.
Fig. S3. (A) Schematic representation of the intronic A/T-rich region preceding the miR-17-
92 coding sequence. The region A1 defines the genomic sequence 0.1 kb downstream of the
functional c-Myc binding site (E3 box) that was amplified in ChIP analyses. A2 covers a
segment immediately upstream of the miRNA-coding region; A3-A5 are located along the
coding sequence of the human miR-17-92 cluster. The length (bp) of each amplicon is
indicated at the top. (B) ChIP analysis of the regions A1 to A5 in K562 cells, using an
antibody specific for HP1or RNA polymerase II (only A2 analyzed); +AB: with antibody; -
AB: without antibody; Mock: buffer only without cell lysate; Input: supernatant of the “- AB”
sample after immunoprecipitation and centrifugation (for details, see Supplementary
Material). (C) ChIP analysis of the A2 region in HeLa cells using the antibody specific for
HP1

8
Table S1:
K562 c-Myc KD E2F3 KD Pim-1 KD
2^-∆∆CT pri-mir-
17-92
KD
efficiency
2^-∆∆CT pri-mir-
17-92
KD
efficiency
2^-∆∆CT pri-mir-
17-92
KD
efficiency
0.13 77 0.21 95 1.23 72
0.02 87 0.16 98 0.16 69
0.56 59 0.60 19 1.39 55
0.75 74 0.76 59
0.33 75 0.22 49
0.14 99 2.38 78
0.20 97 1.84 87
0.55 80 0.80 88
0.27 85
0.40 89
0.52 67
0.69 65
0.37 87
Mean 0.33 81 0.34 89 0.47 73
SEM 0.09 5.0 0.15 8.0 0.08 5.0
K562 c-Myc / E2F3 KD c-Myc / Pim-1 KD Pim-1 / E2F3 KD
2^-∆∆CT pri-mir-
17-92
KD
efficiency
2^-∆∆CT pri-mir-
17-92
KD
efficiency
2^-∆∆CT pri-mir-
17-92
KD
efficiency
0.22 82 / 75 0.45 72 / 55 0.69 88 / 86
0.23 86 / 72 0.19 90 / 54 0.56 68 / 73
0.15 81 / 48 0.19 95 / 48 0.19 95 / 99
0.08 99 / 99 0.52 87 / 81
0.04 99 / 99 0.23 91 / 93
Mean 0.15 89 / 79 0.28 86 / 52 0.44 86 / 86
SEM 0.04 4.0 / 9.6 0.08 7.0 / 2.2 0.09 4.7 / 4.5
HeLa c-Myc KD E2F3 KD Pim-1 KD
2^-∆∆CT pri-mir-
17-92
KD
efficiency
2^-∆∆CT pri-mir-
17-92
KD
efficiency
2^-∆∆CT pri-mir-
17-92
KD
efficiency
0.37 70 0.72 51 0.50 47
0.29 82 0.66 78 0.34 72
0.32 61 0.40 76 0.71 63
0.41 99 0.53 73 0.58 80
0.48 55 0.64 73 0.54 87
0.37 64 0.78 72
0.70 76
Mean 0.37 65 0.59 70 0.59 71
SEM 0.03 6.7 0.07 6.3 0.06 4.9
HeLa c-Myc / E2F3 KD c-Myc / Pim-1 KD Pim-1 / E2F3 KD
2^-∆∆CT pri-mir-
17-92
KD
efficiency
2^-∆∆CT pri-mir-
17-92
KD
efficiency
2^-∆∆CT pri-mir-
17-92
KD
efficiency
0.24 79 / 64 0.24 79 / 84 0.49 81 / 96
0.13 91 / 81 0.25 77 / 61 0.33 91 / 85
0.11 93 / 86 0.15 86 / 58 0.10 97 / 94
0.12 90 / 91 0.12 95 / 91 0.26 92 / 94
0.23 87 / 74 0.41 84 / 73
0.26 83 / 66 0.10 97 / 95
Mean 0.18 87 / 77 0.21 86 /77 0.30 90 / 92
SEM 0.03 2.2 / 4.4 0.053 3.3 / 6.0 0.08 3.3 / 2.5

NCBI Reference Sequence: NG_032702.1
Homo sapiens mir-17-92 microRNA cluster containing MIR17HG, MIR17, MIR18A,
MIR19A, MIR19B1, MIR20A, and MIR92A1 (MIR17-MIR92); and microRNA 17 (MIR17);
and miR-17-92 cluster host gene (non-protein coding) (MIR17HG); and microRNA
18a (MIR18A); and microRNA 19a ...
91,995,073 –
91,999,514 AAGGGCCGGT AAAGTAATAA ACTGTGATCG CACAGCGTAC ACGTCGAGTC CCAGGGAGAG
91,999,574 CAGGGCTCCC AGGAAGCCCC GGGAAGCGTG CGCTTCCAGG AGGGTGTGCG GCGCGCGGGG
91,999,634 GTCTGCACGC GCGCAGAGCT TGTTAACGGA GGGCGTGCCG GAGGCGTGGC GCGAGGTGTT
91,999,694 CGGGCGAGGC GCTCCGCGAG GCTGGCGGCG GTGGGCGGGC CACGGGGGAG CGCGGCCCGG
91,999,754 GGAAGGCTGC GCGGCGCCGC CAGCGGCTCC CGGCTCCCGC TCTCCCGGCC GCCAAGAACG
91,999,814 AGCCGCCGTG GGCGGGGCCT GCGGTGATTG GCGGGCGGGC GGGGAGGTCG GAAGTACTTT
91,999,874 GTTTTTTATG CTAATGAGGG AGTGGGGCTT GTCCGTATTT ACGTTGAGGC GGGAGCCGCC
91,999,934 GCCCTTCATT CACCCACATG GTCCTTCGAG GTGCCGCCGC CGCCGCCCGA CCTGCGCCTT
91,999,994 CGCGCCACTT CGCGCCCTCG GGCGAGGCCG AGGGGGTGGG GACGACTACC GCAGCGCCGC
92,000,054 CGGGGCTCGC GCTCCTCCGC GAAGCTCTCC TCGCGGGGCG GGCCGGCCGG CCGCACCCCC
92,000,114 GGCCTGGGGC CTCCGGTCGT AGTAAAGCGC AGGCGGGCGG GGAGGCGGGA GCAGGAGCCC
92,000,174 GCGGCCGGCC AGCCGAAGAT GGTGGCGGCT ACTCCTCCTG GTGAGTCTGC CCGCCCCTCC
92,000,234 GGCGACGGAG GGAAACCTGT TGTGTGCGGC CCGGGTCTGG CGGGCGGGGC GGAGCGGCCC
92,000,294 GGGGCGGACT GGCCCGGGGC AGCGTGGCGG CGGCGGCGTG GCCGGGGCGG GTCTCGGCCG
92,000,354 TTGGCCGCCC CGGCGTGTGG CAGCCGCATC TGGCTGCCCC CTCGCTCGCC CGCGGGCCGG
92,000,414 CGGAGGGGGG CAGGGCCGGG GCGGGAGGGT GGGAGGGGGC GGCGTGCGCG TGGCGGCCGC
92,000,474 GCCCGGGACC CGCGCAGACC CTGCCTGGGC CGACCCGAAG GCGGGTGGGC GGACGGCGAA
92,000,534 CACAATGGCC CCTCGGGGAG AGGACGTGCG AGGCCCGTGC CTTCTCCGGG GCCCGGGGCG
92,000,594 CGCGCGGGGC GTGGGGTCTC TGGGTAGGAA AGTTTCTCCC GAGGGCGAGA GTTAAAGCGC
92,000,654 CTCCAGAACA AAGCGGCGGC GGCGGCGGCA CATGGGGCAG GCCGCGGGCC GGGAGGGGGC
92,000,714 GCGCCCACGA GGTACCTGCG CGCCAGCGGG CGGCGTGGCG TGGGCGGGAG CCCGCGGTTC
92,000,774 CCCAAACTTT GTACGCGCGA GGGTGGGCGG AGGGGCGCCG AGATCGGCGC GGCCTGGGCG
92,000,834 CCACCCCCGC TCCGCGTGGG CTTTGTTAGC CCGCGTGGGC AGCCTCGGGG CGGGGCCCGC
92,000,894 AACTTCCCCG CCGTGGCCCT CGGAGGAGGC CGCAGTCGGC CTCAGCCGCG GCGTGGAGCC
92,000,954 GCCTGCGCCC GGCCGCTTGC TGGGAGTGTG GCGCGGGAGG GCCAGCCCGG CTCGGCGGGA
92,001,014 GCGGCGTCCC CGCCGCCATG TTCCTGCGGG GCGGGCTGCA CGGGGGTGAG GGCGGGGGAC
92,001,074 ATGGCGGCGA CTGCGCGCCG CCGCCGATTG TTCCCGGCTT AGGCCTCGGG CCGCGTGCGA
92,001,134 CGGGCACCGC GGCCGCGGAG CCCCCGCCCC TCTGGGCCGG GCTCGGGGGG GCTGGGGGAC
92,001,194 ACAAAGGAGG GGCGGCGCGC CCGCGTCCCC GCCGCACTCG GGCCTCGGCG CCGCCGGTCG
92,001,254 CCGCGCGGCT GCCGCCGGGA AACGGGTTGG GGGGGTTGCC GCGTCCGGCG GGGCCTGACT
92,001,314 CTGACCCGCC GCCCCCTGGC GGCTACGCGG AGAATCGCAG GGCCGCGCTC CCCCTTGTGC
92,001,374 GACATGTGCT GCCGGCCCGG GCTCCATGAG CGTGGCGGGC ACTTTGCAGT CTCGGGTGTT
92,001,434 CCTGCCCGGT CTTCTGTTCC TAAACTGCAG CAAAGGGAAA AGGAACTGAA AAAGGCAGGC
92,001,494 TCGTCGTTGC AATATCACCA AAAGAGAAAA TTAACGGCAT GCCATCAGGA CCACAGCAGT
92,001,554 TGGAGAAACA ACTCTTTATC CCGGCTTGCA GCCACGAGGT CTTGATTGGG GGAGGGGTGG
92,001,614 TGAAGAATAG TCTGTGGGCT GCTTTTTTTT TTTCCTTTTA CTGGAGCTGT ACAGTGGAGT
92,001,674 CGGTGATTGC TGCTGATCAT AATCAAGTAT TTTAGGAGCT TATTTAGACA TGTATCTGAT
92,001,734 AGCTAAGGAT TTTTCAACTT TATTCTCTTA CGTATTTTTC AACTGTAAAT TATTGGGCTT
92,001,794 TTAAATCCTG CTAGTATTGC TCGACTCTTA CTCTCACAAA TGGATGGAAT TAATTGCTGT
92,001,854 TAGGAGGTTG GAAAATAGCA AATATAGATT TGGACGGTGG TAGTAATTTT GAGCAAATAA
92,001,914 TGTTTTATCT TTTTTTTCCT TATTTTTCCC TATTCCAGTC ATACACGTGG ACCTAACTGC
92,001,974 ACCAGTAGCT TTTCTGAGAA TACTTGCTGA AAAGGAAGTT TTCTGGAATG GGTAAGTGTA
92,002,034 TTCTGATTTT CTTGAACTTT TCTTAAAAAC AAATTTTTCT TGCTATTAAA GTTGAATAAA
92,002,094 TAGGATTGGT TTCTTAGAGA GTAAAAGTAG GTGTTTCTTT CTTTAGACAA TGTACCTTTT
92,002,154 CTGAAAAACT AACTCATTAA GTACGGATTT GCTAATTTTA AGGTAGTAAA ATTACAGTGT
92,002,214 AAATATTCCT GTACATTTTT GGAAACTGGC TTATGCAGTT TACGAAATAT AATTTTAGAC
92,002,274 CCTCTTTTAA GTTGGGTGAT AAAGTAGATA TAACCTGAGA TGATAGATTT AAACAGGATA
92,002,334 TTTACGTTCT GCTACAATTG ACTGATAACA CTTGAAGTGT AGTCTGAACA GTAATTTTGT
92,002,394 TAATCATTTC AACAAGTATT TGCTAAGTGG AAGCCAGAAG AGGAGGAAAA TGTTTTGCCA
92,002,454 CGTGGATGTG AAGATTTCCT CTAAAAGGTA CACATGGACT AAATTGCCTT TAAATGTTCC
92,002,514 AAAATTAGTT CTCATTTATT TGCAGTCTCA TTTTGTTTTG TTTTTTTTCT CTATGTGTCA
92,002,574 ATCCATTTGG GAGAGGCCAG CCATTGGAAG AGCCACCACT TCCAGTGCTA GTTGGATGGT
92,002,634 TGGTTATGAT TGCCTTCTGT AAAGAATTCT TAAGGCATAA ATACGTGTCT AAATGGACCT
92,002,694 CATATCTTTG AGATAATTAA ACTAATTTTT TCTTCCCCAT TAGGGATTAT GCTGAATTTG
92,002,754 TATGGTTTAT AGTTGTTAGA GTTTGAGGTG TTAATTCTAA TTATCTATTT CAAATTTAGC
92,002,814 AGGAAAAAAG AGAACATCAC CTTGTAAAAC TGAAGATTGT GACCAGTCAG AATAATGTCA
92,002,874 AAGTGCTTAC AGTGCAGGTA GTGATATGTG CATCTACTGC AGTGAAGGCA CTTGTAGCAT
92,002,934 TATGGTGACA GCTGCCTCGG GAAGCCAAGT TGGGCTTTAA AGTGCAGGGC CTGCTGATGT
92,002,994 TGAGTGCTTT TTGTTCTAAG GTGCATCTAG TGCAGATAGT GAAGTAGATT AGCATCTACT

92,003,054 GCCCTAAGTG CTCCTTCTGG CATAAGAAGT TATGTATTCA TCCAATAATT CAAGCCAAGC
92,003,114 AAGTATATAG GTGTTTTAAT AGTTTTTGTT TGCAGTCCTC TGTTAGTTTT GCATAGTTGC
92,003,174 ACTACAAGAA GAATGTAGTT GTGCAAATCT ATGCAAAACT GATGGTGGCC TGCTATTTCC
92,003,234 TTCAAATGAA TGATTTTTAC TAATTTTGTG TACTTTTATT GTGTCGATGT AGAATCTGCC
92,003,294 TGGTCTATCT GATGTGACAG CTTCTGTAGC ACTAAAGTGC TTATAGTGCA GGTAGTGTTT
92,003,354 AGTTATCTAC TGCATTATGA GCACTTAAAG TACTGCTAGC TGTAGAACTC CAGCTTCGGC
92,003,414 CTGTCGCCCA ATCAAACTGT CCTGTTACTG AACACTGTTC TATGGTTAGT TTTGCAGGTT
92,003,474 TGCATCCAGC TGTGTGATAT TCTGCTGTGC AAATCCATGC AAAACTGACT GTGGTAGTGA
92,003,534 AAAGTCTGTA GAAAAGTAAG GGAAACTCAA ACCCCTTTCT ACACAGGTTG GGATCGGTTG
92,003,594 CAATGCTGTG TTTCTGTATG GTATTGCACT TGTCCCGGCC TGTTGAGTTT GGTGGGGATT
92,003,654 GTGACCAGAA GATTTTGAAA ATTAAATATT ACTGAAGATT TCGACTTCCA CTGTTAAATG
-
92,006,074 CTTCATTTTA CAGGCAGACC TGTCTAACTA CAAGCCAGAC TTGGGTTTTC TCCTGTAGTT
TGAAGACACA CTGACTCCTG ACAAAATGCA GCCTGCAACT TCCTGGAGAA CAACTCAGTG
TCACATTAAA GTTTATTATG TATTTAATGA TACACTGTTT AATTGACAGT TTTGCATAGT
TTGTCTAACT TTAGAGAATT AAGAGCCTCT CAACTGAGCA GTAAAGGTAA GGAGAGCTCA
ATCTGCACAG AGCCAGTTTT TAGTGTTTGA TGGAAATAAG ATCATCATGC CCACTTGAGA
CTTCAGATTA TTCTTTAGCT TAGTGGTTGT ATGAGTTACA TCTTATTAAA GTCGAAATTA
ATGTAGTTTT CTGCCTTGAT AACATTTCAT ATGTGGTATT AGTTTTAAAG GGTCATTAGG
AAAATGCACA TATTCCATGA ATTTTAAGAC CCATAGAAAA GTTGAAGAAT GCTTAATTTT
CTTATCCAGT AATGTAAACA CAGAGACAGA ACATTGAGAT GTGCCTAGTT CTGTATTTAC
AGTTTGGTCT GGCTGTTTGA GTTCTAGCGC ATTTAATGTT AATAAATAAA ATACTGCATT
92,006,774 TTAAAGCTGT TAAGAAATTG TCCAGAACGA GAATATTGAA ATAAAAACTT CAAGGTTATT
-
92,008,829

9

10

Appendix
186
E. Acronyms and units
Acronyms and units
% percentage
[γ32
P]-ATP gamma 32
P-adenosine triphosphate
°C degree Celsius
ε molar absorptivity/ extinction coefficient
µg microgram
µL microliter
µM micromolar
µm micrometer
2’-F 2’-fluoro
2’-O-Me 2’-O-methyl
2’-O-MOE 2’-O-methoxyethyl
32P
32phosphor isotope
5S rRNA 5S ribosomal RNA
A adenine
A260 absorption at 260 nm
A280 absorption at 280 nm
AAV adenovirus-associated vector
ABCA1 ATP-binding cassette transporter A1
AFM atomic force microscopy
AGO argonaute RISC catalytic component
ALT alanine transaminase
APS ammonium persulfate
AST aspartate transaminase
ATP adenosine triphosphate
AURKB aurora kinase B
BAD BCL-2 associated agonist of cell death
BCL2 B-cell lymphoma 2
BCL2L11 BCL2-like apoptosis facilitator
B-CLL B-cell chronic lymphocytic leukemia
BLAST Basic Local Alignment Search Tool
bp base pair
BPB bromophenol blue
C cytosine
c concentration
C. elegans Caenorhabditis elegans
C13orf25 chromosome 13 open reading frame 25
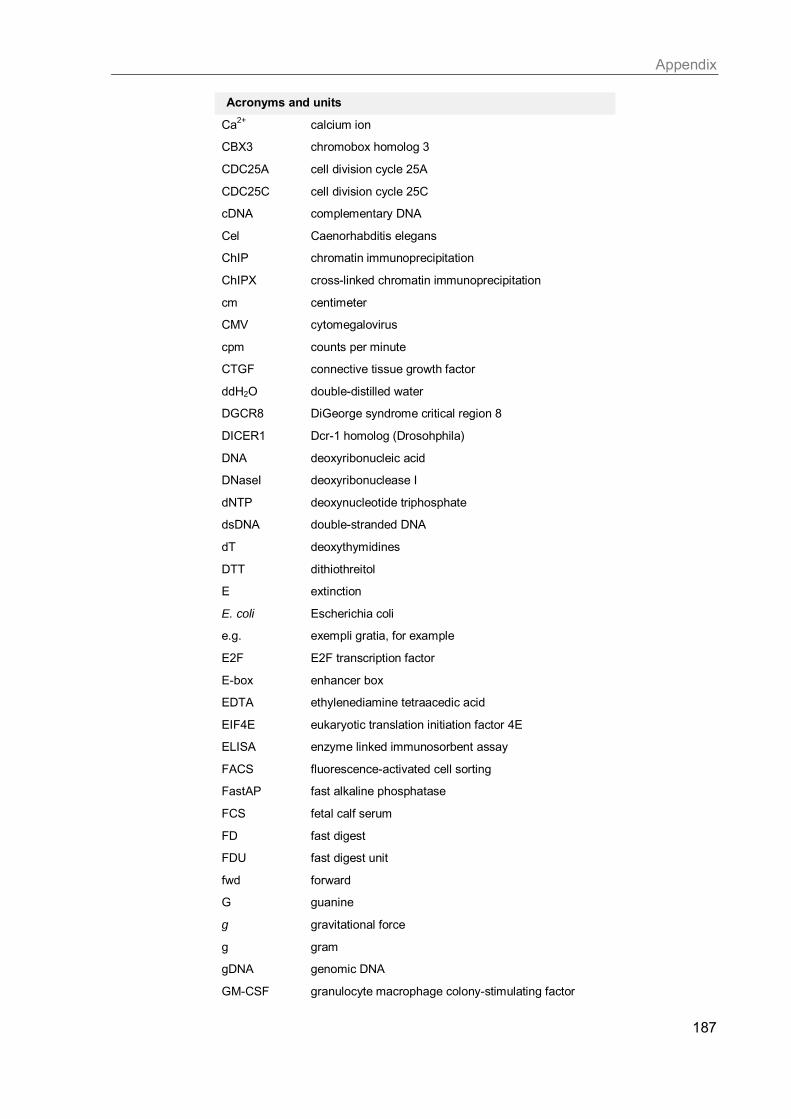
Appendix
187
Acronyms and units
Ca2+
calcium ion
CBX3 chromobox homolog 3
CDC25A cell division cycle 25A
CDC25C cell division cycle 25C
cDNA complementary DNA
Cel Caenorhabditis elegans
ChIP chromatin immunoprecipitation
ChIPX cross-linked chromatin immunoprecipitation
cm centimeter
CMV cytomegalovirus
cpm counts per minute
CTGF connective tissue growth factor
ddH2O double-distilled water
DGCR8 DiGeorge syndrome critical region 8
DICER1 Dcr-1 homolog (Drosohphila)
DNA deoxyribonucleic acid
DNaseI deoxyribonuclease I
dNTP deoxynucleotide triphosphate
dsDNA double-stranded DNA
dT deoxythymidines
DTT dithiothreitol
E extinction
E. coli Escherichia coli
e.g. exempli gratia, for example
E2F E2F transcription factor
E-box enhancer box
EDTA ethylenediamine tetraacedic acid
EIF4E eukaryotic translation initiation factor 4E
ELISA enzyme linked immunosorbent assay
FACS fluorescence-activated cell sorting
FastAP fast alkaline phosphatase
FCS fetal calf serum
FD fast digest
FDU fast digest unit
fwd forward
G guanine
g gravitational force
g gram
gDNA genomic DNA
GM-CSF granulocyte macrophage colony-stimulating factor

Appendix
188
Acronyms and units
G-phase gap phase
GTP guanosine triphosphate
h hour
H3 histone 3
H3S10 histone 3 serine 10
HCV hepatitis C virus
HeLa Henrietta Lacks
HEPES 4-(2-hydroxyethyl)-1-piperazineethanesulfonic acid
HP1G heterochromatin protein 1 gamma
HRP horse-radish peroxidase
hsa homo sapiens
HSP90 heat shock protein 90
Hz hertz
i.p. intraperitoneal
i.t. intratumoral
i.v. intravenous
IgG immunoglobulin G
IL interleukin
IMDM Iscove’s Modified Dulbecco Medium
kb (=kbp) kilo base pair
kDa kilo Dalton
kHz kilo hertz
KRAS Kirsten rat sarcoma viral oncogene homolog
l length
L liter
LAV lentivirus-associated vector
LB lysogeny broth
let-7a lethal-7a
LNA locked nucleic acid
LPS lipopolysaccharide
luc luciferase
M molar
m meter
mA milliampere
mAB monoclonal antibody
MAX MYC-associated factor X
mC 2’-oxymethyl cytosine
Mg2+
magnesium ion
min minute
miRISC miRNA-induced silencing complex

Appendix
189
Acronyms and units
miRNA microRNA
mL milliliter
mM millimolar
mm millimeter
M-MuLV RT moloney murine leukemia virus reverse transcriptase
MOPS 3-(N-morpholino)propanesulfonic acid
M-phase mitosis phase
mRNA messenger RNA
msec millisecond
mU 2’-oxymethyl uracil
MuLV murine leukemia virus
MYC v-myc myelocytomatosis viral oncogene homolog
N Newton
N/P ratio nitrogen per nucleic acid phosphate ratio
NCBI National Center for Biotechnology Information
ncRNA non-coding RNA
ng nanogram
nm nanometer
NP-40 nonyl phenoxypolyethoxylethanol
nt nucleotide
OD optical density
OD576 optical density at 576 nm
OH hydroxyl
P21 cyclin-dependent kinase inhibitor 1A (CDKN1A, P21)
P27 cyclin-dependent kinase inhibitor 1B (CDKN1B, P27)
PAGE polyacrylamide gel electrophoresis
PBS phosphate buffered saline
PCR polymerase chain reaction
PEI polyethylenimine
PEI F25 LMW polyethylenimine F25 low molecular weight
PIM proviral integration site of murine leukemia virus
pmol picomol
PMSF phenylmethylsulfonyl fluoride
PO phosphodiester
POLR2 RNA polymerase II
PP2A protein phosphatase 2A
pre-B-cell progenitor B-cell
pre-miRNA precursor miRNA
pri-miRNA primary miRNA
pRNA product RNA

Appendix
190
Acronyms and units
PS phosphorothioate
PTEN phosphatase and tensin homolog
PVDF polyvinylidine fluoride
qPCR quantitative real time PCR
QT quantitative
RAN Ras-related nuclear protein
rev reverse
RISC RNA-induced silencing complex
RNA ribonucleic acid
RNAi RNA interference
RNase ribonuclease
RNaseP ribonuclease P
rpm rounds per minute
RPMI Roswell Park Memorial Institute
RT reverse transcriptase
RT room temperature
S serin
s.c. subcutaneous
SDS sodiumdodecylsulfate
SDS PAGE sodiumdodecylsulfate polyacrylamide gel
electrophoresis
sec second
SGOT serum glutamic oxaloacetic transaminase
SGPT serum glutamic pyruvate transaminase
Si3N4 trisilicon tetranitride
siRNA small interfering RNA
SNP single nucleotide polymorphism
SOCS suppressor of cytokine signaling
S-phase synthesis phase
ssDNA single-stranded DNA
STAT signal transducer and activator of transcription
SV40 simian vacuolating virus 40
T thymine
T4 PNK T4 polynucleotide kinase
TBE Tris-HCl, borate, EDTA
TBST Tris-HCl-buffered-saline-Tween 20
TEMED tetramethylethylenediamine
TGFB tissue growth factor beta
TNFα tumor necrosis factor alpha
TP53 tumor protein 53

Appendix
191
Acronyms and units
TSP1 thrombospondin-1
TU transcription unit
U uracil
U unit
UTR untranslated region
UV ultraviolet
V voltage
v/v volume per volume %
VR1 vanilloid receptor 1
w/v mass per volume %
WST-1 water soluble tetrazolium salt-1
XCB xylene cyanol blue
XPO5 Exportin-5

Appendix
192
F. Gene nomenclature
Gene nomenclature was applied according to the guidelines provided by the HUGO Gene
Nomenclature Committee (HGNC) at http://www.genenames.org/guidelines.html (259). Gene
symbols are italicized and all letters are in upper case. CDNA and mRNA use the gene
symbol and formatting conventions. Protein designations are the same as the gene symbol,
but using only upper case letters.
Abbreviation gene symbol, cDNA, mRNA, protein
ABCA1 ATP-binding cassette transporter A1
AGO1-4 argonaute RISC catalytic component 1-4
AURKB aurora kinase B
BAD BCL-2 associated agonist of cell death
BCL2 B-cell lymphoma 2
BCL2L11 BCL2-like apoptosis facilitator
C13orf25 chromosome 13 open reading frame 25
CBX3 chromobox homolog 3
CDC25A cell division cycle 25A
CDC25C cell division cycle 25C
CTGF connective tissue growth factor
DGCR8 DiGeorge syndrome critical region 8
DICER1 Dcr1-homolog (Drosophila)
E2F 1-3 E3F transcription facto 1-3r
EIF4E eukaryotic translation initiation factor 4E
GM-CSF granulocyte macrophage colony-stimulating factor
HP1G heterochromatin protein 1 gamma
HSP90 heat shock protein 90
KRAS Kirsten rat sarcoma viral oncogene homolog
MAX MYC-associated factor X
MYC v-myc myelocytomatosis viral oncogene homolog
P21 cyclin-dependent kinase inhibitor (CDKN1A, P21)
P27 cyclin-dependent kinase inhibitor (CDKN1B, P27)
PIM1-3 proviral integration site of murine leukemia virus 1-3
POLR2 RNA polymerase II
PP2A protein phosphatase 2A
PTEN phosphatase and tensin homolog
RAN Ras-related nuclear protein
SOCS suppressor of cytokine signaling

Appendix
193
Abbreviation gene symbol, cDNA, mRNA, protein
STAT 3/5 signal transducer and activator of transcription 3/5
TGFB tissue growth factor beta
TP53 tumor protein 53
TSP1 thrombospondin-1
XPO5 Exportin-5

Appendix
194
G. List of figures
FIGURE 1: FORMATION OF A MALIGNANT NEOPLASM .................................................................................................. 1
FIGURE 2: SELECTION BENEFIT OF CANCER CELLS .................................................................................................... 2
FIGURE 3: BIOGENESIS OF MIRNAS ....................................................................................................................... 5
FIGURE 4: MODIFICATIONS OF ANTIMIRS ................................................................................................................10
FIGURE 5: DESIGN OF MIRNA-BASED THERAPEUTICS ..............................................................................................12
FIGURE 6: REGULATORY NETWORK OF PIM1 ..........................................................................................................15
FIGURE 7: REGULATORY NETWORK OF THE HUMAN MIR-17-92 CLUSTER .....................................................................17
FIGURE 8: GOAL OF THE PROJECT ........................................................................................................................19
FIGURE 9: PCMV6-XL4 PIM1 CDNA ...................................................................................................................40
FIGURE 10: PGL3 CONTROL REPORTER VECTOR AND ITS DERIVATIVES .......................................................................41
FIGURE 11: HUMAN PIM1 IS A TARGET OF MIR-33A ................................................................................................70
FIGURE 12: MIR-33A-SPECIFIC REGULATION OF PIM1 EXPRESSION ...........................................................................71
FIGURE 13: LONG-TERM EFFECTS OF PIM1 KNOCKDOWN BY THE MIR-33A MIMIC .........................................................72
FIGURE 14: ANTITUMOR EFFECTS OF SYSTEMIC PEI/MIR-33A TREATMENT IN LS174T TUMOR XENOGRAFTS ....................73
FIGURE 15: LNA ANTISEEDS (PO) AS MIRNA INHIBITORS .........................................................................................76
FIGURE 16: SPECIFIC INHIBITORY EFFECTS OF LNA ANTISEEDS (PO) AGAINST THE MIR-106B FAMILY .............................77
FIGURE 17: FUNCTIONAL DELIVERY OF PEI/LNA ANTISEED (PO) NANOPARTICLES .......................................................78
FIGURE 18: MYC-DEPENDENT INTRONIC TRANSCRIPTIONAL ACTIVITY OF THE HUMAN C13ORF25 LOCUS ..........................81
FIGURE 19: CHIP ANALYSIS OF THE FUNCTIONAL MYC BINDING SITE IN THE INTRONIC REGION OF C13ORF25 ...................82
FIGURE 20: TRANSCRIPTIONAL ACTIVITY OF THE HUMAN MIR-17-92 CLUSTER AFTER RNAI-MEDIATED KNOCKDOWN OF
REGULATORY PROTEINS ......................................................................................................................83

Appendix
195
H. List of tables
TABLE 1: PRIMERS FOR RNA ANALYSES ................................................................................................................22
TABLE 2: PRIMERS FOR CDNA GENERATION OF MIRNAS .........................................................................................22
TABLE 3: PRIMERS FOR QPCR OF MIRNAS ...........................................................................................................23
TABLE 4: SIRNAS .............................................................................................................................................24
TABLE 5: MIRNA MIMICS ....................................................................................................................................25
TABLE 6: MIRIDIAN HAIRPIN INHIBITORS ...............................................................................................................25
TABLE 7: LNA MIRNA INHIBITORS ........................................................................................................................26
TABLE 8: PRIMARY ANTIBODIES ............................................................................................................................27
TABLE 9: SECONDARY ANTIBODIES .......................................................................................................................27
TABLE 10: SIZE MARKERS ...................................................................................................................................27
TABLE 11: COMPOSITION OF 15 % SDS PAGE GELS ..............................................................................................34
TABLE 12: SEPARATION RANGE OF AGAROSE GELS ..................................................................................................45
TABLE 13: SIZE FRAGMENTATION IN PAGE ............................................................................................................46
TABLE 14: PHOSPHORYLATION OF DNA OLIGONUCLEOTIDES ....................................................................................50
TABLE 15: DEPHOSPHORYLATION OF DNA ............................................................................................................50
TABLE 16: RESTRICTION ENZYMES .......................................................................................................................51
TABLE 17: RESTRICTION DIGEST ..........................................................................................................................51
TABLE 18: LIGATION REACTION ............................................................................................................................52
TABLE 19: REVERSE TRANSCRIPTION ....................................................................................................................53
TABLE 20: REACTION MIXTURE GDNA ...................................................................................................................54
TABLE 21: AMPLIFICATION GDNA .........................................................................................................................54
TABLE 22: REACTION MIXTURE MUTAGENESIS PCR .................................................................................................55
TABLE 23: AMPLIFICATION MUTAGENESIS PCR .......................................................................................................55
TABLE 24: QUANTITATIVE REAL-TIME PCR ............................................................................................................56
TABLE 25: AMPLIFICATION QPCR OF MRNAS ........................................................................................................56
TABLE 26: AMPLIFICATION QPCR OF MIRNAS ........................................................................................................56
TABLE 27: PRIMERS FOR CHIP ASSAY ...................................................................................................................59
TABLE 28: DNASEI DIGESTION .............................................................................................................................61
TABLE 29: OLIGONUCLEOTIDES FOR 5’-END LABELING ..............................................................................................62
TABLE 30: RADIOLABELING MIXTURE .....................................................................................................................62

Appendix
196
I. List of equations
EQUATION 1: LAW OF LAMBERT-BEER ...................................................................................................................44
EQUATION 2: CONCENTRATION OF NUCLEIC ACIDS ...................................................................................................44
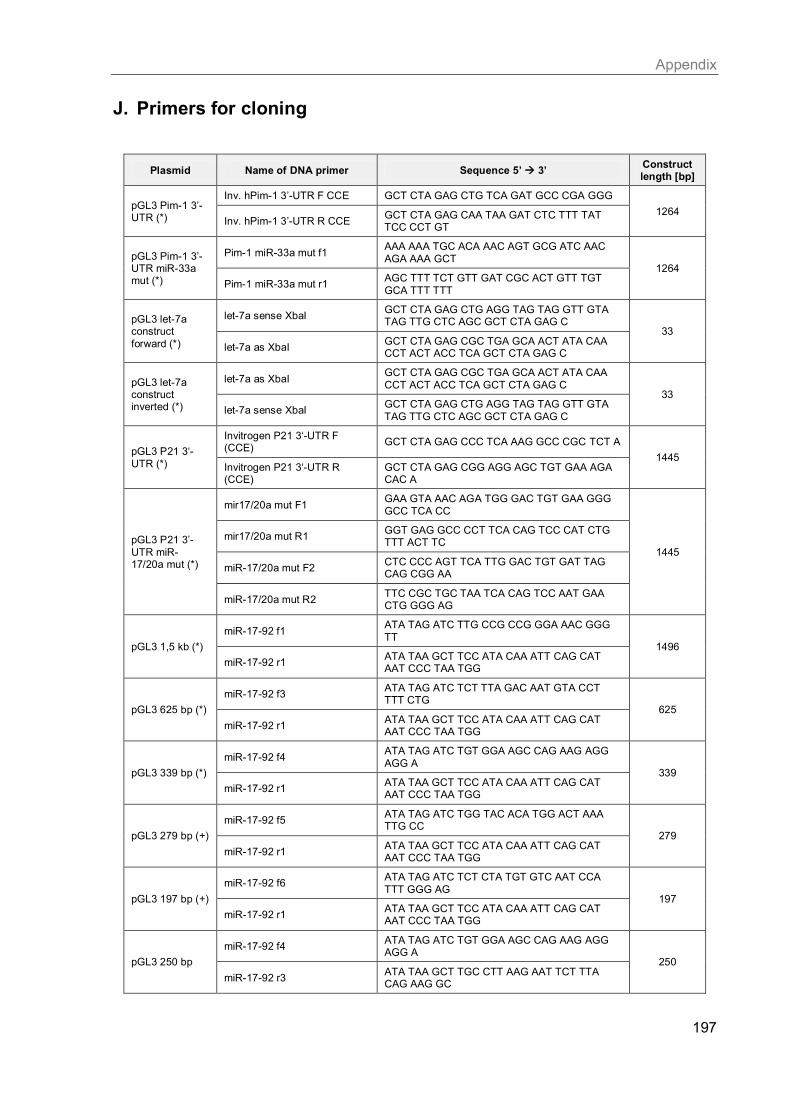
Appendix
197
J. Primers for cloning
Plasmid Name of DNA primer Sequence 5’ 3’ Construct length [bp]
pGL3 Pim-1 3’-UTR (*)
Inv. hPim-1 3’-UTR F CCE GCT CTA GAG CTG TCA GAT GCC CGA GGG
1264 Inv. hPim-1 3’-UTR R CCE
GCT CTA GAG CAA TAA GAT CTC TTT TAT TCC CCT GT
pGL3 Pim-1 3’-UTR miR-33a mut (*)
Pim-1 miR-33a mut f1 AAA AAA TGC ACA AAC AGT GCG ATC AAC
AGA AAA GCT 1264
Pim-1 miR-33a mut r1 AGC TTT TCT GTT GAT CGC ACT GTT TGT
GCA TTT TTT
pGL3 let-7a construct
forward (*)
let-7a sense XbaI GCT CTA GAG CTG AGG TAG TAG GTT GTA TAG TTG CTC AGC GCT CTA GAG C
33
let-7a as XbaI GCT CTA GAG CGC TGA GCA ACT ATA CAA CCT ACT ACC TCA GCT CTA GAG C
pGL3 let-7a construct inverted (*)
let-7a as XbaI GCT CTA GAG CGC TGA GCA ACT ATA CAA
CCT ACT ACC TCA GCT CTA GAG C 33
let-7a sense XbaI GCT CTA GAG CTG AGG TAG TAG GTT GTA
TAG TTG CTC AGC GCT CTA GAG C
pGL3 P21 3‘-
UTR (*)
Invitrogen P21 3‘-UTR F (CCE)
GCT CTA GAG CCC TCA AAG GCC CGC TCT A
1445 Invitrogen P21 3‘-UTR R (CCE)
GCT CTA GAG CGG AGG AGC TGT GAA AGA CAC A
pGL3 P21 3’-
UTR miR-17/20a mut (*)
mir17/20a mut F1 GAA GTA AAC AGA TGG GAC TGT GAA GGG
GCC TCA CC
1445
mir17/20a mut R1 GGT GAG GCC CCT TCA CAG TCC CAT CTG TTT ACT TC
miR-17/20a mut F2 CTC CCC AGT TCA TTG GAC TGT GAT TAG CAG CGG AA
miR-17/20a mut R2 TTC CGC TGC TAA TCA CAG TCC AAT GAA CTG GGG AG
pGL3 1,5 kb (*)
miR-17-92 f1 ATA TAG ATC TTG CCG CCG GGA AAC GGG
TT 1496
miR-17-92 r1 ATA TAA GCT TCC ATA CAA ATT CAG CAT AAT CCC TAA TGG
pGL3 625 bp (*)
miR-17-92 f3 ATA TAG ATC TCT TTA GAC AAT GTA CCT TTT CTG
625
miR-17-92 r1 ATA TAA GCT TCC ATA CAA ATT CAG CAT AAT CCC TAA TGG
pGL3 339 bp (*)
miR-17-92 f4 ATA TAG ATC TGT GGA AGC CAG AAG AGG
AGG A 339
miR-17-92 r1 ATA TAA GCT TCC ATA CAA ATT CAG CAT AAT CCC TAA TGG
pGL3 279 bp (+)
miR-17-92 f5 ATA TAG ATC TGG TAC ACA TGG ACT AAA TTG CC
279
miR-17-92 r1 ATA TAA GCT TCC ATA CAA ATT CAG CAT AAT CCC TAA TGG
pGL3 197 bp (+)
miR-17-92 f6 ATA TAG ATC TCT CTA TGT GTC AAT CCA
TTT GGG AG 197
miR-17-92 r1 ATA TAA GCT TCC ATA CAA ATT CAG CAT AAT CCC TAA TGG
pGL3 250 bp
miR-17-92 f4 ATA TAG ATC TGT GGA AGC CAG AAG AGG AGG A
250
miR-17-92 r3 ATA TAA GCT TGC CTT AAG AAT TCT TTA CAG AAG GC
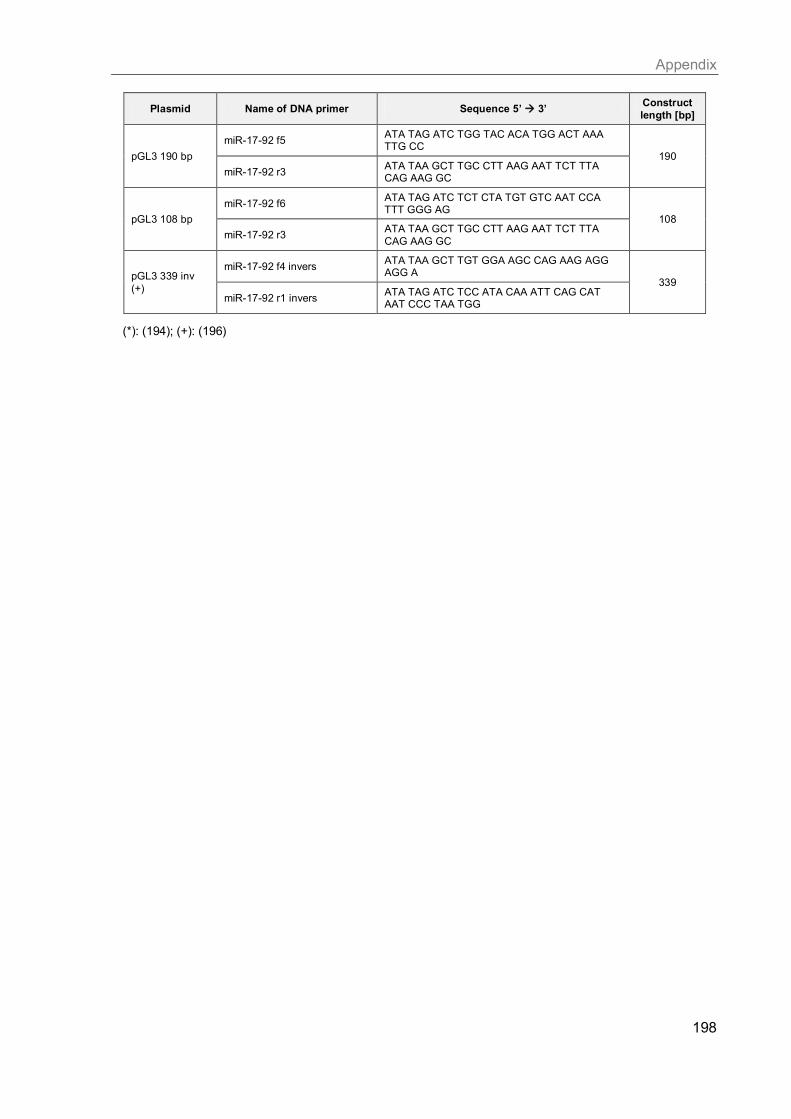
Appendix
198
Plasmid Name of DNA primer Sequence 5’ 3’ Construct
length [bp]
pGL3 190 bp
miR-17-92 f5 ATA TAG ATC TGG TAC ACA TGG ACT AAA TTG CC
190
miR-17-92 r3 ATA TAA GCT TGC CTT AAG AAT TCT TTA CAG AAG GC
pGL3 108 bp
miR-17-92 f6 ATA TAG ATC TCT CTA TGT GTC AAT CCA TTT GGG AG
108
miR-17-92 r3 ATA TAA GCT TGC CTT AAG AAT TCT TTA
CAG AAG GC
pGL3 339 inv
(+)
miR-17-92 f4 invers ATA TAA GCT TGT GGA AGC CAG AAG AGG AGG A
339
miR-17-92 r1 invers ATA TAG ATC TCC ATA CAA ATT CAG CAT AAT CCC TAA TGG
(*): (194); (+): (196)

Appendix
199
K. Primers for sequencing
Plasmid Name of DNA primer Sequence 5’ 3’
cDNA clone variants
OriGene
VP 1,5 seq GGA CTT TCC AAA ATG TCG
XL 39 seq ATT AGG ACA AGG CTG GTG GG
Pim-1 3rd TCT CCA AAA ATC TGC CTG GGT T
pGL3 Pim-1 3’-UTR
variants
Pim-1 3rd TCT CCA AAA ATC TGC CTG GGT T
Inv. hPim-1 3’-UTR R
CCE
GCT CTA GAG CAA TAA GAT CTC TTT
TAT TCC CCT GT
pGL3 let-7a variants pGL3 ctr let7 01 TCG CCA GTC AAG TAA CAA CC
pGL3 P21 3’-UTR
variants
P21 3’-UTR 3rd TCC TCT AAG GTT GGG CAG G
Invitrogen P21 3‘-UTR
R (CCE)
GCT CTA GAG CGG AGG AGC TGT GAA
AGA CAC A
pGL3 1,5 kb variants
miR-17-92 f1 ATA TAG ATC TTG CCG CCG GGA AAC
GGG TT
miR-17-92 r1 ATA TAA GCT TCC ATA CAA ATT CAG
CAT AAT CCC TAA TGG
RVprimer3 CTA GCA AAA TAG GCT GTC CC
seq miR-Promo 2F TGG TGA AGA ATA GTC TGT GGG C
pGL3 625 bp
RVprimer3 CTA GCA AAA TAG GCT GTC CC
miR-17-92 r1 ATA TAA GCT TCC ATA CAA ATT CAG
CAT AAT CCC TAA TGG
pGL3 339 bp
RVprimer3 CTA GCA AAA TAG GCT GTC CC
miR-17-92 r1 ATA TAA GCT TCC ATA CAA ATT CAG
CAT AAT CCC TAA TGG
pGL3 279 bp RVprimer3 CTA GCA AAA TAG GCT GTC CC
pGL3 339 inv
RVprimer3 CTA GCA AAA TAG GCT GTC CC
miR-17-92 r1 ATA TAA GCT TCC ATA CAA ATT CAG
CAT AAT CCC TAA TGG

Appendix
200
L. MiRNA sequences
miRNA name miRBase Release 19.0
accession number sequence 5’ 3’
hsa-miR-15a-5p MIMAT0000068 UAG CAG CAC AUA AUG GUU UGU G
hsa-miR-16-5p MIMAT0000069 UAG CAG CAC GUA AAU AUU GGC G
hsa-miR-17-5p MIMAT0000070 CAA AGU GCU UAC AGU GCA GGU AG
hsa-miR-20a-5p MIMAT0000075 UAA AGU GCU UAU AGU GCA GGU AG
hsa-miR-24-3p MIMAT0000080 UGG CUC AGU UCA GCA GGA ACA G
hsa-miR-26a-5p MIMAT0000082 UUC AAG UAA UCC AGG AUA GGC U
hsa-miR-33a-5p MIMAT0000091 GUG CAU UGU AGU UGC AUU GCA
hsa-miR-33b-5p MIMAT0003301 GUG CAU UGC UGU UGC AUU GC
hsa-miR-144-3p MIMAT0000436 UAC AGU AUA GAU GAU GUA CU
hsa-miR-374a-5p MIMAT0000727 UUA UAA UAC AAC CUG AUA AGU G
hsa-miR-423-5p MIMAT0004748 UGA GGG GCA GAG AGC GAG ACU UU

Appendix
201
M. Equipment
Device Manufacturer
Agarose gel chamber PerfectBlue Gel System Mini S/M, PEQLAB Biotechnology GMBH
Autoclave V 95, Systec
Automatic weighing machine Sartorius
DENVER Instruments
Blotting equipment Trans-Blot® SD Semi-Dry Transfer cell, Bio-Rad
Cell culture dishes SARSTEDT
Cell culture plates Cellstar®, greiner-bio-one
Centrifuges Biofuge pico, Fresco 17, HERAUS
5810R, Eppendorf
Cryo pure tubes SARSTEDT
Cuvettes Gene Pulser Cuvette, 4mm, Bio-Rad
Detection films Kodak
Electroporation system Gene Pulser Xcell, Bio-Rad
Gel documentation Gerix 1000, Biostep
GS-800 Calibrated Densitometer, Bio-Rad
Hand monitor LB 1210 B, Berthold
Heating block TB1, Biometra
Hemocytometer Neubauer bright-line, MarienFeld
Hybridization oven OV3, Biometra
Imager cassettes Bas cassette 4043, Fuji Film
Incubator BE 400, Memmert
NuAire, Memmert
Luminescence detector Safire2™ micro plate reader, Tecan
Magnetic stirrer Heidolph Instruments GmbH and Co
Micro plate reader Safire2™ micro plate reader, Tecan
Microscope AE20, Motic
Microwave oven 8020 E, Privileg
Pasteur pipette SARSTEDT
Petri dishes SARSTEDT
pH-meter inoLab, SENTON
Phosphorimager Fuji FLA-3000 R; Fuji Film
Pipet boy Pipetboy acu, IBS
Pipettes ABiMED (0.1 – 2 µL; 2 – 20 µL; 20 – 200 µL; 100 – 1000 µL)
Polyacrylamide gel chamber custom-made, University of Lübeck
Power supply Power N Pac 3000, Bio-Rad
PVDF membrane Immobilon™-P, Millipore
Quartz cuvette 104-QS, 10 mm; Hellma

Appendix
202
Device Manufacturer
Real time PCR system LightCycler®2.0, Roche
MyiQ™5 Real-Time PCR Detection System, Bio-Rad
Rotor wheel LMOM1203, Kobe
Safety cabinet HERAsafe KS, Thermo Scientific
Scintillation analyzer 1900 CA TRI-CARB® Liquid Scintillation Analyzer, Perkin Elmer
SDS-PAGE equipment Mini Protean® 3 Cell, Bio-Rad
Serological pipettes SARSTEDT
Shaking incubator 3033, GFL
Sonifier Branson 250, Heinemann
Spectral photometer Biomate 3, Thermo Scientific
Spin columns illustra Micro-Spin G-25, GE Healthcare Life Sciences
Thermocycler TGradient, Biometra
Thermomixer 5436, Eppendorf
Tips SARSTEDT
Tubes SARSTEDT
Vortexer 7-2020, NeoLab
Water bath water bath with polycarbonate basin, NeoLab
Whatman filter Thick Blot Paper, Bio-Rad

Appendix
203
N. Chemicals
Chemical Manufacturer
2-mercaptoethanol Merck
Acetic acid Roth
Acrylamide/bisacrylamide (48:2) for PAA gels Roth
Acrylamide/bisacrylamide 30 % for SDS gels Gerbu
Agar agar Serva
Agarose GTQ Roth
Ammonium acetate Roth
APS Roth
Ammonium thiocyanate Roth
Ampicillin Roth
Aqua-phenol Roth
Boric acid Roth
Bromophenol blue Merck
Calcium chloride Roth
Chloroform Merck
Crystal violet Merck
Deoxycholate Roth
Deoxynucleosidtriphosphates Thermo Fisher Scientific
DTT Gerbu
Ethanol Roth
EDTA Gerbu
FCS PAA
Formaldehyde Roth
Formamide Gerbu
Glycerol (99,5 %) Gerbu
Glycine Roth
Guanidinium thiocyanate Roth
HEPES Gerbu
Hydrochloric acid Roth
IMDM cell culture medium PAA
Isopropanol Roth
Lithium chloride Roth
Magnesium chloride Roth,
Thermo Fisher Scientific
Magnesium sulfate Roth,
Thermo Fisher Scientific
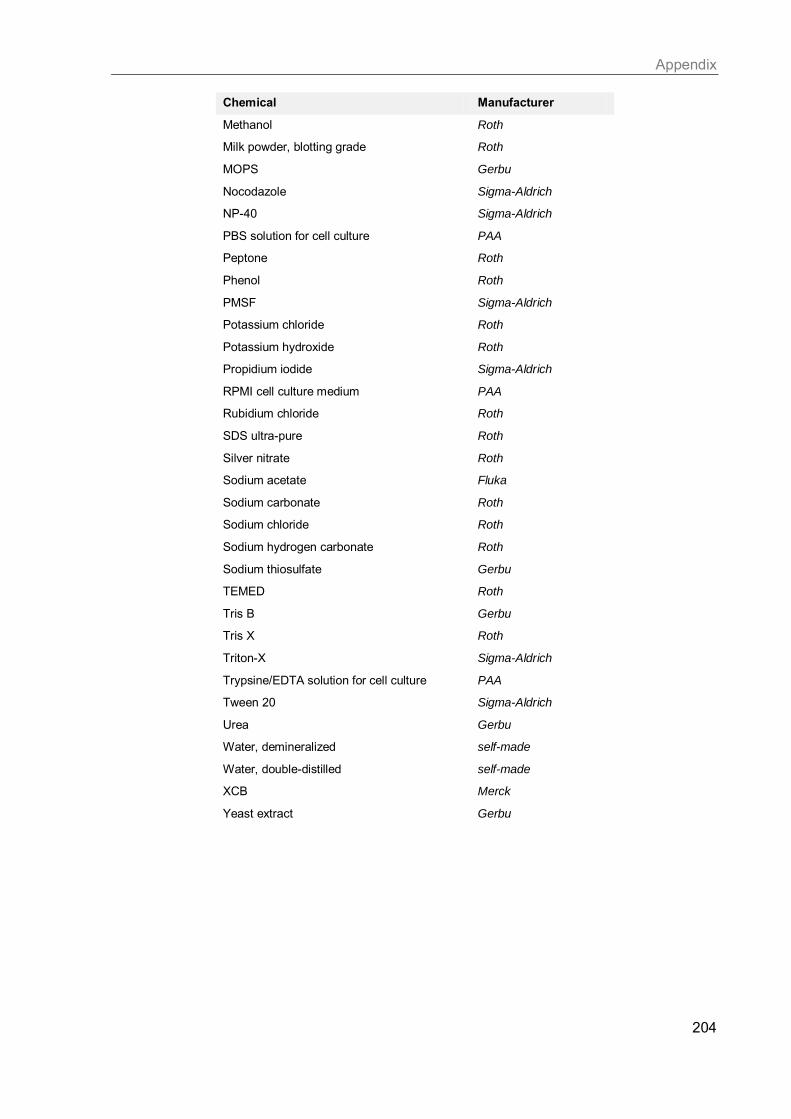
Appendix
204
Chemical Manufacturer
Methanol Roth
Milk powder, blotting grade Roth
MOPS Gerbu
Nocodazole Sigma-Aldrich
NP-40 Sigma-Aldrich
PBS solution for cell culture PAA
Peptone Roth
Phenol Roth
PMSF Sigma-Aldrich
Potassium chloride Roth
Potassium hydroxide Roth
Propidium iodide Sigma-Aldrich
RPMI cell culture medium PAA
Rubidium chloride Roth
SDS ultra-pure Roth
Silver nitrate Roth
Sodium acetate Fluka
Sodium carbonate Roth
Sodium chloride Roth
Sodium hydrogen carbonate Roth
Sodium thiosulfate Gerbu
TEMED Roth
Tris B Gerbu
Tris X Roth
Triton-X Sigma-Aldrich
Trypsine/EDTA solution for cell culture PAA
Tween 20 Sigma-Aldrich
Urea Gerbu
Water, demineralized self-made
Water, double-distilled self-made
XCB Merck
Yeast extract Gerbu

Appendix
205
O. Enzymes, Kits and Reagents
Enzyme, kit, reagent Purpose Manufacturer
Absolute qPCR SYBR Green Mix quantitative PCR Thermo Fisher Scientific
Amersham ECL™/ECL plus™
Western Blotting Detection Reagent Western Blot GE Healthcare Life Sciences
Cell Death Detection ELISA apoptosis assay Roche Applied Biosciences
Cell proliferation reagent WST-1 proliferation assay Roche
cOmplete Mini Protease Inhibitor Cocktail protease inhibition Roche
DNaseI, RNase-free DNA digestion Thermo Fisher Scientific
DNeasy® Blood & Tissue Kit genomic DNA purification Quiagen
Ethidiumbromide for agarose gels (0.025 %) nucleic acid staining Roth
Ethidiumbromide for PAA gels (0.5 %) nucleic acid staining Roth
FastAP Thermosensitive Alkaline
Phosphatase dephosphorylation reaction Thermo Fisher Scientific
FastDigest enzyme BglII restriction digest Thermo Fisher Scientific
FastDigest enzyme BlpI restriction digest Thermo Fisher Scientific
FastDigest enzyme HindIII restriction digest Thermo Fisher Scientific
FastDigest enzyme XbaI restriction digest Thermo Fisher Scientific
GBX Developer and Replenisher Western Blot detection Kodak®
GBX Fixer and Replenisher Western Blot detection Kodak®
GeneJet™ Plasmid Miniprep Kit plasmid Miniprep Thermo Fisher Scientific
Lipofectamine™ 2000 transfection of mammalian cells Invitrogen™ Life Technologies
Luciferase Assay System luciferase assay Promega
mirVana™ miRNA Isolation Kit miRNA isolation Ambion Life Technologies
NucleoBond® PC 500 purification kit plasmid Maxiprep Macherey-Nagel
Optimem I transfection of mammalian cells Invitrogen™ Life Technologies
PANSORBIN® Staph A cells anti-IgG reagent for ChIP assay Calbiochem/Merck
PEI F25 LMW transfection of mammalian cells custom-made, Sigma-Aldrich
Pfu DNA polymerase amplification of DNA Thermo Fisher Scientific
Proteinase K protein digestion Thermo Fisher Scientific
RevertAid H Minus First Strand cDNA
Synthesis Kit cDNA generation Thermo Fisher Scientific
RNase A RNA digestion Thermo Fisher Scientific
SYBR® gold nucleic acid staining Invitrogen™ Life Technologies
T4 DNA ligase ligation reaction Thermo Fisher Scientific
T4 polynucleotide kinase phosphorylation reaction Thermo Fisher Scientific
Taq DNA polymerase amplification of DNA Thermo Fisher Scientific
Wizard®SV Gel and PCR Clean-Up System
agarose gel extraction, PCR
purification Promega

Appendix
206
P. Vector sequence pCMV-XL4 (OriGene)

Nucleotide Sequence of pCMV6-XL4 GenBank Accession Number: AF067196 AACAAAATAT TAACGCTTAC AATTTCCATT CGCCATTCAG GCTGCGCAAC
TGTTGGGAAG GGCGATCGGT GCGGGCCTCT TCGCTATTAC GCCAGCTGGC
GAAAGGGGGA TGTGCTGCAA GGCGATTAAG TTGGGTAACG CCAGGGTTTT
CCCAGTCACG ACGTTGTAAA ACGACGGCCA GTGCCAAGCT GATCTATACA
TTGAATCAAT ATTGGCAATT AGCCATATTA GTCATTGGTT ATATAGCATA
AATCAATATT GGCTATTGGC CATTGCATAC GTTGTATCTA TATCATAATA
TGTACATTTA TATTGGCTCA TGTCCAATAT GACCGCCATG TTGACATTGA
TTATTGACTA GTTATTAATA GTAATCAATT ACGGGGTCAT TAGTTCATAG
CCCATATATG GAGTTCCGCG TTACATAACT TACGGTAAAT GGCCCGCCTG
GCTGACCGCC CAACGACCCC CGCCCATTGA CGTCAATAAT GACGTATGTT
CCCATAGTAA CGCCAATAGG GACTTTCCAT TGACGTCAAT GGGTGGAGTA
TTTACGGTAA ACTGCCCACT TGGCAGTACA TCAAGTGTAT CATATGCCAA
GTCCGCCCCC TATTGACGTC AATGACGGTA AATGGCCCGC CTGGCATTAT
GCCCAGTACA TGACCTTACG GGACTTTCCT ACTTGGCAGT ACATCTACGT
ATTAGTCATC GCTATTACCA TGGTGATGCG GTTTTGGCAG TACACCAATG
GGCGTGGATA GCGGTTTGAC TCACGGGGAT TTCCAAGTCT CCACCCCATT
GACGTCAATG GGAGTTTGTT TTGGCACCAA AATCAACGGG ACTTTCCAAA
ATGTCGTAAT AACCCCGCCC CGTTGACGCA AATGGGCGGT AGGCGTGTAC
GGTGGGAGGT CTATATAAGC AGAGCTCGTT TAGTGAACCG TCAGAATTTT
GTAATACGAC TCACTATAGG GCGGCCGCGA ATTCAGATCT GGTACCGATA
TCAAGCTTGT CGACTCTAGA TTGCGGCCGC GGTCATAGCT GTTTCCTGAA
CAGATCC CGGGTGGCAT CCCTGTGACC CCTCCCCAGT GCCTCTCCTG
GCCCTGGAAG TTGCCACTCC AGTGCCCACC AGCCTTGTCC TAATAAAATT
AAGTTGCATC ATTTTGTCTG ACTAGGTGTC CTTCTATAAT ATTATGGGGT
GGAGGGGGGT GGTATGGAGC AAGGGGCAAG TTGGGAAGAC AACCTGTAGG
GCCTGCGGGG TCTATTGGGA ACCAAGCTGG AGTGCAGTGG CACAATCTTG
GCTCACTGCA ATCTCCGCCT CCTGGGTTCA AGCGATTCTC CTGCCTCAGC
CTCCCGAGTT GTTGGGATTC CAGGCATGCA TGACCAGGCT CAGCTAATTT
TTGTTTTTTT GGTAGAGACG GGGTTTCACC ATATTGGCCA GGCTGGTCTC
CAACTCCTAA TCTCAGGTGA TCTACCCACC TTGGCCTCCC AAATTGCTGG
GATTACAGGC GTGAACCACT GCTCCCTTCC CTGTCCTTCT GATTTTAAAA
TAACTATACC AGCAGGAGGA CGTCCAGACA CAGCATAGGC TACCTGGCCA
TGCCCAACCG GTGGGACATT TGAGTTGCTT GCTTGGCACT GTCCTCTCAT
GCGTTGGGTC CACTCAGTAG ATGCCTGTTG AATTGGGTAC GCGGCCAGCT
TGGCTGTGGA ATGTGTGTCA GTTAGGGTGT GGAAAGTCCC CAGGCTCCCC
AGCAGGCAGA AGTATGCAAA GCATGCATCT CAATTAGTCA GCAACCAGGT
GTGGAAAGTC CCCAGGCTCC CCAGCAGGCA GAAGTATGCA AAGCATGCAT
CTCAATTAGT CAGCAACCAT AGTCCCGCCC CTAACTCCGC CCATCCCGCC
CCTAACTCCG CCCAGTTCCG CCCATTCTCC GCCCCATGGC TGACTAATTT
TTTTTATTTA TGCAGAGGCC GAGGCCGCCT CGGCCTCTGA GCTATTCCAG
AAGTAGTGAG GAGGCTTTTT TGGAGGCCTA GGCTTTTGCA AAAAGCTCCT
CGAGGAACTG AAAAACCAGA AAGTTAATTC CCTATAGTGA GTCGTATTAA
ATTCGTAATC ATGTCATAGC TGTTTCCTGT GTGAAATTGT TATCCGCTCA
CAATTCCACA CAACATACGA GCCGGAAGCA TAAAGTGTAA AGCCTGGGGT
GCCTAATGAG TGAGCTAACT CACATTAATT GCGTTGCGCT CACTGCCCGC
TTTCCAGTCG GGAAACCTGT CGTGCCAGCT GCATTAATGA ATCGGCCAAC
GCGCGGGGAG AGGCGGTTTG CGTATTGGGC GCTCTTCCGC TTCCTCGCTC
ACTGACTCGC TGCGCTCGGT CGTTCGGCTG CGGCGAGCGG TATCAGCTCA
CTCAAAGGCG GTAATACGGT TATCCACAGA ATCAGGGGAT AACGCAGGAA
AGAACATGTG AGCAAAAGGC CAGCAAAAGG CCAGGAACCG TAAAAAGGCC
GCGTTGCTGG CGTTTTTCCA TAGGCTCCGC CCCCCTGACG AGCATCACAA
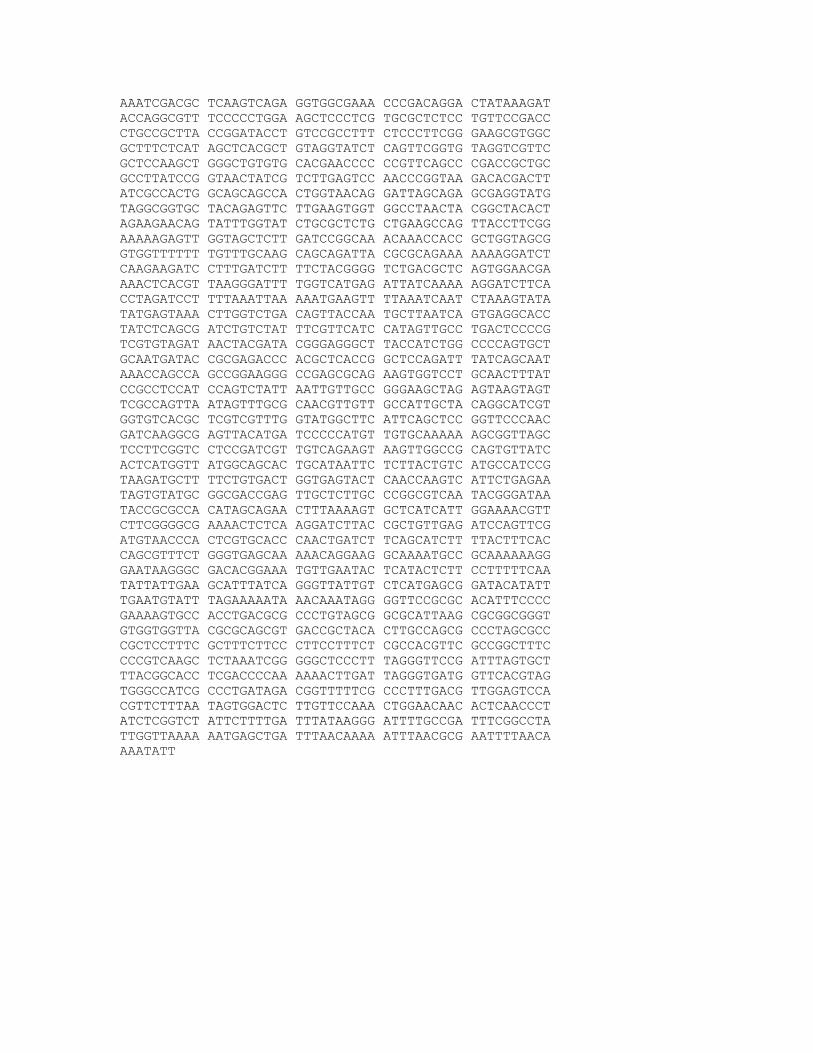
AAATCGACGC TCAAGTCAGA GGTGGCGAAA CCCGACAGGA CTATAAAGAT
ACCAGGCGTT TCCCCCTGGA AGCTCCCTCG TGCGCTCTCC TGTTCCGACC
CTGCCGCTTA CCGGATACCT GTCCGCCTTT CTCCCTTCGG GAAGCGTGGC
GCTTTCTCAT AGCTCACGCT GTAGGTATCT CAGTTCGGTG TAGGTCGTTC
GCTCCAAGCT GGGCTGTGTG CACGAACCCC CCGTTCAGCC CGACCGCTGC
GCCTTATCCG GTAACTATCG TCTTGAGTCC AACCCGGTAA GACACGACTT
ATCGCCACTG GCAGCAGCCA CTGGTAACAG GATTAGCAGA GCGAGGTATG
TAGGCGGTGC TACAGAGTTC TTGAAGTGGT GGCCTAACTA CGGCTACACT
AGAAGAACAG TATTTGGTAT CTGCGCTCTG CTGAAGCCAG TTACCTTCGG
AAAAAGAGTT GGTAGCTCTT GATCCGGCAA ACAAACCACC GCTGGTAGCG
GTGGTTTTTT TGTTTGCAAG CAGCAGATTA CGCGCAGAAA AAAAGGATCT
CAAGAAGATC CTTTGATCTT TTCTACGGGG TCTGACGCTC AGTGGAACGA
AAACTCACGT TAAGGGATTT TGGTCATGAG ATTATCAAAA AGGATCTTCA
CCTAGATCCT TTTAAATTAA AAATGAAGTT TTAAATCAAT CTAAAGTATA
TATGAGTAAA CTTGGTCTGA CAGTTACCAA TGCTTAATCA GTGAGGCACC
TATCTCAGCG ATCTGTCTAT TTCGTTCATC CATAGTTGCC TGACTCCCCG
TCGTGTAGAT AACTACGATA CGGGAGGGCT TACCATCTGG CCCCAGTGCT
GCAATGATAC CGCGAGACCC ACGCTCACCG GCTCCAGATT TATCAGCAAT
AAACCAGCCA GCCGGAAGGG CCGAGCGCAG AAGTGGTCCT GCAACTTTAT
CCGCCTCCAT CCAGTCTATT AATTGTTGCC GGGAAGCTAG AGTAAGTAGT
TCGCCAGTTA ATAGTTTGCG CAACGTTGTT GCCATTGCTA CAGGCATCGT
GGTGTCACGC TCGTCGTTTG GTATGGCTTC ATTCAGCTCC GGTTCCCAAC
GATCAAGGCG AGTTACATGA TCCCCCATGT TGTGCAAAAA AGCGGTTAGC
TCCTTCGGTC CTCCGATCGT TGTCAGAAGT AAGTTGGCCG CAGTGTTATC
ACTCATGGTT ATGGCAGCAC TGCATAATTC TCTTACTGTC ATGCCATCCG
TAAGATGCTT TTCTGTGACT GGTGAGTACT CAACCAAGTC ATTCTGAGAA
TAGTGTATGC GGCGACCGAG TTGCTCTTGC CCGGCGTCAA TACGGGATAA
TACCGCGCCA CATAGCAGAA CTTTAAAAGT GCTCATCATT GGAAAACGTT
CTTCGGGGCG AAAACTCTCA AGGATCTTAC CGCTGTTGAG ATCCAGTTCG
ATGTAACCCA CTCGTGCACC CAACTGATCT TCAGCATCTT TTACTTTCAC
CAGCGTTTCT GGGTGAGCAA AAACAGGAAG GCAAAATGCC GCAAAAAAGG
GAATAAGGGC GACACGGAAA TGTTGAATAC TCATACTCTT CCTTTTTCAA
TATTATTGAA GCATTTATCA GGGTTATTGT CTCATGAGCG GATACATATT
TGAATGTATT TAGAAAAATA AACAAATAGG GGTTCCGCGC ACATTTCCCC
GAAAAGTGCC ACCTGACGCG CCCTGTAGCG GCGCATTAAG CGCGGCGGGT
GTGGTGGTTA CGCGCAGCGT GACCGCTACA CTTGCCAGCG CCCTAGCGCC
CGCTCCTTTC GCTTTCTTCC CTTCCTTTCT CGCCACGTTC GCCGGCTTTC
CCCGTCAAGC TCTAAATCGG GGGCTCCCTT TAGGGTTCCG ATTTAGTGCT
TTACGGCACC TCGACCCCAA AAAACTTGAT TAGGGTGATG GTTCACGTAG
TGGGCCATCG CCCTGATAGA CGGTTTTTCG CCCTTTGACG TTGGAGTCCA
CGTTCTTTAA TAGTGGACTC TTGTTCCAAA CTGGAACAAC ACTCAACCCT
ATCTCGGTCT ATTCTTTTGA TTTATAAGGG ATTTTGCCGA TTTCGGCCTA
TTGGTTAAAA AATGAGCTGA TTTAACAAAA ATTTAACGCG AATTTTAACA
AAATATT

Appendix
209
Q. Vector sequence pGL3 control (Promega)
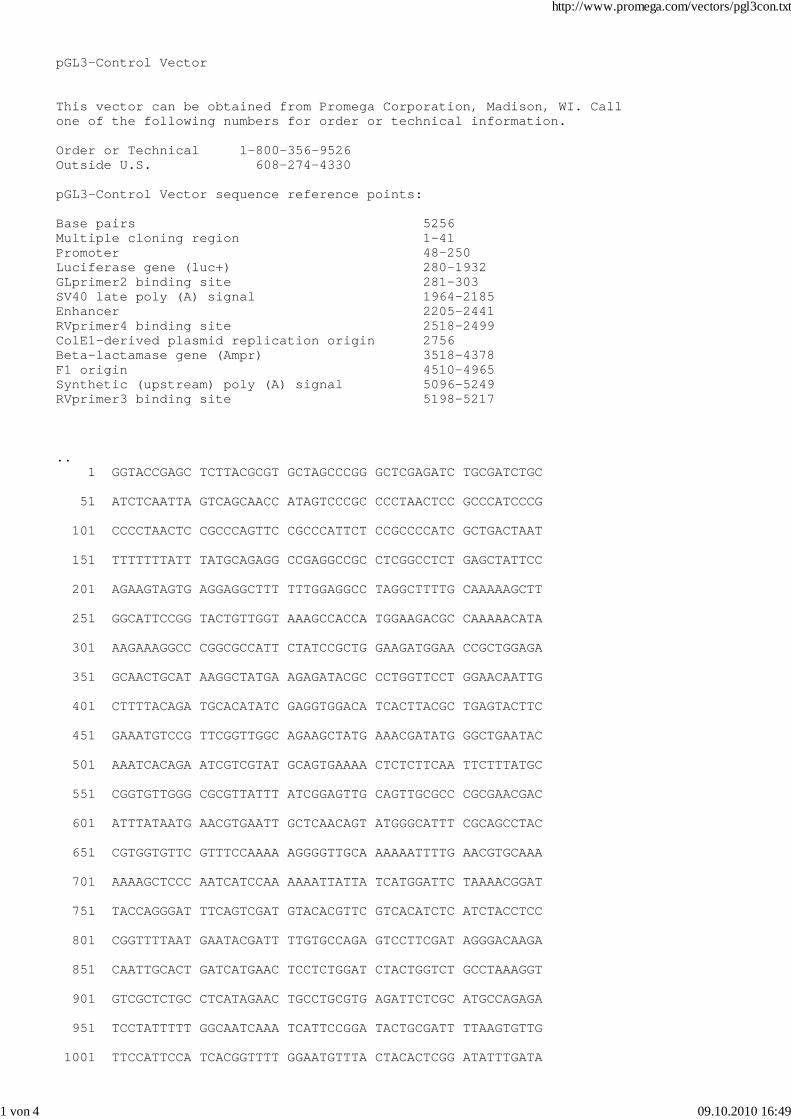
pGL3-Control Vector
This vector can be obtained from Promega Corporation, Madison, WI. Call one of the following numbers for order or technical information.
Order or Technical 1-800-356-9526Outside U.S. 608-274-4330
pGL3-Control Vector sequence reference points:
Base pairs 5256Multiple cloning region 1-41Promoter 48-250Luciferase gene (luc+) 280-1932GLprimer2 binding site 281-303SV40 late poly (A) signal 1964-2185Enhancer 2205-2441RVprimer4 binding site 2518-2499ColE1-derived plasmid replication origin 2756Beta-lactamase gene (Ampr) 3518-4378F1 origin 4510-4965Synthetic (upstream) poly (A) signal 5096-5249RVprimer3 binding site 5198-5217
.. 1 GGTACCGAGC TCTTACGCGT GCTAGCCCGG GCTCGAGATC TGCGATCTGC
51 ATCTCAATTA GTCAGCAACC ATAGTCCCGC CCCTAACTCC GCCCATCCCG
101 CCCCTAACTC CGCCCAGTTC CGCCCATTCT CCGCCCCATC GCTGACTAAT
151 TTTTTTTATT TATGCAGAGG CCGAGGCCGC CTCGGCCTCT GAGCTATTCC
201 AGAAGTAGTG AGGAGGCTTT TTTGGAGGCC TAGGCTTTTG CAAAAAGCTT
251 GGCATTCCGG TACTGTTGGT AAAGCCACCA TGGAAGACGC CAAAAACATA
301 AAGAAAGGCC CGGCGCCATT CTATCCGCTG GAAGATGGAA CCGCTGGAGA
351 GCAACTGCAT AAGGCTATGA AGAGATACGC CCTGGTTCCT GGAACAATTG
401 CTTTTACAGA TGCACATATC GAGGTGGACA TCACTTACGC TGAGTACTTC
451 GAAATGTCCG TTCGGTTGGC AGAAGCTATG AAACGATATG GGCTGAATAC
501 AAATCACAGA ATCGTCGTAT GCAGTGAAAA CTCTCTTCAA TTCTTTATGC
551 CGGTGTTGGG CGCGTTATTT ATCGGAGTTG CAGTTGCGCC CGCGAACGAC
601 ATTTATAATG AACGTGAATT GCTCAACAGT ATGGGCATTT CGCAGCCTAC
651 CGTGGTGTTC GTTTCCAAAA AGGGGTTGCA AAAAATTTTG AACGTGCAAA
701 AAAAGCTCCC AATCATCCAA AAAATTATTA TCATGGATTC TAAAACGGAT
751 TACCAGGGAT TTCAGTCGAT GTACACGTTC GTCACATCTC ATCTACCTCC
801 CGGTTTTAAT GAATACGATT TTGTGCCAGA GTCCTTCGAT AGGGACAAGA
851 CAATTGCACT GATCATGAAC TCCTCTGGAT CTACTGGTCT GCCTAAAGGT
901 GTCGCTCTGC CTCATAGAAC TGCCTGCGTG AGATTCTCGC ATGCCAGAGA
951 TCCTATTTTT GGCAATCAAA TCATTCCGGA TACTGCGATT TTAAGTGTTG
1001 TTCCATTCCA TCACGGTTTT GGAATGTTTA CTACACTCGG ATATTTGATA
http://www.promega.com/vectors/pgl3con.txt
1 von 4 09.10.2010 16:49

1051 TGTGGATTTC GAGTCGTCTT AATGTATAGA TTTGAAGAAG AGCTGTTTCT
1101 GAGGAGCCTT CAGGATTACA AGATTCAAAG TGCGCTGCTG GTGCCAACCC
1151 TATTCTCCTT CTTCGCCAAA AGCACTCTGA TTGACAAATA CGATTTATCT
1201 AATTTACACG AAATTGCTTC TGGTGGCGCT CCCCTCTCTA AGGAAGTCGG
1251 GGAAGCGGTT GCCAAGAGGT TCCATCTGCC AGGTATCAGG CAAGGATATG
1301 GGCTCACTGA GACTACATCA GCTATTCTGA TTACACCCGA GGGGGATGAT
1351 AAACCGGGCG CGGTCGGTAA AGTTGTTCCA TTTTTTGAAG CGAAGGTTGT
1401 GGATCTGGAT ACCGGGAAAA CGCTGGGCGT TAATCAAAGA GGCGAACTGT
1451 GTGTGAGAGG TCCTATGATT ATGTCCGGTT ATGTAAACAA TCCGGAAGCG
1501 ACCAACGCCT TGATTGACAA GGATGGATGG CTACATTCTG GAGACATAGC
1551 TTACTGGGAC GAAGACGAAC ACTTCTTCAT CGTTGACCGC CTGAAGTCTC
1601 TGATTAAGTA CAAAGGCTAT CAGGTGGCTC CCGCTGAATT GGAATCCATC
1651 TTGCTCCAAC ACCCCAACAT CTTCGACGCA GGTGTCGCAG GTCTTCCCGA
1701 CGATGACGCC GGTGAACTTC CCGCCGCCGT TGTTGTTTTG GAGCACGGAA
1751 AGACGATGAC GGAAAAAGAG ATCGTGGATT ACGTCGCCAG TCAAGTAACA
1801 ACCGCGAAAA AGTTGCGCGG AGGAGTTGTG TTTGTGGACG AAGTACCGAA
1851 AGGTCTTACC GGAAAACTCG ACGCAAGAAA AATCAGAGAG ATCCTCATAA
1901 AGGCCAAGAA GGGCGGAAAG ATCGCCGTGT AATTCTAGAG TCGGGGCGGC
1951 CGGCCGCTTC GAGCAGACAT GATAAGATAC ATTGATGAGT TTGGACAAAC
2001 CACAACTAGA ATGCAGTGAA AAAAATGCTT TATTTGTGAA ATTTGTGATG
2051 CTATTGCTTT ATTTGTAACC ATTATAAGCT GCAATAAACA AGTTAACAAC
2101 AACAATTGCA TTCATTTTAT GTTTCAGGTT CAGGGGGAGG TGTGGGAGGT
2151 TTTTTAAAGC AAGTAAAACC TCTACAAATG TGGTAAAATC GATAAGGATC
2201 TGAACGATGG AGCGGAGAAT GGGCGGAACT GGGCGGAGTT AGGGGCGGGA
2251 TGGGCGGAGT TAGGGGCGGG ACTATGGTTG CTGACTAATT GAGATGCATG
2301 CTTTGCATAC TTCTGCCTGC TGGGGAGCCT GGGGACTTTC CACACCTGGT
2351 TGCTGACTAA TTGAGATGCA TGCTTTGCAT ACTTCTGCCT GCTGGGGAGC
2401 CTGGGGACTT TCCACACCCT AACTGACACA CATTCCACAG CGGATCCGTC
2451 GACCGATGCC CTTGAGAGCC TTCAACCCAG TCAGCTCCTT CCGGTGGGCG
2501 CGGGGCATGA CTATCGTCGC CGCACTTATG ACTGTCTTCT TTATCATGCA
2551 ACTCGTAGGA CAGGTGCCGG CAGCGCTCTT CCGCTTCCTC GCTCACTGAC
2601 TCGCTGCGCT CGGTCGTTCG GCTGCGGCGA GCGGTATCAG CTCACTCAAA
2651 GGCGGTAATA CGGTTATCCA CAGAATCAGG GGATAACGCA GGAAAGAACA
2701 TGTGAGCAAA AGGCCAGCAA AAGGCCAGGA ACCGTAAAAA GGCCGCGTTG
http://www.promega.com/vectors/pgl3con.txt
2 von 4 09.10.2010 16:49
2751 CTGGCGTTTT TCCATAGGCT CCGCCCCCCT GACGAGCATC ACAAAAATCG
2801 ACGCTCAAGT CAGAGGTGGC GAAACCCGAC AGGACTATAA AGATACCAGG
2851 CGTTTCCCCC TGGAAGCTCC CTCGTGCGCT CTCCTGTTCC GACCCTGCCG
2901 CTTACCGGAT ACCTGTCCGC CTTTCTCCCT TCGGGAAGCG TGGCGCTTTC
2951 TCATAGCTCA CGCTGTAGGT ATCTCAGTTC GGTGTAGGTC GTTCGCTCCA
3001 AGCTGGGCTG TGTGCACGAA CCCCCCGTTC AGCCCGACCG CTGCGCCTTA
3051 TCCGGTAACT ATCGTCTTGA GTCCAACCCG GTAAGACACG ACTTATCGCC
3101 ACTGGCAGCA GCCACTGGTA ACAGGATTAG CAGAGCGAGG TATGTAGGCG
3151 GTGCTACAGA GTTCTTGAAG TGGTGGCCTA ACTACGGCTA CACTAGAAGA
3201 ACAGTATTTG GTATCTGCGC TCTGCTGAAG CCAGTTACCT TCGGAAAAAG
3251 AGTTGGTAGC TCTTGATCCG GCAAACAAAC CACCGCTGGT AGCGGTGGTT
3301 TTTTTGTTTG CAAGCAGCAG ATTACGCGCA GAAAAAAAGG ATCTCAAGAA
3351 GATCCTTTGA TCTTTTCTAC GGGGTCTGAC GCTCAGTGGA ACGAAAACTC
3401 ACGTTAAGGG ATTTTGGTCA TGAGATTATC AAAAAGGATC TTCACCTAGA
3451 TCCTTTTAAA TTAAAAATGA AGTTTTAAAT CAATCTAAAG TATATATGAG
3501 TAAACTTGGT CTGACAGTTA CCAATGCTTA ATCAGTGAGG CACCTATCTC
3551 AGCGATCTGT CTATTTCGTT CATCCATAGT TGCCTGACTC CCCGTCGTGT
3601 AGATAACTAC GATACGGGAG GGCTTACCAT CTGGCCCCAG TGCTGCAATG
3651 ATACCGCGAG ACCCACGCTC ACCGGCTCCA GATTTATCAG CAATAAACCA
3701 GCCAGCCGGA AGGGCCGAGC GCAGAAGTGG TCCTGCAACT TTATCCGCCT
3751 CCATCCAGTC TATTAATTGT TGCCGGGAAG CTAGAGTAAG TAGTTCGCCA
3801 GTTAATAGTT TGCGCAACGT TGTTGCCATT GCTACAGGCA TCGTGGTGTC
3851 ACGCTCGTCG TTTGGTATGG CTTCATTCAG CTCCGGTTCC CAACGATCAA
3901 GGCGAGTTAC ATGATCCCCC ATGTTGTGCA AAAAAGCGGT TAGCTCCTTC
3951 GGTCCTCCGA TCGTTGTCAG AAGTAAGTTG GCCGCAGTGT TATCACTCAT
4001 GGTTATGGCA GCACTGCATA ATTCTCTTAC TGTCATGCCA TCCGTAAGAT
4051 GCTTTTCTGT GACTGGTGAG TACTCAACCA AGTCATTCTG AGAATAGTGT
4101 ATGCGGCGAC CGAGTTGCTC TTGCCCGGCG TCAATACGGG ATAATACCGC
4151 GCCACATAGC AGAACTTTAA AAGTGCTCAT CATTGGAAAA CGTTCTTCGG
4201 GGCGAAAACT CTCAAGGATC TTACCGCTGT TGAGATCCAG TTCGATGTAA
4251 CCCACTCGTG CACCCAACTG ATCTTCAGCA TCTTTTACTT TCACCAGCGT
4301 TTCTGGGTGA GCAAAAACAG GAAGGCAAAA TGCCGCAAAA AAGGGAATAA
4351 GGGCGACACG GAAATGTTGA ATACTCATAC TCTTCCTTTT TCAATATTAT
4401 TGAAGCATTT ATCAGGGTTA TTGTCTCATG AGCGGATACA TATTTGAATG
4451 TATTTAGAAA AATAAACAAA TAGGGGTTCC GCGCACATTT CCCCGAAAAG
http://www.promega.com/vectors/pgl3con.txt
3 von 4 09.10.2010 16:49

4501 TGCCACCTGA CGCGCCCTGT AGCGGCGCAT TAAGCGCGGC GGGTGTGGTG
4551 GTTACGCGCA GCGTGACCGC TACACTTGCC AGCGCCCTAG CGCCCGCTCC
4601 TTTCGCTTTC TTCCCTTCCT TTCTCGCCAC GTTCGCCGGC TTTCCCCGTC
4651 AAGCTCTAAA TCGGGGGCTC CCTTTAGGGT TCCGATTTAG TGCTTTACGG
4701 CACCTCGACC CCAAAAAACT TGATTAGGGT GATGGTTCAC GTAGTGGGCC
4751 ATCGCCCTGA TAGACGGTTT TTCGCCCTTT GACGTTGGAG TCCACGTTCT
4801 TTAATAGTGG ACTCTTGTTC CAAACTGGAA CAACACTCAA CCCTATCTCG
4851 GTCTATTCTT TTGATTTATA AGGGATTTTG CCGATTTCGG CCTATTGGTT
4901 AAAAAATGAG CTGATTTAAC AAAAATTTAA CGCGAATTTT AACAAAATAT
4951 TAACGCTTAC AATTTGCCAT TCGCCATTCA GGCTGCGCAA CTGTTGGGAA
5001 GGGCGATCGG TGCGGGCCTC TTCGCTATTA CGCCAGCCCA AGCTACCATG
5051 ATAAGTAAGT AATATTAAGG TACGGGAGGT ACTTGGAGCG GCCGCAATAA
5101 AATATCTTTA TTTTCATTAC ATCTGTGTGT TGGTTTTTTG TGTGAATCGA
5151 TAGTACTAAC ATACGCTCTC CATCAAAACA AAACGAAACA AAACAAACTA
5201 GCAAAATAGG CTGTCCCCAG TGCAAGTGCA GGTGCCAGAA CATTTCTCTA
5251 TCGATA
Sequence revised 16-Apr-02.
http://www.promega.com/vectors/pgl3con.txt
4 von 4 09.10.2010 16:49

214
Acknowledgments
All good things must come to an end.
On that note, I would like to thank…
…above all…
… Prof. Dr. Roland K. Hartmann for affording me the opportunity to start my PhD, for being
addressable at all times to discuss any problems and for his excellent supervision during
the progress of my work,
… Prof. Dr. Jens Kurreck for his readiness to act as the second reviewer of my PhD thesis and
for great conversations at poster sessions,
… Prof. Dr. Carsten Culmsee for participating as chairperson in my examination committee,
… Prof. Dr. Maike Petersen for attending my examination committee,
…more grand persons…
… Dr. Arnold Grünweller for writing protocol during my exam, for one of the most interesting
research topics ever, for brilliant scientific discussions, for excellent co-supervision and for
great barbeques at his home,
… all colleagues of the ‘KMaren office’ - I shall treasure this memory and wish you all the very
best,
… Katja, Markus, Dominik, Arnold, Kerstin, Astrid, Karen, Philipp, Marcus, Katrin, Julia,
Dennis, Dennis and Tanja for supporting me in complicated affairs, for many fun and a
friendly atmosphere in the lab and for one or two beers after work,
… all former colleagues particularly Steffi for spending a glorious time,
… Prof. Dr. Achim Aigner and Ulrike for excellent discussions about science and for a very
fruitful cooperation,
…last but not least…
… Meike and Kari for critically reading my PhD thesis, for helpful comments and for enduring
friendship,
… Rina and Matt for sincere friendship and for correcting a lot of mistakes including bad
grammar,
… Gilla for always having a sympathetic ear and for believing in me,
… my families - I couldn’t have done it without you,
… Flo for encouraging me for all these years, for sympathizing with me even in the hard times
and for his infinite love.
215
Academic achievement
Publications
Thomas M, Lange-Grünweller K, Weirauch U, Gutsch D, Aigner A, Grünweller A and
Hartmann RK: The proto-oncogene Pim-1 is a target of miR-33a. Oncogene (2012), 31,
918-928
Ibrahim AF, Weirauch U, Thomas M, Grünweller A, Hartmann RK and Aigner A: MicroRNA
Replacement Therapy for miR-145 and miR-33a Is Efficacious in a Model of Colon
Carcinoma. Cancer Res (2011), 71, 5214-5224
Thomas M, Lange-Grünweller K, Dayyoub E, Bakowsky U, Weirauch U, Aigner A, Hartmann
RK and Grünweller A: PEI-complexed LNA antiseeds as miRNA inhibitors. RNA Biology
(2012), 9(8), 1088-1098
Weirauch U, Beckmann N, Thomas M, Grünweller A, Huber K, Bracher F, Hartmann RK and
Aigner A: Functional role and therapeutic potential of the Pim-1 kinase in colon
carcinoma. Neoplasia, status: accepted
Thomas M, Lange-Grünweller K, Hartmann D, Golde L, Schlereth J, Aigner A, Grünweller A
and Hartmann RK: Pim-1 Dependent Transcriptional Regulation of the Human miR-17-
92 Cluster. Manuscript in preparation
Oral presentations
10th NordForsk Meeting, 2011, Stockholm, Sweden: The proto-oncogene Pim-1 is a target
of miR-33a.
EMBO Workshop ‘The reciprocal interactions of signaling pathways and non-coding RNA’,
2012, Ascona, Schweiz: PEI-complexed LNA antiseeds as miRNA inhibitors.

Academic achievement
216
Poster presentations
6th Meeting of the GBM study section 'RNA-Biochemistry' in cooperation with the GEN AG2
‘Regulatory RNA’ of the German Genetics Society, 2010, Hohenwart, Germany: Repression
of the proto-oncogene Pim-1 by miR-33a
7th Meeting of the GBM study section ‘RNA-Biochemistry’ in cooperation with the GEN AG2
‘Regulatory RNA’ of the German Genetics Society, 2012, Bonn, Germany: PEI-complexed
LNA antiseeds as miRNA inhibitors, poster award of the RNA society

217
Curriculum Vitae
Personal Details
Name Thomas
First name Maren
Date of Birth April 04th, 1984
Place of Birth Freudenberg/Westfalen
Nationality German
Email address [email protected]
Education
Since
September
2009
Ph.D. studies, Institute of Pharmaceutical Chemistry, Philipps-Universität Marburg
06/2009 medical license as pharmacist; Approbation
2004-2009 Studies in pharmacy (Staatsexamen), Philipps-Universität Marburg
Ph.D thesis
Title RNAi-based anti-cancer strategies – targeting the proto-oncogene PIM1 and
oncogenic miRNAs
Supervisor Prof. Dr. Roland K. Hartmann (Philipps-Universität Marburg)
Experience
Field of interest Molecular biology, RNA biochemistry, immunology, pharmacology, toxicology
Teaching Supervision of undergraduate lab courses; supervision of undergraduates in
scientific work (master thesis)
Working as a side job (2009-2012): pharmacist (Schloss Apotheke Siegen)
Scientific skills and methods
Molecular
biology
Work with genetically modified organisms (bacteria and eukaryotic cell lines);
isolation, cultivation and differentiation of primary cells; transient transfection
methods; standard DNA techniques (preparation/modification); cloning; PCR; RT-
PCR; quantitative real-time PCR

Curriculum Vitae
218
RNA methods RNA isolation; in vitro transcription; RNAi-mediated protein knockdown
Protein
methods
Recombinant/native protein expression and purification using affinity, gel filtration or
FPLC based chromatography, Western blotting; ELISA; immunoprecipitation
Scientific achievements
Poster
presentations
7th Meeting of the GBM study section ‘RNA-Biochemistry’ in cooperation with the
GEN AG2 ‘Regulatory RNA’ of the German Genetics Society, 2012, Bonn,
Germany: PEI-complexed LNA antiseeds as miRNA inhibitors, poster award of
the RNA society
6th Meeting of the GBM study section 'RNA-Biochemistry' in cooperation with the
GEN AG2 ‘Regulatory RNA’ of the German Genetics Society, 2010, Hohenwart,
Germany: Repression of the proto-oncogene Pim-1 by miR-33a
Oral
presentations
EMBO Workshop ‘The reciprocal interactions of signaling pathways and non-coding
RNA’, 2012, Ascona, Schweiz: PEI-complexed LNA antiseeds as miRNA
inhibitors
10th NordForsk Meeting, 2011, Stockholm, Sweden: The proto-oncogene Pim-1 is
a target of miR-33a
Publications Thomas M, Lange-Grünweller K, Weirauch U, Gutsch D, Aigner A, Grünweller A
and Hartmann RK: The proto-oncogene Pim-1 is a target of miR-33a. Oncogene
(2012), 31, 918-928
Ibrahim AF, Weirauch U, Thomas M, Grünweller A, Hartmann RK and Aigner A:
MicroRNA Replacement Therapy for miR-145 and miR-33a Is Efficacious in a Model
of Colon Carcinoma. Cancer Res (2011), 71, 5214-5224
Thomas M, Lange-Grünweller K, Dayyoub E, Bakowsky U, Weirauch U, Aigner A,
Hartmann RK and Grünweller A: PEI-complexed LNA antiseeds as miRNA
inhibitors. RNA Biology (2012), 9(8), 1088-1098
Weirauch U, Beckmann N, Thomas M, Grünweller A, Huber K, Bracher F,
Hartmann RK and Aigner A: Functional role and therapeutic potential of the Pim-1
kinase in colon carcinoma. Neoplasia, status: accepted
Languages
German Native
English Very good; ongoing experience in reading English literature, giving talks and writing
proposals
French School education for three years

219
Declaration/Erklärung
Hiermit versichere ich, dass die vorgelegte Dissertation
“RNAi-based anti-cancer strategies -
targeting the proto-oncogene PIM1 and oncogenic miRNAs”
von mir selbstständig und ohne unerlaubte Hilfe angefertigt wurde und ich mich keiner
anderen als der von mir ausdrücklich bezeichneten Quellen und Hilfen bedient habe.
Die Dissertation wurde in der jetzigen oder in ähnlicher Form noch an keiner anderen
Hochschule eingereicht und hat noch keinen sonstigen Prüfungszwecken gedient.
Marburg, 12. März 2013
Maren Thomas