rivm rapport 609021044 health-based guideline values for
TRANSCRIPT
Contact: Mrs. A. Dusseldorp Centre for Inspection Research, Emergency Response and Drinking Water
e-mail: [email protected]
This study was commissioned by the Inspectorate of the Netherlands Ministry of Housing, Spatial Planning and the Environment, for projects M/609021 (Response to issues raised by the Main Inspectorate), M/500012 (Health and environment programme) and V/609026 (Medical environmental studies) RIVM, P.O. Box 1, 3720 BA Bilthoven, the Netherlands, tel +31 30 2749111, fax +31 30 274 2971
RIVM report 609021044/2007 Health-based guideline values for the indoor environment A. Dusseldorp, M. van Bruggen, J. Douwes, P.J.C.M. Janssen, G. Kelfkens
Page 2 of 97 RIVM report 609021044
Abstract Health-based guideline values for the indoor environment Exposure to chemicals, biological agents and physical factors, such as noise and radiation, can be harmful to human health. Health-based guidelines for indoor environments establish the tolerance levels of residential dwellers to these environmental stressors. The primary aim of the guidelines is to enable meaningful assessment of the indoor environment. The guidelines are intended for residential dwellings but could also be applied to public indoor environments, such as schools and offices. Although the guidelines are not laid down by law, they provide the basis for future indoor environment policy. Keywords: health, dwellings, indoor environment, government guidelines.
RIVM report 609021044 Page 3 of 97
Rapport in het kort Gezondheidkundige advieswaarden binnenmilieu Chemische stoffen, biologische agentia en fysische factoren zoals geluid en straling kunnen de gezondheid schade toebrengen. Gezondheidkundige advieswaarden voor het binnenmilieu geven aan in hoeverre de bewoners deze agentia binnenshuis kunnen verdragen. Zij worden vooral gebruikt om de kwaliteit van het binnenmilieu te beoordelen. Deze gezondheidskundige advieswaarden kunnen niet alleen voor woningen worden gebruikt maar ook voor kantoren of scholen, plaatsen waar mensen langere tijd binnen verblijven. Zij hebben geen wettelijke status, maar kunnen wel helpen de kwaliteit van het binnenmilieu te verbeteren. Trefwoorden: gezondheid, woningen, binnenmilieu, advieswaarden

Page 4 of 97 RIVM report 609021044
Preface Framework This report was commissioned by the Inspectorate of the Netherlands Ministry of Health, Spatial Planning and the Environment (VROM). It refers to the action points defined in the Action Programme on Health and the Environment (Actieprogramma Gezondheid en Milieu) under the theme of health in buildings (VROM/VWS, 2002)1. The original report originates from 2004 and has been translated in 2007. The guideline values for chemical agents which were updated in 2007 (RIVM report 609021043) have been incorporated in this translation. Authors The primary authors of this report are Ir A. Dusseldorp and Drs M. van Bruggen. The other authors covered a range of specialist subjects: Biological agents: Dr J. Douwes, Centre for Public Health Research,
Massey University, Wellington, New Zealand Chemical agents: Ing P.J.C.M. Janssen, RIVM (SIR), Bilthoven Nonionising radiation: Dr G. Kelfkens, RIVM (LSO), Bilthoven The section on noise includes a contribution by Dr I. van Kamp (RIVM, MGO). Supervisory committee This project was supported by a committee including: Drs C.M. Alders, Astma Fonds, Leusden Ir A.P.M. Blom, VROM, DGM, The Hague Dr C.J.M. van den Bogaard, VROM Inspectorate, The Hague Drs F. Duijm, GGD Groningen, Groningen Mr E.A. Fontijn, SZW, A&G, The Hague C. Kuin, Vereniging Eigen Huis, Amersfoort Ir P.J van Luijk, VROM, DGW, The Hague Drs ing O.G. van Rijsbergen, Nederlandse Woonbond, Amsterdam Ir R. Slob, GGD Rotterdam, Rotterdam Dr M.E.J. van der Weiden, VWS, The Hague Considerations Available data During the course of the project we became aware of data for a wide range of agents. Unfortunately, this did not necessarily mean that a health-based guideline value could be derived for all agents. The supervisory committee would like to emphasise that the lack of a standard does not mean that these agents are less important. The committee also hopes that the data gathered for these agents, will remain available for future use. The scope of the project also meant that some issues were not considered although they are relevant to the indoor environment. Some of these issues which the supervisory committee is aware of include: the potential accumulation of fire
1 Actieprogramma Gezondheid en Milieu. Uitwerking van een beleidsversterking. Ministry of Housing, Spatial Planning and the Environment; Ministry of Health, Welfare and Sport, May 2002.
RIVM report 609021044 Page 5 of 97
retardants and pesticides in house dust, the effects of light, vermin, Legionella risk factors, and phthalates. Purpose of the guideline values Guideline values as such cannot bring about a better indoor environment. We have to consider how these values can be used in policies aiming to improve the indoor environment. The guideline values were defined as assessment levels for indoor air quality in dwellings. However, schools or offices could also be covered by the policies. The envisaged protection level requires special consideration. The guideline values in this report are based on the maximum permissible risk (MPR), previously defined for the Dutch environmental policies. During the course of this project the supervisory committee discussed whether in the current framework the negligible risk (NR) should be used instead, for substances without a threshold value. The negligible risk is 100 times lower than the maximum permissible risk. The authors felt that there were a number of reasons not to opt for this approach, such as: 1. The MPR has broadly the same basis as the air quality guidelines (AQG) of the
WHO, the chronic reference concentration of the US EPA, and the chronic minimal risk Level (MRL) of the US ATSDR.
2. The WHO AQGs provided an important reference when deriving the limit values in air.
3. The MPR is also the primary reference for other environmental risk assessments, such as those used to determine soil pollution intervention values.

Page 6 of 97 RIVM report 609021044
RIVM report 609021044 Page 7 of 97
Contents
Summary 9
1. Introduction 13
2. Chemicals 17 2.1. Products of combustion and classical air pollution components 18 2.2. Volatile and other organic compounds 18
2.2.1. Aromatic compounds 19 2.2.2. Aldehydes 19 2.2.3. Aliphatic compounds 19 2.2.4. Chlorinated aliphatic compounds 20 2.2.5. Chlorinated benzenes 20
2.3. Pesticides 20 2.4 Heavy metals 22 2.5 Asbestos and mineral fibres 23
2.5.1. Asbestos 23 2.5.2. Mineral fibres 23
2.6. References 24 3. Physical agents 25
3.1. Temperature 25 3.2. Damp 25 3.3. Noise 27 3.4. Radiation 28
3.3.1. Radon 28 3.3.2. Nonionising radiation (NIR) 28
3.5. References 31 4. Biological agents 33
4.1. Fungi 34 4.2 Fungal components 35
4.2.1 ß(1→3)-glucanes 35 4.2.2 Allergens 36 4.2.3 Mycotoxins 36 4.2.4 Volatile organic compounds 37
4.3 Bacteria 37 4.4 Bacterial components 38
4.4.1 Endotoxins 38 4.4.2 Peptidoglycans 39
4.5 House dust mite allergens 40 4.6 Pet and cockroach allergens 41 4.7. References 43
Page 8 of 97 RIVM report 609021044
5. Perceived air quality and ventilation 51 5.1. Perceived air quality 51 5.2. Ventilation 51 5.3. References 52
6. Other agents 55 6.1. Tobacco smoke 55 6.2 References 55
APPENDIX A: Justification of the health-based guideline values for chemicals 57
APPENDIX B: Pesticides - active ingredients of a range of products 71
APPENDIX C: Health effects of noise 73
APPENDIX D: Values used in other countries 75
APPENDIX E: Abbreviations 93
APPENDIX F: Derivation of the health-based guideline value for naphthalene 95
RIVM report 609021044 Page 9 of 97
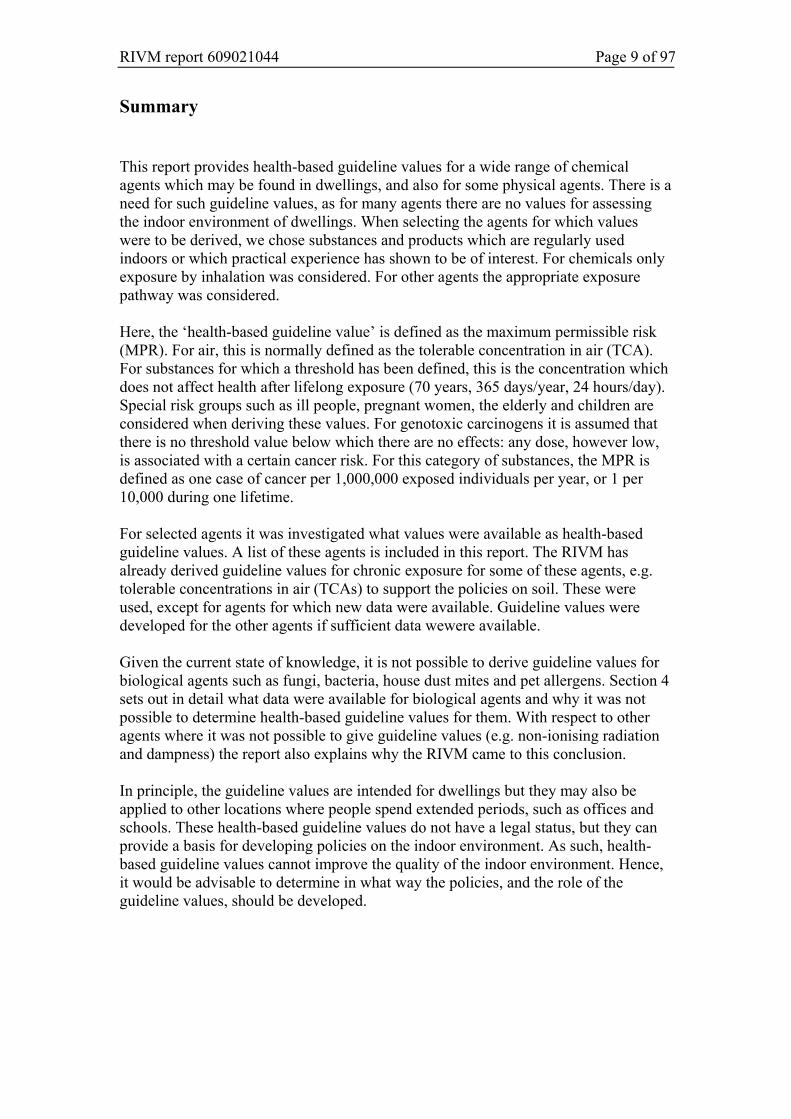
Summary This report provides health-based guideline values for a wide range of chemical agents which may be found in dwellings, and also for some physical agents. There is a need for such guideline values, as for many agents there are no values for assessing the indoor environment of dwellings. When selecting the agents for which values were to be derived, we chose substances and products which are regularly used indoors or which practical experience has shown to be of interest. For chemicals only exposure by inhalation was considered. For other agents the appropriate exposure pathway was considered. Here, the ‘health-based guideline value’ is defined as the maximum permissible risk (MPR). For air, this is normally defined as the tolerable concentration in air (TCA). For substances for which a threshold has been defined, this is the concentration which does not affect health after lifelong exposure (70 years, 365 days/year, 24 hours/day). Special risk groups such as ill people, pregnant women, the elderly and children are considered when deriving these values. For genotoxic carcinogens it is assumed that there is no threshold value below which there are no effects: any dose, however low, is associated with a certain cancer risk. For this category of substances, the MPR is defined as one case of cancer per 1,000,000 exposed individuals per year, or 1 per 10,000 during one lifetime. For selected agents it was investigated what values were available as health-based guideline values. A list of these agents is included in this report. The RIVM has already derived guideline values for chronic exposure for some of these agents, e.g. tolerable concentrations in air (TCAs) to support the policies on soil. These were used, except for agents for which new data were available. Guideline values were developed for the other agents if sufficient data wewere available. Given the current state of knowledge, it is not possible to derive guideline values for biological agents such as fungi, bacteria, house dust mites and pet allergens. Section 4 sets out in detail what data were available for biological agents and why it was not possible to determine health-based guideline values for them. With respect to other agents where it was not possible to give guideline values (e.g. non-ionising radiation and dampness) the report also explains why the RIVM came to this conclusion. In principle, the guideline values are intended for dwellings but they may also be applied to other locations where people spend extended periods, such as offices and schools. These health-based guideline values do not have a legal status, but they can provide a basis for developing policies on the indoor environment. As such, health-based guideline values cannot improve the quality of the indoor environment. Hence, it would be advisable to determine in what way the policies, and the role of the guideline values, should be developed.

Page 10 of 97 RIVM report 609021044
Table 1: Agents covered by this report and their guideline values Agent Guideline
value Period2 Unit Section
Chemical agents 1,1,1-trichloroethane 380 μg/m3 2.2.4 1,2-dichloroethane 48 μg/m3 2.2.4 1,2-dichloropropane 12 μg/m3 2.2.4. 1,4-dichlorobenzene 670 μg/m3 2.2.5 Alkanes3: total of pentane, heptane and octane
18,400 μg/m3 2.2.3
Alkanes: higher alkanes (nonane and higher)
1,000 μg/m3 2.2.3
Alkylbenzenes:4: total of isopropylbenzene, trimethylbenzene, methylethylbenzene, n-propylbenzene n-butylbenzene
870 μg/m3 2.2.1
Alkyldimethylbenzyl-ammoniumchloride - 2.3 Asbestos 100,000 ve/m3 2.5 Benzene 20 μg/m3 2.2.1 Chlorobenzene 500 μg/m3 2.2.5 Chlorpyrifos 3 μg/m3 2.3 Cyclohexane 3,000 μg/m3 2.2.3 Dichloromethane 3,000 μg/m3 2.2.4 Didecyldimethyl-ammoniumchloride - 2.3 Ethylbenzene 770 μg/m3 2.2.1 Particulate matter (PM10) 50
20 24 hour annual average
μg/m3
μg/m3 2.1.
Particulate Matter (PM2,5) 25 10
24 hour annual average
μg/m3
μg/m3 2.1
Formaldehyde5 1.2 μg/m3 2.2.2 Foxim - 2.3 HBAS6 800 μg/m3 2.2.1 Hexane 200 μg/m3 2.2.3 Carbon dioxide (CO2) - 5.1 Carbon monoxide (CO) 100
60 30 10
15 minutes 30 minutes 1 hour 8 hour
mg/m3
mg/m3
mg/m3
mg/m3
2.1
Mercury vapour 50 Annual average ng/m3 2.4 Lead 500 annual average ng/m3 2.4 Mineral fibres 100,000 annual average ve/m3 2.5 Ozone 100 8 hour μg/m3 2.1 Naphtalene 25 μg/m3 Appendix F PAH 1.2 ng
B(a)P/m3 2.1
Propoxur 22 μg/m3 2.3 Nitrogen dioxide (NO2) 200
40 1 hour annual average
μg/m3
μg/m3 2.1
2 If other than lifetime exposure. 3 See also hexane, cyclohexane. 4 See also toluene, xylene, ethylbenzene, HABS. 5 See section 2.2.2 for details. 6 HBAS: High-Boiling Aromatic Solvents. A group of solvents derived from mineral oil containing high concentrations of alkylbenzenes (especially methylethylbenzenes and trimethylbenzenes).
RIVM report 609021044 Page 11 of 97
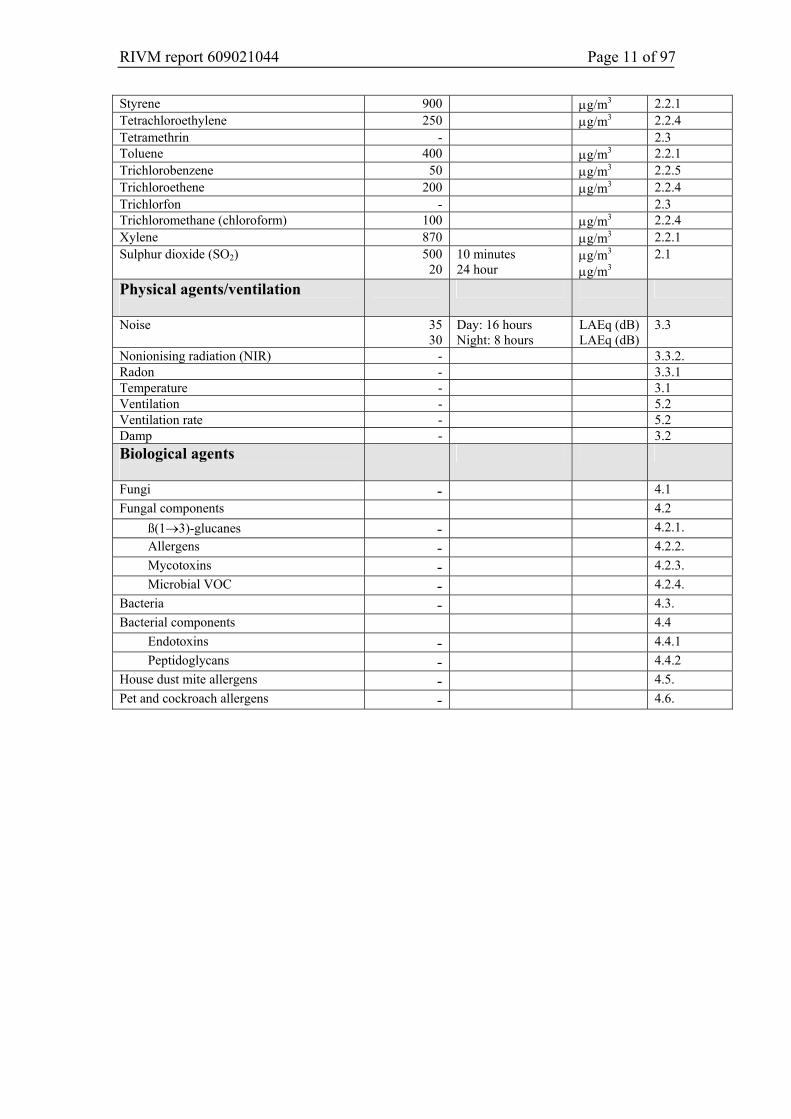
Styrene 900 μg/m3 2.2.1 Tetrachloroethylene 250 μg/m3 2.2.4 Tetramethrin - 2.3 Toluene 400 μg/m3 2.2.1 Trichlorobenzene 50 μg/m3 2.2.5 Trichloroethene 200 μg/m3 2.2.4 Trichlorfon - 2.3 Trichloromethane (chloroform) 100 μg/m3 2.2.4 Xylene 870 μg/m3 2.2.1 Sulphur dioxide (SO2) 500
20 10 minutes 24 hour
μg/m3
μg/m3 2.1
Physical agents/ventilation
Noise 35 30
Day: 16 hours Night: 8 hours
LAEq (dB) LAEq (dB)
3.3
Nonionising radiation (NIR) - 3.3.2. Radon - 3.3.1 Temperature - 3.1 Ventilation - 5.2 Ventilation rate - 5.2 Damp - 3.2 Biological agents
Fungi - 4.1 Fungal components 4.2
ß(1→3)-glucanes - 4.2.1. Allergens - 4.2.2. Mycotoxins - 4.2.3. Microbial VOC - 4.2.4.
Bacteria - 4.3. Bacterial components 4.4
Endotoxins - 4.4.1 Peptidoglycans - 4.4.2
House dust mite allergens - 4.5. Pet and cockroach allergens - 4.6.

Page 12 of 97 RIVM report 609021044
RIVM report 609021044 Page 13 of 97
1. Introduction In recent years, the RIVM has determined guideline values for many substances. They can be used to determine at what concentrations health hazards may occur. These guideline values do not have any legal status, but are often used to support policies on soil pollution or air quality. Consequently, the emphasis has been on avoiding or limiting risks outdoors. By contrast, there are few standards in the Netherlands for assessing the quality of the indoor environment. 7. This is because the indoor environment in dwellings is affected by many factors, including: • date of construction, construction methods, building materials; • location (groundwater, insolation); • heating and ventilation (flueless water heaters); • behaviour of the residents (smoking, hobbies, pets, ventilation); • external sources (traffic, aviation, industry, soil pollution); • building finishes, consumer products; • natural substances; • maintenance and use of the house. Consequently, there are major differences in the quality of the indoor environment, even in apparently identical dwellings or buildings. Some of these factors are difficult to influence or enforce through government policy. Health-based guideline values There is a real need for values to assess the quality of the indoor environment, for example when measurements are undertaken further to residents suffering health problems, or to assess building materials. Hence, the VROM Inspectorate asked the RIVM to determine health-based guideline values for a number of agents in the indoor environment of dwellings. Such values could be useful when developing policies to set limit or target values for the indoor environment. Here, ‘health-based guideline value’ means a concentration which, given lifetime exposure, either has no health effect or poses an acceptable risk. This value is referred to as the MPR (maximum permissible risk8). − For substances with a threshold value these values were set such that lifetime
exposure (70 years, 365 days/year, 24 hours/day) should not lead to harmful effects. Similarly, special risk groups such as ill people, pregnant women, the elderly and children should not experience health effects below these values either.
− For substances without a threshold value (genotoxic carcinogens) it is obviously not possible to base the determination on a nil likelihood of health effects. In this case, the maximum permissible risk level is used. This corresponds to 1 case of cancer per 1,000,000 million exposed people per year, or 1 per 10,000 during a lifetime (100 years).
7 The only exception are the MAC values for air quality in industrial settings. 8 See also ‘Stoffen en Normen’ (Chemical substances and standards), 1999. A list of substances and standards relevant to environmental policy. VROM-DGM. Samson, Alphen aan de Rijn. ISBN 90 6092 802 4
Page 14 of 97 RIVM report 609021044
Applications of guideline values Given the above premises (lifetime exposure and adequate protection of special risk groups), these values may also be applied to premises other than dwellings where the occupants spend long periods. However, this report concerns dwellings, in accordance with the brief. Selection of agents Given the diversity of agents and their wide range, it is not practicable to draw up a list of all agents which may be found in the indoor environment. This selection includes substances which are often associated with contaminated indoor environments, either in the literature or by those working in the field. At the start of the project this list was drawn up by the supervisory committee. Determination of guideline values Some of these agents also pose problems in the outdoor environment and guideline values have already been set for them by the RIVM. The premise for this project was that these values would be used wherever possible. New values were only derived if there were recent data suggesting the need for this. Hence, with respect to the guideline values it is irrelevant whether the sources are inside the dwelling or outside. Obviously, the focus was on determining values for agents with sources indoors. The reasoning behind the guideline values is included in this report (in Appendix A). If it was not possible to determine a health-based guideline value for an agent, then the reasons for this were discussed. Examples of this include nonionising radiation and biological agents. If the RIVM did not have relevant expertise in-house then we aimed to find external experts or guideline values defined by others. Values used in other countries The first step of the project was to undertake a literature study of projects in other countries to define guideline values for dwellings. Appendix D provides more information about this, as well as a table of the values used elsewhere, and the values used in the Netherlands. Exposure period Most of the health-based guideline values presented here were derived on the basis of the MPR for lifetime exposure, even when in practice an agent will be associated with a shorter exposure period. For some substances it was not possible to derive health-based guideline values for lifetime exposure. In those cases, guideline values for a different exposure period were used. This is indicated for the relevant values. Some examples: − For substances only values based on a shorter timeframe are available. These often
concern risks primarily associated with short-term exposure to higher concentrations, e.g. CO.
− There is no risk-free concentration of noncarcinogenic particulate matter. Hence, given the definition of the MPR for noncarcinogenic substances it was not possible to determine a health-based guideline value.
− The health-based guideline value for radon would be 4 to 6 times lower than the concentration in the outdoor atmosphere. This is technically unfeasible, particularly as in the Netherlands the major sources are found indoors. Consequently, no guideline value was determined.
RIVM report 609021044 Page 15 of 97
− It was not possible to derive health-based guideline values for biological agents (fungi, endotoxins, allergens) as the relevance of concentrations measured in a dwelling to the risk of illness are unknown. These measurements vary widely due to aspects of the dwelling, the time of year, the behaviour of the residents, the measurement period which is by necessity limited, the measuring method and the point where the measurement is made.
Limitations inherent to the scope • The available measurement methods were not considered when setting the values.
Hence, it may sometimes be difficult to undertake an assessment based on the guideline values as measurements (given the nature of emissions in the indoor environment) will not always be representative of the annual average.
• As it was decided to determine health-based guideline values for assessing the quality of the indoor environment, this report does not consider other options for identifying circumstances which pose an increased or even high risk. This includes identifying problems with damp, the use of certain building materials or consumer products and the presence of certain ventilation and heating systems.
• The scope of this project was limited to exposure through air. Hence, a number of issues which may be relevant to the quality of the indoor environment were not covered by this study.

Page 16 of 97 RIVM report 609021044
RIVM report 609021044 Page 17 of 97
2. Chemicals Limit values for industrial environments are available for a wide range of chemicals found in the indoor environment. These MAC values 9 are based on a working life, i.e. 8 hours per day, 5 days per week, for at most 40 years, and are intended to protect employees. However, they should not be considered appropriate for the indoor atmosphere in dwellings. This is because in this case the exposure may occur 24 hours per day, 7 days a week, during a human lifetime. Furthermore, employees normally represent a healthy subsection of the population as a whole. However, dwellings should also be safe for groups at special risk. A further disadvantage is that MAC values are occasionally set on the basis of practical considerations related to production processes, rather than the potential hazard to health. Available values Hence, when assessing the chemical agents we looked for values which were set to avoid harmful effects even during lifetime exposure. As discussed in the introduction, our approach is based on the maximum permissible risk (MPR). The MPR can be expressed as an tolerable daily intake (TDI) or tolerable concentration in the atmosphere (TCA). As this project is only concerned with exposure through the air, this section presents a range of TCAs. For some substances the RIVM derived TCAs some time ago. In such cases these TCAs were used, unless recent developments suggested the need for a review. Where no TCA was available, we investigated if there was sufficient data available about the agent in the toxicological literature to derive a TCA. If there were insufficient data this is stated in the report. Appendix A lists the data used for each substance to determine the guideline values. Exceedance When the measured concentrations are below the guideline values then, given the premises of this study, there is no expected adverse impact on health. When the measured concentrations are above the guideline values then the situation will have to be considered in greater detail. In that case it may be useful to consider acute limit values such as the acute reference doses for pesticides or the acute MRLs (minimal risk levels) set by US ATSDR. The significance of temporary or permanent exceedance of the guideline values can be assessed on the basis of these acute limit values.
9 MAC is the Maximum Admissible Concentration in the workplace (= TLV).
Page 18 of 97 RIVM report 609021044
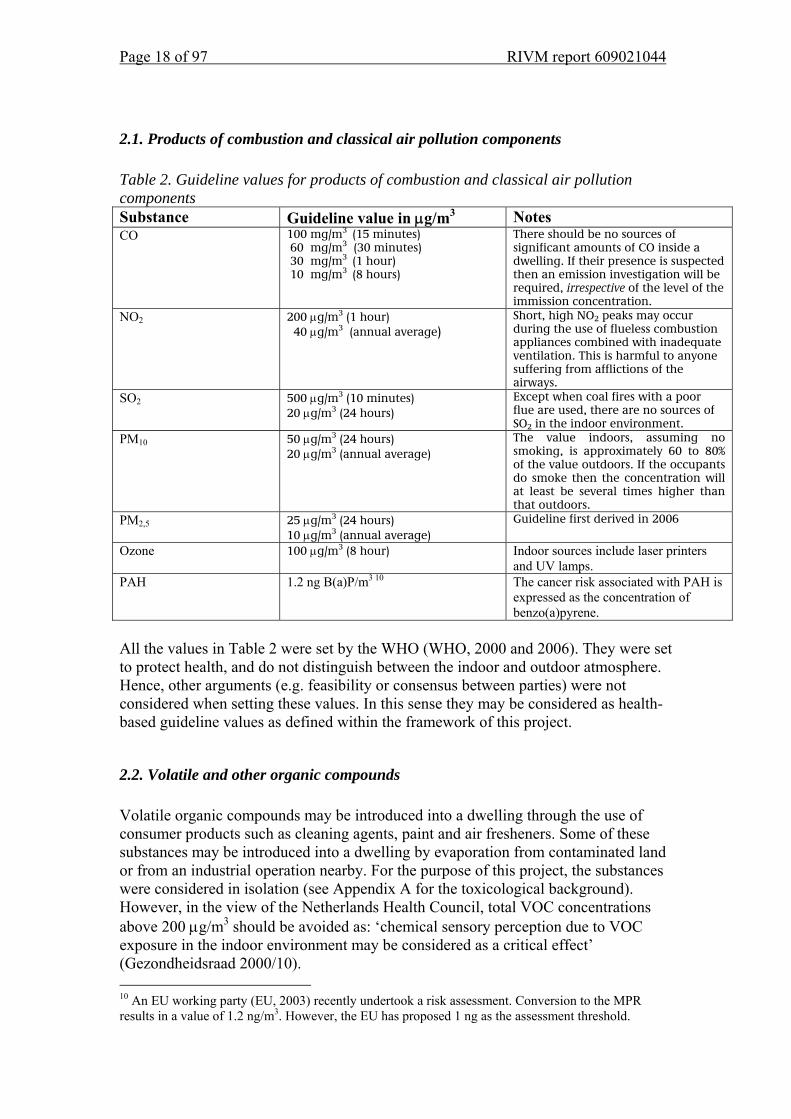
2.1. Products of combustion and classical air pollution components Table 2. Guideline values for products of combustion and classical air pollution components Substance Guideline value in μg/m3 Notes CO 100 mg/m3 (15 minutes)
60 mg/m3 (30 minutes) 30 mg/m3 (1 hour) 10 mg/m3 (8 hours)
There should be no sources of significant amounts of CO inside a dwelling. If their presence is suspected then an emission investigation will be required, irrespective of the level of the immission concentration.
NO2 200 μg/m3 (1 hour) 40 μg/m3 (annual average)
Short, high NO2 peaks may occur during the use of flueless combustion appliances combined with inadequate ventilation. This is harmful to anyone suffering from afflictions of the airways.
SO2 500 μg/m3 (10 minutes) 20 μg/m3 (24 hours)
Except when coal fires with a poor flue are used, there are no sources of SO2 in the indoor environment.
PM10
50 μg/m3 (24 hours) 20 μg/m3 (annual average)
The value indoors, assuming no smoking, is approximately 60 to 80% of the value outdoors. If the occupants do smoke then the concentration will at least be several times higher than that outdoors.
PM2,5 25 μg/m3 (24 hours) 10 μg/m3 (annual average)
Guideline first derived in 2006
Ozone 100 μg/m3 (8 hour) Indoor sources include laser printers and UV lamps.
PAH 1.2 ng B(a)P/m3 10 The cancer risk associated with PAH is expressed as the concentration of benzo(a)pyrene.
All the values in Table 2 were set by the WHO (WHO, 2000 and 2006). They were set to protect health, and do not distinguish between the indoor and outdoor atmosphere. Hence, other arguments (e.g. feasibility or consensus between parties) were not considered when setting these values. In this sense they may be considered as health-based guideline values as defined within the framework of this project.
2.2. Volatile and other organic compounds Volatile organic compounds may be introduced into a dwelling through the use of consumer products such as cleaning agents, paint and air fresheners. Some of these substances may be introduced into a dwelling by evaporation from contaminated land or from an industrial operation nearby. For the purpose of this project, the substances were considered in isolation (see Appendix A for the toxicological background). However, in the view of the Netherlands Health Council, total VOC concentrations above 200 μg/m3 should be avoided as: ‘chemical sensory perception due to VOC exposure in the indoor environment may be considered as a critical effect’ (Gezondheidsraad 2000/10). 10 An EU working party (EU, 2003) recently undertook a risk assessment. Conversion to the MPR results in a value of 1.2 ng/m3. However, the EU has proposed 1 ng as the assessment threshold.
RIVM report 609021044 Page 19 of 97
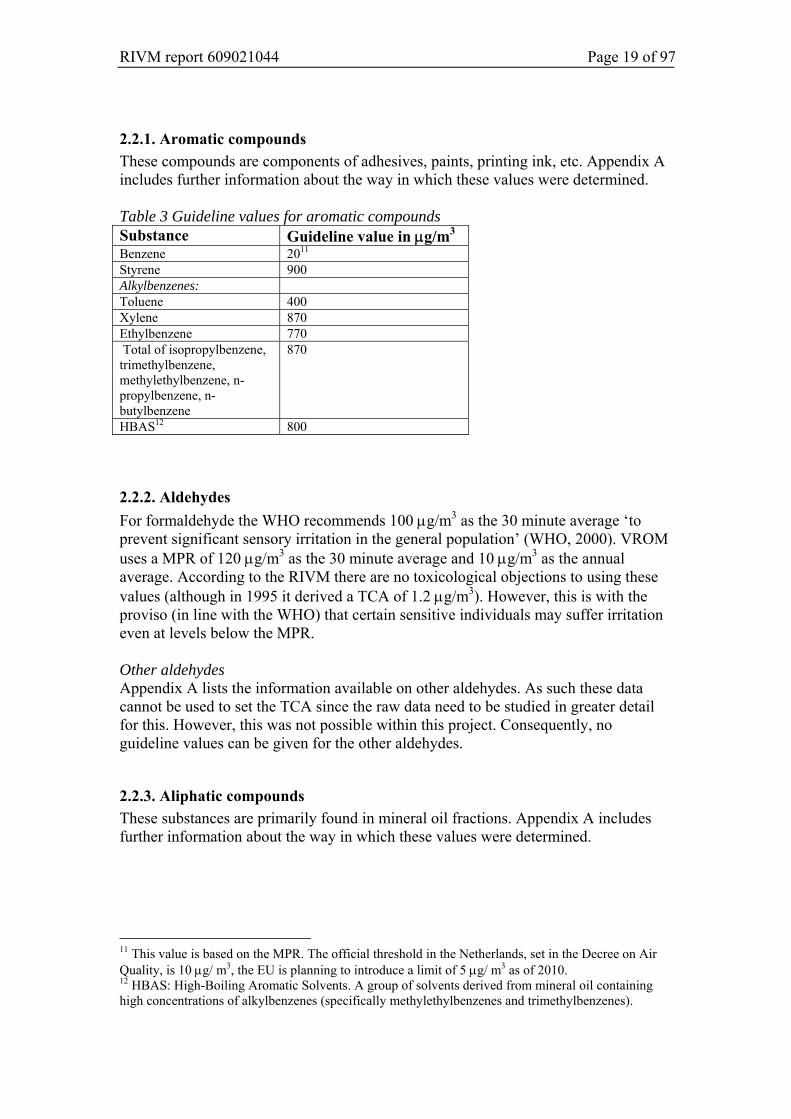
2.2.1. Aromatic compounds These compounds are components of adhesives, paints, printing ink, etc. Appendix A includes further information about the way in which these values were determined. Table 3 Guideline values for aromatic compounds Substance Guideline value in μg/m3 Benzene 2011 Styrene 900 Alkylbenzenes: Toluene 400 Xylene 870 Ethylbenzene 770 Total of isopropylbenzene, trimethylbenzene, methylethylbenzene, n-propylbenzene, n-butylbenzene
870
HBAS12 800
2.2.2. Aldehydes For formaldehyde the WHO recommends 100 μg/m3 as the 30 minute average ‘to prevent significant sensory irritation in the general population’ (WHO, 2000). VROM uses a MPR of 120 μg/m3 as the 30 minute average and 10 μg/m3 as the annual average. According to the RIVM there are no toxicological objections to using these values (although in 1995 it derived a TCA of 1.2 μg/m3). However, this is with the proviso (in line with the WHO) that certain sensitive individuals may suffer irritation even at levels below the MPR. Other aldehydes Appendix A lists the information available on other aldehydes. As such these data cannot be used to set the TCA since the raw data need to be studied in greater detail for this. However, this was not possible within this project. Consequently, no guideline values can be given for the other aldehydes.
2.2.3. Aliphatic compounds These substances are primarily found in mineral oil fractions. Appendix A includes further information about the way in which these values were determined.
11 This value is based on the MPR. The official threshold in the Netherlands, set in the Decree on Air Quality, is 10 μg/ m3, the EU is planning to introduce a limit of 5 μg/ m3 as of 2010. 12 HBAS: High-Boiling Aromatic Solvents. A group of solvents derived from mineral oil containing high concentrations of alkylbenzenes (specifically methylethylbenzenes and trimethylbenzenes).

Page 20 of 97 RIVM report 609021044
Table 4 Guideline values for aliphatic compounds Substance Guideline value in μg/m3 Hexane 200 Total of pentane, heptane and octane
18,400
Higher alkanes (nonane and higher)
1,000
Cyclohexane 3,000
2.2.4. Chlorinated aliphatic compounds These compounds are primarily found in paints, varnishes, inks and adhesives. Appendix A includes further information about the way in which these values were determined. Table 5. Guideline values for chlorinated aliphatic compounds Substance Guideline value inμg/m3 Dichloromethane 3,000 Trichloromethane (chloroform)
100
1.2-dichloroethane 4813 1,1,1-trichloroethane 380 1,2-dichloropropane 12 Trichloroethene 200 Tetrachloroethylene 250
2.2.5. Chlorinated benzenes These compounds are mostly found in paints, disinfectants and insecticides. Appendix A includes information on how these values were determined. Table 6 Guideline values for chlorinated benzenes Substance Guideline value in μg/m3 Chlorobenzene 500 1,4-dichlorobenzene 670 Trichlorobenzene 50
2.3. Pesticides
Table 7 Guideline values for pesticides Substance Guideline value (μg/m3) Typical application Chlorpyrifos 3 Insecticide: pest spray Foxim Cannot be derived Insecticide: ant bait boxes Tetramethrin Cannot be derived Insecticide Trichlorfon Cannot be derived Insecticide: ant bait boxes Propoxur 22 Insecticide: pesticide powder Alkyldimethylbenzyl-ammoniumchloride
Cannot be derived Disinfectants
Didecyldimethyl-ammoniumchloride
Cannot be derived Disinfectants
13 Provisional value, based on oral data.
RIVM report 609021044 Page 21 of 97
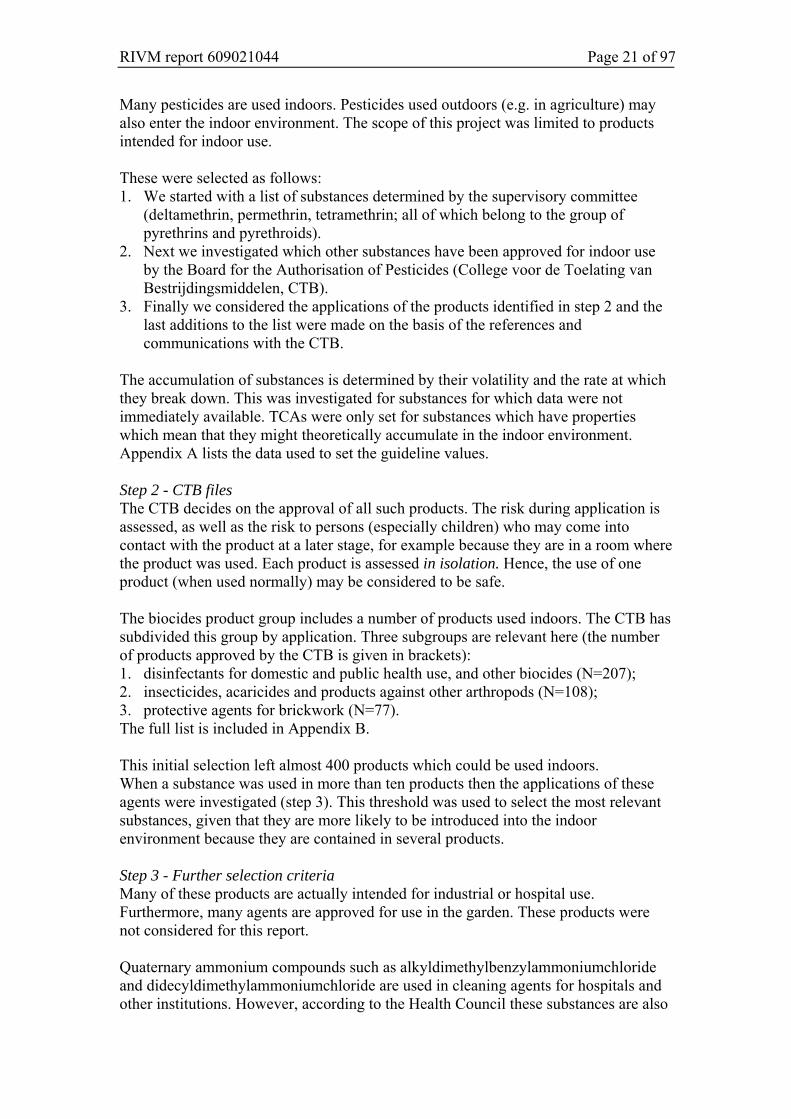
Many pesticides are used indoors. Pesticides used outdoors (e.g. in agriculture) may also enter the indoor environment. The scope of this project was limited to products intended for indoor use. These were selected as follows: 1. We started with a list of substances determined by the supervisory committee
(deltamethrin, permethrin, tetramethrin; all of which belong to the group of pyrethrins and pyrethroids).
2. Next we investigated which other substances have been approved for indoor use by the Board for the Authorisation of Pesticides (College voor de Toelating van Bestrijdingsmiddelen, CTB).
3. Finally we considered the applications of the products identified in step 2 and the last additions to the list were made on the basis of the references and communications with the CTB.
The accumulation of substances is determined by their volatility and the rate at which they break down. This was investigated for substances for which data were not immediately available. TCAs were only set for substances which have properties which mean that they might theoretically accumulate in the indoor environment. Appendix A lists the data used to set the guideline values. Step 2 - CTB files The CTB decides on the approval of all such products. The risk during application is assessed, as well as the risk to persons (especially children) who may come into contact with the product at a later stage, for example because they are in a room where the product was used. Each product is assessed in isolation. Hence, the use of one product (when used normally) may be considered to be safe. The biocides product group includes a number of products used indoors. The CTB has subdivided this group by application. Three subgroups are relevant here (the number of products approved by the CTB is given in brackets): 1. disinfectants for domestic and public health use, and other biocides (N=207); 2. insecticides, acaricides and products against other arthropods (N=108); 3. protective agents for brickwork (N=77). The full list is included in Appendix B. This initial selection left almost 400 products which could be used indoors. When a substance was used in more than ten products then the applications of these agents were investigated (step 3). This threshold was used to select the most relevant substances, given that they are more likely to be introduced into the indoor environment because they are contained in several products. Step 3 - Further selection criteria Many of these products are actually intended for industrial or hospital use. Furthermore, many agents are approved for use in the garden. These products were not considered for this report. Quaternary ammonium compounds such as alkyldimethylbenzylammoniumchloride and didecyldimethylammoniumchloride are used in cleaning agents for hospitals and other institutions. However, according to the Health Council these substances are also
Page 22 of 97 RIVM report 609021044
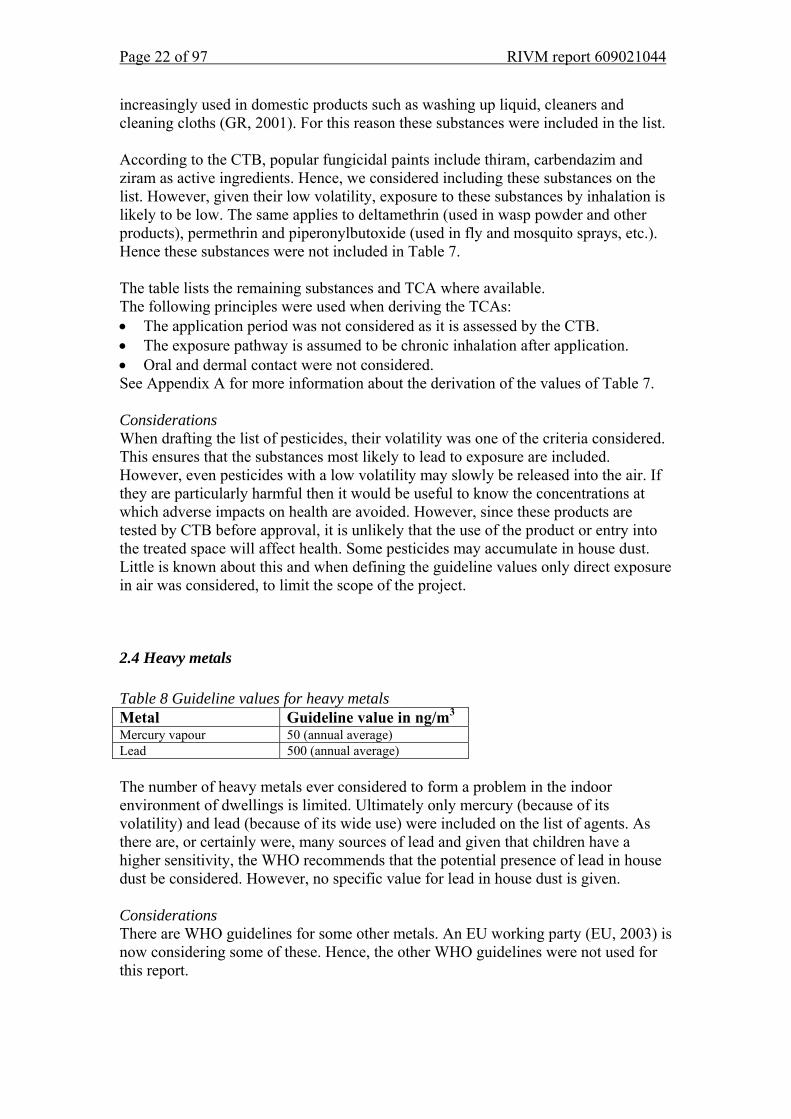
increasingly used in domestic products such as washing up liquid, cleaners and cleaning cloths (GR, 2001). For this reason these substances were included in the list. According to the CTB, popular fungicidal paints include thiram, carbendazim and ziram as active ingredients. Hence, we considered including these substances on the list. However, given their low volatility, exposure to these substances by inhalation is likely to be low. The same applies to deltamethrin (used in wasp powder and other products), permethrin and piperonylbutoxide (used in fly and mosquito sprays, etc.). Hence these substances were not included in Table 7. The table lists the remaining substances and TCA where available. The following principles were used when deriving the TCAs: • The application period was not considered as it is assessed by the CTB. • The exposure pathway is assumed to be chronic inhalation after application. • Oral and dermal contact were not considered. See Appendix A for more information about the derivation of the values of Table 7. Considerations When drafting the list of pesticides, their volatility was one of the criteria considered. This ensures that the substances most likely to lead to exposure are included. However, even pesticides with a low volatility may slowly be released into the air. If they are particularly harmful then it would be useful to know the concentrations at which adverse impacts on health are avoided. However, since these products are tested by CTB before approval, it is unlikely that the use of the product or entry into the treated space will affect health. Some pesticides may accumulate in house dust. Little is known about this and when defining the guideline values only direct exposure in air was considered, to limit the scope of the project.
2.4 Heavy metals Table 8 Guideline values for heavy metals Metal Guideline value in ng/m3 Mercury vapour 50 (annual average) Lead 500 (annual average) The number of heavy metals ever considered to form a problem in the indoor environment of dwellings is limited. Ultimately only mercury (because of its volatility) and lead (because of its wide use) were included on the list of agents. As there are, or certainly were, many sources of lead and given that children have a higher sensitivity, the WHO recommends that the potential presence of lead in house dust be considered. However, no specific value for lead in house dust is given. Considerations There are WHO guidelines for some other metals. An EU working party (EU, 2003) is now considering some of these. Hence, the other WHO guidelines were not used for this report.
RIVM report 609021044 Page 23 of 97
2.5 Asbestos and mineral fibres Table 9 Guideline values for asbestos and mineral fibres Agent Guideline value (in fibre
equivalent/m3) Notes
Asbestos 100,000 (annual average) See section 2.3.1. Mineral fibres 100,000 (annual average) Applies to refractory ceramic
fibres, see section 2.3.2.
2.5.1. Asbestos The MPR is set to 100,000 fibre equivalent per m3, averaged over one year. This standard applies to non-work related exposure, indoors and outdoors. The reference to fibre equivalents reflects the differences in the effects of various fibre types. The following classification is used: - chrysotile fibres < 5 micrometer have an equivalence factor of 0.1; - ditto > 5 micrometer have an equivalence factor of 1; - amphibolic fibres < 5 micrometer have an equivalence factor of 1; - ditto > 5 micrometer have an equivalence factor of 10. The fibres should be characterised by electron microscopy.
2.5.2. Mineral fibres MMVF (Man-made Vitreous Fibres) such as rock wool and glass wool are increasingly being used. The IARC has classified a range of fibres as Group 2b (possibly carcinogenic to humans). Glass filaments cannot be classified by the IARC and are therefore designated as Group 3 (not classifiable as to carcinogenicity in humans). For one of these fibre types, RCF (Refractory Ceramic Fibres) which are almost exclusively limited to industrial applications, the WHO has derived an Air Quality Guideline (AQG) given the risk of lung tumours. Conversion of this value to the Dutch MPR results in 100,000 fibres per m3 for lifetime exposure. According to the WHO there are insufficient data for setting AQGs for other fibre types. There are a few studies of the total concentration of MMVF in the outdoor atmosphere. These resulted in values from 2 fibres per m3 in the countryside to 1700 fibres per m3 in an urban environment. During the installation of these materials the concentrations range from 500,000 – 2,000,000 fibres per m3. This is actually higher than during manufacturing operations (100,000 per m3).
Page 24 of 97 RIVM report 609021044
2.6. References Baars A.J., Theelen R.M.C., Janssen P.J.C.M., Hesse J.M., Apeldoorn M.E. van,
Meijerink M.C.M., Verdam L., Zeilmaker M.J. (2001). Herevaluatie van humaan-toxicologische maximum toelaatbare risico-waarden. RIVMrapport 711701025, RIVM, Bilthoven.
Buringh E., Opperhuizen A. (eds) (2002). Over de gezondheidsrisico’s van fijn stof in Nederland. RIVMrapport 650010032, RIVM, Bilthoven.
EU (2003) Proposal for a directive of the European Parliament and of the Council relating to arsenic, cadmium, mercury, nickel and polycyclic aromatic hydrocarbons in ambient air. COM (2003) 423 Final, Brussels.
Gezondheidsraad (2000). Vluchtige organische stoffen uit bouwmaterialen in verblijfsruimten. GR, publicatienummer 2000/10, Den Haag.
Gezondheidsraad (2001). Desinfectantia in consumentenprodukten. Signalement. GR, publicatienummer 2001/05, Den Haag.
WHO (2000). Air Quality Guidelines for Europe. Second Edition. WHO regional publications, european series, No 91, Copenhagen.
WHO (2006).WHO Air Quality Guidelines for particulate matter, ozone, nitrogen dioxide and sulfur dioxide. Global update 2005. Summary of risk assessment, Copenhagen.
RIVM report 609021044 Page 25 of 97
3. Physical agents Table 10 Guideline values for physical agents Agent Guideline value Notes Temperature No guideline value See section 3.1. Damp No guideline value See section 3.2. Noise Day 35 LAEq (dB) (16 hours)
Night 30 LAEq (dB) (8 hours) See section 3.3
Radiation Radon No guideline value See section 3.3.1. Nonionising radiation (0-300 GHz)
No guideline value See section 3.3.2
3.1. Temperature The Building Decree (VROM, 2003) does not give any specific requirements for the indoor temperature. On the whole, temperatures from around 18 – 25oC are considered comfortable. To some extent this is affected by the relative humidity. At a higher relative humidity (approximately 80%) the temperature can be 2 - 3 degrees lower. Elderly and the ill need a slightly higher temperature, partly because they tend to move about less. The recommended temperature for asthma patients is around 20oC and they are advised not to let their home cool down to 15oC at night. This is because condensation will occur on cold surfaces (the relative humidity increases as the temperature falls) which promotes the development of fungi and house dust mites. No guideline value As epidemiological studies of the effects of temperature on health are primarily concerned with the outdoor temperature, the results of these studies cannot necessarily be applied to the situation indoors, where the residents have some control over the temperature. For this reason it was decided not to set a health-based guideline value.
3.2. Damp The Building Decree (VROM, 2003) includes articles on ‘excluding internal and external damp’ and ventilation. These articles aim to prevent the build up of moisture and prevent the development of fungi and house dust mites. The regulations aim to prevent cold surfaces (which lead to condensation), to keep out rainwater and rising damp, and to ensure that moisture released inside the house is removed. There are many NEN standards (Dutch national standards) about the methods to verify that these provisions meet the requirements and that designs comply with the regulations. A discussion of these issues is outside the scope of this document. However, it
Page 26 of 97 RIVM report 609021044
appears that in practice, simply complying with the requirements of the Building Decree, does not always ensure a dry indoor environment. Relationship between damp and health There is a surprisingly consistent relationship between damp in a dwelling and respiratory tract problems. A recent literature study covering 61 studies concluded that there was a significant relationship between damp in the residential environment and respiratory tract problems such as coughing and wheezing, and to a lesser extent with asthma (Bornehag et al., 2001). This has been demonstrated both in the Netherlands (Cuijpers et al., 1995; Brunekreef, 1992) and in other countries (Andriessen et al., 1998; Peat et al., 1998; Nafstad et al., 1998; Norback et al., 1998; Zock et al., 2002) for both children and adults. Some studies also established a dose-effect relationship between the extent of the problems with damp and the occurrence of respiratory tract symptoms (Williamson et al., 1997; Engvall et al., 2001). In addition to the symptoms affecting the respiratory tract, damp in dwellings has also been associated with less specific symptoms such as nausea, headaches, and even with an increased risk of respiratory tract infections (Pirhonen et al., 1996; Li et al., 1997; Kilpelaïnen et al., 2001). There is strong evidence about the link between damp in the residential environment and health effects. At present it is uncertain whether dampness in the residential environment only exacerbates existing respiratory tract conditions (asthma, COPD) (i.e. secondary causality) or whether it can also initiate these problems (i.e. primary causality) (Douwes and Pearce, 2003). A large proportion of the Dutch population lives in damp houses. A study commissioned by VROM in 1985 covering housing associations which managed some 1.6 million dwellings (at that time almost one third of the total housing stock), showed that around 18% of these were affected by damp (Tammes et al., 1985). A later study, covering 1989 - 1991, indicated that approximately 20% of the houses inspected (around 6 million) were affected by damp to some extent (VROM, 1993). Two epidemiological studies in the early 1990s in Helmond (n=3340, adults; Brunekreef, 1992) and Maastricht (n=470, children; Cuijpers et al., 1995) confirmed this. Around 20 - 25% of those interviewed claimed to live in dwellings affected by damp. These studies defined ‘damp dwellings’ as those where dampness or fungal stains were found. Consequently, the population at risk is large. Furthermore, the most sensitive group (those already suffering from respiratory tract conditions such as asthma and COPD) is also relatively large. Hence, measures to prevent damp are essential and can potentially contribute significantly to improving public health. This is supported by the World Health Organisation (WHO) in its report ‘Concern for Europe’s tomorrow’ in which exposure to damp housing is identified as the most frequent environmental exposure which may affect health in Europe (WHO, 1994). It is unclear what specific exposure in damp dwellings is responsible for the observed effects on health. The literature suggests that biological agents (see definition in section 4) are particularly significant, especially fungi and house dust mites (both of which need damp to develop and survive). In addition to biological agents, chemical substances may also be relevant, as damp can lead to the decay of building materials and so increase chemical emission from building materials.
RIVM report 609021044 Page 27 of 97
No guideline value Many epidemiological studies show a consistent link between damp housing and health effects. However, practically all these studies are based on qualitative estimates of exposure based on data from questionnaires (damp or fungi in the house, condensation on windows, water damage, leaks, flooded basements, etc.). The questions used in these studies were not standardised, hence they cannot be compared with each other. Similarly, the link to more objective measurements (e.g. the relative humidity in a house) is not unambiguous. Thus, a ‘damp dwelling’ is not unambiguously defined and there are no generally acceptable methods for measuring damp problems in the residential environment. The lack of quantitative data means that at present it is not possible to derive a health-based guideline value for damp in dwellings. Temperature, damp and ventilation (see section 5.2) All these three physical agents are extremely important to comfort in the home and, indirectly, to health, as in combination they affect wellbeing indoors. For these physical agents there are mostly recommendations related to building engineering. It is not possible to provide direct health-based guideline values for these agents. Given the effects of these agents and their interrelationship it would be advisable to study their combination in greater detail.
3.3. Noise In 1999 the WHO published new guidelines on environmental noise (Berglund et al., 1999). These are included in Table 10. These values show some differences with those published earlier by bodies such as the Health Council. The limit for nuisance is an example of this. According to the Health Council, nuisance occurs from approximately 42 dB(A) and according to the WHO from 50 dB(A). The WHO does not give any guidelines for cardiovascular disease. Broadly, effects on wellbeing such as nuisance and disrupted sleep occur from approximately 35 dB(A) indoor or 50 dB(A) outdoors. According to the WHO and the Health Council, clinical effects such as hearing damage and cardiovascular diseases occur at approximately 65-70 dB(A), indoors and outdoors. It is difficult to define clear thresholds above which effects may occur (Van Kempen et al., 2002). Furthermore, the response to noise may be affected by other factors such as individual nonacoustic factors such as the sensitivity to noise or fear of a source of noise. The conditions under which the noise is perceived are also relevant, for example when the source of the noise can be seen from the dwelling and noise disturbs an activity which demands concentration. Significant effects may occur in sensitive groups (e.g. the elderly, ill, young children, individuals with hearing damage) at lower levels (WHO, 1999). Appendix C includes a list of all suspected and proven health effects of noise (source: WHO, 1999).
Page 28 of 97 RIVM report 609021044
3.4. Radiation
3.3.1. Radon According to the Health Council there are approximately 800 (range 100 - 1200) fatalities per year in the Netherlands due to radon. Recently built dwellings usually have higher radon concentrations than older buildings. This is partly due to a lower air permeability of the building shell resulting from the energy performance requirements for modern buildings, and partly due to the increasing use of brick and similar building materials. Consequently, the average radon concentration in the Netherlands is slowly increasing. However, the radon concentrations in the Netherlands are generally low as there are hardly any areas with significant radon emissions from the soil. So far, VROM has mainly focussed on avoiding any further increases in the risk. The ministry developed a radiation performance standard for this purpose. However, there were major objections against it and it will not be introduced in the foreseeable future. The European intervention guidelines are primarily intended for existing buildings. They address high concentrations (> 400 Bq/m3). Lower maximum levels are proposed for new dwellings (< 200 Bq/m3). Neither limit is exceeded in the Netherlands. No guideline value It was decided not to define a health-based guideline value for radon. The 800 fatalities referred to earlier correspond to approximately 50 per 1,000,000 per year. To reduce the risk to a value corresponding to the MPR (1 fatality per 1,000,000 persons per year) the radon concentration in the indoor environment would have to be reduced by a factor of 50. Given an average exposure in the Netherlands of 24 Bq/m3 this amounts to a reduction down to approximately 0.5 Bq/m3, which is actually below the current outdoor concentration of 3 Bq/m3. Obtaining radon concentrations in dwellings similar to those in the outdoor atmosphere would require completely different construction methods, such as wooden houses on posts, or steel and glass structures. According to the Ministry of Housing, Physical Planning and the Environment this is unfeasible in practical terms.
3.3.2. Nonionising radiation (NIR) Nonionising radiation (NIR, frequency range: 0 Hz – 300 GHz) is electromagnetic radiation with an energy that is too low to ionise atoms. Consequently, its health effects are different from those of ionising radiation. UV radiation is a borderline case. Nonionising radiation covers a broad spectrum with greatly different properties and many different sources. Indoors the following frequencies and applications are most relevant: • 50 Hz: Electrical appliances (vacuum cleaner, washing machine, shaver, hair
dryer, etc.) produce this frequency. Residents may also be exposed to the ELF14fields of high voltage power lines and other parts of the electricity transmission system near to the dwelling.
14 ELF: Extremely Low Frequency
RIVM report 609021044 Page 29 of 97
• 900 / 1800 MHz: There are two mobile telephony systems: GSM (Global System for Mobile Communications) and DCS (Digital Communications System). These systems operate at 900 and 1800 MHz respectively. Residents are also exposed to the electromagnetic fields around base stations. While a mobile phone is being used there is a temporary increase in exposure.
• 2100 MHz: This frequency is used by the next generation of mobile phones: UMTS (Universal Mobile Telecommunications System).
Basic restrictions and reference levels An EU recommendation from 1999 (EU, 1999) concerning the reduction of the exposure of the general population to electromagnetic fields is currently at the centre of the development of European policies. This EU recommendation is based on a guideline issued by the ICNIRP (International Commission on Non-ionizing Radiation Protection) in 1998 (ICNIRP 1998). This guideline addresses acute, short-term effects: nerve stimulation, perceived flashes of light and heating of the body. ICNIRP has set ‘basic restrictions’ for the permissible exposure of the general population, these amount to approximately 2% of the exposure level at which these effects have been observed. For practical reasons, ICNIRP has converted the basic restrictions to reference levels, as these are easier to measure. The guide line gives instructions for calculating the reference levels for any frequency from 0 Hz to 300 GHz. The ICNIRP reference levels for the frequencies related to sources mostly commonly encountered indoors are included in Table 11. Table 11 ICNIRP guideline reference levels ELF 50 Hz
E field15: 5 kV/m H field: 80 A/m B field: 100 µT
RF16 900 MHz
E field: 41 V/m H field: 0.11 A/m B field: 0.14 µT
RF 1800 MHz
E field: 58 V/m H field: 0.16 A/m B field: 0.20 µT
RF 2100 MHz
E field: 61 V/m H field: 0.16 A/m B field: 0.20 µT
The Health Council has also published recommendations about exposure to electromagnetic fields (GR, 2000a; GR, 1997) with some minor differences from the EU recommendation. To ensure international coordination, the Netherlands decided to use the ICNIRP values which are also recommended by the EU, instead of the slightly less strict values recommended by the Health Council (VROM/VWS, 2001). A recent study showed that exposure to radio frequency (RF) fields at approximately 2100 MHz and an electric field strength of 1 V/m (a factor 60 below the reference level for this frequency) had adverse effects on the ‘wellbeing’ of test subjects
15 The EU recommendation includes separate reference values for the strength of the electric field (E field, V/m), the strength of magnetic field (H field, A/m) and the magnetic flux density (B field, µT). 16 RF: Radio Frequency
Page 30 of 97 RIVM report 609021044
(Zwamborn et al., 2003). Hence, it is uncertain whether exposure below the reference level has any effects, short-term or otherwise. At present it is not possible to draw definitive conclusions on the basis of this study. Another current discussion concerns the possible link between exposure to ELF fields and miscarriages. Two studies from 2002 suggest that there may be a link between exposure to ELF fields (60 Hz) during pregnancy and the likelihood of a miscarriage (Lee at al., 2002; Li, 2001). Short exposures to field strengths above 1.6 μT appeared to lead to a significant increase of the likelihood of a miscarriage, while no link was established between the average field strength and miscarriages. Further studies will have to show if this is indeed a consistent and reproducible effect. Long-term effects The ICNIRP guideline includes the following statement on potential long-term effects: ‘In the case of potential long-term effects of exposure, such as an increased risk of cancer, ICNIRP concluded that available data are insufficient to provide a basis for setting exposure restrictions, although epidemiological research has provided suggestive, but unconvincing, evidence of an association between possible carcinogenic effects and exposure at levels of 50/60 Hz magnetic flux densities substantially lower than those recommended in these guidelines.’ Since the publication of the ICNIRP guideline in 1998 the suggestions of a potential link between 50 Hz magnetic fields and the risk of leukaemia in children have become more consistent, particularly with the publication of two major epidemiological studies in 2000 (see Van der Plas et al., 2001 for further details). The Health Council refers to a ‘reasonably consistent association’ but considers a causal relationship to be unlikely as there is no credible biological mechanism which could explain the link between exposure to EM fields and leukaemia (GR, 2000a; GR, 2001). The WHO has classified 50 Hz magnetic fields as potentially carcinogenic. Given the epidemiological studies, a potentially increased risk of leukaemia in children might occur at exposure to magnetic fields with a field strength higher than somewhere between 0.2 μT and 0.5 μT (Van der Plas et al., 2001). These values are 200 - 500 times lower than the 50 Hz reference level according to the ICNIRP. With respect to the RF fields related to mobile telecommunications, we will have to await the results of current studies before a definitive conclusion can be drawn between a causal relationship with the initiation or promotion of cancer. The ICNIRP guideline does not consider potential health effects due to low exposure levels over many years. No guideline value It is the view of the RIVM that at present it is not possible to set exposure values for LF and RF nonionising radiation below which there is no risk to residents, or only a negligible risk, given lifetime exposure. The primary reasons for this are: 1. The current basic restrictions and reference levels are based on acute effects after
a relatively short exposure. 2. The effects of prolonged exposure to levels below the basic restrictions and
reference levels are unclear.
RIVM report 609021044 Page 31 of 97
3.5. References Andriessen J.W., Brunekreef B., Roemer W. Home dampness and respiratory health
status in European children. Clin Exp Allergy 1998;28:1191-1200. BEIR VI. (1998) National Research Council: Committee on Health Risks of Exposure
to radon (BEIR VI). Health Effects of exposure to radon. Washington DC, National Academy Press.
Building Decree (2003). Ministry of Environment, Spatial Planning and the Environment; Den Haag.
Brunekreef B. Damp housing and adult respiratory symptoms. Allergy 1992; 47:498-502.
Burge H. Bioaerosols: Prevalnce and health effects in the indoor environment. J Allergy Clin Immunol 1990;86:687-701.
Cuijpers C.E.J., Swaen G.M.H., Wesseling G., Sturmans F., Wouters E.F.M. Adverse effects of the indoor environment on respiratory health in primary school children. Env Res 1995;68:11-23.
Douwes J, Pearce N, Heederik D. Does bacterial endotoxin prevent asthma? Thorax 2002;57:86-90.
Engvall K, Norrby C, Norback D. Asthma symptoms in relation to building dampness and odour in older multifamily houses in Stockholm. Int J Tuberc Lung Dis 2001;5:468-77.
EU (1999). Raad van de Europese Gemeenschappen. Aanbeveling van de Raad van 12 juli 1999 betreffende de beperking van blootstelling van de bevolking aan elektromagnetische velden van 0 Hz - 300 GHz. Publicatieblad Van De Europese Gemeenschappen 1999/519/EG
Fast T., Bruggen M. van (2004). Beoordelingskader gezondheid en milieu: GSM basisstations, legionella, radon, fijn stof en geluid door wegverkeer. RIVM rapport 609031001.
Gezondheidsraad (1997). Commissie Radiofrequente straling. Radiofrequente elektromagnetische velden (300 Hz - 300 GHz). Rijswijk: Gezondheidsraad, 1997; publicatie nr. 1997/01.
Gezondheidsraad (2000a). Commissie ELF elektromagnetische velden. Blootstelling aan elektromagnetische velden (0 Hz - 10 MHz). Den Haag: Gezondheidsraad, 2000; 2000/6.
Gezondheidsraad (2000b). Radon. Toetsing rapport BEIR VI. GR rapport 2000/05. Gezondheidsraad (2001) Elektromagnetische velden: jaarbericht 2001. Den Haag,
Gezondheidsraad, 2001, publicatie nr. 2001/14. Gezondheidsraad (2003). Gezondheid en milieu: kennis voor beleid. Den Haag,
Gezondheidsraad, 2003, publicatie nr. 2003/20. ICNIRP (1998) International Commission on Non-Ionizing Radiation Protection.
Guidelines for limiting exposure to time-varying electric, magnetic, and electromagnetic fields (up to 300 GHz). Health Phys. 1998; 74(4):494-522.
Kilpeläinen M, Terho EO, Helenius H, et al. Home dampness, current allergic diseases, and respiratory infections among young adults. Thorax 2001;56:462-467.
Lee M.G., R.R. Neutra, L. Hristova, M. Yostand, R.A. Hiatt A nested case-control study of residential and personal magnetic field measures and miscarriages Epidemiology 13, 21-31, 2002
Li CS, HSU CW, Lu CH. Dampness and respiratory symptoms among workers in daycare centers in a subtropical climate. Arch Environ Health 1997;52:68-71.
Page 32 of 97 RIVM report 609021044
Li D., Odouli R., Wi S., Janevic T., Golditch I., Bracken T.D., Senior R., Rankin R., Iriye R. A population based prospective cohort study of personal exposure to magnetic fields during pregnancy and the risk of miscarriage Epidemiology 13, 9-20, 2002
Nafstad P, Øie L, Mehl R et al. Residential dampness problems and symptoms and signs of bronchial obstruction in young Norwegian children. Am J Respir Crit Care Med 1998;157:410-414.
Norback D, Bjornsson E, Janson C, et al. Current asthma and biochemical signs of inflammation in relation to building dampness in dwellings. Int J Tuberc Lung Dis 1999;3:368-76.
Peat JK, Britton WJ, Salome CM, Woolcock AJ. Bronchial hyperresponsiveness in two populations of Australian schoolchildren. III. Effect of exposure to environmental allergens. Clin Allergy 1987;17:297-300.
Pirhonen I, Nevalainen A, Husman T, Pekkanen J. Home dampness, moulds and their influence on respiratory infections and symptoms in adults in Finland. Eur Respir J 1996;9:2618-2622.
Stoop P., Glastra P., Hiemstra Y., de Vries L., Lembrechts J. (1998). Resultaten van het tweede landelijke onderzoek naar radon in woningen. RIVMrapport 6100058006, RIVM, Bilthoven.
Van der Plas M., Houthuijs D.J.M., Dusseldorp A., Pennders R.M.J., Pruppers M.J.M., (2001). Magnetische velden van hoogspanningslijnen en leukemie bij kinderen, RIVM rapport 610050007. RIVM, Bilthoven, 2001.
Van Kempen E.E.M.M., Kruize H., Boshuizen H.C., Ameling C.B., Staatsen B.A.M., de Hollander AEM. The association between noise exposure blood pressure and ischemic heart disease. Environ Health Perspect 2002; 110: 307-17.
VROM/VWS (2001) Brief van de Ministers van Volkshuisvesting, Ruimtelijke Ordening en Milieubeheer en van Volksgezondheid, Welzijn en Sport aan de Voorzitter van de Tweede Kamer der Staten-Generaal. Tweede Kamer, vergaderjaar 2000-2001, 27 561, nr. 13, 8 juni 2001.
VROM. Qualitative housing registration 1989-1991. Results of a nationwide sample (in Dutch). VROM, Den Haag, 1993.
WHO (1994). Concern for Europe's tomorrow: Health and Environment in the WHO European Region/WHO, Copenhagen.
WHO (1999) Berglund B., T. Lindvall and D.H. Schwela (eds.). Guidelines for community noise. World Health Organisation, Genève.
Williamson I.J., Martin C.J., McGill G., Monie R.D., Fennerty A.G.. Damp housing and asthma: a case-control study. Thorax 1997 Mar;52(3):229-34.
Zock J.P., Jarvis D., Luczynska C., et al. Housing characteristics, reported mold exposure, and asthma in the European Community Respiratory Health Survey. J Allergy Clin Immunol 2002;110:285-92.
Zwamborn A.P.M., Vossen S.H.J.A., Van Leersum B.J.A.M., Ouwens M.A., Mäkel W.N. (2003). Effects of global communication system radio-frequency fields on well being and cognitive functions of human subjects with and without subjective complaints. TNO-report FEL-03-C148. TNO Physics and Electronic Laboratory, september 2003.
RIVM report 609021044 Page 33 of 97
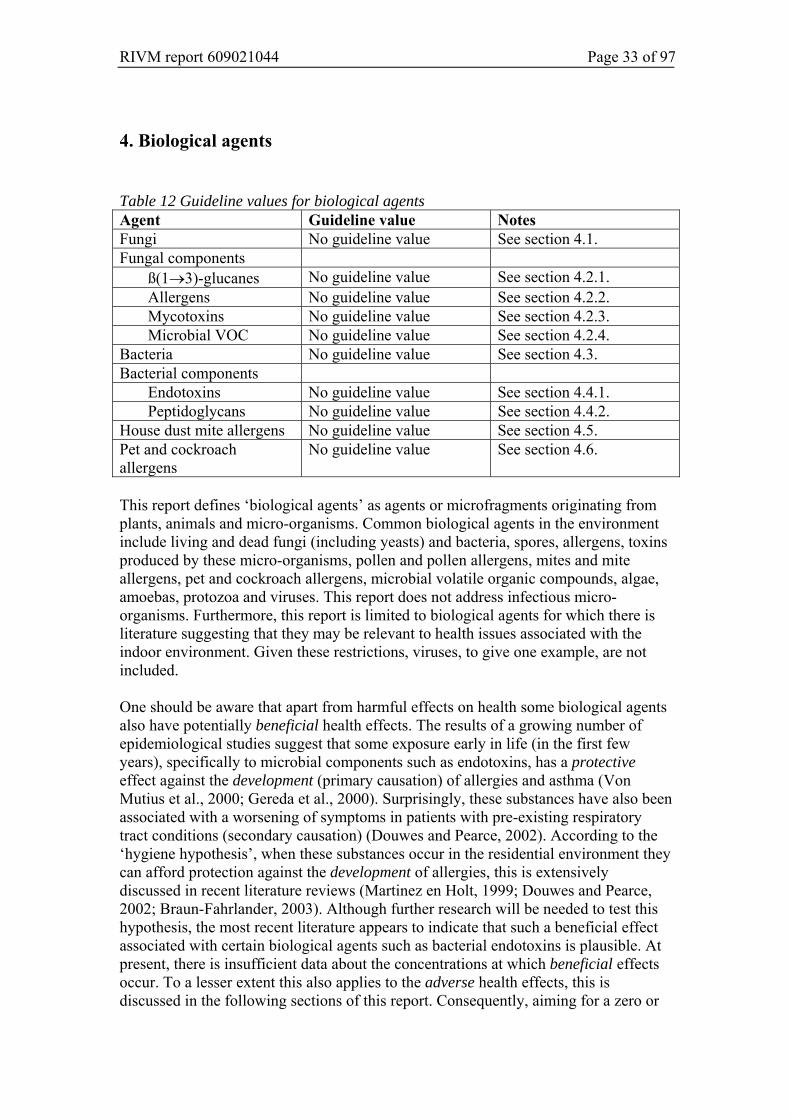
4. Biological agents Table 12 Guideline values for biological agents Agent Guideline value Notes Fungi No guideline value See section 4.1. Fungal components
ß(1→3)-glucanes No guideline value See section 4.2.1. Allergens No guideline value See section 4.2.2. Mycotoxins No guideline value See section 4.2.3. Microbial VOC No guideline value See section 4.2.4.
Bacteria No guideline value See section 4.3. Bacterial components
Endotoxins No guideline value See section 4.4.1. Peptidoglycans No guideline value See section 4.4.2.
House dust mite allergens No guideline value See section 4.5. Pet and cockroach allergens
No guideline value See section 4.6.
This report defines ‘biological agents’ as agents or microfragments originating from plants, animals and micro-organisms. Common biological agents in the environment include living and dead fungi (including yeasts) and bacteria, spores, allergens, toxins produced by these micro-organisms, pollen and pollen allergens, mites and mite allergens, pet and cockroach allergens, microbial volatile organic compounds, algae, amoebas, protozoa and viruses. This report does not address infectious micro-organisms. Furthermore, this report is limited to biological agents for which there is literature suggesting that they may be relevant to health issues associated with the indoor environment. Given these restrictions, viruses, to give one example, are not included. One should be aware that apart from harmful effects on health some biological agents also have potentially beneficial health effects. The results of a growing number of epidemiological studies suggest that some exposure early in life (in the first few years), specifically to microbial components such as endotoxins, has a protective effect against the development (primary causation) of allergies and asthma (Von Mutius et al., 2000; Gereda et al., 2000). Surprisingly, these substances have also been associated with a worsening of symptoms in patients with pre-existing respiratory tract conditions (secondary causation) (Douwes and Pearce, 2002). According to the ‘hygiene hypothesis’, when these substances occur in the residential environment they can afford protection against the development of allergies, this is extensively discussed in recent literature reviews (Martinez en Holt, 1999; Douwes and Pearce, 2002; Braun-Fahrlander, 2003). Although further research will be needed to test this hypothesis, the most recent literature appears to indicate that such a beneficial effect associated with certain biological agents such as bacterial endotoxins is plausible. At present, there is insufficient data about the concentrations at which beneficial effects occur. To a lesser extent this also applies to the adverse health effects, this is discussed in the following sections of this report. Consequently, aiming for a zero or
Page 34 of 97 RIVM report 609021044
extremely low exposure of the whole population might, given the hygiene hypothesis, have undesirable consequences. However, this does not apply with respect to those with existing allergies or respiratory tract conditions in whom even minor exposure can lead to acute symptoms (secondary causation). For these people, e.g. those suffering from an allergy to house dust mites or cats, reducing the exposure to extremely low levels is advisable. Both the WHO and the US National Academy of Sciences (NAS) have set up expert committees on damp dwellings, biological agents and health. The primary objectives of these committees were to assess the available literature to determine if there is sufficient evidence to prove a link between exposure to biological agents and health effects, and where possible to recommend guidelines and guideline values. These reports are expected to be published in the first half of 2004. For more information about the NAS committee you are referred to the NAS website, project identification number: HPDP-H-00-06-A.
4.1. Fungi Many epidemiological studies have shown a causal relationship between reported exposure to fungi in the residential environment and respiratory tract symptoms ( Peat et al., 1998; Andriessen et al., 1998; Zock et al., 2002; Dharmage et al., 2002). A link between sensitisation to fungi, damp dwellings and asthma has also been demonstrated, and associations between exposure to fungi (Alternaria) in the outdoor atmosphere and asthma have been observed (see section 4.2.2). It is also known that fungi can produce potent allergens, mycotoxins and proinflammatory substances such as ß(1→3)-glucanes (Verhoeff and Burge, 1997; Douwes et al., 2003). Hence, it is most likely that fungi are relevant to health effects related to damp dwellings (see section 3.2). However, the evidence for this is not as strong as is often assumed. This lack of evidence is primarily due to the fact that there are no reliable quantitative methods to measure exposure (Douwes et al., 2003). Most epidemiological studies estimate the exposure on the basis of data from questionnaires (damp and fungal stains in the house, mouldy smell, etc.) and it is uncertain to what extent these estimates are correlated to the actual exposure to relevant fungal components. In addition to studies in which the exposure was estimated using questionnaires, there are also some studies where objective fungi measurements were undertaken in the dwellings. However, only some of these showed an association with health effects (Verhoeff and Burge, 1997; Garrett et al., 1998; Belanger et al., 2003). In these studies, exposure was primarily determined by taking samples of viable fungi in the indoor atmosphere. However, measuring viable fungi to estimate exposure is of limited value, given that: 1. only viable fungi are measured while dead and unviable fungi may also affect
health; 2. the results are highly dependent, in qualitative and quantitative terms, on the
equipment used for sampling and on the growing medium (Verhoeff et al., 1994); and
3. the reproducibility and therefore the precision of these measurements is not very high (Verhoeff et al., 1994; Chew et al., 2001). This is primarily due to the often

RIVM report 609021044 Page 35 of 97
extremely short sampling time combined with a great variation in the concentrations in air over time (Douwes et al., 2003). Measurements of viable fungi in house dust are more robust, but even these measurements are not accurate enough for quantitative exposure estimates (Verhoeff et al., 1994). It is likely that the lack of precision of these exposure measurements is responsible for the absence of a clear correlation between the measured exposure to fungi and health effects. Alternative methods have recently been developed (Miller and Young, 1997; Eduard et al., 1998; Pasanen et al., 1999; Douwes et al., 1999; Douwes et al., 2003), but so far there is little experience with these techniques.
No guideline value A causal role of exposure to fungi with respect to the health effects related to damp dwellings is plausible, but at present the quantitative basis for this is inadequate. Given the current literature it is not possible to define quantitative guideline values. The literature includes suggestions for limits, but these are not supported by health-related arguments. For example, the report of the group on biological agents published by the Dutch Occupational Hygiene Society (Nederlandse vereniging voor Arbeidshygiëne, NvvA) recommends a workplace limit of 10,000 colony forming units (CFU) per m3 and 500 CFU/m3 for one particular fungus (CGBF). The Committee on Bio-aerosols of the American Conference of Governmental Industrial Hygienists has recommended that the concentration of saprophytic micro-organisms in the indoor atmosphere may be one third that of the outdoor atmosphere if the outdoor atmosphere is the only source of micro-organisms (Burge et al., 1987). As stated above, these guideline values cannot be interpreted as health-based guideline values.
4.2 Fungal components
4.2.1 ß(1→3)-glucanes ß(1→3)-glucanes are components of the cell walls of fungi, certain bacteria and most plants. They consist of a large number of glucose monomers with ß(1→3) links between them (Williamson, 1997; Stone and Clarke, 1992). According to studies in Sweden and Switzerland, higher (approximately 10 - 100 times higher) concentrations of ß(1→3)-glucanes are measured in buildings affected by fungi than in houses and offices without damp or fungus problems (Rylander et al., 1992; Rylander et al., 1994). ß(1→3)-glucanes have recently been associated with human respiratory tract problems. However, the concentrations at which in vitro effects have been observed are many times higher than those of endotoxins, for example (up to 100 - 1000 times higher) (Sigsgaard et al., 2000). So far, only a few epidemiological field studies have been undertaken on the role of glucanes. Some smaller Swedish studies indicate a link between the airborne ß(1→3)-glucane concentration (measured in a children's nursery, post office, two schools, a paper mill and the residential environment) and symptoms such as coughing and throat and eye irritation (Rylander et al., 1992; Rylander, 1997a, 1997b; Rylander et al., 1999). One of these studies (in the residential environment) also indicated a positive link with atopy and reduced lung function (Rylander et al., 1998). Some experimental exposure studies on volunteers in
Page 36 of 97 RIVM report 609021044
Sweden confirm this impression. However, the measured effects were relatively mild (Rylander, 1996; Fogelmark et al., 2001). A larger study in the Netherlands, covering 159 children, showed a positive relationship between glucanes detected in house dust and peak flow variability (a measure of the seriousness of asthma) in children with respiratory tract problems (Douwes et al., 2000). Data from animal experiments also appears to indicate that glucanes enhance the effect of endotoxins on the respiratory tract (respiratory tract infections) in the event of long-term, combined exposure (Fogelmark et al., 1992, 1994). Although given in vitro studies it is likely that ß(1→3)-glucanes have a causal role in the development of respiratory tract symptoms, at present there is insufficient epidemiological evidence. No guideline value At present it is not possible to set a guideline value for ß(1→3)-glucanes in the residential environment. This is primarily due to the fact that at present there is insufficient epidemiological data to confirm the potential role of glucanes in the indoor environment on the development or worsening of respiratory tract symptoms. A further problem is that at present two tests are used to measure glucanes and it is uncertain to what extent their outcomes are comparable. One of these tests is based on the Limulus Amebocyte Lysate (LAL) test which is comparable with the LAL test for measuring endotoxins (see 4.4.1) (Aketagawa et al., 1993). The other test is an enzyme immunoassay (EIA) developed in the Netherlands by the IRAS, Utrecht University (previously Health Studies at Wageningen University) (Douwes et al., 1996).
4.2.2 Allergens Many common fungi produce IgE inducing allergens (type I allergens) which can lead to sensitisation and allergies in susceptible individuals. Some studies have indicated a prevalent atopic (IgE) sensitisation to fungi allergens in residents of damp dwellings (Norback et al., 1999) and asthma sufferers (Black et al., 2000). A major European multicentre study also indicated an association between sensitisation to fungi (Alternaria Alternata and Cladosporium herbarum) and the seriousness of the complaints of asthma sufferers (Zureik et al., 2002). Allergic reactions to Alternaria exposure in the outdoor environment have also been demonstrated (Halonen et al., 1997). Given studies it is plausible that fungal allergens in the indoor environment can indeed lead to health effects. However, as it is difficult to measure fungal allergens (and IgE due to these allergens) because of the huge variation in allergen expression within and between fungus species, it is unclear how relevant these allergens are as a risk factor in health problems associated with the indoor environment. It is also unclear at what concentrations effects (IgE sensitisation and symptoms) may occur. No guideline value Given the current literature, it is not possible to set a guideline value for fungal allergens in the indoor environment.
4.2.3 Mycotoxins Mycotoxins are low molecular weight compounds which are highly toxic to humans and animals. Penicillin is one of the best known mycotoxins. Other well-known
RIVM report 609021044 Page 37 of 97
mycotoxins include carcinogenic mycotoxins such as aflatoxin. There has been significant media interest in mycotoxins in the indoor environment, particularly in the US. In the US, trychocetenes (highly toxic mycotoxins produced by Stachybotrys fungi) have been associated with an outbreak of life-threatening acute pulmonary haemorrhage in babies, which has led to the death of some of these babies (Montana et al., 1997). Although Stachybotrys mycotoxins are suspected to be relevant in the residential environment there is currently insufficient evidence to support this (Miller et al., 2003). Given the current literature, there is no reason to assume that mycotoxins are an important risk to public health in the indoor environment. No guideline value Given the current literature, it is not possible to set a guideline value for mycotoxins in the indoor environment.
4.2.4 Volatile organic compounds The volatile organic compounds (VOC) produced by fungi are responsible for the musty (mouldy) odour often found in damp dwellings (Keller et al., 1999). Microbial VOC in concentrations above the odour threshold may lead to a general feeling of discomfort. It has also been suggested that exposure may lead to irritation of the eyes and respiratory tract and symptoms such as headaches, dizziness, nausea and fatigue (Burge, 1990; Tobin et al., 1987; Korpi et al., 1999). However, at present there is insufficient evidence for this. No guideline value Given the current literature, it is not possible to set a guideline value for microbial VOC in the indoor environment.
4.3 Bacteria With the exception of the work done on endotoxins (see section 4.4.1), there has been little research on exposure to bacteria in the residential environment and its potential health effects. A study of 88 adults in Sweden indicated a significant association between the concentration of bacteria in the air and the occurrence of asthma symptoms (Bjornsson et al., 1995). There are also some in vitro studies suggesting a link between health effects and exposure to Streptomycetes, a group of spore-forming bacteria (Hirvonen et al., 1997; Huttunen et al., 2003). However, so far there is insufficient evidence to prove a link between bacteria and exposure to Streptomycetes. No guideline value Given the current literature, it is not possible to set a guideline value for bacteria in the indoor environment.
Page 38 of 97 RIVM report 609021044
4.4 Bacterial components
4.4.1 Endotoxins Endotoxins form part of the outer membrane of Gram-negative bacteria. Lipopolysaccharide is the most important component of endotoxins and is responsible for their toxicity. Endotoxins are widely found in the residential environment and occur in concentrations of 500 - 2000 ng/g in house dust (5,000 – 20,000 endotoxin units/g dust) (Douwes et al., 2000). There are few indoor measurements outside other than those in workplaces. A US study measured an average indoor atmosphere concentration of 64 pg/m3 which is extremely low compared to workplace concentrations (Park et al., 2001). Peak exposures are likely to occur during certain domestic activities such as vacuum cleaning, making beds, etc. but this has not been studied in detail. There are no clearly proven associations between endotoxin concentrations and damp dwellings (Bischof et al., 2002); however, a link has been proven between raised endotoxin concentrations in house dust and the presence of pets (Douwes et al., 2000; Park et al., 2001) as well as keeping a bin for organic kitchen and garden waste indoors (Wouters et al., 2000). Experimental and epidemiological studies in the workplace have demonstrated a clear link between exposure to endotoxins and acute and chronic respiratory effects (DECOS 1998; Douwes et al., 2002). After inhalation the following effects may occur in humans: dry cough, shortness of breath with an impaired lung function, fever and general malaise, headaches and joint complaints (Pernis et al., 1961; Michel et al., 1992, 1997; Michel 1997). Those with existing respiratory tract problems such as CARA (asthma and bronchitis) were found to react more strongly to exposure to endotoxins (Zwan et al., 1982; Michel et al., 1989, 1992). The dose at which effects occurred ranged from approximately 5 to 20 µg. In healthy, nonallergic subjects, reproducible differences affecting the respiratory tract were shown between individuals after experimental exposure to endotoxins (Kline et al., 1999; Michel et al., 2001). The study by Kline et al. demonstrated even clearer effects (a reduction in lung function (FEV1) of more than 20%) following a dose of 6.5 µg in the most sensitive group. The least sensitive group showed only a minor effect (difference in lung function less than 10%) even when exposed to 41.5 µg. This suggests that it is possible that only sensitive subpopulations are at risk from endotoxins. There is insufficient evidence to conclude that workplace exposure to endotoxins can lead to respiratory effects (DECOS, 1998; Douwes et al., 2002). However, there have only been few studies on the effects of exposure to endotoxins in the residential environment. Michel et al. in Belgium (1996) found a positive association between endotoxin concentrations in house dust (average concentration 1.78 ng/mg) and increases in the number of complaints and use of medication among 69 adult sufferers of asthma. Furthermore, exposure to endotoxins was associated with an impaired lung function ( FEV1). This was confirmed by a smaller study in Brazil, among 10 children suffering from asthma and 10 children as controls (Rizzo et al., 1997). A study of 159 children in the Netherlands showed a link between endoxotin concentrations in house dust and an increase in peak flow variation in children with asthma symptoms (Douwes et al., 2000). This association disappeared after making a correction for the presence of pets, as the presence of pets showed a strong link with endotoxin concentrations. The average endotoxin concentrations in this study ranged from 1 - 100 endotoxin units/mg (~ 0.1 - 10 ng/mg). These studies suggest that endotoxins in
RIVM report 609021044 Page 39 of 97
the residential environment may exacerbate existing respiratory complaints such as asthma. As discussed earlier, there are also some studies indicating that limited exposure to endotoxins during the first years of life protects against the development of allergies and asthma (Gereda et al., 2000; Braun – Fahrlander et al., 2002; Bőttcher et al., 2002). At present, it is not clear at what concentrations this protective effect may be expected. However, the concentrations measured in these studies were not significantly different from the concentrations measured in earlier studies which suggested that exposure may lead to a worsening of existing respiratory tract problems. No guideline value The Health Council has recommended a health-based limit of 50 endotoxin units/m3 (~ 5 ng/m3) in workplace environments, based on a personal respirable dust fraction measured as an 8-hour weighted average (DECOS, 1998). As the Health Council report was based on the endotoxin concentration in air this limit is of little use for determining the health hazard of endotoxin concentrations in house dust (endotoxin concentrations in the residential environment are normally based on house dust analysis). A further problem when setting a limit for endotoxins is posed by the lack of standardisation of measurement methods. The most widely used method to detect endotoxins is the kinetic Limulus Amebocyte Lysate (LAL) test. However, the results may be affected by interfering compounds in dust extracts and variability of the LAL reagent, as well as other factors. Furthermore, the sampling, extraction and storage methods applied before the LAL test are not standardised and it is known that differences in extraction methods can lead to substantial differences in exposure estimates (Douwes et al., 1995). The Health Council report recommends a standard analytical procedure to minimise differences in exposure estimates resulting from different extraction and analysis protocols. Consequently, at present there is no data for reliable quantitative estimates of the concentrations at which beneficial or harmful health effects may occur in dwellings. Even so, concentrations exceeding 50 EU/m3 (the workplace limit) should always be avoided. Given the above uncertainties it is not possible to set a more definite guideline value.
4.4.2 Peptidoglycans Peptidoglycans are another group of bacterial components in the indoor environment which pose a potential health hazard. Peptidoglycans are cell wall compounds found in all bacteria and especially in Gram-positive bacteria. Like endotoxins they have strong pro-inflammatory properties. Peptidoglycans have been found in air conditioning system filters and several workplace environments (Verhoef and Kalter, 1985; Sonesson et al., 1988; Zhiping et al., 1996). However, at present there are no published detailed studies of a potential link between exposure to peptidoglycans and health effects in the residential environment No guideline value Given the current literature, it is not possible to determine a guideline value for peptidodoglycans.
Page 40 of 97 RIVM report 609021044
4.5 House dust mite allergens House dust mites are arachnids and the most common species in house dust are Dermatophagoides pteronyssinus and D. farinae. They are extremely common in temperate climates and hence also in the Netherlands. Mattresses, upholstered furniture, rugs and carpets provide an ideal microclimate to mites with an adequately high relative humidity and nutrients (skin fragments, fungi and other organic matter) (Platts-Mills and De Weck, 1989). House dust mite faeces contains potent allergens (group I allergens) and a number of major allergens have been identified, including Der pI and Der fI, produced by, respectively, D. pteronyssinus and D. farinae (Lind, 1985; Platts-Mills and Chapman, 1987; Platts-Mills et al., 1992). Mite allergen concentrations in house dust vary greatly between dwellings and the concentrations depend greatly on the presence of carpet and rugs in the dwelling and (to a lesser extent) on the measured relative humidity, date of construction of the dwelling, age of the mattress, etc. (Van Strien et al., 1994). A 1990 study of 516 dwellings in the Netherlands showed that in 86% of the dwellings the maximum Der pI concentration in house dust exceeded 2 µg/g, and in 55% it even exceeded 10 µg/g (Van Strien et al., 1994). A concentration of 2 µg/g has been suggested as a health-based limit for the development of atopic sensitisation and asthma and 10 µg/g for acute asthma attacks in allergic individuals (Platts-Mills and De Weck, 1989). A more recent study in the Netherlands suggests that the concentration of house dust mite allergens has fallen (Van Strien et al., 2002). However, the differences in methods and the studied populations were such that a direct comparison is not possible. Only a few studies included measurements of mite allergens in air, and the concentrations were generally very low (Custovic et al., 1999). Peak exposures are likely to occur during certain domestic activities such as vacuum cleaning, making beds, etc. but this has not been studied in detail. Many studies show an association between exposure to mite allergens (measured in house dust) and (IgE) sensitisation (Wahn et al., 1997; Sporik et al., 1990; Platts-Mills et al., 1997). Sensitisation to mites shows a strong association with asthma (Sears et al., 1989; Sporik et al., 1990; Peat et al., 1996). It is also known that asthma patients allergic to mites show significantly fewer symptoms in an environment without exposure to house dust mites (e.g. in the Alps where the relative humidity is too low for house dust mites) (Spieksma et al., 1971; Boner et al., 1985). Several cross-sectional studies have also demonstrated associations between exposure to mite allergens and symptoms in allergic subjects (Peat et al., 1987). Hence, there is sufficient evidence that mite allergens can lead to complaints affecting allergic asthmatic subjects (secondary causation). However, given that most of these studies were cross-sectional it is difficult to determine whether there is also a link between exposure to mite allergens and the primary development of asthma (primary causation). A longitudinal study of 67 children from families prone to allergies showed a direct link between exposure to house dust mites and the primary development of asthma, but this link was not statistically significant (Sporik et al., 1990). Furthermore, this was not confirmed by two larger birth cohort studies with 453 and 939 children each (Burr et al., 1993; Lau et al., 2000). Both studies followed babies for 7 years and did not find an association between asthma and exposure to mite allergens. Hence, house dust mite allergens do not appear to have a significant role in the primary development of asthma (Pearce et al., 2000; Lau et al., 2000).
RIVM report 609021044 Page 41 of 97
Apart from asthma, exposure to mite allergens has also been associated with atopic dermatitis (Huang et al., 2001; Pajno et al., 2003) No guideline value During a workshop on exposure to mite allergens and asthma, organised by the WHO, a guideline was proposed of 2 µg/g house dust for the development of atopic sensitisation and asthma and 10 µg/g for symptoms in allergic subjects (Platts-Mills and De Weck, 1989). These limits were confirmed by a later workshop. However, it was noted that they only apply to part of the population and that these levels were probably too high for the most susceptible individuals (Platts-Mills et al., 1992). Approximately ten years after these initial initiatives by the WHO, the Committee on the assessment of asthma and indoor air of the National Academy of Sciences concluded in its report that ‘… results strongly support a dose-response relationship between exposure and development of sensitization, with an approximate threshold of 2 µg/g. This report also stated that this limit cannot be used in the same way as limits for chemicals as 1) high concentrations of mite allergens are not toxic to nonallergic subjects; 2) concentrations below the limit may still initiate symptoms in highly sensitive allergic asthmatics; and 3) concentration measurements in dust are only a most indirect measure of exposure. One should also be aware that many of those sensitised to mite allergens do not actually develop any symptoms (Platts-Mills and De Weck, 1989. A longitudinal study demonstrated sensitisation to mites at concentrations below the suggested limit of 2 µg/g dust (Price et al., 1990; Wahn et al., 1997). Partly in view of these uncertainties and the uncertainties about the role of house dust mites in the primary causation of health effects it is currently not possible to recommend guideline values for house dust mite allergens. Furthermore, sampling and analysis methods should be standardised before a limit for mite allergens can be generally applied.
4.6 Pet and cockroach allergens Many people in the Netherlands have a cat or dog, which is generally kept indoors. The fur, skin and saliva of cats and dogs contain allergens which, unlike house dust mite allergens, may remain suspended in the air for long periods and which are also easily spread on clothing, etc. (Custovic et al., 1997; Egmar et al., 1998). Cat and dog allergens are widespread in the Netherlands and may be found in raised concentrations in dwellings (and in public spaces such as schools and hospitals (Berge et al., 1998; Custovic et al., 1998)) where dogs and cats are not actually kept. The most important cat and dog allergens are Fel dI and Can fI (Schou, 1993). Although a study in Amsterdam showed that measurable concentrations of cockroach allergens were found in 44% of the 46 dwellings studied (Van Wijnen et al., 1997) it is likely that cockroach allergens are less widespread in the Netherlands than cat and dog allergens. The most important cockroach species in the Netherlands is the German cockroach (Blatella germanica). Bla gI is the most important allergen associated with Blatella germanica (Schou et al., 1990). Exposure to cat and dog allergens can lead to nose and respiratory tract symptoms in those allergic to cats and dogs (secondary causation) (Vanto et al., 1980; Sichere et
Page 42 of 97 RIVM report 609021044
al., 1983). Although sensitisation to cat and dog allergens has been associated with asthma (Sears et al., 1989; Litonjua et al., 1997) an unambiguous association between asthma and exposure to pets and their allergens has never been demonstrated (Celedon et al., 2002; Anyo et al., 2002). Many of the more recent studies even report that exposure to pets has a negative association with sensitisation and asthma (Svanes et al., 1999; Hesselmar et al., 1999; Ownby et al., 2002; Linneberg et al., 2003). Consequently, exposure to pets is more likely to protect against the development of asthma than to cause it (primary causation). Further studies will be required to explain the paradoxical role of exposure to pets and the development of asthma. There is sufficient evidence that cockroach allergens can lead to symptoms in subjects allergic to cockroaches (secondary causation) (Kang, 1976). Furthermore, several studies have shown a clear dose-response relationship between exposure to cockroach allergens and sensitisation to cockroaches (Eggleston et al., 1998; Rosenstreich et al., 1997). However, at present it is not entirely clear if exposure to cockroaches can also cause asthma (primary causation). There have hardly been any studies on cockroach allergens in the Netherlands and the nature and scale of any problems associated with cockroach allergens is therefore unclear. No guideline value Given the current literature, it is not possible to set a guideline value for pet and cockroach allergens.
RIVM report 609021044 Page 43 of 97
4.7. References Aketagawa J et al. Activation of limulus coagulation factor G by several (1 3)-ß-D-
glucans: comparison of the potency of glucans with identical degree of polymerization but different conformations. J Biochem 1993; 113: 683–6.
Andriessen J.W., Brunekreef B., Roemer W. Home dampness and respiratory health status in European children. Clin Exp Allergy 1998;28:1191-1200.
Anyo G., Brunekreef B., de Meer G., et al. Early, current and past pet ownership: associations with sensitization, bronchial responsiveness and allergic symptoms in school children. Clin Exp Allergy 2002; 32: 361-6
Belanger K. et al. Symptoms of wheeze and persistent cough in the first year of life: associations with indoor allergens, air contaminants, and maternal history of asthma. Am J Epidemiol, 2003; 158:203-206.
Berge M., Munir A.K., Dreborg S. Concentrations of cat (Fel dI), dog (Can fI) and mite (Der fI and Der pI) allergens in the clothing and school environment of Swedish school children with and without pets at home. Pediatric Allergy and Immunoly 1998;9:25-30
Bischof W., Koch A., Gehring U., Fahlbusch B., Wichmann H.E., Heinrich J.; Indoor Exposure and Genetics in Asthma Study Group. Predictors of high endotoxin concentrations in the settled dust of German homes. Indoor Air. 2002;12:2-9.
Black P.N., Udy A.A., Brodie S.M. Sensitivity to fungal allergens is a risk factor for life-threatening asthma. Allergy 2000;55:501-4.
Boner A.L., Niero E., Antolini I., Valietta A., Gaburro D. Pulmonary function and bronchial hyperreactivity in asthmatic children with house dust mite allergy during prolonged stay in the Italian Alps (Misurina, 1756m) Ann Allergy 1985;54:42-5.
Bornehag C.G., Blomquist G., Gyntelberg F., et al. Dampness in buildings and health. Nordic interdisciplinary review of the scientific evidence on associations between exposure to ‘dampness’ in buildings and health effects (NORDDAMP). Indoor Air 2001;11:72-86.
Bőttcher M.F., Björkstén B., Gustafson S., Jenmalm M.C.. Endotoxin levels in Estonian and Swedish house dust and atopy in infancy. Clin Exp Allergy 2003;33:295-300.
Braun-Fahrlander C. Environmental exposure to endotoxin and other microbial products and the decreased risk of childhood atopy: evaluating developments since April 2002. Curr Opin Allergy Clin Immunol. 2003;3:325-9.
Braun-Fahrlander C., Riedler J., Herz et al. Allergy and Endotoxin Study Team. Environmental exposure to endotoxin and its relation to asthma in school-age children. N Engl J Med 2002;347:869-77.
Brunekreef B. Damp housing and adult respiratory symptoms. Allergy 1992; 47:498-502.
Burge H. Bioaerosols: Prevalnce and health effects in the indoor environment. J Allergy Clin Immunol 1990;86:687-701.
Burge H.A., Chatigny M., Feeley J., Kreiss K., Morey P., Otten J., Peterson K. Guidelines for the assessment and sampling of saprophytic bioaerosols in the indoor environment. Appl Indust Hyg 1987;2:R10-R16.
Burr M.L., Limb E.S., Maguire M.J., et al. Infant bedding, wheezing, and allergy: a prospective study. Arch Dis Child 1993;68:724-8.
Page 44 of 97 RIVM report 609021044
Celedon JC, Litonjua AA, Ryan L, Platts-Mills T, Weiss ST, Gold DR. Exposure to cat allergen, maternal history of asthma, and wheezing in first 5 years of life. Lancet. 2002; 360:781-2.
Chew G., Douwes J., Doekes G., et al. Fungal extracellular polysaccharides, β (1→3)-glucans, and culturable fungi in repeated sampling of house dust. Indoor Air 2001;11:171-178.
Cuijpers C.E.J., Swaen G.M.H., Wesseling G., Sturmans F., Wouters E.F.M. Adverse effects of the indoor environment on respiratory health in primary school children. Env Res 1995;68:11-23.
Custovic A., Green R., Fletcher A., Smith A., Pickering C.A., Chapman M.D., Woodcock A. Aerodynamic proerties of the major dog allergen Can fI: distribution in homes, concentration, and particle size of allergen in the air. Am J Resp Crit Care Med 1997;155:94-98.
Custovic A., Fletcher A., Pickering C.A., Francis H.C., Green R., Smith A., Chapman M., Woodcock A. Domestic allergens in public places. III: House dust mite, cat, dog and cockroach allergens in British hospitals. Clin Exp Allergy 1998;28:53-59.
Custovic A., Simpson B., Simpson A., Hallam C., Craven M., Woodcock A. Relationship between mite, cat and dog allergens in reservoir dust and ambient air. Allergy 1999;54:612-6.
Decos (Dutch Expert Committee on Occupational Standards) (1998) Endotoxins: Health based recommended exposure limit. A report of the Health Council of the Netherlands. Rijswijk: Health Council of the Netherlands; publication no 1998/03WGD.
Dharmage S., Bailey M., Raven J., Abeyawickrama K., Cao D., Guest D., Rolland J., Forbes A., Thien F., Abramson M., Walters E.H.. Mouldy houses influence symptoms of asthma among atopic individuals. Clin Exp Allergy. 2002 May;32(5):714-20.
Douwes J., Doekes G., Montijn R., Heederik D., Brunekreef B. Measurement of ß(1→3)-glucans in the occupational and home environment with an inhibition enzyme immunoassay. Appl Environ Microbiol 1996;62:3176-82.
Douwes J., van der Sluis B., Doekes G., et al. Fungal extracellular polysaccharides in house dust as a marker for exposure to fungi: Relations with culturable fungi, reported home dampness and respiratory symptoms. J Allergy Clin Immun 1999;103:494-500.
Douwes J., Zuidhof A., Doekes G., van der Zee S., Wouters I., Boezen H.M., Brunekreef B.. (1→3)-ß-D-glucan and endotoxin in house dust and peak flow variability in children. Am J Resp Crit Care Med 2000;162:1348-54.
Douwes J, Pearce N, Heederik D. Does bacterial endotoxin prevent asthma? Thorax 2002;57:86-90.
Douwes J and Pearce N. Asthma and the westernization ‘package’. Int J Epidemiol 2002;31:1098-1102.
Douwes J and Pearce N. Is indoor mould exposure a risk factor for asthma? Am J Epidemiol, 2003; 158:203-206.
Douwes J, Thorne P, Pearce N, Heederik D. Bioaerosol health effects and exposure assessment: Progress and prospects. Annals Occup Hyg 2003;47:187-200.
Eduard W., Heederik D (1998): Methods for quantitative assessment of airborne levels of non-infectious micro-organisms in highly contaminated work environments. Am Ind Hyg Assoc J;59:113-27.
Eggleston PA, Rosenstreich D, Lynn H, Gergen P, Baker D, Kattan M, Mortimer KM, Mitchell H, Ownby D, Slavin R, Malveaux F. Relationship of indoor allergen
RIVM report 609021044 Page 45 of 97
exposure to skin test sensitivity in inner-city children with asthma. J Allergy Clin Immunol. 1998;102:563-70.
Egmar AC, Emenius S, Almqvist C, Wickman M. Cat and dog allergens in mattresses and textile covered floors of homes which do or do not have pets, either in the past or currently. Pediatr Allergy Immunol 1998;9:31-5.
Engvall K, Norrby C, Norback D. Asthma symptoms in relation to building dampness and odour in older multifamily houses in Stockholm. Int J Tuberc Lung Dis 2001;5:468-77.
Fogelmark B, Goto H, Yuasa K, Marchat B, Rylander R. Acute pulmonary toxicity of inhaled (1→3)-ß-D-glucan and endotoxin. Agents Action 1992;35:50-5.
Fogelmark, B, Sjöstrand M, Rylander R. Pulmonary inflammation induced by repeated inhalations of ß(1→3)-D-glucan and endotoxin. International Journal Exp Pathology 1994;75: 85-90.
Fogelmark B, Thorn J, Rylander R. Inhalation of (1→3)-ß-D-glucan causes airway eosinophilia. Mediators of Inflammation 2001;10:13-9.
Garrett MH, Rayment PR, Hooper MJ. Indoor fungal spores, house dampness and associations with environmental factors and respiratory health in children. Clin Exp Allergy 1998;28:459-467.
Gereda JE, Leung DYM, Thatayatikom A, et al. Relation between house-dust endotoxin exposure, type 1 T-cell development, and allergen sensitisation in infants at high risk of asthma. Lancet 2000; 355: 1680-83.
Halonen M, Stern DA, Wright AL, et al. Alternaria as a major allergen for asthma in children raised in a desert environment. Am J Resp Crit Care Med 1997;155:1356-61.
Hesselmar N, Aberg N, Aberg B, Eriksson-B, Björkstén B. Does early exposure to cat or dog protect against allergy development? Clin. Exp. Allergy 1999; 29: 611-7.
Hirvonen MR, Nevalainen A, Makkonen N, Monkkonen J, Savolainen K. Induced production of nitric oxide, tumor necrosis factor, and interleukin-6 in RAW 264.7 macrophages by streptomycetes from indoor air of moldy houses. Arch Environ Health. 1997;52:426-32.
Huang JL, Chen CC, Kuo ML, Hsieh KH. Exposure to high concentration of mite allergen in early infancy is a risk factor for developing atopic dermatitis: a 3-year follow-up. Pediatr Allergy Immunol 2001;12:11-6
Huttunen K, Hyvarinen A, Nevalainen A, Komulainen H, Hirvonen MR. Production of proinflammatory mediators by indoor air bacteria and fungal spores in mouse and human cell lines. Environ Health Perspect. 2003 Jan;111(1):85-92.
Kang B. Study on cockroach antigen as a probable causative agent in bronchial asthma. J Allergy Clin Immunol 1976;58:357-365.
Keller R, Senkpiel K, Ohgke H. Use of MVOC measurements and odor perception as indicators of mould in indoor areas. In Johanning E (ed.), Bioaerosols, fungi, and mycotoxins: Health effects, assessment, prevention and control. Eastern New York Occupational and Environmental Health Center, Alany, New York, 1999, pp. 532-537.
Kilpeläinen M, Terho EO, Helenius H, et al. Home dampness, current allergic diseases, and respiratory infections among young adults. Thorax 2001;56:462-467.
Kline JN, Cowden JD, Hunninghake GW, et al. Variable airway responsiveness to inhaled lipopolysaccharide. Am J Respir Crit Care Med 1999;160:297-303.
Korpi A, Kasanen JP, Kosma AY. Sensory irritating potency of some microbial volatile organic compounds (MVOC’s) and a mixture of five MVOC’s. Arch Environ Health 1999;54:347-52.

Page 46 of 97 RIVM report 609021044
Lau S, Illi S, Sommerfeld C, Niggemann B, Bergmann R, von Mutius E, Wahn U. Early exposure to house-dust mite and cat allergens and development of childhood asthma: a cohort study. Multicentre Allergy Study Group. Lancet 2000;356:1392-7.
Li CS, HSU CW, Lu CH. Dampness and respiratory symptoms among workers in daycare centers in a subtropical climate. Arch Environ Health 1997;52:68-71.
Lind P. Purification and partial characterisation of two major allergens from the house dust mite Dermatophagoides pteronyssinus. J Allergy Clin Immunology 1985;76:753-761.
Linneberg A, Nielsen NH, Madsen F, Frølund L, Dirksen A, Jørgensen T. Pets in the home and the development of pet allergy in adulthood. The Copenhagen Allergy Study. Allergy 2003;58:21-26.
Litonjua AA, Sparrow D, Weiss ST, O’Connor GT, Long AA, Ohman JL Jr. Sensitization to cat allergen is associated with asthma in older men and predicts new-onset airway hyperresponsiveness. The Normative Aging Study. Am J Respir Crit Care Med 1997;156:23-27.
Martinez FD, Holt PG. Role of microbial burden in aetiology of allergy and asthma. Lancet 1999;354:12-5.
Michel O, Duchateau J, Sergysels R. Effects of inhaled endotoxin on bronchial reactivity in asthmatic and normal subjects. J Appl Physiol 1989;66:1059-64.
Michel O, Ginanni R, Le Bon B, Content J, Duchateau J, Sergysels R. Inflammatory response to acute inhalation of endotoxin in asthmatic patients. Am Rev Respir Dis 1992;146:352-7.
Michel O, Kips J, Duchateau J, Vertongen F, Robert L, Collet H, Pauwels R, Sergysels R. Severity of asthma is related to endotoxin in house dust. Am J Respir Crit Care Med 1996;154:1641-46.
Michel O. Human challenge studies with endotoxins. Int J Occup Env Health 1997;3 (suppl 1):S18-25.
Michel O, Nagy AM, Schroeven M, Duchateau J, Neve J, Fondu P, Sergysels R. Dose-response relationship to inhaled endotoxin in normal subjects. Am J Respir Crit Care Med 1997;156:1157-64.
Michel O, Dentener M, Corazza F, et al. Healthy subjects express differences in clinical responses to inhaled lipopolysaccharide that are related with inflammation and with atopy. J Allergy Clin Immunol 2001;107:797-804.
Miller JD, and Young JC. The use of ergosterol to measure exposure to fungal propagules in indoor air. Am Ind Hyg Assoc J 1997;58:39-43.
Miller JD, Rand TG, Jarvis BB. Stachybotrys chartarum: cause of human disease or media darling? Med Mycol. 2003;41:271-91.
Montana E, Etzel R, Allan T, Horgan TE, Dearborne DG. Environmental risk factors associated with pediatric idiopathic pulmonary hemorrhage and hemosiderosis in a Cleveland community. Pediatrics 1997;99:E51-E58 [supplement].
Nafstad P, Øie L, Mehl R et al. Residential dampness problems and symptoms and signs of bronchial obstruction in young Norwegian children. Am J Respir Crit Care Med 1998;157:410-414.
National Academy of Sciences. Clearing the air. Asthma and indoor exposures. National Academy Press 2000, Washington.
Norback D, Bjornsson E, Janson C, et al. Current asthma and biochemical signs of inflammation in relation to building dampness in dwellings. Int J Tuberc Lung Dis 1999;3:368-76.
RIVM report 609021044 Page 47 of 97
Ownby DR, Johnson CC, Peterson EL Exposure to dogs and cats in the first year of life and risk of allergic sensitization at 6 to 7 years of age. JAMA. 2002;288:963-72.
Pajno GB, Peroni DG, Barberio G, Pietrobelli A, Boner AL. Predictive features for persistence of atopic dermatitis in children. Pediatr Allergy Immunol 2003;14:292-5.
Park JH, Spiegelman DL, Gold DR, Burge HA, Milton DK. Predictors of airborne endotoxin in the home. Environ Health Perspect. 2001;109:859-64.
Pasanen A-L, Yli-Pietilä, Pasanen P, et al. Ergosterol content in various fungal species and biocontaminated building materials. Appl Environ Microbiol 1999;65:138-142.
Pearce N, Douwes J, Beasley R. Is allergen exposure the major primary cause of asthma? Thorax 2000;55:424-431.
Peat JK, Britton WJ, Salome CM, Woolcock AJ. Bronchial hyperresponsiveness in two populations of Australian schoolchildren. III. Effect of exposure to environmental allergens. Clin Allergy 1987;17:297-300.
Peat JK, Tovey E, Toelle BG, Haby MM, Gray EJ, Mahmic A, Woolcock AJ. House dust mite allergens. A major risk factor for childhood asthma in Australia. Am J Resp Crit Care Med 1996;153:141-146.
Peat JK, Dickerson J, Li J. Effects of damp and mould in the home on respiratory health: a review of the literature. Allergy 1998;53:120-8.
Pernis B, Vigliani EC, Cavagna C. (1961) The role of bacterial endotoxins in occupational diseases caused by inhaling vegetable dusts. Brit J Ind Med;18:120-9.
Pirhonen I, Nevalainen A, Husman T, Pekkanen J. Home dampness, moulds and their influence on respiratory infections and symptoms in adults in Finland. Eur Respir J 1996;9:2618-2622.
Platts-Mills TAE, De Weck AL. Dust mite allergens and asthma: a world wide problem. International workshop report. J Allergy Clin Immunol 1989;83:416-427.
Platts-Mills TAE, MD Chapman. Dust mites: immunology, allergic disease, and environmental control. J Allergy Immunol 1987;80:755-777.
Platts-Mills T.A.E,. Thomas W.R, Aalberse R.C., Vervloet D., Chapman M.D.. Dust mite allergens and asthma: report of a second international workshop. J Allergy Clin Immunol 1992;89:1046-1060.
Platts-Mills T.A., Vervloet D., Thomas W.R., Aalberse R.C., Chapman M.D. Indoor allergens and asthma: report of the Third International Workshop, Cuenca, Spain. J allergy Clin Immunol 1997;100:s2-s24.
Price J.A., Pollock I., Little S.A., Longbottom J.L., Warner J.O. Measurement of airborne mite antigen in homes of asthmatic children. Lancet 1990;336:895-897.
Rizzo M.C., Naspitz C.K., Fernandez-Cladas E., et al. Endotoxin exposure and symptoms in asthmatic children. Pediatric Allergy Immunol 1997;8:121-26.
Rosenstreich D.L., Eggleston P., Kattan M., Baker D., Slavin R.G., Gergen P., Mitchell H, McNiff-Mortimer K., Lynn H., Ownby D., Malveaux F. The role of cockroach allergy and exposure to cockroach allergen in causing morbidity among inner-city children with asthma. N Engl J Med. 1997 May 8;336(19):1356-63.
Rylander R., Persson K., Goto H., Yuasa K., Tanaka S. Airborne Beta-1,3-Glucan may be related to symptoms in sick buildings. Indoor Environment 1992;1:263-7.
Rylander R., Hsieh V., Courteheuse C. The first case of sick building syndrome in Switzerland. Indoor Environment 1994;3:159-62.
Page 48 of 97 RIVM report 609021044
Rylander R. Airway responsiveness and chest symptoms after inhalation of endotoxin or (1→3)-ß-D-Glucan. Indoor Built Environment 1996;5:106-11.
Rylander R. Airborne (1→3)-ß-D-glucan and airway disease in a Day-care center before and after renovation. Archives of Environmental Health 1997a;52: 281-5.
Rylander R. Investigations of the relationship between disease and airborne (1→3)-ß-D-glucan in building. Mediators of inflammation 1997b;6:257-77.
Rylander R, Norhall M, Engdahl U, Tunsäter A, Holt PG. Airways inflammation, atopy, and (1→3)-ß-D-glucan exposure in two schools. American Journal of Respiratory and Critical Care Medicine 1998;158:1685-7.
Rylander R, Thorn J, Attefors R. Airways inflammation among workers in a paper industry. Eur Resp J 1999;13: 1151-7.
Schou C, Lind P, Fernandez-Caldas E, Lockey RF, Lowenstein H. Identification and purification of an important cross-reactive allergen from American (Periplaneta Americana) and German (Blattella germanica) cockroach. J Allergy Clin Immunol 1990;86:935-946.
Schou C. Defining allergens of mammalian origin. Clin Exp Allergy 1993;23:7-14. Sears MR, Herbison GP, Holdaway MD, Hewitt CJ, Flannery EM, Silva, PA. The
relative risk of sensitivity to grass pollen, house dust mite and cat dander in the development of childhood asthma. Clin Exp Allergy 1989;19:419-424.
Sichere SH, Wood RA, Egglestone PA. Determinants of airway responses to cat allergen: comparison of environmental challenge to quantitative nasal and bronchial challenge. J Allergy Clin Immunol 1997;99:798-805
Sonesson A, Larsson L, Fox A, Westerdahl G, Odham G. Determination of environmental levels of peptidoglycan and lipopolysaccharide using gas chromatography-mass spectrometry utilizing bacterial amino acids and hydroxy fatty acids as biomarkers. J Chromatogr Biomed Appl 1988;431:1-15.
Spieksma FThM, Zuidema P, Leupen MJ, High altitude and house-ust mites. Br Med J 1971;1:82-4.
Sporik R, HolgateST, Platts-MillsTAE, Cogswell JJ. Exposure to house dust mite allergen (Der p1) and development of asthma in childhood. A prospective study. N Engl J Med 1990;323:502-7.
Stone BA, Clarke AE. Chemistry and Biology of 1, 3-[beta]-Glucans 1992 - La Trobe University Press Victoria, Australia
Strien van RT, Verhoeff AP, Brunekreef B, Wijnen van JH. Mite antigen in house dust: relationship with different housing charcteristics in the Netherlands. Clin Exp Allergy 1994;24:843-53.
Strien van RT, Koopman LP, Kerkhof M, Spithoven J, de Jongste JC, Gerritsen J, Neijens HJ, Aalberse RC, Smit HA, Brunekreef B. Mite and pet allergen levels in homes of children born to allergic and nonallergic parents: the PIAMA study. Environ Health Perspect. 2002;110:A693-8.
Svanes C, Jarvis D, Chinn S, Burney P. Childhood environment and adult atopy: Results from the European Community Respiratory Health Survey. J Allergy Clin Immunol 1999; 103: 415-20.
Tammes E, De Borst AR, Hutink BM. Inventarisatie van vocht en schimmelproblemen in woningen. Bouwcentrum, Rotterdam, 1995.
Tobin RS, Baranowski E, Gilman AP et al. Significance of fungi in indoor air: report of a working group. Can J Public Health 1987, 78:s1-s14.
Vanto T, Koivikko A. Dog hypersensitivity in asthmatic children. A clinical study with special reference to the relationship between the exposure to dogs and the occurrence of hypersensitivity symptoms. Acta Peadiatr Scand 1983;72:571-575.
RIVM report 609021044 Page 49 of 97
Verhoef J, Kalter E. Endotoxic effects of peptidoglycan. In: ten Cate J.W., Büler H.R., sturk A (eds). Bacterial endotoxins: structure, biomedical significance, and detection with the Limulus Amebocyte Lysate test. New York, Alan R. Liss Inc, 1985:101-112.
Verhoeff A.P., van Reenen-Hoekstra E.S., Samson R.A., et al. Fungal propagules in house dust. I. Comparison of analytic methods and their value as estimators of potential exposure. Allergy 1994;49:533-9.
Verhoeff A.P., Burge H.A. Health risk assessment of fungi in home environments. Ann Allergy Asthma Immunol 1997;78:544-56.
Von Mutius E., Braun-Fahrlander C., Schierl R., et al. Exposure to endotoxin or other bacterial components might protect against the development of atopy. Clin Exp Allergy 2000; 30: 1230-34.
VROM. Qualitative housing registration 1989-1991. Results of a nationwide sample (in Dutch). VROM, Den Haag, 1993.
Wahn U., Lau S., Bergmann R., Kulig M., Forster J., Bergmann K., Bauer C.P., Guggenmoos-Holzmann I. Indoor allergen exposure is a risk factor for sensitisation during th efirts three years of life. J Allergy Clin Immunol 1997;99:763-9.
Williamson I.J., Martin C.J., McGill G., Monie R.D., Fennerty A.G.. Damp housing and asthma: a case-control study. Thorax 1997 Mar;52(3):229-34.
World Health Organisation. Concern for Europe's tomorrow: Health and Environment in the WHO European Region/WHO, Copenhagen,1994.
Wouters I.M., Douwes J., Doekes G., Thorne P.S., Heederik D.J.J. Increased levels of bacterial endotoxin and fungal antigens in homes with indoor storage of organic household waste. Appl Environ Microbiol 2000;66:627-631.
Wijnen van J.H., Verhoeff A.P., Mulder-Folkerts D.K., Brachel H.J., Schou C. Cockroach allergen in house dust. Allergy 1997;52:460-4.
Zhiping W., Malmberg P., Larsson B.M., Larsson K., Larsson L., Saraf A. Exposure to bacteria in swine-house dust and acute inflammatory reactions in humans. Am J Respir Crit Care Med. 1996;154:1261-6.
Zock J.P., Jarvis D., Luczynska C., et al. Housing characteristics, reported mold exposure, and asthma in the European Community Respiratory Health Survey. J Allergy Clin Immunol 2002;110:285-92.
Zureik M., Neukirch C., Leynaert B., et al. Sensitisation to airborne moulds and severity of asthma: cross sectional study form European Community respiratory health survey. BMJ 2002;325:411-4.
Zwan van der J.C., Orie N.M.G., Kauffman H.F., et al., Bronchial obstructive reactions after inhalation with endotoxin and precipitinogens of Haemophilis influenzae in patients with chronic non-specific lung disease. Clin Allergy 1982;12:547-59.

Page 50 of 97 RIVM report 609021044
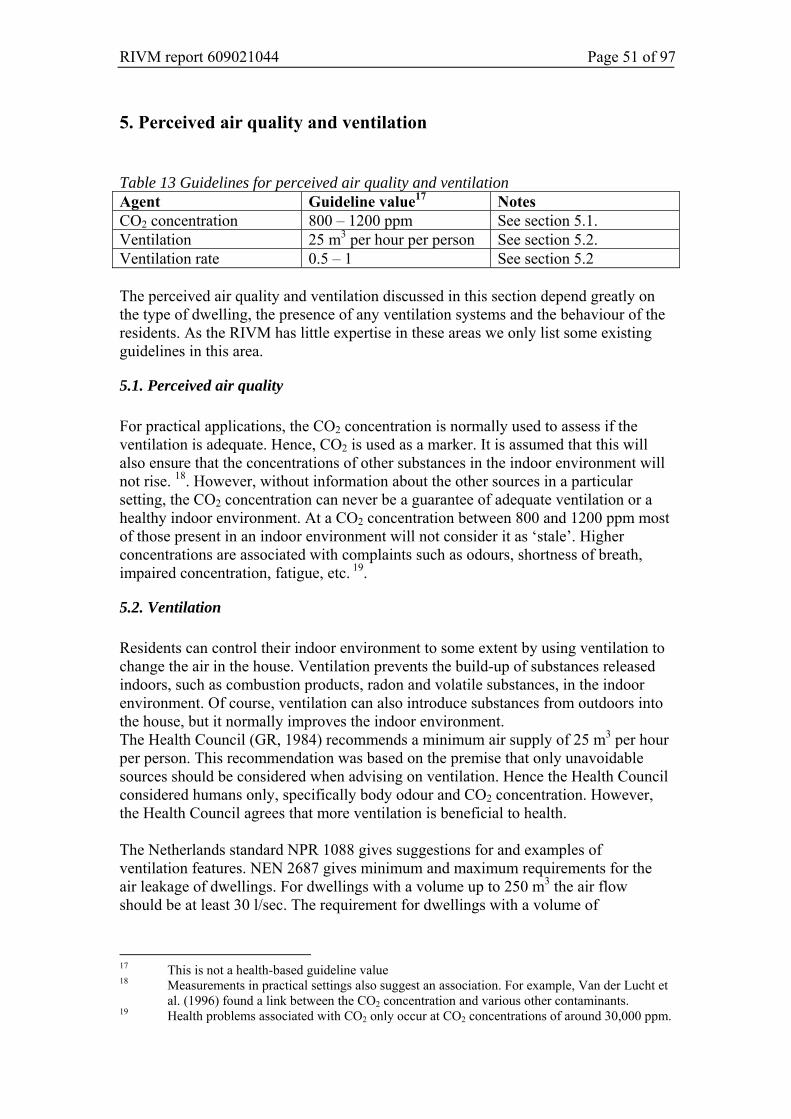
RIVM report 609021044 Page 51 of 97
5. Perceived air quality and ventilation Table 13 Guidelines for perceived air quality and ventilation Agent Guideline value17 Notes CO2 concentration 800 – 1200 ppm See section 5.1. Ventilation 25 m3 per hour per person See section 5.2. Ventilation rate 0.5 – 1 See section 5.2 The perceived air quality and ventilation discussed in this section depend greatly on the type of dwelling, the presence of any ventilation systems and the behaviour of the residents. As the RIVM has little expertise in these areas we only list some existing guidelines in this area.
5.1. Perceived air quality For practical applications, the CO2 concentration is normally used to assess if the ventilation is adequate. Hence, CO2 is used as a marker. It is assumed that this will also ensure that the concentrations of other substances in the indoor environment will not rise. 18. However, without information about the other sources in a particular setting, the CO2 concentration can never be a guarantee of adequate ventilation or a healthy indoor environment. At a CO2 concentration between 800 and 1200 ppm most of those present in an indoor environment will not consider it as ‘stale’. Higher concentrations are associated with complaints such as odours, shortness of breath, impaired concentration, fatigue, etc. 19.
5.2. Ventilation Residents can control their indoor environment to some extent by using ventilation to change the air in the house. Ventilation prevents the build-up of substances released indoors, such as combustion products, radon and volatile substances, in the indoor environment. Of course, ventilation can also introduce substances from outdoors into the house, but it normally improves the indoor environment. The Health Council (GR, 1984) recommends a minimum air supply of 25 m3 per hour per person. This recommendation was based on the premise that only unavoidable sources should be considered when advising on ventilation. Hence the Health Council considered humans only, specifically body odour and CO2 concentration. However, the Health Council agrees that more ventilation is beneficial to health. The Netherlands standard NPR 1088 gives suggestions for and examples of ventilation features. NEN 2687 gives minimum and maximum requirements for the air leakage of dwellings. For dwellings with a volume up to 250 m3 the air flow should be at least 30 l/sec. The requirement for dwellings with a volume of
17 This is not a health-based guideline value 18 Measurements in practical settings also suggest an association. For example, Van der Lucht et
al. (1996) found a link between the CO2 concentration and various other contaminants. 19 Health problems associated with CO2 only occur at CO2 concentrations of around 30,000 ppm.
Page 52 of 97 RIVM report 609021044
250 – 500 m3 is at least 50 l/sec. The values for extremely energy-efficient dwellings, dwellings with air heating and dwellings with ventilation systems with heat recovery are 50 and 80 l/sec. For a dwelling of 250 – 500 m3 a ventilation flow of 180 – 280 m3 per hour, or a ventilation rate of approximately 0.5 is given as the minimum. This is rather low. The Indoor Environment Manual (Handboek Binnenmilieu) gives a ventilation rate of 1 as the minimum. The difference with the Health Council requirement (25 m3 per person) is due to the fact that the Council only considered human sources and not the substances released from building materials and the dwelling. In practice, ventilation is not always adequate, even if the building regulations are observed. The actual ventilation also depends on the weather conditions and features of the dwelling such as its location, and the behaviour of the occupants, such as using the ventilation and opening doors and windows. New dwellings normally have mechanical ventilation systems, especially in areas where water vapour has to be extracted. Such systems are soon affected by fouling and in practice their capacity is often inadequate. Older dwellings normally do not have mechanical ventilation and the effective ventilation largely depends on the extent to which the occupants open the doors and windows. If older dwellings are insulated without modifying the ventilation system then the ventilation will be significantly reduced. (Van Veen et al., 2001) In recent years there has been great interest internationally in the potential link between ventilation, CO2 and performance at work or school, sick building syndrome (Building Related Illness) and specific respiratory tract problems (Wargocki et al., 2000/2002; Smedje et al., 2000; Milton 2000; Bouwman 1981; Seppänen et al., 1999/2002; Fisk et al., 2002; Apte et al., 2000; Nörback et al., 1995; Kim et al., 2002; Erdmann et al., 2002). Most studies recommend improved ventilation, good maintenance of the ventilation system, and the development of new ventilation and air conditioning systems. Some studies suggest that the ventilation should be increased such that the CO2 concentration is lower than the guideline value of 800 – 1200 ppm referred to above. For example, TNO have advocated a CO2 concentration of 600 – 800 ppm, depending on the relevant population group (TNO, 2003).
5.3. References Apte, M.G. et al.: Associations Between Indoor CO₂ Concentrations and Sick
Building Syndrome Symptoms in U.S. Office Buildings: An Analysis of the 1994-1996 BASE Study Data; Indoor Air 2000; 10: 246-257.
Bouwman, H.B.: Binnenklimaat in gebouwen, onderzoek naar de toelaatbare ‘minimum verseluchttoevoer per persoon’ in gebouwen; IMG-TNO rapport C470, januari 1981.
Erdmann, C.A. et al.: Indoor carbon dioxide concentrations and sick building syndrome symptoms in the base study revisited: analyses of the 100 building dataset; Proceedings: Indoor Air 2002: 443-448
Fisk, W.J. et al: Worker performance and ventilation: analyses of time-series data for a group of call-center workers; Proceedings: Indoor Air 2002: 790-795
Gezondheidsraad (1984) Advies inzake het binnenhuisklimaat, in het bijzonder een ventilatieminimum, in Nederlandse woningen, Den Haag.
Handboek Binnenmilieu (1996). GGGD Amsterdam.
RIVM report 609021044 Page 53 of 97
Kim, C.S. et al.: Effect of Indoor CO₂ Concentrations of Wheezing Attacks in Children; Proceedings: Indoor Air 2002: 492-497.
Lucht F. van der, Meijer G. Duijm F., Broer J., Nijdam R (1996). Binnenmilieu-Luchtwegonderzoek. GGD Groningen Stad en Ommelanden.
Milton, D.K.: Risk of Sick Leave Associated with Outdoor Air Supply Rate, Humidification, and Occupant Complaints; Indoor Air 2000; 10: 212
Norbäck, D. et al: Asthmatic symptoms and volatile organic compounds, formaldehyde, and carbon dioxide in dwellings; Occup Environ Med 1995 Jun; 52 (6): 388-95.
NEN 2687: Luchtdoorlatendheid van woningen, eisen (1989). NPR 1088: Nederlandse Praktijk Richtlijn; Ventilation in dwellings and residential
buildings – Indications for and examples of the construction of ventilation systems; ICS 91.140.30 (1999).
Seppänen, O.A. et al: Association of Ventilation Rates and CO₂ Concentrations with Health and Other Responses in Commercial and Institutional Buildings; Indoor Air 1999; 9: 226-252
Seppänen, O.A. en Fisk, W.J.: Association of ventilation system type with SBS symptoms in office workers; Indoor Air 2002; 12: 98-112
Smedje, G. and Norbäck, D.: New Ventilation Systems at Select Schools in Sweden – Effects on Asthma and Exposure; Archives of Environmental Health, January/February 2000 (Vol. 55 (No.1)): 18-25
TNO (2003). Relatie EPC-niveau en gezondheidsrisico’s als onderdeel van het kwaliteitsniveau van gebouwen (2003-GGI-R057).
Veen M.P. van, Crommentuijn L.E.M., Janssen M.P.M., Hollander A.E.M. de (2001). Binnenmilieukwaliteit: ventilatie en vochtigheid. Een studie voor Milieuverkenning 5. RIVM-rapport 630920001).
Wargocki, P. et al: The Effects of Outdoor Air Supply Rate in an Office on Perceived Air Quality, Sick Building Syndrome (SBS) Symptoms and Productivity; Indoor Air 2000; 10: 222-236
Wargocki, P. et al: Ventilation and Health in non-industrial environments: report from a European Multidisciplinary Scientific Consensus Meeting (EUROVEN); Indoor Air (2002); 12: 113-128

Page 54 of 97 RIVM report 609021044
RIVM report 609021044 Page 55 of 97
6. Other agents
6.1. Tobacco smoke Smoking releases a wide range of harmful substances into the indoor atmosphere. Examples include polycyclic aromatic hydrocarbons (PAH), aldehydes and particulate matter. In theory, each component should be considered separately to set a guideline value. However, a recommendation by the Health Council (GR, 1990) advises against this. The reason for this is that tobacco smoke is a complex mixture of components which may interact. It has been convincingly demonstrated that smoking and passive smoking are harmful to health. Exposure to tobacco smoke in the surroundings can lead, among other problems, to an increased risk of lung cancer and other forms of cancer, heart disease, respiratory tract problems and a lower weight at birth (GR, 2003). No guideline value It is not possible to set a safe exposure limit for tobacco smoke. For health reasons, smoking indoors should be avoided. This also ties in with current government policies.
6.2 References Gezondheidsraad (1990). Passief roken. Beoordeling van de schadelijkheid van
omgevingstabakrook voor de gezondheid. GR 1990/18, Den Haag. Gezondheidsraad (2003). Volksgezondheidsschade door passief roken. Den Haag:
Gezondheidsraad, 2003; publicatie nr 2003/21

Page 56 of 97 RIVM report 609021044
RIVM report 609021044 Page 57 of 97
APPENDIX A: Justification of the health-based guideline values for chemicals Aromatic compounds • Benzene There is extensive toxicological literature on benzene. In 2001 the RIVM studied benzene for a project on soil quality and risks. Benzene is a genotoxic carcinogen. TCAs are not set for this class of substances. Instead, the cancer risk is quantified. Dutch environmental policies are based on a risk of 1 per 10,000 lives as the Maximum Permissible Risk (MPR). For benzene, this risk level is reached after lifetime exposure to 20 μg/m3 (RIVM, 2001a). The official Dutch limit for benzene, defined in the Air Quality Decree, is 10 μg/m3. The EU is planning to introduce a limit of 5 μg/m3 in 2010. • Toluene There is extensive toxicological literature on toluene. In 2001 the RIVM studied toluene for a project on soil quality and risks. This led to setting a TCA of 400 μg/m3 (RIVM, 2001a). • Xylene Xylene was also assessed by the RIVM in 2001 for the project on soil quality and risks. This led to setting a TCA of 870 μg/m3 (RIVM, 2001a). • Trimethylbenzene Trimethylbenzene (CAS 25551-13-7) has three isomers: 1,3,5-trimethylbenzene (synonym: mesitylene; CAS 108-67-8) 1,2,4-trimethylbenzene (synonym: pseudocumene; CAS 95-63-6) 1,2,3-trimethylbenzene (synonym: hemimellitene; CAS 526-73-8) These trimethylbenzenes occur naturally in mineral oil products. Certain solvents derived from mineral oil contain high concentrations (sometimes more than 50%) of these compounds. In 1995 the RIVM set a chronic air limit value (TCA) of 800 μg/m3 for these mixtures derived from mineral oil. Hence, part of the limit applies to trimethylbenzene. The MAC value of trimethylbenzenes is 100 mg/m3. This value was based on the American TLV which is based on information related to health. This value applies to the total of all isomers. A Polish research team has been doing toxicological experiments with the separate isomers since 1996. Acute and subacute neurotoxicity experiments have been undertaken with all three isomers (Korsak and Rydzynsky, 1996; Waiderna et al., 2002) and subchronic toxicity studies of 1,2,3 and 1,2,4-trimethylbenzene (Korsak et al. 2000a and 2000b). The genotoxicity of the isomers was also studied (Janik-Spichowicz et al., 1998). Additionally, a 90-day study using rats was undertaken in 1995 with 1,3,5-trimethylbenzene. However, there is no substantive information available from this industry-sponsored study.
Page 58 of 97 RIVM report 609021044
The Polish studies showed that during acute exposure 1,2,3-trimethylbenzene has a stronger neurotoxic effect than the other two isomers (EC50 values for pain avoidance behaviour 4240 mg/m3 compared with 5575 and 6060 mg/m3) (Korsak and Rydzynsky, 1996). The respiratory irritation potential associated with acute exposure was similar for all three isomers according to a study of the respiration rate of male mice (RD50 values 2895, 2595 and 2570 mg/m3) (Korsak et al., 1997). In subacute neurotoxicity experiments using the separate isomers (Gralewicz et al., 1997; Wiaderna et al, 1998; Wiaderna et al., 2002) some neurological test parameters for all isomers differed at concentrations from 500 and 1250 mg/m3 (6 hours/day, 5 days/week, 4 weeks). These tests were undertaken in the period 14 - 61 days after the last exposure. Interestingly, the neurotoxic effect did not increase proportionally to the concentration (it was always greatest at the middle concentration of 500 mg/m3 and reduced at 1 250 mg/m3). The effects were marginal or nonexistent at the lowest test concentration of 125 mg/m3. In subchronic inhalation studies of 1,2,3 and 1,2,4-trimethylbenzene (Korsak et al., 2000a and 2000b; Korsak and Rydzynski, 1996) rats were exposed to 125, 500 and 1250 mg/m3 for 6 hours/day, 5 days/week during a period of 13 weeks. The same neurotoxic effects were observed as in the subacute studies. Only a low systemic toxicity was observed. Only at 1230 mg/m3 were there minor effects on the blood, liver and lungs. The NOAEL based on these studies is 125 mg3. The genotoxicity of the trimethylbenzenes was studied in bacteria (Ames test in S. typhimurium) and mammals (micronucleus test in mice) (Janik-Spiechowicz et al., 1998). In bacteria 1,2,3-trimethylbenzene resulted in a positive response without metabolic activation (and negative with activation). The other two isomers gave a negative response. The micronucleus test with mice was negative for all isomers. However, all three isomers led a higher incidences of SCEs. These studies do not allow us to come to a definitive conclusion about the genotoxic potential of trimethylbenzenes. As stated above, in 1995 the RIVM set a TCA for solvents derived from mineral oil solvents (HBAS: High-Boiling Aromatic Solvents) which may contain more than 50% trimethylbenzene (RIVM, 1995a). The NOAEL underlying that decision was 450 mg/m3, based on a 1-year study with rats. This study did not report any neurotoxicity, even at the highest test concentration of 1800 mg/m3. Given the observations in the new Polish trimethylbenzene studies (mild neurotoxic effects at 500 mg/m3), such a toxicity would be expected (as the tested solvents consist of around 50% trimethylbenzene) and might have been observed had specific neurological tests been undertaken. It may be concluded that the NOAEL of 450 mg HBAS/m3 may not entirely cover the neurotoxic effects of trimethylbenzenes (and possibly also that of other alkylbenzenes in the mixture) and for this reason, for the trimethylbenzenes, the NOAEL of 125 mg/m3 from the subchronic experiments with 1,2,3 and 1,2,4-trimethylbenzene might provide a better basis for deriving a TCA. From a broader perspective, when considering the alkylbenzenes as a group, the available data for trimethylbenzenes is limited and some related substances such as xylene and isopropylbenzene have been studied much more extensively. The overall NOAELs for the latter should be considered to set an adequate TCA for alkylbenzenes (see also the discussion below).
RIVM report 609021044 Page 59 of 97
• Methylethylbenzene Methylethylbenzene (synonym: ethyltoluene; CAS 25550-14-5) has three isomers: - 1-methyl-2-ethylbenzene (CAS 611-14-3) - 1-methyl-3-ethylbenzene (CAS 620-14-4) - 1-methyl-4-ethylbenzene (CAS 622-96-8) These methylethylbenzenes occur naturally in mineral oil products and certain solvents derived from mineral oil contain high concentrations (20 - 30%) of these compounds. In 1995 the RIVM set a chronic air limit value (TCA) of 800 μg/m3 for these mixtures derived from mineral oil. Hence, part of the limit applies to methylethylbenzene. The available toxicological data for methylethylbenzene (mixture of the isomers) and for two of the isomers is extremely limited. However, several studies, all using the oral route, were undertaken with 1-methyl-4-ethylbenzene around 1980. These studies were undertaken by the American industry and the reports were filed with the EPA/OTS under the Toxic Substances Control Act. These studies address acute, subacute and semichronic toxicity in rats and the teratogenic effect in rats and rabbits. Genotoxicity was also studied in vitro (bacteria, yeast, mammalian cells) and in vivo (fruit flies, rats). However there is no information available on these studies, not even a summary of the results. • n-propylbenzene There is no usable data about n-propylbenzene (CAS 103-65-1; synonym: isocumene) in the toxicological literature. • i-propylbenzene The toxicological data for isopropylbenzene (synonym: cumene; CAS 98-82-8) has recently been assess for the EU project on existing substances (EU, 2001). There is also an assessment by the US EPA in 1997. Isopropylbenzene has a MAC of 100 mg/m3. This value is based on the American TLV, set on the basis of health-related information. According to the EU assessment, isopropylbenzene has a low acute toxicity. Laboratory animals suffered neurological effects at ≥ 2450 mg/m3 (NOAEL 490 mg/m3) after a single exposure of 6 hours. In humans, sensory irritation has been observed at concentrations between 1470 and 1960 mg/m3 (NOAEL unknown). Subchronic experiments with rats resulted in depression of the nervous system and weight increases of the liver, kidneys and adrenal glands. The NOAEL for repeated exposure was 490 mg/m3 with minimal effects at a LOAEL of 2450 mg/m3. Isopropylbenzene did not show any effect in the genotoxicity studies. Furthermore it did not show any reprotoxicity. The EU project does not set limit values for substances. However, the US EPA (1997a) has derived a chronic limit for cumene on the basis of a subchronic NOAEL of 2450 mg/m3. In the EU assessment this NOAEL was considered as a minimum LOAEL. Using the NOAEL of 2450 mg/m3 and an overall uncertainty factor of 1000, the EPA derived a chronic limit value of 400 μg/m3.
Page 60 of 97 RIVM report 609021044
Adopting the EU approach, using the NOAEL of 490 mg/m3 we can derive a limit value for isopropylbenzene as follows. The NOAEL corrected for the limited exposure period in the study (extrapolation to continuous exposure) is 87 mg/m3. The corrected NOAEL is divided by a safety factor to obtain the TCA. A factor 100 is used here, comprising 10 for extrapolation from laboratory animals to humans and 10 to protect sensitive groups in the human population. As the critical effect is mild, there is no need for a higher factor. This results in a TCA of 870 μg/m3 for isopropylbenzene. • Isopropylmethylbenzene Isopropylmethylbenzene (synonym: cymene; CAS 25155-15-1) has three isomers: 1-methyl-4-isopropylbenzene (synonym: p-cymene; CAS 99-87-6) 1-methyl-2-ispropylbenzene (synonym: o-cymene; CAS 527-84-4) 1-methyl-3-ispropylbenzene (synonym: m-cymene; CAS 535-77-3) The toxicological literature does not provide usable data for any of these isomers. • n-butylbenzene The toxicological literature does not provide any usable data for n-butylbenzene (CAS 104-51-8). Evaluation of alkylbenzenes The table below summarises the TCAs of alkylbenzenes. Substance TCA in μg/m3 Based on Toluene 400 Human LOAEL 332 mg/m3 Xylene 870 Laboratory animal LOAEL 870 mg/m3 Trimethylbenzene Undetermined Laboratory animal NOAEL 125 mg/m3 Ethylbenzene 770 Laboratory animal NOAEL 430 mg/m3 Methylethylbenzene Undetermined n-propylbenzene Undetermined Isopropylbenzene 870 Laboratory animal NOAEL 490 mg/m3 n-butylbenzene Undetermined HBAS 800 Laboratory animal NOAEL 450 mg/m3 The TCAs and NOAELs of xylene, ethylbenzene, isopropylbenzene and HBAS (a mixture) are close. The NOAEL of trimethylbenzenes is lower. In the subchronic inhalation studies used to set the NOAEL there were effects on some neurotoxicological test parameters at 500 mg/m3. Such an effect at those concentrations was not observed with other alkylbenzenes which have been studied more extensively. Weighting all the data suggests a TCA of approximately 800 μg/m3 for alkylbenzenes as a group. The margin between such a TCA and the lower NOAEL of 125 mg/m3 (based on the Polish studies with two trimethylbenzenes) is sufficient to consider the TCA to be safe with respect to the observed neurotoxic effects. It is proposed to apply the value for isopropylbenzene (870 μg/m3) to trimethylbenzene, methylethylbenzene, n-propylbenzene and n-butylbenzene. Hence, the level of 870 μg/m3 applies to the total of these five substances. Obviously, the existing TCAs for toluene, xylene, ethylbenzene and HBAS will continue to apply.
RIVM report 609021044 Page 61 of 97
• Styrene There is extensive toxicological literature on styrene. In 2001 the RIVM studied styrene for a project on soil quality and risks. This led to setting a TCA of 900 μg/m3 (RIVM, 2001a). ALIPHATIC COMPOUNDS • Hexane n-hexane is the most toxic compound in the series of linear aliphatic alkanes (butane, pentane, hexane, heptane). It causes peripheral neuropathy in humans, this effect is due to the metabolite 2,5-hexanedione. The toxicology of hexane was studied by US EPA in 1993 and by US ATSDR in 1999. In 1996 and 2000 the RIVM proposed oral and inhalation MPRs based on these extensive reviews. The proposed TCA for n-hexane is 200 μmg/m3 (RIVM, 1996a, 2000). • Heptane The RIVM assessed the toxicological data for heptane in 2001. This formed part of an assessment of mineral oil, which heptane is a component of, for a project on soil quality and risks. On the basis of studies of n-heptane, a TCA of 18,400 μg/m3 was proposed for aliphatic fractions in mineral oil (pentane, heptane and octane, with the exception of n-hexane) (RIVM, 2001). This value applies to the total of these aliphatic alkanes. N-hexane was excluded as it is highly neurotoxic and its toxicology is quite different from that of other linear and branched alkanes. • Octane The RIVM assessed the toxicological data for octane in 2001. This formed part of an assessment of mineral oil, which octane is a component of. On the basis of studies of n-heptane, a TCA of 18,400 μg/m33 was proposed for aliphatic fractions in mineral oil (pentane, heptane and octane, with the exception of n-hexane) (RIVM). This value applies to the total of these aliphatic alkanes. N-hexane was excluded as it is highly neurotoxic and its toxicology is quite different from that of other linear and branched alkanes. • Higher alkanes In the assessment of mineral oil by the RIVM (RIVM, 2001a) a TCA of 1000 μg/m3 was proposed for the fraction of higher aliphatic alkanes (nonane and higher). This value was derived from experiments with dearomatised mineral oil fractions containing high concentrations of higher aliphatic alkanes. • Cyclohexane The toxicological data for cyclohexane was assessed by the RIVM in 1996 to set a provisional TCA (RIVM, 1996b). Cyclohexane is included in the EU existing substances programme further to which a draft risk assessment document from 2000 is available. In 1996, the RIVM proposed a provisional TCA of 270 μg/m3, given a NOAEL of 1515 mg/m3 based on a 10-week experiment with rabbits. This evaluation was made on an ad-hoc basis. By contrast, all available data was studied for the EU assessment and its results therefore determined the current update of the TCA for cyclohexane.
Page 62 of 97 RIVM report 609021044
Cyclohexane has a low acute toxicity. Subacute and semichronic toxicity tests show that after repeated inhalation there are only minor effects on the liver. The NOAEL for this effect is 6880 mg/m3. However, in these experiments acute neurotoxicity (narcotic changes, reduced motor activity) occurred at lower concentrations. The NOAEL for this effect was 1720 mg/m3. Neurotoxicity was also investigated in human volunteers exposed once to 86 or 860 mg/m3. The behavioural tests did not indicate any changes. The genotoxicity tests for cyclohexane were negative (i.e. no effect). In teratogenic and reprotoxic tests this substance was not found to have any harmful effects on development and reproduction. On the basis of the NOAEL of 1720 mg/m3 set further to the subchronic studies a new TCA can now be derived. Converted to continuous exposure, the NOAEL corresponds to 307 mg/m3. The corrected NOAEL is divided by a safety factor to obtain the TCA. A factor 100 is used here, comprising 10 for extrapolation from laboratory animals to humans and 10 to protect sensitive groups in the human population. Given the temporary nature of the critical effect and lack of genotoxic and reprotoxic potential it was decided that there was no need for a higher factor. This results in a TCA of 3000 μg/m3 for cyclohexane. CHLORINATED ALIPHATIC COMPOUNDS • Dichloromethane There is extensive toxicological literature on dichloromethane. In 2001 the RIVM studied dichloromethane for a project on soil quality and risks. This led to setting a TCA of 3000 μg/m3 (RIVM, 2001a). • Chloroform There is extensive toxicological literature on chloroform. In 2001 the RIVM studied chloroform for a project on soil quality and risks. This led to setting a TCA of 100 μg/m3 (RIVM, 2001a). • 1,2-dichloroethane There is extensive toxicological literature on 1,2-dichloroethane. In 2001 the RIVM studied dichloroethane for a project on soil quality and risks. 1,2-dichloroethane is a genotoxic carcinogen and no TCAs are set for this group of substances. Instead, the cancer risk is quantified. Dutch environmental policies are based on a risk of 1 per 10,000 lives as the Maximum Permissible Risk (MPR). With 1,2-dichloroethane this risk level is reached after lifelong exposure to 48 μg/m3. This is a provisional value as it is based on oral exposure data (route-route extrapolation) (RIVM, 2001a). • 1,1,1-trichloroethane The toxicological data for this substance had been assessed by the RIVM in 1995 for a project on soil quality and risks. This resulted TCA of 380 μg/m3 (RIVM, 2001a). There are no new studies suggesting that the TCA should be adjusted.
RIVM report 609021044 Page 63 of 97
• 1,2-dichloropropane The toxicological data for this substance had been assessed by the RIVM in 1998 for a project on soil quality and risks. This resulted TCA of 12 μg/m3 (RIVM, 1995). • Trichloroethene There is extensive toxicological literature on trichloroethene. In 2001 the RIVM studied trichloroethene for a project on soil quality and risks. This led to setting a provisional TCA of 200 μg/m3 (RIVM, 2001a). • Tetrachloroethene There is extensive toxicological literature on tetrachloroethene. In 2001 the RIVM studied tetrachloroethene for a project on soil quality and risks. This led to setting a TCA of 250 μg/m3 (RIVM, 2001a). ALDEHYDES • Formaldehyde There is extensive toxicological literature on formaldehyde. In 1995 the RIVM studied this substance for a project on soil quality and risks. This led to setting a provisional TCA of 1.2 μg/m3 (RIVM, 1995). This value was set on the basis of the NOAEL for eye, throat and nose irritation in humans of 120 μg/m3 (short-term exposure). The MPR for formaldehyde in air as set in the past by VROM is - 120 μg/m3, 30 minute average. - 10 μg/m3 annual average. The target value in air is 1 μg/m3 (annual average). The Health Council recently proposed a health-based MAC-value of 150 μg/m3 (8-hour average) (DECOS, 2003). The current MAC value is 1.5 mg/m3. Formaldehyde is a common atmospheric contaminant. According to a recent report by the WHO, the concentration in the outdoor atmosphere in urban and suburban areas in Canada can be up to several tens of microgrammes per m3. The highest daily average was 27.5 μg/m3 (WHO, 2002). In the indoor atmosphere the 50, 95 and 99 percentiles of five Canadian studies were 30, 85 and 116 μg/m3. These data clearly show that the TCA proposed by the RIVM in 1995 is frequently exceeded. The question arises how much need there is for the relatively large safety margin (factor 100) used in 1995. A number of volunteer studies have been undertaken with formaldehyde and provide information about the dose-response curve of the induction of sensory irritation in humans (the critical effect when setting the TCA). The results of these studies suggest that there is a large variation between individuals in the human population in terms of the sensitivity to sensory irritation by formaldehyde. Some individuals only experience a reaction at concentrations exceeding 1000 μg/m3 while others are sensitive to significantly lower concentrations. For example, a volunteer study
Page 64 of 97 RIVM report 609021044
undertaken in 1993 reported minor irritation symptoms at 500 μg/m3.20 Some hypersensitive individuals can detect a concentration of 10 μg/m3 or even lower as a warm feeling in their face, as reported in the WHO's evaluation (2000). The effects at these low concentrations are minor. The WHO recommendation for the general population is a limit value of 100 μg/m3 (30-minute average). As mentioned above, some susceptible individuals may experience discomfort at lower concentrations. It is not possible to give a reliable estimate of the concentration below which this will not occur. In conclusion, given the minor critical effect (sensory irritation), it would appear that the safety factor applied in 1995 might be rather high. The limit value recommended by the WHO (2000), 100 μg/m3 (30-minute average) is little different from the 30 minute average MPR of 120 μg/m3. Hence it might not be necessary to change the current MPR. However, it should be noted that some susceptible individuals might experience discomfort and possibly minor irritation at concentrations below the MPR. Other aldehydes Most of these substances have never been adequately assessed for exposure by inhalation. The available data sets should be studied and assessed. All these substances result in some degree of irritation of the respiratory tract. A combined standard would be an obvious choice. Such a combined standard should include the separate substances on the basis of their potential effect. A test parameter will have to be chosen to quantify the individual potentials. This amounts to a substantial effort which could not be undertaken within this project. The information available for each aldehyde is given below. • Acetaldehyde Inhalation toxicology never assessed by the RIVM. Source document: Environmental Health Criteria no. 167, WHO/IPCS 1995 • Propanal Never assessed by the RIVM. Source document: OECD SIDS • Crotonaldehyde Never assessed by the RIVM. Source documents: BUA 98, IARC 63, TSCATS database (data not evaluated) • Butanal Never assessed by the RIVM. Source documents: OECD SIDS, TSCATS database (data not evaluated) • Benzaldehyde Never assessed by the RIVM. Source document: OECD SIDS, PTP Tr 378, TSCATS database (data not evaluated) 20 Study by Pazdrak et al. (1993). This study was used by the US ATSDR when setting the acute limit value for formaldehyde.
RIVM report 609021044 Page 65 of 97
• 2-methylbutanal Never assessed by the RIVM. Source documents: none • Hexanal Never assessed by the RIVM. Source documents: none • Acrolein Current atmospheric limit values: target 0.01 μg/m3, MPR 0.5 μg/m3 (annual average), 25 μg/m3 (30 minutes). Source documents: WHO/CICAD, EU existing substances, US EPA IRIS, ATSDR • Chloroacetaldehyde Never assessed by the RIVM. Source documents: none • Furfural Never assessed by the RIVM. Source documents: WHO/CICAD, EU existing substances • Glutaraldehyde RIVM assessment, 2001. Overall NOAEL for inhalation 0.1 mg/m3. • Valerian aldehyde Never assessed by the RIVM. Source document: DECOS (2003) CHLORINATED BENZENES • Chlorobenzene Monocholorobenzene was assessed by the RIVM in 2001 for the project on soil quality and risks. This led to setting a provisional TCA of 500 μg/m3 (RIVM, 2001a). • 1,4-dichlorobenzene 1,4-dicholorobenzene was assessed by the RIVM in 2001 for the project on soil quality and risks. This led to setting a TCA of 670 μg/m3 (RIVM, 2001a) • Trichlorobenzene Tricholorobenzene was assessed by the RIVM in 2001 for the project on soil quality and risks. A combined provisional TCA of 50 μg/m3 was derived for the three isomers (RIVM, 2001a). POLYCYCLIC AROMATIC HYDROCARBONS Polycyclic aromatic hydrocarbons (PAH) are products of incomplete combustion. There is extensive toxicological literature available about the toxicological properties of this group of environmental pollutants. The major toxicological effect of PAH is cancer. In 2003 an EU working party undertook a risk assessment of the cancer risk
Page 66 of 97 RIVM report 609021044
associated with exposure to PAH in the atmosphere (EU, 2003). For this group of compounds the cancer risk is normally expressed as the benzo(a)pyrene (B(a)P) concentration. The result of this assessment was that the cancer risk amounts to 8.7 x 10⁻⁵ per ng B(a)P/m3 given lifetime exposure. Converted for the MPR used in the Dutch environmental policies (for genotoxic carcinogens: 1 per 10,000 at lifetime exposure) this results in 1.2 ng B(a)P/m3. The EU assessment resulted in a proposed assessment threshold of 1 ng B(a)P/m3. • Naphtalene The toxicology and risk assessment of naphtalene have been covered in several recent reviews, US-EPA (1998), EU-RAR (2003) and ATSDR (2005). The assessment is based on the information contained in these source documents. Critical toxicological effects for naphtalene are hemolytic anemia, carcinogenicity and local effects on the respiratory tract. It is not possible to derive a NOAEL (No Observed Adverse Effect Level) for hemolytic anemia due to a lack of adequate animal or human data. As the available carcinogenicity data point towards an absence of genotoxic effects, it is concluded that local toxic effects on the nasal mucous membrane can be used to derive the guideline. Using the standard safety factor of 100, the TCA can be set at 0,025 mg/m3. Due to the great variability in odour perception of naphtalene however, odour (annoyance) cannot be fully ruled out at this concentration. METALS • Mercury There is also extensive toxicological literature available on mercury. An EU working party recently undertook a risk assessment of mercury in air (EU, 2003). The working party arrived at a concentration of 50 ng/m3 as the maximum acceptable for metallic mercury. This value is lower than the TCA of 200 ng/m3 proposed in 2000 by the RIVM for metallic mercury. • Lead There is also extensive toxicological literature available on lead. For air there is an assessment undertaken for the WHO Air Quality Guidelines (WHO, 2000). This resulted in a recommended maximum concentration in air of 500 ng/m3 (annual average). This is the same as the current annual average limit value for lead in air in the Netherlands of 500 ng3. The 98th percentile of the 24-hour average in the Netherlands is 2000 ng/m3. PESTICIDES • Chlorpyrifos Chlorpyrifos is an organic phosphorous ester insecticide. This group of pesticides inhibits the action of the enzyme cholinesterase which is essential to the handling of stimuli by the nervous system. There is a large volume of toxicological studies on this substance, which was assessed by the WHO/JMPR in 1999. The RIVM last undertook a major assessment of this substance in 1987.
RIVM report 609021044 Page 67 of 97
The most important toxicological data about chlorpyrifos for the purpose of determining the TCA is provided by two inhalation studies in rats, both with exposure for 6 hours/day, 5 days/week, for a period of 13 weeks. Neither of these studies showed clear toxicological effects. The overall NOAEL of 287 μg/m3 for cholinesterase inhibition derived from these studies by JMPR may therefore be a poor indicator of the inhalation toxicity of chlorpyrifos - the actual NOAEL may be considerably higher. Even so, this NOAEL and a safety factor of 100 can be used to calculate a provisional TCA of 3 μg/m3 (rounded value). A higher safety factor is considered unnecessary given the extensive dataset for oral exposure. 21 The MAC value of chlorpyrifos is 200 μg/m3. This was based on the American TLV which is based on information related to health. • Foxim Foxim is an organic phosphorous ester insecticide. This group of pesticides inhibits the action of the enzyme cholinesterase which is essential to the handling of stimuli by the nervous system. There is extensive information from toxicological studies available for this substance, which was assessed in 1982 and 1984 by the WHO/JMPR and in 1999 by the WHO/JECFA. The human toxicology data for this substance include many studies based on oral exposure. On the basis of these studies, JECFA set an ADI of 4 μg/kg body weight. The inhalation data for foxim are limited to some acute studies (LC50 determinations). Given the limited data, it is not possible to determine a TCA. There is no MAC value for foxim. • Tetramethrin Tetramethrin is a synthetic pyrethroid insecticide. There is a wide range of toxicological studies available, which were assessed in 1995 and 2001 by the RIVM for the Board for the Authorisation of Pesticides. This assessment resulted in a proposed ADI of 18 μg/kg body weight (RIVM, 1995b, 2001b, 2001c). Two subacute inhalation studies are the most relevant items in the toxicological file on tetramethrin with respect to setting a TCA. In a 28-day study with rats, a tetramethrin aerosol was given 3 hours/day for 7 days/week. In this study all test concentrations had effects on the white blood cells and the cholinesterase activity in blood was inhibited. The LOAEL was 26 mg/m3. The only other longer inhalation studies were a 7-day study of infant mice (exposure 6.3 hours/day, day 10 - 17 after birth). The density of the muscarinic acetylcholine receptor was increased at all test concentrations (LOAEL 1.8 mg/m3). This data is insufficient for setting a TCA. There is no MAC value for tetramethrin. • Trichlorfon Trichlorfon is an organic phosphorous ester insecticide. This group of pesticides inhibits the action of the enzyme cholinesterase which is essential to the handling of stimuli by the nervous system. There is extensive information from toxicological studies available for this substance, which was assessed in 1992 by the WHO/IPCS and in 2000 by the WHO/JECFA. The human toxicology data for this substance
21 The assessment of this dataset for oral exposure was an ADI of 10 μg/kg body weight. If this ADI is converted for a 70 kg adult breathing 20 m3 per day this results in a concentration of 35 μg/m3. This supports that the derived TCA of 3 μg/m3 is indeed safe.
Page 68 of 97 RIVM report 609021044
includes many studies based on oral exposure. On the basis of these studies, JECFA set an ADI of 20 μg/kg body weight. There is limited inhalation data for trichlorfon. The only longer inhalation study which we are aware of is a subacute experiment with rats exposed 6 hours/day, 5 days/week during a period of 3 weeks. Cholinesterase inhibition in blood and the brain occurred at 35.4 and 103.5 mg/m3 but not at 12.7 mg/m3. This data is insufficient for setting a TCA. There is no MAC value for trichlorfon. • Propoxur Propoxur is an insecticide in the carbamate group. This group of pesticides inhibits the action of the enzyme cholinesterase which is essential to the handling of stimuli by the nervous system. There is a large volume of toxicological studies on this substance, which was assessed by the WHO/JMPR in 1989. A more recent assessment is that by the US EPA for the American approval as a pesticide (US-EPA, 1997b). The human toxicology data for this substance includes many studies based on oral exposure. On the basis of these studies, JMPR set an ADI of 20 μg/kg body weight. Propoxur has been covered by a relatively large number of inhalation studies. There have been two studies with rats using exposure during 8 or 12 weeks (6 hours/day, 5 days/week). The critical effect was cholinesterase inhibition in the brain. This effect occurred at ≥15.7 mg/m3 (NOAEL 5.7 mg/m3). The US EPA evaluation also refers to a 2-year experiment with rats (exposure 6.3 hours/day, 5 days/week). Again the most sensitive effect was cholinesterase inhibition. The LOAEL in this study was 10.4 mg/m3 and the NOAEL 2.2 mg/m3. This NOAEL and a safety factor of 100 can be used to derive a provisional TCA of 22 μg/m3. Propoxur has a MAC value of 500 μg/m3. This value is based on the American TLV, set on the basis of health-related information. • Alkyldimethylbenzylammoniumchloride This substance is a member of the large group of quarternary ammonium compounds. In 1991, the human toxicology of alkyldimethylbenzylammoniumchloride was assessed by the RIVM for the then Committee for the Authorisation of Pesticides. The outcome of this assessment was a maximum acceptable concentration in food of 1 mg/kg food. No ADI was determined as the toxicological effect of this highly irritant group of compounds is primarily determined by the concentration rather than the dose. Inhalation data was limited to a determination of the acute LC50. Hence, it is not possible to set a TCA for this substance. The volatility is unknown but given the structure of the compound this is expected to be low. • Didecyldimethylammoniumchloride Between 1985 and 1994 the human toxicology of this substance was assessed by the RIVM on several occasions for the then Committee for the Authorisation of Pesticides. The outcome of this assessment was a maximum acceptable concentration in food of 0.8 mg/kg food. No ADI was determined as the toxicological effect of this highly irritant compound is primarily determined by the concentration rather than the dose. Inhalation data was limited to a determination of the acuteLC50. Hence, it is not possible to set a TCA for this substance.
RIVM report 609021044 Page 69 of 97
References Appendix A ATSDR (2005) Toxicological profile for naphthalene, 1-methylnaphthalene, and 2-
methylnaphthalene. US Agency for Toxic Substances and Disease Registry, report dated August 2005.
EU (2000) Concept Risk Assessement Report – Cyclohexane. European Chemicals Bureau, Existing Substances.
EU (2001) Risk Assessement Report – Cumene. European Chemicals Bureau, Existing Substances.
EU (2003) Proposal for a directive of the European Parliament and of the Council relating to arsenic, cadmium, mercury, nickel and polycyclic aromatic hydrocarbons in ambient air. COM (2002) 423 Final.
EU (2003) European Union Risk Assessment Report – Naftaleen. European Chemicals Bureau - Existing Substances, 1st Priority List, Volume 33.
Gralewicz et al. (1997) Behavioral changes following 4-week inhalation exposure to pseudocumene (1,2,4-trimethylbenzene) in the rat. Neurotoxicology and Teratology 19 (no. 4), 327-333.
Janik-Spichowicz et al. (1998) Genotoxicity evaluation of trimethylbenzenes. Mutation Research 412, (no. 3). 299-305.
Korsak, Z., Rydzynski, K. (1996) Neurotoxic effects of acute and subchronic inhalation exposure to trimethylbenzene isomers (pseudocumene, mesitylene, hemimellitene) in rats. International Journal of Occupational Medicine and Environmental Health 9, no. 4, 341-349.
Korsak, Z., et al. (1997) Respiratory irritative effects of trimethylbenzenes: an experimental animal study. International Journal of Occupational Medicine and Environmental Health 10, no. 3, 303-311.
Korsak, Z., et al. (2000a) Subchronic inhalation toxicity of 1,2,3-trimethylbenzene (hemimellitene) in rats. International Journal of Occupational Medicine and Environmental Health 13, no. 3, 223-232.
Korsak, Z., et al. (2000b) Subchronic inhalation toxicity of 1,2,4-trimethylbenzene (pseudocumene) in rats. International Journal of Occupational Medicine and Environmental Health 13, no. 2, 155-164.
RIVM (1987) Chlorpyrifos - Korte samenvatting van humaantoxicologische gegevens. Auteurs: J. van Koten-Vermeulen en E. Heijna-Merkus.
RIVM (1994) Beoordelingssystematiek bodemkwaliteit ten behoeve van bouwvergunningsaanvragen. RIVM-rpport nr. 715810001 d.d. juni 1994.
RIVM (1995b) Toxicologische samenvatting – Tetramethrin. Toxicology Advisory Group 30-05-1995.
RIVM (1996a) Voorlopige MTR-waarde voor n-hexaan. Interne notitie van P. Janssen en J. van Engelen aan F. Swartjes d.d. 26 oktober 1996.
RIVM (1996b) Afleiding van voorlopige MTR voor cyclohexaan. Interne notitie van J. van Engelen & P. Janssen aan J. Kliest d.d. 1 oktober 1996.
RIVM (1998) Janssen P.J.C.M., Apeldoorn M.E. van, Engelen J.G.M. van, Schielen P.C.J.I.,Wouters, M.F.A. Maximum Permissble Risk levels for human intake of soil contaminants: Fourth series of compounds. RIVM rapport nr. 711701004, d.d. maart 1998.
RIVM (2001a) Baars A.J., Theelen R.M.C., Janssen P.J.C.M, Hesse J.M., Apeldoorn M.E. van, Meijerink M.C.M., Verdam L., Zeilmaker M.J.
Page 70 of 97 RIVM report 609021044
Re-evaluation of human-toxicological maximum permissible risk levels. RIVM rapport nr. 711701025, d.d. maart 2001.
RIVM (2001b) Tetramethrin - Toxicologie Addendum Adviesrapport no. 08433A00, d.d. 13-7-2001.
RIVM (2001c) Tetramethrin – Risicoschatting voor de particuliere en beroepsmatige toepasser. Adviesrapport no. 08433B01, d.d. 31-7-2001.
US-EPA (1997a). Cumene - Reference Concentration for Chronic Inhalation Exposure (RfC) d.d. 08/01/1997.
US-EPA (1997b). Reregistration eligibility decision (RED) – Propoxur. US EPA Office of Pesticide Registration.
US-EPA (1998) Integrated Risk Information System (IRIS) – Naftalene. Inhalation RfC Assessment 09/17/1998.DECOS (2003) Formaldehyde - Health-based recommended occupational exposure limit. Gezondheidsraad. http://www.gr.nl/adviezen.php?ID=622
WHO (2000). WHO Air Quality Guidelines for Europe 2nd edition, Regional Ofice for Europe.
WHO (2002) Concise International Chemical Assessment Document 40 – Formaldehyde. WHO/IPCS.
WHO/IPCS (1992) Environmental Health Criteria no.132 – Trichlorfon., Geneva. WHO/JECFA (1999) Toxicological evaluation of certain veterinary drug residues in
food. WHO Food Additives Series no. 43. Meeting of the Joint FAO/WHO Expert Committee on Food Additives.
WHO/JECFA (2000) Toxicological evaluation of certain veterinary drug residues in food. WHO Food Additives Series no. 45. Meeting of the Joint FAO/WHO Expert Committee on Food Additives.
WHO/JMPR (1999) Pesticide residues in food – 1999. Toxicological Evaluations. Joint meeting of the FAO Panel of Experts on Pesticide Residues in Food and the Environment and the WHO Core Assessment Group.
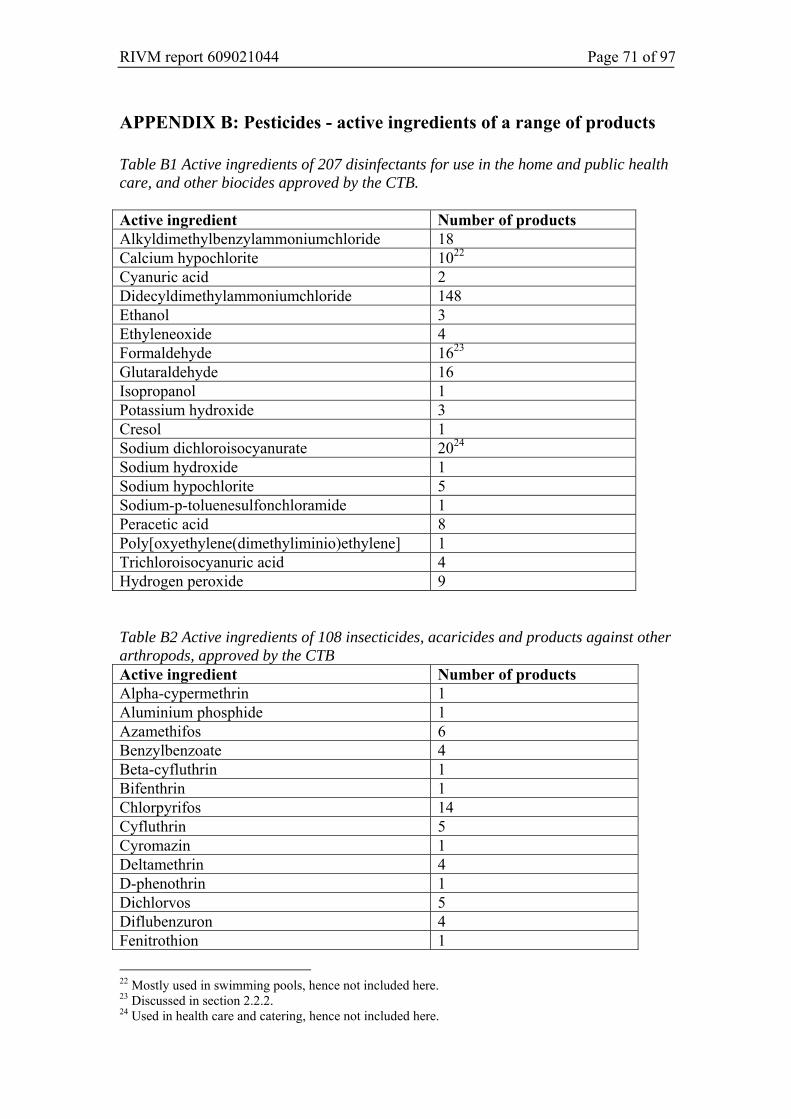
RIVM report 609021044 Page 71 of 97
APPENDIX B: Pesticides - active ingredients of a range of products Table B1 Active ingredients of 207 disinfectants for use in the home and public health care, and other biocides approved by the CTB. Active ingredient Number of products Alkyldimethylbenzylammoniumchloride 18 Calcium hypochlorite 1022 Cyanuric acid 2 Didecyldimethylammoniumchloride 148 Ethanol 3 Ethyleneoxide 4 Formaldehyde 1623 Glutaraldehyde 16 Isopropanol 1 Potassium hydroxide 3 Cresol 1 Sodium dichloroisocyanurate 2024 Sodium hydroxide 1 Sodium hypochlorite 5 Sodium-p-toluenesulfonchloramide 1 Peracetic acid 8 Poly[oxyethylene(dimethyliminio)ethylene] 1 Trichloroisocyanuric acid 4 Hydrogen peroxide 9 Table B2 Active ingredients of 108 insecticides, acaricides and products against other arthropods, approved by the CTB Active ingredient Number of products Alpha-cypermethrin 1 Aluminium phosphide 1 Azamethifos 6 Benzylbenzoate 4 Beta-cyfluthrin 1 Bifenthrin 1 Chlorpyrifos 14 Cyfluthrin 5 Cyromazin 1 Deltamethrin 4 D-phenothrin 1 Dichlorvos 5 Diflubenzuron 4 Fenitrothion 1
22 Mostly used in swimming pools, hence not included here. 23 Discussed in section 2.2.2. 24 Used in health care and catering, hence not included here.
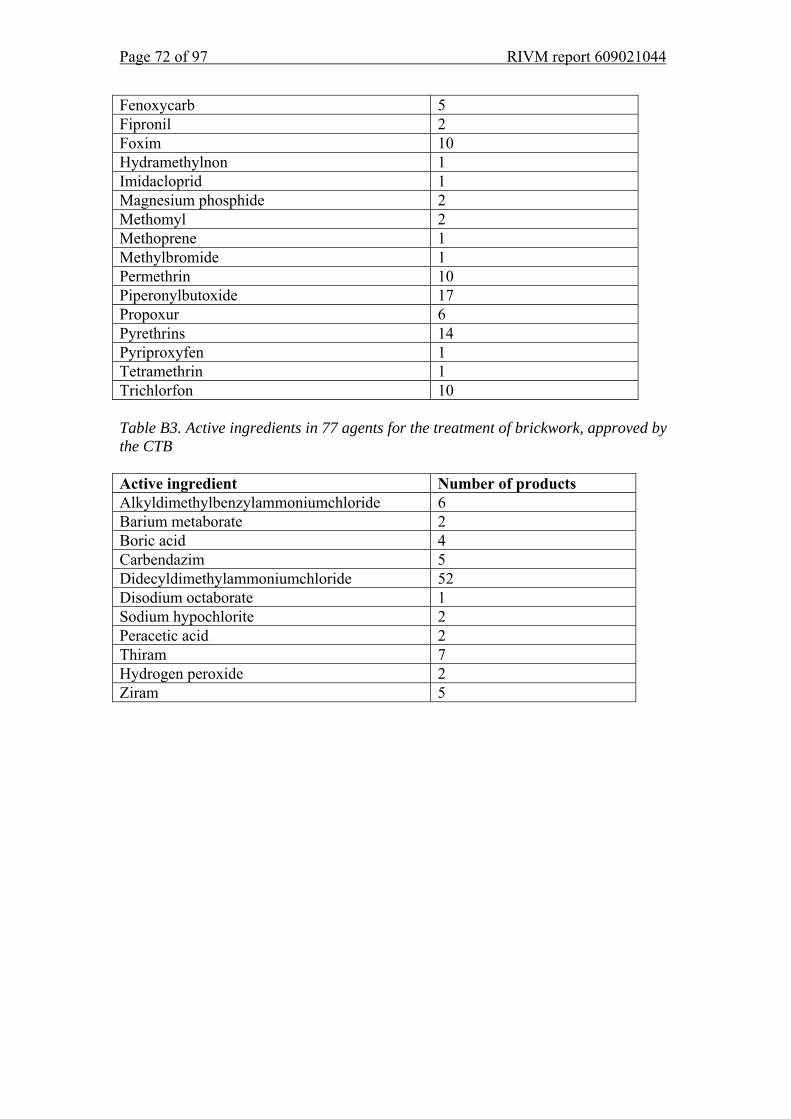
Page 72 of 97 RIVM report 609021044
Fenoxycarb 5 Fipronil 2 Foxim 10 Hydramethylnon 1 Imidacloprid 1 Magnesium phosphide 2 Methomyl 2 Methoprene 1 Methylbromide 1 Permethrin 10 Piperonylbutoxide 17 Propoxur 6 Pyrethrins 14 Pyriproxyfen 1 Tetramethrin 1 Trichlorfon 10 Table B3. Active ingredients in 77 agents for the treatment of brickwork, approved by the CTB Active ingredient Number of products Alkyldimethylbenzylammoniumchloride 6 Barium metaborate 2 Boric acid 4 Carbendazim 5 Didecyldimethylammoniumchloride 52 Disodium octaborate 1 Sodium hypochlorite 2 Peracetic acid 2 Thiram 7 Hydrogen peroxide 2 Ziram 5
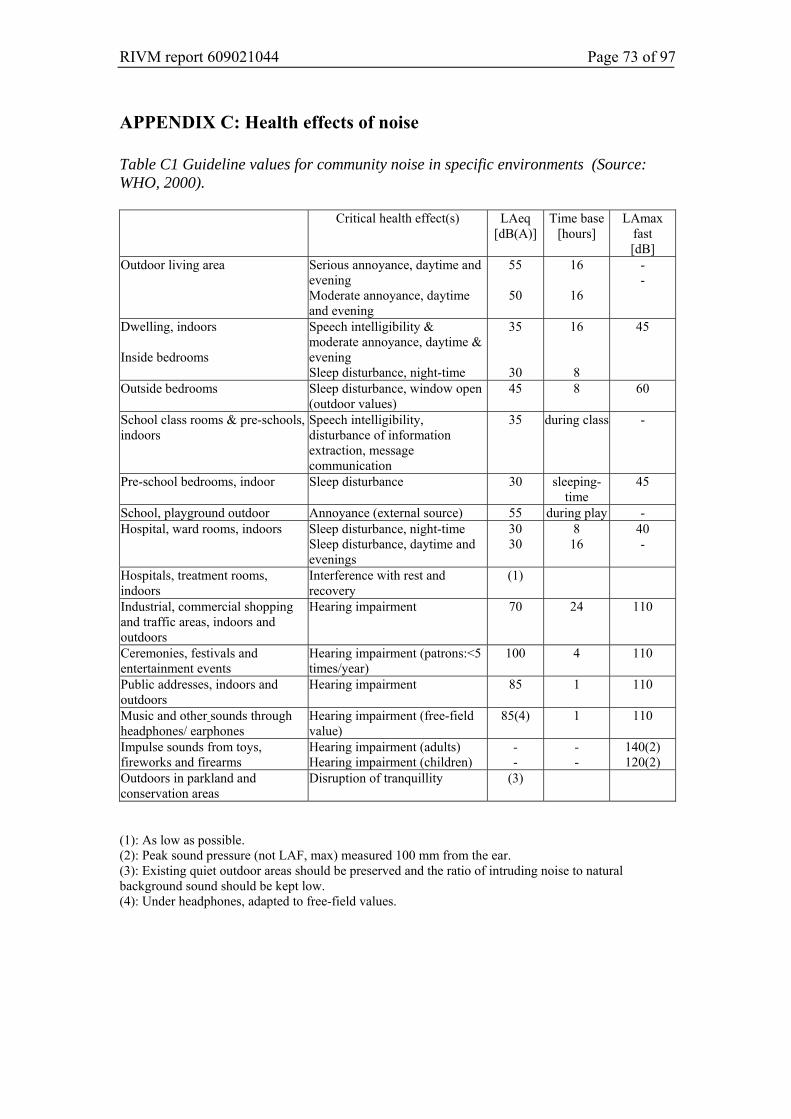
RIVM report 609021044 Page 73 of 97
APPENDIX C: Health effects of noise Table C1 Guideline values for community noise in specific environments (Source: WHO, 2000).
Critical health effect(s) LAeq [dB(A)]
Time base [hours]
LAmax fast [dB]
Outdoor living area Serious annoyance, daytime and evening Moderate annoyance, daytime and evening
55
50
16
16
- -
Dwelling, indoors Inside bedrooms
Speech intelligibility & moderate annoyance, daytime & evening Sleep disturbance, night-time
35
30
16
8
45
Outside bedrooms Sleep disturbance, window open (outdoor values)
45 8 60
School class rooms & pre-schools, indoors
Speech intelligibility, disturbance of information extraction, message communication
35 during class -
Pre-school bedrooms, indoor Sleep disturbance 30 sleeping-time
45
School, playground outdoor Annoyance (external source) 55 during play - Hospital, ward rooms, indoors Sleep disturbance, night-time
Sleep disturbance, daytime and evenings
30 30
8 16
40 -
Hospitals, treatment rooms, indoors
Interference with rest and recovery
(1)
Industrial, commercial shopping and traffic areas, indoors and outdoors
Hearing impairment 70 24 110
Ceremonies, festivals and entertainment events
Hearing impairment (patrons:<5 times/year)
100 4 110
Public addresses, indoors and outdoors
Hearing impairment 85 1 110
Music and other sounds through headphones/ earphones
Hearing impairment (free-field value)
85(4) 1 110
Impulse sounds from toys, fireworks and firearms
Hearing impairment (adults) Hearing impairment (children)
- -
- -
140(2) 120(2)
Outdoors in parkland and conservation areas
Disruption of tranquillity (3)
(1): As low as possible. (2): Peak sound pressure (not LAF, max) measured 100 mm from the ear. (3): Existing quiet outdoor areas should be preserved and the ratio of intruding noise to natural background sound should be kept low. (4): Under headphones, adapted to free-field values.

Page 74 of 97 RIVM report 609021044
RIVM report 609021044 Page 75 of 97
APPENDIX D: Values used in other countries There is also interest in the indoor environment in other countries. Traditionally, limit values to protect human health have mostly been set for the workplace environment. However, in this project we aimed to identify limit values defined for dwellings. We undertook an extensive literature and Internet search. This showed that there are few standards specifically for the residential environment. In many cases, a value set for the workplace environment is used with correction factors to allow for differences in the exposure period and the fact that the occupants of a dwelling may have a higher sensitivity than employees. Values specifically for dwellings Germany and Canada use a systematic approach to collect or define limit values for dwellings. Hence, the table includes many values from these countries, which need some explanation. Health Canada In Canada work started in the early 1980s on defining the Exposure Guidelines for Residential Indoor Air Quality. Health Canada does not have the authority to define limits, so these values are guidelines. The results were compiled in a document published in 1995 by the Minister of Supply and Services Canada. A number of working parties set guideline values for aldehydes, CO2, CO, NO2, O3, fine dust, SO2, water vapour and radon. It was concluded that it was not possible to set guideline values for a range of other agents, normally due to a lack of data. This concerned biological agents, ETS (Environmental Tobacco Smoke) and substances found in consumer products. In those cases, recommendations were given for minimising exposure. These agents and the guideline values are included in the table. The following methods were used for setting these values: • For noncarcinogenic substances the LOAEL (lowest observed adverse effect
level) was used. This was divided by safety factors dependent on the origin of the data (animal or human studies) and if the data also covered potentially sensitive groups in the population. In essence, the safety factor is primarily based on consensus among the experts. Health Canada decided not to use values set for workplace exposure as their scientific underpinning is often unclear and because these values are often also based on feasibility.
• For carcinogenic substances an extrapolation was used, based on higher exposures in the workplace.
Two types of values were defined: • ALTER (Acceptable Long-Term Exposure Range): the concentration range which
it is believed from existing information that a person may be exposed to over a lifetime without undue risk to health.
• ASTER (Acceptable Short-Term Exposure Range): the concentration range which it is believed from existing information that a person may be exposed to over the specified time period without undue risk to health.
In the table these values are indicated by the reference ‘Health Canada’.
Page 76 of 97 RIVM report 609021044
Germany Germany started to define guideline values for the indoor environment in the mid-1990s. This was further to the publication by the authorities of a concept for better indoor air quality. Here, the indoor environment is broadly defined: the guideline values apply to dwellings, but also to other environments. Initially, a general framework was drawn up further to which guideline values are defined (Ad-HOC-AG 1996). This framework is used by the working parties when defining guideline values. The steps of the framework are: 1. Determining the effect threshold, preferably on the basis of human studies,
otherwise using animal studies. The LOAEL provides the starting point. 2. Convert animal data to human data. 3. Consider sensitive groups. 4. Consider the exposure pattern. 5. Consider physiological differences in the population. 6. Identify other relevant aspects, e.g. exposure through other routes. Two types of values are defined: • Guideline Value II (GVII): action is necessary if this value is exceeded. Staying
permanently in an environment where this concentration is present is likely to lead to health effects, particularly in sensitive subjects.
• Guideline Value I (GVI); No health effect is expected after lifetime exposure to this concentration. It is determined by dividing GVII by 10. If the substance has an odour threshold which is lower than the GVI then the odour threshold is used instead.
These determinations have been published in a number of science journals. In the table these values are identified by the reference ‘Germany’ (and the name of the author, where the article included a named author)25. Other values As there are few guideline values for dwellings we investigated what other values could be used as a basis for assessing indoor air quality. These values are also included in the table. First of all, TCAs (permissible concentration in air) have been defined in the Netherlands for a range of substances. These primarily relate to volatile substances which may be released during soil remediation projects. They were defined to protect health and indicate the concentrations which after lifetime exposure are not expected to lead to effects in the general population. Hence, in theory, they can be used as health-based guideline values for the indoor environment. These values were included where possible, see Section 2 of this report. For completeness sake they are also included in the table in this appendix26.
25 In addition to the agents considered for this project, the German work includes documents on pentachlorophenol, diisocyanate and tri-2-chloroethylphosphate (AG, 1997; Wolff, 2000 and Sagunski, 2002). 26 TCAs defined as part of this project are not included in the table.
RIVM report 609021044 Page 77 of 97
Secondly, the WHO guidelines for the outdoor atmosphere are also of some use. These are based on health considerations and do not consider the feasibility aspects, etc. incorporated in many national limit values. Thirdly, the ATSDR has defined Minimal Risk Levels for Hazardous Substances (MRLs). These are based on the NOAEL. Human studies are used where possible, but many values are derived from animal studies. Safety factors are applied to correct for the differences between humans and animals, or an additional margin is included to protect sensitive groups. Three exposure categories are used when defining MRLs: Acute MRL 1 - 14 days Intermediate MRL > 14 - 364 days Chronic MRL > 364 days Finally, Kirkeskov et al. determined no expected health effect concentrations for a large number of VOCs. Their work was based on published NOAEL/LOAEL values from a study on VOCs which may be released from timber and timber products. They determined the LCI (Lowest Concentration of Interest) for each VOC. This is the concentration which given continuous exposure (27 hours/day, 70 years) does not affect health or comfort. Current issues During our search for information we learned about a number of national and working party projects on the indoor environment. However, at present they do not have any values which could be included in the table. These projects are: • UK: COMEAP (Committee on the Medical Effects of Air Pollutants) is working
on a publication on indoor air quality guidelines. This has reached the draft stage, but was not available for external use by the time this present report went to press.
• ISPRA: do not currently have guidelines for dwellings. • There may be other projects, but we could not identify them through a literature
search. Hence, there may be activities in other countries which have not been included here.
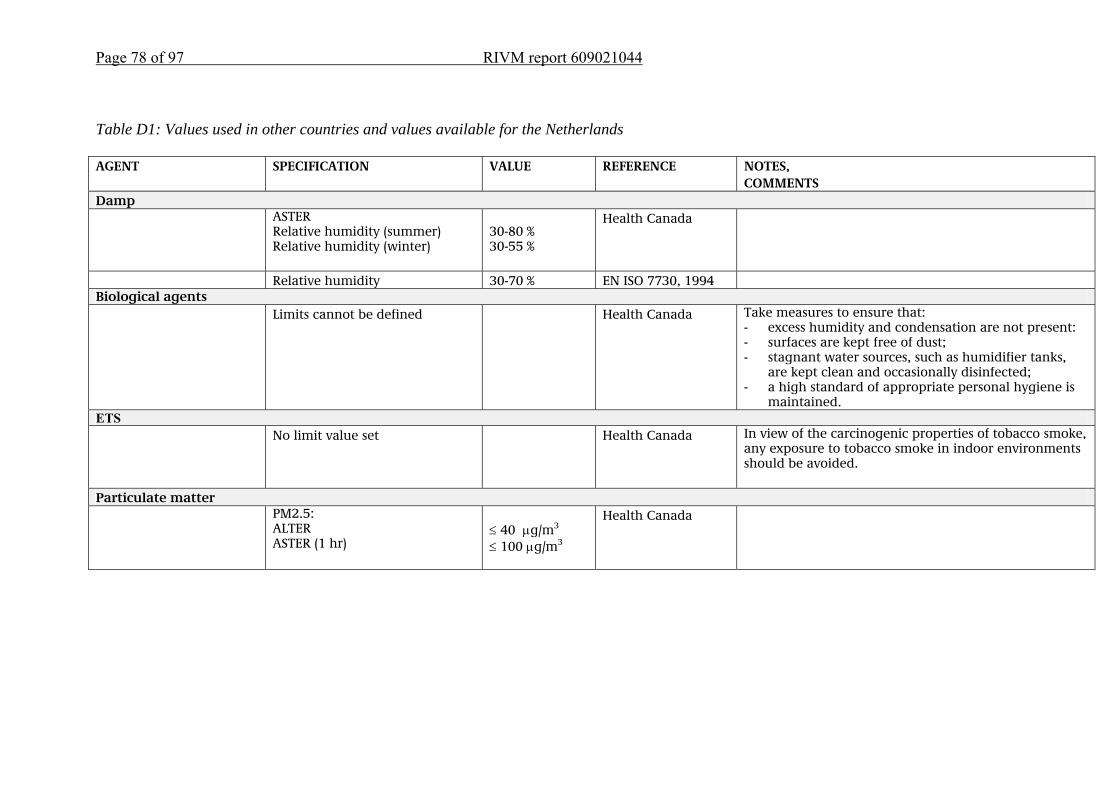
Page 78 of 97 RIVM report 609021044
Table D1: Values used in other countries and values available for the Netherlands AGENT SPECIFICATION VALUE REFERENCE NOTES,
COMMENTS Damp ASTER
Relative humidity (summer) Relative humidity (winter)
30-80 % 30-55 %
Health Canada
Relative humidity 30-70 % EN ISO 7730, 1994 Biological agents Limits cannot be defined Health Canada Take measures to ensure that:
- excess humidity and condensation are not present: - surfaces are kept free of dust; - stagnant water sources, such as humidifier tanks,
are kept clean and occasionally disinfected; - a high standard of appropriate personal hygiene is
maintained. ETS No limit value set Health Canada In view of the carcinogenic properties of tobacco smoke,
any exposure to tobacco smoke in indoor environments should be avoided.
Particulate matter PM2.5:
ALTER ASTER (1 hr)
≤ 40 μg/m3 ≤ 100 μg/m3
Health Canada
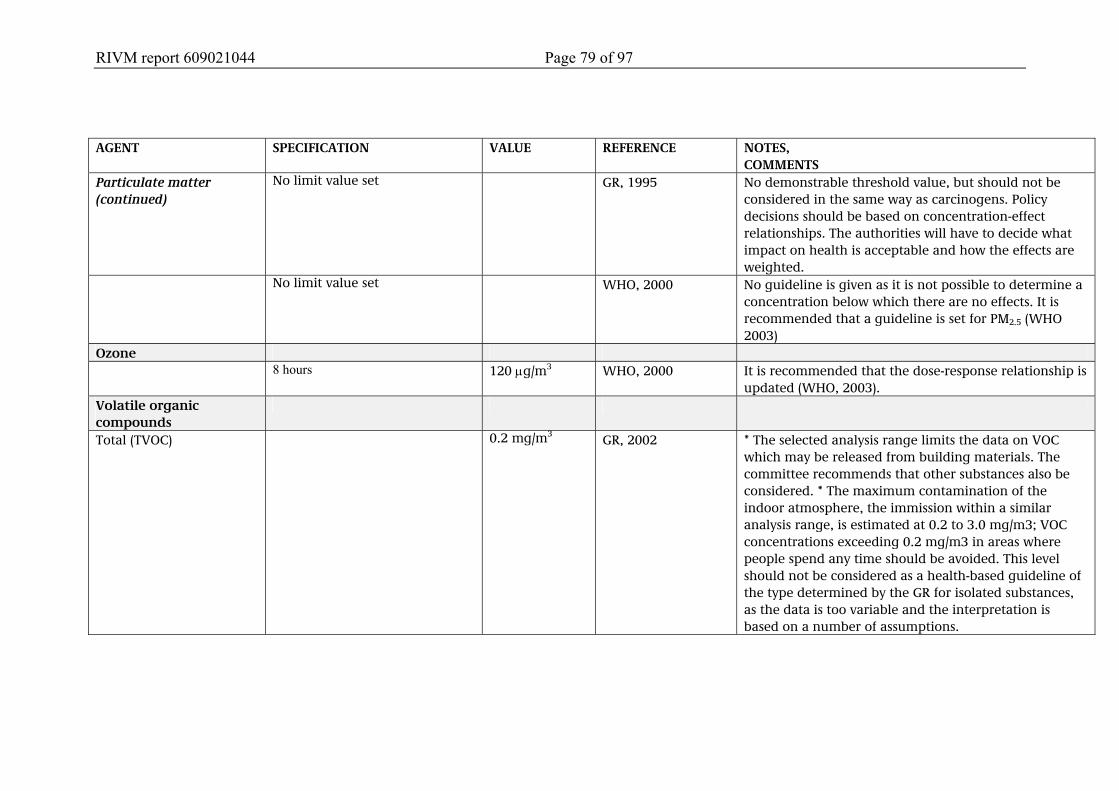
RIVM report 609021044 Page 79 of 97
AGENT SPECIFICATION VALUE REFERENCE NOTES,
COMMENTS Particulate matter (continued)
No limit value set GR, 1995 No demonstrable threshold value, but should not be considered in the same way as carcinogens. Policy decisions should be based on concentration-effect relationships. The authorities will have to decide what impact on health is acceptable and how the effects are weighted.
No limit value set WHO, 2000 No guideline is given as it is not possible to determine a concentration below which there are no effects. It is recommended that a guideline is set for PM2.5 (WHO 2003)
Ozone 8 hours 120 μg/m3 WHO, 2000 It is recommended that the dose-response relationship is
updated (WHO, 2003). Volatile organic compounds
Total (TVOC)
0.2 mg/m3 GR, 2002 * The selected analysis range limits the data on VOC which may be released from building materials. The committee recommends that other substances also be considered. * The maximum contamination of the indoor atmosphere, the immission within a similar analysis range, is estimated at 0.2 to 3.0 mg/m3; VOC concentrations exceeding 0.2 mg/m3 in areas where people spend any time should be avoided. This level should not be considered as a health-based guideline of the type determined by the GR for isolated substances, as the data is too variable and the interpretation is based on a number of assumptions.
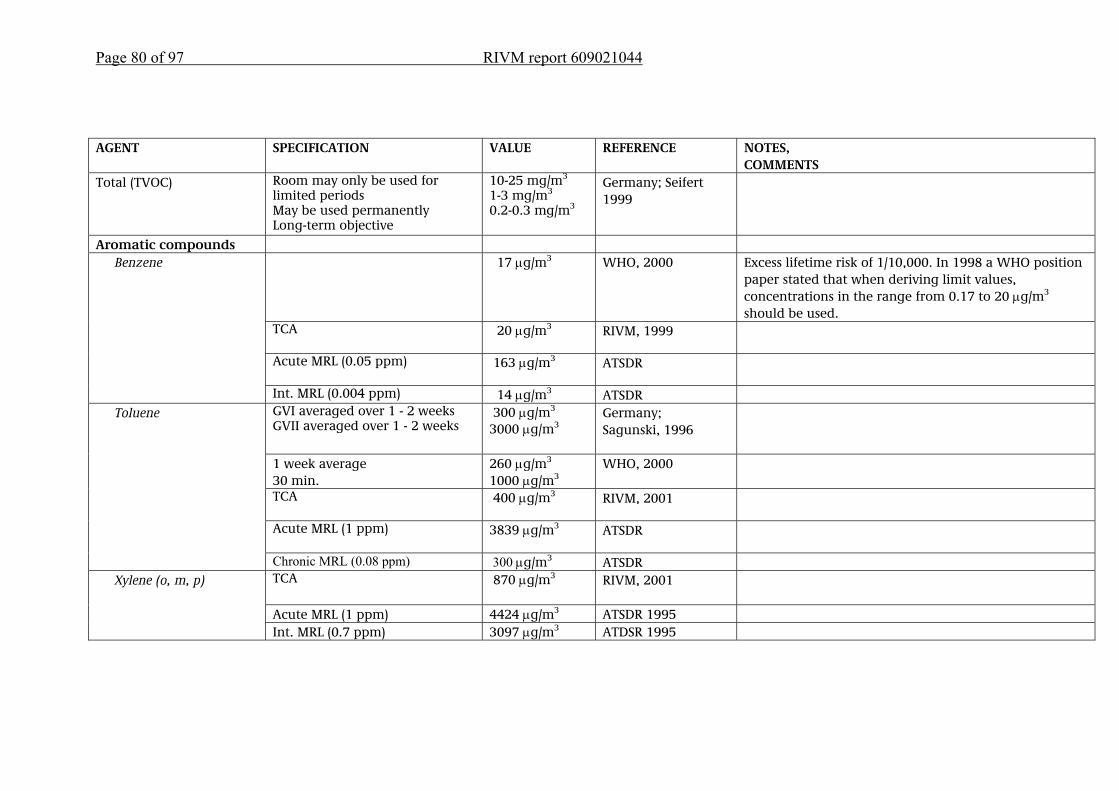
Page 80 of 97 RIVM report 609021044
AGENT SPECIFICATION VALUE REFERENCE NOTES,
COMMENTS Total (TVOC) Room may only be used for
limited periods May be used permanently Long-term objective
10-25 mg/m3 1-3 mg/m3 0.2-0.3 mg/m3
Germany; Seifert 1999
Aromatic compounds 17 μg/m3 WHO, 2000 Excess lifetime risk of 1/10,000. In 1998 a WHO position
paper stated that when deriving limit values, concentrations in the range from 0.17 to 20 μg/m3 should be used.
TCA 20 μg/m3
RIVM, 1999
Acute MRL (0.05 ppm) 163 μg/m3
ATSDR
Benzene
Int. MRL (0.004 ppm) 14 μg/m3 ATSDR GVI averaged over 1 - 2 weeks GVII averaged over 1 - 2 weeks
300 μg/m3 3000 μg/m3
Germany; Sagunski, 1996
1 week average 30 min.
260 μg/m3 1000 μg/m3
WHO, 2000
TCA 400 μg/m3
RIVM, 2001
Acute MRL (1 ppm) 3839 μg/m3
ATSDR
Toluene
Chronic MRL (0.08 ppm) 300 μg/m3 ATSDR TCA 870 μg/m3
RIVM, 2001
Acute MRL (1 ppm) 4424 μg/m3 ATSDR 1995
Xylene (o, m, p)
Int. MRL (0.7 ppm) 3097 μg/m3 ATDSR 1995
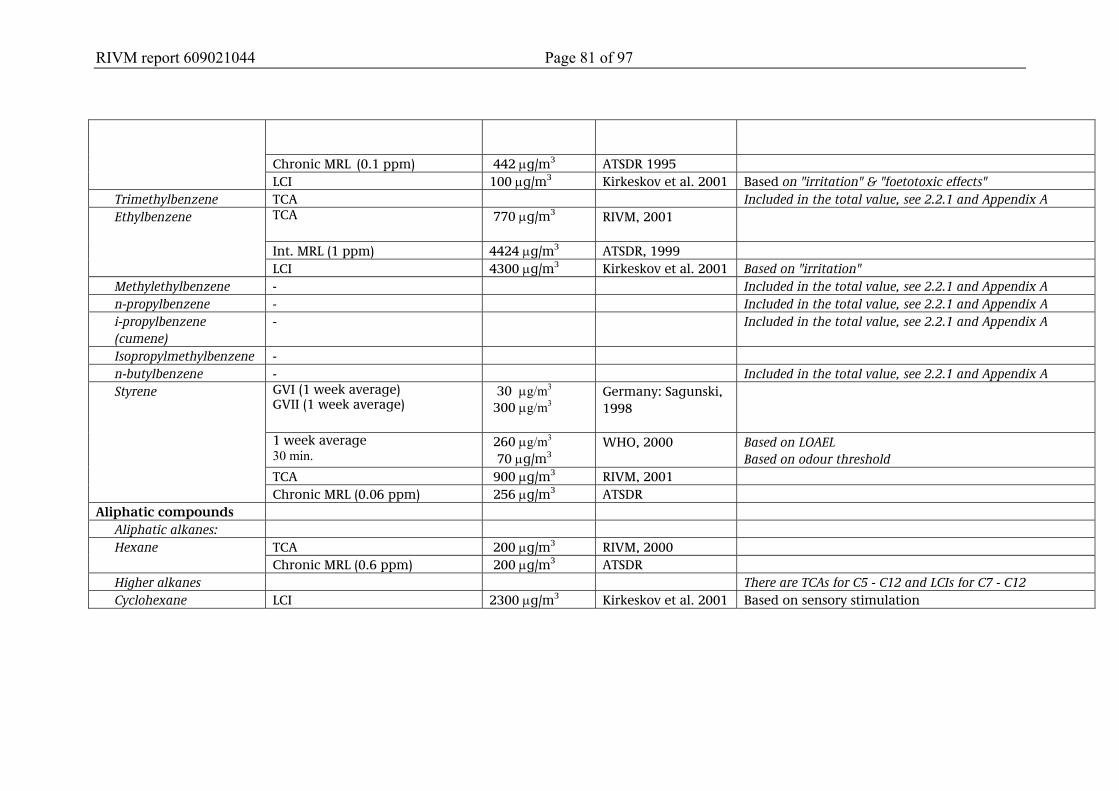
RIVM report 609021044 Page 81 of 97
Chronic MRL (0.1 ppm) 442 μg/m3 ATSDR 1995
LCI 100 μg/m3 Kirkeskov et al. 2001 Based on "irritation" & "foetotoxic effects" Trimethylbenzene TCA Included in the total value, see 2.2.1 and Appendix A
TCA 770 μg/m3
RIVM, 2001
Int. MRL (1 ppm) 4424 μg/m3 ATSDR, 1999
Ethylbenzene
LCI 4300 μg/m3 Kirkeskov et al. 2001 Based on "irritation" Methylethylbenzene - Included in the total value, see 2.2.1 and Appendix A n-propylbenzene - Included in the total value, see 2.2.1 and Appendix A i-propylbenzene (cumene)
- Included in the total value, see 2.2.1 and Appendix A
Isopropylmethylbenzene - n-butylbenzene - Included in the total value, see 2.2.1 and Appendix A
GVI (1 week average) GVII (1 week average)
30 μg/m3 300 μg/m3
Germany: Sagunski, 1998
1 week average 30 min.
260 μg/m3 70 μg/m3
WHO, 2000 Based on LOAEL Based on odour threshold
TCA 900 μg/m3 RIVM, 2001
Styrene
Chronic MRL (0.06 ppm) 256 μg/m3 ATSDR Aliphatic compounds
Aliphatic alkanes: TCA 200 μg/m3 RIVM, 2000 Hexane Chronic MRL (0.6 ppm) 200 μg/m3 ATSDR
Higher alkanes There are TCAs for C5 - C12 and LCIs for C7 - C12 Cyclohexane LCI 2300 μg/m3 Kirkeskov et al. 2001 Based on sensory stimulation

Page 82 of 97 RIVM report 609021044
AGENT SPECIFICATION VALUE REFERENCE NOTES,
COMMENTS Chlorinated aliphatic compounds
GVI (24 h average) GVII (24 h average)
200 μg/ m3
2000 μg/ m3
Germany; Witten et al. 1997
24 h average 1 wk average
3000 μg/ m3 450 μg/ m3
WHO, 2000
Dichloromethane
TCL 3000 μg/ m3 RIVM, 2001 TCL 100 μg/ m3 RIVM, 1991 Acute MRL (0.1 ppm) 497 μg/ m3 ATSDR, 1997 Int. MRL (0.05 ppm) 249 μg/ m3 ATSDR, 1997
Trichloromethane (chloroform)
Chronic MRL (0.02 ppm) 100 μg/ m3 ATSDR, 1997 24 h average 700 μg/ m3 WHO, 2000 1,2-dichloroethane Chronic MRL (0.6 ppm) 2800 μg/ m3 ATSDR, 2001 TCL 380 μg/ m3 RIVM, 1995 Acute MRL 11117 μg/ m3 ATSDR, 1995 Intermediate MRL 3891 μg/ m3 ATSDR, 1995
1,1,1-trichloroethane
Chronic MRL none Acute MRL (0.05 ppm) 300 μg/ m3 ATSDR 1989 Int. MRL (0.007 ppm) 42 μg/ m3 ATSDR 1989
1,2-dichloropropane
Chronic MRL none ATSDR 1989 Excess lifetime risk of 1/10 000 230 μg/ m3 WHO, 2000 TCL 200 μg/ m3 RIVM, 2001 Acute MRL (0.1 ppm) 10950 μg/ m3 ATSDR 1997 Int. MRL (2 ppm) 548 μg/ m3 ATSDR 1997
Trichloroethene/trichloroethylene
Chronic MRL none Tetrachloroethene/ tetrachloroethylene
Annual average 30 min.
250 μg/ m3 8000 μg/ m3
WHO 2000
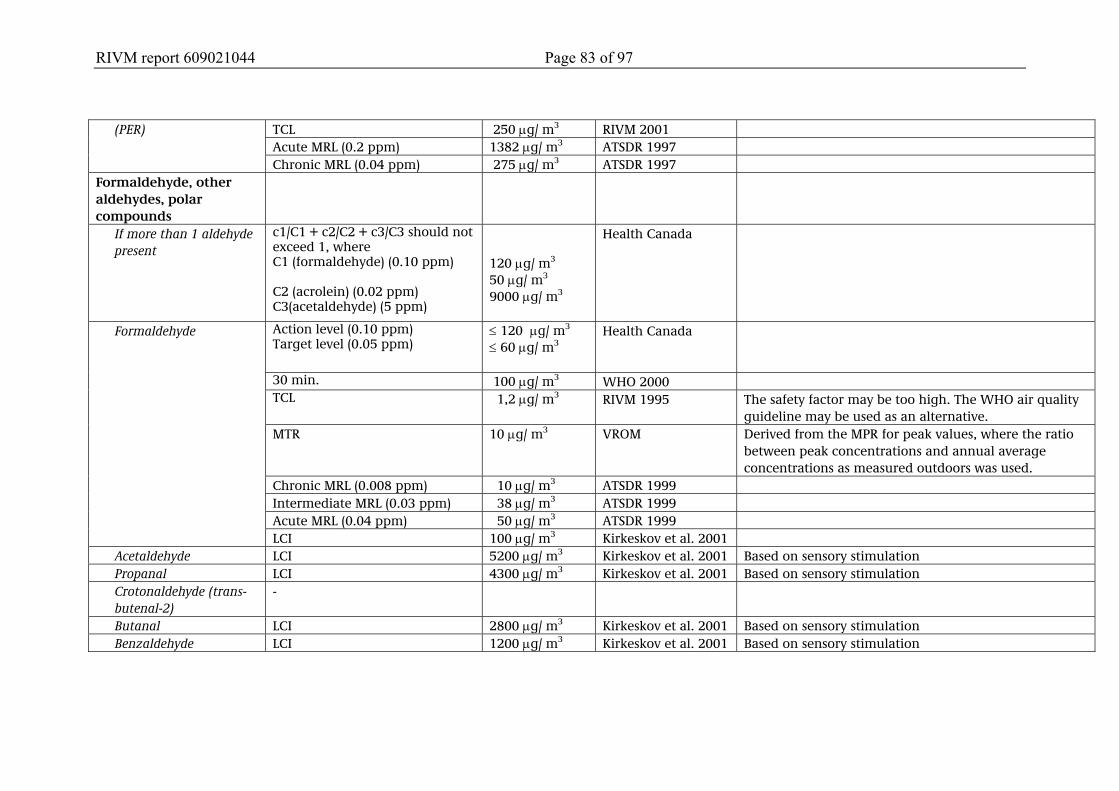
RIVM report 609021044 Page 83 of 97
TCL 250 μg/ m3 RIVM 2001 Acute MRL (0.2 ppm) 1382 μg/ m3 ATSDR 1997
(PER)
Chronic MRL (0.04 ppm) 275 μg/ m3 ATSDR 1997 Formaldehyde, other aldehydes, polar compounds
If more than 1 aldehyde present
c1/C1 + c2/C2 + c3/C3 should not exceed 1, where C1 (formaldehyde) (0.10 ppm) C2 (acrolein) (0.02 ppm) C3(acetaldehyde) (5 ppm)
120 μg/ m3
50 μg/ m3 9000 μg/ m3
Health Canada
Action level (0.10 ppm) Target level (0.05 ppm)
≤ 120 μg/ m3 ≤ 60 μg/ m3
Health Canada
30 min. 100 μg/ m3 WHO 2000 TCL 1,2 μg/ m3 RIVM 1995 The safety factor may be too high. The WHO air quality
guideline may be used as an alternative. MTR 10 μg/ m3 VROM Derived from the MPR for peak values, where the ratio
between peak concentrations and annual average concentrations as measured outdoors was used.
Chronic MRL (0.008 ppm) 10 μg/ m3 ATSDR 1999 Intermediate MRL (0.03 ppm) 38 μg/ m3 ATSDR 1999 Acute MRL (0.04 ppm) 50 μg/ m3 ATSDR 1999
Formaldehyde
LCI 100 μg/ m3 Kirkeskov et al. 2001 Acetaldehyde LCI 5200 μg/ m3 Kirkeskov et al. 2001 Based on sensory stimulation Propanal LCI 4300 μg/ m3 Kirkeskov et al. 2001 Based on sensory stimulation Crotonaldehyde (trans-butenal-2)
-
Butanal LCI 2800 μg/ m3 Kirkeskov et al. 2001 Based on sensory stimulation Benzaldehyde LCI 1200 μg/ m3 Kirkeskov et al. 2001 Based on sensory stimulation
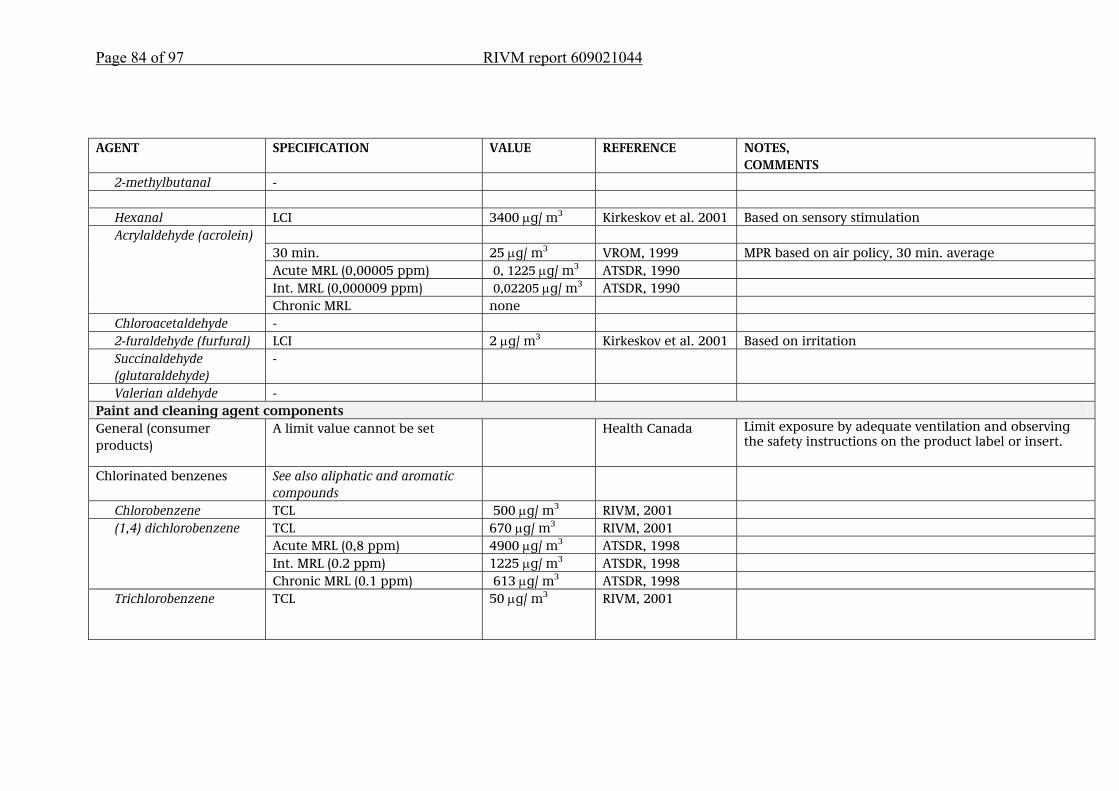
Page 84 of 97 RIVM report 609021044
AGENT SPECIFICATION VALUE REFERENCE NOTES,
COMMENTS 2-methylbutanal - Hexanal LCI 3400 μg/ m3 Kirkeskov et al. 2001 Based on sensory stimulation
30 min. 25 μg/ m3 VROM, 1999 MPR based on air policy, 30 min. average Acute MRL (0,00005 ppm) 0, 1225 μg/ m3 ATSDR, 1990 Int. MRL (0,000009 ppm) 0,02205 μg/ m3 ATSDR, 1990
Acrylaldehyde (acrolein)
Chronic MRL none Chloroacetaldehyde - 2-furaldehyde (furfural) LCI 2 μg/ m3 Kirkeskov et al. 2001 Based on irritation Succinaldehyde (glutaraldehyde)
-
Valerian aldehyde - Paint and cleaning agent components General (consumer products)
A limit value cannot be set
Health Canada Limit exposure by adequate ventilation and observing the safety instructions on the product label or insert.
Chlorinated benzenes See also aliphatic and aromatic compounds
Chlorobenzene TCL 500 μg/ m3 RIVM, 2001 TCL 670 μg/ m3 RIVM, 2001 Acute MRL (0,8 ppm) 4900 μg/ m3 ATSDR, 1998 Int. MRL (0.2 ppm) 1225 μg/ m3 ATSDR, 1998
(1,4) dichlorobenzene
Chronic MRL (0.1 ppm) 613 μg/ m3 ATSDR, 1998 Trichlorobenzene TCL 50 μg/ m3 RIVM, 2001
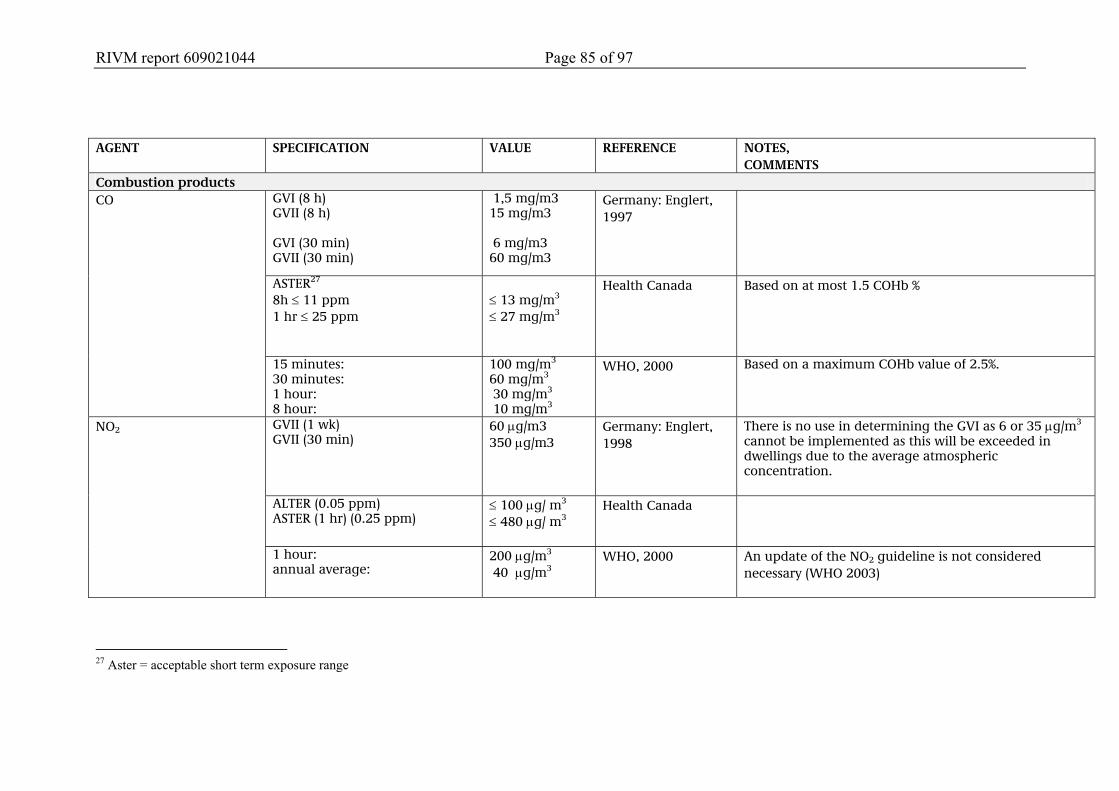
RIVM report 609021044 Page 85 of 97
AGENT SPECIFICATION VALUE REFERENCE NOTES,
COMMENTS Combustion products
GVI (8 h) GVII (8 h) GVI (30 min) GVII (30 min)
1,5 mg/m3 15 mg/m3 6 mg/m3 60 mg/m3
Germany: Englert, 1997
ASTER27 8h ≤ 11 ppm 1 hr ≤ 25 ppm
≤ 13 mg/m3 ≤ 27 mg/m3
Health Canada Based on at most 1.5 COHb %
CO
15 minutes: 30 minutes: 1 hour: 8 hour:
100 mg/m3 60 mg/m3 30 mg/m3 10 mg/m3
WHO, 2000 Based on a maximum COHb value of 2.5%.
GVII (1 wk) GVII (30 min)
60 μg/m3 350 μg/m3
Germany: Englert, 1998
There is no use in determining the GVI as 6 or 35 μg/m3
cannot be implemented as this will be exceeded in dwellings due to the average atmospheric concentration.
ALTER (0.05 ppm) ASTER (1 hr) (0.25 ppm)
≤ 100 μg/ m3 ≤ 480 μg/ m3
Health Canada
NO2
1 hour: annual average:
200 μg/m3 40 μg/m3
WHO, 2000 An update of the NO2 guideline is not considered necessary (WHO 2003)
27 Aster = acceptable short term exposure range
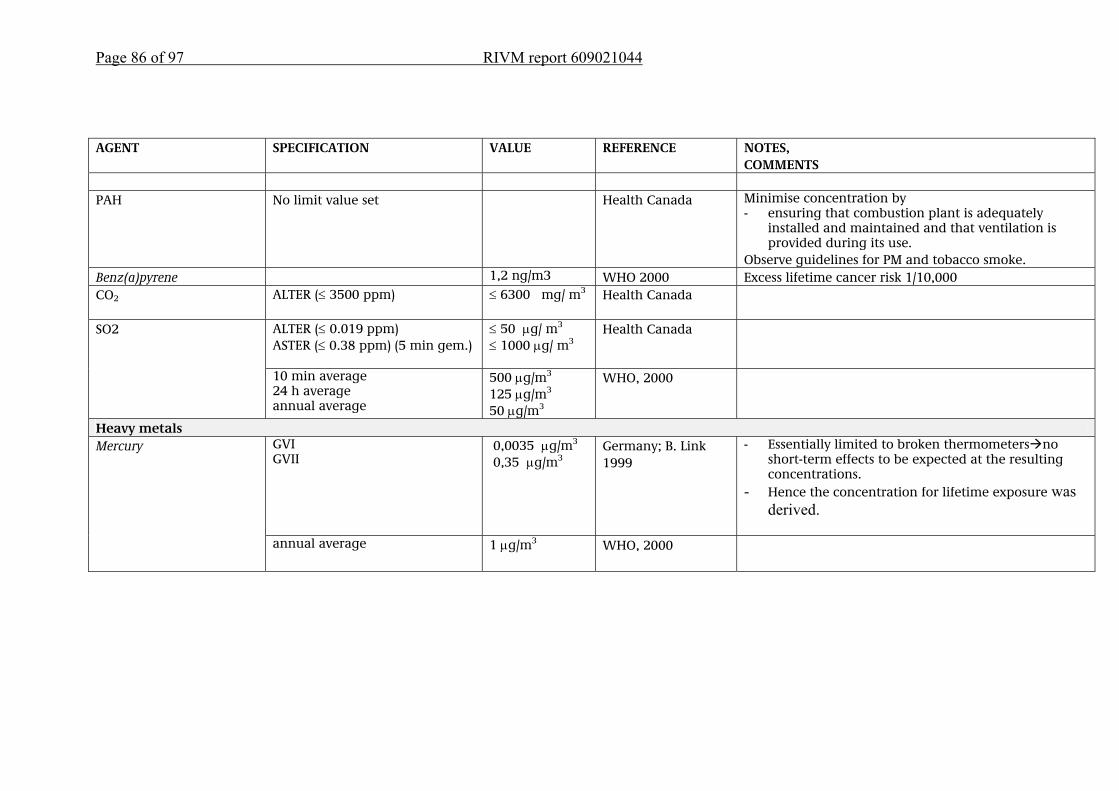
Page 86 of 97 RIVM report 609021044
AGENT SPECIFICATION VALUE REFERENCE NOTES,
COMMENTS PAH No limit value set Health Canada Minimise concentration by
- ensuring that combustion plant is adequately installed and maintained and that ventilation is provided during its use.
Observe guidelines for PM and tobacco smoke. Benz(a)pyrene 1,2 ng/m3 WHO 2000 Excess lifetime cancer risk 1/10,000 CO2 ALTER (≤ 3500 ppm) ≤ 6300 mg/ m3
Health Canada
ALTER (≤ 0.019 ppm) ASTER (≤ 0.38 ppm) (5 min gem.)
≤ 50 μg/ m3 ≤ 1000 μg/ m3
Health Canada SO2
10 min average 24 h average annual average
500 μg/m3 125 μg/m3 50 μg/m3
WHO, 2000
Heavy metals GVI GVII
0,0035 μg/m3
0,35 μg/m3
Germany; B. Link 1999
- Essentially limited to broken thermometers no short-term effects to be expected at the resulting concentrations.
- Hence the concentration for lifetime exposure was derived.
Mercury
annual average 1 μg/m3 WHO, 2000
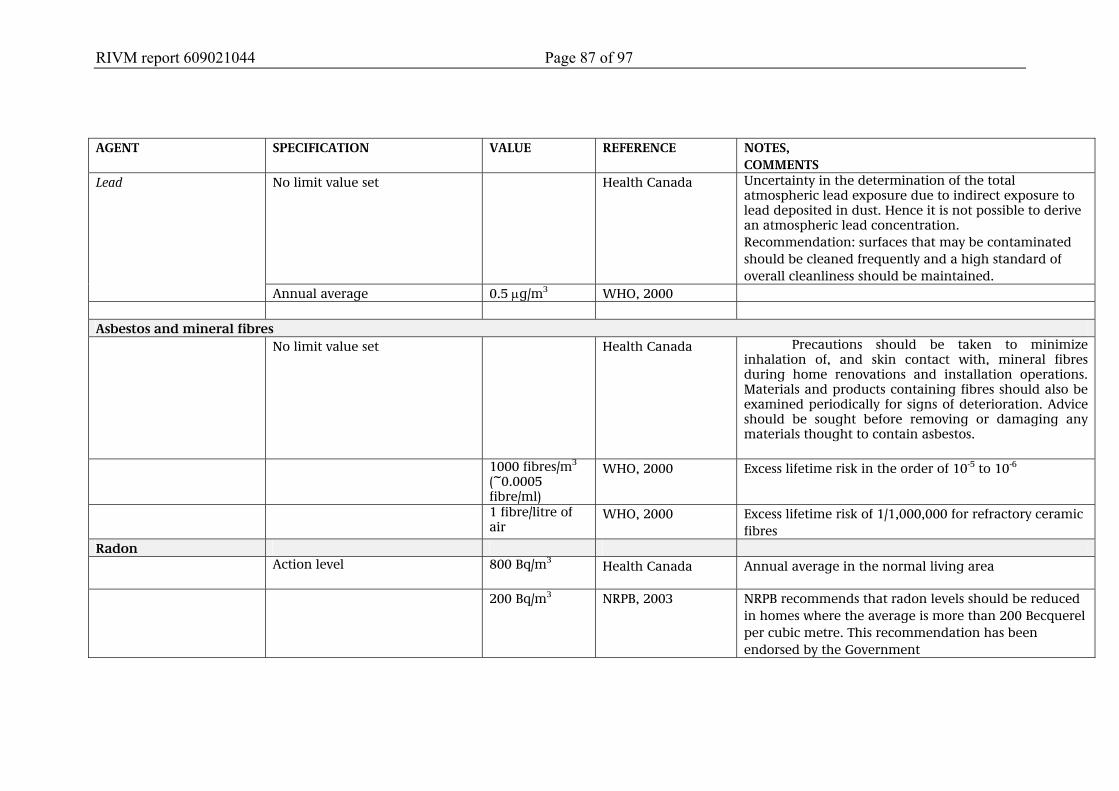
RIVM report 609021044 Page 87 of 97
AGENT SPECIFICATION VALUE REFERENCE NOTES,
COMMENTS No limit value set Health Canada Uncertainty in the determination of the total
atmospheric lead exposure due to indirect exposure to lead deposited in dust. Hence it is not possible to derive an atmospheric lead concentration. Recommendation: surfaces that may be contaminated should be cleaned frequently and a high standard of overall cleanliness should be maintained.
Lead
Annual average 0.5 μg/m3 WHO, 2000 Asbestos and mineral fibres No limit value set Health Canada Precautions should be taken to minimize
inhalation of, and skin contact with, mineral fibres during home renovations and installation operations. Materials and products containing fibres should also be examined periodically for signs of deterioration. Advice should be sought before removing or damaging any materials thought to contain asbestos.
1000 fibres/m3 (~0.0005 fibre/ml)
WHO, 2000 Excess lifetime risk in the order of 10-5 to 10-6
1 fibre/litre of air
WHO, 2000 Excess lifetime risk of 1/1,000,000 for refractory ceramic fibres
Radon Action level 800 Bq/m3
Health Canada Annual average in the normal living area
200 Bq/m3 NRPB, 2003 NRPB recommends that radon levels should be reduced in homes where the average is more than 200 Becquerel per cubic metre. This recommendation has been endorsed by the Government
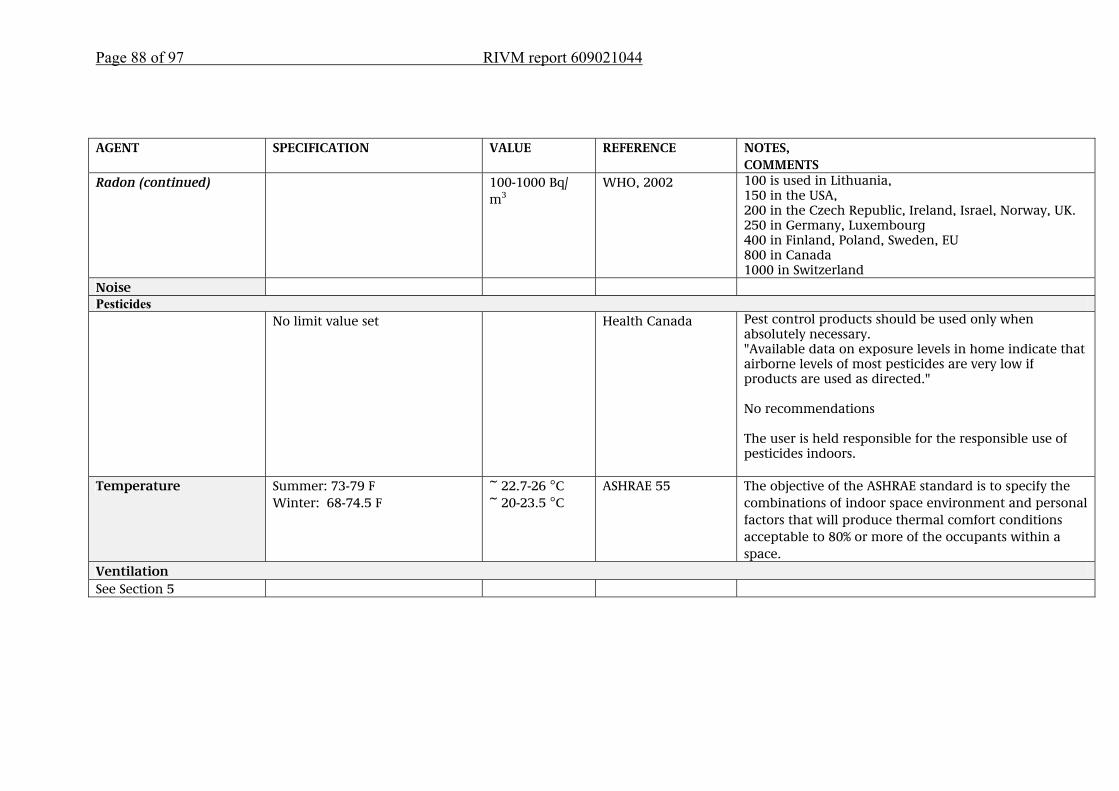
Page 88 of 97 RIVM report 609021044
AGENT SPECIFICATION VALUE REFERENCE NOTES,
COMMENTS Radon (continued) 100-1000 Bq/
m3 WHO, 2002 100 is used in Lithuania,
150 in the USA, 200 in the Czech Republic, Ireland, Israel, Norway, UK. 250 in Germany, Luxembourg 400 in Finland, Poland, Sweden, EU 800 in Canada 1000 in Switzerland
Noise Pesticides No limit value set Health Canada Pest control products should be used only when
absolutely necessary. "Available data on exposure levels in home indicate that airborne levels of most pesticides are very low if products are used as directed." No recommendations The user is held responsible for the responsible use of pesticides indoors.
Temperature Summer: 73-79 F Winter: 68-74.5 F
~ 22.7-26 °C ~ 20-23.5 °C
ASHRAE 55 The objective of the ASHRAE standard is to specify the combinations of indoor space environment and personal factors that will produce thermal comfort conditions acceptable to 80% or more of the occupants within a space.
Ventilation See Section 5
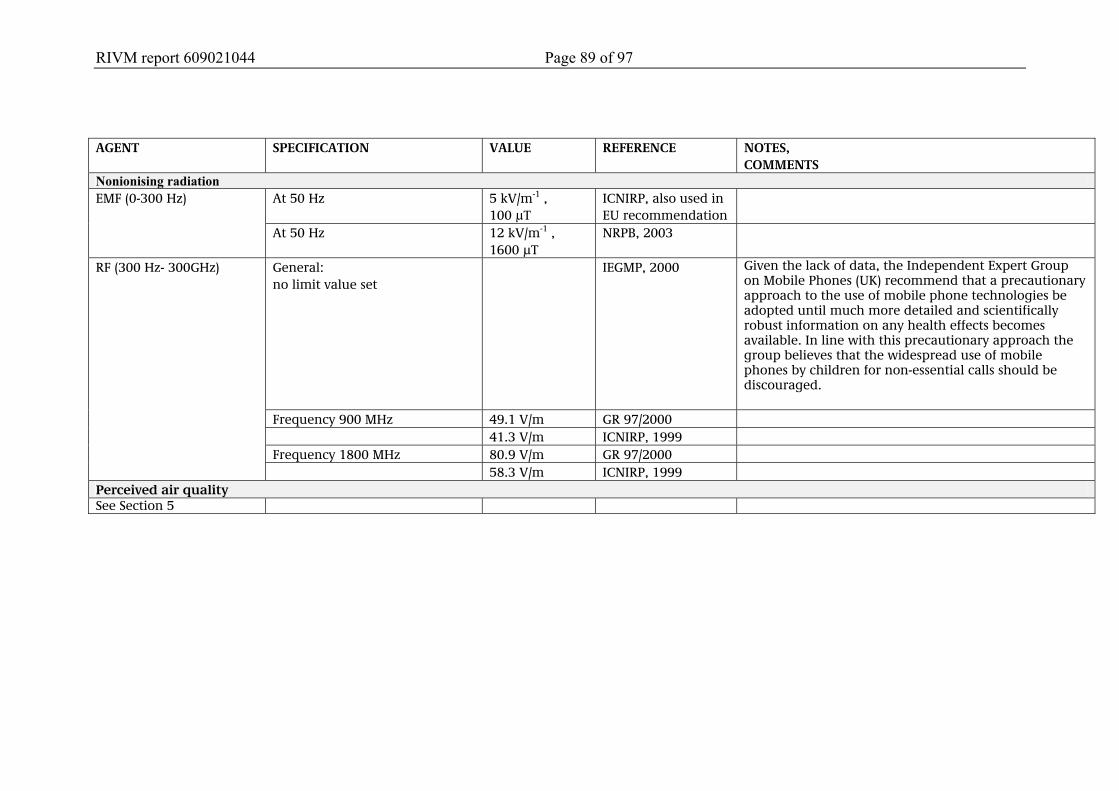
RIVM report 609021044 Page 89 of 97
AGENT SPECIFICATION VALUE REFERENCE NOTES,
COMMENTS Nonionising radiation
At 50 Hz 5 kV/m-1 , 100 µT
ICNIRP, also used in EU recommendation
EMF (0-300 Hz)
At 50 Hz 12 kV/m-1 , 1600 µT
NRPB, 2003
General: no limit value set
IEGMP, 2000 Given the lack of data, the Independent Expert Group on Mobile Phones (UK) recommend that a precautionary approach to the use of mobile phone technologies be adopted until much more detailed and scientifically robust information on any health effects becomes available. In line with this precautionary approach the group believes that the widespread use of mobile phones by children for non-essential calls should be discouraged.
Frequency 900 MHz 49.1 V/m GR 97/2000 41.3 V/m ICNIRP, 1999 Frequency 1800 MHz 80.9 V/m GR 97/2000
RF (300 Hz- 300GHz)
58.3 V/m ICNIRP, 1999 Perceived air quality See Section 5

RIVM report 609021044 Page 91 of 97
References Ad-Hoc-AG (1996). Richtwerte für die Innenraumluft: Basisschema.
Bundesgesundheitsblatt 39 (heft 11), 422-426. Ad-Hoc-AG (1997). Richtwerte für die Innenraumluft: Pentachlorphenol.
Bundesgesundheitsblatt 40 (heft 7), 234-236. ATSDR Minimal Risk Levels (several volumes). http://www.atsdr.cdc.gov/mrls.html.
2003. Gezondheidsraad (1997). Commissie Radiofrequente straling. Radiofrequente
elektromagnetische velden (300 Hz - 300 GHz). Rijswijk: Gezondheidsraad, 1997; publicatie nr. 1997/01.
Gezondheidsraad (2000a) Commissie ELF elektromagnetische velden. Blootstelling aan elektromagnetische velden (0 Hz - 10 MHz). Den Haag: Gezondheidsraad, 2000; 2000/6.
Englert N., (1997). Richtwerte für die Innenraumluft: Kohlenmonoxid. Bundesgesundheitsblatt 40 (heft 11), 425-428.
Englert N., (1998). Richtwerte für die Innenraumluft: Stickstoffdioxid. Bundesgesundheitsblatt 41 (heft 1), 9-12.
Health Canada. Exposure Guidelines for Residential Indoor Air Quality. A report of the federal Advisory Committee on Environmental and Occupational Health.. Minister of Supply and Services Canada (1995). ISBN 0-662-17882-3.
ICNIRP (1998) International Commission on Non-Ionizing Radiation Protection. Guidelines for limiting exposure to time-varying electric, magnetic, and electromagnetic fields (up to 300 GHz). Health Phys. 1998; 74(4):494-522.
Kirkeskov Jensen L., Larsen A., Molhave L., Hansen MK, Knudsen B. Health Evaluation of Volatile Organic Compound (VOC) Emissions from Wood and Wood-based Materials (2001). Archivesof Environmental Health. Vol 56, No5, 419-431
Link, B., (1999). Richtwerte für die Innenraumluft: Quecksilber. Bundesgesundheitsblatt 42 (heft 2), 168-173.
RIVM, (several volumes) see references Appendix A. Seifert, B. (1999). Richtwerte für die Innenraumluft: TVOC. Bundesgesundheitsblatt
42 (heft 3), 270-278. Sagunski, H. (1996). Richtwerte für die Innenraumluft: Toluol.
Bundesgesundheitsblatt 39 (heft 11), 416-426. Sagunski, H. (1998). Richtwerte für die Innenraumluft: Styrol.
Bundesgesundheitsblatt 41 (heft 9), 392-398. Sagunski, H. (2002). Richtwerte für die Innenraumluft: Tris(2-chlorethyl)phosphat.
Bundesgesundheitsblatt 45 (heft 3), 502-512. WHO (2000) WHO Air Quality Guidelines for Europe 2nd edition, Regional Ofice
for Europe. WHO (2002). Radon and Health. Information Sheet.
www.who.int/entity/ionizing_radiation/ env/en/Radon_Info_sheet.pdf Witten, J., Sagunski, H., Wildeboer B., (1997). Richtwerte für die Innenraumluft:
Dichlormethan. Bundesgesundheitsblatt 40 (heft 8), 278-284. Wolff, T., Rosskamp E. (2000). Richtwerte für die Innenraumluft: Diisocyanate.
Bundesgesundheitsblatt 43 (heft 3), 300-306.

Page 92 of 97 RIVM report 609021044
RIVM report 609021044 Page 93 of 97
APPENDIX E: Abbreviations ACQ Air Quality Guideline ADI Acceptable Daily Intake ATSDR Agency for Toxic Substances and Disease Registry (VS) CFU Colony-Forming Units CTB College voor de Toelating van Bestrijdingsmiddelen - Board for the Authorisation of Pesticides COPD Chronic Obstructive Pulmonary Disease DECOS Dutch Expert Committee on Occupational Standards ELF Extremely Low Frequency EM fields Electromagnetic fields GR Gezondheidsraad - Health Council HBAS High-Boiling Aromatic Solvents IARC International Agency for Research on Cancer ICNIRP International Commission on Non-ionizing Radiation Protection JECFA Joint FAO/WHO Expert Committee on Food Additives JMPR Joint FAO/WHO Meeting on Pesticide Residues LAEq Equivalent A-weighted Level Lden28 Lday-evening-night LOAEL Lowest Observed Adverse Effect Level. MAC Maximum Acceptable Concentration MPR Maximum Permissible Risk MMVF Man-made Vitreous Fibres MRL Minimal Risk Level NAS National Academy of Sciences (US) NIR Non-ionising Radiation NOAEL No Observed Adverse Effect Level PAH Polycyclic Aromatic Hydrocarbons TCA Permissible Concentration in the Atmosphere RIVM Rijksinstituut voor Volksgezondheid en Milieu - National Institute for Public Health and the Environment (NL) RCF Refractory Ceramic Fibres RfC Reference Concentration SPN Stralings Prestatie Norm - radiation performance standard TLV Threshold Limit Value VOC Volatile Organic Compounds VROM Volkshuisvesting, Ruimtelijke Ordening en Milieubeheer - Ministry of Housing, Spatial Planning and the Environment (NL) WHO World Health Organization
28 Equivalent noise measure (see LAeq), waarbij, as with Ldiel, noise in the evening and at night has a heavier weight than noise during the day.

Page 94 of 97 RIVM report 609021044
RIVM report 609021044 Page 95 of 97
APPENDIX F: Derivation of the health-based guideline value for naphthalene Author: PCJM Janssen (RIVM-SIR) The toxicology and risk assessment of naphthalene have been covered in several reviews by official bodies. The most relevant are the reviews by US-EPA (1998), EU-RAR (2003) and ATSDR (2005). This assessment is based on the information contained in these source documents. Toxicology The information below was derived from EU-RAR (2003). The critical toxicological effects of naphthalene are haemolytic anaemia, local effects on the respiratory tract and carcinogenicity. Common animal models (mice, rats, rabbits) cannot be used to study of haemolytic anaemia. Dogs may be susceptible to this, but the available data is extremely limited. Thus, the dose-response relationship for this effect would have to be analysed on the basis of human data. However, the human data is based on cases from the medical literature which cannot be used to derive reliable quantitative relationships. It is known that individuals with a deficiency of the enzyme glucose-6-phosphate-dehydrogenase have an increased susceptibility to the induction of haemolytic anaemia by naphthalene. This may have been relevant in some of the reported cases. EU-RAR concludes that although it is evident that naphthalene can cause haemolytic anaemia further to dermal, oral and inhalation exposure, there is no adequate NOAEL for this agent. Local effects on the respiratory tract have been observed in numerous inhalation studies. In a 90-day study of rats, minor degenerative changes to the nasal mucous membrane (but not in the lungs) were still observed at the lowest tested concentration of 2 ppm (10 mg/m3). In a 28-day study similar effects were observed at 1 ppm (5 mg/m3). Higher concentrations resulted in more serious damage to the nasal mucous membrane. In a 2-year study of rats (published in 2000), chronic inflammatory reactions of the olfactory and respiratory epithelium were observed at all concentrations of 10 ppm (50 mg/m3) and higher (exposure for 6 hours/day, 5 days/week). The observed lesions also included atrophy, hyperplasia and metaplasia. The extent and severity of the effects were clearly dependent on the dose. There is limited human carcinogenicity data available. There have been a number of animal studies. The most relevant study showed an increased incidence of respiratory epithelium adenomas and olfactory epithelium neuroblastomas (a rare type of tumour), even at the lowest test concentration of 10 ppm (50 mg/m3). A further study showed an increased frequency of benign lung tumours (alveolar/bronchiolar adenomas) in female mice. The available genotoxicity data on naphthalene suggests that it has no genotoxic activity. Thus it was concluded that the observed tumours were probably caused by a nongenotoxic mechanism. The tumour development may be related to local toxic effects in the lungs (EU-RAR 2003). Current limit values for naphthalene The RIVM has not previously determined a chronic limit value in air (TCA).
Page 96 of 97 RIVM report 609021044
EU-RAR (2003) includes the derivation of an overall LOAEL based on the local toxic effect in the nose. This LOAEL is 5 mg/m3 and is based on a 28-day study in rats with exposure for 6 hours/day, 5 days per week. It is considered that the use of this LOAEL for the risk assessment provides adequate protection against the carcinogenic effects as observed in the chronic inhalation experiments with rats. The EU-RAR (2003) method does not include the derivation of limit values: the risk assessment was based on "margins of safety". US-EPA (1998) derived a chronic limit value in air (RfC) of 0.003 mg/m3 based on a chronic LOAEL of 10 ppm (50 mg/m3) derived from a 2-year study of mice. This level was converted to a Human Equivalent Concentration (HEC) of 9.3 mg/m3 and then divided by an uncertainty factor of 3000 (10 for extrapolation from mice to humans, 10 for protecting sensitive groups, 10 for extrapolation from a LOAEL to a NOAEL, and 3 for lack of information in the database including the lack of a second generation reproduction study and chronic inhalation data for species other than mice). ATSDR (2005) derived a chronic limit value for air (MRL - chronic) of 0.0007 ppm (0.0035 mg/m3) based on a chronic LOAEL of 10 ppm (50 mg/m3) from chronic studies with rats and mice (the same studies as used by US-EPA and EU-RAR). The LOAEL was extrapolated to an HEC of 0.2 ppm (1 mg/m3) and then divided by an uncertainty factor of 300 (10 for the use of a LOAEL, 3 for extrapolation from animals to humans and 10 for variability in the human population). Assessment and conclusion When deriving a limit value, the local toxic effect on the nasal mucous membrane is the critical effect. This effect was still observed to a minor extent at the LOAEL of 5 mg/m3. In general, the impression is that this LOAEL marks the starting point of the dose-response curve. Consequently, only a limited extrapolation factor needs to be used when extrapolating to the NOAEL. A factor 2 is used here, resulting in an estimated NOAEL of 2.5 mg/m3. Given the nature of the effect (local damage to the epithelium) we consider that there is no need to apply the conventional time extrapolation for the limited exposure regime of the experiment (conversion from 30 hour/week exposure to continuous exposure). This is because such effects are primarily dependent on the concentration rather than the time. The LOAEL is based in part on chronic studies, hence there is no need to extrapolate for the limited duration of the experiment (subacute). Applying the standard uncertainty factor extrapolation of 100 (10 for extrapolation from animals to humans, 10 for protecting sensitive groups) to the estimated NOAEL of 2.5 mg/m3 resulted in a limit value (TCA) of 0.025 mg/m3. Naphthalene has a strong odour. RIVM (1994) set the odour threshold in air at 0.05 mg/m3. However, ATSDR uses a higher value, 0.44 mg/m3. A critical analysis of the odour data for naphthalene is beyond the scope of this recommendation. However, it should be noted that although the derived TCA is lower than the reported odour thresholds, it cannot be guaranteed, given the great variation in odour perception in the human population, that the odour will not be noticeable, and may even be somewhat objectionable, at the TCA.
RIVM report 609021044 Page 97 of 97
ATSDR (2005) Toxicological profile for naphthalene, 1-methylnaphthalene, and 2-methylnaphthalene. US Agency for Toxic Substances and Disease Registry, report dated August 2005. EU (2003) European Union Risk Assessment Report – Naftaleen. European Chemicals Bureau - Existing Substances, 1st Priority List, Volume 33. RIVM (1994) Beoordelingssystematiek bodemkwaliteit ten behoeve van bouwvergunningsaanvragen. RIVM-rpport nr. 715810001 d.d. juni 1994. US-EPA (1998) Integrated Risk Information System (IRIS) – Naftalene. Inhalation RfC Assessment 09/17/1998.