rivm rapport 500029001 trends in the environmental burden
TRANSCRIPT

Contact: Anne Knol Centrum voor Milieu-Gezondheid Onderzoek [email protected]
RIVM report 500029001/2005 Trends in the environmental burden of disease in the Netherlands 1980 – 2020 AB Knol, BAM Staatsen
This investigation has been performed by order and for the account of the Netherlands Environmental Assessment Agency (MNP), within the framework of the project ‘Gezondheidseffecten en Risico's’ (Health Effects and Risks).
RIVM, P.O. Box 1, 3720 BA Bilthoven, telephone: 31 - 30 - 274 91 11; telefax: 31 - 30 - 274 29 71

page 2 of 97 RIVM report 500029001

RIVM report 500029001 page 3 of 97
Abstract
Trends in the environmental burden of disease in the Netherlands 1980 – 2020
Several aspects of the environment, such as exposure to air pollution or noise, can have
effects on our health. In order to gain some perspective on the dimensions of this
environment-related health loss in the Netherlands, we have calculated Disability Adjusted
Life Years (DALYs) for the health effects of air pollution, noise, radon, natural UV-radiation
and indoor dampness for the years 1980, 2000 and 2020. DALYs give a crude indication of
the estimated number of healthy-life-years-lost in a population due to premature mortality or
morbidity (the disease burden).
In the Netherlands, roughly 2 to 5 percent of the disease burden (as calculated for 49 (groups
of) diseases) can be attributed to the effects of (short-term) exposure to air pollution, noise,
radon, total natural UV and dampness in houses for the year 2000. Including the more
uncertain long-term effects of PM10 exposure, this can increase to slightly over ten percent,
assuming no threshold. Assuming a reference level of 20 µg/m3 will give an estimate of
roughly 3 to 9 percent.
Among the investigated factors, the relatively uncertain effects of long-term PM10 exposure
have the greatest impact. Long-term PM10 is an indicator for a complex urban air pollution
mixture. The levels of PM10 are decreasing; therefore the related disease burden is also
expected to decrease. Noise exposure and its associated disease burden will probably increase
up to a level where the disease burden is similar to that attributable to traffic accidents.
These rough estimates do not provide a complete and unambiguous picture of the
environmental disease burden; data are uncertain, not all environmental-health relationships
are known, not all environmental factors are included, nor was it possible to assess all
potential health effects. The effects of a number of these assumptions were evaluated in
uncertainty analyses.
Keywords: DALYs, disease burden, environment

page 4 of 97 RIVM report 500029001
Rapport in het kort
Trends in de milieugerelateerde ziektelast in Nederland, 1980 – 2020
In het jaar 2000 werd naar schatting 2 tot 5 procent van de ziektelast in Nederland
veroorzaakt door acute blootstelling aan fijn stof (PM10) en ozon, en blootstelling aan geluid,
radon, (totaal) UV-straling en vocht in huizen. Dit kan oplopen tot iets boven de 10 procent
als ook de meer onzekere langetermijneffecten van blootstelling aan fijn stof worden
meegewogen (en geen drempelwaarde voor effecten wordt aangenomen). Wanneer een
drempelwaarde van 20 van µg/m3 wordt verondersteld leidt dit tot een totaal van ruwweg
3 tot 9 procent van de ziektelast. De relatief onzekere effecten van langdurige blootstelling
aan fijn stof hebben de grootste invloed op het totaal milieu-gerelateerd gezondheidsverlies in
Nederland. Fijn stof kan hierbij gezien worden als een indicator voor een complex mengsel
van luchtverontreiniging. De ziektelast voor fijn stof loopt naar schatting terug over de
periode 1980-2020. Voor geluid wordt een toename verwacht.
Dit blijkt uit een analyse van Nederlandse en buitenlandse gegevens over de relatie tussen
blootstelling aan enkele milieufactoren en effecten op gezondheid. In deze analyse is de
milieu-gerelateerde ziektelast uitgedrukt in de zogenaamde DALY:
Disability-Adjusted-Life-Years. Dit is een maat waarin zowel het aantal mensen bij wie
gezondheidseffecten optreden, als de ernst en de duur van deze effecten, verwerkt is. Deze
DALY’s zijn berekend voor de gezondheidseffecten van luchtverontreiniging, geluid, radon,
UV straling en vocht in huizen voor de periode 1980 - 2020. Dit geeft een ruwe indicatie van
het aantal verloren gezonde levensjaren in de Nederlandse populatie door milieu-gerelateerde
ziekte of vroegtijdige sterfte (de ziektelast).
Bij het berekenen van de milieu-gerelateerde ziektelast zijn een groot aantal aannames
gedaan. De effecten van die aannames zijn geanalyseerd met behulp van
onzekerheidsanalyses.
Trefwoorden: DALYs, ziektelast, milieu

RIVM report 500029001 page 5 of 97
Contents
Samenvatting 7
Summary 9
Introduction 11
1. Health and the environment in the Netherlands 15
1.1 Air pollution 16 1.2 Noise 16 1.3 Radiation (radon and UV) 17 1.4 Indoor dampness 17 1.5 Traffic accidents 17
2. Health Impact Assessment 19
2.1 Integrated health measures 20 2.2 Value of integrated health measures for policy makers 22
3. Methods 25
3.1 Consultation of experts 25 3.2 Calculations 25 3.3 Data selection 27 3.4 Monte Carlo analysis 31
4. Data 33
4.1 Air pollution 33 4.2 Noise 40 4.3 Radon 46 4.4 UV 48 4.5 Indoor dampness 50 4.6 Traffic accidents 52
5. Thematic results and discussion 55
5.1 Air pollution 55 5.2 Noise 60 5.3 Radon 65 5.4 UV 66 5.5 Indoor dampness 68 5.6 Traffic accidents 69

page 6 of 97 RIVM report 500029001
6. Overall results and discussion 71
6.1 Implications of the results 71 6.2 Uncertainty 75 6.3 Other burden of disease studies 78 6.4 The DALY debate 80 6.5 Policy relevance 83 6.6 Methodological conclusions and recommended future research 85
References 89
Acknowledgements 94
Appendix 1 Data 95
Appendix 2 Results on a logarithmic scale 97

RIVM report 500029001 page 7 of 97
Samenvatting
Milieufactoren kunnen op verschillende manieren van invloed zijn op de gezondheid en de
kwaliteit van leven van de Nederlandse bevolking. Zo is luchtverontreiniging bijvoorbeeld
gerelateerd aan luchtwegklachten of hartvaatziekten, geluidsoverlast kan leiden tot hinder, en
blootstelling aan bepaalde straling kan in sommige gevallen kanker veroorzaken. Het is lastig
om deze problemen te vergelijken, omdat ze allen van verschillende aard en omvang zijn.
Daarom is het nuttig om de milieugerelateerde gezondheidseffecten onder één noemer te
brengen met behulp van een geïntegreerde maat.
In deze studie hebben we de effecten op de volksgezondheid in Nederland van
luchtvervuiling (fijn stof en ozon), geluid, straling (radon en UV straling) en vocht in
woningen samengevat met behulp van DALYs (Disability Adjusted Life Years). In een
DALY berekening wordt het aantal mensen dat een bepaalde aandoening heeft ten gevolge
van blootstelling aan een milieufactor vermenigvuldigd met de tijd dat ze de aandoening
hebben (of de levensduurverkorting in geval van sterfte) en de ernst van de aandoening
(variërend van 0 voor perfecte gezondheid tot 1 voor sterfte). Op deze manier kunnen zowel
ziekte als sterfte in één getal worden uitgedrukt, waardoor milieugezondheidsproblemen
kunnen worden vergeleken en beleid op dat terrein kan worden gepland of geëvalueerd.
DALYs zijn een vereenvoudiging van een zeer complexe werkelijkheid, waardoor de maat
slechts een zeer ruwe indicatie geeft van (milieu-gerelateerd) gezondheidsverlies.
Voor elke onderzochte milieufactor is bepaald welke gezondheidseffecten relevant zijn en
welke gegevens het best gebruikt konden worden voor de DALY berekeningen. Het gaat
daarbij bijvoorbeeld om gegevens over het vóórkomen van ziektes, de relatie tussen
milieufactoren en gezondheidseffecten en weegfactoren die een indicatie geven van de ernst
van een aandoening. Wanneer informatie ontbrak of bepaalde bronnen verschillende
informatie weergaven, is met behulp van inhoudsdeskundigen bepaald welke (alternatieve)
gegevens gebruikt zouden moeten worden. Er is een onzekerheidsanalyse uitgevoerd waarin
het effect van de verschillende aannamen op de uitkomsten is geanalyseerd. Daarnaast zijn de
uitkomsten ook kwalitatief beoordeeld op hun bruikbaarheid.

page 8 of 97 RIVM report 500029001
Van de milieufactoren die in deze studie zijn onderzocht, levert de langetermijnblootstelling
aan fijn stof op dit moment de grootste bijdrage aan de ziektelast in Nederland. Fijn stof kan
worden gezien als een indicator voor een complexer geheel aan luchtvervuilende stoffen. Het
relatief grote aantal DALYs dat wordt toegeschreven aan blootstelling aan fijn stof wordt
echter voornamelijk bepaald door de langetermijneffecten, waar nog veel onduidelijkheid
over bestaat. Blootstelling aan geluid zorgt ook voor een aanzienlijk aantal DALYs in
Nederland, vooral omdat er zoveel mensen blootgesteld zijn aan geluid. De effecten van
radon en UV zijn iets minder omvangrijk, terwijl blootstelling aan ozon en vocht in huizen de
geringste hoeveelheden DALYs opleveren in deze studie.
In dit onderzoek is gekeken naar tijdtrends in ziektelast, door zowel berekeningen voor het
verleden (1980 of 1990) als voor de toekomst (2010 of 2020) uit te voeren. De effecten van
UV en radon blijven ongeveer gelijk. De ziektelast ten gevolge van PM10 blootstelling neemt
af, terwijl het geluidsgerelateerde gezondheidsverlies in de toekomst waarschijnlijk juist zal
toenemen.
Bij benadering wordt geschat dat zo’n 2 tot 5 procent van de ziektelast in Nederland (die is
berekend voor 49 (groepen van) ziekten en aandoeningen) toe te schrijven is aan de effecten
van luchtverontreiniging (fijn stof en ozon, kortetermijneffecten), geluid, radon, UV en vocht
in huizen. Inclusief de relatief onzekere effecten van langetermijnblootstelling aan fijn stof
kan het zelfs gaan om iets meer dan 10 procent, indien geen drempelwaarde wordt
verondersteld. Dit lijkt echter een minder realistisch scenario. Wanneer een drempelwaarde
van 20 van µg/m3 wordt verondersteld leidt dit tot een totaal percentage van ruwweg
3 tot 9 procent van de ziektelast.
RIVM report 500029001 page 9 of 97
Summary
Environmental factors can affect health and quality of life of the Dutch population in various
ways. Air pollution is associated with respiratory or cardiovascular diseases, noise exposure
can lead to annoyance, and exposure to certain forms of radiation can cause the development
of cancer. It is difficult to compare these problems, since they differ in type and scope.
Therefore it can be useful to quantify the health impact of the environment in an integrated
measure.
We have quantified the public health impacts of air pollution (PM10 and ozone), noise,
radiation (radon and UV) and indoor dampness using DALYs (Disability Adjusted Life
Years). In DALY calculations, the number of people with a certain disease is multiplied by
the duration of the disease (or loss of life expectancy in case of mortality) and the severity of
the disorder (varying from 0 for perfect health to 1 for death). In this way, morbidity as well
as mortality can be expressed in one similar value, making environmental health problems
more or less comparable and providing ways to plan or evaluate environmental health related
policies. However, DALYs are a simplification of a very complex reality, and therefore only
give a very crude indication of (environmental) health impact.
In our study, we have assessed which effects are relevant to investigate for each
environmental factor, and which data are best to use. Necessary data include for example
prevalence numbers, exposure-response relationships, and weighting factors that give an
indication of the severity of a certain disorder. When information was missing or ambiguous,
we have consulted experts in order to decide which (alternative) data sources to use. An
uncertainty analysis was carried out in order to analyze the effects of different assumptions.
Results have also been qualitatively evaluated for their usefulness within different contexts.
The effects of PM10 make the greatest contribution to the environment-related disease burden
in the Netherlands in our study. PM10 can be regarded as an indicator for a complex mixture
of urban air pollutants. However, the relatively large amount of DALYs potentially
attributable to PM10 is mostly caused by long-term effects of PM10 exposure, which are very
uncertain. Exposure to noise also leads to a significant number of DALYs in the Netherlands,
mainly because there are so many people exposed to noise. The health effects of radon and

page 10 of 97 RIVM report 500029001
UV radiation are also significant -although slightly less substantial-, whereas ozone and
indoor dampness make the smallest contribution to the environment-related burden of disease
in the Netherlands as calculated in this study.
We have studied time trends in the environmental burden of disease by making calculations
for the past (1980 or 1990) and for the future (2010 or 2020). Based on these calculations, we
have concluded that the disease burden related to PM10 exposure will probably decrease, the
noise-related disease burden will further increase, and the number of DALYs caused by radon
and UV radiation is supposed to remain fairly similar.
Overall, around 2 to 5 % of the disease burden in the Netherlands (which was calculated
based on data for 49 (groups of) diseases) is estimated to be attributable to the effects of air
pollution (PM10 and ozone, short-term effects), noise, radon, UV and indoor dampness.
Including the relatively uncertain effects of long-term exposure to PM10, this may increase
over 10%, assuming no threshold.

RIVM report 500029001 page 11 of 97
Introduction Just as we are affecting our environment, the environment can also affect us. Several
environmental determinants are known to have impacts on our health. Due to better control of
these environmental factors and better environmental policies aimed at protecting population
health, the contribution of our current environment to our total disease burden (morbidity and
mortality) is probably reduced to a few percent. Lifestyle factors, such as smoking, food,
alcohol, and exercise, presumably have a bigger influence on health.
Persistent environmental problems such as air pollution and noise still can affect human
health quite considerably. Effects from air pollution range from aggravation of asthma to
premature mortality, while noise exposure is associated with annoyance, sleep disturbance
and effects on cognition. Because of the divergence in magnitude, duration and severity of
these health effects, integrated health measures which convert all effects to a comparable
unit, can be very useful for the interpretation and comparison of different (environmental)
health problems. This is especially useful for evaluating and comparing different policy
options and assessing cost effectiveness of mitigating measures or prevention. Experience
with integrated health measures in environmental health decision-making is limited to the use
of monetary cost estimates of health impacts, the Years of Life Lost (YLL) due to mortality
and the total amount of healthy life lost expressed in Disability Adjusted Life Years
(DALYs).
DALYs give an indication of the (potential) number of healthy life years lost in a population
due to premature mortality or morbidity, the latter being weighted for the severity of the
disorder. The concept was first introduced by Murray and Lopez (1996) as part of the Global
Burden of Disease study, which was launched by the World Bank. Since then, the World
Health Organization has endorsed the procedure, and the DALY approach has been used in
various studies on a global, national and regional level.
In spite of the increasing use of DALYs, the method is being debated. Some people address
the very essence of the method by discussing whether it is ethically sound to quantify health
and prioritize health problems. Furthermore, people argue that the method is -at least partly-
subjective, since the severity values of health conditions (which can range from 0 (perfect
health) to 1 (death)) are assigned by ‘expert panels’. Also, implicit to this weighing method,

page 12 of 97 RIVM report 500029001
people that are already disabled have ‘less health to lose’, and are therefore discriminated
when policy measures are based solely on DALY outcomes. In general, DALY outcomes are
relatively unstable, due to uncertain data used in the calculations. When using DALYs for
health impact assessment of specific (environmental) determinants, an essential assumption is
that of causality, as it is for any type of impact indicators. In these calculations, more
variables, such as exposure assessment data and exposure-response relationships, are added,
contributing to greater total variability of the output.
These drawbacks of calculating DALYs, which will be discussed in more detail later, are
certainly valid. However, to this date, no better alternatives to quantify health are available,
while the demand for such aggregated indicators is considerable. Policy makers need to
allocate budgets, and, besides personal interest and public engagement, they want to base
their decisions on information regarding severity, magnitude, policy options and costs. The
only way to link these determinants is by making them comparable, and therefore by
quantifying health, preferably aggregated in a single indicator. Yet it remains important to
take all limitations of the method into account when presenting and interpreting the results.
This report presents the results of quantitative assessments of the environmental health
burden in the Netherlands. It is based on (previous) work commissioned by the Dutch Health
Care Inspectorate, the Ministery of Housing, Spatial Planning and the Environment (VROM)
and the Netherlands Environmental Assessment Agency (MNP). Earlier, De Hollander et al.
(1999) have completed a Dutch environmental health impact assessment using DALYs. They
focused on numerous environmental exposures and concluded that around 5% of the annual
burden of disease in the Netherlands can be attributed to these exposures, with long-term
exposure to particulate air pollution as the greatest contributor. The Netherlands
Environmental Assessment Agency (MNP) requested to repeat this exercise using more
recent data, to describe trends over time and to further document all calculation steps. The
outcomes presented in this report are used by MNP in policy documents, such as the
Environmental Balance (Milieubalans).
We have assessed the health impact of some important environmental factors in the
Netherlands: air pollution, noise, radon, UV, dampness in houses and traffic accidents. We
have also examined the trends in these impacts over time, using past (1980/1990) and
RIVM report 500029001 page 13 of 97
scenario (2010/2020) data. In addition to comparing environmental health problems, this can
enable evaluation of past policy measures and better future policy planning.
This report starts with an impression of the main environmental health problems in the
Netherlands. Chapter 2 gives an overview of several health impact assessment measures.
Chapter 3 describes the methods of our study, while Chapter 4 goes deeper into the specific
data used for our DALY calculations. Chapters 5 and 6 present the results and discussion, as
well as some conclusions and recommendations for future research. Further documentation
on the calculations (in the form of spreadsheets) is available through the contact person
Various experts have given input for the calculations and this report. The sections on air
pollution have been reviewed by Paul Fischer. Danny Houthuijs and Elise Van Kempen have
assessed the paragraphs on noise, whereas Gert Kelfkens has worked on calculations and
texts for radiation. Annemiek van Overveld has given input for the methodology section.
Statistical analyses have been performed by Caroline Ameling. Erik Lebret has reviewed the
report.

page 14 of 97 RIVM report 500029001
RIVM report 500029001 page 15 of 97
1. Health and the environment in the Netherlands
Health and quality of life are influenced by the environment. Most risks have been greatly
reduced during the industrial revolution and its attendant economical progress. This is mainly
caused by improvements in drinking water supplies, sewage systems, waste collection and
housing (RIVM MNP and CBS and Stichting DLO, 2003a). However, industrialization and
mass production have also introduced new risks. The introduction of chemical substances to
water, air and food has lead to respiratory diseases and certain types of cancer, and has also
caused some large scale industrial disasters, resulting in numerous victims (European
Environment Agency, 2003). Nowadays, many of the known environmental risks have been
regulated with standards, policies and risk abatement. Environmental policies have helped to
reduce exposure to many substances. This has lead to increased life expectancies in the Dutch
population (RIVM MNP and CBS and Stichting DLO, 2003a). However, several new
environmental risks are affecting our health.
Environmental health impacts are driven by many factors, including economic growth,
population growth and mobility, and urbanization (World Resources Institute, 1998). Due to
economic and population growth, there is an increasing demand for transport, industry,
energy and agriculture. This leads to increasing exposure to noise and air pollution, and
decreasing quality of life in urban regions. In the Netherlands, many environmental health
effects are driven by the increased use of transport. Although transport is considered an
important part of the economy and lifestyle in western societies, it exacts a high price from
society and the environment and it is an important source of pollution. The air pollution and
noise emitted by traffic affect populations, particularly urban residents, reducing quality of
life and promoting a range of less severe symptoms. However, the exact extent and impact of
transport is not entirely known. The same is true for most other environmental health
problems. Even if emissions are known, the translation to human exposure and health effects
is difficult (World Health Organization, 2004a).
The basis of this report is an analysis of trends in the environmental disease burden
associated with air pollution, UV radiation, radon, noise and dampness in houses in the
Netherlands from 1980 up to 2020. We have also investigated the effects of traffic accidents.
We will first describe the environmental factors and the associated health effects that we

page 16 of 97 RIVM report 500029001
considered. We have not been able to include all environmental factors which potentially
cause health effects in the calculations, nor could we include all health effects potentially
associated with these environmental factors. Therefore, final outcomes probably
underestimate the environmental disease burden.
1.1 Air pollution
In previous years, the concentration of many air pollutants has been significantly reduced in
the Netherlands. Various studies (World Health Organization, 2004b) suggest, however, that
short-term variations in particulate matter (PM) are associated with adverse health effects
even at low levels of exposure. PM is emitted by sources such as traffic (mainly diesel
combustion) and industry. In the year 2001, around 14% of the urban population in Western
Europe (the former EU15) was exposed to PM10 levels higher than 40 µg/m3 (European
Environment Agency, 2003). The effects of exposure to PM range from mild changes in
respiratory function, through increased respiratory and cardiovascular morbidity, to increased
total mortality. According to some studies and impact assessments, long-term exposure to
particulate matter is associated with a reduction in life expectancy per victim in the order of
about 10 years (Künzli et al., 2001; WHO, 2005; AEA Technology, 2005).
High concentrations of ozone in the troposphere, typical for the summer months, lead to an
increase in the frequency of respiratory symptoms. In addition to aggravating asthma, ozone-
exposure can lead to more serious effects and is associated with premature death. Days with
elevated ozone concentrations can also lead to decreased lung functioning (World Health
Organization, 2003). The latter, however, has not been analyzed in our study, due to the
difficulty in translating decreased lung function into a quantifiable health impact.
1.2 Noise
Many sources generate noise. Transport (road, rail and air traffic) is the most important
source of community noise. Due to increasing transport demands, an increase in duration of
exposure (due to the 24-hour economy) as well as an expansion of noise-exposed areas, noise
will probably remain a major problem in the future.
Exposure to noise causes annoyance and sleep disturbance in a considerable part of the Dutch
population (Miedema, 2001; Franssen et al., 2004). Furthermore, noise exposure has also
been associated with effects on children’s learning (World Health Organization, 2004a).

RIVM report 500029001 page 17 of 97
However, the scope of the latter effect is as yet unclear and some necessary data unavailable;
therefore it has not been included in the calculations.
Next to severe annoyance and sleep disturbance, we have also investigated the potential of
noise exposure leading to hypertension (through stress) and hence cardiovascular diseases,
potentially resulting in death (Van Kempen et al., 2002). Although it is generally accepted
that noise can affect the cardiovascular system, the exposure-response relationship between
noise exposure and cardiovascular mortality is still being debated (Van Kempen et al., 2002).
1.3 Radiation (radon and UV)
Radiation can broadly be divided into ionizing and non-ionizing radiation. Radon, which is a
natural substance present in the soil and in certain building materials, is part of the first
category, while UV radiation is non-ionizing.
Radiation can cause cell damage, potentially resulting in certain cancers. Radon is known to
cause lung cancer due to inhalation of mainly indoor air which contains radon and radon
decay products.
UV radiation, a component of sunlight, can cause effects such as sunburns or ageing of the
skin, but can also cause immune suppression, cataract or skin cancer. Only skin cancer
(morbidity and mortality) has been included in this study, since data and descriptive models
for other effects were currently insufficient.
1.4 Indoor dampness
Besides more prominent indoor health problems, such as radon and ETS (environmental
tobacco smoke), indoor dampness can also cause health effects, mainly affecting respiratory
functions (Van Veen et al., 2001). The most important effect of living in damp houses is
(aggravation of) asthma. Children are especially vulnerable (Van Veen et al., 2001). Damp
houses can also indirectly cause allergic or rheumatic complaints (Pernot et al., 2003), which
were not included in this study.
1.5 Traffic accidents
Apart from causing noise and air pollution, traffic obviously has more direct health
consequences in the form of traffic accidents. Although accidents might not fall under a

page 18 of 97 RIVM report 500029001
narrow definition of ‘environment’, it is part of the environment in a broader sense and is also
a good standard for interpreting other (transport-related) health effects. In addition to
mortality, traffic accidents can cause short-term as well as long-term (chronic) disability.

RIVM report 500029001 page 19 of 97
2. Health Impact Assessment
Health policies are based on many decisions and policy makers need to prioritize health
problems in order to allocate their budgets. These types of decisions are often based on
information regarding severity and magnitude of the problems as well as policy options and
costs. Personal interest and public concern and engagement also play a role.
One way to compare different policy options is by carrying out a health impact assessment
(HIA). HIA is a combination of procedures, methods and instruments used for assessing the
potential health impacts of certain matters. These can vary from a single environmental factor
to a more complicated set of factors, for instance in an infrastructural or industrial project.
For quantifying health impacts, the following steps can be distinguished (Hertz-Picciotto,
1998):
• Selection of health endpoints with sufficient proof (based on expert judgements) of a
causal relationship with the risk factor
• Assessment of population exposure (combination of measurements, models and
demographic data)
• Identification of exposure-response relations (relative risks, threshold values) based on
(meta) analyses and epidemiological and toxicological research.
• Estimation of the (extra) number of cases with the specific health state, attributable to
exposure to the risk factor. This is a function of the population distribution, exposure-
response relation and base prevalence of the health state in the population.
• Computation of the total health burden, or costs to society of all risk factors (if
wanted/necessary)
A common problem is that the health effects of environmental factors can vary considerably
with regard to their severity, duration and magnitude. These differences hamper the
comparison of policies (comparative risk assessment) or the costs of policy measures (cost
effectiveness analysis). An integrated health measure, using the same denominator for all
health effects, can help with interpretation and comparison of health problems and policies.

page 20 of 97 RIVM report 500029001
2.1 Integrated health measures
Common health measures include mortality, morbidity, healthy life expectancy, attributable
burden of disease measures, and monetary valuation. Some of these measures will be further
described below. All methods have several associated difficulties, such as imprecision of the
population exposure assessment; uncertain shapes of the exposure-response curves for the
low environmental exposure levels; insufficient (quality of) epidemiological data;
extrapolation from animal to man or from occupational to the general population;
generalisation of exposure-response relations from locally collected data for use on regional,
national or global scale; combined effects in complex mixtures, etc.
Mortality figures
The annual mortality risk or the number of deaths related to a certain (environment-related)
disease can be compared with this risk or number in another region or country, or with data
from another period in time. Subsequently, different policies can be compared and policies
that do or do not work can be identified. Within a country, time trends can be analyzed. This
method is easy to comprehend. No ethical questions are attached; everyone is treated equal.
Since this method only includes mortality, it is not suitable for assessing factors with less
severe consequences (morbidity). Also, it is difficult to attribute mortality to specific
environmental causes.
Morbidity figures
Similar to mortality figures, morbidity numbers (prevalences or incidences based on hospital
admissions or doctor visits) can be used to evaluate a (population) health state. Advantages
and drawbacks are comparable to those applying to using mortality figures. The use of
morbidity numbers is therefore similarly limited, especially when (environmental) causes of
the diseases vary.
Healthy life expectancy
Using mortality tables, one can calculate the total average life expectancy for different age
groups in a population, subdivided into years with good and years with less-than-good health.
This measure is especially useful to review the generic health state in a country for the long
term, but it doesn’t give insight into specific health effects, effects of specific policy
interventions, or trends in certain subgroups.

RIVM report 500029001 page 21 of 97
Attributable burden of disease
Health impact assessments can also be executed by calculating the attributable burden of
disease. There are several ways to assess the burden of disease attributable to an
(environmental) factor, such as the QALY and the DALY.
Quality Adjusted Life Years, QALYs, capture both the quality and quantity elements of health
in one indicator. Essentially, time spent in ill health (measured in years) is multiplied by a
weight measuring the relative (un)desirability of the illness state. Thereby a number is
obtained which represents the equivalent number of years with full health. QALYs are
commonly used for cost-utility analysis and to appraise different forms of health care. To do
that, QALYs combine life years gained as a result of these health interventions/health care
programs with a judgment about the quality of these life years.
Disability adjusted life years, DALYs, are comparable to QALYs in that they both combine
information on quality and quantity of life. However, contrary to QALYs, DALYs give an
indication of the (potential) number of healthy life years lost due to premature mortality or
morbidity and are estimated for particular diseases, instead of a health state. Morbidity is
weighted for the severity of the disorder.
With QALY, the focus is on assessing individual preference for different non-fatal health
outcomes that might result from a specific intervention, whereas the DALY was developed
primarily to compare relative burdens among different diseases and among different
populations (Morrow and Bryant, 1995). DALYs are suitable for analyzing particular
disorders or specific factors that influence health. Problems associated with the DALY
approach include the difficulty of estimating the duration of the effects (which have hardly
been studied) and the severity of a disease; and allowing for combined effects in the same
individual (first you have symptoms, then you go to a hospital and then you may die). The
DALY concept, which has been used in our study, will be further described in the next
chapter. More information on the drawbacks of the method can be found in Chapter 6.4.
Monetary valuation
Another approach to health impact assessment is monetary valuation. In this measure, money
is used as a unit to express health loss or gain, thereby facilitating the comparison of policy
costs and benefits. It can help policy makers in allocating limited (health care) resources and

page 22 of 97 RIVM report 500029001
setting priorities. There are different approaches to monetary valuation such as ‘cost of
illness’ and ‘willingness to pay/accept’.
The ‘cost of illness’ (COI) approach estimates the material costs related to mortality and
morbidity. It includes the costs for the whole society and considers loss of income,
productivity and medical costs. This approach does not include immaterial costs, such as
impact of disability (pain, fear) or decrease in quality of life. This could lead to an
underestimation of the health costs. Furthermore, individual preferences are not considered.
The ‘willingness to pay’ (WTP) approach measures how much money one would be willing
to pay for improvement of a certain health state or for a reduction in health risk. The
‘willingness to accept’ (WTA) approach measures how much money one wants to receive to
accept an increased risk. WTP and WTA can be estimated by observing the individual’s
behaviour and expenditures on related goods (revealed preference). For example, the extra
amount of money people are willing to pay for safer or healthier products (e.g. cars with air
bags), or the extra salary they accept for compensation of a risky occupation (De Hollander,
2004). Another similar method is contingent valuation (CV), in which people are asked
directly how much money they would be willing to pay (under hypothetical circumstances)
for obtaining a certain benefit (e.g. clean air or good health).
Advantages of these approaches are that the values represent individual preferences and
include certain indefinable costs (e.g. pain, quality of life). The values also appear to be fairly
stable in Western countries (De Hollander, 2004). A disadvantage is that the values are
restricted to individual costs. Social costs are not incorporated. The reliability of the answers
obtained in contingent valuation studies can be discussed, as people are spending
‘hypothetical’ money for ‘hypothetical’ health benefits. In addition, willingness-to-pay values
have shown to be dependent on income.
2.2 Value of integrated health measures for policy makers
Health measures can assist policy makers in the decision making process, but cannot provide
definite answers. However, depending on the methods used, they can facilitate comparison of
environmental health risks in order to set priorities, evaluation of the efficiency of different

RIVM report 500029001 page 23 of 97
policy measures, and evaluation of accumulation of multiple environmental risk factors (in a
certain area) (De Hollander, 2004).
Mortality figures are the simplest approach to integrated health measures, as they are easy to
calculate and understand. A serious disadvantage is that non-fatal health outcomes are not
incorporated in the calculations. Morbidity figures are also relatively easy to use, but do not
include fatal outcomes or an indication of the severity of diseases. In addition, both mortality
and morbidity figures are difficult to attribute to their exact causes. Therefore, mortality and
morbidity figures only reveal part of a public health problem and are not very useful for
complex policy questions related to environmental health.
In contrast, burden of disease measures (DALY’s and QALY’s) do include information on
both fatal and non-fatal health outcomes and the quality of life associated with these
outcomes. They provide information on public health in a country in a comparable way. In
practice, however, there are still many disadvantages involved in these kinds of calculations,
since very complex information has to be reduced to one single value. The results should
therefore be handled with care, but can be very useful with proper explanation and clear
description of the uncertainties involved.
Results of monetary valuation of health problems provide policy makers with crude
estimations of the costs and benefits associated with certain policy decisions. However,
expressing health in terms of money is complicated and many uncertainties are involved, as
holds for attributable burden of disease measures.
It should be noted that comparing public health problems, whether in terms of DALYs or
money or some other measure, should never be the only criterion on which to base policy.
Other important factors not captured in these methods include for example solidarity and
equity, and certain social impacts. However, the measures can provide valuable information
as part of the whole decision making process.

page 24 of 97 RIVM report 500029001

RIVM report 500029001 page 25 of 97
3. Methods
The DALY is one of the most commonly used methods of the ones described in
paragraph 2.1 and was first introduced by Murray and Lopez (1996) in collaboration with
World Health Organization and the Worldbank in an attempt to introduce morbidity in
mortality-based health discussions. The estimation of environmental DALYs starts with
screening of the feasibility to describe the disease burden of certain environmental agents,
e.g. availability of relevant and suitable information, weight of evidence, and severity
estimates for specific effects. In this first step, environmental factors are selected for further
analyses. We have analysed the environmental disease burden related to air pollution, UV,
radon, noise, dampness in houses and traffic accidents from 1980 up to 2020. We have
chosen these environmental factors because of their known relation to health, their
importance in the Netherlands and the availability of data. Some other factors that can also be
of great importance, such as some chemicals, infectious diseases and indoor tobacco smoke,
have not been included, because we did not have access to all necessary data, and because of
the difficulty to estimate the number of people exposed to some of these agents.
3.1 Consultation of experts
We have asked an internal group of experts to advice on general procedures, and to judge the
weight of evidence and comment on the methods of our study. We have also consulted
experts for each specific environmental health field, in order to use the most up-to-date
information in our calculations, and to verify results. These experts have also been asked to
make estimations for certain missing data, mainly for uncertainty ranges.
3.2 Calculations
DALYs incorporate three important factors of health: loss of life expectancy due to
premature mortality, combined with the duration of living in a deteriorated health state,
standardized to the severity of the deteriorated health state.
Some DALY calculations also use age weights and time preferences. Age weights indicate
the relative importance of healthy life at different ages, for example, a rise of importance
from birth until age 25 and decline thereafter. Time preference compares the value of health

page 26 of 97 RIVM report 500029001
gains today to the value attached to health gains in the future. In economic theory, the latter is
assumed to be lower than the former.
However, for ethical reasons, we have chosen not to make a difference between elder and
younger people and for sustainability and durability reasons, we have not discounted health
benefits in the future. For more information on these and other discussion points: see
paragraph 6.4.
In general, DALYs can be calculated using the equations below:
DALY = AB * D * S
AB = AR * P * F
AR = (RR’-1)/RR’
RR’ = ((RR-1) * C) + 1
AB: Attributable Burden; the number of people in a certain health state as a result of
exposure to the (environmental) factor that is being analyzed, not corrected for
comorbidity.
D: Duration of the health state; for morbidity, prevalence numbers have been used and
therefore duration is one year (except for hospital visits, for which the mean duration
of the specific hospital visit has been used). For mortality, the duration of time lost
due to premature mortality is calculated using standard expected years of life lost with
model life-tables.
S: Severity; the reduction in capacity due to morbidity is measured using severity
weights. A weight factor, varying from 0 (healthy) to 1 (death), is determined by
experts (clinicians, researchers, etc).
AR: Attributive Risk; risk of getting a specific disease as a result of exposure to a certain
(environmental) factor.
P: Base prevalence for morbidity; number of deaths for mortality
F: Fraction of the population exposed to the (environmental) factor under investigation
(for air pollution, this fraction is set to 1, meaning that everybody is exposed to a
certain degree)
RR’: Adjusted Relative Risk
RR: Relative Risk
C: Concentration of the environmental factor, expressed in the unit of the Relative Risk

RIVM report 500029001 page 27 of 97
For some calculations, such as for noise, some calculation steps are unnecessary and are
therefore skipped or replaced by other calculations. The individual theme chapter will discuss
these specific methods. In this study, all calculations are corrected for changes in population
size and composition (ageing), unless otherwise stated.
3.3 Data selection
The aim of this study was to analyze trends in the environmental burden of disease for
various environmental factors for 1980, 2000 and 2020. If data for some of these years were
not available, we have used alternative years (i.e. 1990 and 2010). Calculations were made on
a national scale (the Netherlands).
As specified above, for the calculation of DALYs we need information on exposure to the
environmental factor, and exposure-response relationships (relative risks), base prevalences
at the reference level, duration, and severity for all associated health effects. Using the
common steps of health impact assessments, as discussed in chapter 2, as a guideline, we will
describe the methodological criteria of our data selection process. The selection of severity
weights and years of life lost (duration), which is specific to DALY calculations, will be
described as an extra step (step 5).
1) Selection of health endpoints
Health endpoints associated with the environmental factors have been selected based on the
availability of sufficient proof for a causal relationship with the risk factor. We have
consulted experts in order to gain insight into the weight of evidence for the relationships. In
some cases, we have investigated health impacts of which there is no complete scientific
consensus on the causal relationship (yet), but which we feel are important nonetheless. In
these cases, the lack of scientific consensus is made explicit in the description of the results.
Besides discussions with experts, we have used literature reviews, preferably by expert
committees. If any data in subsequent steps were not available, the impact of the health
endpoint under study could not be quantified. Therefore, some health effects have not or only
partly (e.g. only hospital admissions) been included in the calculations.

page 28 of 97 RIVM report 500029001
2) Assessment of population exposure
We have calculated all DALYs for the general population, since exposure-response
relationships were not based on individual exposure assessments, nor was extension to
personal exposure considered useful, since such refinement and detail would be lost when
combined with other more uncertain input data. Population exposure was assessed using a
combination of measurements, validated dispersion models and demographic data. Usually,
even though concentrations are measured at some locations, concentrations in other regions
need to be estimated. Furthermore, the exposure of humans to these emissions is not
measured and is therefore generally based on models. We have used a combination of
measured and modelled values. If these values were not available for all years, they were
estimated (expert judgements), interpolated or, as a last option, skipped. We have generally
used the same year for data on exposure and data on health effects. However, some effects
might occur much later than exposure (latency). It is difficult to allow for these effects. The
individual thematic chapters will address the issue when relevant.
3) Identification of exposure-response relations
Relative risks are based on (meta) analyses of epidemiological and toxicological data. We
have selected recent exposure-response relationships based on well founded Dutch
epidemiological studies or, when Dutch data were not available or unsuitable, we have used
the international estimate which best suited the Dutch situation. We have tried to select
exposure-response relations from studies in which the exposure range of the subjects is
similar to the exposure of the Dutch population. In addition to the difficulty to determine
which exposure-response relation is best to use, potential problems can also relate to the
slope of the relationship, the presence of a threshold and heterogeneity of the slope. Firstly,
the slope and form of the curve influence the possibility to assess health effects at different
exposures. We have tried to take the slope of (non-linear) curves into account. Secondly,
whether there is a threshold or not can influence results substantially. We have used
thresholds according to the latest insights of experts in the area under study. For example, we
did not use thresholds for air pollution, UV and radon in our final calculations, but we did
use thresholds for calculating the effects of noise annoyance and sleep disturbance, which are
judged to only take place above a certain noise exposure level. Individual paragraphs in
chapter 4 will go further into this issue. Lastly, heterogeneity of a relationship can result in
RIVM report 500029001 page 29 of 97
different values for different geographical regions or different age categories. We have
therefore tried to the degree possible to use Dutch data and studies.
4) Estimation of the extra number of cases with the specific health state
To estimate the number of cases attributable to a certain environmental factor, a function of
the population distribution, exposure-response relation and base prevalence of the health state
in the population is used. Prevalence data were ideally taken from national mortality and
morbidity registries, as used in the National Public Health Compass (RIVM, 2004). Most data
were available per 5 year age categories. Past and future values were based on demographic
projections and the assumption that the share of age groups within the total
mortality/morbidity number has been and will remain equal over the years. All demographic
data were based on data from Statistics Netherlands (CBS).
If prevalence data were not available, modelled or estimated values were used. For example,
data for cardiovascular disease hospital admissions were available for the years 1980 and
2000 (Nederlandse Hartstichting, 2004), however, for 2010 the prevalence had to be
estimated. We did this by assuming that the trend in cardiovascular hospital admissions is
similar to the trend in the number of hospital admissions for coronary heart disease. For the
latter, as well as for the number of clinical hospital admissions for COPD and total
respiratory diseases, we have used the trend in data from 1980 to 2003 in order to estimate
values for 2010 and 2020.
5) Selection of severity weights and duration of health effects
Severity weights
Severity weights (or disability weights) are determined by expert panels, such as doctors and
scientists. For this exercise, we mainly used the weight factors as used by the Department of
Public Health Status and Forecasting (RIVM, 2004a) and the background report for the
Public Health Status and Forecast 1997 (Melse and Kramers, 1998).
These weights were evaluated by Stouthard et al. (1997) by comparing different stages of one
disease, by comparing similar stages of different diseases and by comparing the severity
weights with the predicted weights of the EuroQol (5D+) model. The latter is a model which
evaluates health states based on six health dimensions: mobility, self-care, daily activities,
pain or discomfort, anxiety or depression and cognitive functions. The weights have also

page 30 of 97 RIVM report 500029001
been compared with the severity weights of the Global Burden of Disease study (Murray and
Lopez, 1996). Stouthard et al also studied the reliability of the weights by using panels and a
written procedure. The values and ranking order of the weights attributed by the panels were
very similar to one another. They were also similar to weights attributed by other experts
using the written procedure. Based on these evaluations we consider these severity weights of
sufficient quality.
If severity weights were not available from the abovementioned sources (such as weight
factors for hospital admissions for respiratory and cardiovascular diseases) we have used
weights from De Hollander et al. (1999). In the absence of a pre-existing weight factor, De
Hollander used a calibration scale drawn up by Stouthard to have environment-oriented
physicians evaluate health states.
For severe annoyance and sleep disturbance, we have slightly altered the estimate of De
Hollander. These health outcomes are not often included in weighting exercises and the
available weights vary considerably. We have chosen to use a weight factor of 0.02 and allow
for the relatively great uncertainty by using 0.01 (weight as used in De Hollander, 1999) as a
minimum value and 0.12/0.10 (for severe annoyance/ severe sleep disturbance respectively,
as described in Van Kempen (1998)), as maximum values in our Monte Carlo analysis.
Duration
The duration of a health effect is based on the number of healthy life years lost. For
morbidity, prevalence data were used and duration was therefore set to one year (assuming
that prevalence approximately equals incidence multiplied by duration, and thereby assuming
a steady-state equation where the rates are not changing).
For mortality caused by those environmental factors that are “completely responsible” for
death (such as traffic is responsible for traffic accident mortality), we have used mean life
expectancy minus mean age of death as the number of years of life lost. For factors only
partly responsible for death (such as short-term exposure to PM10 accelerating death in people
that are already diseased), we have used estimations of the attributable years of life lost.
Years of life lost were calculated similarly for all years.
It is interesting to realize that two different and opposing factors play a role when estimating
trends in years of life lost. If for example mortality numbers are decreasing, there will be
fewer years of life lost. However, less mortality also means a greater life expectancy, thus
increasing the number of years of life lost.

RIVM report 500029001 page 31 of 97
6) Computation of the total health burden of all risk factors
The last step in the general procedure of a quantitative health impact assessment is the
computation of the total disease burden, if wanted, by adding up all DALYs. Since we were
not able to include all environmental health factors that significantly affect health in our
calculations, our total burden of disease is probably an underestimation. However, this study
could be regarded as the current ‘state of the art’ and gives an indication of the total disease
burden caused by the factors studied, and the overall trends in this burden.
3.4 Monte Carlo analysis
Due to the large number of variables in the DALY calculation, each with its own uncertainty
range, results should be interpreted with care, and uncertainty analysis is relevant.
In this study, a Monte Carlo uncertainty analysis has been applied to all computations, using
the uncertainty ranges (based on literature or expert judgements) for the exposure, relative
risk, severity factor and duration. With this method, a 90% prediction interval can be
estimated around the output. In a Monte Carlo analysis, all variables are attributed a series of
random values within their range, thereby estimating the range of the output distribution. In
this type of simulation, probability distributions are defined for each uncertain variable.
Figure 1 shows some different types of these distributions. For each variable, the distribution
type is based on conditions and assumptions relevant to that variable. Based on these
distributions, a Monte Carlo simulation calculates multiple scenarios of a model by
repeatedly sampling values from the probability distributions for the uncertain variables. We
used the version 4.5 of @risk software (Palisade Decision Tools) to execute these
simulations.
Figure 1 Some types of probability distributions (Decisioneering website, 2004).
We present the values of the 90% prediction intervals for all Monte Carlo calculations. The
90% prediction intervals of the cumulative numbers mentioned in this report (the totals per
environmental factor, as shown in all graphs) can be slightly different from the intervals that

page 32 of 97 RIVM report 500029001
can be derived by adding up the effect-specific 90% prediction intervals (which are shown in
the table in the appendix). This is because all separate health effects have been treated as
independent variables, and therefore their most extreme values will not be likely to coexist
when analysing all effects simultaneously.
Apart from uncertainty within variables, there is also uncertainty caused by qualitative
differences between variables. All input variables have different origins. Some variables are
based on Dutch data, but, if not available, international (meta-) analyses were used. Also,
some variables are modelled, while others are measured. Some uncertainty ranges are
modelled and calculated, while others are based on expert judgments. Severity factors are
derived from different sources due to incompleteness of individual studies. Evidently, these
differences hamper comparison. Also, one should realize that the DALY is a composite
measure that cannot be directly measured in a population. Therefore, a direct validation of
modelled outcomes against empirical data is not possible. More information on uncertainty in
the DALY calculations can be found in paragraph 6.2.

RIVM report 500029001 page 33 of 97
4. Data
The following paragraphs describe the specific sources of the data we have used for the
estimations of the disease burden that can be attributed to air pollution, noise, radon, UV,
indoor dampness and traffic accidents. The values and uncertainty ranges for severity and
duration estimates can be found in Appendix 1.
4.1 Air pollution
We have investigated the effects of PM10 and ozone on the health of the Dutch population.
PM10 can be regarded as an indicator of a more complex mixture of urban air pollutants. For
the effects of short-term PM10 exposure, health effects taken into account include mortality
(total and subdivided in cardiovascular and respiratory mortality, including COPD), and
hospital admissions for cardiovascular and respiratory disease (total and separately for COPD
and asthma). For long-term PM10 exposure, we have analyzed total mortality.
The health effects of short-term ozone exposure that we have considered are mortality (total
and subdivided in cardiovascular and respiratory mortality), hospital admissions for
cardiovascular and respiratory disease (total and separately for COPD and asthma) and
asthma attacks (separately for children and adults).
Time spent outside the hospital while still suffering from the disease or disability is not
included in our DALY outcomes due to lack of data.
Exposure
Data on concentrations of PM10 are a based on dispersion models, and adjusted for
underestimation of these models by using measurement data, which gives most accurate
concentration data (RIVM MNP. Personal communication. Hammingh P. 2004). The
modelled data were calculated for the years 1980, 1995 and 2010. These values have been
used to create a ‘best fit’ line and calculate a value for the year 2000 (Figure 2). Average
PM10 concentrations are estimated to decrease from around 48 µg/m3 in 1980 to 29 µg/m3 in
2010. Uncertainty of these values lies around 30%.

page 34 of 97 RIVM report 500029001
0
10
20
30
40
50
60
1980 1985 1990 1995 2000 2005 2010
PM10
(µg/
m3)
Figure 2 Annual PM10 concentrations (µg/m3) in the Netherlands, 1980 – 2010 (PM10 concentration for the
year 2000 based on a ‘best fit’ line)
It is generally agreed that a ‘no effect level’ for PM10 does not exist: health effects can occur
at all levels of exposure. However, it can be realistic to calculate health effects of PM10 using
certain fixed levels as minimum exposures. For example, an ambient PM10 concentration of
10 µg/m3 can be regarded as a ‘background concentration’. DALY outcomes based on this
level will only include attributable mortality due to man-made pollution. An alternative
reference level is 20 µg/m3, which represents the target set for the year 2010 by the European
Union. DALY outcomes then give an indication what part of mortality could be avoided if
this level was to be achieved. We have calculated DALYs using no threshold (=0 µg/m3), a
10 µg/m3 reference level and a 20 µg/m3 reference level. The DALYs calculated without a
threshold were used in the final outcome presentation in order to show the complete PM10-
related disease burden, which is what we have done for the other environmental factors as
well.
For ozone, mean daily max 8-hour values were available for 1990 and 2000, based on
measured values. For the year 1990, in order to correct for annual peaks, the mean value of
1990-1992 has been used (1989 was not available) and for the year 2000, we have used the
mean of the years 2000 to 2002. The uncertainty range is around 15% (RIVM MNP. Personal
communication. Hammingh P. 2004). There is no clear trend visible in the ozone
concentrations from 1990 – 2002 (Figure 3) and it is currently not possible to estimate stable
future values.

RIVM report 500029001 page 35 of 97
Figure 3 Annual mean of daily 8 hour (13-20h) mean ozone values in the Netherlands in µg/m3, 1990 - 2002
Prevalence Prevalence data are derived from various registrations as used in the National Public Health
Compass (RIVM, 2004a). The prevalence data originated mainly from general practitioners
registries. Some are supplemented with numbers from hospitals or nursing homes.
Exposure-response Numerous epidemiological studies have investigated the health effects of short-term exposure
to PM10 or ozone and several studies are currently underway. Still, the exposure-response
relationships are not completely clear. This is partly due to the fact that a single best
relationship does not exist and can therefore not be found: the exposure-response
relationships can differ in place as well as in time. For example, for PM10, the exposure-
response relationships might have changed in the last decades. Current research (RIVM, not
published yet) analyzes new PM10 data series in order to investigate these potential trends,
which could for instance be caused by changes in the mixture of air pollutants that PM10
represents.
0,00
10,00
20,00
30,00
40,00
50,00
60,00
70,00
1988 1990 1992 1994 1996 1998 2000 2002 2004
Year
DataSen's estimate 99 % conf. min 99 % conf. max 95 % conf. min 95 % conf. max

page 36 of 97 RIVM report 500029001
The tables in this paragraph show the air pollution-related health effects that were taken into
account in the calculations, and the accompanying exposure-response relationships we have
used. We have tried to use the most recent studies that we considered most applicable to the
Netherlands. For the short-term effects, we have chosen to use a constant lag time (lag 1),
indicating that, in order to derive exposure-response relationships, health effects have been
related to PM10 exposure one day earlier. This assumption affects the relative risks and
thereby the DALY outcomes. For the year 2000, we were able to make calculations using a
2 component-model, in which the effects of PM10 and ozone are integrated (see paragraph
5.1). In this model, a lag-time of seven days is used.
PM10 long-term exposure As yet, not many studies have investigated the potential health effects related to long-term
PM10 exposure. For the calculation of the DALY for long-term exposure to PM10 we used the
estimate for the concentration – response curve from Künzli et al. (2000), which is a 4.3%
increase in mortality per 10 µg/m3 increase in PM10. This estimate is the weighted average
from two American cohort studies (Dockery et al., 1993; Pope et al., 1995). Dockery
measured the 14-to-16-year mortality follow-up of 8111 adults in six U.S cities and related
this to air pollution. Pope linked ambient air pollution data from 151 US metropolitan areas in
1980 with individual risk factor on 552,138 adults. These two American cohort studies are at
the moment the best cohort studies available for application to the Dutch situation. Two
additional studies have assessed the long-term effects of ambient air pollution in a cohort of
50,000 US-veterans (Lipfert et al., 2001) and in a cohort of 6,338 nonsmoking Californian
Seventh-day Adventists (Abbey et al., 1999). We think that the results of these two studies
are less transferable to the Dutch population because they were performed in specific groups,
and therefore less representative for the general population than the studies of Dockery et al.
and Pope et al. In 2002, Pope has published an updated analysis of the mortality follow-up
for a longer period (Pope et al., 2002), which confirmed the results of the first analyses. For
comparing purposes, the various relative risks of the individual studies are presented in
Table 1. We have converted the PM2.5 relative risks into PM10 relative risks by applying a
PM2.5/PM10 ratio of 0.67 (Cyrys et al., 2003). When using the individual study results and the
ranges of uncertainty between the individual studies, our risk estimate of 4.3% increase in
mortality per 10 µg/m3 increase in PM10 is surrounded by a lowest point estimate of 4.2%
(Pope et al., 2002) and a highest point estimate of 9.2% (Dockery et al., 1993). Taken into
account the range in confidence intervals of the individual studies, a lowest estimate of 1.4%

RIVM report 500029001 page 37 of 97
was found in the Pope (2002) study, while the highest 95% confidence estimate of 16.1%
increase per 10 µg/m3 PM10 was calculated in the Dockery (1993) study.
Table 1 Relative risks of different studies for mortality due to long-term PM10 exposure
Reported RR
Based on PM10 per 10 µg/m3
(recalculation) Kunzli 2000 1.043 (1.026 - 1.061) PM10 1.043 (1.026 - 1.061) Pope 1995 1.066 (1.036 - 1.099) PM2.5 1.046 (1.025 - 1.070) Dockery 1993* 1.085 (1.028 - 1.146) PM10 1.085 (1.028 - 1.146) Dockery 1993 1.132 (1.042 - 1.230) PM2.5 1.092 (1.029 - 1.161) Pope 2002 1.060 (1.020 - 1.110) PM2.5 1.042 (1.014 - 1.077) Abbey 1999 1.045** (0.992 - 1.101) PM10 1.045 (0.992 - 1.101) Lipfert, 2000 n.a. n.a. n.a. * based on EPA 8-124 ** For men only. For women <1
PM10 short-term (peak) exposure
For the effects of peak exposure to PM10, valid estimates based on the Dutch situation and
population were available (Table 2), and therefore these were considered most appropriate for
our study. Exposure-response relationships for mortality are based on the most recent 7-year
time-series analysis of PM-associated premature mortality in the Netherlands (Buringh and
Opperhuizen, 2002). For morbidity (hospital admissions), a recent analysis from the
University of Groningen has been used (Vonk and Schouten, 2002), in which the linear short-
term relationship between daily air pollution and the number of (emergency) hospital
admissions was investigated, using data from 1992 to 1999.
Internationally, many other exposure-response relationships for acute effects of PM10
exposure have been published. Künzli et al., for example, have also published relative risks
(Künzli et al., 2000, exposure-response relationships not presented here), based on a meta-
analysis of various air quality studies, and calculated as the variance-weighted average of all
studies. These relative risks are considerably higher than the estimates based on the Dutch
data. For comparison, we have also calculated DALYs using the RR by Künzli for short-term
PM10 exposure related effects, when available.

page 38 of 97 RIVM report 500029001
Table 2 Relative risks of morbidity and mortality effects of short-term exposure to PM10, as used in the DALY calculations, based on Dutch data
Reference Original Relative Risk Relative Risk per per 10 µg/m3
Mortality (total) Buringh et al., lag 1 (2002)
1.036 (1.025-1.047) (per 100 µg/m3)
1.0036 (1.0025 - 1.0046)
Cardiovascular disease mortality
Buringh et al., lag 1 (2002)
1.025 (1.009-1.042) (per 100 µg/m3)
1.0025 (1.0009 - 1.0041)
Respiratory disease mortality
Buringh et al., lag 1 (2002)
1.120 (1.084-1.157) (per 100 µg/m3)
1.0114 (1.0084 - 1.0157)
COPD mortality Buringh et al., lag 1 (2002)
1.111 (1.064-1.161) (per 100 µg/m3)
1.0106 (1.0062 - 1.0150)
Hospital admissions cardiovascular disease
Vonk et al lag 1, (2002) 1.020 (1.012-1.028) (per 63 µg/m3)
1.0032 (1.0019 - 1.0044)
Hospital admissions respiratory disease (total)
Vonk et al lag 1, (2002) 1.030 (1.016-1.043) (per 63 µg/m3)
1.0047 (1.0025 - 1.0067)
Hospital admissions COPD
Vonk et al lag 1, (2002) 1.054 (1.034-1.075) (per 63 µg/m3)
1.0084 (1.0053 - 1.0115)
Hospital admissions asthma
Vonk et al lag 1, (2002) Not significant -
Ozone
As mentioned above, we have used most recent Dutch studies to analyze ozone-related
mortality. Although there have been previous estimates of ozone-related morbidity (hospital
admissions), recent Dutch research does not yield reliable exposure-response relationships
(Vonk et al., 2002). The latest WHO meta-analysis of time-series and panel studies for PM10
and ozone (Anderson et al., 2004) does not find significant positive relationships for ozone-
related morbidity either.
There is also insufficient evidence to quantify a relationship between long-term ozone
exposure and health effects (World Health Organization, 2003), apart from a reduction in
lung function development (World Health Organization, 2004b), which is not quantifiable.
Therefore, we have chosen not to include long-term effects nor morbidity effects of ozone in
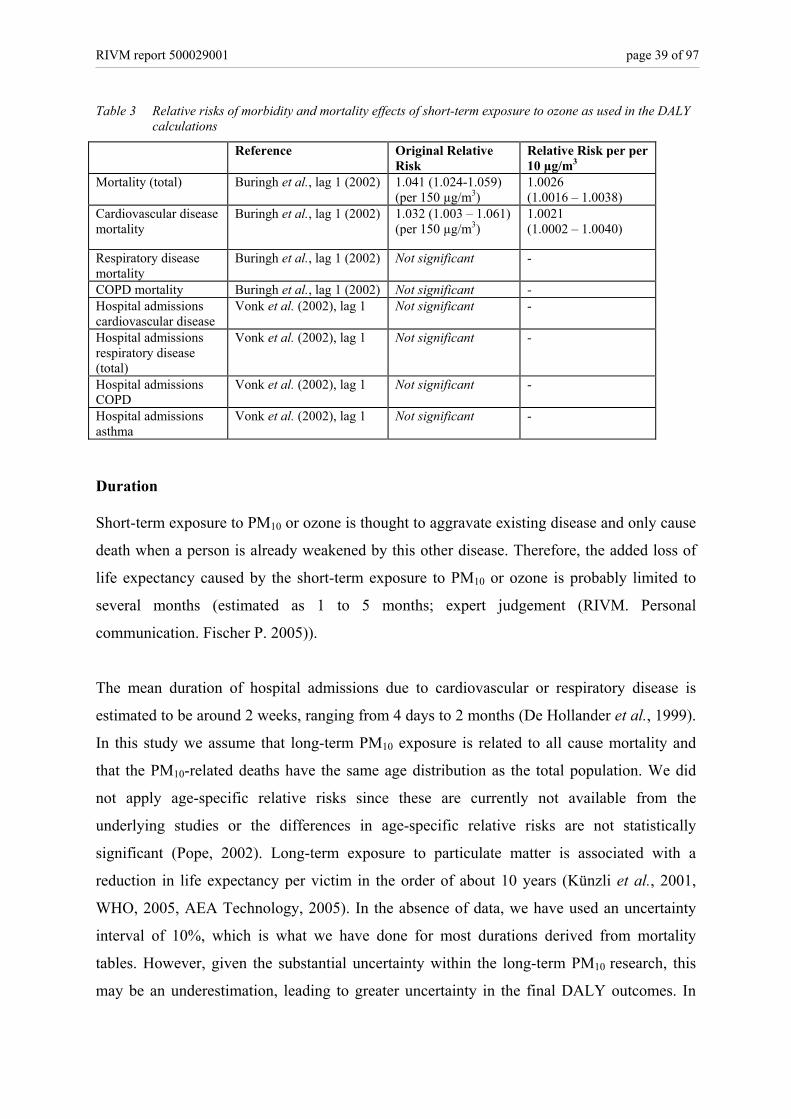
this study. Table 3 shows the relative risks used in our study.
RIVM report 500029001 page 39 of 97
Table 3 Relative risks of morbidity and mortality effects of short-term exposure to ozone as used in the DALY calculations
Reference Original Relative Risk
Relative Risk per per 10 µg/m3
Mortality (total) Buringh et al., lag 1 (2002) 1.041 (1.024-1.059) (per 150 µg/m3)
1.0026 (1.0016 – 1.0038)
Cardiovascular disease mortality
Buringh et al., lag 1 (2002) 1.032 (1.003 – 1.061) (per 150 µg/m3)
1.0021 (1.0002 – 1.0040)
Respiratory disease mortality
Buringh et al., lag 1 (2002) Not significant -
COPD mortality Buringh et al., lag 1 (2002) Not significant - Hospital admissions cardiovascular disease
Vonk et al. (2002), lag 1
Not significant -
Hospital admissions respiratory disease (total)
Vonk et al. (2002), lag 1
Not significant -
Hospital admissions COPD
Vonk et al. (2002), lag 1 Not significant -
Hospital admissions asthma
Vonk et al. (2002), lag 1 Not significant -
Duration Short-term exposure to PM10 or ozone is thought to aggravate existing disease and only cause
death when a person is already weakened by this other disease. Therefore, the added loss of
life expectancy caused by the short-term exposure to PM10 or ozone is probably limited to
several months (estimated as 1 to 5 months; expert judgement (RIVM. Personal
communication. Fischer P. 2005)).
The mean duration of hospital admissions due to cardiovascular or respiratory disease is
estimated to be around 2 weeks, ranging from 4 days to 2 months (De Hollander et al., 1999).
In this study we assume that long-term PM10 exposure is related to all cause mortality and
that the PM10-related deaths have the same age distribution as the total population. We did
not apply age-specific relative risks since these are currently not available from the
underlying studies or the differences in age-specific relative risks are not statistically
significant (Pope, 2002). Long-term exposure to particulate matter is associated with a
reduction in life expectancy per victim in the order of about 10 years (Künzli et al., 2001,
WHO, 2005, AEA Technology, 2005). In the absence of data, we have used an uncertainty
interval of 10%, which is what we have done for most durations derived from mortality
tables. However, given the substantial uncertainty within the long-term PM10 research, this
may be an underestimation, leading to greater uncertainty in the final DALY outcomes. In

page 40 of 97 RIVM report 500029001
order to estimate the magnitude of this potential variation in the number of years of life lost,
we have made alternative calculations using a greater uncertainty interval, which we created
by using age-specific duration estimates. It is as yet unclear to what extent PM10-related
mortality occurs more frequent in certain age categories. However, this could influence the
estimate of the number of years of life lost. Using age-specific mortality data from Statistics
Netherlands (CBS), we have estimated that the years of life lost might range from around 4
years (deaths only occurring in the population over 85 years old) to around 13 years (deaths
occurring in the population over 25 years old). We have made an alternative calculation of
the long-term PM10-related disease burden using these values in the uncertainty analysis,
thereby potentially giving a more realistic view of the uncertainty interval (90% prediction)
surrounding the DALY output.
Severity All severity factors have been derived from the sources mentioned in paragraph 3.3. For
hospital admissions for asthma and COPD, the weight factors for ‘severe asthma’ and ‘severe
COPD’ have been used (0.36 and 0.53 respectively).
4.2 Noise
Noise can have several effects on human health. We have analyzed severe annoyance and
severe sleep disturbance caused by several traffic noise sources (industrial noise, neighbour
noise, etc, have not been included). We have also included the potential effect of noise on
hypertension, which could lead to cardiovascular diseases and potentially premature
mortality. Other effects, such as the potential influence on cognition, have not been
incorporated, because there is no usable exposure-response relationship available as yet.
Exposure For calculation of the noise exposure of the Dutch population, the EMPARA model (Dassen,
2001) has been used, which uses characteristics of the noise sources to calculate noise
emissions and generate noise maps. These emissions are then translated to human noise
exposure, using noise propagation paths and demographic data. We have calculated the
number of dwellings exposed to certain levels of transport noise (per 1 dB) for the years
1980, 2000 and 2020. By multiplying the percentages of exposed dwellings with population
numbers, the number of people exposed to the various noise levels has been calculated. The

RIVM report 500029001 page 41 of 97
noise sources include road traffic (municipal, provincial and national roads), rail traffic and
air traffic (only around the major Dutch airport, Schiphol). For road traffic, cumulative data
have been used to account for simultaneous exposure to noise from multiple road types.
Cumulative data could also be derived for simultaneous exposure to road, air and rail traffic.
However, these combined source data could not be used for annoyance and sleep disturbance
calculations, because the exposure-response functions used to calculate the number of
annoyed or sleep disturbed people are specific for each source. The cumulative numbers have
been used to calculate mortality numbers, for which we made calculations using the same
exposure-response relationship for each source. The validity of this assumption of source
similarity for mortality can, however, be debated (see paragraph on exposure-response).
For the year 2020, two scenarios have been assessed: a scenario based on current policy
efforts (policy as usual) and a scenario based on optimal policy efforts to reduce noise at the
source. This second scenario assumes a 5 dB noise reduction for all sources (except air
traffic), which can be useful to evaluate or plan policy measures aimed at reducing noise.
Measures that can be implemented in order to achieve such a noise reduction are described in
paragraph 5.2. The noise exposure distribution (in percentages) for all years is shown in
Figure 4. The number of people in dwellings exposed to the higher noise classes has
increased from 1980 to 2000, and will continue to increase in a policy-as-usual scenario.
When optimal source policy is implemented, however, the number of (highly) exposed
people will presumably be significantly reduced.

page 42 of 97 RIVM report 500029001
0%
20%
40%
60%
80%
100%
1980 2000 2020 2020,optimal
policy at thesource
Per
cent
age
of h
ouse
s ex
pose
d
>60 dB50-60 dB40-50 dB<40 dB
Figure 4 Noise exposure distribution (Lden, outside) based on exposed dwellings in the Netherlands for 1980,
2000, 2020, and for 2020 with optimal policy for road and noise traffic. Road traffic accounts for the largest share of transport noise, with municipal (urban) roads as
the greatest contributor to road traffic noise (Figure 5).
050
100150200250300350400450
L24h
* 30 35 40 45 50 55 60 65 70 75 80 85
Abso
lute
num
ber
of h
ouse
s ex
pose
d (x
1000
)
cumulativemunicipal roadsprovincial roadsnational roads
* L24h = max (Lday, Levening + 5, Lnight + 10) Figure 5 Absolute number of dwellingss exposed to certain sources of road transport noise in the Netherlands,
2000
These estimations of noise exposure should be interpreted with caution. Exposure is based on
the noise level on the most exposed part of the house. Varying degrees of isolation of these

RIVM report 500029001 page 43 of 97
houses can influence personal exposure and affect the exposure distribution. Some other
uncertainties also play a role, such as uncertainty in the estimated traffic volume (which has
been measured for the year 1980 and 2000, but estimated for 2020 using the EC scenario of
the 5th Environmental Outlook (Idenburg, 2001) and uncertainties in the models (influence of
buildings, noise barriers, etcetera). The form of the exposure curves is probably realistic,
however, uncertainty lies mainly in the locations of the peaks of the curves.
As an estimate, we have used an uncertainty range of +/- 1 dB(A). Although uncertainty
might be larger for estimates in the past and the future, we have kept the same uncertainty
intervals for all years, treating the past and future values as scenarios.
Prevalence In contrast to other health outcomes, by definition there is no base prevalence for noise
annoyance or sleep disturbance. The prevalence of noise annoyance and sleep disturbance is
estimated as described in the following paragraph, using exposure-response models. This is
an indirect way of estimating the prevalence. These relationships are based on combined
results from various studies. Because questions and response categories in these studies
differ, all results have been translated to a 0-100 scale (Miedema et al, 2001), in which a 72
cut-off is applied for the percentage of people that is highly annoyed (cut off at 50 is the
percentage of people being ‘annoyed’).
Another option to estimate the prevalence of annoyance and sleep disturbance is by directly
using numbers from surveys. The number of people reporting annoyance in surveys is
generally higher than the numbers that might be expected based on models using the
established exposure-response relationships (numbers from the most recent noise annoyance
inventory in the Netherlands are given in the results section, paragraph 5.2) even though these
models are principally based on survey data. This discrepancy can be caused by various
reasons, which will also be addressed in the results section where outcomes will be
compared.
The prevalence of hypertension is estimated to be 24% in men and 19% in women in age
category 20-60. For older people, these percentages are higher (RIVM, 2004a). These
prevalences have been corrected for population size, but not for composition of the
population (ageing).
page 44 of 97 RIVM report 500029001
Exposure-response Exposure-response curves indicating the percentage of people (severely) annoyed or sleep
disturbed at certain noise exposure levels have been derived by Miedema et al. (Miedema et
al., 2001, 2003). These curves are recommended for use in the EU Directive on Noise (World
Health Organization, 2004a). They have been derived for road, rail and air traffic noise and
severe annoyance, and road and rail traffic noise and severe sleep disturbance. A relationship
for air traffic and sleep disturbance was not proposed by Miedema (2002), because of the
large variance in outcomes. In a follow-up study (Miedema and Vos, 2004), Miedema
included some new studies and proposed a relationship for air traffic and sleep disturbance.
However, these curves are only indicative and involve much more uncertainty than the curves
for road and rail traffic-related sleep disturbance. Therefore, we did not use them for our
current study.
The annoyance curves of Miedema and Oudshoorn (2001) are based on a pooled analysis of
datasets from noise annoyance studies in several regions, inside as well as outside Europe.
Methodological differences in these studies could have influenced the relationships.
However, more recent analyses (TNO, not published yet) based on newer datasets do not
show any systematic changes. Results from noise annoyance and sleep disturbance research
around Schiphol have not been included in the exposure-response relationships by Miedema,
since outcomes of these studies were considered incomparable to the other studies that were
used for the derivation of the relations (Ministerie van Verkeer en Waterstaat, 2000).
However, vice versa, this would imply that the curves derived by Miedema are not applicable
to Schiphol airport, which is the largest source of air traffic-related noise annoyance in the
Netherlands. Therefore, it might not be completely valid to use these relations for the Dutch
situation.
Also, the curves can only be applied to long-term stable situations (no changes in number of
flight, flight routes, etc) and cannot be used to analyze short-term or local noise problems.
Whether this precondition is realistic is questionable, since a stable situation is hardly ever
reached at airports, where development and change is practically ongoing (Van Kempen et
al., 2005).
In our calculations, only severe annoyance and severe sleep disturbance have been included.
Figure 6 shows the exposure-response curves by Miedema et al for road traffic and severe
annoyance and sleep disturbance. We have used third order polynomials that Miedema

RIVM report 500029001 page 45 of 97
0102030405060708090
100
44 46 48 50 52 54 56 58 60 62 64
Lnight
% o
f pop
ulat
ion
seve
rely
slee
pdi
stur
bed
0102030405060708090
100
42 45 48 51 54 57 60 63 66 69 72
Lden
% o
f pop
ulat
ion
seve
rely
ann
oyed
proposed as workable versions of the more complicated original curves. For severe
annoyance, data below 45dB and above 75dB (Lden) were excluded from his study because
these were judged less essential and too uncertain (Miedema, 2001). Furthermore, for the
polynomial, a zero severe annoyance level has been set to 42 dB. In our study, people
exposed to levels below 42 dB have not been included in the calculations, while people
exposed to levels above 75 dB have been regarded as exposed to 75dB. The curves for severe
sleep disturbance are valid in the range 45-65 dB (Lnight). People exposed to noise below
45 dB have not been included. Noise levels above 65 dB have been regarded as 65 dB. The
validity ranges of these curves are based on the available measurement data, and do not
necessarily imply that no annoyance or sleep disturbance will occur beneath these thresholds.
Figure 6 Exposure-response relationships for road traffic noise exposure and severe annoyance (left) and
severe sleep disturbance (right). (Miedema et al., 2001- 2004)
Partly due to the influence of non-acoustic factors, (severe) annoyance or (severe) sleep
disturbance is difficult to quantify. This difficulty is illustrated by the fact that different
approaches to measure noise annoyance/ sleep disturbance can yield diverse results. In order
to demonstrate this variability and its effects on calculations, we have also calculated DALYs
using a recent Dutch study on environment-related annoyance and quality of life (Franssen et
al., 2004). In this study, 2000 randomly selected people in the Netherlands were interviewed
and were asked how often they experienced annoyance or sleep disturbance as a result of
exposure to noise from various sources. In this study, no exposure data were examined. The
study took place in the year 2003 and showed that 29% of the respondents reported severe
annoyance due to noise from one or more road traffic sources, 12% of the people experienced

page 46 of 97 RIVM report 500029001
severe annoyance caused by air traffic, whereas rail traffic was a source of severe annoyance
for 2% of the respondents. For severe sleep disturbance, these percentages were 12%, 3% and
1% respectively. We have used these percentages to calculate DALYs in order to compare
them with the results based on the curves by Miedema.
The exposure-response relation for noise and hypertension is based on a meta-analysis (Van
Kempen et al., 2002), which was based on data for air traffic (RR5 dB(A) = 1.26 (1.14 - 1.39).
In this study, we have used this same relation for road and rail traffic as well, which may be
an overestimation. This relative risk is valid from 55-72 dB(A). The relative risk for
hypertension based mortality is estimated to be 1.4 (1.2-1.6) based on meta-analysis (RIVM.
Personal communication. Hoogenveen R. 2004).
Duration We have used prevalence data for annoyance and sleep disturbance, and the duration is
therefore one year. As an estimation of the loss of life expectancy via noise → hypertension
→ cardiovascular disease → mortality, we have used the mean loss of life expectancy for
mortality due to cardiovascular disease (almost 11 years), which has been derived from
mortality tables (RIVM, 2004a).
Severity Severe annoyance and sleep disturbance are hard to weigh, because there is little information
on their relationship with quality of life measures. We have used a severity factor of 0.02,
with a relatively large uncertainty interval (0.01-0.12 for annoyance, 0.01-0.10 for sleep
disturbance). The minimum value (0.01) is based on De Hollander et al. (1999), who used a
panel of environment-oriented physicians to attribute severity weights to various health states
based on a protocol by Stouthard (1997). The maximum values (0.10 and 0.12) are based on
Van Kempen (1998) who did a panel study with 13 medical experts, also based on a protocol
by Stouthard. In that study, sleep disturbance and annoyance were weighted relatively high.
Since the weight factors are so small, these variations have a relatively big impact on the
outcomes.
4.3 Radon
Radon is a radioactive gas that is formed during the natural breakdown of uranium in soil,
water and stony materials. It finds its way into houses through cracks and holes in the

RIVM report 500029001 page 47 of 97
foundation. Radon and its decay products can cause lung cancer. Studies show that radon is
more of a risk to smokers than to non-smokers. However, the latter also have an elevated
chance of developing lung cancer when exposed to radon. We have calculated the radon-
related burden of disease based on lung cancer mortality.
Exposure As a relevant exposure measure, we have used the mean individual dose over 10 years before
lung cancer diagnoses. This dose is proportional to the mean indoor radon concentration over
the same period of time. Since we are investigating lung cancer, we have confined ourselves
to inhalation doses.
Over the period 1990-2000, the mean radon concentration for the total housing stock was
22.7 Bq/m3 (2000: 23.2; 1990: 22.2 Bq/m3). This concentration corresponds to an inhalation
dose of radon decay products of 700 microsievert. For 1970-1980, the mean dose was
19.6 Bq/m3 (1979: 20.3; 1969: 18.8 Bq/m3). Indoor radon concentrations are increasing over
time (Figure 7).
Figure 7 Average radon concentrations in Dutch houses and mean values per decade (Stoop et al., 1998).

page 48 of 97 RIVM report 500029001
Prevalence Prevalence data for lung cancer are derived from mortality registration as used in the National
Public Health Compass (RIVM, 2004a). These prevalences have been corrected for
population size, but not for composition of the population (ageing).
Exposure-response Calculations by the Health Council of the Netherlands (Gezondheidsraad, 2000) indicate
100 to 1200 extra cases of lung cancer (central estimate: 800 deaths) caused by indoor radon
exposure. This is based on data for mine workers, assuming a linear relationship between
radon and lung cancer. The effect of smoking has been incorporated using a multiplicative
model. It has been assumed that the indoor radon concentration of 23 Bq/m³ leads to these
800 radon-related deaths, implying that a radon concentration of 1 Bq/m3 roughly
corresponds to a mortality of 2.2 people per million. Using the characteristics of these
estimates, we have been able to calculate radon attributable lung cancer for 1980 and 2020.
Duration By setting the radon-related deaths as a fixed fraction of the overall lung cancer deaths, we
inherently imply that the age and gender specific incidence and disease development are
identical to lung cancer cases in the general population. The durations used are based on
standard mortality tables and vary between 11 and 17 years (dependent on year and gender).
Severity Severity for mortality is 1.
4.4 UV
Ultraviolet (UV) radiation is responsible for several adverse health effects. Exposure to UV
radiation can potentially lead to skin cancer, suppression of the immune system, cataracts and
premature skin aging. We have calculated the UV-related disease burden based on skin
cancer (basal cell carcinoma, squamous cell carcinoma and melanoma), morbidity and
mortality. Together, these 3 types of skin cancer make up almost 100% of all skin cancer
incidence (70%, 20% and 10% respectively). Mortality calculations for basal cell carcinoma
have not been made, since hardly anybody dies due to that type of cancer. Changes in UV-
exposure do not have an immediate effect on skin cancer risk, due to long latency periods

RIVM report 500029001 page 49 of 97
(Slaper, 1996; Kelfkens, 2002). Thus it is to be expected that the increase in skin cancer
resulting from ozone depletion will hardly be visible during the period of this study
(1980-2020)
Therefore, the estimated disease burden during this period is predominantly due to outdoor
UV-exposures that are only marginally affected by ozone depletion. This disease burden is
therefore only marginally open to environmental policy. It is, however, open to public health
policy, since behavioral aspects dominate actual exposure.
Effects associated with exposure to artificial UV sources, e.g. the use of tanning equipment or
for medical reasons, have not been estimated in our study.
Exposure and exposure-response The large majority of skin cancer cases are thought to be attributable to UV radiation.
However, induction and development of skin cancer is a complicated and long-term process.
The cumulative UV-dose over 30-50 years before diagnosis is relevant for the induction of
squamous cell carcinoma. For basal cell carcinoma exposure early in life is probably most
important. For the induction of melanoma, additional information on the variation in UV
exposure and skin burning history may be more relevant. Model calculations can in retrospect
yield information on the ambient UV dose, but none of these models can incorporate the
changing sunbathing behavior of the population with any sophistication. Consequently, a
exposure-response relationship relating the ambient UV dose to skin cancer incidence,
incorporating people’s behavior, is currently not available. Therefore, the DALY calculations
are based on the observed number of skin cancer cases in the year 2000. For the years 1980
and 2020, these numbers have been corrected for the size and age distribution of the
population, but not for possible differences in exposure, for instance due to a change in
behavior or in stratospheric ozone content, or for ethnicity and potential changes in the
prevalence of certain skin types .
Prevalence Prevalence data for cancer are derived from mortality registration as used in the National
Public Health Compass (RIVM, 2004a), which are data from the Dutch Cancer registration.
Since age specific prevalences for basal cell carcinoma were lacking, we have used the same
age distribution as for squamous cell carcinoma, multiplied by 3.5 (based on data from the
Dutch Cancer Society (KWF Kankerbestrijding, 2004)).

page 50 of 97 RIVM report 500029001
In order to assess the impact of our input choices, we have also calculated UV-related
DALYs using incidence data. We have used age specific incidence data for mortality and
morbidity. In order to estimate morbidity numbers, we have calculated the fraction of people
that survive the disease each year (for basal cell carcinoma 100%, for squamous cell
carcinoma 95-98%, for melanoma 77-86% over the years).
Duration For the morbidity calculations based on prevalences, duration is standard one year. The
average number of years of life lost due to premature mortality have been derived from the
age specific incidence data. For squamous cell carcinoma, this number varies from around
5 to 9 years (depending on year and gender). Some 18 to 28 years of life are averagely lost
due to melanoma-related mortality.
The alternative incidence-based morbidity calculations were made using the number of
remaining life years after the occurrence of cancer as input for the duration. This duration is
around 9 to13 years for basal and squamous cell carcinoma and 22 to 29 years for melanoma
(depending on year and gender).
Severity All severity factors have been derived from the sources mentioned in paragraph 3.3.
4.5 Indoor dampness
The main health effect of living in damp houses is (aggravation of) respiratory diseases, such
as asthma (Van Veen et al., 2001). We have analyzed the contribution of indoor dampness to
asthma complaints for children and for adults.
Exposure The percentage of houses with dampness problems has been estimated using various research
and registrations (Van Veen et al., 2001). Data were available for 1971, 1995, 2000 and
2020. The value for 1980 has been interpolated using the data for 1971 and 1995, as is shown
in Figure 8. The percentages have been multiplied with population numbers and split into

RIVM report 500029001 page 51 of 97
children (< 15 years) and adults in order to estimate the number of exposed children and
adults.
It is possible that the type of dampness, and consequently the concentration and type of
mould associated with this dampness, has changed over the years. This can potentially affect
our disease burden estimates; however, data to include these potential effects in the
calculations was unavailable.
1971; 24%
2020; 15%
2000: 17%
1995: 18%
1980; 22%
0%
5%
10%
15%
20%
25%
30%
1970
1975
1980
1985
1990
1995
2000
2005
2010
2015
2020
% d
amp
hous
es
Figure 8 Percentage of damp houses in the Netherlands. The value for 1980 has been interpolated.
Prevalence, exposure-response, duration and severity Prevalence of asthma is based on doctor registrations. Since these data were available per
5 year age category, it was possible to perform separate calculations for children and adults
(RIVM, 2004a). As children are more vulnerable to asthma then adults, their relative risk is
higher (1.5 - 3.5) than for adults (1.5 - 2) (Van Veen et al., 2001). These estimates are based
on a literature review and a dissertation using international studies.
Severity is similar for children and adults, at a severity weight of 0.078 per year with asthma
(RIVM, 2004a). Duration of asthma is standard one year using prevalence rates.

page 52 of 97 RIVM report 500029001
4.6 Traffic accidents
Traffic accidents can cause mortality and (severe) morbidity. For calculations on traffic
accidents, there is no need to model the ’attributable risk’: all traffic accidents are by
definition related to traffic. Also, all people are in principle exposed to traffic. Therefore, data
on exposure and exposure-response are not needed.
Prevalence In the year 2000, around 1,200 people died and some 136,000 people were injured in traffic
accidents (Stichting Wetenschappelijk Onderzoek Verkeersveiligheid (SWOV). Personal
communication. Bos N, 2004). These numbers relate to all victims of traffic accidents in the
Netherlands on public roads with at least one driving vehicle involved.
For the years 1980 and 2000, mortality numbers are based on registered numbers, which are
raised (since there is around 7% underreporting) using court reports and death certificates to
get the true numbers. The uncertainty margin is relatively small and mainly caused by
definition issues: foreign people having an accident on Dutch roads are registered, while
Dutch people having an accident on foreign roads are not. Therefore, registrations are not a
100% precise reflection of the Dutch population, but are a 100% reflection of the Dutch
traffic situation.
For 2020, index numbers for mobility in 2020 (Bos and Nagelhout, 2001) and an estimation
of risk development (number of victims per vehicle kilometre) are used to estimate mortality
rates; uncertainty is around 20%. This is based on a constant transport system and
composition of the traffic fleet.
Due to a lack of data (registries as well as weight factors), it was not possible to include all
possible traffic accident-related disabilities. We have included people suffering long-term
injury (longer than one year). In 1994, 6360 people are estimated to have such disability
(Ruwaard and Kramers, 1997). Using this information combined with injury incidence
numbers, prevalence of disability lasting longer than one year has been estimated for all years
in the study (assuming a constant share of long-term injuries within the total number of
injuries, a constant registration degree, constant transport system, etc). Due to estimation and
scaling errors, varying registration degrees, etc, the uncertainty range of injury estimations is
greater than for mortality (total range: 30% for injuries and 10% for mortality for the years
1980 and 2000. For 2020, this is 20% and 40% respectively) (Stichting Wetenschappelijk
Onderzoek Verkeersveiligheid (SWOV). Personal communication. Bos N, 2004).

RIVM report 500029001 page 53 of 97
Traffic prevalence data have been corrected for population size, but not for composition of
the population (ageing).
Duration The injury calculations are based on prevalence, and duration is set to one year. Duration of
mortality (loss of life expectancy) is based on the mean age of the victims. More men than
women are involved in accidents (3:1 rate) and since life expectancy for men is generally
lower than for women, this has been allowed for in the calculations. A source of uncertainty
in these estimates is the higher number of older people within the 7% of non-registered
victims.
Severity The weight factor for traffic accidents with remaining health consequences after one year is
set to 0.43, with a standard deviation of 0.15 (RIVM, 2004a).

page 54 of 97 RIVM report 500029001

RIVM report 500029001 page 55 of 97
5. Thematic results and discussion We calculated the burden of disease in the Netherlands attributable to (exposure to) air
pollution (PM10 and ozone), noise, UV, radon dampness in houses and traffic accidents as
described in the previous chapters. This chapter describes the results for each of these
environmental factors. All input and output numbers can be found in Appendix 1.
5.1 Air pollution Air pollution is one of the main environmental health issues in Europe, and PM10 and ozone
are assumed to be two of the main contributors to the air pollution-related burden of disease.
PM10 and ozone show some seasonal correlation, but on a yearly basis, concentrations are
rather uncorrelated. Most other outdoor air pollutants (e.g. NO2, CO, total suspended
particles, SO2) are highly correlated with PM10, and effects are difficult to separate.
Therefore, PM10 can be regarded as an indicator for this complex ambient air pollution
mixture.
Figure 9 and Figure 10 show the total disease burden in DALYs for long-term PM10 exposure
and short-term PM10 and ozone exposure calculated for the Netherlands.
0
5000
10000
15000
20000
25000
1980 2000 2010
DA
LY
s pe
r m
illio
n pe
ople
Figure 9 Burden of disease expressed in DALYs per million people caused by long-term exposure to PM10,
1980 – 2010, Netherlands, with 90% prediction intervals. Estimates based on calculations using a
conservative (10%) uncertainty interval for the number of years of life lost.

page 56 of 97 RIVM report 500029001
0
10
20
30
40
50
60
70
80
1980 2000 2010 1990 2000
PM10 short-term Ozone short-term
DA
LY
s pe
r m
illio
n pe
ople
Figure 10 Burden of disease expressed in DALYs per million people caused by short-term exposure to PM10
and ozone, 1980 – 2010, Netherlands, with 90% prediction intervals.
In addition to contributing to cardiovascular and respiratory disease, it is estimated that short-
term exposure to PM10 has lead to 1,200 to 2,200 deaths in the year 2000, whereas ozone may
have caused 1,200 to 2,400 deaths in that same year (both PM10 and ozone calculations based
on the individual component-models; calculations made with a 2 component-model are
presented later in this paragraph). For long-term exposure to PM10, the mortality number is
many times higher (around 12,000 to 24,000), although, as mentioned earlier, the
epidemiological evidence base for these effects is still limited. DALYs related to long-term
PM10 exposure range from 7400 to 15000 per million people for the year 2000, using a
conservative uncertainty interval (10%) for the number of years of life lost. This conservative
estimate is based on the uncertainty in the estimation of life expectancy in general.
Alternative calculations were made with an interval of 4 to 13 years, to illustrate the impact
of a greater uncertainty interval around the duration estimate. There are currently no clear cut
approaches to reliably estimate the uncertainty interval. The interval of 4 to 13 years is based
on alternative assumptions about the age-categories affected by mortality attributed to PM10.
The 4 year stems from an assumption that only older age-categories are affected,
predominantly from cardiovascular mortality. The higher estimate of 13 years assumes that
also younger age groups are affected. This wider uncertainty interval results in roughly 4,100
to 29,000 DALYs.
For the year 2000, the total number of PM10-related DALYs decreased compared to the year
1980. With the current policy, this trend will probably continue from 2000 to 2020.

RIVM report 500029001 page 57 of 97
We have calculated the PM10-related disease burden without a threshold value for PM10. We
have repeated these calculations using minimum levels of 10 µg/m3 (‘background
concentration’) and 20 µg/m3 (EU target value for 2010). Table 4 shows the impact of using
such reference levels. Since the average PM10 concentrations are decreasing over time, the
relative impact of a reference level is greatest in the year 2010: a decrease in DALYs of
around 31% for a 10 µg/m3 reference level and around 65% for a 20 µg/m3 reference level,
compared to no reference levels).
Table 4 PM10-related disease burden (DALYs per million people) using no reference level, a 10 µg/m3
reference level and a 20 µg/m3 reference level
DALYs per million people No reference level Reference level: 10 µg/m3
Reference level: 20 µg/m3
PM10 short-term exposure 1980 46 (24 – 71) 36 (19 - 59) 27 (14 – 43) 2000 33 (18 – 51) 23 (13 – 36) 14 (7 – 23) 2010 28 (15 – 44) 19 (9 – 29) 9 (4 – 15) PM10 long-term exposure * 1980 14863 (10075 – 19934) 12225 (8077 –
16721) 9379 (5914 – 13183)
2000 11163 (7437 – 15133) 8233 (5267 – 11493) 5057 (2862 – 7539) 2010 9759 (6501 – 13270) 6712 (4332 – 9421) 3406 (1781 – 5351) * DALY estimates based on calculations using a conservative (10%) uncertainty interval for the number of years of life lost.
In another alternative calculation, we have compared our short-term PM10 morbidity
calculations based on Dutch exposure-response relationships (Vonk and Schouten, 2002)
with calculations based on exposure-response estimates by Künzli (2000).
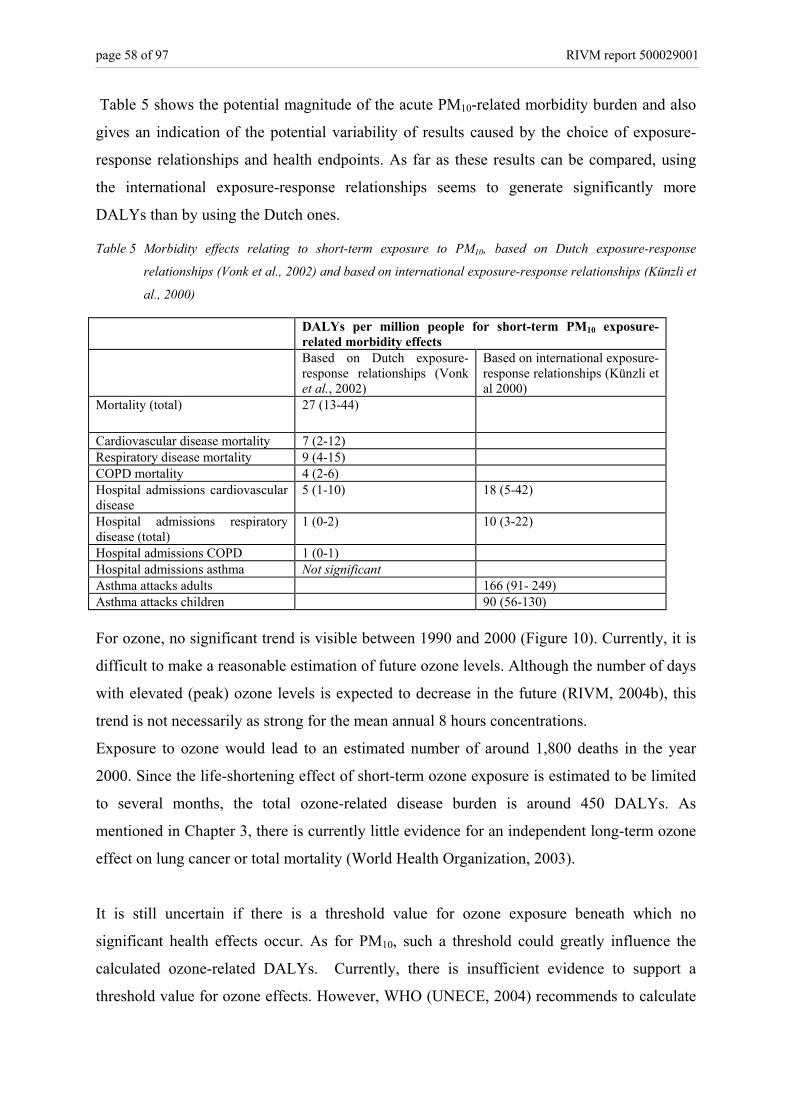
page 58 of 97 RIVM report 500029001
Table 5 shows the potential magnitude of the acute PM10-related morbidity burden and also
gives an indication of the potential variability of results caused by the choice of exposure-
response relationships and health endpoints. As far as these results can be compared, using
the international exposure-response relationships seems to generate significantly more
DALYs than by using the Dutch ones.
Table 5 Morbidity effects relating to short-term exposure to PM10, based on Dutch exposure-response
relationships (Vonk et al., 2002) and based on international exposure-response relationships (Künzli et
al., 2000)
DALYs per million people for short-term PM10 exposure-related morbidity effects
Based on Dutch exposure-response relationships (Vonk et al., 2002)
Based on international exposure-response relationships (Künzli et al 2000)
Mortality (total) 27 (13-44)
Cardiovascular disease mortality 7 (2-12) Respiratory disease mortality 9 (4-15) COPD mortality 4 (2-6) Hospital admissions cardiovascular disease
5 (1-10) 18 (5-42)
Hospital admissions respiratory disease (total)
1 (0-2) 10 (3-22)
Hospital admissions COPD 1 (0-1) Hospital admissions asthma Not significant Asthma attacks adults 166 (91- 249) Asthma attacks children 90 (56-130) For ozone, no significant trend is visible between 1990 and 2000 (Figure 10). Currently, it is
difficult to make a reasonable estimation of future ozone levels. Although the number of days
with elevated (peak) ozone levels is expected to decrease in the future (RIVM, 2004b), this
trend is not necessarily as strong for the mean annual 8 hours concentrations.
Exposure to ozone would lead to an estimated number of around 1,800 deaths in the year
2000. Since the life-shortening effect of short-term ozone exposure is estimated to be limited
to several months, the total ozone-related disease burden is around 450 DALYs. As
mentioned in Chapter 3, there is currently little evidence for an independent long-term ozone
effect on lung cancer or total mortality (World Health Organization, 2003).
It is still uncertain if there is a threshold value for ozone exposure beneath which no
significant health effects occur. As for PM10, such a threshold could greatly influence the
calculated ozone-related DALYs. Currently, there is insufficient evidence to support a
threshold value for ozone effects. However, WHO (UNECE, 2004) recommends to calculate

RIVM report 500029001 page 59 of 97
health impacts using a threshold value of 35ppb (35 ppb = 70 µg/m3), thereby ignoring health
effects that are potentially occurring below this level. In their calculations, a relative risk of
1.003 (1.001 - 1.004) for a 10 µg/m3 increase in the daily maximum 8-hour mean was used,
which is very similar to our relative risk of 1.041 (1.024-1.059) per 150 µg/m3. However,
WHO claims that ‘it (is) highly likely that the overall effects of ozone (are) underestimated
by this approach’. To apply the WHO approach, daily ozone data is needed in order to
calculate the health impacts of peak value ozone concentrations (above 70 µg/m3). For this
study, we used modelled yearly average 8-hour concentrations in the Netherlands, which, as
shown in Figure 3 are never above 70 µg/m3. Since (modeled) one hour ozone concentrations
were not available for all years, we have not calculated ozone-related mortality based on
these recent WHO assumptions within the context of this study.
We have calculated the effects of short-term peak exposure to PM10 and to ozone separately.
Only for the year 2000, a so-called 2 component-model could be used, since the available
years of data for PM10 and ozone did not overlap for the other years. This model is set up to
produce more accurate results for multi-exposure assessments and is therefore likely to
produce more correct outcomes. Calculations for the year 2000 resulted in a total estimation
of around 5,000 air pollution-related deaths, of which 2,200 to 3,500 can roughly be
attributed to PM10 and 1,600 to 3,100 to ozone. Using the 1 component-models, a total of
some 3,500 air pollution deaths were estimated for that same year. The discrepancy between
these two numbers is some 40% and should be considered while interpreting results. The
difference is possibly caused by the fact that the covariance structure has not been taken into
account in the individual calculations. Furthermore, a possible explanation for this
discrepancy is the difference in the way the relative risks were calculated. For the individual
models, daily concentrations have been related to the health effects of the day after the
exposure (lagtime 1). For the 2 component-model, mortality numbers have been related to
mean weekly concentrations. Several studies have shown that more days averages correlate
better with mortality than single day exposures. This suggests that the effects of air pollution
aggregate over air pollution levels of several days. Consequently, the 2 component-model,
using weekly average values, will lead to higher mortality numbers than the estimates based
on the individual models.
Overall, the effects of air pollution are considerable, and can affect the entire population,
although some groups such as children and elderly are especially vulnerable. Our calculations

page 60 of 97 RIVM report 500029001
might underestimate the real burden of disease, since not all health responses could be
included completely. For example, the long-term effects of PM10 are based on mortality
numbers alone, while long-term PM10 exposure may also lead to increased morbidity (i.e.
respiratory diseases). However, valid exposure-response relationships are currently
unavailable (RIVM. Personal communication. Fischer P. 2005). As for the acute effects of
PM10, we could take into account more health effects, because more research has been done
on this subject. However, we could only use hospital admission numbers, thereby not
including morbidity effects of a less severe degree. The ozone-related burden of disease is
only based on mortality numbers, since valid and positive exposure-response relationships for
morbidity effects were not found in the latest Dutch study (Vonk and Schouten, 2002). This
does not necessarily mean, however, that effects on morbidity do not occur. For example,
days with elevated ozone concentrations have been linked to effects such as a decrease in
lung function. An estimated 10 percent of children from 7 to12 years old have a decreased
lung function on at least one day in summer, due to smog (RIVM, 1997). Due to the lack of a
suitable weighting factor this effect has not been included in the DALY calculations.
On the whole, long-term effects of PM10 (as indicator for a complex urban mixture of air
pollutants) are probably most hazardous and hardest to avoid. Several policy interventions are
aiming to reduce air pollution and have been quite successful in the past. However, continued
efforts are necessary, especially on an international scale (RIVM MNP, 2004). The European
Union has set a target PM10 value of 20 µg/m3 in 2010. Reducing PM10 levels to this level
would significantly benefit health and reduce the health burden by 35% according to our
calculations, assuming a proportional reduction in the causative fraction of the PM10 mixture.
However, in the Netherlands it is highly unlikely this target will be reached, even at high
costs (Beck et al., 2003).
5.2 Noise Exposure to noise, and consequent annoyance, sleep disturbance or even cardiovascular
problems, is a significant problem in the crowded country of the Netherlands. Figure 11
shows the estimated noise-related disease burden, which has increased and will probably
continue to increase: the burden will probably have risen by 20% in 2020 (compared to the
year 2000). Although the majority of DALYs is attributable to annoyance and sleep
disturbance, we have calculated that 110,000 to 270,000 people may have hypertension

RIVM report 500029001 page 61 of 97
which can be attributed to noise exposure in the year 2000. Hypertension can potentially lead
to cardiovascular disease. We have estimated that around 600 people may have died due to
noise induced cardiovascular diseases in the year 2000, accounting for around 400 DALYs
per million people. Due to the exposure range of the relative risk, people exposed below
55 dB have not been included in these calculations. This cut-off point can significantly
influence the results. As an illustration, Table 6 shows the outcomes of earlier calculations
(Van Kempen et al., 2001) investigating the effect of such a cut-off point on the estimated
magnitude of some road traffic noise related effects. It might be useful follow-up research to
repeat these calculations using more varying cut-off values (60 or 70 dB(A), for example).
The same study (Van Kempen et al., 2001) also showed that the investigated noise range and
the composition of the population under investigation can affect these type of outcomes.
Table 6 The influence of a cut-off point on the number of myocard infarcts and ischemic heart disease
cases, attributable to road traffic noise (Van Kempen et al., 2001)
Cut-off point (dB(A)) 50 dB(A) 53 dB(A) 55 dB(A) Myocard infarct 1982 (0-51119) 1081 (0 – 2869) 469 (0 – 1299) Ischemic heart diseases 2644 (1485 – 3764) 1478 (815 – 2143) 66 (357 – 993)
Policy interventions aiming to reduce noise exposure have been relatively effective in the
past. Noise barriers, the introduction of porous road surfaces and speed limitations, along
with more stringent test requirements for road traffic, have restricted the increase of noise-
related DALYs for the 1980-2000 period. However, with current policy, the disease burden
will increase in the upcoming years. Therefore, measures aiming to reduce noise exposure
could be useful. Decreasing noise levels by around 5 dB for every source by 2020 could
almost half the number of annoyance and sleep disturbance-related DALYs (Figure 12). This
reduction could potentially be achieved by implementation of the use of silent tires, sound
absorbing pavements and speed limitations (at highways, provincial- and municipal roads);
and more silent break systems and rail construction for rail traffic. Since road traffic has the
biggest share in the traffic-related disease burden, this would be an important source to
tackle.

page 62 of 97 RIVM report 500029001
0
1000
2000
3000
4000
5000
6000
7000
1980 2000 2020
DA
LY
s pe
r m
illio
n pe
ople
Figure 11 Burden of disease in DALYs per million people caused by exposure to noise, 1980 – 2020, with
90% prediction intervals.
0
500
1000
1500
2000
2500
1980 2000 2020 2020; 5dBreduction
DA
LYs
per m
illio
n pe
ople
Road trafficRail trafficAir traffic
Figure 12 Burden of disease in DALYs per million people caused by severe annoyance or severe sleep
disturbance due to road, train and air traffic noise, for 1980, 2000 and 2020, including an alternative scenario for 2020 (with a 5dB noise exposure reduction for road and rail traffic).
Alternatively, we have calculated noise-related annoyance and noise-related sleep disturbance
using prevalence estimates from a recent survey on environment-related annoyance and
quality of life (Franssen et al., 2004). These results vary greatly from the results based on the
exposure-response relationships derived by Miedema et al. (2001).

RIVM report 500029001 page 63 of 97
Table 7 DALYs for severe noise annoyance and severe sleep disturbance, based on exposure-response curves (Miedema,2001) and based on a survey (Franssen et al., 2004)
DALYs per million people Miedema exposure-response curves (Miedema, 2001), year : 2000
Environment-related annoyance and quality of life survey (Franssen 2004), year: 2003
Road 1,122 (441 – 2,753) 7,604 (3,119 – 18,387) Air 16 (6 – 38) 314 (129 – 761)
Severe annoyance
Rail 65 (24 – 158) 524 (215 – 1,268) Road 526 (189 – 1291) 3045 (1,298 – 7,029) Air - 761 (324 – 1,757)
Severe sleep disturbance
Rail 32 (10 – 80) 253 (108 – 586)
The variability of the outcomes is shown in Table 7. Even though basic assumptions and
principles differ (for example, the noise maps are mainly based on car traffic, while the
survey concludes that moped noise is the biggest contributor to the annoyance measured in
their study), the difference in outcomes remains considerable. Most outcomes differ by a
factor of around 8, with the exception of severe annoyance from air traffic noise, where the
survey results are 19 times higher than the ones based on the EU recommended curves by
Miedema, Statistics Netherlands (CBS) reports annoyance in a different way than the
previously described studies. As part of a permanent investigation of the quality of life in the
Dutch population (Centraal Bureau voor de Statistiek, 2005), they report for the year
2001/2002 that 6.4% (+/- 0.2) of the population is annoyed (not necessarily severely and
based on different survey questions) by road traffic noise, which corresponds to some
64,000 people per million.
The large fluctuations in annoyance estimates can mainly be ascribed to disparities in
methodologies and definitions. As the questions and aim of the Statistics Netherlands
research differs from the other studies, results are incomparable.
In the survey by Franssen et al. (2004), effects were addressed per traffic source and in a
representative sample of the population, whereas the EMPARA model only gives estimations
of the total transportation-related noise exposure for the whole population. Furthermore, the
applicability of the studies underlying the estimation of the exposure-response relationship by
Miedema et al. (2001) can be debated: some seem rather outdated or were executed in a very
different context (Van Kempen, 2005). Other factors that potentially influence the validity of
our results include incorrect exposure measurements, or the fact that the (recent) surveys are

page 64 of 97 RIVM report 500029001
held at places where there is increased sensitivity to noise or an ongoing political debate,
which influences peoples emotions and thereby perhaps the annoyance reporting frequency.
As explained earlier, we have used the results based on the exposure-response relationships
by Miedema in our final DALY figures.
As for air traffic-related annoyance, our results probably underestimate the real number of
people being annoyed, since recent annoyance measurements around Schiphol airport
(Breugelmans et al., 2005) indicate a higher number of severely annoyed people (13%) than
based on the Miedema relations. Results from former studies around Schiphol airport are not
included in the Miedema relations, since the situation around Schiphol airport was not judged
sufficiently stable (Ministerie van Verkeer en Waterstaat, 2000). In future studies, the recent
exposure-response relations for annoyance and sleep disturbance based on data gathered
around Schiphol (Breugelmans et al., 2005) might be more suitable for estimating the air
traffic noise-related disease burden in the Netherlands.
It is uncertain whether our outcomes are more likely to under- or overestimate the real noise-
related burden of disease. Effects such as cognition could not be included. Furthermore, air
traffic results are incomplete due to the fact that we didn’t assess air traffic-related sleep
disturbance and the relationships we used for noise annoyance (Miedema, 2001) might not be
completely applicable to the Dutch situation. Also, air traffic-related annoyance is only based
on exposure data from the area around Schiphol (main airport). These shortcomings point to
potential underestimation of the noise-related disease burden. This corresponds with the fact
that the DALY calculations based on the survey data are significantly greater than our
estimates based on the curves by Miedema. However, since the magnitude of the effect of
noise on cardiovascular diseases is still being debated, and since the qualification of
annoyance and sleep disturbance as health effects can be contested, our outcomes could also
be overestimates.
With regard to the estimated trends, the increasing number of people being annoyed and sleep
disturbed can obviously be attributed to the rising noise levels. However, another aspect, not
included in this study, could also affect the number of people being annoyed. Guski (2004)
has suggested there is a possible trend in the number of people that experience annoyance at a
certain noise level. This assumption is based on preliminary research, in which a constant
percentage of 25% of respondents being highly annoyed by air traffic noise was found at

RIVM report 500029001 page 65 of 97
lower day/night noise levels over a time period of around 30 years. This would imply that
people are getting annoyed more quickly. If this is an actual trend, this would mean for our
study that more people than we have estimated might be annoyed in the future.
5.3 Radon It is estimated that around 800 people died from radon induced lung cancer in the year 2000.
This number is expected to increase because the average indoor radon concentration is still
increasing as a result of better isolation, often combined with less ventilation (RIVM, 2004a).
In 2004, a policy has been developed to achieve a stand-still situation of indoor radon
concentrations in new dwellings. Our prognosis for the year 2020 is based on the assumption
that this policy will be effective and that the radon level in new houses will remain at the
level of the year 2000. But despite this policy effort focused on new dwellings, indoor radon
concentrations for an average Dutch dwelling will continue to rise during the coming decades
as a result of the replacement of old dwellings (with low indoor radon concentrations) with
new dwellings (with relatively high indoor radon levels).
Females generally lose more healthy life years due to lung cancer than males do (in the year
2000, the lung cancer induced loss of life expectancy was 11.4 and 14.3 years for males and
females respectively). However, this increase may partly be an artefact, since it is attributable
to the assumption that radon-related deaths have the same age and gender specific incidence
as lung cancer deaths in the general population, which might not necessarily be true,
particularly since the exposure-response relationships have been derived from studies among
mine workers, a predominantly male group.

page 66 of 97 RIVM report 500029001
0
500
1000
1500
2000
2500
1980 2000 2020
DA
LY
s pe
r m
illio
n pe
ople
Figure 13 DALYs per 1.000.000 people for lung cancer mortality due to radon exposure, 1980 – 2020, with 90% prediction intervals.
The radon-related disease burden can be significant and may increase over the coming
decades. Radon occurs naturally and the policy to build low-energy dwellings may lead to
insufficient ventilation. Although the building of energy-efficient dwellings with adequate
ventilation is possible, this involves extra costs. Finally, the behaviour of the occupant also
affects the radon exposure. A covenant with the construction sector and a national call for
adequate ventilation may reduce or reverse the increase.
5.4 UV In the year 2000, around 130.000 people had a diagnosed form of some type of skin cancer in
the Netherlands. Practically all of these cases are attributable to UV exposure. Since data
about changing UV intensity or sunbathing behavior were not included in the calculations,
mainly because of lack of information on sunbathing behavior and the latency time, this
number is the same for 1980 and 2020 when imposed on the population of the year 2000.
Based on our calculations it is not possible to make statements about trends in UV-related
burden of disease that relate to actual changes in exposure.
Looking at trends in UV doses, the average dose in 2002 was 7% higher than in 1980, mainly
due to degradation of the ozone layer ((RIVM MNP and CBS and Stichting DLO, 2003b). In
time, this will probably lead to additional cases of skin cancer (Kelfkens, 2002). The increase
in UV levels in the 90’s are expected to lead to 2,000 to 3,000 additional skin cancer cases, of

RIVM report 500029001 page 67 of 97
which 40-50 are estimated to die from the skin cancer. When current policy measures are
implemented and maintained, the ozone layer is expected to slowly recover. In that case, the
extra number of skin cancer cases will probably be reduced to 1,500 to 2000 by the middle of
the century (Pruppers et al., 2001). These data, however, were not usable for DALY
calculations, since effects are estimated to mainly take place beyond the time frame of our
study.
Although we did not include potential trends in UV exposure in our calculations, we could
investigate the effects of changes in population composition (age en gender) by not using the
standard year 2000 population (as has been done for all other calculations) but instead using
the actual population numbers for 1980 and 2020. Figure 14 shows the UV-related disease
burden per million people, including effects of changes in population composition (age and
gender), which leads to a significant increase in the number of DALYs per million people.
0
500
1000
1500
2000
2500
1980 2000 2020
DA
LY
s pe
r m
illio
n pe
ople
Figure 14 DALYs per 1.000.000 people for skin cancer mortality and morbidity due to UV exposure, 1980 –
2020, including demographic changes (not corrected for population composition), with 90% prediction intervals.
The burden of disease related to UV exposure lies somewhere between 900 and
1,600 DALYs per million people (year 2000). This could be an underestimation, since
incidence data from the Dutch Cancer Society (KWF Kankerbestrijding, 2004) lie higher than
incidence data from the Dutch Cancer Registry (the source of our prevalence data) (Table 8).
This could lead to potential underestimation of 13 to 37%.

page 68 of 97 RIVM report 500029001
Table 8 Skin cancer incidence data from the Dutch Cancer Society and the Dutch Cancer Registry, year 2000
Incidence Dutch Cancer Society Dutch Cancer Registry Basal cell carcinoma
17,500 11,000*
Squamous cell carcinoma
5,000 3,168
Melanoma 2,500 2,168 Total 25,000 16,336 * Estimated by multiplying squamous cell carcinoma incidence with a factor 3.5 (factor based on data from the Dutch Cancer Society).
Additionally, we have made the DALY calculations using incidence instead of prevalence
data (Table 9). DALY estimates based on incidence lie 29 – 39% higher than those based on
prevalence data. This difference is caused by the fact that in the incidence based calculations,
all incident cases that survive the year under study are considered skin cancer cases for the
rest of their lives. Since some people will cure, this duration will be an overestimation,
thereby overestimating the DALY outcomes.
Table 9 UV-related DALYs per million people, uncorrected for population composition (ageing), using prevalence and incidence data.
DALYs per million people, uncorrected for population
composition Based on: Prevalence Incidence 1980 998 (557 – 1,492) 1,385 (980 – 1,841) 2000 1,289 (757 – 1882) 1,728 (1,255 – 2,248) 2020 1,762 (1,054 – 2,550) 2,267 (1,686 – 2,951)
Even though it is difficult to calculate UV-related disease burden and trends are hard to
assess, the continuing degradation of the ozone layer, potentially combined with more
careless sunbathing behaviour and more frequent travels to exotic countries, will probably
keep skin cancer on the public health agenda for the upcoming decades.
5.5 Indoor dampness In the year 2000, 120 DALYs per million people were estimated due to indoor dampness
(Figure 15). Although relatively similar numbers of children (<15 years old) and adults have

RIVM report 500029001 page 69 of 97
asthma, the fraction of cases that is potentially related to dampness is higher for children, so
children contribute more to the total disease burden (see Appendix 1).
The indoor dampness-related disease burden (74-214 DALYs per million people in the year
2000) is expected to decrease in the future. However, in the long run, this trend might change
due to increasing isolation influencing natural ventilation, but this trend is not yet visible
(Van Veen et al., 2001). Also, background asthma incidence is increasing, which, provided
exposure-response relationships are constant, would lead to higher estimates of indoor
dampness-related effects.
0
50
100
150
200
250
300
350
400
1980 2000 2020
DA
LY
s pe
r m
illio
n pe
ople
Figure 15 DALYs per 1.000.000 people for indoor dampness-related asthma, with 90% prediction intervals.
5.6 Traffic accidents Traffic accidents cause a significant part of the burden of disease as calculated in this study.
Even though traffic accidents might not be considered environmental, they are nonetheless
useful to put the other environmental factors in perspective.
The traffic accident-related disease has declined in the past and will probably continue to
decline in the future (8,000 DALYs in 1980 to less than half of that in 2020, Figure 16)
because the decrease in risk (safer cars) will probably exceed the increase in mobility. This is
based on historical trends and can partly be explained by the fact that the greatest increase in
mobility will take place on the safest roads.

page 70 of 97 RIVM report 500029001
0
2000
4000
6000
8000
10000
12000
1980 2000 2020
DA
LY
s pe
r m
illio
n pe
ople
Figure 16 DALYs per 1.000.000 people for mortality and severe injuries (health consequences > one year) caused by traffic accidents, 1980 - 2020, with 90% prediction intervals.
The traffic accident-related disease burden is relatively high due to the fact that, although
only a relatively small number of people are involved in traffic accidents, their average age is
considerably lower than i.e. the age of people dying from a cardiovascular disease. Therefore,
more years of healthy life are lost in traffic accidents, contributing to a greater disease
burden. For example, in the year 2000, 73 people per million inhabitants died due to a traffic
accident, which adds up to almost 2,700 DALYs per million for mortality alone. Including
injuries, total disease burden equals almost 5,000 DALYs per million people.
The outcomes will probably be underestimates, since injury has only been included when
persisting after one year. In the year 1994, 6,360 people were assumed to have such long
lasting injury (prevalence). However, the total incidence of traffic injuries in that year was
around 120,000 (Stichting Wetenschappelijk Onderzoek Verkeersveiligheid (SWOV).
Personal communication. Bos N, 2004). Therefore, many injuries with less severe
consequences could not be included due to a lack of appropriate data.

RIVM report 500029001 page 71 of 97
6. Overall results and discussion
6.1 Implications of the results
We have estimated the disease burden attributable to exposure to some environmental factors.
In previous sections, results have been discussed per environmental factor. However, one of
the reasons to calculate DALYs is to enable comparisons between these different factors.
When we do so, it becomes clear that among the investigated factors, the (relatively
uncertain) effects of long-term PM10 exposure currently generate most DALYs followed by
traffic accidents, noise, UV and radon (Figure 17). The uncertainty interval around the long-
term PM10-related disease burden as presented in the figure is probably rather conservative,
since we have used a standard 10% uncertainty interval for the number of years of life lost
(10 years +/- 10%), which is relatively small given the overall uncertainty of the health
effects of long-term PM10. Using a greater and potentially more realistic uncertainty interval
of 4 to 13 years results in a disease burden ranging from 4,100 to 29,000 DALYs. This
alternative interval is based on varying assumptions regarding the age categories (whole
population or only elderly people) that are affected by long-term PM10-related mortality.
However, these calculations are merely an illustration, as it is currently unclear what the
uncertainty interval should look like.
The substantial impact of noise is due to the large number of people exposed to noise.
Relatively small effects (not shown in Figure 17 because of the scale of the y-axis) can also
be attributed to the short-term effects of PM10 and ozone exposure and to indoor dampness
exposure (Figure 18). Because of the great variety in outcomes, results could not be displayed
meaningfully in one graph using standard linear scaling. A graph with a logarithmic scale
displaying all results together is presented in Appendix 2.
Trends The number of DALYs related to noise and traffic accidents are likely to become more
similar in the year 2020, due to an increasing disease burden for noise and a decreasing
disease burden for traffic accidents. DALYs related to long-term exposure to PM10 are many
times higher than DALYs related to short-term PM10 exposure (acute effects). Both are
slowly decreasing over time because PM10 levels are expected to decrease. DALYs related to
radon exposure slowly increase over time, because the overall level of radon and its decay
products is expected to increase.

page 72 of 97 RIVM report 500029001
0
5000
10000
15000
20000
25000
1980
2000
2010
1980
2000
2020
1980
2000
2020
1980
2000
2020
1980
2000
2020
PM10 long-term
Noise Radon UV Trafficaccidents
DA
LY
s pe
r m
illio
n pe
ople
Figure 17 Estimation of the environment-related disease burden (in DALYs per million people) for the period
1980 – 2020: PM10 (long-term exposure; using a conservative (10%) uncertainty interval), noise,
radon, UV and traffic accidents, with 90% prediction intervals. DALYs are corrected for population
size and composition (standard population 2000).
PM10, long-term based on mortality, using a conservative (10%) uncertainty interval for the number of years of life lost. Noise based on severe annoyance (road/rail/air traffic), severe sleep disturbance (road/rail) and mortality due to hypertension (for all traffic sources) Radon based on lung cancer mortality UV based on skin cancer (morbidity and mortality) Traffic accidents based on mortality and disability (>one year)

RIVM report 500029001 page 73 of 97
0
50
100
150
200
250
300
350
400
1980 2000 2010 1990 2000 1980 2000 2020
PM10 short-term Ozone short-term
Indoor dampness
DA
LY
s pe
r m
illio
n pe
ople
Figure 18 Estimation of the environment-related disease burden (in DALYs per million people) for the period
1980 – 2020: PM10 (short-term effects), ozone (short-term effects) and dampness in houses, with
90% prediction intervals. DALYs are corrected for population size and composition (standard
population 2000)
PM10, short-term effects based on mortality and hospital admissions for respiratory and cardiovascular diseases Ozone, short-term effects based on mortality and 3-year mean annual 8 hour ozone concentrations. Dampness in houses based on (aggravation of) asthma
Environmental disease burden The ‘total’ disease burden in the Netherlands in the year 2000 is estimated to be at least
2.9 million DALYs (RIVM, 2004a). This estimate is based on data for 53 diseases that
represent around half of the doctors diagnoses, 70% of mortality and 65% of the health care
costs. For 7 of these diseases, no epidemiological evidence was available to calculate the
disease burden (Hoeymans and Poos, 2002). Some other diseases have been split up in
different subsets. In total, 49 (groups of) diseases are included in the calculation of this ‘total’
disease burden. Therefore, 2.9 million DALYs will be a significant underestimation of the
total disease burden (based on the coverage of the estimate, the total might be over 4 million
DALYs).
If this minimal number is regarded as the total disease burden, the health impacts of air
pollution, noise, radon, total UV and damp houses contribute to around 6 to 13% (assuming
no thresholds for PM10 and ozone effects) of this ‘total’ disease burden in the Netherlands in

page 74 of 97 RIVM report 500029001
the year 2000. If the total disease burden is over 4 million DALYs, a similar calculation
results in an environmental impact of 4 to 9% (again, assuming no threshold for PM10 and
ozone effects). The effects of long-term exposure to PM10 contribute to almost 70% of the
total environment-related disease burden. However, the evidence base for long-term PM10
effects is very limited to date (see paragraph 4.1) and this percentage is based on calculations
made without reference levels. Assuming a 20 µg/m3 reference level results in a 50%
contribution of long-term PM10 to the environment-related disease burden, which then
accounts for 3 to 9% of the total disease burden. When excluding the effects of long-term
PM10 exposure – and therefore only including those environmental health relations for which
scientific consensus is judged reasonable to good – the environment-related percentage of the
2.9 million DALYs is 2 – 5 %. Percentages are rough estimates that should be interpreted
with caution.
The calculations above are based on the total effect each environmental factor has on public
health and not only the human-induced portion of the effects. For instance, UV radiation is
only for a small fraction human-induced (due to ozone layer degradation), but mainly occurs
naturally. The most noticeable effects of ozone layer degradation on UV induced skin cancer
prevalence will start to occur in 2030 to 2050 (RIVM. Personal communication. Kelfkens G.
2005), so UV-related disease burden to human activities is minimal in the timeframe of our
study. PM10 also occurs naturally, although the greatest part is human induced, especially in
urban areas. Noise is (almost) completely due to human activities. Housing conditions, which
affect radon concentrations and indoor dampness, are partly structural and partly influenced
by human behaviour. On most of these issues, consensus on the anthropogenic part is lacking,
and therefore it is difficult to estimate the total effect of human activities on the
environmental disease burden.
One of the main issues is that we have only included a limited set of environmental factors in
our study (based on the priority areas of the MNP and availability of data). For example, we
did not include the health impacts of certain chemicals (i.e. lead, cadmium, benzene, PAH,
dioxins; the effects of which are probably very small), or potential annoyance caused by
odours. Furthermore, for the effects of housing, we only investigated the potential effects of
indoor dampness on asthma, thereby not including other housing factors, such as dust, dust
mites, and environmental tobacco smoke. Other calculations (Ruwaard and Kramers, 1997)
have estimated for the year 2000 that around 26,000 DALYs can be attributable to total

RIVM report 500029001 page 75 of 97
indoor environment-related asthma, which corresponds to more than 1,600 DALYs per
million people. This might, however, be an overestimation, since 70% of all asthma cases are
presumed to be housing-related, which seems a rather large percentage given the genetic and
other possible causes of asthma. As for environmental tobacco smoke (ETS), an important
indoor air pollutant, it is estimated by the Health Council (Gezondheidsraad, 2003) that
passive smoking may annually lead to hundreds of lung cancer deaths, thousands of
cardiovascular deaths, around ten cases of sudden infant death syndrome and several tens of
thousands of cases of respiratory tract disorders in children.
6.2 Uncertainty
In our results, uncertainty can be caused by the (lack of) scientific consensus on the causal
relationship between the environmental factor and the health effect; the choice of studies and
numbers used in the calculations; and the uncertainty within these studies and numbers.
Scientific consensus
Within the complicated and only partly understood context of environmental pollution, and
the equally complex matter of health and diseases, it is difficult to be certain about potential
environment and health relationships. Epidemiological and toxicological research aims to
elucidate these potential linkages. However, often evidence is insufficient, inconclusive or
very diverse. Sometimes scientific consensus is not reached, in which case we have used
expert judgements in order to decide whether a relationship is plausible enough and which
exposure-response relationships would be best to use. We have based our calculations on
authoritative consensus documents where possible (e.g. WHO, Dutch Health Council, peer
reviewed analyses).
Of the investigated factors, the health effects due to long-term exposure to PM10 are probably
most controversial. Although results of most studies point into the same direction (paragraph
5.1), the knowledge base for these effects is still relatively limited and relationships are based
on American studies, which might not be completely transferable to the Dutch situation
(Buringh and Opperhuizen, 2002). Also, the estimate of the number of years of life lost due
to long-term PM10-related mortality is not sufficiently clear yet. In our calculations, we have
used an estimate of 10 years of life lost (Künzli et al., 2001; WHO, 2005; AEA Technology,
2005), using a conservative uncertainty interval based on general uncertainty in life

page 76 of 97 RIVM report 500029001
expectancy tables. However, it is as yet unclear whether these estimations of (uncertainty
around) the years of life lost are completely applicable to long-term PM10-related mortality.
Therefore, uncertainty is potentially greater, which is why we have made alternative
calculations with a greater uncertainty interval around the duration estimate (4 to 13 years).
This interval is based on alternative assumptions about the age-categories affected by
mortality attributed to PM10: only older age-categories or younger age groups as well. These
alternative calculations indicate the great influence of assumptions on DALY output, and the
necessity to interpret results with caution.
The effects of short-term exposure to PM10, on the other hand, have been studied in numerous
research projects (Buringh and Opperhuizen, 2002). Although one single best exposure-
response relationships for short-term PM10 exposure for all countries and contexts does not
exist, causality of the relationship may be assumed, based amongst other things on the
Bradford Hill criteria for causality.
Short-term exposure to ozone has also been related to various health effects (Buringh and
Opperhuizen, 2002). The fact that ozone exposure is associated with mortality implies that
there probably also will be a relation between ozone exposure and some form of morbidity,
assuming that people will be sick before they die. However, most recent Dutch studies do not
yield significant relationships for morbidity effects of ozone exposure (Vonk and Schouten,
2002) so scientific evidence is inconclusive. Also, evidence for effects of long-term exposure
to ozone is ambiguous (World Health Organization, 2003).
For noise, virtually no one denies people can be annoyed by noise. However, the opinions on
whether annoyance or sleep disturbance can actually be considered health effects vary (De
Hollander, 2004). Clinical effects, such as effects on the cardiovascular system, are more
generally accepted as health effects. However, these effects have been investigated by only a
small number of epidemiological studies.
Although the effects of UV are not easy to quantify, there is no debate on the causality of UV
exposure and skin cancer, so scientific consensus is considerable in that respect. For radon,
the other form of radiation we have studied, scientists agree that a relation between radon and
lung cancer, especially in combination with smoking, is highly likely (Gezondheidsraad,
2000). The existing relationships, however, are based on American studies with mine

RIVM report 500029001 page 77 of 97
workers, who were exposed to extremely high radon concentrations. These data have been
(linearly) extrapolated in order to gain exposure-response relations for low radon
concentrations. Whether this assumption of linearity is valid, however, is not yet completely
certain (Gezondheidsraad, 2000).
Finally, for indoor dampness scientific consensus exists for the causality with (aggrevation
of) asthma; a relationship which has been shown in numerous studies (Van Veen et al.,
2001), however, robust exposure- response relationships have not been derived yet.
The disease burden that can be related to environmental factors for which the consensus on
causality is at least reasonable (short-term PM10 and ozone exposure, noise annoyance and
sleep disturbance, UV, radon and indoor dampness) is estimated to lie between 2 and 5 %
(based on a ‘total’ disease burden of 2.9 million DALYs). When noise-related annoyance and
sleep disturbance are not considered ‘health effects’, the contribution to the disease burden of
the remaining environmental factors lies between 1 and 2 %.
Choices and assumptions When starting a DALY exercise, many choices have to be made. Which environmental
factors shall we include? Which health effects should be considered? Which data should be
used: Prevalence or incidence? National or international exposure-response relationships?
Modelled or measured concentrations? In this report, we have described our decisions
regarding such choices. We have tried to maintain consistency across topics, but this could
not always be achieved due to e.g. lack of relevant data.
We analysed the effects of such decisions on the DALY output by doing some alternative
calculations. For example, using incidence instead of prevalence data for the UV calculations
changed the DALY output by 29 to 39%. Using a different, international exposure-response
relationship for the DALY calculation of some of the effects of short-term PM10 exposure
resulted in up to 10 times higher output estimates for the short-term PM10 DALY’s. Similarly,
the use of noise annoyance prevalence data based on measured values produced DALY
outcomes that were factors higher than those based on modelled estimates. Using a

page 78 of 97 RIVM report 500029001
2 component-model for PM10 and ozone instead of 1 component-models gave different
DALY outcomes and we have also seen that the choice of a reference value for noise and for
PM10 exposure greatly influenced the results.
Data uncertainty Once it has been decided which studies and data to use for the calculations, it is important to
consider the uncertainty within these values. We have accounted for this uncertainty by
carrying out a Monte Carlo analysis, thereby being able to show the potential range of our
outcomes. The input data for such an analysis are not always directly available. Data such as
exposure-response relationships or weight factors usually come with an estimated confidence
internal. However, for other input data, such as prevalences or duration (years of life lost),
these type of intervals or not always available and sometimes need to be estimated by experts.
Furthermore, once uncertainty ranges are clear, the form of the probability curve should fit
with the conditions of the variable, which also has to be assessed. The uncertainty ranges
given therefore only give a general indication of the uncertainty in the underlying data.
The variations in the input data have an equal impact on the output, since DALY calculations
essentially consist of a series of multiplications. The relative variation in some input numbers
can be much greater than in others. For example, changing a weight factor from 0.01 to 0.02
(which can be done for noise annoyance) means a 100% change in the output, while changing
it from 0.6 to 0.7 for a health endpoint with a more severe impact on quality of life, only
causes a 16% change. In general, variations in relatively small numbers such as severity
weights have a bigger impact on the output than variation in relatively large numbers such as
most prevalence and concentration data. Therefore, in order to decrease the variation in
DALY outcomes, research should focus on reducing uncertainty in input data that have
relatively large variation. Paragraph 6.6 will further comment on recommendations for future
research, by which the limitations of DALYs can be reduced.
6.3 Other burden of disease studies
Several global as well as national and more regional burden of disease studies have been
undertaken in recent years, some of which focused specifically on the potential
environmental impact on this burden (Prüss et al., 2001). Environmental health impact

RIVM report 500029001 page 79 of 97
assessment can be addressed in different ways, which can generally be divided into two
approaches: exposure-based and outcome based (Prüss et al., 2001). The exposure-based
approach, which was used in our study, uses population exposure data and exposure-response
relationships in order to estimate the number of disease cases attributable to certain
environmental factors. In contrast, the outcome-based approach uses the disease burden as a
starting point and estimates the fraction potentially attributable to the environmental factor.
The latter approach is more suitable for diseases that are predominantly related to one
specific risk factor, while the exposure-based approach can be used to assess broad, large
scale and non-specific environmental health relationships (Prüss et al., 2001).
We have used the exposure-based approach and focused on the most prominent
environmental health problems in the Netherlands, using the most recent relevant data
available. Some of our results vary somewhat from earlier calculations in the Netherlands (De
Hollander et al., 1999), since we had a slightly different aim (trend analysis) and we made
other assumptions, based on newer insights. In some cases (such as the effects of short-term
PM10), the difference in outcomes was due to the use of a different relative risk or different
prevalence estimates (i.e. for hospital admissions for respiratory diseases). Other reasons
include different exposure levels (i.e. ozone), different overall calculation (i.e. mortality due
to noise exposure) or different estimations of the duration of the health effects. These
differences underline the difficulties in consistently calculating DALYs and comparing
results from different studies, and the need for generally approved methods and baseline data
(such as exposure-response relationships).
The same sorts of discrepancies exist between studies from different nations. For example,
Belgian estimates (Torfs, 2003) would be expected to match relatively well with the Dutch
estimates, since both countries have a lot in common with regard to the main environmental
health problems. However, comparing results leads to some differences, with Dutch PM10-
related disease burden being more than twice as high as the Belgian estimates (mainly due to
a different set of health end points and part of the Belgian calculations being based on PM2.5),
and ozone-related disease burden being higher in Belgium (the latter caused by the fact that
Belgium included morbidity effects related to ozone, where we only included mortality). As
long as DALY calculations are not standardised, it is probably more useful to compare
exposure data instead of DALYs when comparing countries (for only one pollutant).

page 80 of 97 RIVM report 500029001
These consistency problems are not restricted to relatively small scale national studies. The
variation in the various global burden of disease estimates is also considerable. Where Smith
et al. (1999) estimated 25-33% of the global burden of disease to be attributed to
environmental risk factors using an outcome-based approach, Murray and Lopez (1999)
concluded, based on the data they used for the Global Burden of Disease study, that some
16% of the total worldwide DALYs could be attributed to malnutrition, almost 7% to poor
water and sanitation and 0.5% to air pollution. Prüss et al. (2001) estimated the contribution
of water, sanitation and hygiene to the global burden of disease to be around 5.7%, while
Briggs et al. (2003) found environmental and occupational pollution (water, sanitation and
hygiene; outdoor air pollution; indoor smoke; lead; and occupational carcinogens, airborne
particles and noise) responsible for 8-9% of the total disease burden, based on data from
Ezzati et al. (2002). An outcome-based environmental health impact assessment by Melse
and Kramers (1998) concluded that up to 11% of the global burden of disease could be
environment-related (narrowing it down to 2-5% in OECD countries).
Since each study investigated different aspects of the environmental disease burden, results
are incomparable. Most of the differences in the outcomes can be traced back to the
fundamentals of the research: which definitions are being used for ‘environment’ and
‘health’, which assumptions underlie the calculations, which models and which baseline data
have been used? The outcomes can therefore not be interpreted as isolated numbers, but only
make sense in view of the context and underlying assumptions of the calculations.
Comparisons of numbers from different studies should be made with great caution.
A current research project (RIVM, not yet published) aims to assess which factors
specifically have led to the variations in these various studies. Results of this project will be
very useful for discussion and interpretation of burden of disease studies.
6.4 The DALY debate
Since the introduction of the DALY to measure the burden of disease, there has been a lot of
discussion on its advances and limitations. The main issues are described in the following
paragraphs.

RIVM report 500029001 page 81 of 97
Ethics of severity weights The very concept of attributing severity weights to health states has been criticised. Critics
say that severity weights assume that life of a disabled person has less value than that of a
healthy person. Taken to the extreme, this could theoretically lead to reasoning that disabled
people are less entitled to scarce health resources that would extend their lives (such as
preventive medicine) than healthy people (Arnesen and Nord, 1999).
Limitations of severity weights Severity weights value a certain health state in relation to an ideal state of good health, with 0
being perfectly healthy, and 1 being dead. The weights, however, do not represent the
experience of an individual in a certain health state or the ability of that person to cope with
the disability (Anand and Hanson, 1997). Some diseases/disabilities can give a higher burden
of disease to certain people than to others. For example, missing an arm will be worse to a
farmer than to a college professor (Groce and Cheney, 1998). Allotey et al. (2003) described
these contextual factors related to the burden of disease, such as culture, development,
environment (urban/rural), gender and social-economic status. Their conclusion was that the
experience of a health condition is an interaction between a person and their social, cultural
and environmental context and the experience of the disease is greatly influenced by all of
these factors. They proposed to include a ‘development gradient’ in the severity valuation
that would lessen the severity as the development of a country improves. However, this
would not cover all contextual factors and also, such severity weights do not currently exist.
Ways to value disability Severity weights are used to value the time lived in a certain health state. In most studies, the
various health states are valued by a team of experts. Experts may represent a skewed sample
of the population (Arnesen and Nord, 1999), although the Dutch disability weights study
(Stouthard et al., 1997) did not find much difference between the average values assigned by
a lay panel compared to those assigned by an expert panel. The Andhra Pradesh burden of
disease study (Indian Institute of Health Systems, 2005) however did show that the general
public rated severity weights for the same health state higher than experts. Also, people living
in a particular health state tend to value severity weights for that state lower than other people
(AbouZahr and Vaughan, 2000). Depending on the purpose of the study, input from those
suffering from a certain health state, people with direct experience of the health state (family,

page 82 of 97 RIVM report 500029001
friends), health care providers, and the general public could be considered, next to the
opinion of experts (Schneider, 2001). Further research is needed to find out what the best
method is to value disability. It has been suggested (Indian Institute of Health Systems, 2005)
to do repeated measures to help the valuers clarify their value sets. The realization of such a
new or improved valuation set went beyond the scope of this study.
Age-weighting When age-weighting is used in DALY calculations, different values are assigned to (healthy)
time lived at different ages. This procedure has been justified by arguing that the social value
of middle-age groups is considered to be greater, due to responsibility for their dependants,
than the value of younger or older people. Age-weighting is one of the most controversial
aspects of DALY calculations. Some critics state that it is unethical to value the lives of
children and elderly less than other lives (Arnesen and Nord, 1999; Anand and Hanson, 1997;
Schneider, 2001). Age-weights are not used in the calculations in this study, so a healthy life
year is valued equal at all ages.
Discounting In discounting, future years of healthy life lived are valued less than present years. Therefore,
this is not favourable for children and future generations (Anand and Hanson, 1997; Arnesen
and Nord, 1999). Preventive measures are devalued, as they cost money now while benefits
will become apparent later (Schneider, 2001). For these reasons, no discounting has been
done in this study. Other studies, such as the Australian burden of disease study (Mathers et
al., 1999), do use discounting. A recent Belgian burden of disease study (Torfs, 2003) has
calculated results with and without 3% discounting. The discounting factor resulted in a
12% decrease of the total number of DALYs (not statistically significant).
Comorbidity In industrialised countries, older people often have more than one disease. Severity weights
do not take account of these comorbid conditions (Gold et al., 2001). The disease burden is
disease-specific and not individual specific, so adding up the severity weights for all diseases
in a person could result in a weight of more than one, representing a state worse than death
(Anand and Hanson, 1997; Schneider, 2001).

RIVM report 500029001 page 83 of 97
The Global Burden of Disease study (Murray and Lopez, 1996) did not attempt to deal with
the effects of comorbidities. In the Australian burden of disease study (Mathers et al., 1999),
adjustments were made for the effects of comorbidity between mental disorders and between
physical disorders at older ages. A multiplicative model was used to estimate weights for
comorbid conditions and the change in total weight was attributed back to the weight for the
milder of the conditions. However, because of the complexity and the fact that there is
currently no general approach, we have not accounted for co-morbidity in the current study.
Burden to society DALYs only reflect the time of healthy life lost for patients themselves. However, society
shares the burden of disease in supporting the patient in different ways (Pang et al., 2000).
An example of the burden to society is support provided through public services, family and
friends, and private income. If the objective of DALY calculation is to measure the actual
burden of disease, the burden to society should be included. However, it is currently
impossible to quantitatively account for these effects in a coherent manner. These aspects
should however be considered.
6.5 Policy relevance
As addressed in previous chapters, outcomes of various DALY studies vary, the method is
being debated, and results are relatively uncertain. With all this ambiguity, one could
question the usefulness of these types of calculations for policy makers, who generally want
relatively certain information. One should realise, however, that a substantial part of the
uncertainties is always involved in quantitative assessment of the impact of environmental
pollutants, even when restricted to estimates of the number of people with a certain health
effect, without aggregation into a DALY.
However, in spite of the various criticisms, the DALY has been adopted internationally and is
increasingly used in various national and global burden of disease studies. We think that,
within the proper context, results can give a useful -though crude- indication of the
dimensions of environment-related health loss.

page 84 of 97 RIVM report 500029001
DALYs can also be used as summary measure to evaluate policy measures, instead of using
multiple endpoints. Although more research is needed, our study has shown some examples
of these types of evaluations. For instance, implementing policy measures to reduce PM10
levels to the EU target threshold value of 20 µg/m3 in 2010 could reduce the PM10-related
disease burden. For noise, reducing exposure levels by 5dB in 2020 could reduce the disease
burden by almost half (1800 DALYs, mainly attributable to noise from road traffic). For
radon, policy could aim at a stand-still situation for radon levels (having them the same in
2020 as in 2000), which could prevent over 100 DALYs. By summarizing these effects in
one integrated measure, the impact of different environmental factors can be compared. The
policy relevance of these types of calculations, even though they are only rough estimates, is
evident, since these numbers can help to focus policy on the aspects of the environment with
the largest public health impact. Calculating source-specific DALYs (such as could, with
certain assumptions, be attempted for i.e. traffic, industry or housing) can provide added
value to policy makers, since policy is preferably aimed at the source.
For further usefulness, estimates need to be combined with cost-benefit analysis. This would
also provide a better grip on the numbers, since it is difficult for most people to judge
whether, for example, preventing 500 DALYs is a lot or a little.
Overall, if quantitative health impact assessment is useful, which it is in many (policy-
related) circumstances, DALYs offer the most complete way of denominating health.
However, DALYs should not be used in isolation, but in context with information about
public engagement, acceptance of the risk by the exposed population, current policy and its
effectiveness, special risk groups, etc. One way to consider these issues is by using the so-
called Appraisal Framework Environment and Health (Van Bruggen and Fast, 2003), which
has been set up to serve as a useful checklist, including the various issues that may play a
role, separately or in unison, in policy decisions on health-related environmental problems.
As a supporting tool, DALYs certainly have added value as compared to underlying data
such as concentrations, exposed population, etc, which can also be used as a basis for policy
making. This is because DALYs integrate information on the number of people affected and
the severity and duration of the disease, while also standardizing health effects, thereby
allowing comparison between different (environmental) health problems. The usefulness of
DALYs is a balance between these extra useful dimensions on the one hand and the extra
uncertainty on the other hand. Uncertainty should be analyzed and described, in order to

RIVM report 500029001 page 85 of 97
make DALY results meaningful and interpretable. When using DALYs as guidelines instead
of definite priorities, the approach can be very useful.
6.6 Methodological conclusions and recommended future
research
Several burden of disease studies have been completed or are currently being carried out.
These types of health impact assessments are useful for a (crude) comparison of the overall
public health impact of different environmental factors and for assessing policy options.
Therefore, as already mentioned in the introduction, it is useful to link general burden of
disease studies to actual causes of disease (whether environmental or otherwise). This helps
to identify main sources of (environmental) health loss, which can than be targeted with
specific policy measures. It is therefore also helpful to try and identify a specific segment of
the disease burden that can be attributed to a certain source, such as, for instance, the traffic-
or housing-related disease burden. A further useful step is to calculate trends over time, as we
have undertaken in this study, which allows evaluation of past policy measures and
anticipation of the future. Generation of alternative (policy) scenarios can also help in this
context. For example, in this study, we have experimented with alternative noise scenarios.
The outcomes of our exercise show the possible health improvements of policy measures that
reduce noise levels by 5 dB.
Furthermore, geographical trends can be informative, and can help evaluate regional policy
efforts. There is an increasing request for integrated (environmental) health information on a
more local scale. Research and discussion is needed on the applicability and validity of the
DALY concept on such smaller (sub-national) scales.
DALYs can be expressed in terms of money, thereby being compatible for cost-benefit
analysis, which is useful for policy makers. Such an analysis can help to evaluate which
environmental health problem can be reduced most efficiently and effectively. This involves
assembling potential policy measures, calculating their potential effects on the problem,
assessing the costs of these measures and also evaluating the costs of the health effects (such
as the costs of absence due to illness, medical costs, etc). These costs can than be compared

page 86 of 97 RIVM report 500029001
in a cost benefit analysis. Such an analysis was beyond the scope of this project. RIVM is
currently starting a project on cost benefit analyses of transport policy measures.
When presenting results, it is important to provide the context of the calculations. As stated
before, DALYs can only be interpreted properly when considering the framework,
assumptions and uncertainties. Even though this context will always remain necessary,
uniformity of burden of disease studies would certainly be of use. It will be very useful to
acquire internationally consistent methodologies to calculate the (environmental) burden of
disease, based on “good practise”. These methods could specify ways to assess exposure for
each factor and population, ways to obtain prevalence data, etc, and could also supply a
model that processes all variables in an internationally consistent way (Prüss et al., 2001).
The World Health Organization has already supplied several other guideline documents and
continues to try and standardize all sorts of methodologies (such as on the use of
epidemiological evidence for environmental HIA, (World Health Organization, 2000)).
In addition to setting up these good practise guidelines, an attempt should be made to
streamline the data that are being used, such as exposure-response relationships. Careful
analysis of the relationships between risk factors and health outcomes for different
populations could potentially provide an internationally accepted core set of exposure-
response relationships (including guidelines on how and when to use national research
instead). However, these relationships might differ in different context, so applicability might
be limited. Furthermore, existing data should constantly be updated, trying to minimize
uncertainty and maximize validity and applicability.
Different types of uncertainty underlie DALY calculations. Some data could theoretically be
almost 100% precise, such as prevalence data for specific populations. Other factors simply
cannot be completely accurate. In many cases, expert judgements were needed to estimate
input values and/or uncertainty of input values. More formalized procedures need to be
adopted to elicit such expert opinions.
Severity factors will always be estimates and the exact exposure of a population can only be
modelled. Even though DALYs will therefore never be fixed numbers and will always be
surrounded with considerable uncertainty ranges, it is worthwhile to at least try to limit these.
The focus should lie on limiting uncertainty that affects the output most. Since DALYs are
based on multiplications, relatively small values with relatively great uncertainty ranges, such

RIVM report 500029001 page 87 of 97
as severity weights, affect outcomes most. One of the weakest links in the DALY calculations
is therefore the absence of a complete and validated set of severity weights. Combining all
previous efforts, filling in the blanks and validating all weights by expert panels as well as lay
people, could potentially lead to one internationally recognized set of severity weights.
However, this set would only be valid for countries with similar cultural and social
backgrounds and values, as different cultures appraise health states differently.
Although it will be difficult to limit uncertainty in DALY issues to a great extent, thinking
about these issues and trying to tune ones own research to other studies might help to
streamline all burden of disease studies, adding value to each individual one.

page 88 of 97 RIVM report 500029001

RIVM report 500029001 page 89 of 97
References
Abbey DE, Nishino N, McDonnell WF, Burchette RJ, Knutsen SF, Beeson WL, Yang JX. Long-term inhalable particles and other air pollutants related to mortality in nonsmokers. Am. J. Respir. Crit. Care Med. 159: 373-382, 1999.
AbouZahr C, Vaughan JP. Assessing the burden of sexual and reproductive ill-health: questions regarding the
use of disability-adjusted life years. Bull World Health Organization; 78(5):655-66, 2000. AEA Technology. Baseline Scenarios for Service Contract for carrying out cost-benefit analysis of air
quality related issues, in particular in the clean air for Europe (CAFE) programme. European Commission DG Environment. ENV.C.1/SER/2003/0027. 2005.
Allotey P, Reidpath D, Kouame A, Cummins R. The DALY, context and the determinants of the severity of
disease: an exploratory comparison of paraplegia in Australia and Cameroon. Soc Sci Med. Sep;57(5):949-58, 2003.
Anand S, Hanson K. Disability-adjusted life years: a critical review. J Health Econ. Dec;16(6):685-702, 1997. Anderson HR, Atkinson RW, Peacock JL, Marston L, Konstantinou K. Meta-analysis of Time-Series Studies
and Panel Studies of Particulate Matter (PM) and Ozone (O3): Report of a WHO Task Group. Copenhagen, World Health Organization, 2004.
Arnesen T, Nord E. The value of DALY life: problems with ethics and validity of disability adjusted life years.
BMJ; 319:1423-1425, 1999. Beck J, Bree L van, Diederen H, Dolmans J, Esbroek M van, Fischer P, Folkert R, Hinsberg A van, Velze K
van, Marra M, Pul W van, Ruiter J de, Waal L de. Gezondheids- en natuureffecten van verschillende verzuringambities in 2010. Rapportnummer 725501007. Bilthoven: RIVM, 2003.
Breugelmans O, Wiechen C van, Kamp I van, Heisterkamp S, Houthuijs D. Tussenrapportage Monitoring
Gezondheidskundige Evaluatie Schiphol: Gezondheid en beleving van de omgevingskwaliteit in de regio Schiphol: 2002. Rapportnummer 630100001. Bilthoven: RIVM, 2005.
Bruggen M van, Fast T. Framework for Decision Making in the Field of Environment and Health.
Rapportnummer 609026003. Bilthoven: RIVM, 2003. Brunekreef B. Air pollution and life expectancy: is there a relation? Occupational Environmental Medicine,
Nov; 54:781-784, 1997. Buringh E, Opperhuizen A. On health risks of ambient PM in the Netherlands. Rapportnummer 650010032.
Bilthoven: RIVM, 2002. Centraal Bureau voor de Statistiek. Geluids- en geurhinder naar bron per provincie 2001/2002. Online available
at http://statline.cbs.nl. Accession date: April 2005. Cyrys J, Heinrich J, Hoek G, Meliefste K, Lewné M, Gehring U, Bellander T, Fischer P, van Vliet P, Brauer M,
Wichmann H, Brunekreef B. Comparison between different traffic-related particle indicators: Elemental carbon (EC), PM2.5 mass, and absorbance. J Expo Anal Environ Epidemiol;13:134-143, 2003.
Dassen AGM, Jabben J, Dolmans JHJ. Development and use of EMPARA: a model for analysing the extent and
effects of local environmental problems in the Netherlands. In: Proceedings of Internoise, the international congress and exhibition on noise control engineering. The Hague, the Netherlands, 27-30 August 2001.
Decisioneering (2000-2003). Risk analysis overview. Online available at http://www.decisioneering.com/risk-
analysis.html. Accession date: November 2004.
page 90 of 97 RIVM report 500029001
Dockery DW, Pope III CA, Xu X, Spengler JD, Ware JH, Fay ME, Ferris BG, F. E. Speizer. "An Association between Air Pollution and Mortality in Six U.S. Cities". The New England Joumal of Medicine, Vol329, No. 24, 1753-1759, 1993.
European Environment Agency. Europe's environment: the third assessment. Environmental assessment report
No 10. Luxembourg: Office for Official Publications of the European Communities. 2003 Ezzati M, Lopez AD, Rodgers A, Vander Hoorn S, Murray CJ. Selected major risk factors and global and
regional burden of disease. Lancet. Nov 2;360(9343):1347-60, 2002. Franssen AEM, Dongen JEF van, Ruysbroek JMH, Vos H, Stellato RK. Hinder door milieufactoren en de
beoordeling van de leefomgeving in Nederland. Inventarisatie verstoringen 2003. Rapportnummer 815120001/2004. Bilthoven: RIVM, 2004.
Gezondheidsraad (Health Council of the Netherlands). Radon: Evaluation 'BEIR VI'. Publicatienummer
2000/05. Den Haag: 2000. Gezondheidsraad.Volksgezondheidsschade door passief roken. Publicatienummer 2003/21. Den Haag: 2003. Gold MR, Stevenson D, Fryback DG. HALYS and QALYS and DALYS, Oh My: similarities and differences in
summary measures of population Health. Annu Rev Public Health. 2002; 23:115-34. Epub Oct 25, 2001. Groce N, Cheney M, Me ST, Measuring the Quality of Life:Rethinking the World Bank’s Disability Adjusted
Life Years. International Rehabilitation Research Review, vol. 4, pp. 12-16, 1998. Guski R. How to forecast community annoyance in planning noisy facilities. Noise and Health 2004, 6; 22, 59-
64, 2004. Hertz-Picciotto I. Environmental epidemiology. In “Modern Epidemiology”, second edition, Rothman KJ and
Greenland S eds. Lippincott-Raven publishers, Philadelphia, PA, USA, 1998. Hoeymans N, Poos MJJC. Wat is de ziektelast en hoe wordt deze berekend? In: Volksgezondheid Toekomst
Verkenning, Nationaal Kompas Volksgezondheid. Online available at http://www.nationaalkompas.nl. Last updated: 14 november 2002. Bilthoven: RIVM, 2002.
Hollander AEM de, Melse JM, Lebret E, Kramers PGN. An aggregate public health indicator to represent the
impact of multiple environmental exposures. Epidemiology, vol. 10, p. 606-617, 1999. Hollander AEM de. Assessing and evaluating the health impact of environmental exposures. Proefschrift,
Universiteit Utrecht, 2004. Idenburg AM, Nagelhout D. EC scenario of the 5th Environmental Outlook. Doorbraaktechnologieen en het
milieu. Achtergrondinformatie bij de Vijfde Milieuverkenning. Rapportnummer 408129008. Bilthoven: RIVM, 2001.
Indian Institute of Health Systems “Andhra Pradesh Burden of Disease Study”. Online available at:
http://www.ihsnet.org.in/BurdenOfDisease/APBurdenofDiseaseStudy.htm. Accession date: April 2005. Kelfkens G, Bregman A, Gruijl FR de, Leun JC van der, Piquet A, Oijen T van, Gieskes WWC, Loveren H van,
Velders GJM, Martens P, Slaper H. Ozone layer - climate change interactions. Influence on UV levels and UV related effects. Rapportnummer 410200112 NOP-series. Bilthoven: RIVM, 2002.
Kempen EEM van. Milieu-DALY’s: zieketelast die wordt veroorzaakt door blootstelling aan milieufactoren.
Ontwikkeling van wegingsfactoren voor verschillende effecten van milieuverontreiniging en een schatting van de omvang van deze effecten. Universiteit van Maastricht, scriptie, 1998.
Kempen EEM van, Ameling CB, Hoogenveen RT, Staatsen BAM, Hollander AEM de. De potentiële ziektelast
toe te schrijven aan de geluidbelasting in Nederland. Kwantitatieve schattingen in het kader van de Vijfde Milieuverkenningen. Rapportnummer 408129 021. Bilthoven: RIVM, 2001.

RIVM report 500029001 page 91 of 97
Kempen EEM van, Kruize H, Boshuizen HC, Ameling CB, Staatsen BAM, Hollander AEM de. The association between noise exposure and blood pressure and ischemic heart disease: a meta-analysis. Environmental Health Perspective. Mar;110(3):307-17, 2002.
Kempen EEM van, Staatsen BAM, Kamp I van. Noise and health: Selection and evaluation of exposure-effect-
relationships for health-impact-assessment. Rapportnummer 630400001. Bilthoven: RIVM, 2005. Kunzli N, Kaiser R, Medina S, Studnicka M, Chanel O, Filliger P, Herry M, Horak F Jr, Puybonnieux-Texier V,
Quenel P, Schneider J, Seethaler R, Vergnaud JC, Sommer H. Public-health impact of outdoor and traffic-related air pollution: a European assessment. The Lancet, Sep 2;356 (9232):795-801, 2000.
Künzli N, Medina S, Kaiser R, Quenel P, Horak Jr F, Studnicka M. Assessment of deaths attributable to air
pollution: should we use risk estimates based on time series or on cohort studies? Am J Epidemiol., 2001. KWF Kankerbestrijding (Dutch Cancer Society). Online available at http://www.kwfkankerbestrijding.nl.
Accession date: December 2004. Lipfert FW, Perry Jr HM, Miller JP, Baty JD, Wyzga RE, Carmody SE. The Washington University-EPRI
Veterans' Cohort Mortality Study: preliminary results. Inhal Toxicol.;12 Suppl 4:41-73, 2000;153(11):1050-5, 2001.
Mathers E, Vos T, Stevenson C. The burden of disease and injury in Australia. Canberra: AIHW, Catalogue No.
PHE-17, 1999. Melse JM, Kramers PG. Berekeningen van de ziektelast in Nederland. Achtergronddocument bij VTV-1997
deel III, hoofdstuk 7. Rapportnummer 431501028. Bilthoven: RIVM, 1998. Miedema HM, Oudshoorn CG. Annoyance from transportation noise: relationships with exposure metrics DNL
and DENL and their confidence intervals. Environmental Health Perspective. Apr;109(4):409-16, 2001. Miedema HME, Passchier-Vermeer W, Vos H. Elements for a position paper on night-time transportation noise
and sleep disturbance. Rapportnummer 2002-59. Delft: TNO Inro, 2003. Miedema HME, Vos H. Self-reported sleep disturbance caused by aircraft noise. Rapportnummer 2004-15.
Delft: TNO Inro, 2004. Ministerie van Verkeer en Waterstaat. Dosis-responsrelaties luchtvaartgeluid. Delft: TNO Preventie en
Gezondheid, 2000. Morrow RH, Bryant JH. Health Policy Approaches to Measuring and Valuing Human Life: Conceptual and
Ethical Issues. American Journal of Public Health, 85(10): 1356-1360, 1995. Murray CJL, Lopez AD. The Global Burden of Disease. Geneva, World Health Organization, Harvard School
of Public Health, World Bank, 1996. Murray CJ, Lopez AD. On the comparable quantification of health risks: lessons from the Global Burden of
Disease study Epidemiology. Sep;10(5):594-605, 1999. Nederlandse Hartstichting (Netherlands Heart Foundation). Online available at http://www.hartstichting.nl.
Accession date: December 2004. Pang L, Jin SG, Song GD, Guo ZY. Study on measuring burden of disease. Biomed Environ Sci Mar;13(1):1-6,
2000. Pernot CEE, Koren LGH, Dongen JEF van, Bronswijk JEMH van. Relatie EPC-niveau en gezondheidsrisico's
als onderdeel van het kwaliteitsniveau van gebouwen. Rapportnummer 2003-GGI-R057. Delft: TNO Bouw, 2003.
Pope III CA, Dockery DW, Schwartz J. Review of epidemiological evidence of health effects of particulate air
pollution. Inhal. Toxicol.;7:1–18, 1995.

page 92 of 97 RIVM report 500029001
Pope III CA, Burnett R, Thun MJ, Calle EE, Krewski D, Ito K, Thurston GD.Lung cancer, cardiopulmonary
mortality and long-term exposure to fine particulate air pollution. Journal of the American Medical Association 287(9): 1132-1141, 2002.
Pruppers MJM, Lembrechts JFMM, Slaper H. Hoe is de blootstelling aan straling terug te dringen? In:
Volksgezondheid Toekomst Verkenning, Nationaal Kompas Volksgezondheid. Online available at http://www.nationaalkompas.nl/. Last updated: 25 september 2001. Bilthoven: RIVM, 2001.
Prüss A, Corvalán CF, Pastides H, Hollander AEM de. Methodologic considerations in estimating burden of
disease from environmental risk factors at national and global levels. Int. J. Occup. Environ. Health; 7:58-67, 2001.
RIVM. Milieubalans 1997. Het Nederlandse milieu verklaard. Bilthoven: 1997. RIVM. Nationaal Kompas Volksgezondheid. Volksgezondheid Toekomst Verkenning. Online available at
http://www.nationaalkompas.nl. Accession date: November 2004. Bilthoven: 2004a. RIVM. Milieubalans 2004. Het Nederlandse milieu verklaard. Bilthoven: 2004b. RIVM MNP. Outstanding environmental issues. A review of the EU's environmental agenda. Bilthoven: 2004. RIVM MNP, Bilthoven, CBS, Den Haag en de Stichting DLO, Wageningen. Gezondheidseffecten door
milieufactoren in Nederland. In: Milieu- en Natuurcompendium. Online available at http://www.rivm.nl/milieuennatuurcompendium. Page last changed: 3 October 2003. Bilthoven: 2003a.
RIVM MNP, Bilthoven, CBS, Den Haag en de Stichting DLO, Wageningen. UV-straling in Nederland, 1980-
2002. In: Milieu- en Natuurcompendium. Online available at http://www.rivm.nl/milieuennatuurcompendium. Page last changed: 3 oktober 2003. Bilthoven: 2003b.
RIVM MNP, Bilthoven, CBS, Den Haag en de Stichting DLO, Wageningen. Emissies naar lucht door verkeer
en vervoer, 2002. In: Milieu- en Natuurcompendium. Online available at http://www.rivm.nl/milieuennatuurcompendium. Page last changed: 27 april 2004. Bilthoven: 2004.
Ruwaard D, Kramers PGN (eds.). Volksgezondheid Toekomst Verkenning 1997; de som der delen.
Rapportnummer 431501018. Bilthoven: RIVM, 1997. Schneider M. The setting of health research priorities in South Africa. Cape Town, Burden of Disease Research
Unit, 2001. Slaper, H., Daniel, J.S., de Gruijl, F.R., and van der Leun, J.C. Estimates of ozone depletion
and skin cancer incidence to examine the Vienna convention achievements. Nature; 384: 256-258, 1996. Stoop P, Glastra P, Hiemstra Y, de Vries L, Lembrechts J. Results of the second Dutch national survey on radon
in dwellings. Rapportnummer 610058006. Bilthoven: RIVM, 1998. Stouthard MEA, Essink-Bot ML, Bonsel GJ, Barendregt JJ, Kramers PGN, Water HPA van de, Gunning-
Schepers LJ, Maas PJ van der. Disability weights for diseases in The Netherlands. Department of Public Health, Erasmus University Rotterdam. ISBN 90-72245-84-9, 1997.
Torfs R. Kwantificering van gezondheidsrisico’s aan de hand van DALYs en externe gezondheidskosten, studie
uitgevoerd in opdracht van de Vlaamse Milieumaatschappij, MIRA. Rapportnummer MIRA/2003/02, Vito, 2003.
UNECE. Modeling and assessment of the health impact of particulate matter and ozone. Summary report
prepared by the joint Task Force on the Health Aspects of Air Pollution of the World Health Organization/European Centre for Environment and Health and the Executive Body. EB.AIR/WG.1/2004/11. Online available at: http://www.unece.org/env/documents/2004/eb/wg1/eb.air.wg1.2004.11.e.pdf. 2004.

RIVM report 500029001 page 93 of 97
Veen MP van, Crommentuijn LEM, Janssen MPM, Hollander AEM de. Binnenmilieu-kwaliteit: ventilatie en vochtigheid. Een studie voor Milieuverkenning 5. Rapportnummer 630920 001. Bilthoven: RIVM, 2001.
Vonk JM, Schouten JP. Daily emergency hospital admissions and air pollution in the Netherlands 1992-1999.
RU Groningen, 2002. World Health Organization (WHO). Evaluation and use of epidemiological evidence for Environmental Health
Risk Assessment. WHO Regional Office for Europe, Copenhagen, EUR/00/5020369, 2000. World Health Organization (WHO). Health Aspects of Air Pollution with Particulate Matter, Ozone and
Nitrogen Dioxide; Report on a WHO Working Group, Bonn, Germany 13–15 January 2003. World Health Organization (WHO). Transport, Health and Environment Pan-European Project. Transport-
related Health Effects with a Particular Focus on Children - Towards an Integrated Assessment of their Costs and Benefits. State of the Art Knowledge, Methodological Aspects and Policy Directions. Topic report on Noise. 2004a.
World Health Organization (WHO). Health aspects of air pollution. Results from the WHO project “systematic
review of health aspects of air pollution in Europe”. 2004b. World Health Organization (WHO). Particulate matter air pollution: how it harms health. Factsheet
EURO/04/05. Berlin, Copenhagen, Rome, 2005.

page 94 of 97 RIVM report 500029001
Acknowledgements We would like to thank the following people for their valuable help in supplying data,
documentation and useful suggestions:
• Caroline Ameling (RIVM/MGO)
• Jan-Anne Annema (MNP/RIM)
• Niels Bos (SWOV)
• Eltjo Buringh (MNP/LOK)
• Leon Crommentuijn (MNP/RIM)
• Tilly Fast (Fast Advies)
• Paul Fischer (RIVM/MGO)
• Pieter Hammingh (MNP/LED)
• Aldert Hanemaaijer (MNP/NMD)
• Danny Houthuijs (RIVM/MGO)
• Rudolf Hoogenveen (RIVM/PZO)
• Guus de Hollander (RIVM/VTV)
• Jan Jabben (RIVM/LVM)
• Irene van Kamp (RIVM/MGO)
• Gert Kelfkens (RIVM/LSO)
• Elise Van Kempen (RIVM/MGO)
• Erik Lebret (RIVM/MGO)
• Ruedi Müller-Wenk (Universität St.Gallen, Switzerland)
• Annemiek van Overveld (RIVM/MGO)
• Rene Poos (RIVM/VTV)
• Harry Slaper (RIVM/LSO)
• Lany Slobbe (RIVM/VTV)

Appendix 1 Data Environmental factors and associated health outcomes with the corresponding number of people affected, duration and severity of the health state, and DALYs per million people for the year 2000. Environmental Factor
Health Outcome Total number of people affected Duration (+ sd)
Severity (+ sd) DALYs per million people Ж
Mortality (total) 1,700 (1,200- 2,200) based on individual PM10 model. 2,800 (2,200 – 3,500) based on 2 component-model with ozone.
3 months (+/1 month) 1 27 (13-44) based on individual PM10 model. 45 (24 – 70) based on 2 component-model with ozone.
Cardiovascular disease mortality 420 (190 – 660) 3 months (+/1 month) 1 7 (2-12) Respiratory disease mortality 580 (430 – 750) 3 months (+/1 month) 1 9 (4-15) COPD mortality 240 (160 – 340) 3 months (+/1 month) 1 4 (2-6) Hospital admissions cardiovascular disease
2,800 (1,900 – 3,900) 2 weeks * 0.71 (+/- 0.2) 5 (1-10)
Hospital admissions respiratory disease (total)
700 (430- 990) 2 weeks * 0.64 (+/- 0.17) 1 (0-2)
Hospital admissions COPD 500 (340- 670) 2 weeks * 0.53 (+/- 0.08) 1 (0-1) Hospital admissions asthma not sign - - -
PM10 (short-term)
Total 33 (17- 50) Ж PM10 (long-term)
Mortality (total) 18,100 (12,400 – 23,800)
10 years (+/- 10%) Ψ 10 (4 – 13) years
1 11,200 (7,400 – 15,000) Ψ 11,200 (4,100 – 29,000)
Mortality (total) 1,800 (1,200 – 2,400) based on individual ozone model. 2,400 (1,600 – 3,100) based on 2 component-model with PM10.
3 months (+/1 month) 1 28 (13-47) based on individual ozone model. 38 (17 – 61) based on 2 component-model with PM10.
Cardiovascular disease mortality 500 (130 – 870) 3 months (+/1 month) 1 8 (2-16) Respiratory disease mortality not sign - - - COPD mortality not sign - - - Hospital admissions cardiovascular disease
not sign - - -
Hospital admissions respiratory disease (total)
not sign - - -
Hospital admissions COPD not sign - - - Hospital admissions asthma not sign - - -
Ozone (short-term)
Total 28 (13 – 47) Ж
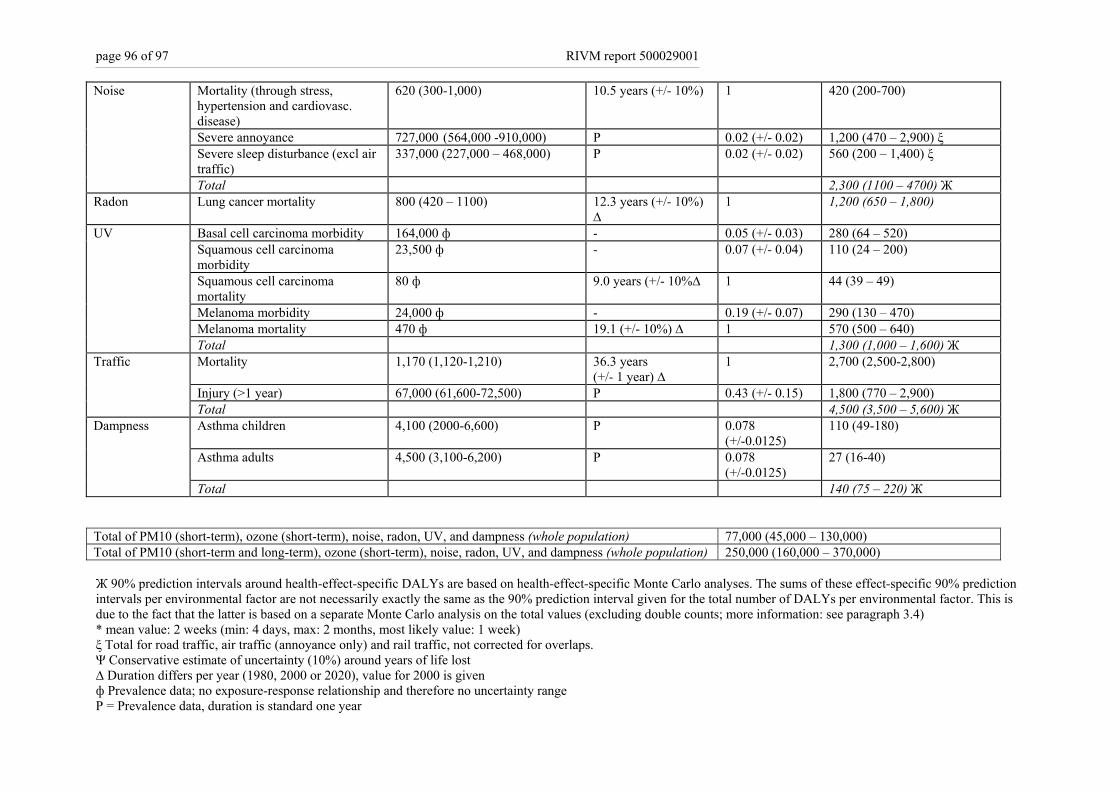
page 96 of 97 RIVM report 500029001
Mortality (through stress, hypertension and cardiovasc. disease)
620 (300-1,000) 10.5 years (+/- 10%) 1 420 (200-700)
Severe annoyance 727,000 (564,000 -910,000) P 0.02 (+/- 0.02) 1,200 (470 – 2,900) ξ Severe sleep disturbance (excl air traffic)
337,000 (227,000 – 468,000) P 0.02 (+/- 0.02) 560 (200 – 1,400) ξ
Noise
Total 2,300 (1100 – 4700) Ж Radon Lung cancer mortality 800 (420 – 1100) 12.3 years (+/- 10%)
∆ 1 1,200 (650 – 1,800)
Basal cell carcinoma morbidity 164,000 ф - 0.05 (+/- 0.03) 280 (64 – 520) Squamous cell carcinoma morbidity
23,500 ф - 0.07 (+/- 0.04) 110 (24 – 200)
Squamous cell carcinoma mortality
80 ф 9.0 years (+/- 10%∆ 1 44 (39 – 49)
Melanoma morbidity 24,000 ф - 0.19 (+/- 0.07) 290 (130 – 470) Melanoma mortality 470 ф 19.1 (+/- 10%) ∆ 1 570 (500 – 640)
UV
Total 1,300 (1,000 – 1,600) Ж Mortality 1,170 (1,120-1,210) 36.3 years
(+/- 1 year) ∆ 1 2,700 (2,500-2,800)
Injury (>1 year) 67,000 (61,600-72,500) P 0.43 (+/- 0.15) 1,800 (770 – 2,900)
Traffic
Total 4,500 (3,500 – 5,600) Ж Asthma children 4,100 (2000-6,600) P 0.078
(+/-0.0125) 110 (49-180)
Asthma adults 4,500 (3,100-6,200) P 0.078 (+/-0.0125)
27 (16-40)
Dampness
Total 140 (75 – 220) Ж Total of PM10 (short-term), ozone (short-term), noise, radon, UV, and dampness (whole population) 77,000 (45,000 – 130,000) Total of PM10 (short-term and long-term), ozone (short-term), noise, radon, UV, and dampness (whole population) 250,000 (160,000 – 370,000) Ж 90% prediction intervals around health-effect-specific DALYs are based on health-effect-specific Monte Carlo analyses. The sums of these effect-specific 90% prediction intervals per environmental factor are not necessarily exactly the same as the 90% prediction interval given for the total number of DALYs per environmental factor. This is due to the fact that the latter is based on a separate Monte Carlo analysis on the total values (excluding double counts; more information: see paragraph 3.4) * mean value: 2 weeks (min: 4 days, max: 2 months, most likely value: 1 week) ξ Total for road traffic, air traffic (annoyance only) and rail traffic, not corrected for overlaps. Ψ Conservative estimate of uncertainty (10%) around years of life lost ∆ Duration differs per year (1980, 2000 or 2020), value for 2000 is given ф Prevalence data; no exposure-response relationship and therefore no uncertainty range P = Prevalence data, duration is standard one year

RIVM report 500029001 page 97 of 97
Appendix 2 Results on a logarithmic scale
1
10
100
1000
10000
10000019
80
2000
2010
1980
2000
2020
1980
2000
2020
1980
2000
2020
1980
2000
2020
1980
2000
2010
1990
2000
1980
2000
2020
PM10 long-term
Noise Radon UV Trafficaccidents
PM10 short-term
Ozoneshort-term
Indoordampness
(log)
DA
LY
s pe
r m
illio
n pe
ople
PM10 long-term based on calculations using a conservative (10%) uncertainty interval for the number of years of life lost.