rivm rapport 350100002 functional foor monitoring as part
TRANSCRIPT
Corresponding author: M.C. Ocké Centre for Nutrition and Health Email address: [email protected]
RIVM report 350100002/2006 Functional food monitoring as part of the new Dutch dietary monitoring system C.J.M. Rompelberg, M. Jager, M.I. Bakker, E.J.M. Buurma-Rethans, M.C. Ocké
This investigation has been performed by order and for the account of the Dutch Food and Consumer Product Safety Authority (VWA), within the framework of project V/350100, Monitoring supplements, enriched foods and functional foods.
RIVM, P.O. Box 1, 3720 BA Bilthoven, telephone: 31 - 30 - 274 91 11; telefax: 31 - 30 - 274 29 71

page 2 of 51 RIVM report 350100002
RIVM report 350100002 page 3 of 51
Abstract
Functional food monitoring as part of the new Dutch dietary monitoring system Good data on functional food consumption necessary for an adequate Dutch nutrition policy are lacking. This lack may be overcome in future by including functional food monitoring in the new dietary monitoring system in the Netherlands. One specific form of monitoring could be an Internet-based questionnaire for a large group of people. Although it is thought that consumption of functional foods may imply health benefits, this implication has not been substantiated and potential health risks cannot be excluded. This was reason enough to report on how functional food monitoring might be included in the present dietary monitoring system through the use of a module-based method. Functional foods would be taken up in three modules of the dietary monitoring system: the core survey and two separate surveys for specific target groups, and specific foods. A ‘functional food composition database’ would also be needed. Once implemented, this functional food monitoring would result in data on consumption of functional foods (at product and ingredient levels) for both the general Dutch population and relevant subgroups. Key words: functional foods; dietary monitoring; food consumption surveys; food safety, adequate nutrition

page 4 of 51 RIVM report 350100002
RIVM report 350100002 page 5 of 51
Rapport in het kort
Monitoring van functionele voedingsmiddelen als onderdeel van het nieuwe Nederlandse Voedingspeilingsysteem Goede consumptiegegevens van functionele voedingsmiddelen ontbreken, maar zijn nodig voor een adequaat Nederlands voedingsbeleid. Monitoring van deze voedingsmiddelen kan in de toekomst deel uitmaken van het nieuwe Nederlandse voedingspeilingsysteem. Dit kan door onder andere gerichte vragen via Internet te stellen aan grote groepen mensen. Functionele voedingsmiddelen zijn voedingsmiddelen waaraan een positief gezondheidseffect wordt toegeschreven. Vaak is dit positieve effect echter niet bewezen en kan het gebruik ook risico’s opleveren. Het gebruik van deze voedingsmiddelen kan worden gemonitord door ze op te nemen in het Nederlandse voedingspeilingsysteem, een systeem waarmee op reguliere basis wordt nagegaan wat Nederlanders eten. In het rapport wordt aangegeven hoe deze implementatie kan worden gerealiseerd. Aanbevolen wordt om functionele voedingsmiddelen op te nemen in drie modules van het voedingspeilingsysteem: de basisgegevensverzameling, de aanvullende gegevensverzameling voor specifieke groepen en die voor specifieke producten. Daarnaast is een bestand nodig met de samenstelling van functionele voedingsmiddelen. Het Nederlands voedingspeilingsysteem resulteert hiermee in consumptiegegevens van functionele voedingsmiddelen (op product- en ingrediëntniveau) voor de algemene Nederlandse bevolking en relevante subgroepen. Trefwoorden: functionele voedingsmiddelen; voedingsmonitoring; voedselconsumptiepeilingen; voedselveiligheid; gezonde voeding .

page 6 of 51 RIVM report 350100002
RIVM report 350100002 page 7 of 51
Contents
Summary 9
1. Introduction 11
2. Data required on functional food consumption 15
2.1 Prioritizing functional foods to be monitored 15 2.2 Information needed for priority foods 16
3. Proposal for functional food data collection 19
3.1 Components of the Dutch dietary monitoring system 19 3.2 The core survey and the specific groups surveys 20 3.3 The specific products survey 21
3.3.1 Design of the specific products survey for functional food monitoring 22 3.3.2 An internet-based food frequency questionnaire 23
3.4 Product composition database 25 3.5 Selection of the appropriate survey for a priority functional food 29
4. Functional food and component exposure calculations 31
4.1 Analyses at the product level 32 4.2 Analyses at the level of the micronutrient or bio-active component 33
5. Discussion and conclusions 35
Glossary 39
References 41
Appendix 1: Internet-based food frequency questionnaire (draft version) 43

page 8 of 51 RIVM report 350100002
RIVM report 350100002 page 9 of 51
Summary Up till now, very limited data on overall functional food consumption in the Dutch population are available. Consumption data of these products are necessary to underpin an adequate nutrition policy both from a health promotion (efficacy) and health protection (food safety/signalling) point of view. Some important preconditions can be given for functional food monitoring. These include the possibility to monitor in a study population that is representative for the general Dutch population and specific subgroups (target groups and at risk groups), the possibility to monitor the intake at product and ingredient level, and the possibility to monitor the total daily intake of a specific ingredient, i.e. including the intake from functional foods, supplements and traditional food products. It is recommended to conduct functional food monitoring as part of the new Dutch dietary monitoring system. The core of the new system comprises a continuous collection of data pertaining to the general population aged from 7 to 69 years. Separate surveys are advised for specific target groups, specific foods, nutritional status and/or determinants of dietary behaviour. In the present report the possibility for implementation of functional food monitoring within this system is described. Required data collection It is advised that as a first step, functional foods to be monitored are selected based on priorities from a food safety point of view and a health promotion point of view. To obtain adequate data on functional foods consumption, functional foods monitoring should be implemented into three food consumption surveys i.e. the core survey, the specific group survey and the specific products survey. A flow scheme has been developed to select the appropriate survey and dietary assessment method for a priority functional food. The specific product survey will be very important for functional foods monitoring because most functional foods are expected to be consumed by relatively few people. Until now, the specific product survey has not been conducted within the national dietary monitoring system. Therefore a proposal for the design and methods of this survey is presented from the viewpoint of functional food monitoring. It is proposed to use an internet-based food frequency questionnaire as dietary assessment method, and to administer them to at least 40,000 people. The questionnaire consists of screening questions to identify users of specific functional foods. Questions about frequency and amount of the use of the functional foods are only administered to the users. An example questionnaire has been worked out for functional foods enriched with folic acid and phytosterols or -stanols. Future data collection should be flexible and is proposed to be conducted on a biannual basis. Required databases and statistical models To calculate intake of nutrients and bio-active components derived from functional foods consumption a ‘functional food composition database’ will be needed in which the amounts of nutrients and bio-active components of the foods are given. At present such a database is not available but several initiatives are promising as a first step. Moreover, adequate statistical models need to be developed to combine information on functional ingredient use from different sources, such as functional foods, dietary supplements and traditional products. This also requires a food supplement database.

page 10 of 51 RIVM report 350100002
Conclusion The proposed monitoring of functional foods will provide data that allows evaluation of the current admittance policy for these types of foods from a food safety point of view and a healthy nutrition point of view. The methodologies and procedures need to be pilot-tested before actual implementation takes place.
RIVM report 350100002 page 11 of 51
1. Introduction During the past twenty years, the dietary pattern of the Dutch consumers changed in various aspects 1. A particular development is the increase in products that aim at getting the consumer’s attention, claiming or appearing to be healthy. Foods enriched with bio-active components, vitamins or minerals are typical examples of these products. In this report we refer to those foods with the term functional foods. Functional foods can be classified in some main categories as illustrated in Table 1.1 2. Among the first modified traditional foods were skimmed and semi-skimmed versions of dairy products, and margarines with a modified fat composition. These products were introduced on the market in the 1960s. Since the 1980s, a growing number of other food products in which a part of the fat or carbohydrate (sugar) content had been replaced by ingredients with less energy or none at all (the ‘light’ products) were produced. In the 1990s, manufacturers started to add bio-active substances and bacterial cultures with an (alleged) positive health effect to their food products. Finally, since 1996, a growing number of products fortified with vitamins and minerals are launched at the market due to less restrictive legislation on food fortification [Warenwetbesluit ‘Toevoeging micro-voedingsstoffen aan levensmiddelen’, Staatsblad 311, 1996]. In the coming years new product categories can be expected, like functional foods with peptides to reduce blood pressure and with new ingredients to help against overweight. Consumption of functional foods may thus constitute beneficial health effects, although not all claimed or suggested effects are scientifically proven. Moreover many claims relate to intermediate biological effects rather than to the reduction of risk of diseases or ultimate health. Even for foods with proven health effects, the efficacy in free living conditions needs to be substantiated. In addition, potential safety hazards of functional food consumption should not be disregarded, even after extensive premarket evaluation. Examples of safety hazards are health issues through risks of over consumption of specific ingredients due to the much higher than usual content or consumption of micronutrients or bio-active compounds, the risk of interaction effects with other nutrients and/or active constituents in drugs, unexpected long-term effects, or potential harmful effects in specific at risk groups within the population 2. The manufacturer is responsible for the safety of the specific marketed product, whereas the government has to protect public health, and is therefore responsible for the safety of the overall food supply for the whole population. In this respect keeping an eye on functional foods consumption becomes more relevant since more and more foods enriched with the same micronutrients or bio-active compounds appear on the market, and functional foods may be consumed in combination with the use of dietary supplements and drugs with the same ingredient or health intention 3. To underpin a policy that will provide both adequate healthy nutrition and food safety, insight is needed in the consumption of functional foods and in the intake of nutrients and bio-active components that are added to those foods. Among others, these intake data should give insight in possible exceeding of maximum intake levels for micronutrients and bioactive components, the efficacy of micronutrient enriched foods to prevent inadequate micronutrient intake, and the exposure to functional foods in target and non-target groups. As such, the data will be a crucial part of post launch monitoring of functional foods, although post launch
page 12 of 51 RIVM report 350100002
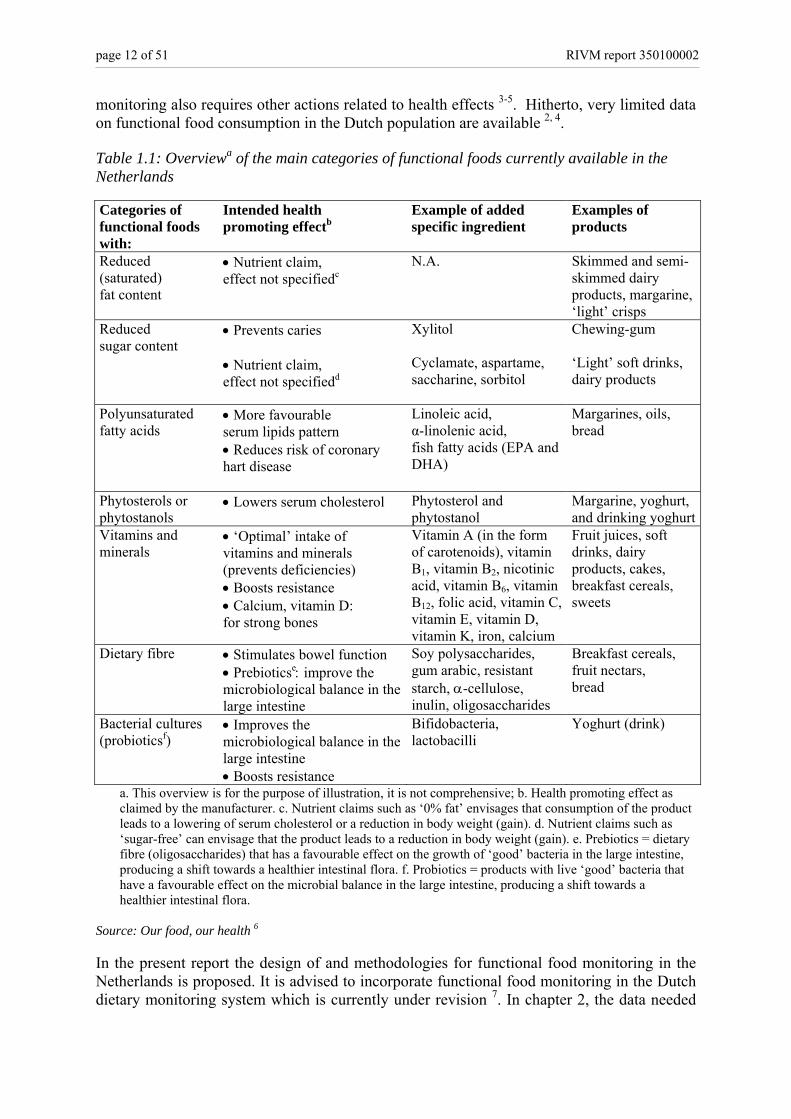
monitoring also requires other actions related to health effects 3-5. Hitherto, very limited data on functional food consumption in the Dutch population are available 2, 4. Table 1.1: Overviewa of the main categories of functional foods currently available in the Netherlands Categories of functional foods with:
Intended health promoting effectb
Example of added specific ingredient
Examples of products
Reduced (saturated) fat content
• Nutrient claim, effect not specifiedc
N.A. Skimmed and semi-skimmed dairy products, margarine, ‘light’ crisps
Reduced sugar content
• Prevents caries • Nutrient claim, effect not specifiedd
Xylitol Cyclamate, aspartame, saccharine, sorbitol
Chewing-gum ‘Light’ soft drinks, dairy products
Polyunsaturated fatty acids
• More favourable serum lipids pattern • Reduces risk of coronary hart disease
Linoleic acid, α-linolenic acid, fish fatty acids (EPA and DHA)
Margarines, oils, bread
Phytosterols or phytostanols
• Lowers serum cholesterol Phytosterol and phytostanol
Margarine, yoghurt, and drinking yoghurt
Vitamins and minerals
• ‘Optimal’ intake of vitamins and minerals (prevents deficiencies) • Boosts resistance • Calcium, vitamin D: for strong bones
Vitamin A (in the form of carotenoids), vitamin B1, vitamin B2, nicotinic acid, vitamin B6, vitamin B12, folic acid, vitamin C, vitamin E, vitamin D, vitamin K, iron, calcium
Fruit juices, soft drinks, dairy products, cakes, breakfast cereals, sweets
Dietary fibre • Stimulates bowel function • Prebioticse: improve the microbiological balance in the large intestine
Soy polysaccharides, gum arabic, resistant starch, α-cellulose, inulin, oligosaccharides
Breakfast cereals, fruit nectars, bread
Bacterial cultures (probioticsf)
• Improves the microbiological balance in the large intestine • Boosts resistance
Bifidobacteria, lactobacilli
Yoghurt (drink)
a. This overview is for the purpose of illustration, it is not comprehensive; b. Health promoting effect as claimed by the manufacturer. c. Nutrient claims such as ‘0% fat’ envisages that consumption of the product leads to a lowering of serum cholesterol or a reduction in body weight (gain). d. Nutrient claims such as ‘sugar-free’ can envisage that the product leads to a reduction in body weight (gain). e. Prebiotics = dietary fibre (oligosaccharides) that has a favourable effect on the growth of ‘good’ bacteria in the large intestine, producing a shift towards a healthier intestinal flora. f. Probiotics = products with live ‘good’ bacteria that have a favourable effect on the microbial balance in the large intestine, producing a shift towards a healthier intestinal flora.
Source: Our food, our health 6 In the present report the design of and methodologies for functional food monitoring in the Netherlands is proposed. It is advised to incorporate functional food monitoring in the Dutch dietary monitoring system which is currently under revision 7. In chapter 2, the data needed

RIVM report 350100002 page 13 of 51
for a functional food survey are described, and in chapter 3 the consequences for data collection and the design of the functional food survey are presented. Chapter 4 deals with the required data handling and statistics to translate the collected data into the required results. Finally in chapter 5, conclusions are drawn and some critical aspects are discussed.

page 14 of 51 RIVM report 350100002
RIVM report 350100002 page 15 of 51
2. Data required on functional food consumption
2.1 Prioritizing functional foods to be monitored Presently a large and extending number of different types of functional foods is on the market. In this section we discuss which types of functional foods are important to monitor both from a health promotion (efficacy) and health protection (food safety/signalling) point of view. Priority foods from a health protection (food safety/signalling) point of view. The admittance policy for the micronutrient enriched foods and innovative foodsa with specific bio-active components should be evaluated from time to time in order to check whether intake of micronutrients or bio-active compounds is not higher than expected and exceeds the upper level. This is one of the aspects of post launch monitoring. In a recent report on post launch monitoring of functional foods 5 four criteria (two on product level and two on ingredient level) were proposed to prioritize the different types of functional foods for which consumption should be monitored. The criteria on product level include: 1) Is it a recently (about 1 year) introduced ‘innovative’ food with specific bio-active components? and 2) Has this food been on the market for ten years or a multiple of ten years? For micronutrients or specific bio-active compounds that may be present in functional foods, the proposed criteria (on ingredient level) are: 3) Is there a small range between recommended intake and the safe upper limit? and 4) Are there more than four product groups or non-food products (e.g. dietary supplements) enriched with the same (novel) components? In addition, when relevant indications of adverse effect of a component have emerged while no tolerable upper level has been established, the monitoring of such foods should get priority. Examples of innovative foods that are on the market are: several products enriched with phytosterols or phytostanols, several pre- and probiotica, several products with inuline. After about one year, ten years and multiples of ten years the intake of these foods should be monitored. This should also be the case when the bio-active ingredient has been added to more than four product groups. Because until now, intake data of good quality are not available, De Jong et al. propose to focus on all those foods in the first year, and start with the time scheme in subsequent years 5. Foods enriched with micronutrients with a small range between recommended intake and the safe upper limit are foods enriched with micronutrients for which exemption is needed by Dutch law (vitamin A, D, folic acid, selenium, iodine, copper and zinc). Until now most exemptions have been granted for food products enriched with folic acid and to a lesser extend for products with added vitamin D. At present, monitoring of functional foods with folic acid and vitamin D should therefore have a high priority. Monitoring of the remaining functional foods (like functional foods enriched with micronutrients and bio-active compounds that are generally and historically recognized as safe) may only have priority if the number of products/product groups becomes (very) high or if the total daily intake of a specific bio-active compound may be expected to be high in subpopulations, like supplement users. For example, monitoring of the intake of food a Food products enriched with specific bio-active compounds such as phytosterols, fibers, bacteria, processed proteins, etc.
page 16 of 51 RIVM report 350100002
products (including supplements) containing vitamin B6 is prioritized since the combined usage of foods enriched with vitamin B6 with a high dosed vitamin B6 supplement may result in exceeding the tolerable upper level as signalled earlier 6. Priority foods from a health promotion (efficacy) point of view. From the perspective of a healthy nutrition policy, intake data for foods enriched with micronutrients may be collected in order to evaluate whether the foods are consumed in effective amounts. We propose to give priority to foods enriched with those micronutrients for which groups of the Dutch population have a relatively low intake. In a recent report on nutritional status it was concluded that these micronutrients are vitamins A, B2, B12, and D, folic acid, iodine, magnesium, iron, calcium, chrome, selenium and zinc. Of those micronutrients, at present enriched products are available for vitamins A, B2, B12, D, and folic acid, and minerals magnesium, iron and calcium. Moreover, depending on future policy targets on efficacy of foods, priority may be given to other functional foods with a specific health claim. Products with substantiated claims (examples are Becel pro.activ® dairy products containing phytosterols, and ProFit bread® containing β-glucan), may be prioritised to study the efficacy of these products in the general population by comparing the daily intake with the recommend intake.
2.2 Information needed for priority foods To obtain insight in the intake of functional foods and their bio-active ingredients the monitoring system should collect the following information (of relevance): Information on the study population • Information to determine whether the user/non user is a member of a target or at risk
group: for instance age, sex, presence/absence of a risk factor or impaired physical functioning, being pregnant
• Information to determine whether the study population is representative for the general Dutch population: for instance age, sex, education, region, population density, smoking, alcohol usage, dietary indicators, length, weight
• Information to calculate intake of a component per kg bodyweightb: weight Information on the use of the functional food • Exact identification of product (manufacturer, brand name, variety within the brand) • Frequency of use (i.e. number of times per day, week or month) • Amount consumed • Frequency and amount can be combined to calculate the usual intake in grams per day • If relevant, duration of consumption • If relevant, combined consumption with other foods, supplements and/or drugs that may
interfere Information on the functional food needed to calculate the usual daily intake of the nutrient or the bio-active compound • Product composition: amount of nutrients and/or bio-active compounds per 100 g or per
100 kcal • Size of a serving b some tolerable Upper Levels (ULs) are given per kg body weight, others in absolute amounts
RIVM report 350100002 page 17 of 51
Information to calculate the total daily exposure to the nutrient or bio-active compound including the intake of the micronutrient/bio-active compound from other sources than the functional food • Intake of other products that contain the specific micronutrient or bio-active compound
(traditional foods products, dietary supplements, other sources if relevant). Depending on frequency of use this can either be obtained in frequency and amount per time (food frequency questions) or amount on several independent days (24-h dietary recalls; see chapter 3)
• Information on the other sources of the micronutrient or bio-active compound: for instance product composition, and, if relevant, size of a serving
With the information specified above the total intake of the functional ingredient can be calculated for an individual. In chapter 4, more information is given on the way to obtain the type of result needed to answer the policy questions.

page 18 of 51 RIVM report 350100002
RIVM report 350100002 page 19 of 51
3. Proposal for functional food data collection Given the aims that are specified in chapter 1, some important preconditions can be given for functional food monitoring. These include the possibility to monitor in a study population that is representative for the general Dutch population and specific subgroups (target- and at risk groups), the possibility to monitor the intake at product and ingredient level, and the possibility to monitor the total daily intake of a specific ingredient (including the intake from functional foods, supplements and traditional food products). It is recommended to conduct functional food monitoring within the new Dutch dietary monitoring system. In this chapter, a short introduction of the five components of the new Dutch dietary monitoring system will be given. After this the possibility for implementation of functional food monitoring within the system is described.
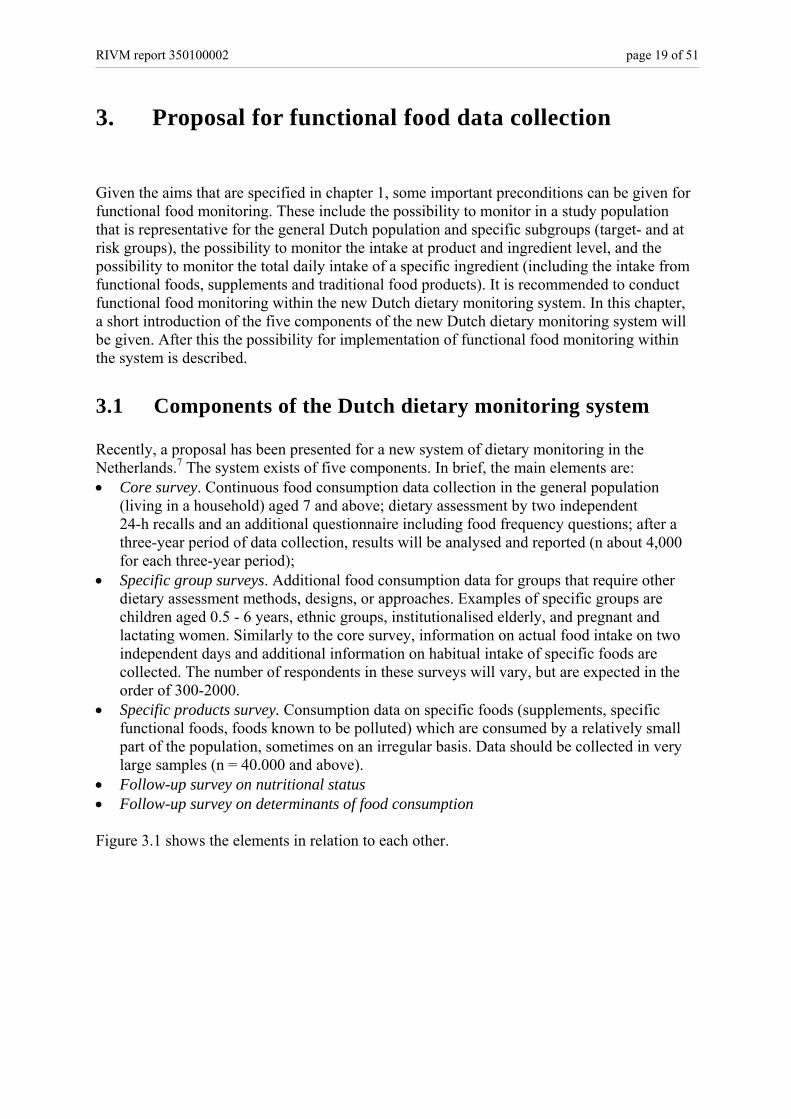
3.1 Components of the Dutch dietary monitoring system Recently, a proposal has been presented for a new system of dietary monitoring in the Netherlands.7 The system exists of five components. In brief, the main elements are: • Core survey. Continuous food consumption data collection in the general population
(living in a household) aged 7 and above; dietary assessment by two independent 24-h recalls and an additional questionnaire including food frequency questions; after a three-year period of data collection, results will be analysed and reported (n about 4,000 for each three-year period);
• Specific group surveys. Additional food consumption data for groups that require other dietary assessment methods, designs, or approaches. Examples of specific groups are children aged 0.5 - 6 years, ethnic groups, institutionalised elderly, and pregnant and lactating women. Similarly to the core survey, information on actual food intake on two independent days and additional information on habitual intake of specific foods are collected. The number of respondents in these surveys will vary, but are expected in the order of 300-2000.
• Specific products survey. Consumption data on specific foods (supplements, specific functional foods, foods known to be polluted) which are consumed by a relatively small part of the population, sometimes on an irregular basis. Data should be collected in very large samples (n = 40.000 and above).
• Follow-up survey on nutritional status • Follow-up survey on determinants of food consumption Figure 3.1 shows the elements in relation to each other.
page 20 of 51 RIVM report 350100002
Figure 3.1: Schematic overview of the proposed new system of dietary monitoring in the Netherlands.
3.2 The core survey and the specific groups surveys In the core survey, two types of dietary assessment methods are employed in the general population, i.e. two independent dietary recalls and a concise food frequency questionnaire. Experience with this type of survey has been gained in 2003 8, and is planned to be extended for children aged 7 and above in the coming years. When the outcome is successful the continuous data collection could start afterwards, if sufficient funding is available. The first three-year period of data collection is planned to take place in the period 2007-2010. The 24-h recall data in the core survey are suitable to estimate the usual distribution of intake of foods that are frequently consumed by a large proportion of the population, or for nutrients/compounds that have various food sources which together are frequently consumed by a large proportion of the population. The usual intake distribution of micronutrients that are used abundantly for enrichment, like vitamins C and B6 can be estimated from the 24-h recall data in the core survey. For other enriched foods like those with folic acid or for specific innovative foods like products with phytosterols or -stanols, which are consumed by fewer people, the data give some insight but are insufficient to estimate the percentage of subjects above a safe upper level. As the 24-h recall is an open method (all consumed foods on a given day are reported) relatively few actions are needed to make the method suitable for functional food monitoring purposes. Most importantly the data need to be precise enough to exactly identify a consumed functional food. When the 24-h recall data are collected using the computer-assisted interview software (EPIC-Soft) 9, the software needs to be prepared for this level of detail in the food groups that include functional foods. Before each new round of data collection, a systematic screening and classification of functional foods on the market needs to be undertaken. The consequences for the food list and the attached follow-up questions to
Follo
w-u
p
Si
gnal
ling
st
udie
s
phas
e
Specific products survey Additional data collection
for specific products Among large populations
for important products eaten by few people
Follow-up research on
nutrional status
Specific group survey Additional data collection
for specific groups Infants and tottlers,
pregnant and lactating women, etnic groups,
elderly people
Follow-up research on
determinants of dietary behaviour
Core survey Continuous
core data collection persons aged 7+ y
using 2 independent computer assissted 24-h diet recalls +
additional questionnaire
RIVM report 350100002 page 21 of 51
describe the food need to be analysed, in order to be able to describe the functional foods in such a way that they are exactly identified. The same is the case for dietary supplements. The core survey’s complementary food frequency questionnaire (food frequency questionnaire) has the advantage that it provides valuable information for foods that are consumed infrequently by a considerable proportion of the population. We advise that those (types of) functional foods that are estimated to be consumed by some 1-10 % of the population but not on a daily basis will be incorporated in the food frequency questionnaire. In the anticipated study population of 4,000 subjects in the three year period, this would give information on the consumption frequency (and amounts if relevant) in 40-400 subjects. The usefulness of the final data is dependent on the type of product, the type of consumer and for example the associated within-person and between-person variations in the intake data. In practice this would mean that in the preparation phase of a new three year period an inventory of the functional foods needs to be made and the foods have to be incorporated in the food frequency questionnaire. The same should be done for dietary supplements. Moreover, it might be wise to evaluate on a yearly basis whether the food frequency questionnaire should be adapted because some products are no longer available whereas others might be new. Similarly, the specific group surveys are valuable for the same types of functional foods but in specific groups. Since the study size of these surveys will probably be smaller than that of the core survey, functional foods that are consumed by a higher percentage of subjects than in the core survey can be included. In 2005/2006, experience is gained for the group of children aged 2-6 years (intended study size 1280), and the food frequency questionnaire will provide information on margarine and dairy foods enriched with phytosterols/-stanols, probiotics, vitamin and/or mineral enriched juices, desserts, dairy foods or biscuits, dietary supplements.
3.3 The specific products survey The specific products survey is specifically focussed on those products of interest that are consumed by too few people in the core survey or the specific group surveys. Such a survey is required because some groups of foods contribute highly to the intake of nutrients or the exposure to contaminants although they are only used by a small proportion of the population. The specific products that may be included are foods high in toxic chemicals (for instance fatty fish), specific dietary supplements, and specific functional foods. Many foods that belong to these groups are expected to be eaten by less than 5% (200 participants) of the total study population of about 4,000 persons of the core data collection. Such a small number of users prohibits an accurate estimation of intake/exposure levels in the core survey. To overcome this problem a specific product survey has been proposed. For functional foods monitoring this survey will be very important because most functional foods are relatively new products and can thus be expected to be consumed by relatively few people. Until now, this type of survey has not been conducted within the national food consumption survey system. Therefore, in this paragraph a proposal for the design and methods of this survey will be presented from the viewpoint of functional food monitoring.
page 22 of 51 RIVM report 350100002
3.3.1 Design of the specific products survey for functional food monitoring We advise that the module for the functional food intake in the specific products survey will be targeted on those functional foods from the priority list in chapter 2 which are consumed by fewer than about 5% of the population. Since new functional foods appear on the market continuously, whereas others disappear, the module should be flexible. For this reason we propose a bi-annual data collection. In year one the data collection is prepared, in year two data are collected, etcetera. One step in the preparation phase is thus to decide which functional foods fulfil the criteria to be included in the questionnaire. Moreover, the required information on dietary supplements with the same active components needs to be identified. The next step is to adapt the questionnaire accordingly. This step should be taken as late as possible in the process, since the market changes very quickly in this respect. A screening question whether or not a person is user of the specific product, in combination with information on socio-demographic characteristics is sufficient for the estimation of the percentage of users and the characterisation of users (in contrast to non-users). Only among users further information on consumption frequency, consumed amounts, and in some cases more in-depth background information is required. In principle a representative sample of the total Dutch population should be included in the survey. In order to reach a sufficient number of consumers of the specific foods, screening questions to identify functional food consumers should be applied in very large population samples. We advise a size of at least 40,000 subject so that 400 consumers can be identified for products that are consumed by 1% of the population. Given the above requirements an internet-based food frequency questionnaire seems most appropriate as functional food assessment tool. Such a questionnaire can easily be distributed among a large study population without the costs becoming too high. Moreover, a major advantage of an internet-based questionnaire is that the respondent gets presented a minimum amount of questions. Answer dependent routing type questions are used to shorten the questionnaire. For example, when a respondent does not consume products from a product group, e.g. cereal bars, no further questions about the cereal bars will be asked. A proposal for the questionnaire is given in sub section 3.3.2. One specific element to consider is obtaining information on the consumption of functional foods by elderly and children. For young children, it is advised that one of the parents or caretakers fills out the questionnaire. However this person might not always know exactly which products are used in for example kindergartens. From a certain age (± 9 years) onwards, the children themselves will know better what is eaten and it is advised that at the earliest age possible child and parent fill out the questionnaire together. At a later age, the child (adolescent) itself will be the best person to fill out the questionnaire. For a large proportion of the elderly, internet-based questionnaires might not be feasible and other options need to be explored. In the Netherlands several market research organisations dispose of large internet consumer panels that are approached with internet-based questionnaires on a regular basis.
RIVM report 350100002 page 23 of 51
3.3.2 An internet-based food frequency questionnaire A food frequency questionnaire is a questionnaire in which the respondent is presented with a list of foods and is required to say how often each is eaten in broad terms such as x times per day/per week/per month, etcetera. Foods selected are usually chosen for the specific purposes of a study and may not assess total diet 10. To test the feasibility of an internet-based food frequency questionnaire for functional foods, a questionnaire targeted at folic acid and phytosterols/-stanols has been worked out as a first step. Several sample pages of the draft questionnaire are given in Appendix 1. The two types of functional foods were selected as representatives of different types of the priority functional foods occurring increasingly on the market. The questionnaire starts with a general instruction for filling out the food frequency questionnaire, followed by a general part for respondent characteristics. The food frequency section consists of a food list and a frequency response section (Figure 3.2). At the end, a separate section on dietary supplements is included. Throughout the questionnaire pop-up instructions for specific questions within the food frequency questionnaire are available for the respondent. The idea is that the structure of the questionnaire will be similar when the consumption is assessed for other functional foods, but the items included will differ. General questions The questionnaire starts with a general part for respondent characteristics. If the questionnaire is distributed to a market research agency panel, some general characteristics such as gender and age may already be known. Furthermore, height and weight are asked, as well as some other characteristics such as ethnicity and education level. These characteristics are necessary both for data analysis and checking the sample for representative ness of the population, see chapter 2. The general questions were mainly derived from the ‘Local and National Public Health Monitor’ (in Dutch: ‘Lokale en Nationale Monitor Volksgezondheid’) 11. In this way populations of both studies can be compared. A few additional questions were added to assess whether a functional food reaches the target group. This includes questions about (elevated) blood cholesterol level and cholesterol-lowering medication, related to plant sterol/stanol use and a question to check for (expected/wished) pregnancy as this is related to folic acid use. These questions are specific for the chosen example functional foods. Food list The food list consists of the brands of foods (both major name brands and private labels) with the nutrients/bio-active compound of interest. To derive the list for the questionnaire model, an inventory was made of functional foods enriched with folic acid or phytosterols/-stanols. In the list all products were included for which recently exemption has been granted for the addition of folic acid by the ministry of Health, Welfare and Sport [http://www.row.minvws.nl/content.aspx?cid=162]. This list was expanded with other functional foods enriched with folic acid or phytosterols/-stanols by information from literature, magazines, a supermarket inventory and information from manufacturers. The food list is probably incomplete; however it is expected to cover the majority of relevant products. In the next step the identified products were grouped into food groups. For folic acid and phytosterols/-stanols the groups are: breakfast cereals, cereal bars, margarine, yoghurt and supplements. Two other groups (flavoured milk powder and yoghurt/milk drink) were added containing only specific products that could not be grouped with other products.
page 24 of 51 RIVM report 350100002
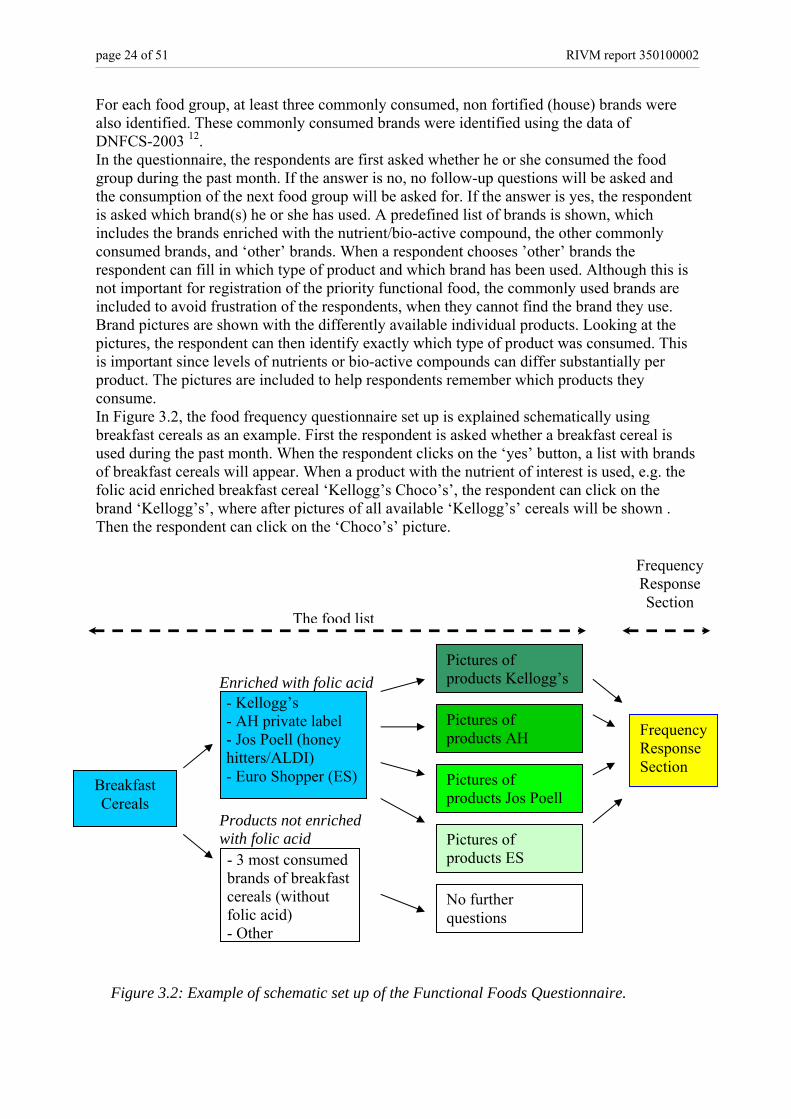
For each food group, at least three commonly consumed, non fortified (house) brands were also identified. These commonly consumed brands were identified using the data of DNFCS-2003 12. In the questionnaire, the respondents are first asked whether he or she consumed the food group during the past month. If the answer is no, no follow-up questions will be asked and the consumption of the next food group will be asked for. If the answer is yes, the respondent is asked which brand(s) he or she has used. A predefined list of brands is shown, which includes the brands enriched with the nutrient/bio-active compound, the other commonly consumed brands, and ‘other’ brands. When a respondent chooses ’other’ brands the respondent can fill in which type of product and which brand has been used. Although this is not important for registration of the priority functional food, the commonly used brands are included to avoid frustration of the respondents, when they cannot find the brand they use. Brand pictures are shown with the differently available individual products. Looking at the pictures, the respondent can then identify exactly which type of product was consumed. This is important since levels of nutrients or bio-active compounds can differ substantially per product. The pictures are included to help respondents remember which products they consume. In Figure 3.2, the food frequency questionnaire set up is explained schematically using breakfast cereals as an example. First the respondent is asked whether a breakfast cereal is used during the past month. When the respondent clicks on the ‘yes’ button, a list with brands of breakfast cereals will appear. When a product with the nutrient of interest is used, e.g. the folic acid enriched breakfast cereal ‘Kellogg’s Choco’s’, the respondent can click on the brand ‘Kellogg’s’, where after pictures of all available ‘Kellogg’s’ cereals will be shown . Then the respondent can click on the ‘Choco’s’ picture.
Enriched with folic acid
Products not enriched with folic acid
Breakfast Cereals
- Kellogg’s - AH private label - Jos Poell (honey hitters/ALDI) - Euro Shopper (ES)
Pictures of products AH
Pictures of products Kellogg’s
Pictures of products Jos Poell
FrequencyResponse Section
Figure 3.2: Example of schematic set up of the Functional Foods Questionnaire.
The food list
No further questions
- 3 most consumed brands of breakfast cereals (without folic acid) - Other
Frequency Response Section
Pictures of products ES
RIVM report 350100002 page 25 of 51
Frequency response section After identification of the functional food of interest, the frequency of use and the portion size are to be assessed. The respondent can choose the number of days per month or week that the product is consumed. This is followed by a separate question about the number of portions per day. For some products the serving size is predetermined as it is packed per portion, e.g. cereal bars. For other products such as margarine and breakfast cereals, portion size will be assessed using pictures of different portion sizes. For the pilot questionnaire, these pictures were extracted from the EPIC- Soft Picture Book used for the DNFCS-2003. Supplement section The supplement section was based on the supplement database that was set up for supplement assessment as part of DNFCS-2003 13. From this database all folic acid containing supplements were identified and divided into four groups: folic acid supplements, multivitamin and mineral supplements, vitamin B-complex supplements and vitamin B12 supplements. Unexpectedly, in the latter category some supplements appeared to contain folic acid as well. In the questionnaire, first a question about supplement use will be asked. When respondents do use supplements, a generic list of supplement groups will be shown. Besides the above mentioned groups, the groups calcium, iron, vitamin A, A/D, C, D and E are included for face-validity. When respondents click on one of the groups of folic acid containing supplements, all brands mentioned in the supplement database within this group will be shown, and the type of supplement unit, e.g. tablet or drops, is asked. After this, the frequency of use is assessed. Respondents can choose a frequency per month, per week or per day. Due to time limitations, consumption in different seasons is not accounted for in the questionnaire. However, in a future questionnaire, a separate section for seasonal variation can be included. It was chosen not to include the period of use, since it will make the food frequency questionnaire more complicated and the benefit of this information is questioned.
3.4 Product composition database The availability of functional foods at the consumers’ market concerns all kind of products, including enriched foods and innovative foods. To calculate the nutrient and bio-active component intake through functional foods consumption a ‘functional food composition database’ will be needed in which the amounts of nutrients and bio-active components of the foods are given. Although in this report special attention is given to products enriched with folic acid and phytosterols/-stanols, a functional food composition database should contain as much products as possible. Existing Dutch food databases are not sufficient to cover these needs: the Dutch food composition table (NEVO) [http://www.nevo-foodcomp.nl/]is not product specific and the ALBA database (ALlergenen dataBAnk) on allergic food components [http://www.allergenendatabank.nl/] contains no nutrient information.
page 26 of 51 RIVM report 350100002
Several difficulties hamper the realisation and actualisation of a functional food database: • The fast growing (European) market of functional foods, • No compulsory registration of newly launched enriched products (expired since
September 2004) [Staatsblad 2004, 461], • No compulsory registration of retrieved products, • Product specificity is necessary: each brand within product groups is a different item
and within brands each individual product is a different item, • Not only the amounts of ‘functional specific’ nutrients or bio-active components have
to be tabulated, also ‘usual’ macro and micro nutrients and energy, • In many cases just label information is available, • It is unknown whether label values indicate the minimum level at the end of the shelf
life, the mean level through the period of shelf life, or other values. To realise a functional food database a few initiatives are interesting:
• The market research institute GfK performs household purchasing scans through EAN/DAS codes (European Article Numbering/Data Alignment System). The ConsumerScan group includes 4,000 households, to be extended to 6,000. Household characteristics are known, for instance geographic region; urbanisation degree; number and age of household members; education level. EAN/DAS codes are product unique. The GfK EAN codes database contains 50,000 food and health products. Weekly hundreds of products are added. Since 2005 newly marketed enriched products within food groups are coded. Recorded fortifications are limited to foods enriched with calcium (94 EAN codes; 11 food groups), vitamins (21 EAN codes; 8 food groups) and iron (4 EAN codes; 1 food group (milk)). GfK is interested in extension of this system. [Personal communication]. These data thus show which functional foods are used; not the composition of the functional foods. To some extent the data might be used to estimate the consumption of functional foods. TNO calculated the reliability of using purchase data for estimation of consumption data (Van Erp-Baart, personal communication). They compared three product groups: (1) margarine, low-fat margarine and cooking fat products, (2) vegetables and (3) chocolate and candy bars. It appeared that only data on group (1) ‘fats and margarine’ seem to be reasonably useful. Consumption data of (fresh) vegetables exceed purchase data with 30%, a problem is the lack of EAN scan codes on fresh products. Purchase data and consumption data of chocolate and candy bars differ too much to come to conclusions. If purchase data of functional food should be used to estimate consumption data maybe some similarity can be expected to the product group of margarines and cooking fat, but also to chocolate and candy bars. This is because functional foods are also packaged, some will be consumed indoors, as are the fat products in the TNO study, whereas others indoors as well as outdoors (like candy bars).
• Since February 2005 the international EAN organisations have integrated their standards in the new organisation GS1, including the new Global Data Synchronisation Network (GDSN) and DAS. GS1 is world leading in product identification standard EPC (Electronic Product Code). This will extend coding possibilities.
• In February 2003 FNLI (Federatie Nederlandse Levensmiddelenindustrie) together with GS1 started promising but till now foundered initiatives to develop a food product database: PRODAS-food. Involved were GPI (Wholesale Product Information) and CBG (Centraal Bureau Grootverbruikleveranciers), the Dutch
RIVM report 350100002 page 27 of 51
Nutrition Centre and CBL (Centraal Bureau Levensmiddelenhandel). Plans were developed to implement as much information as possible, including ingredients, nutrient composition, allergic factors and microbiological values. A feasibility study was carried out and early 2005 a blueprint has been presented to the boards of FNLI and CBL. The plan included proposals to implement the ALBA database, NEVO table and GPI databank. The EAN/DAS data pool system is a recommendable logistic starting point, which can be extended with product content concerning data. A start has to be made to gather information of pre-packaged products. For general products, such as ‘no-brand’ products like potatoes, vegetables and fruit, meat, poultry and fish, bread and dairy products NEVO data can be incorporated. Moreover PRODAS-food should be publicly available with the intention to a possible decrease of compulsory label information and decrease of burdening consumer information desks. The Dutch Nutrition Centre and/or the Ministry of Health, Welfare and Sports opt for quality control; the Ministry of Agriculture, Nature and Food Quality is interested from the transparency point of view. A positive blueprint on the development of PRODAS-food has been presented by EAN Netherlands in April 2004. Unfortunately no implementation seems to be going on due to financial and organisational problems.
• The ‘Compendium Dieetproducten en Voedingsmiddelen’, publisher Bohn Stafleu Van Loghum, offers yearly an outline of diet products and food products with deviant nutrient composition. Since 2005 also (low dose) food supplements are recorded. According to the publisher this database covers about 70% of the most important Dutch (diet) food market 14. Agreements are possible to use this database or to exchange information.
• Innovaction BV developed the World Innovation ScanXTC, a monthly revised product database, containing label information of about 130,000 products world wide, gathered through store checks, press releases and trade show visits. Subscription (> € 10,000 minimal) offers online access, tailor made alerts, food trend analyses and trade show reports. A tracing and tracking search can be executed (> € 5,000 minimal).
All mentioned initiatives on food databases concern complete food product databases, not restricted to functional foods. As the number of functional foods on the product market is growing, and sometimes the difference between ‘normal’ (conventional) foods and functional foods is very narrow, it seems to be a recommended development to aspire to a differentiated food database. Products with selected fortifications or other properties can be singled out. The PRODAS-food database is a very promising development, which by all means should be stimulated and activated. For short term research on functional foods (like the pilot internet-based food frequency questionnaire on folic acid enriched products) the database of the ‘Compendium Dieetproducten en Voedingsmiddelen’ will be very useful. Maybe this could lead to a Brand database, like the Belgium Database of Trade names, in which nutrient data are gathered [www.internubel.be]. At present in the Netherlands no up to date supplement composition database is publicly available for research. If estimation of micronutrient intake from dietary supplements is one of the aims for future Dutch dietary monitoring, it is strongly advised to create such a dynamic database. Previously built databases, like the one of the Dutch Consumers’ Association or at Maastricht University might be good starting points. The dietary supplement database must be continually updated using procedures similar to those used for formulating a food composition database: transparent documentation, quality control and
page 28 of 51 RIVM report 350100002
source information are necessary. Alternatively and probably more cost efficient, the database might be updated based on reported supplements in dietary surveys. In that case it would be important that this update is done during the survey period. Otherwise the composition of the supplements at the time of consumption might not be obtained afterwards. It is common practice that dietary supplement databases are compiled from label information obtained from the product manufacturers, through the Internet, or from the package label. This is also the case for the Dutch supplement databases of the Dutch Consumer Association, and of Maastricht University. Supplement labels may not accurately reflect actual supplement content for both nutrient and non-nutrient ingredients. For example it is known that micronutrient concentrations in supplements are usually higher than indicated before the expiration date to compensate for the decline during shelf-life. The degree of error presently occurring for the content of dietary supplements, even for multi-vitamin and mineral supplements in list databases, is unknown. Supplement databases and its utility for the estimation of micronutrient intake form dietary supplements would therefore benefit from a system of analytical verification. Targeted testing of major name brand and private label brand supplements would be a first step towards verification of dietary supplement composition. Several developments in this field, like the harmonisation of analytical methods and the development of reference materials are currently going on at an international level. Also challenges like how to deal with time-released capsules are being addressed.
RIVM report 350100002 page 29 of 51
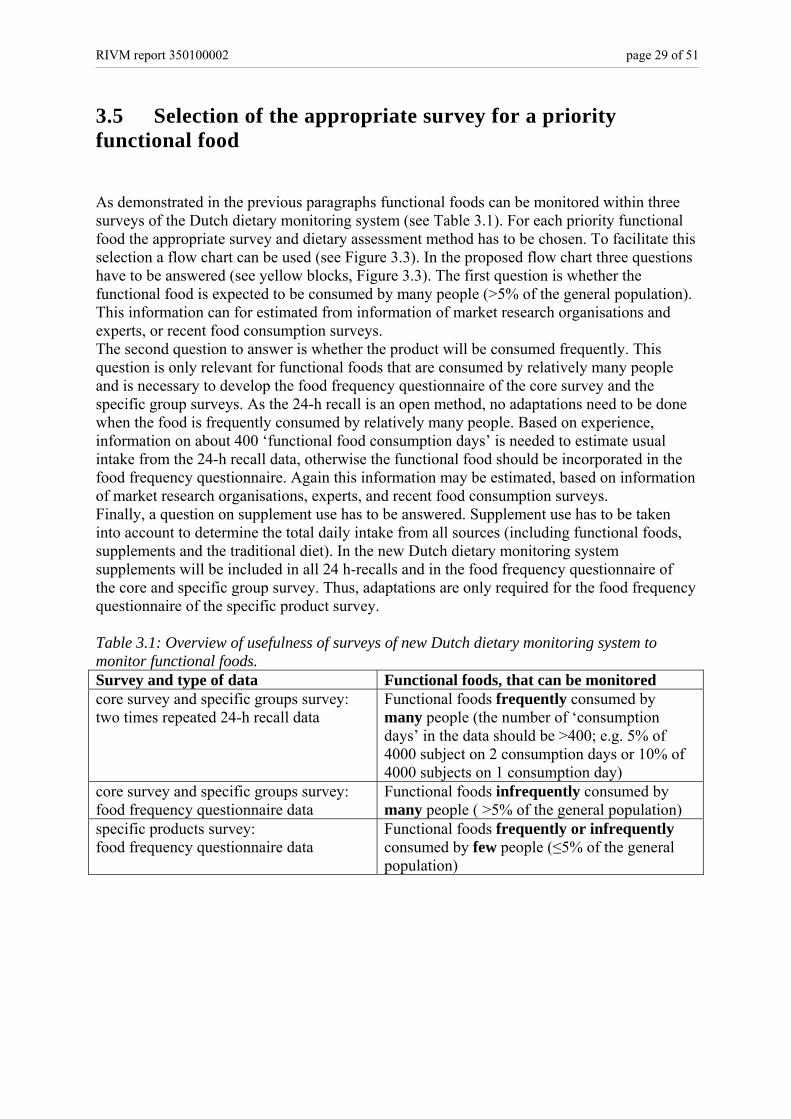
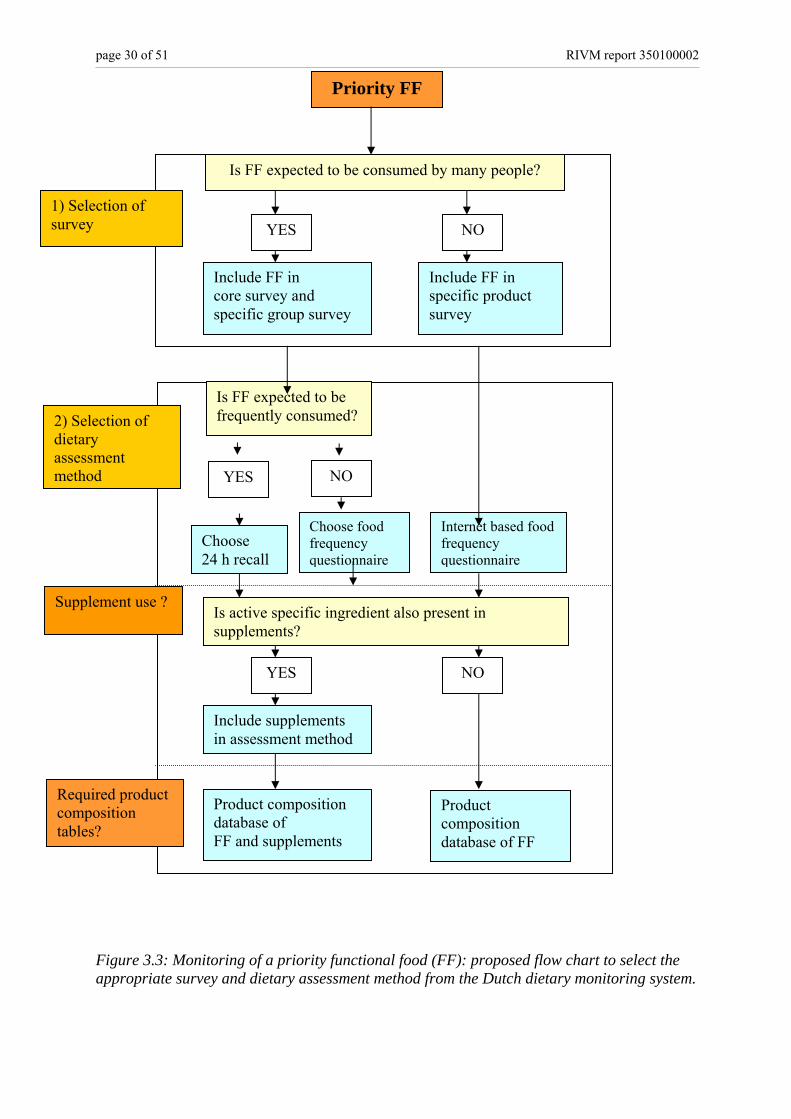
3.5 Selection of the appropriate survey for a priority functional food As demonstrated in the previous paragraphs functional foods can be monitored within three surveys of the Dutch dietary monitoring system (see Table 3.1). For each priority functional food the appropriate survey and dietary assessment method has to be chosen. To facilitate this selection a flow chart can be used (see Figure 3.3). In the proposed flow chart three questions have to be answered (see yellow blocks, Figure 3.3). The first question is whether the functional food is expected to be consumed by many people (>5% of the general population). This information can for estimated from information of market research organisations and experts, or recent food consumption surveys. The second question to answer is whether the product will be consumed frequently. This question is only relevant for functional foods that are consumed by relatively many people and is necessary to develop the food frequency questionnaire of the core survey and the specific group surveys. As the 24-h recall is an open method, no adaptations need to be done when the food is frequently consumed by relatively many people. Based on experience, information on about 400 ‘functional food consumption days’ is needed to estimate usual intake from the 24-h recall data, otherwise the functional food should be incorporated in the food frequency questionnaire. Again this information may be estimated, based on information of market research organisations, experts, and recent food consumption surveys. Finally, a question on supplement use has to be answered. Supplement use has to be taken into account to determine the total daily intake from all sources (including functional foods, supplements and the traditional diet). In the new Dutch dietary monitoring system supplements will be included in all 24 h-recalls and in the food frequency questionnaire of the core and specific group survey. Thus, adaptations are only required for the food frequency questionnaire of the specific product survey. Table 3.1: Overview of usefulness of surveys of new Dutch dietary monitoring system to monitor functional foods. Survey and type of data Functional foods, that can be monitored core survey and specific groups survey: two times repeated 24-h recall data
Functional foods frequently consumed by many people (the number of ‘consumption days’ in the data should be >400; e.g. 5% of 4000 subject on 2 consumption days or 10% of 4000 subjects on 1 consumption day)
core survey and specific groups survey: food frequency questionnaire data
Functional foods infrequently consumed by many people ( >5% of the general population)
specific products survey: food frequency questionnaire data
Functional foods frequently or infrequently consumed by few people (≤5% of the general population)
page 30 of 51 RIVM report 350100002
Figure 3.3: Monitoring of a priority functional food (FF): proposed flow chart to select the appropriate survey and dietary assessment method from the Dutch dietary monitoring system.
Is FF expected to be consumed by many people?
Priority FF
YES NO
Include FF in core survey and specific group survey
Include FF in specific product survey
1) Selection of survey
2) Selection of dietary assessment method
Is FF expected to be frequently consumed?
YES NO
Choose 24 h recall
Choose food frequency questionnaire
Internet based food frequency questionnaire
Is active specific ingredient also present in supplements?
YES
Include supplements in assessment method
NO
Required product composition tables?
Product composition database of FF and supplements
Product composition database of FF
Supplement use ?
RIVM report 350100002 page 31 of 51
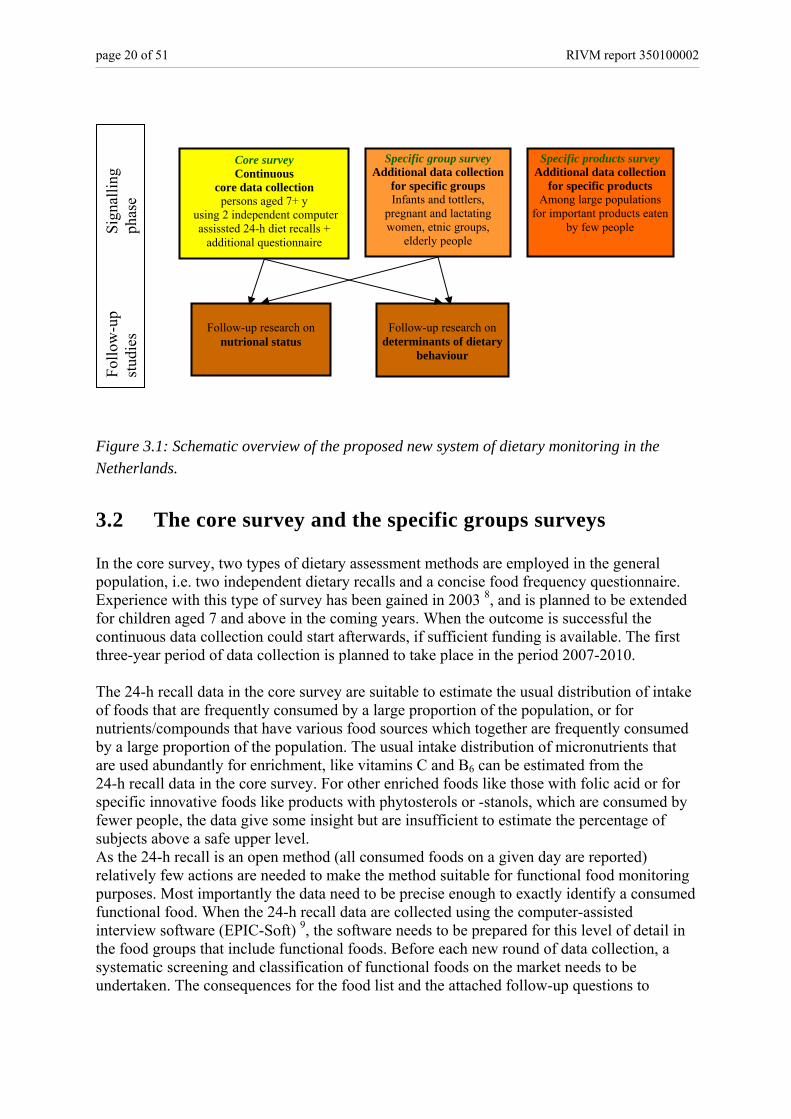
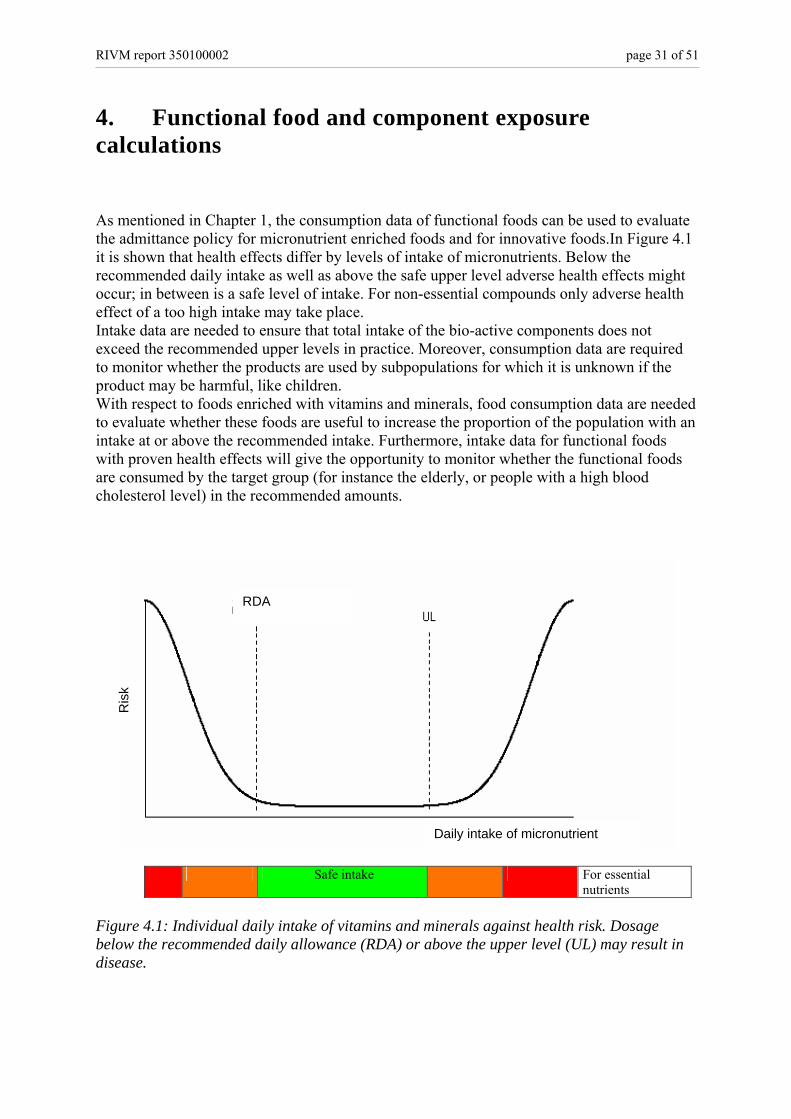
4. Functional food and component exposure calculations As mentioned in Chapter 1, the consumption data of functional foods can be used to evaluate the admittance policy for micronutrient enriched foods and for innovative foods.In Figure 4.1 it is shown that health effects differ by levels of intake of micronutrients. Below the recommended daily intake as well as above the safe upper level adverse health effects might occur; in between is a safe level of intake. For non-essential compounds only adverse health effect of a too high intake may take place. Intake data are needed to ensure that total intake of the bio-active components does not exceed the recommended upper levels in practice. Moreover, consumption data are required to monitor whether the products are used by subpopulations for which it is unknown if the product may be harmful, like children. With respect to foods enriched with vitamins and minerals, food consumption data are needed to evaluate whether these foods are useful to increase the proportion of the population with an intake at or above the recommended intake. Furthermore, intake data for functional foods with proven health effects will give the opportunity to monitor whether the functional foods are consumed by the target group (for instance the elderly, or people with a high blood cholesterol level) in the recommended amounts.
Safe intake For essential nutrients
Figure 4.1: Individual daily intake of vitamins and minerals against health risk. Dosage below the recommended daily allowance (RDA) or above the upper level (UL) may result in disease.
Daily intake of micronutrient
RDA
Ris
k
page 32 of 51 RIVM report 350100002
The present chapter will describe how the obtained data will be used in the safety and health benefit assessments. After the safety assessment, one will be able to answer the questions:
At the product level: • 1a. Are particular functional foods consumed by at risk groups?
At the level of the micronutrient of bio-active component: • 1b. Which fraction of the population exceeds the UL? • 1c. Which fraction of the at risk group exceeds the UL?
Secondly, for the health benefit assessment, the following questions can be answered: At the product level:
• 2a. Are particular functional foods consumed by target groups? At the level of the micronutrient of bio-active component:
• 2b. Which fraction of the population complies with the RDA? • 2c. Which fraction of the population (now) complies with the RDA
that did not comply without the intake of functional foods?
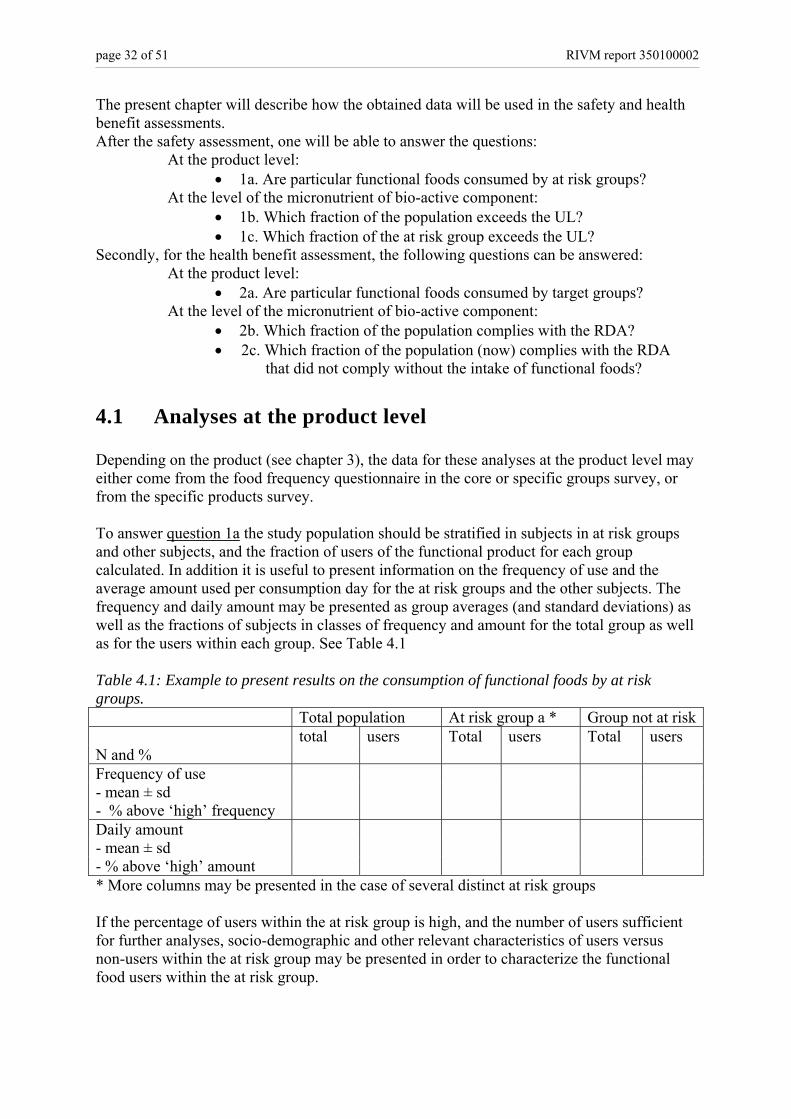
4.1 Analyses at the product level Depending on the product (see chapter 3), the data for these analyses at the product level may either come from the food frequency questionnaire in the core or specific groups survey, or from the specific products survey. To answer question 1a the study population should be stratified in subjects in at risk groups and other subjects, and the fraction of users of the functional product for each group calculated. In addition it is useful to present information on the frequency of use and the average amount used per consumption day for the at risk groups and the other subjects. The frequency and daily amount may be presented as group averages (and standard deviations) as well as the fractions of subjects in classes of frequency and amount for the total group as well as for the users within each group. See Table 4.1 Table 4.1: Example to present results on the consumption of functional foods by at risk groups. Total population At risk group a * Group not at risk total users Total users Total users N and % Frequency of use - mean ± sd - % above ‘high’ frequency Daily amount - mean ± sd - % above ‘high’ amount * More columns may be presented in the case of several distinct at risk groups If the percentage of users within the at risk group is high, and the number of users sufficient for further analyses, socio-demographic and other relevant characteristics of users versus non-users within the at risk group may be presented in order to characterize the functional food users within the at risk group.
RIVM report 350100002 page 33 of 51
Similarly, to answer question 2a, the study population should be stratified in subjects in the target groups and other subjects. Again the fraction of users for each group should be calculated as well as the frequency of use and daily amount used. Rather than presenting information on the fraction above ‘high’ levels, the fraction in the recommended frequency and/or amount should be presented.
4.2 Analyses at the level of the micronutrient or bio-active component To answer the questions which fraction of the population (or at risk group) exceeds the UL or complies with the RDA, the usual intake of the population needs to be calculated from the frequency of use of a functional food and the average amount consumed. Core and specific group surveys If a functional food is used by a large number of people and therefore assessed in either the core or the specific subject survey of the Dutch National Food Survey, the intake of the functional component can be assessed similarly as for other compounds present in either frequently consumed foods (such as dioxins, present in animal fat). The concentration of the components in the products can be taken from the product composition database (Section 3.4). A number of statistical models can be used for the estimation of the usual intake distribution of the components 15-17 . Consequently, the intake distribution can be compared to the recommended daily intakes and upper levels for each age class. As a result the fractions of the population meeting the recommended daily intake (question 2b) and exceeding the upper levels (question 1b) can be calculated for each age class, both for the target group (question 2c) and the at risk group (question 1c). Note that the number of positive intakes in the two-day survey should be at least ~400 for each group to be reported. For the infrequently consumed functional foods, data of the food frequency questionnaire in the core survey can be used to derive usual intake directly or to combine the propensity for use with the 24-h recall data. In addition, if relevant, the intake of the component via the intake of supplements should be taken into account. These intake data are available via the questionnaires added to the core survey. Specific products survey For those functional foods which are consumed infrequently the consumption frequency and amount are assessed via the functional food-questionnaire. The completed questionnaire gives the number of times that a product containing a given component (being a functional food or a supplement) is consumed by the participant during the last month and the corresponding average portion size. Knowing the concentration of the component in the products (product composition database), the usual intake of the functional component by this participant can be calculated. (Note that a participant also can be a non-consumer of a functional component, in that case the intake of this participant is zero). Since the functional food-questionnaire will be completed by a large number (at least 40,000) of individuals, in this manner the usual intake distribution of the functional component can be estimated directly. If the functional foods in the frequency questionnaire are the only source of the components, the fractions of the population meeting the recommended daily intake (question 2b) and exceeding the upper levels (question 1b) can be calculated directly for each age class, and for the target group (question 2c) and the at risk group (question 1c) . If this is
page 34 of 51 RIVM report 350100002
not the case the data of the food frequency questionnaire should be combined with those of the core and specific survey. Combining data of specific products survey with data from core or specific group survey Some functional components, e.g. vitamins and minerals, are not only taken in via functional foods (and supplements), but also via the regular diet. For these components information on the regular diet from the core survey has to be combined with the information of the functional food-questionnaire to obtain the total intake. This can be performed in a probabilistic manner, using Monte Carlo simulations. In a Monte Carlo simulation, an individual’s intake via the regular diet is drawn from the core survey intake distribution and another individual’s intake of functional foods and supplements is drawn form the distribution obtained from the functional food-questionnaire. These two intakes are summed, resulting in a total intake. If this procedure is repeated a large number of times, a distribution of total intakes is obtained. These distributions may be used to answer the questions 1b and c, and 2b and c. The question arises if there are correlations between the intake of the functional component via the regular diet, functional foods and supplements. For example, do persons with a healthy regular diet have a higher intake of functional food and supplements? If such correlations are present they need to be taken into account. The core survey data contain information on the regular diet as well as on the more commonly used functional foods and the use of supplements. Since, the functional food-questionnaire also asks for supplement use of specific vitamins and minerals of interest, information about the correlation between ‘regular diet-supplement’ and ‘functional food-supplement’, and ‘regular diet-functional food’ is present in these datasets.
RIVM report 350100002 page 35 of 51
5. Discussion and conclusions The growing consumption of functional foods increases the need to monitor this consumption both from a food safety point of view and a healthy nutrition point of view. Such monitoring can also be looked upon as (part of) post launch monitoring. The new design of the Dutch dietary monitoring system seems adequate to incorporate functional food monitoring. Herein ‘core surveys’, ‘specific group surveys’ and ‘specific product surveys’ will be conducted. Because many functional foods are used, but only by a small fraction of the population, it is necessary to collect information on functional food consumption in the specific products survey in addition to the core data collection and the specific group surveys. Figure 3.3 in section 3.5 summarizes this set-up. Before drawing a conclusion on the proposed design and methods for functional food monitoring, we want to discuss some critical aspects. This concerns issues with regard to the representative ness of the study population, the validity of the intake data, and various aspects to be resolved. Representative ness In the three consumption modules of the dietary monitoring system (core survey, specific groups surveys, and specific products survey) respondents are sampled from consumer panels of market research organisations. The representative ness of the study populations with regard to socio demographic characteristics can be influenced in the study design and analyses (weighting). However, it cannot be excluded that the panel members have different dietary habits than non-members because the willingness to participate in these panels might be related to dietary habits 1. Moreover, the specific foods survey will be among subjects with access to and experience in using the Internet. This might also be a selective group in comparison to the general population because of the so called ‘digital divide’. Some surveys observed that internet users tend to be young, white, highly educated men. Therefore, internet samples are known to be unrepresentative in age, education, race and gender 18, 19. However, in a Swedish study among 875 subjects aged 20-59, no differences in response to a printed questionnaire and web-based questionnaires were observed by age, body mass index and current smoking; and only small differences by sex, education and food habits 20. In another Swedish study to which ~48,000 women were invited, level of education, income and being a non-smoker were positive predictors of participation. These differences, however, were not large when comparing the responders to web and paper-based questionnaires. This study also showed that the use of the internet-based questionnaires did not lead to bias greater than that related to the use of paper questionnaires 21. Moreover, since internet access is growing, the unrepresentative ness of the internet users for the general population may decrease. In 2005, 83 % of the Dutch population (aged 12-75) had access to internet [www.cbs.nl]. To our view, the potential disadvantage of the potential lack of representative ness of an internet study population is outweighed by the major advantages, such as reaching many people in a relatively easy way and making costs manageable. For some subpopulations like the elderly the selectiveness will be a problem and other options such as interview methods need to be explored 22.
page 36 of 51 RIVM report 350100002
Validity It is proposed to use an internet-based food frequency questionnaire in the specific foods survey. Web-based questionnaires have several advantages compared to paper questionnaires including improved data quality (because of instant checks for errors), reduction of costs and time from initiation of the study to the receipt of analyzable data. The interactive element, which allows for the inclusion of visual aids as well as design issues simplifying for the responders, is yet another of the advantages compared to traditional tools for data collection 21. In principal, the habitual intake of functional foods is of interest. For respondents, it might however be difficult to conceptualize consumption over a long period of time, especially in the case of irregular consumption of functional foods. For this reason it was chosen to have a reference period of the past month in the functional food frequency questionnaire. The validity of the food frequency questionnaires needs to be tested. Aspects to study are the specificity and sensitivity to identify users of the specific functional foods and - among the users - the validity of the estimated average daily amount. In general the quality of the obtained information depends on the memory of the respondent and his/her knowledge of the exact products and the amounts he or she has eaten during the previous month. It has been shown that food frequency questionnaires with many items tend to overestimate true consumption 10. Within this project, an example questionnaire on folic acid and phytosterols was drafted. Folate intake assessed by several food frequency questionnaires have been shown to predict serum folate, showing that a valid assessment is possible. However most of these questionnaires cover many foods, or all important sources of folate and folic acid, are not web-based, and are administered in other populations 23. The results of these surveys can therefore not be extended to our questionnaire. For those micronutrients and bio-active components that have other sources than functional foods, the total intake from functional foods and for example traditional foods or dietary supplements needs to be combined. The information on the other sources may be derived from the 24-h recall data in the core or specific group surveys or from the food frequency questionnaire in these surveys. Statistical approaches for combining information from multiple surveys requires assumptions on the independence of the consumption from the various component sources. It is important to test these assumptions 24. Other issues To calculate the nutrient and bio-active component intake through functional foods consumption a ‘functional food composition database’ will be needed in which the amounts of nutrients and bio-active components of the foods are given. At present such a database is not available for the Netherlands. Similarly up-to-date dietary supplement composition data is needed. The validity of these databases will of course also influence the validity of the estimated exposure. Maintenance of both the food frequency questionnaire and the product composition database is very important. The questionnaire will have to be updated each time before it is distributed. In addition, the available databases and information sources should be scanned for new products and changed product compositions. The proposal in this report on functional foods monitoring may also be extended to other components that are present in high concentrations in products that are eaten by few people. Examples of such components are dioxin or heavy metals in fatty fish, or components in
RIVM report 350100002 page 37 of 51
organ meat. A case by case approach is however needed to check whether the proposed design is adequate. Conclusion The proposed monitoring of functional foods within the national food consumption surveys may allow an evaluation of the current admittance policy for these types of foods from both a food safety and a healthy nutrition point of view. This is needed because very limited data on overall functional food consumption in the Dutch population are available, while the consumption of these products is growing. The methodologies and procedures for the specific products survey need to be piloted before actual implementation takes place.

page 38 of 51 RIVM report 350100002
RIVM report 350100002 page 39 of 51
Glossary NEVO Dutch Food Composition Table (Nederlandse Voedingsmiddelentabel) ALBA Database on Allergic Factors in Food (Allergenen Databank) EAN European Article Numbering DAS Data Alignment System GDSN Global Data Synchronisation Network EPC Electronic Product Code GS1 International Organisation (101 national EAN organisations) responsible
for worldwide synchronisation of product information FNLI Federation of Dutch Food Industry (Federatie Nederlandse
Levensmiddelen industrie); (formerly SMA Stichting Merk Artikel) GPI General Product Information, database for large-scale consumption field,
owned by DeliXL and Sligro CBG Central Departement of large-scale consumption products supplier
(Vereniging Centraal Bureau Grootverbruikers) PRODAS-food National food product datapool [PROduct/Data Allignment System for
foods] (in Dutch: NLD: Nationale Levensmiddelen Databank) UL tolarable Upper Level

page 40 of 51 RIVM report 350100002
RIVM report 350100002 page 41 of 51
References
1. Gezondheidsraad. Commissie Trends voedselconsumptie. Enkele belangrijke ontwikkelingen in de voedselconsumptie. Den Haag: Gezondheidsraad, 2002; publicatienr 200/12.
2. Rompelberg CJM, de Jong N, Jansen EHJM. How healthy and safe are functional foods and dietary suppelements? Our food, our health. Healthy die and safe food in the Netherlands. Vol. RIVM report number 270555009. Bilthoven, The Netherlands: National Institute for Public Health and the Environment, 2006: 189-213.
3. Jong N de, Ocké MC. Postlaunch Monitoring of Functional Foods. Methodology development (I). Bilthoven: RIVM, 2004; RIVM report 350030001.
4. Jong N de, Buurma-Rethans EJM, Fransen HP, Ocké MC. Postlaunch Monitoring of Functional Foods. Methodology Development (II). Bilthoven: RIVM, 2005; RIVM report 350030005.
5. Jong N de, Fransen HP, van den Berg S, Ocké MC. Postlaunch Monitoring of Functional Foods. Methodology development (III). Bilthoven: RIVM, 2005; RIVM report 350030006.
6. Kreijl CF van , Knaap AGAC , van Raaij JMA, eds. Our food, our health. Healthy diet and safe food in the Netherlands. Bilthoven, The Netherlands: National Institute for Public Health and the Environment, 2006; RIVM report 270555009.
7. Ocké M, Hulshof KFAM, Bakker MI, Stafleu A, Streppel MT. Naar een nieuw Nederlands voedingspeilingsysteem. Bilthoven: RIVM, 2005; RIVM report 350050001.
8. Ocké MC, Hulshof KFAM, Buurna-Rethans EJM et al. Voedselconsumptiepeiling 2003 - samenvatting werkwijze en evaluatie. Bilthoven: RIVM / TNO, 2003; RIVM rapport 350030003; TNO rapport V5999/01.
9. Slimani N, Ferrari P, Ocke M et al. Standardization of the 24-hour diet recall calibration method used in the European Prospective Investigation into Cancer and nutrition (EPIC): general concepts and preliminary results. Eur J Clin Nutr 2000; 54(12):900-17.
10. Margetts BM, Nelson M. Design Concepts in Nutrition Epidemiology. Oxford: Oxford University Press, 1997.
11. Loon AJM van, van Veldhuizen H. Voortgangsrapportage 2003 Lokale en Nationale Monitor Volksgezondheid. Bilthoven: RIVM, 2004; RIVM rapport 260854007/2004.
12. Hulshof KFAM, Ocké MC, van Rossum CTM et al. Resultaten van de voedselconsumptiepeiling 2003. Bilthoven: RIVM, 2004; RIVM rapport 350030002; TNO rapport V6000.
13. Ocké MC, Buurma-Rethans EJM, Fransen HP. Dietary supplement use in the Netherlands. Current data and recommendations for future assessment. Bilthoven: RIVM, 2005; RIVM report 350100001/2005.
14. Kaathoven N van, van Genuchten S, eds. Compendium Dieetproducten en Voedingsmiddelen, 33e editie. Houten: Bohn Stafleu van Loghum, 2006.
15. Slob W. Modeling long-term exposure of the whole population to chemicals in food. Risk Anal 1993; 13(5):525-30.
16. Nusser SM, Carriquiry AL, Dodd KW, Fuller WA. A semiparametric transformation approach to estimating usual daily intake distributions. JASA 1996; 91:1440-9.

page 42 of 51 RIVM report 350100002
17. Slob W. Probabilistic dietary exposure assessment taking into account variability in both amount and frequency of consumption. Food Chem Toxicol 2006; 44: in press.
18. Rhodes SD, Bowie DA, Hergenrather KC. Collecting behavioural data using the world wide web: considerations for researchers. J Epidemiol Community Health 2003; 57(1):68-73.
19. Eysenbach G, Wyatt J. Using the Internet for surveys and health research. J Med Internet Res 2002; 4(2):E13.
20. Balter KA, Balter O, Fondell E, Lagerros YT. Web-based and mailed questionnaires: a comparison of response rates and compliance. Epidemiology 2005; 16(4):577-9.
21. Ekman A, Dickman PW, Klint A, Weiderpass E, Litton JE. Feasibility of Using Web-based Questionnaires in Large Population-based Epidemiological Studies. Eur J Epidemiol 2006; 21(2):103-11.
22. Shatenstein B, Payette H, Nadon S, Gray-Donald K. An approach for evaluating lifelong intakes of functional foods in elderly people. J Nutr 2003; 133(7):2384-91.
23. Pufulete M, Emery PW, Nelson M, Sanders TA. Validation of a short food frequency questionnaire to assess folate intake. Br J Nutr 2002; 87(4):383-90.
24. Vose De. Risk analysis: a quantitative guide. Chichester: John Wiley and Sons.
RIVM report 350100002 page 43 of 51
Appendix 1: Internet-based food frequency questionnaire (draft version)
This appendix includes six examples of questions from the draft questionnaire for intake assessment of foods enriched with folic acid, to be presented to respondents on the computer screen (using breakfast cereals as an example). In addition, a schematic overview of the set-up of the draft questionnaire per food group is included on page 51. The six examples of questions on the following pages correspond with the boxes in blue (question 1, 1.1, 1.1.2, 1.2, 1.3, 1.4) on page 51.
On request, the complete draft questionnaire including questions on the remaining food groups for folic acid and all food groups for phytosterols (including cereal bars, margarine, yoghurt and supplements) and some general questions can be demonstrated by the National Institute for Public Health and the Environment (RIVM)

page 44 of 51 RIVM report 350100002
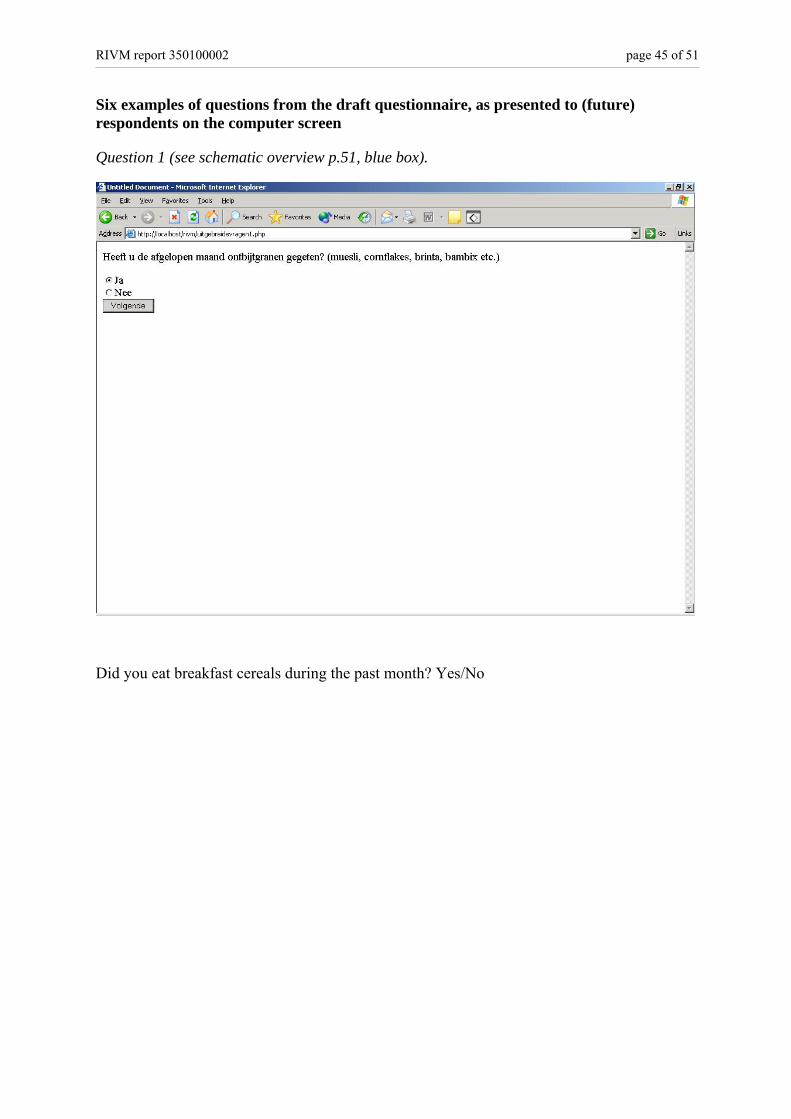
RIVM report 350100002 page 45 of 51
Six examples of questions from the draft questionnaire, as presented to (future) respondents on the computer screen
Question 1 (see schematic overview p.51, blue box).
Did you eat breakfast cereals during the past month? Yes/No
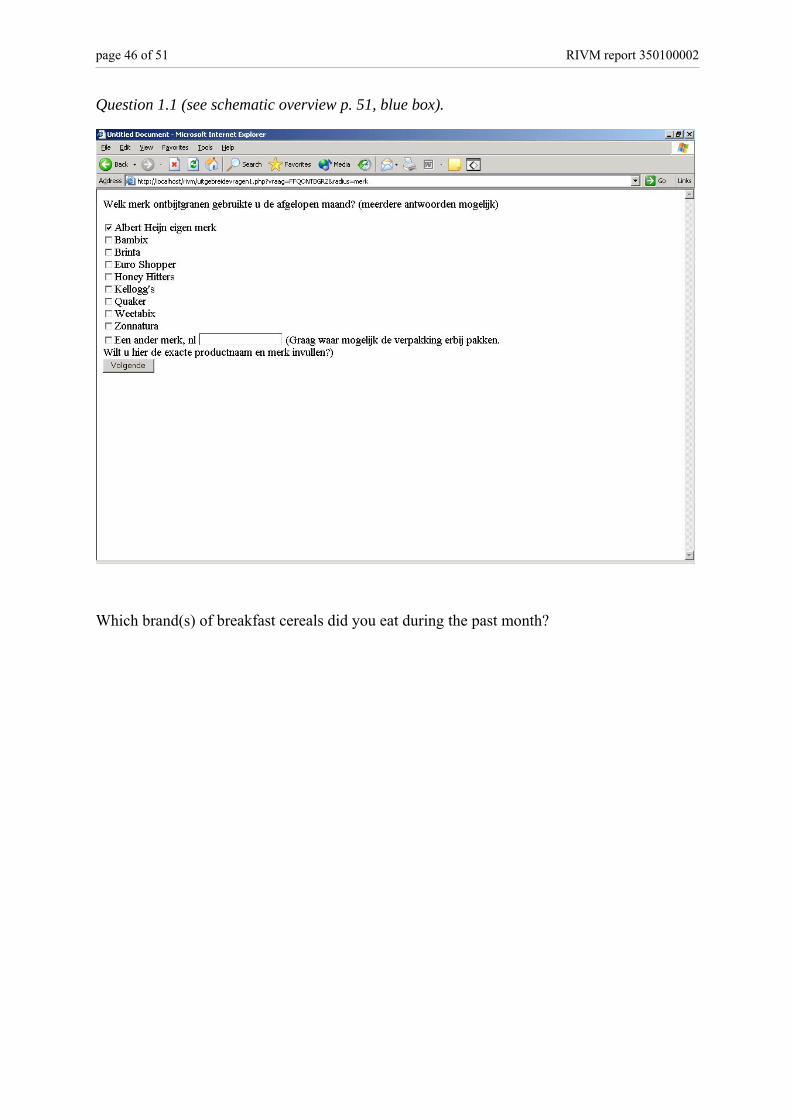
page 46 of 51 RIVM report 350100002
Question 1.1 (see schematic overview p. 51, blue box).
Which brand(s) of breakfast cereals did you eat during the past month?
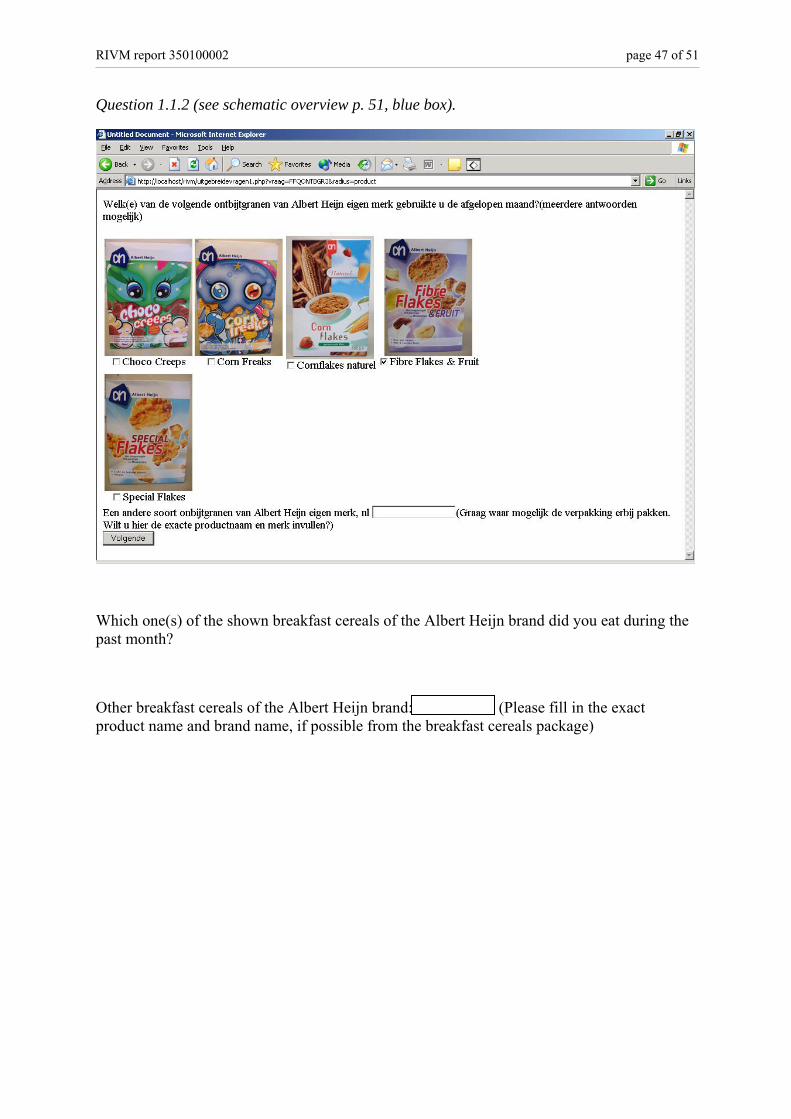
RIVM report 350100002 page 47 of 51
Question 1.1.2 (see schematic overview p. 51, blue box).
Which one(s) of the shown breakfast cereals of the Albert Heijn brand did you eat during the past month?
Other breakfast cereals of the Albert Heijn brand: (Please fill in the exact product name and brand name, if possible from the breakfast cereals package)
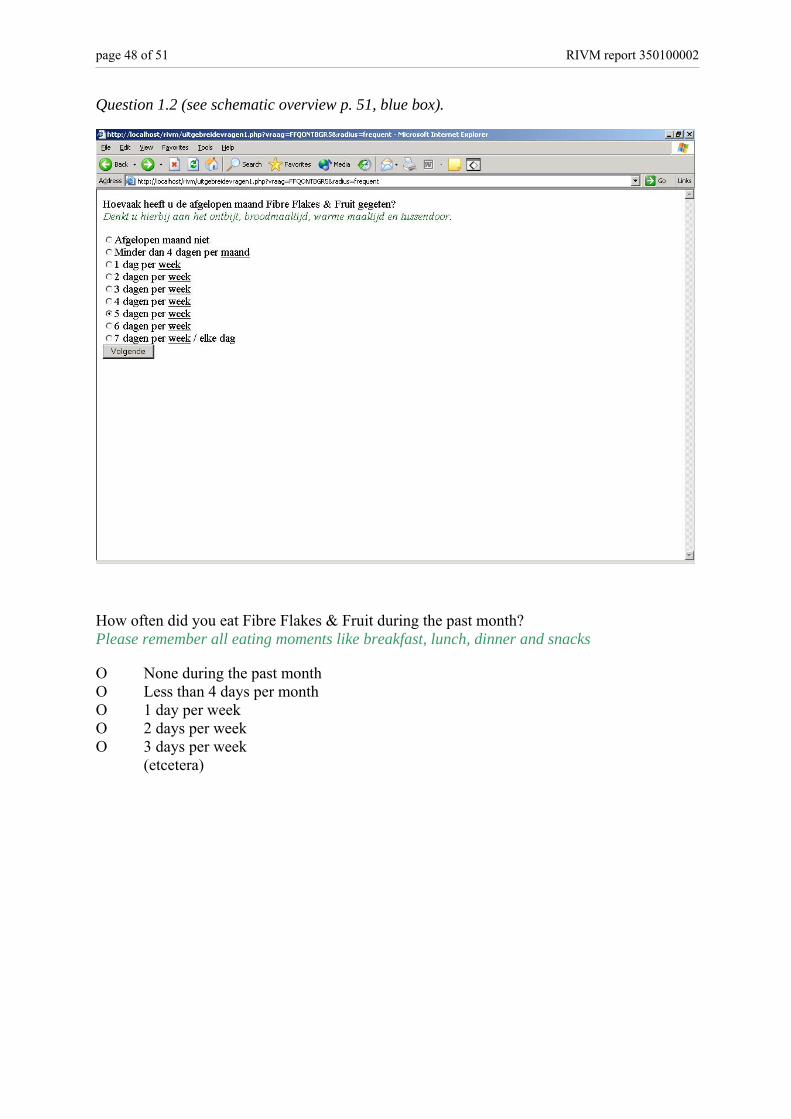
page 48 of 51 RIVM report 350100002
Question 1.2 (see schematic overview p. 51, blue box).
How often did you eat Fibre Flakes & Fruit during the past month? Please remember all eating moments like breakfast, lunch, dinner and snacks
O None during the past month O Less than 4 days per month O 1 day per week O 2 days per week O 3 days per week (etcetera)
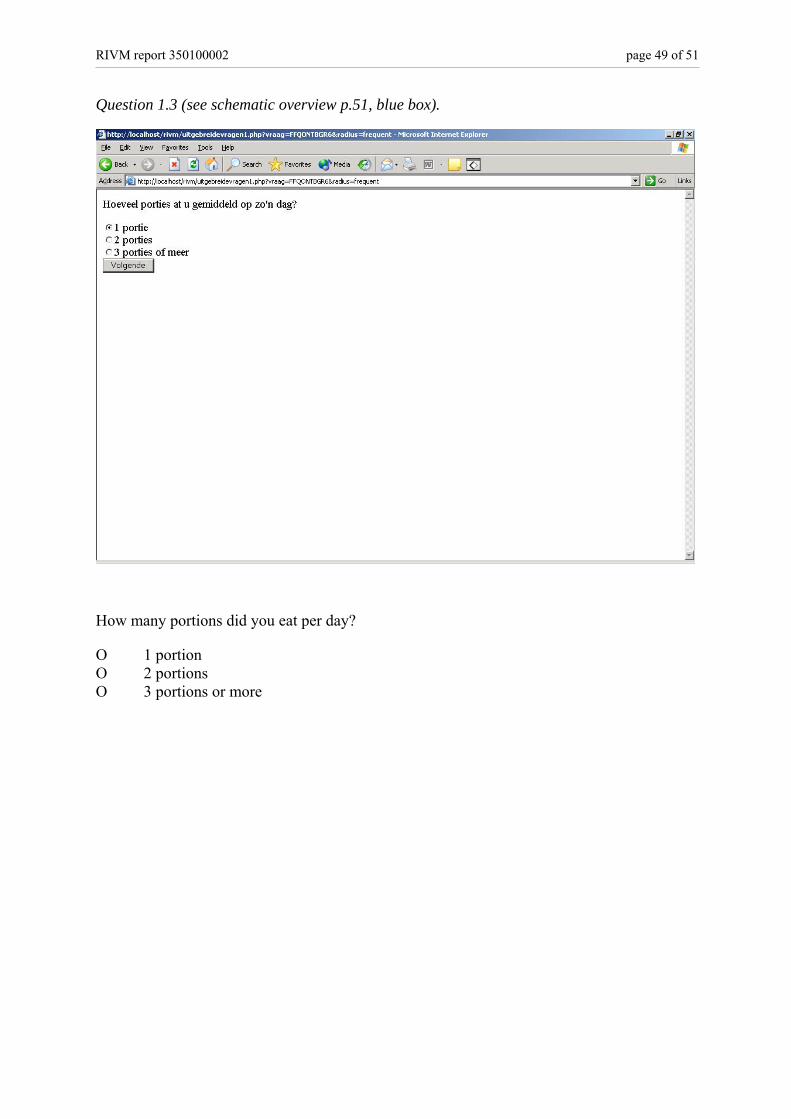
RIVM report 350100002 page 49 of 51
Question 1.3 (see schematic overview p.51, blue box).
How many portions did you eat per day?
O 1 portion O 2 portions O 3 portions or more
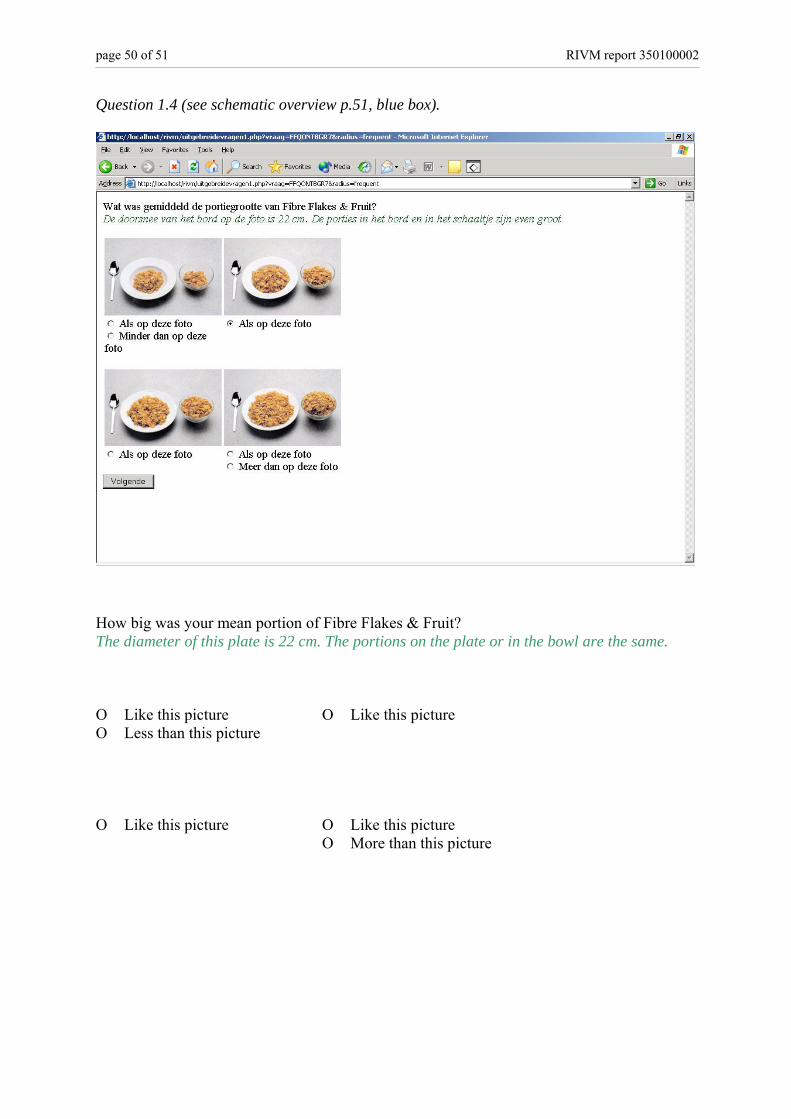
page 50 of 51 RIVM report 350100002
Question 1.4 (see schematic overview p.51, blue box).
How big was your mean portion of Fibre Flakes & Fruit? The diameter of this plate is 22 cm. The portions on the plate or in the bowl are the same. O Like this picture O Like this picture O Less than this picture O Like this picture O Like this picture O More than this picture
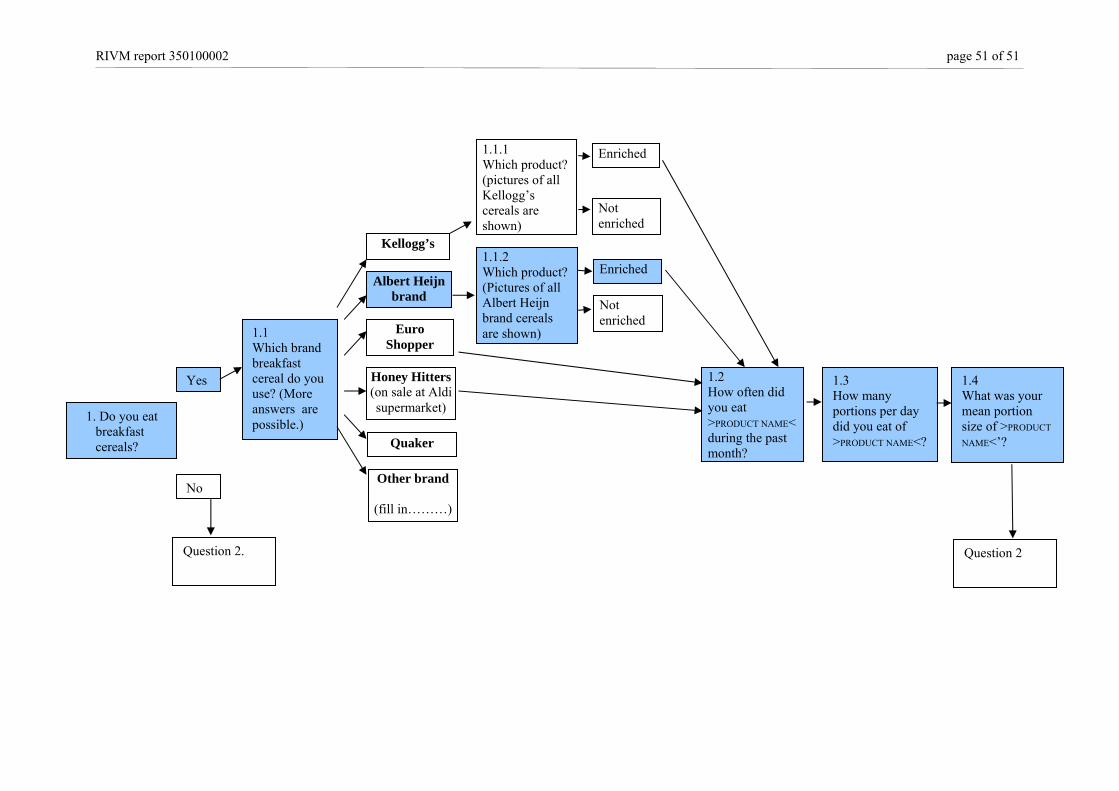
RIVM report 350100002 page 51 of 51
1. Do you eat breakfast cereals?
Yes
No
1.1 Which brand breakfast cereal do you use? (More answers are possible.)
Kellogg’s
Quaker
Albert Heijn brand
Honey Hitters (on sale at Aldi supermarket)
Euro Shopper
Other brand
(fill in………)
1.1.1 Which product? (pictures of all Kellogg’s cereals are shown)
1.1.2 Which product? (Pictures of all Albert Heijn brand cereals are shown)
Enriched
Not enriched
Enriched
Not enriched
1.2 How often did you eat >PRODUCT NAME< during the past month?
1.3 How many portions per day did you eat of >PRODUCT NAME<?
1.4 What was your mean portion size of >PRODUCT
NAME<’?
Question 2 Question 2.