risk managed global sectors - newfound research care deeply about capital preservation. newfound...
TRANSCRIPT

Risk Managed Global Sectors December 2015
Newfound Case ID: 4176909
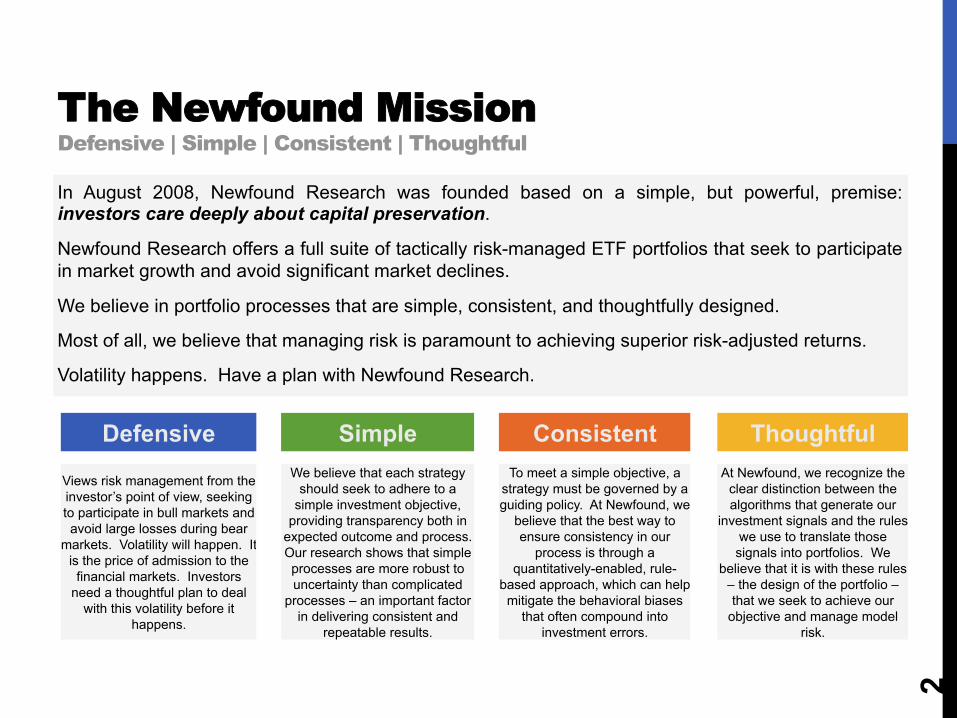
In August 2008, Newfound Research was founded based on a simple, but powerful, premise: investors care deeply about capital preservation.
Newfound Research offers a full suite of tactically risk-managed ETF portfolios that seek to participate in market growth and avoid significant market declines.
We believe in portfolio processes that are simple, consistent, and thoughtfully designed.
Most of all, we believe that managing risk is paramount to achieving superior risk-adjusted returns.
Volatility happens. Have a plan with Newfound Research.
The Newfound Mission Defensive | Simple | Consistent | Thoughtful
2
Defensive Simple Consistent Thoughtful
Views risk management from the investor’s point of view, seeking to participate in bull markets and avoid large losses during bear
markets. Volatility will happen. It is the price of admission to the
financial markets. Investors need a thoughtful plan to deal
with this volatility before it happens.
We believe that each strategy should seek to adhere to a
simple investment objective, providing transparency both in
expected outcome and process. Our research shows that simple processes are more robust to uncertainty than complicated
processes – an important factor in delivering consistent and
repeatable results.
To meet a simple objective, a strategy must be governed by a guiding policy. At Newfound, we
believe that the best way to ensure consistency in our
process is through a quantitatively-enabled, rule-
based approach, which can help mitigate the behavioral biases
that often compound into investment errors.
At Newfound, we recognize the clear distinction between the algorithms that generate our
investment signals and the rules we use to translate those signals into portfolios. We
believe that it is with these rules – the design of the portfolio – that we seek to achieve our
objective and manage model risk.
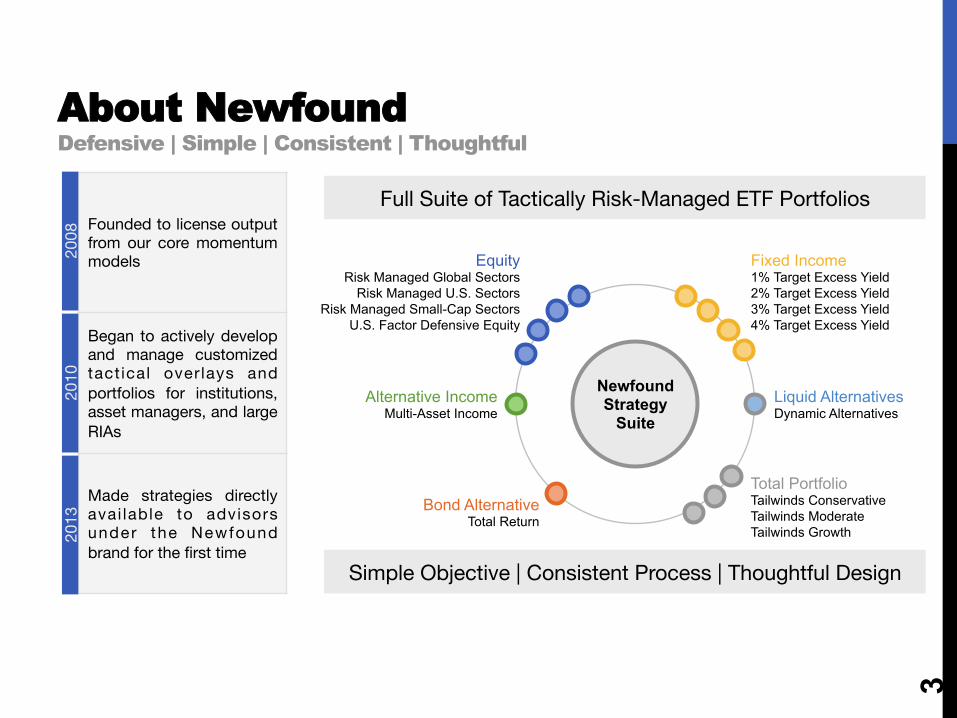
Founded to license output from our core momentum models
Began to actively develop and manage customized tact ical overlays and portfolios for institutions, asset managers, and large RIAs
Made strategies directly avai lable to advisors under the Newfound brand for the first time
About Newfound Defensive | Simple | Consistent | Thoughtful
3
2008
20
13
2010
Newfound Strategy
Suite
Equity Risk Managed Global Sectors
Risk Managed U.S. Sectors Risk Managed Small-Cap Sectors
U.S. Factor Defensive Equity
Alternative Income Multi-Asset Income
Bond Alternative Total Return
Fixed Income 1% Target Excess Yield 2% Target Excess Yield 3% Target Excess Yield 4% Target Excess Yield
Liquid Alternatives Dynamic Alternatives
Total Portfolio Tailwinds Conservative Tailwinds Moderate Tailwinds Growth
Full Suite of Tactically Risk-Managed ETF Portfolios
Simple Objective | Consistent Process | Thoughtful Design
Risk Managed Global Sectors A Simple Objective | A Consistent Process | A Thoughtful Design
4
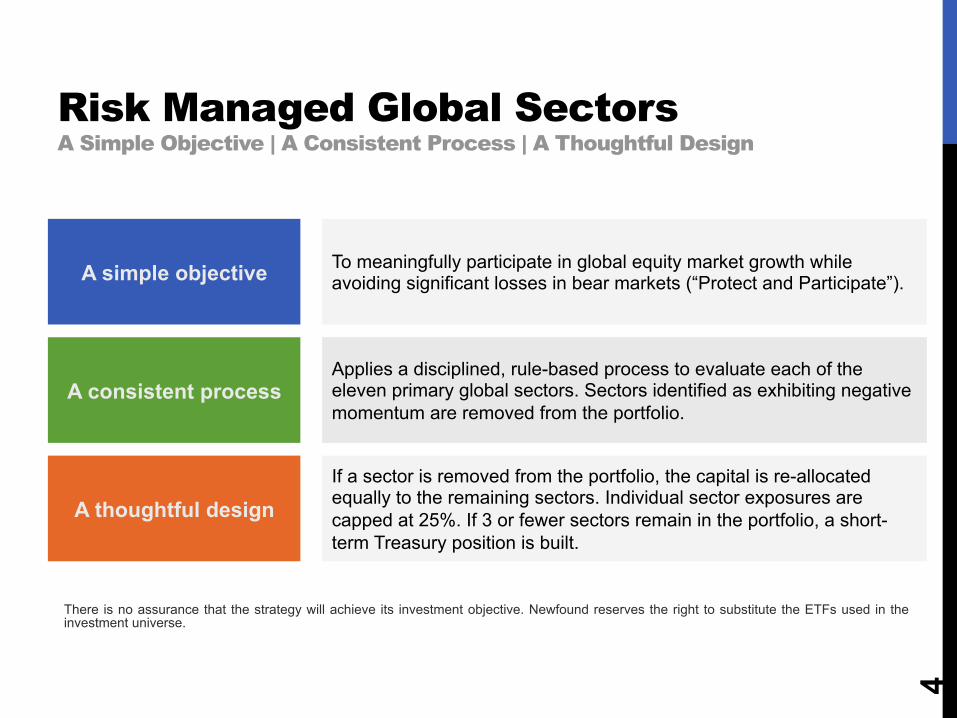
A simple objective To meaningfully participate in global equity market growth while avoiding significant losses in bear markets (“Protect and Participate”).
A consistent process Applies a disciplined, rule-based process to evaluate each of the eleven primary global sectors. Sectors identified as exhibiting negative momentum are removed from the portfolio.
A thoughtful design If a sector is removed from the portfolio, the capital is re-allocated equally to the remaining sectors. Individual sector exposures are capped at 25%. If 3 or fewer sectors remain in the portfolio, a short-term Treasury position is built.
There is no assurance that the strategy will achieve its investment objective. Newfound reserves the right to substitute the ETFs used in the investment universe.
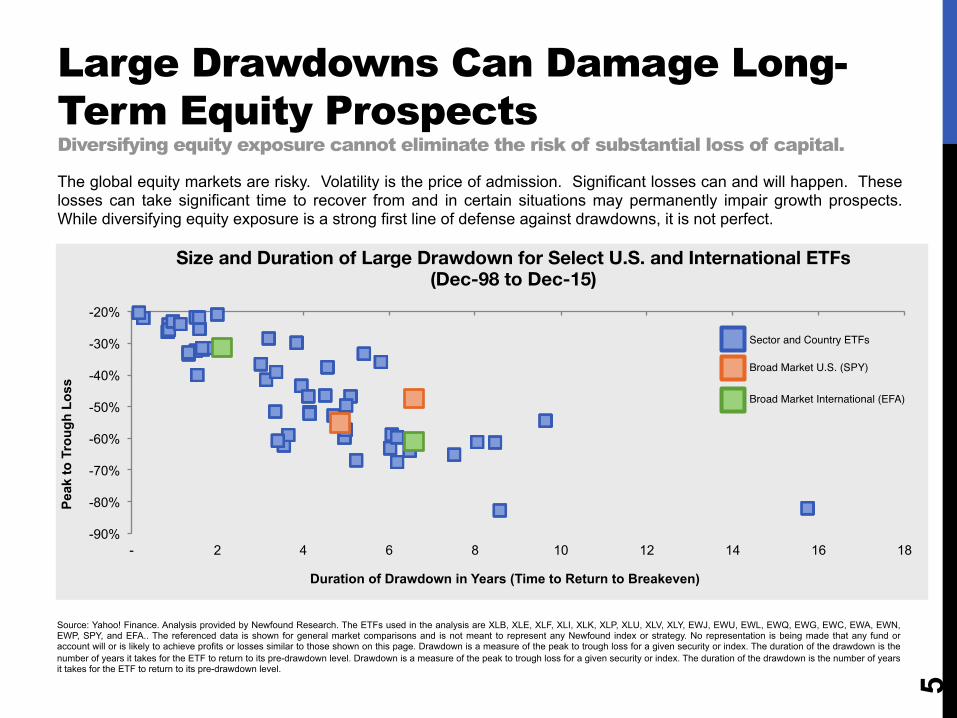
Source: Yahoo! Finance. Analysis provided by Newfound Research. The ETFs used in the analysis are XLB, XLE, XLF, XLI, XLK, XLP, XLU, XLV, XLY, EWJ, EWU, EWL, EWQ, EWG, EWC, EWA, EWN, EWP, SPY, and EFA.. The referenced data is shown for general market comparisons and is not meant to represent any Newfound index or strategy. No representation is being made that any fund or account will or is likely to achieve profits or losses similar to those shown on this page. Drawdown is a measure of the peak to trough loss for a given security or index. The duration of the drawdown is the number of years it takes for the ETF to return to its pre-drawdown level. Drawdown is a measure of the peak to trough loss for a given security or index. The duration of the drawdown is the number of years it takes for the ETF to return to its pre-drawdown level.
The global equity markets are risky. Volatility is the price of admission. Significant losses can and will happen. These losses can take significant time to recover from and in certain situations may permanently impair growth prospects. While diversifying equity exposure is a strong first line of defense against drawdowns, it is not perfect.
Large Drawdowns Can Damage Long-Term Equity Prospects Diversifying equity exposure cannot eliminate the risk of substantial loss of capital.
5
-90%
-80%
-70%
-60%
-50%
-40%
-30%
-20%
- 2 4 6 8 10 12 14 16 18
Peak
to T
roug
h Lo
ss
Duration of Drawdown in Years (Time to Return to Breakeven)
Size and Duration of Large Drawdown for Select U.S. and International ETFs (Dec-98 to Dec-15)
Sector and Country ETFs
Broad Market U.S. (SPY)
Broad Market International (EFA)
Source: Yahoo! Finance. Analysis provided by Newfound Research. Data uses monthly returns from September 2003 to November 2015. Bonds are represented by the iShares Aggregate Bond ETF (ticker: AGG). Stocks are represented by a portfolio of the SPDR S&P 500 ETF (ticker: SPY), the iShares MSCI EAFE ETF (ticker: EFA), and the iShares MSCI Emerging Markets ETF (ticker: EEM). Results are for general market comparisons and are not representative of any Newfound index or strategy. This content should not be considered investment advice.
0%
10%
20%
30%
40%
50%
60%
70%
80%
90%
100%
0% 5% 10% 15% 20% 25% 30% 35% 40% 45% 50% 55% 60% 65% 70% 75% 80% 85% 90% 95% 100%
Stoc
k C
ontr
ibut
ion
to P
ortfo
lio R
isk
Stock Allocation
Traditional Risk Management Tools Aren’t Perfect Portfolios seemingly diversified by asset class can still be dominated by equity risk.
6
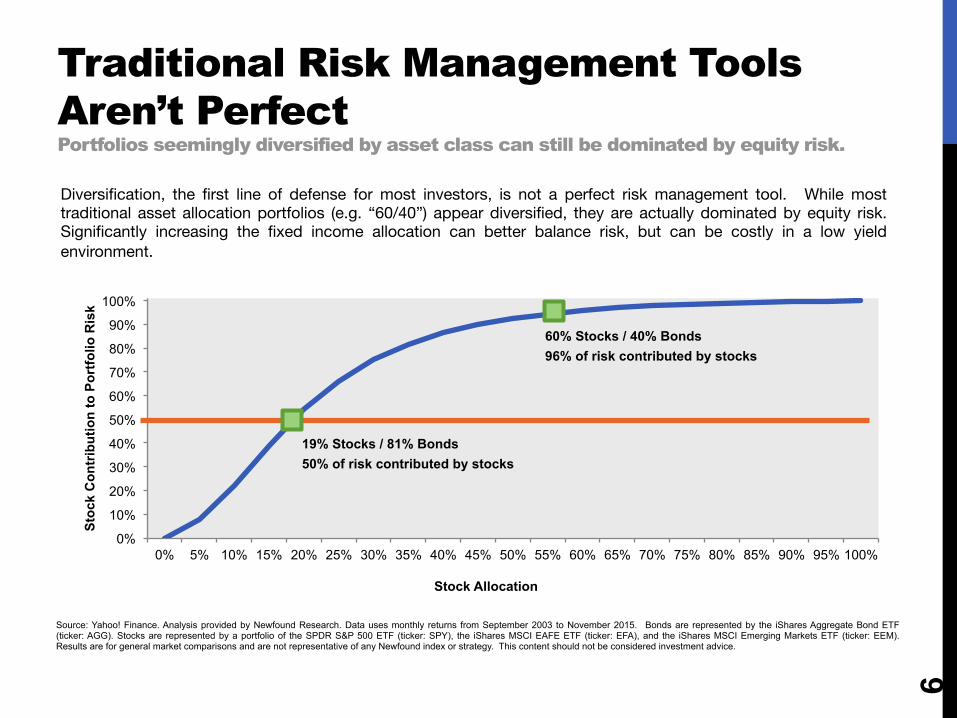
Diversification, the first line of defense for most investors, is not a perfect risk management tool. While most traditional asset allocation portfolios (e.g. “60/40”) appear diversified, they are actually dominated by equity risk. Significantly increasing the fixed income allocation can better balance risk, but can be costly in a low yield environment.
19% Stocks / 81% Bonds
50% of risk contributed by stocks
60% Stocks / 40% Bonds
96% of risk contributed by stocks
Market Manager Market Manager
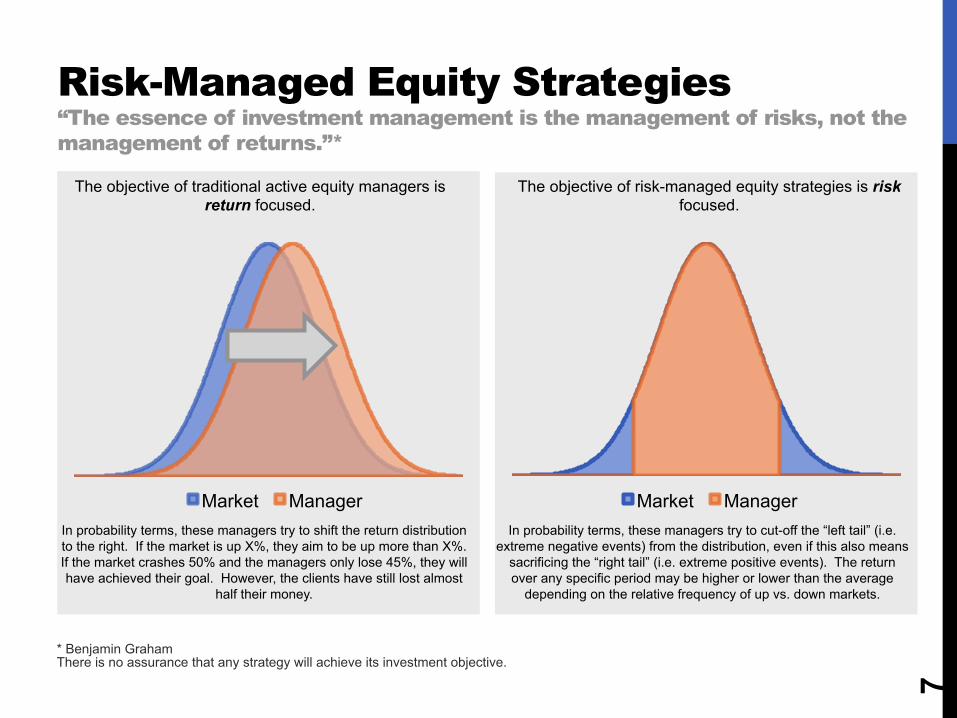
Risk-Managed Equity Strategies “The essence of investment management is the management of risks, not the management of returns.”*
7
The objective of traditional active equity managers is return focused.
The objective of risk-managed equity strategies is risk focused.
In probability terms, these managers try to shift the return distribution to the right. If the market is up X%, they aim to be up more than X%. If the market crashes 50% and the managers only lose 45%, they will have achieved their goal. However, the clients have still lost almost
half their money.
In probability terms, these managers try to cut-off the “left tail” (i.e. extreme negative events) from the distribution, even if this also means
sacrificing the “right tail” (i.e. extreme positive events). The return over any specific period may be higher or lower than the average
depending on the relative frequency of up vs. down markets.
* Benjamin Graham There is no assurance that any strategy will achieve its investment objective.
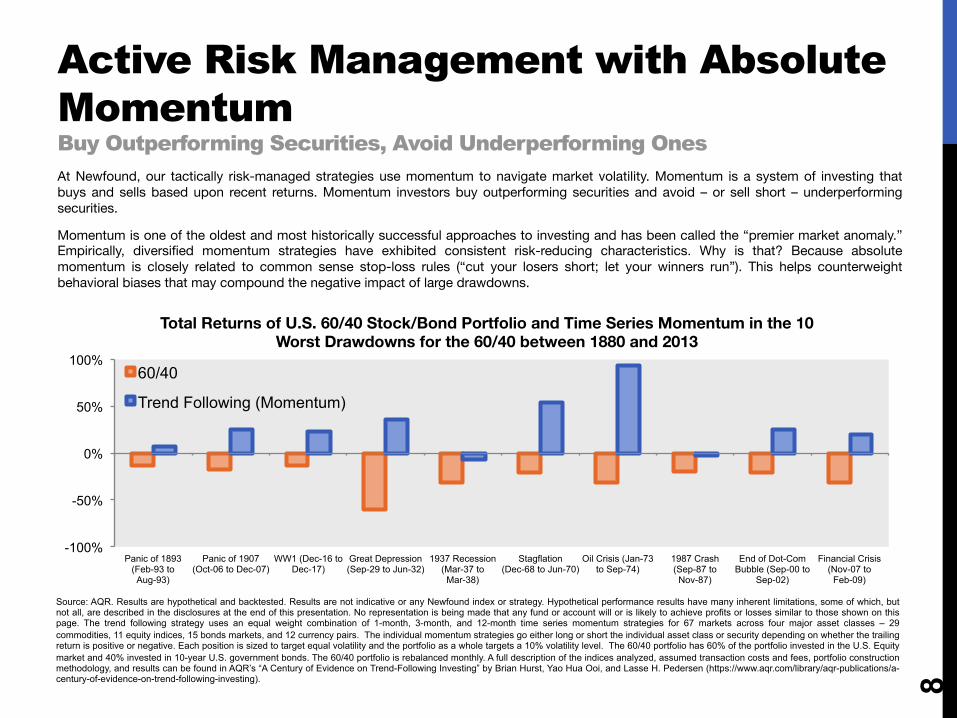
Source: AQR. Results are hypothetical and backtested. Results are not indicative or any Newfound index or strategy. Hypothetical performance results have many inherent limitations, some of which, but not all, are described in the disclosures at the end of this presentation. No representation is being made that any fund or account will or is likely to achieve profits or losses similar to those shown on this page. The trend following strategy uses an equal weight combination of 1-month, 3-month, and 12-month time series momentum strategies for 67 markets across four major asset classes – 29 commodities, 11 equity indices, 15 bonds markets, and 12 currency pairs. The individual momentum strategies go either long or short the individual asset class or security depending on whether the trailing return is positive or negative. Each position is sized to target equal volatility and the portfolio as a whole targets a 10% volatility level. The 60/40 portfolio has 60% of the portfolio invested in the U.S. Equity market and 40% invested in 10-year U.S. government bonds. The 60/40 portfolio is rebalanced monthly. A full description of the indices analyzed, assumed transaction costs and fees, portfolio construction methodology, and results can be found in AQR’s “A Century of Evidence on Trend-Following Investing” by Brian Hurst, Yao Hua Ooi, and Lasse H. Pedersen (https://www.aqr.com/library/aqr-publications/a-century-of-evidence-on-trend-following-investing).
Active Risk Management with Absolute Momentum Buy Outperforming Securities, Avoid Underperforming Ones
8
At Newfound, our tactically risk-managed strategies use momentum to navigate market volatility. Momentum is a system of investing that buys and sells based upon recent returns. Momentum investors buy outperforming securities and avoid – or sell short – underperforming securities.
Momentum is one of the oldest and most historically successful approaches to investing and has been called the “premier market anomaly.” Empirically, diversified momentum strategies have exhibited consistent risk-reducing characteristics. Why is that? Because absolute momentum is closely related to common sense stop-loss rules (“cut your losers short; let your winners run”). This helps counterweight behavioral biases that may compound the negative impact of large drawdowns.
-100%
-50%
0%
50%
100%
Panic of 1893 (Feb-93 to Aug-93)
Panic of 1907 (Oct-06 to Dec-07)
WW1 (Dec-16 to Dec-17)
Great Depression (Sep-29 to Jun-32)
1937 Recession (Mar-37 to Mar-38)
Stagflation (Dec-68 to Jun-70)
Oil Crisis (Jan-73 to Sep-74)
1987 Crash (Sep-87 to
Nov-87)
End of Dot-Com Bubble (Sep-00 to
Sep-02)
Financial Crisis (Nov-07 to
Feb-09)
Total Returns of U.S. 60/40 Stock/Bond Portfolio and Time Series Momentum in the 10 Worst Drawdowns for the 60/40 between 1880 and 2013
60/40
Trend Following (Momentum)
Risk Managed Global Sectors Newfound’s Dynamic, Volatility-Adjusted Momentum Model
9
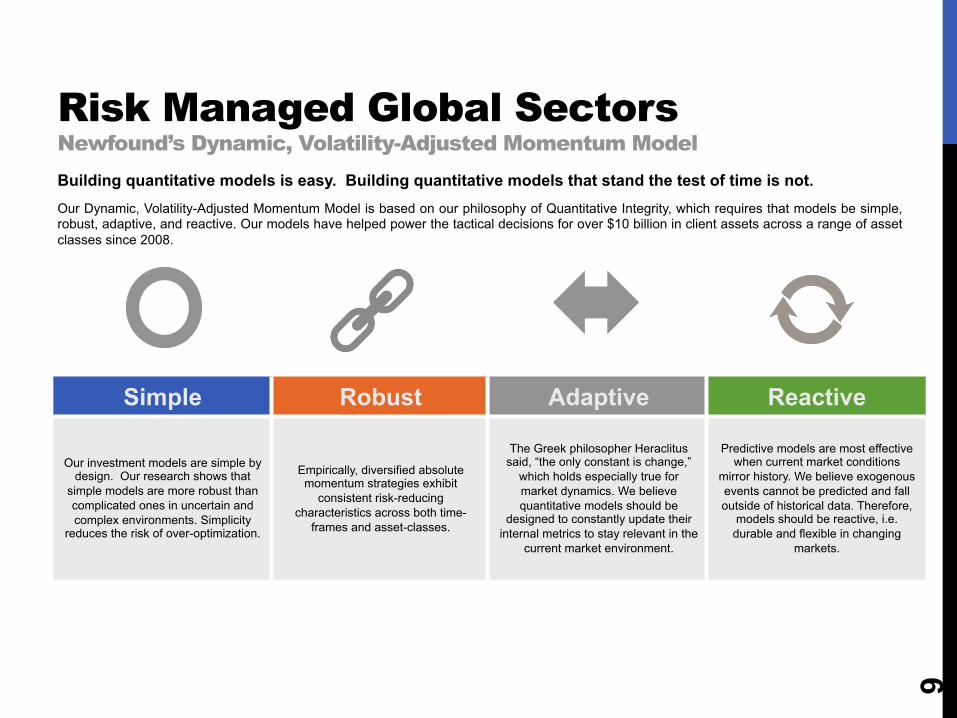
Building quantitative models is easy. Building quantitative models that stand the test of time is not. Our Dynamic, Volatility-Adjusted Momentum Model is based on our philosophy of Quantitative Integrity, which requires that models be simple, robust, adaptive, and reactive. Our models have helped power the tactical decisions for over $10 billion in client assets across a range of asset classes since 2008.
Simple Robust Adaptive Reactive
Our investment models are simple by design. Our research shows that
simple models are more robust than complicated ones in uncertain and complex environments. Simplicity
reduces the risk of over-optimization.
Empirically, diversified absolute momentum strategies exhibit
consistent risk-reducing characteristics across both time-
frames and asset-classes.
The Greek philosopher Heraclitus said, “the only constant is change,”
which holds especially true for market dynamics. We believe quantitative models should be
designed to constantly update their internal metrics to stay relevant in the
current market environment.
Predictive models are most effective when current market conditions
mirror history. We believe exogenous events cannot be predicted and fall outside of historical data. Therefore,
models should be reactive, i.e. durable and flexible in changing
markets.
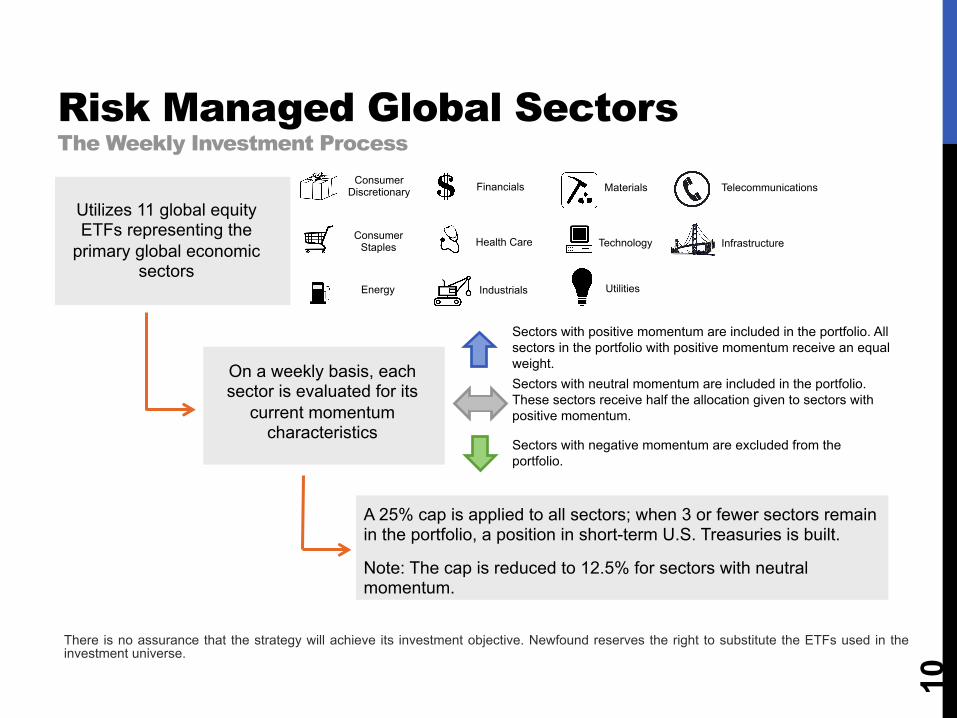
Risk Managed Global Sectors The Weekly Investment Process
Utilizes 11 global equity ETFs representing the
primary global economic sectors
10
Consumer Discretionary
Consumer Staples
Energy
Financials
Health Care
Industrials
Materials
Technology
Utilities
On a weekly basis, each sector is evaluated for its
current momentum characteristics
Sectors with positive momentum are included in the portfolio. All sectors in the portfolio with positive momentum receive an equal weight.
Sectors with negative momentum are excluded from the portfolio.
A 25% cap is applied to all sectors; when 3 or fewer sectors remain in the portfolio, a position in short-term U.S. Treasuries is built.
Note: The cap is reduced to 12.5% for sectors with neutral momentum.
Sectors with neutral momentum are included in the portfolio. These sectors receive half the allocation given to sectors with positive momentum.
There is no assurance that the strategy will achieve its investment objective. Newfound reserves the right to substitute the ETFs used in the investment universe.
Telecommunications
Infrastructure
11 ON
11 ON
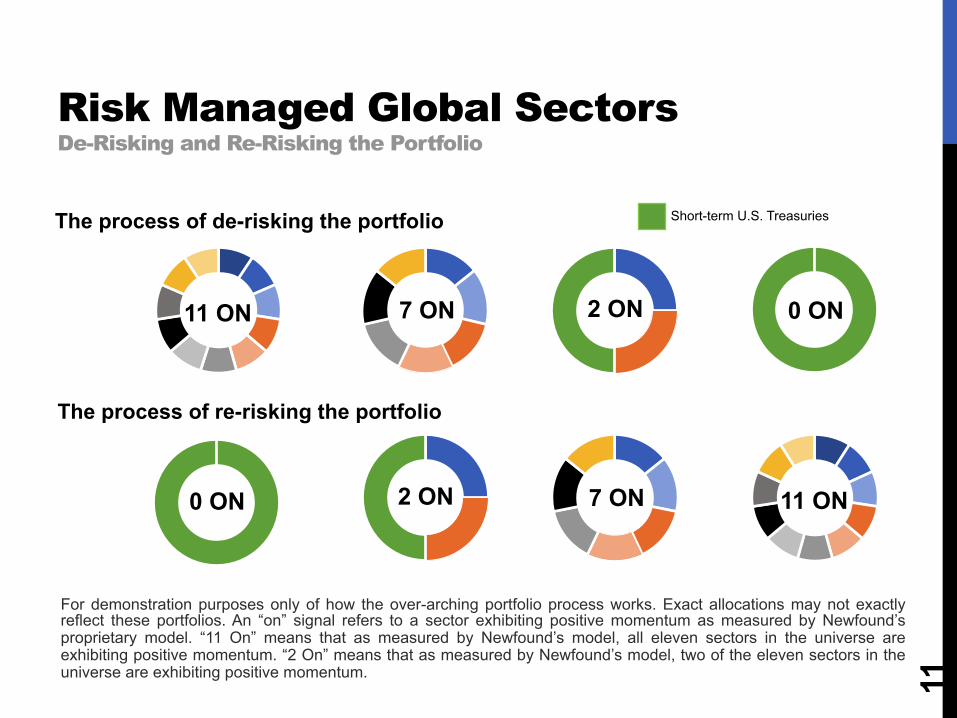
Risk Managed Global Sectors De-Risking and Re-Risking the Portfolio
11
The process of re-risking the portfolio
The process of de-risking the portfolio
7 ON 2 ON 0 ON
0 ON 2 ON
Short-term U.S. Treasuries
7 ON
For demonstration purposes only of how the over-arching portfolio process works. Exact allocations may not exactly reflect these portfolios. An “on” signal refers to a sector exhibiting positive momentum as measured by Newfound’s proprietary model. “11 On” means that as measured by Newfound’s model, all eleven sectors in the universe are exhibiting positive momentum. “2 On” means that as measured by Newfound’s model, two of the eleven sectors in the universe are exhibiting positive momentum.
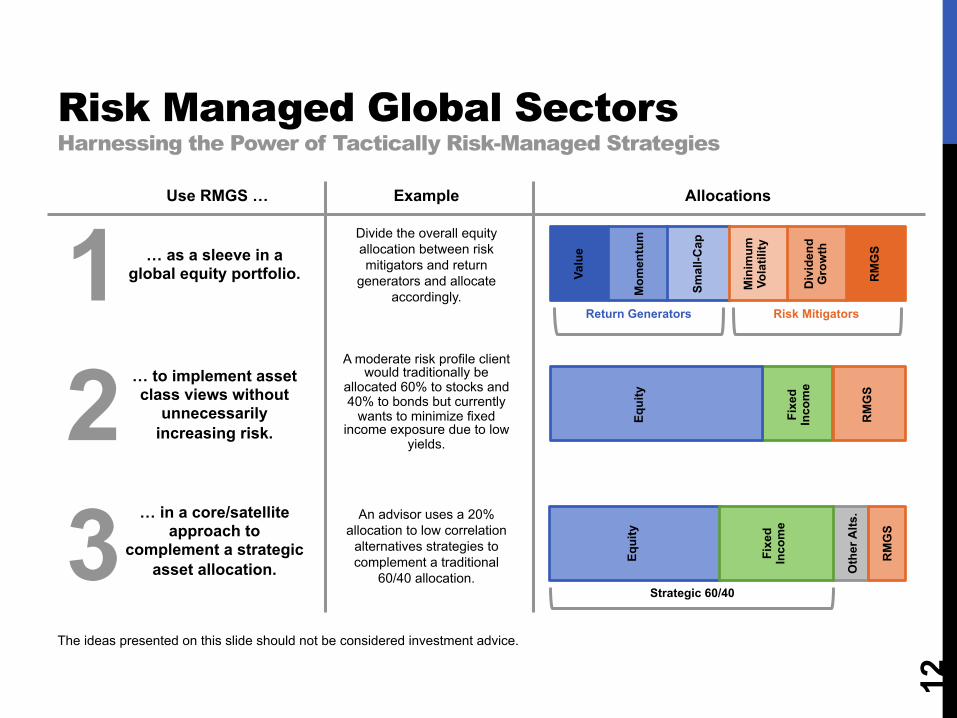
Risk Managed Global Sectors Harnessing the Power of Tactically Risk-Managed Strategies
12
1 2 3
… as a sleeve in a global equity portfolio.
… to implement asset class views without
unnecessarily increasing risk.
… in a core/satellite approach to
complement a strategic asset allocation.
Use RMGS … Example
Divide the overall equity allocation between risk mitigators and return
generators and allocate accordingly.
A moderate risk profile client would traditionally be
allocated 60% to stocks and 40% to bonds but currently
wants to minimize fixed income exposure due to low
yields.
An advisor uses a 20% allocation to low correlation
alternatives strategies to complement a traditional
60/40 allocation.
Allocations
Valu
e
Mom
entu
m
Smal
l-Cap
Min
imum
Vo
latil
ity
Div
iden
d G
row
th
RM
GS
Return Generators Risk Mitigators
RM
GS
Fixe
d
In
com
e
Equi
ty
Equi
ty
Fixe
d
In
com
e
Oth
er A
lts.
Strategic 60/40
RM
GS
The ideas presented on this slide should not be considered investment advice.
Important Disclosures Newfound began to actively calculate the performance of the Newfound Risk Managed Global Sectors index on August 20, 2013. Performance results prior to August 20, 2013 are all backtested and hypothetical. Newfound began to manage and trade a brokerage account on November 27, 2013, which sole purpose was to track the performance of the index. Before you invest in the Newfound Risk Managed Global Sectors strategy, you are strongly encouraged to consult with your financial advisor. Newfound shall have the right at any time, in its sole discretion, to substitute any or all of the ETFs or other securities utilized within the investment strategy.
This presentation (including the hypothetical/backtested performance results) is provided for informational purposes only and is subject to revision. This presentation relates to a rule-based index and related investment strategy which are managed by Newfound. This presentation is not an offer to sell or a solicitation of an offer to purchase an interest or shares (“Interests”) in any pooled vehicle. Newfound does not assume any obligation or duty to update or otherwise revise information set forth herein. This document is not to be reproduced or transmitted, in whole or in part, to other third parties, without the prior consent of Newfound. Certain information contained in this presentation constitutes “forward-looking statements,” which can be identified by the use of forward-looking terminology such as “may,” “will,” “should,” “expect,” “anticipate,” “project,” “estimate,” “intend,” “continue,” or “believe,” or the negatives thereof or other variations or comparable terminology. Due to various risks and uncertainties, actual events or results or the actual performance of an investment managed using the Newfound index or investment strategy may differ materially from those reflected in such forward-looking statements or in the hypothetical backtested composite results or the index’s model performance results included in this presentation. The information in this presentation is made available on an “as is,” without representation or warranty basis. There can be no assurance that the Newfound index or related investment strategy will achieve any level of performance, and investment results may vary substantially from year to year or even from month to month. An investor could lose all or substantially all of his or her investment. Both the use of a single adviser and the focus on a single investment strategy could result in the lack of diversification and consequently, higher risk. The information herein is not intended to provide, and should not be relied upon for, accounting, legal or tax advice or investment recommendations. You should consult your investment adviser, tax, legal, accounting or other advisors about the matters discussed herein. These materials represent an assessment of the market environment at specific points in time and are intended neither to be a guarantee of future events nor as a primary basis for investment decisions. The hypothetical/backtested performance results and model performance results should not be construed as advice meeting the particular needs of any investor. Past performance (whether actual, hypothetical/backtested or model performance) is not indicative of future performance and investments in equity securities do present risk of loss. The ability to replicate the hypothetical or model performance results in actual trading could be affected by market or economic conditions, among other things.
13
Important Disclosures Investors should understand that while the performance results may show a general rising trend at times, there is no assurance that any such trends will continue. If such trends are broken, then investors may experience real losses. None of Newfound nor any other person managed any product or account seeking to track the performance of the index prior to November 27, 2013. No representation is being made that any account will achieve performance results similar to those shown in this presentation. In fact, there may be substantial differences between backtested performance results and the actual results subsequently achieved by any particular investment program. As a result, the index theoretically may be changed from time to time to obtain more favorable performance results. There are other factors related to the markets in general or to the implementation of any specific investment program which have not been fully accounted for in the preparation of the hypothetical/backtested performance results, all of which may adversely affect actual portfolio management results. The information included in this presentation reflects the different assumptions, views and analytical methods of Newfound as of the date of this presentation.
The index’s performance during the Backtested Period is not based on live results produced by an investor’s actual investing and trading, but was achieved by the retroactive application of a model designed with the benefit of hindsight, and, other than the composite results, the index model performance subsequent to August 20 2013 is not based on live results produced by an investor’s investment and trading, and fees, expenses, transaction costs, commissions, penalties or taxes have not been netted from the gross performance results except as is otherwise described in this presentation. The performance results include reinvestment of dividends, capital gains and other earnings. As the Hypothetical Information was backtested, it does not reflect contemporaneous advice or record keeping by an investment adviser. Actual, live client results may have materially differed from the presented performance results. All information presented after the index inception date (August 20, 2013) is the index’s model performance, which means it was calculated by Newfound in real-time (not on a backtested basis), but does not reflect the payment of any fees, commissions or expenses (except as otherwise described in this presentation).
Accounts and funds managed by an adviser using the Newfound model portfolios are subject to additions and redemptions of assets under management, which may positively or negatively affect performance depending generally upon the timing of such events in relation to the market’s direction. The Hypothetical Information and model performance assume full investment, whereas actual accounts and funds managed by an adviser would most likely have a positive cash position. Had the Hypothetical Information or model performance included the cash position, the information would have been different and generally may have been lower. While there have been periodic updates and improvements to the Newfound model, there have not been any material changes in the objectives or strategies of the model that have occurred that may affect results. While Newfound believes the outside data sources cited to be credible, it has not independently verified the correctness of any of their inputs or calculations and, therefore, does not warranty the accuracy of any third-party sources or information.
14