cefa’s tactically managed portfolios of closed …€™s tactically managed portfolios of...
TRANSCRIPT
CEFA’s Tactically Managed Portfolios of Closed-End Funds/BDCs
7204 Glen Forest Drive, Suite #105Richmond, Virginia 23226 USA(800) 356-3508 / (804) 288-2482www.CEFadvisors.com
Firm Pitchbook
Last Updated: 4/20/2018

Important: The information in this presentation is not for general circulation and should not be considered an offer, or solicitation, to deal in any of the mentioned funds. The information is provided on a general basis for information purposes only, and is not to be relied on as advice, as it does not take into account the investment objectives, financial situation or particular needs of any specific investor.
Any research or analysis used to derive, or in relation to, the information herein has been procured by Closed-End Fund Advisors (“CEFA”) for its own use, and may have been acted on for its own purpose. The information herein, including any opinions or forecasts have been obtained from or is based on sources believed by CEFA to be reliable, but CEFA does not warrant the accuracy, adequacy or completeness of the same, and expressly disclaims liability for any errors or omissions. As such, any person acting upon or in reliance of these materials does so entirely at his or her own risk. Any projections or other forward-looking statements regarding future events or performance of countries, markets or companies are not necessarily indicative of, and may differ from, actual events or results. No warranty whatsoever is given and no liability whatsoever is accepted by CEFA or its affiliates, for any loss, arising directly or indirectly, as a result of any action or omission made in reliance of any information, opinion or projection made in this presentation.
The information herein shall not be disclosed, used or disseminated, in whole or part, and shall not be reproduced, copied or made available to others without CEFA expressed written permission. CEFA reserves the right to make changes and corrections to the information, including any opinions or forecasts expressed herein at any time, without notice.
Model Summary reports are the current model portfolio for each investment objective based on the date of the portfolio was last updated. Client accounts may differ from models based on personalized investment objectives or changing opportunities when the accounts were invested into the model. Market price and net asset value total returns shown are for research perspective and may not reflect performance of actual clients in the model as the holdings and allocations may be different. Past performance is not indicative of future results. Investment may lose value and the impact of fees or trading cost are not reflected.
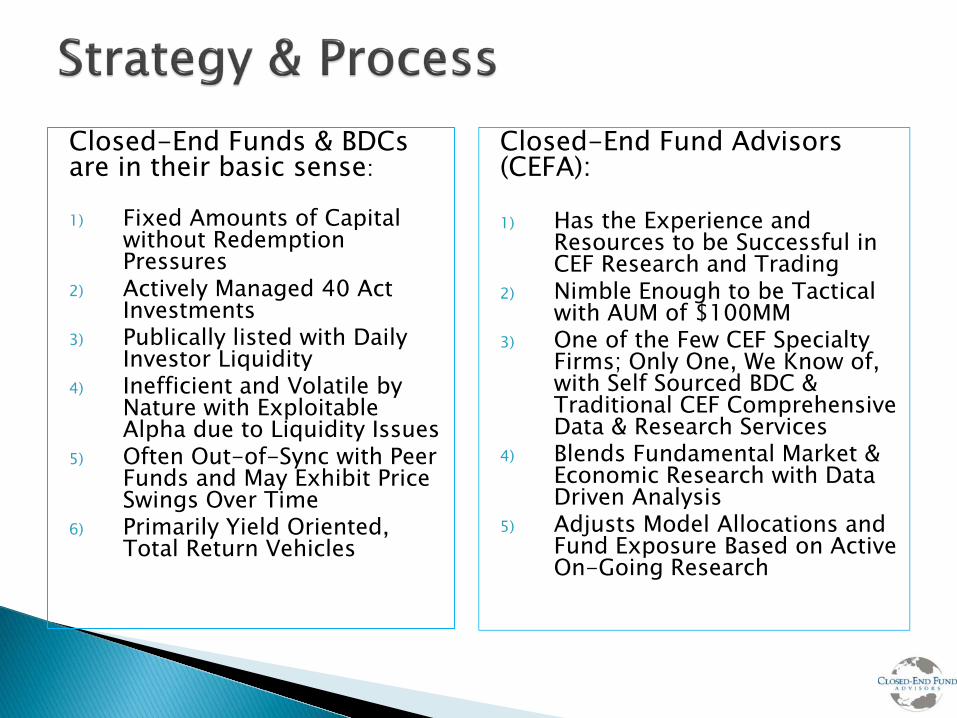
Closed-End Funds & BDCs are in their basic sense:
1) Fixed Amounts of Capital without Redemption Pressures
2) Actively Managed 40 Act Investments
3) Publically listed with Daily Investor Liquidity
4) Inefficient and Volatile by Nature with Exploitable Alpha due to Liquidity Issues
5) Often Out-of-Sync with Peer Funds and May Exhibit Price Swings Over Time
6) Primarily Yield Oriented, Total Return Vehicles
Closed-End Fund Advisors (CEFA):
1) Has the Experience and Resources to be Successful in CEF Research and Trading
2) Nimble Enough to be Tactical with AUM of $100MM
3) One of the Few CEF Specialty Firms; Only One, We Know of, with Self Sourced BDC & Traditional CEF Comprehensive Data & Research Services
4) Blends Fundamental Market & Economic Research with Data Driven Analysis
5) Adjusts Model Allocations and Fund Exposure Based on Active On-Going Research

Source: CEFData.com
Source CEFData.com 3/31/18
Assets of Closed-End Funds by Type, End of PeriodMillions of dollars
1Q 2018 4Q 2017 3Q 2017 2Q 2017Total Trad CEF Equity 109,366 114,407 113,813 111,993
U.S. Equity 20,504 21,029 20,390 19,460 Non U.S. Equity 13,845 14,204 14,187 13,923 Hybrid / Balanced 5,551 5,737 5,848 5,758 Specialty Equity 69,466 73,437 73,389 72,852
Total Trad CEF Bond 130,356 133,200 132,492 131,071 Taxable Bond 65,912 66,955 66,317 65,361 National Municipal 46,433 47,705 47,630 47,219 Single State Municipal 18,011 18,540 18,545 18,492
Total Traditional CEF 239,722 247,607 246,305 243,064
Debt Focused BDC 35,054 35,279 32,757 32,581
Equity Focused BDC 704 702 698 699
Total BDC CEF 35,758 35,981 33,455 33,281
CEF GRAND TOTAL 275,479 283,588 279,759 276,345

2008 2009 2010 2011 2012 2013 2014 2015 2016 2017 2018 YTD 2008 - 2017
BDC-19.35%
Senior Loan69.91%
MLP24.35%
Muni Bond9.73%
REIT25.56%
MLP28.71%
REIT24.47%
Preferred6.37%
MLP33.64%
World Stock25.80%
World Stock2.13%
Preferred8.13%
Investment Grade-23.36%
World Stock54.35%
REIT19.63%
MLP4.14%
Preferred23.75%
US Stock25.62%
Muni Bond19.70%
Muni Bond5.53%
HY Bond18.43%
US Stock19.79%
Senior Loan1.97%
REIT6.61%
Muni Bond-27.04%
HY Bond52.35%
World Stock14.57%
BDC-0.05%
HY Bond20.49%
Convertible20.89%
Preferred17.57%
BDC3.90%
Senior Loan14.91%
Covered Call17.59%
BDC1.48%
Senior Loan5.91%
Covered Call-34.67
Convertible51.37%
Preferred13.01%
Investment Grade-0.21%
World Stock18.27%
Covered Call16.31%
US Stock11.20%
Covered Call1.35%
Convertible12.06%
Preferred14.19%
Convertible0.63%
HY Bond5.86%
US Stock-39.26%
MLP50.62%
Senior Loan7.40%
Preferred-2.15%
Convertible16.40%
BDC13.36%
BDC8.10%
REIT0.95%
BDC10.09%
Convertible12.57%
Investment Grade-0.21%
US Stock5.09%
Preferred-42.86%
Preferred42.35%
HY Bond7.25%
Senior Loan-2.94%
Muni Bond15.38%
HY Bond10.02%
Investment Grade7.73%
US Stock0.42%
Investment Grade8.74%
REIT12.42%
HY Bond-0.40%
Muni Bond4.75%
HY Bond-47.59%
REIT40.91%
Convertible5.91%
REIT-5.08%
Investment Grade15.38%
Senior Loan8.49%
Covered Call4.86%
Investment Grade-2.38%
Covered Call8.67%
Investment Grade10.77%
US Stock-0.82%
MLP4.37%
MLP-53.03%
Muni Bond26.64%
Investment Grade5.78%
US Stock-6.53%
US Stock13.52%
REIT3.65%
MLP3.45%
Senior Loan-2.66%
World Stock8.45%
BDC8.83%
Covered Call-1.49%
Investment Grade4.30%
Senior Loan-54.72%
Investment Grade22.04%
US Stock4.76%
HY Bond-7.49%
BDC13.13%
World Stock3.34%
HY Bond1.59%
HY Bond-4.99%
US Stock7.65%
HY Bond8.50%
Muni Bond-1.67%
Convertible4.28%
Convertible-55.22%
US Stock13.73%
BDC2.87%
Covered Call-8.92%
Senior Loan12.6%
Preferred2.15%
Senior Loan1.32%
World Stock-6.55%
Preferred6.89%
Muni Bond8.41%
Preferred-1.67%
World Stock3.85%
World Stock-57.57%
Covered Call7.25%
Covered Call-2.35%
Convertible-14.09%
Covered Call9.47%
Investment Grade-1.5%
Convertible0.12%
Convertible-7.25%
REIT6.84%
Senior Loan4.82%
REIT-6.73%
BDC3.58%
REIT-63.22%
BDC-5.10%
Muni Bond-4.08%
World Stock-21.93%
MLP1.85%
Muni Bond-7.35%
World Stock-0.26%
MLP-44.23%
Muni Bond0.61%
MLP-5.77
MLP-13.45
Covered Call1.96%
Asset Class Annual Returns (NAV) 2008 - 2018
US Stock – CEFA's US Equity Index; REIT – CEFA's Global Real Estate, REIT & Real Asset Index; MLP – CEFA's Master Limited Partnership (MLP) Fund Index; BDC – CEFA's Debt-Focused Business Development Company (BDC) Index; High Yield Bond – CEFA's High Yield Bond Index; Preferred – CEFA's Preferred Equity Index; World Stock – CEFA's International Equity Index; Sr Loan - CEFA's Senior Loan Index; Muni Bond - CEFA's National Municipal Bond Index; Covered Call - CEFA's Covered Call /
Option Funds Index; Convertible - CEFA's Convertible Bond Index; Investment Grade - CEFA's Investment Grade Bond Index. Returns data are NAV total returns which include dividends and capital appreciation. "2007 - 2017" column shows yearly average for each sector. You cannot invest directly in an index. Past performance is not an indication of future results. Data for all indexes is sourced from CEFDATA.COM, as of 3/31/2018. Performance prior to 2015 was determined using index constituents as of
12/31/[email protected] -- Toll Free: (800) 356-3508 -- www.CEFadvisors.com
www.CEFadvisors.com 7

CEF Investing is a Blend of Income & Contrarian Investment Opportunities
Four Questions We Ask Constantly:
1) What has been normal for the fund; historically or vs. its peers?2) Is the CEF over, under or fairly valued?3) Is the dividend sustainable and reasonable for the sector?4) Has the manager achieved good net asset value performance?
We Look to get in a CEF ahead of, or alongside activist investors. How? We track a CEF’s historical & peer comparison:
Discount trend level Volume trend level Market price / NAV correlation New and updated 13/D or 13/F SEC filings
Note: A bond CEF should be thought of as an equity that ‘derives’ its value from bonds vs. a bond or a bond OEF/ETF

Buy at a ‘Discount’
Actively Monitor Funds
Track Relative Value/ Swap Funds
Anticipate Dividend Changes
When to Raise Cash?
Sell at Premium or Set Stops
CEF Manager Analysis & Results
Adjust Portfolio
Allocations
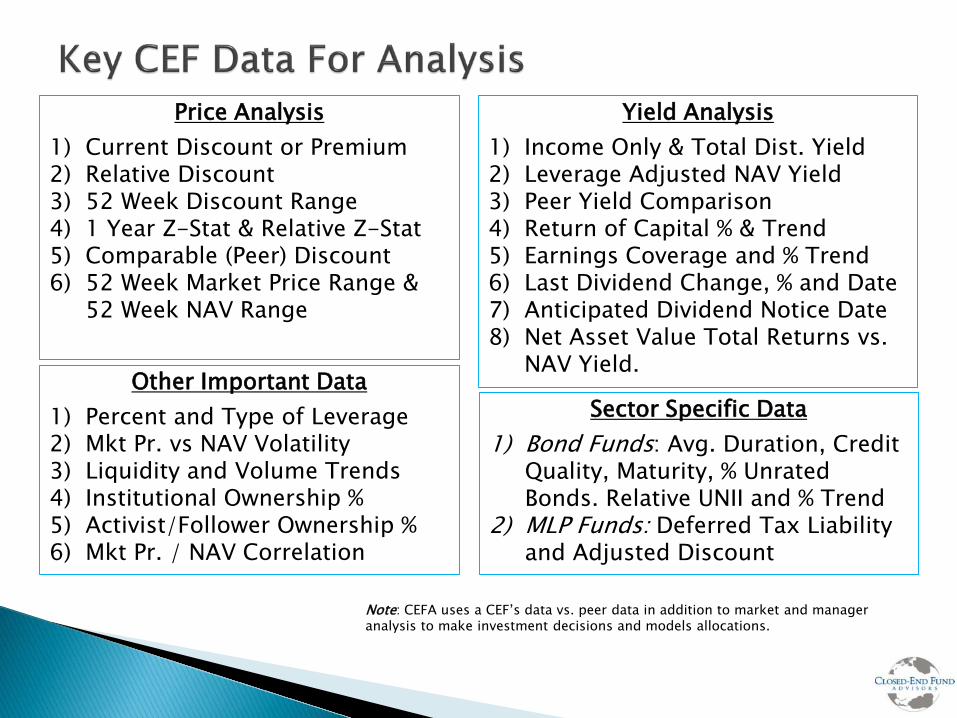
Price Analysis1) Current Discount or Premium2) Relative Discount3) 52 Week Discount Range4) 1 Year Z-Stat & Relative Z-Stat5) Comparable (Peer) Discount6) 52 Week Market Price Range &
52 Week NAV Range
Yield Analysis1) Income Only & Total Dist. Yield2) Leverage Adjusted NAV Yield3) Peer Yield Comparison4) Return of Capital % & Trend5) Earnings Coverage and % Trend6) Last Dividend Change, % and Date7) Anticipated Dividend Notice Date8) Net Asset Value Total Returns vs.
NAV Yield.
Note: CEFA uses a CEF’s data vs. peer data in addition to market and manager analysis to make investment decisions and models allocations.
Other Important Data1) Percent and Type of Leverage2) Mkt Pr. vs NAV Volatility3) Liquidity and Volume Trends4) Institutional Ownership %5) Activist/Follower Ownership %6) Mkt Pr. / NAV Correlation
Sector Specific Data1) Bond Funds: Avg. Duration, Credit
Quality, Maturity, % Unrated Bonds. Relative UNII and % Trend
2) MLP Funds: Deferred Tax Liability and Adjusted Discount

Municipal Bond CEF Screen
Daily Liquidity: $500K+ Discount Wider than Peer Average Total Yield Above Peer Average Earnings Coverage above Peer-
Average 6 & 12 Month NAV Total Return
above Peer-Average AMT Exposure Under 15% No Return of Capital (RoC) Analyze Dividend History &
UNII/Earnings Trend for Dividend risk
Recent Earnings/UNII Figures
On 01/30/15: 5 of 192 possible funds made the screen averaging tax-free 5.8% indicated yield
Equity Income Screen
Daily Liquidity: $500K+ Discount Wider than -5.0% Discount Range under 90% 1 Yr. Z-Stat Under 1.50 Rel. Disc./Prem. Under 1.0% M. or Q. Dividend Yield Over 6.5% Lev. Adj. NAV Yield Under 8.5% RoC Trend Flat/Down, Below 80% 1 Yr. NAV T.R. Over +8.0% 6 mo. NAV TR Over +3.0% Expense Ratio Under 3%
On 01/30/15: 6 of 225 possible equity funds made the screen in 4 different sub-grouping of CEFs with an average 8.2% indicated yield.
Note: Example screens used only to give an idea on how CEFA analyses CEF data and is not the only factors we consider for our decisions.
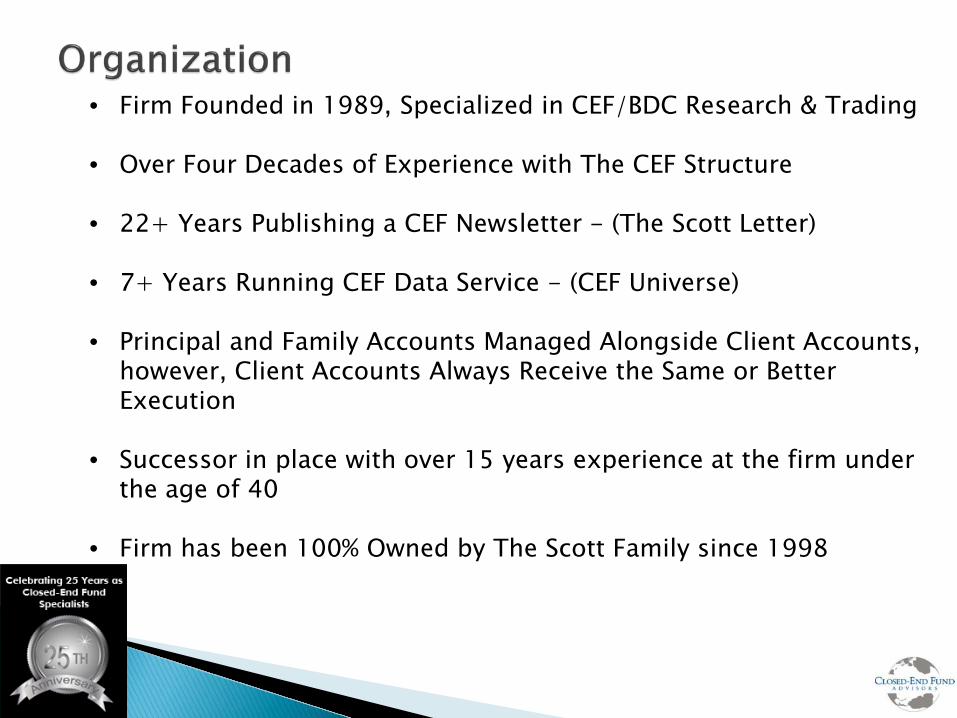
• Firm Founded in 1989, Specialized in CEF/BDC Research & Trading
• Over Four Decades of Experience with The CEF Structure
• 22+ Years Publishing a CEF Newsletter - (The Scott Letter)
• 7+ Years Running CEF Data Service - (CEF Universe)
• Principal and Family Accounts Managed Alongside Client Accounts, however, Client Accounts Always Receive the Same or Better Execution
• Successor in place with over 15 years experience at the firm under the age of 40
• Firm has been 100% Owned by The Scott Family since 1998

Experience
27 years on the board of directors a CEF (AMEX: BEM)
Co-author only hardback book on CEFs (1991)
22+ Years Publishing CEF interviews (The Scott Letter)
Seven year-old weekly CEF data service covering 235+ data points & 210+ for BDCs
Quoted widely by the financial press & recognized as nationally known speakers
Founder 1500 member CEF group on LinkedIn
Resources
Five employees, two FINRA 65/66 licensed Portfolio Managers averaging 30 years of experience
Data team collecting updated fund information and monitoring alerts for all US listed CEFs & BDCs
20:1 Client to employee ratio, 42:1 Manager to client ratio
100% Cloud-based systems allowing for a disaster recovery plan or mobile work when needed
Two CEF execution firms to assist in liquidity and best execution

Diversified Growth (1/1999)◦ 80% Equity / 10% Bond / 10% BDC: Tactical and wide mandate w/ 4%-7%+ est. yield
Growth & Income (1/1999)◦ 72% Equity / 16% Bond / 12% BDC: Diversified, tactical and wide mandate w/ 6%+ est. yield
International Opportunity (11/2002)◦ Primarily equity oriented funds w/ little direct US exposure 3%+ est. yield
Hybrid Income (12/2006)◦ 50% Equity /30% Bond / 20% BDC: Diversified, tactical and wide mandate w/ 9.5%+ est. yield
Foundation/Balanced (10/2009)◦ 55% Equity / 37% Bond / 8% BDC: Diversified and tactical w/ 6%-7.5% est. yield
Conservative Diversified (5/2009)
◦ Primarily CEF-based with 37% Equity / 24% Bond / 5% BDC: Diversified & tactical. Exposure to Non traditional equity/bond ETFs & OEFs (34%) seeking to reduce portfolio volatility
Special Situations (6/2013)
◦ A focused portfolio of 4-7 CEFs & BDCs looking for ideas in three areas: 1. Activist Involved Funds 2. Severe Discount Arbitrage 3. CEFA’s Best Fundamental Ideas
Managed Municipal Bond (8/2014)
◦ Actively managed municipal bond portfolio comprising of both National and State Muni funds. Constantly monitoring for diversified, high quality blended tax free yield while seeking to protect principal
Diversified Tax-Sensitive Income◦ 25%-50% exposure to Municipal Bond CEFs and 20%-40% exposure to low correlation and tax sensitive sectors: MLP
and Covered Call Funds. Seeking 7%-7.5% after tax income. Business Development Company (BDC) Funds (1/2015)
◦ Diversified selection of BDCs seeking consistent income & positive growth of principal and exploiting the increased inefficiencies from a group of funds that trade 5X the liquidity and 20%+ more yield than traditional taxable CEFs. BDCs are generally liquid venture debt exposure to private US companies. www.BDCuniverse.net
Note: When the percentage allocations above do not add up to 100%, the balance is cash exposure for the portfolio model. Account CEFA manages under $100K in value can have allocation variance's due to a smaller number of funds held in the account. Model allocations are as of 3/31/2016.
www.CEFAdvisors.com


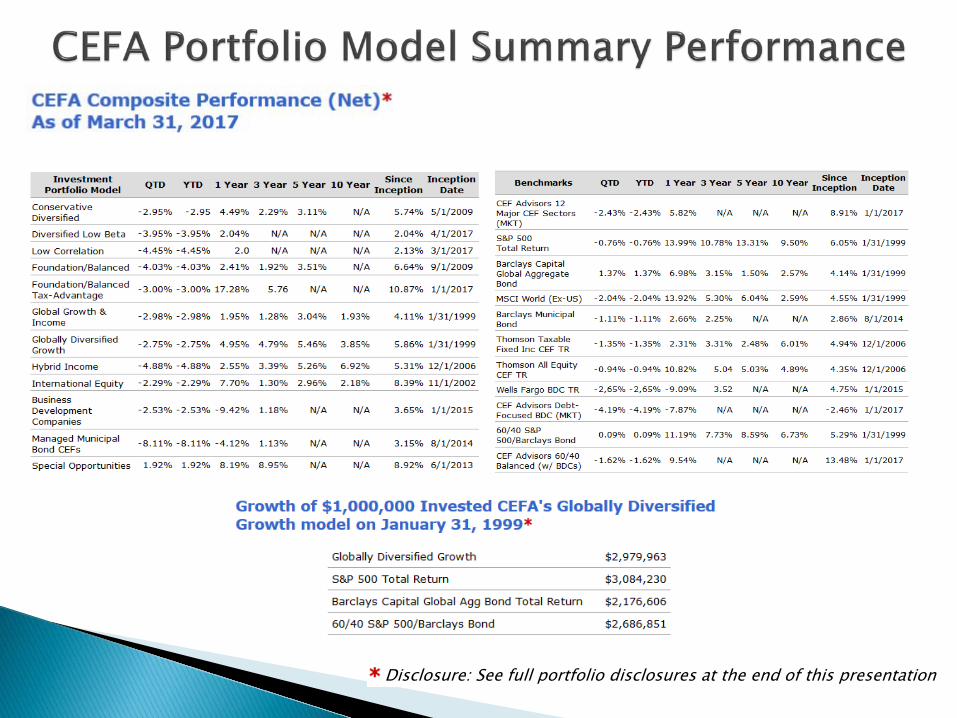
Disclosure: See full portfolio disclosures at the end of this presentation
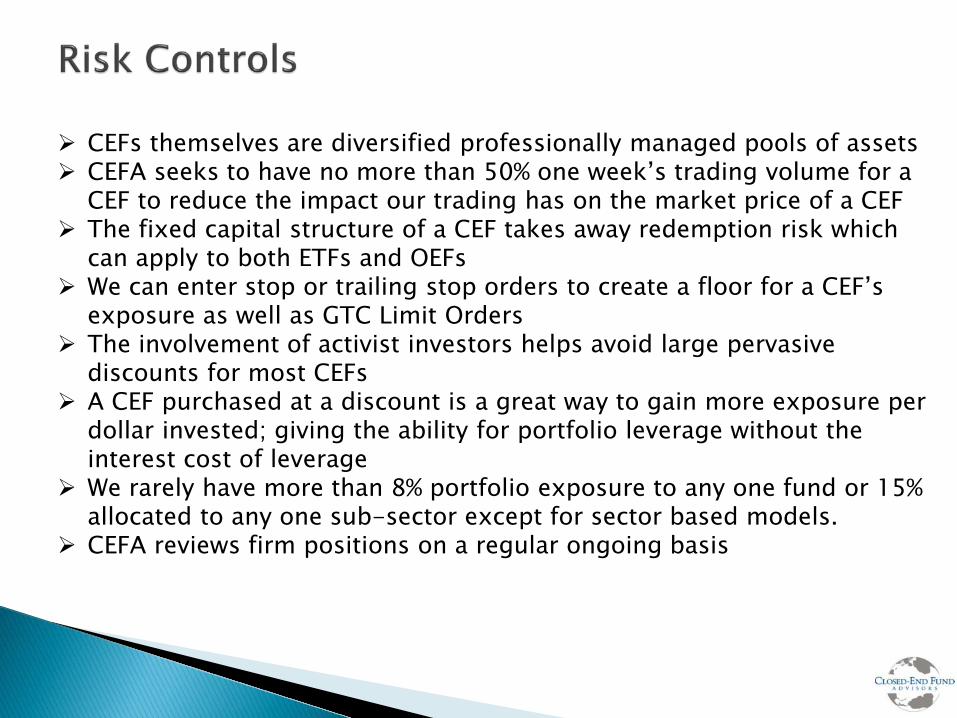
CEFs themselves are diversified professionally managed pools of assets CEFA seeks to have no more than 50% one week’s trading volume for a
CEF to reduce the impact our trading has on the market price of a CEF The fixed capital structure of a CEF takes away redemption risk which
can apply to both ETFs and OEFs We can enter stop or trailing stop orders to create a floor for a CEF’s
exposure as well as GTC Limit Orders The involvement of activist investors helps avoid large pervasive
discounts for most CEFs A CEF purchased at a discount is a great way to gain more exposure per
dollar invested; giving the ability for portfolio leverage without the interest cost of leverage
We rarely have more than 8% portfolio exposure to any one fund or 15% allocated to any one sub-sector except for sector based models.
CEFA reviews firm positions on a regular ongoing basis

6-35 CEFs per account depending on account size and model (Sector vs. Diversified models)
On average, 5-10 trades per quarter, with the potential for very active and quiet quarters. Trading on most models every 3-10 weeks
Investment models can shift throughout the year to adjust for economic, market and the firm’s outlook
CEFA charges fees in advance on a quarterly basis, for portfolio model, trade execution and reporting services
No lock-up period, separately managed account structure
Custodian and Reporting Requirement: Online trade access, block trading account with the ability to use step-out (in) trading firms. Integration with Orion Advisor for composite and client reporting.

George Cole ScottSr. Portfolio Manager, President of Closed-End Fund AdvisorsGeorge’s investment career started in 1969 when he joined a regional brokerage firm after a career as ajournalist. In 1976 he helped a client buy control of a deeply discounted CEF which became BergstromCapital (AMEX: BEM). He served on the board of the fund for 27 years. In 1987 he founded The Scott Letter:Closed-End Fund Report which was a well regarded print newsletter ending the publication when he becamea shareholder of CEF Advisors in 1996. In 1991 he co-authored the only hardback book on CEFs with afinance professor. He is a graduate of The University of Washington, holds the FINRA 66 License and is along time member of The CFA Society and CFA Virginia. He has been widely published and interviewed. Hehas also worked with various closed-end funds on a consulting basis. George is one of a few CEF specialistswith more than four decades of CEF experience .
John Cole Scott, CFSChief Investment Officer of Closed-End Fund Advisors
John has worked at the firm since 2001. He sits on the firm’s investment committee and holds the FINRA 66License and the Certified Fund Specialist designation (CFS). He is a graduate of The College of William andMary and has been quoted widely in the financial press and presented at conferences and for investmentgroups on more than 40 occasions. In 2008 John founded CEFA's Closed-End Fund Universe, acomprehensive weekly data service covering 240+ data points for all US listed closed-end funds and 215 forBDC Funds. He also founded and manages The CEF Network group on LinkedIn and is editor of the firm’sblog. John is a board member of The Richmond Association for Business Economics (RABE), and serves onthe Investment Committee for The New York State Society of The Cincinnati.

Closed-End Fund Advisors, Inc.7204 Glen Forest Drive, Suite #105
Richmond, Virginia 23226 U.S.A(800) 356-3508 / (804) 288-2482
www.CEFadvisors.com www.BDCUniverse.netwww.CEF-Blog.com
*DISCLOSURES: The net returns presented above for all of CEFA's composites were calculated on a time-weighted return basis. All dividends, interest and income, realized and unrealized gains and losses, brokerage and custodial fees are fully reflected. CEFA advisory fees are fully detailed in its ADV Part 2, which is available upon request by calling John Cole Scott at (804) 288-2482. The CEFA composite includes all actual fee-paying and non-fee-paying, fully discretionary accounts in this investment strategy that have been under CEFA management for at least three months.
Diversified Growth and Growth & Income Models: These accounts are managed by both John Cole Scott and George Scott. John Cole Scott began managing accounts in the composite 06/31/2009. The founder of CEFA, George Scott has been managing accounts since the composites inception. As of December 31, 2013, the percentage of non-fee-paying CEFA accounts in this strategy was 10% Growth and 11% Growth & Income. The inception date of both the Globally Diversified Growth and Growth and Income composite is January 31, 1999. Hybrid Income Model: As of December 31, 2013, the percentage of non-fee-paying CEFA accounts in this strategy was 0%. The inception date of the Hybrid Income composite is November 1, 2006. International Opportunity: These accounts are managed by both John Cole Scott and George Scott. John Cole Scott began managing accounts in the International composite 12/31/2010. The founder of CEFA, George Scott has been managing accounts since the composites inception. As of December 31, 2013, the percentage of non-fee-paying CEFA accounts in this strategy was 11%. The inception date of the International Equity (formerly called International Equity and International REIT) composite is November 1, 2002. Foundation Balanced, Conservative Diversified and Special Opportunities: CEFA composites include all fee paying and non-fee paying clients in the model that have given CEFA full discretion and managed only by John Cole Scott. The percentage of non-fee-paying CEFA accounts these models is 0%.
The results for individual accounts at different periods may vary. Investors should not rely on prior performance as a reliable indication of future results. These figures are unaudited and may be subject to change. The information provided should not be considered as a recommendation to buy or sell any particular security outside of a managed account. CEFA reserves the right to modify its current investment strategies and techniques based on changing market conditions or client needs. The S&P 500 and DJ World Stock (excluding U.S.) indices were calculated using total return analysis with dividends reinvested. These indexes have not been selected to represent an appropriate benchmark to compare an client's performance, but rather is disclosed to allow for comparison of the client's performance to that of a certain well-known and widely recognized index.