every acre counts the newfound watershed master plan land conservation priorities in the newfound...
TRANSCRIPT
Every Acre CountsThe Newfound Watershed Master Plan
Land Conservation PrioritiesIn the Newfound Lake Watershed
January 23, 2015
Dan SundquistGreenFire GIS

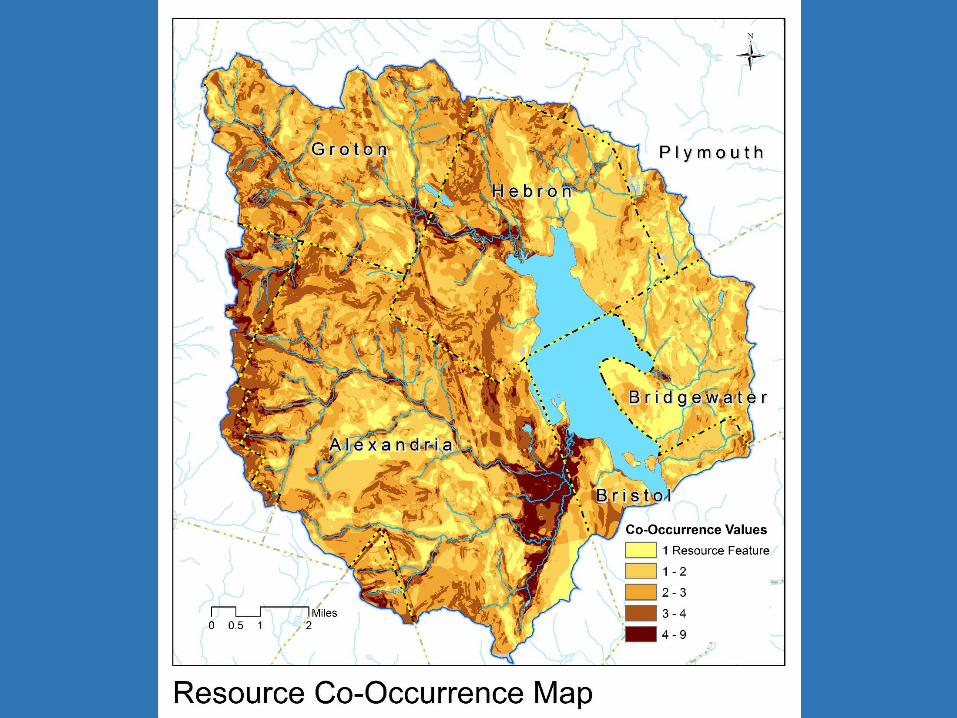
Conservation Planning Process
• Map Key Natural Resource Features• Generate a Co-occurrence Map of All Features• Analyze Co-Occurrence Map for
High-Value Areas
Caveats:• Best-Available Public GIS Data• Scaling Issues (Regional v. Site Scale)• Refine the Plan?
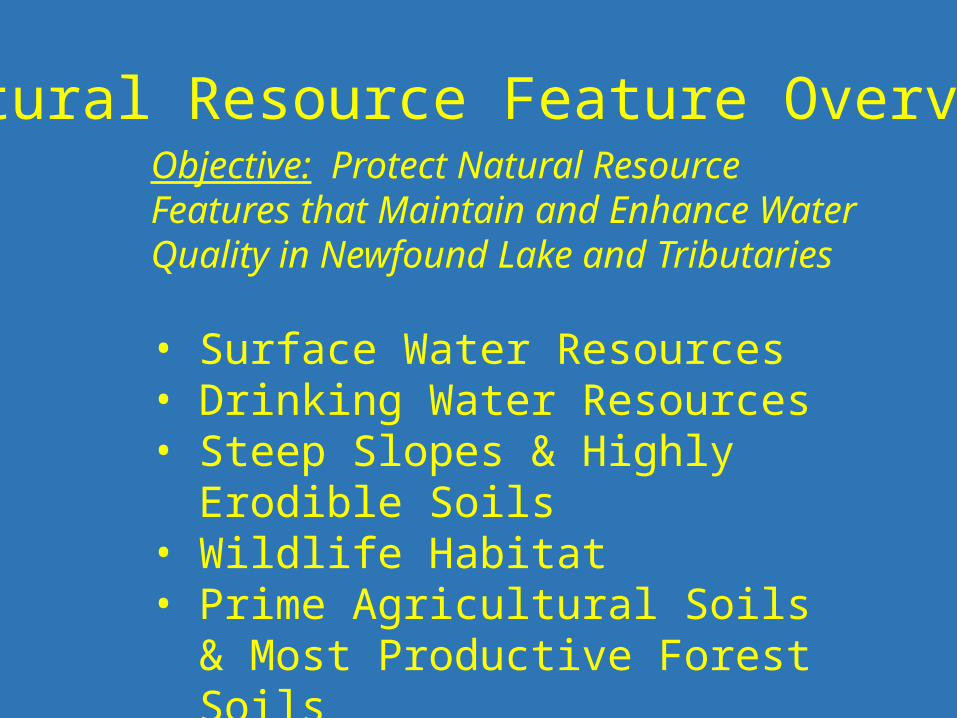
Natural Resource Feature Overview
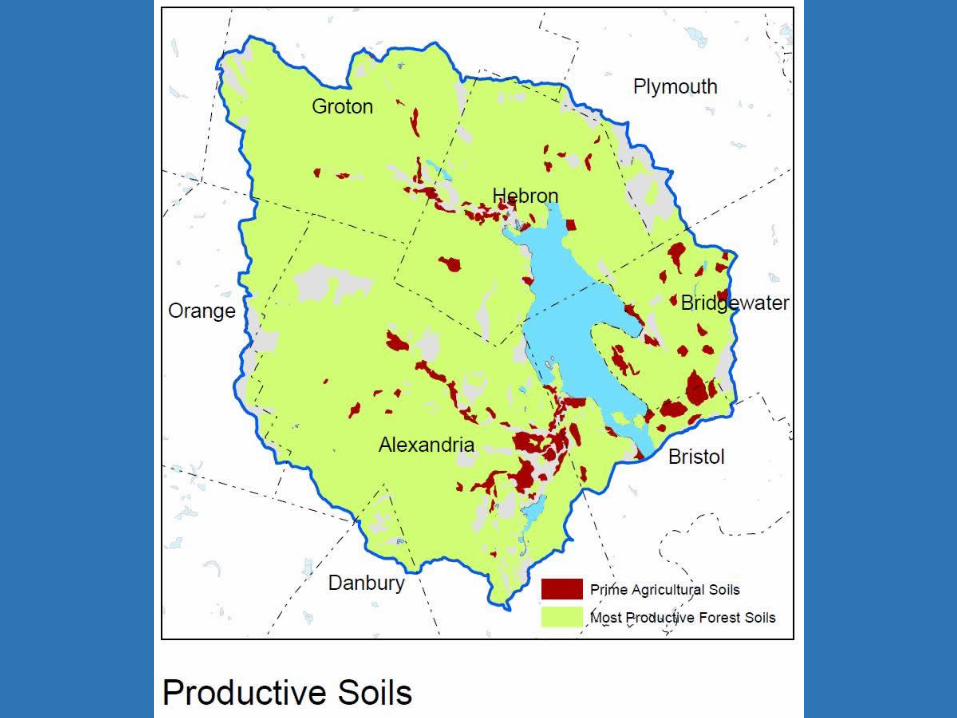
• Surface Water Resources• Drinking Water Resources• Steep Slopes & Highly Erodible Soils• Wildlife Habitat • Prime Agricultural Soils & Most
Productive Forest Soils
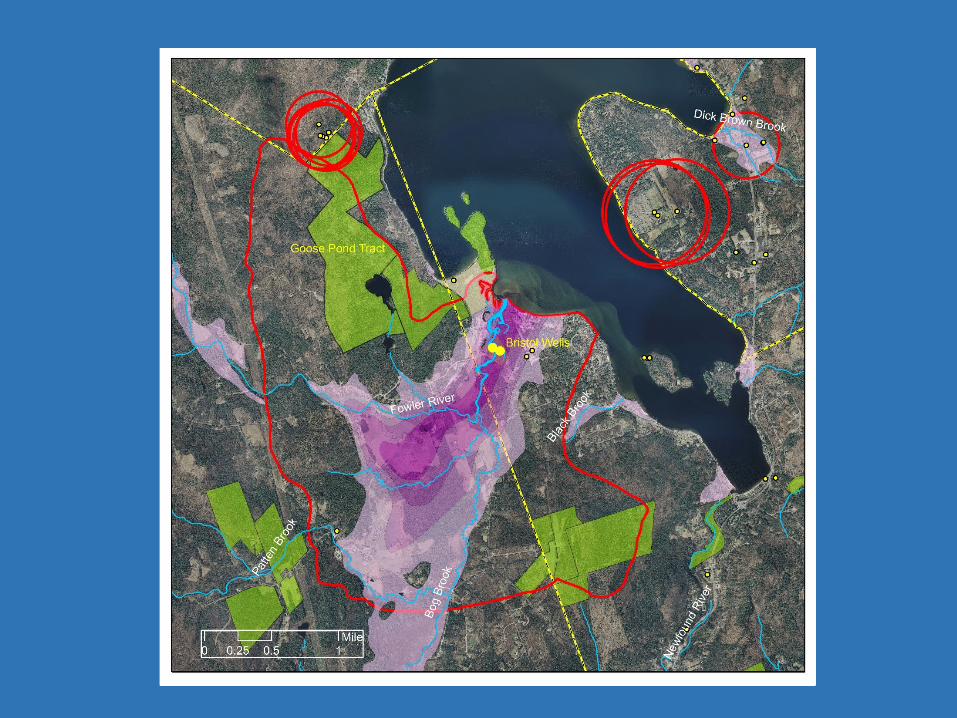
Objective: Protect Natural Resource Features that Maintain and Enhance Water Quality in Newfound Lake and Tributaries

~61,000 Acres or 95 Sq. Miles56, 326 Acres Land Area

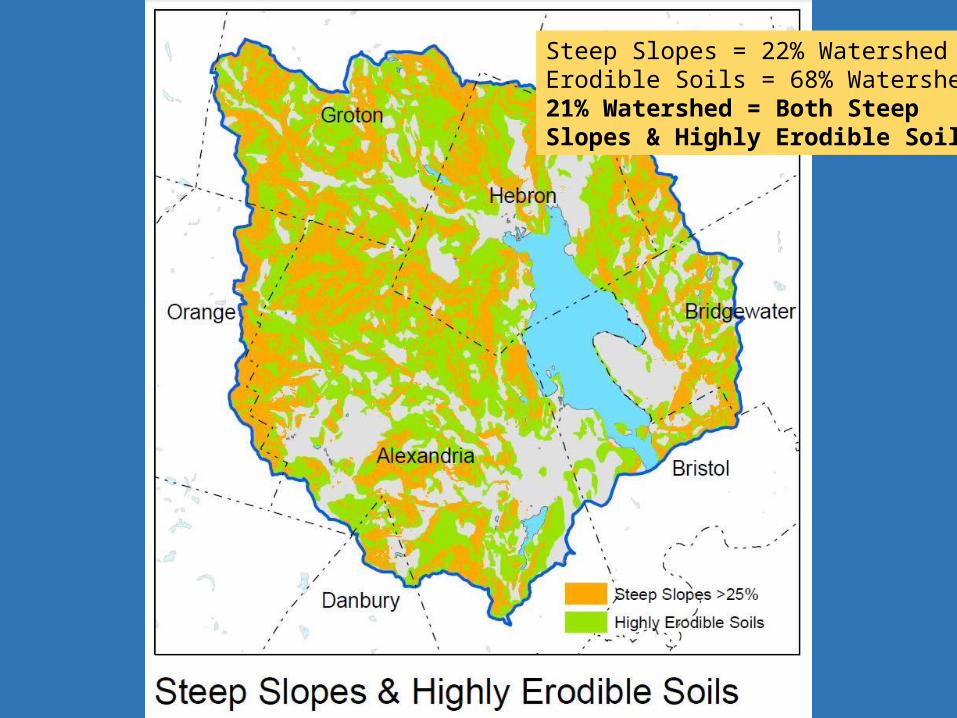
Steep Slopes = 22% WatershedErodible Soils = 68% Watershed21% Watershed = Both Steep Slopes & Highly Erodible Soils


~10,000 Acres Conserved18% of Land Area
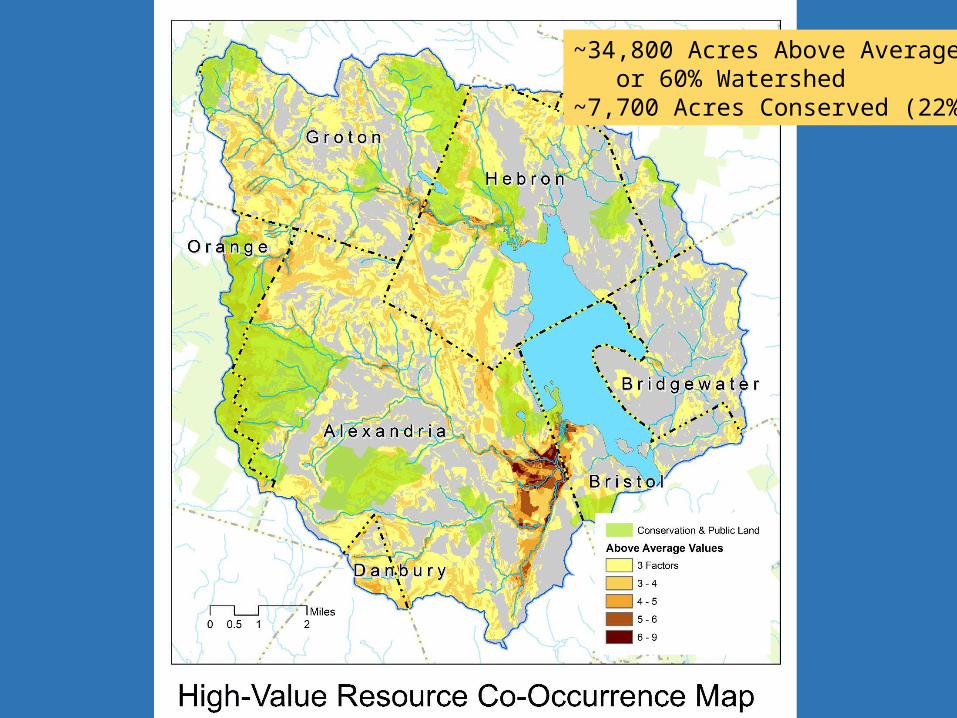
~34,800 Acres Above Average or 60% Watershed~7,700 Acres Conserved (22%)
MunicipalityLand Area
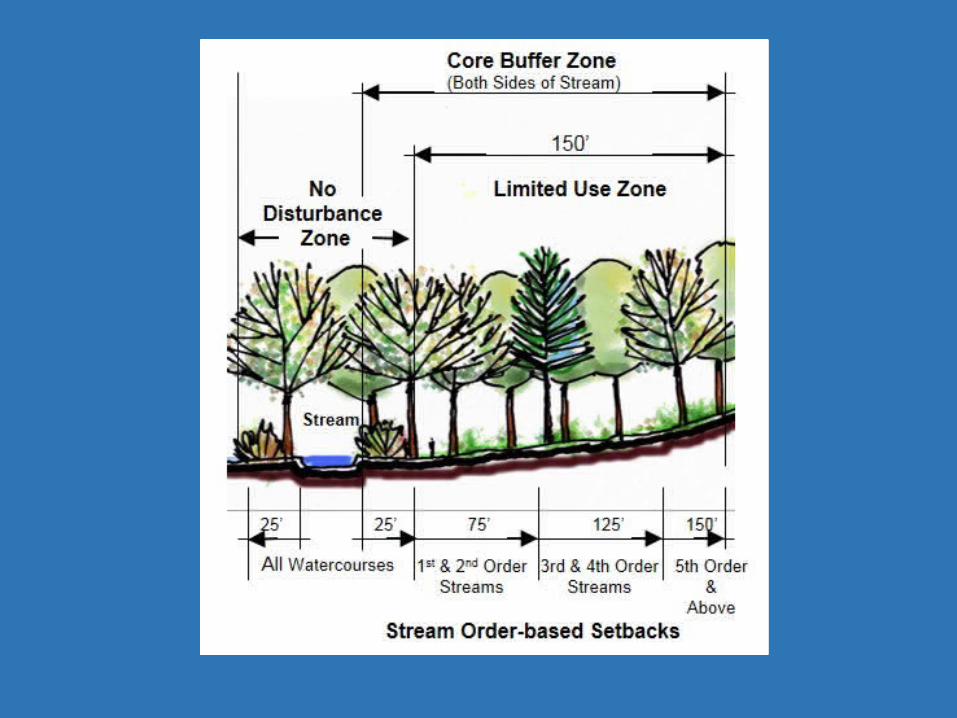
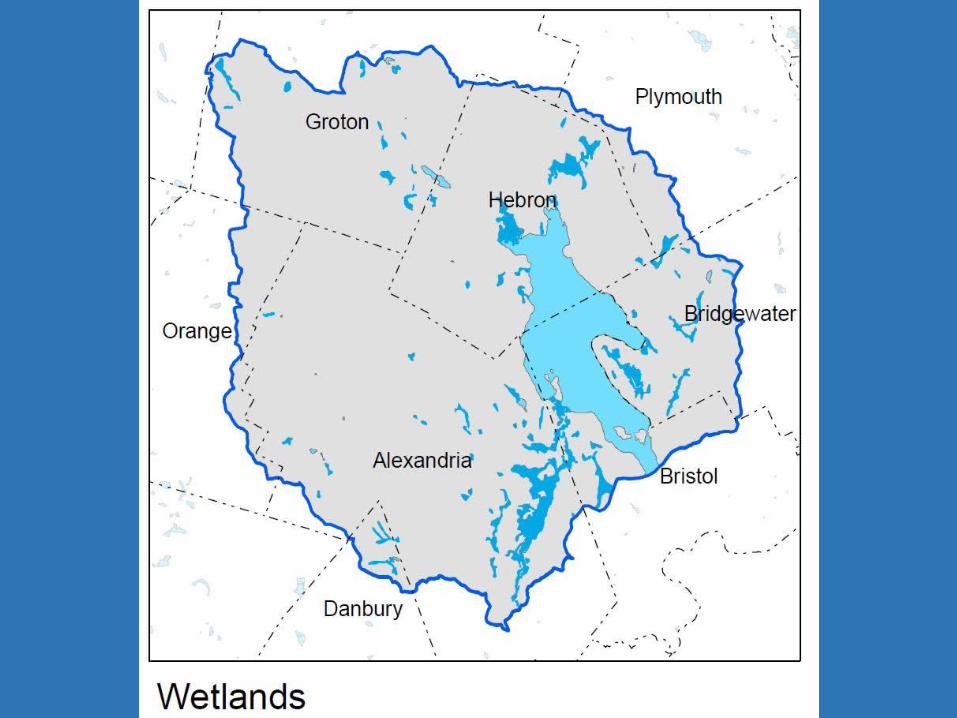
(Ac) WetlandsRiparian
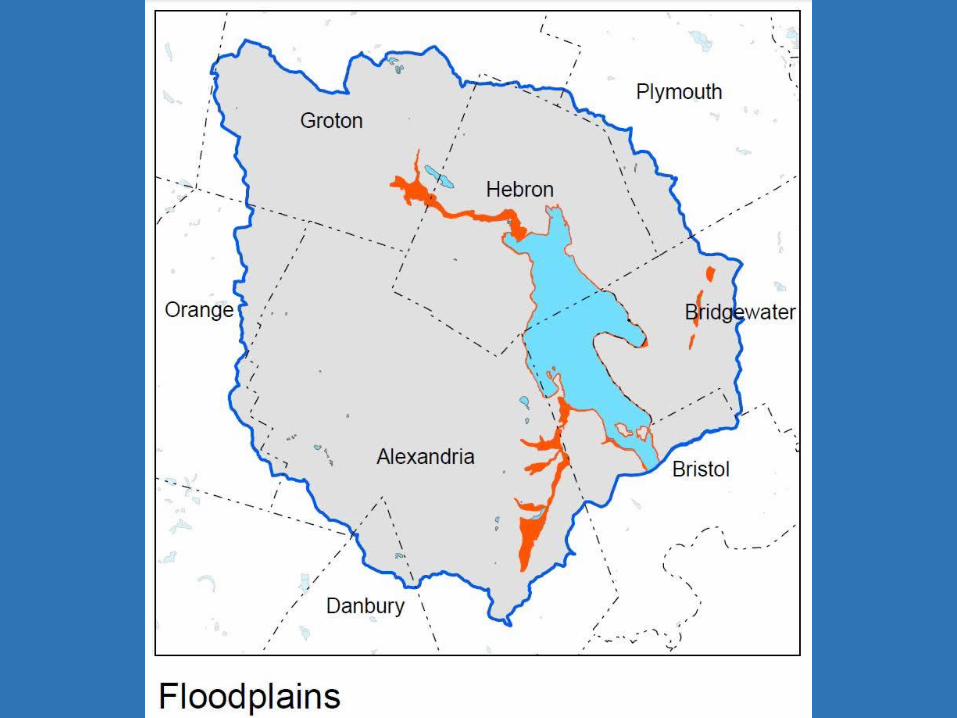
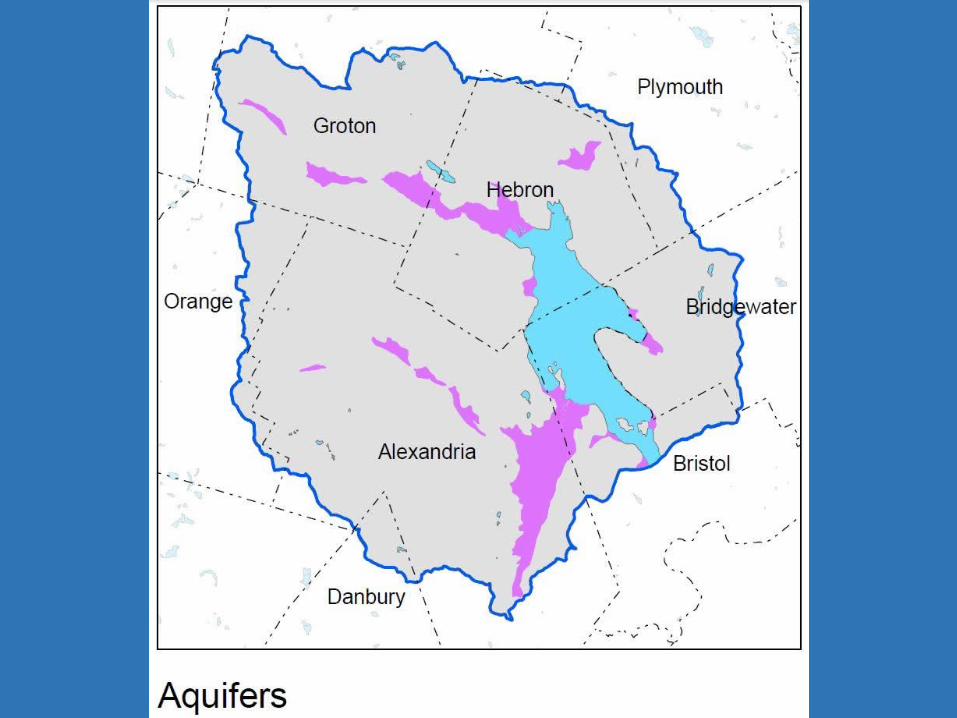
Buffer Floodplains Aquifer
Steep Slopes >25%
Highly Erodilble
SoilsFuture Well
Sites
Wellhead Protection
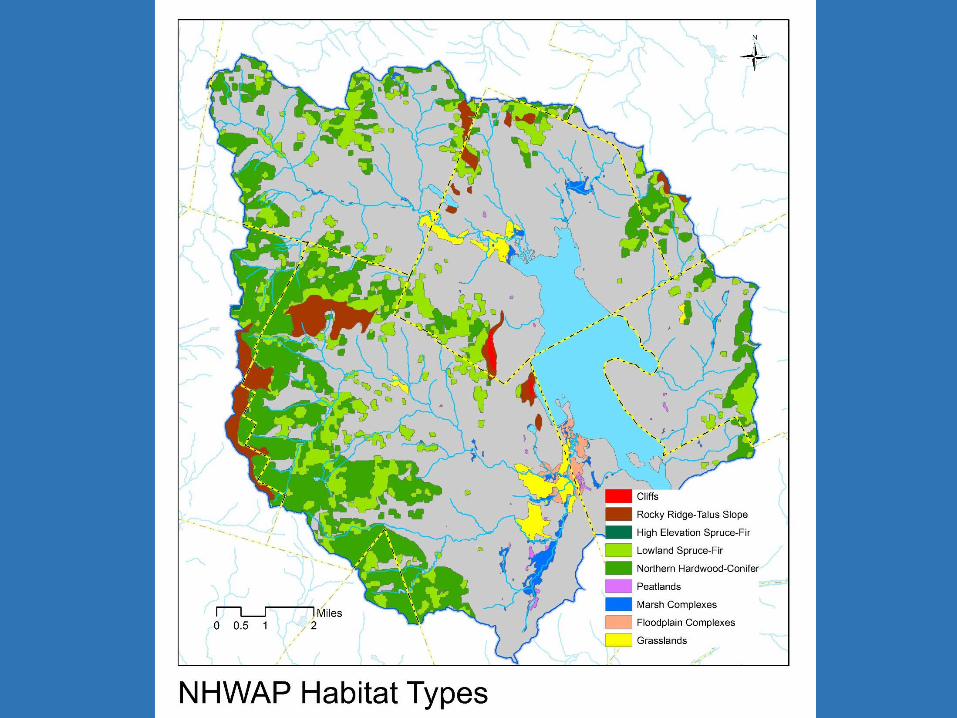
AreasNHWAP
Tier 1NHWAP
Tier 2
Special Habitat Types
Prime Ag Soils
Prime Forest Soils
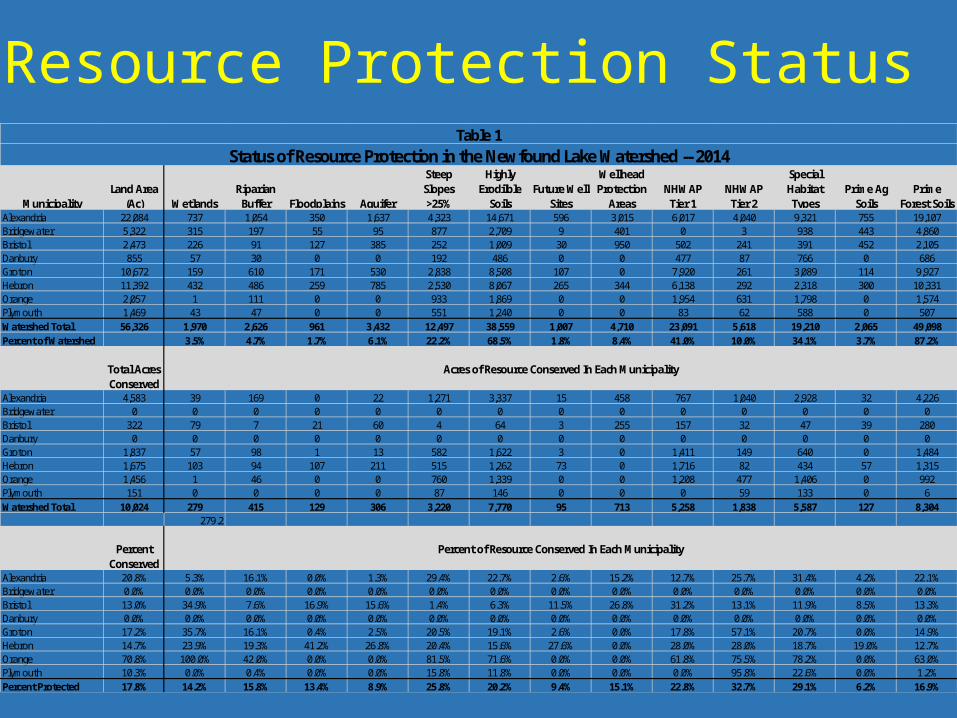
Alexandria 22,084 737 1,054 350 1,637 4,323 14,671 596 3,015 6,017 4,040 9,321 755 19,107Bridgewater 5,322 315 197 55 95 877 2,709 9 401 0 3 938 443 4,860Bristol 2,473 226 91 127 385 252 1,009 30 950 502 241 391 452 2,105Danbury 855 57 30 0 0 192 486 0 0 477 87 766 0 686Groton 10,672 159 610 171 530 2,838 8,508 107 0 7,920 261 3,089 114 9,927Hebron 11,392 432 486 259 785 2,530 8,067 265 344 6,138 292 2,318 300 10,331Orange 2,057 1 111 0 0 933 1,869 0 0 1,954 631 1,798 0 1,574Plymouth 1,469 43 47 0 0 551 1,240 0 0 83 62 588 0 507Watershed Total 56,326 1,970 2,626 961 3,432 12,497 38,559 1,007 4,710 23,091 5,618 19,210 2,065 49,098Percent of Watershed 3.5% 4.7% 1.7% 6.1% 22.2% 68.5% 1.8% 8.4% 41.0% 10.0% 34.1% 3.7% 87.2%
Total Acres Conserved
Alexandria 4,583 39 169 0 22 1,271 3,337 15 458 767 1,040 2,928 32 4,226Bridgewater 0 0 0 0 0 0 0 0 0 0 0 0 0 0Bristol 322 79 7 21 60 4 64 3 255 157 32 47 39 280Danbury 0 0 0 0 0 0 0 0 0 0 0 0 0 0Groton 1,837 57 98 1 13 582 1,622 3 0 1,411 149 640 0 1,484Hebron 1,675 103 94 107 211 515 1,262 73 0 1,716 82 434 57 1,315Orange 1,456 1 46 0 0 760 1,339 0 0 1,208 477 1,406 0 992Plymouth 151 0 0 0 0 87 146 0 0 0 59 133 0 6Watershed Total 10,024 279 415 129 306 3,220 7,770 95 713 5,258 1,838 5,587 127 8,304
279.2
Percent Conserved
Alexandria 20.8% 5.3% 16.1% 0.0% 1.3% 29.4% 22.7% 2.6% 15.2% 12.7% 25.7% 31.4% 4.2% 22.1%Bridgewater 0.0% 0.0% 0.0% 0.0% 0.0% 0.0% 0.0% 0.0% 0.0% 0.0% 0.0% 0.0% 0.0% 0.0%Bristol 13.0% 34.9% 7.6% 16.9% 15.6% 1.4% 6.3% 11.5% 26.8% 31.2% 13.1% 11.9% 8.5% 13.3%Danbury 0.0% 0.0% 0.0% 0.0% 0.0% 0.0% 0.0% 0.0% 0.0% 0.0% 0.0% 0.0% 0.0% 0.0%Groton 17.2% 35.7% 16.1% 0.4% 2.5% 20.5% 19.1% 2.6% 0.0% 17.8% 57.1% 20.7% 0.0% 14.9%Hebron 14.7% 23.9% 19.3% 41.2% 26.8% 20.4% 15.6% 27.6% 0.0% 28.0% 28.0% 18.7% 19.0% 12.7%Orange 70.8% 100.0% 42.0% 0.0% 0.0% 81.5% 71.6% 0.0% 0.0% 61.8% 75.5% 78.2% 0.0% 63.0%Plymouth 10.3% 0.0% 0.4% 0.0% 0.0% 15.8% 11.8% 0.0% 0.0% 0.0% 95.8% 22.6% 0.0% 1.2%Percent Protected 17.8% 14.2% 15.8% 13.4% 8.9% 25.8% 20.2% 9.4% 15.1% 22.8% 32.7% 29.1% 6.2% 16.9%
Status of Resource Protection in the Newfound Lake Watershed -- 2014
Percent of Resource Conserved In Each Municipality
Acres of Resource Conserved In Each Municipality
Table 1
Resource Protection Status

Next Steps…Confirm Objective: Protect Natural Resource Features that Maintain and Enhance Water Quality in Newfound Lake and Tributaries
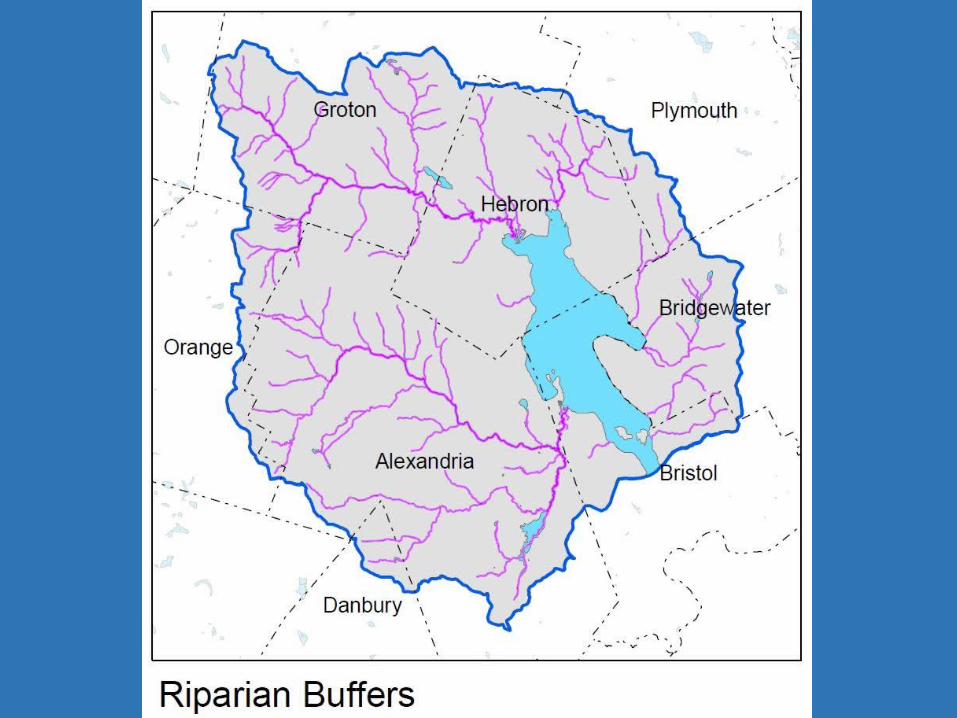
Recommended Priority Features to Protect:• Riparian zones along rivers and tributaries• Land surrounding wetlands & floodplains (buffers)• Aquifer recharge zones (especially Fowler River)• Steep slopes & highly erodible soils (headwaters)
Plan Refinement: Consider developing a “shared vision” of conservation priorities with a regional stakeholder group.