revised city development plan for hubli-dharwad, 2041 · revised city development plan for...
TRANSCRIPT

Revised City Development Plan for
Hubli-Dharwad, 2041
(Draft City Development Plan)
August 2014
Supported under
Capacity Building for Urban Development project
(CBUD)
A Joint Partnership Program between
Ministry of Urban Development, Government of India
and
The World Bank

Ministry of Urban Development
Capacity Building for Urban Development Project
City Development Plan for Hubli Dharwad - 2041
Draft City Development Plan
August 2014
CRISIL Risk and Infrastructure Solutions Limited
” Commercial, cultural and educational hub of North
Karnataka and create an opportunity for growth to all
segments of people
Ministry of Urban Development
[iii]] Draft City Development Plan – Hubli-Dharwad
Contents
List of Abbreviations ......................................................................................................................... xiii
List of Tables ....................................................................................................................................... xv
List of Figures .................................................................................................................................... xix
1. Project Background .................................................................................................................... 22
1.1 Context .................................................................................................................................. 22
1.2 Revised CDP under CBUD Project ....................................................................................... 23
1.2.1 CBUD Programme ................................................................................................... 23
1.2.2 Preparation of Revised CDP under CBUD Programme .......................................... 24
1.3 Revised CDP Guidelines – Key Areas of Emphasis ............................................................. 24
1.3.1 Vision Led Planning ................................................................................................. 24
1.3.2 Resource based planning ........................................................................................ 25
1.3.3 Participatory approach ............................................................................................. 25
1.3.4 Equity concerns, poverty and local economy development .................................... 25
1.3.5 Capacity Building in ULB ......................................................................................... 25
1.3.6 Sectoral Action Plans with Goal Oriented Targets .................................................. 26
1.3.7 Monitoring and Evaluation Arrangements ............................................................... 26
1.4 Objective of the Assignment ................................................................................................. 26
1.5 Approach and Methodology .................................................................................................. 26
1.6 Brief on Comprehensive Development Plan ......................................................................... 28
1.7 Brief on 1st generation CDP .................................................................................................. 29
1.7.1 Projects proposed in 1st generation CDP ................................................................ 30
1.8 Brief scenario after 1st generation CDP ................................................................................ 30
1.9 Key process undertaken for revised CDP preparation process ............................................ 31
1.9.1 Committee Formation – Technical and Policy ......................................................... 31
1.9.2 Stakeholder‘s consultation brief ............................................................................... 32
2. Introduction to the City .............................................................................................................. 34
2.1 Regional Setting .................................................................................................................... 34
2.2 Administrative Boundary ....................................................................................................... 36
2.3 Location and Connectivity ..................................................................................................... 36
2.4 Defining the Study Area ........................................................................................................ 37
Ministry of Urban Development
[iv]] Draft City Development Plan – Hubli-Dharwad
2.5 Physical Setting ..................................................................................................................... 37
2.5.1 Topography and Geology ........................................................................................ 37
2.5.2 Climate ..................................................................................................................... 37
2.5.3 Agriculture, Mineral, and Industry ............................................................................ 37
2.5.4 Water Resources ..................................................................................................... 37
2.5.5 Forest Resources .................................................................................................... 38
3. Demographic Profile of the Town ............................................................................................. 39
3.1 Background ........................................................................................................................... 39
3.2 Population and Urbanization ................................................................................................. 39
3.2.1 Dharwad district population ..................................................................................... 41
3.2.2 Hubli-Dharwad city ................................................................................................... 42
3.3 Population Growth Trend ...................................................................................................... 43
3.4 Population Density ................................................................................................................ 44
3.4.1 Ward-wise demographic profile ............................................................................... 45
3.5 Average Household Size ....................................................................................................... 48
3.6 Literacy Rate ......................................................................................................................... 49
3.7 Sex Ratio ............................................................................................................................... 49
3.7.1 Age-sex distribution ................................................................................................. 49
3.8 Scheduled Caste and Scheduled Tribe Population .............................................................. 50
3.9 Key Observations .................................................................................................................. 50
3.10 Population Projections .......................................................................................................... 50
3.10.1 Methodology adopted for the estimation of population ............................................ 50
3.10.2 Basic assumptions made for population projection ................................................. 52
3.10.3 Recommended population projection ...................................................................... 52
4. Economic Profile of the Town ................................................................................................... 53
4.1 Background ........................................................................................................................... 53
4.2 Overview of Economic Situation of the State and Town ....................................................... 53
4.2.1 Karnataka state economic profile ............................................................................ 54
4.2.2 Gross district domestic product (GDDP) ................................................................. 55
4.2.3 Dharwad district economic profile ............................................................................ 55
4.2.4 Economic profile – Hubli-Dharwad .......................................................................... 55
4.3 Industrial and Commercial Activities ..................................................................................... 56
4.3.1 Informal commercial activity .................................................................................... 58
4.3.2 Specific norms for the ULBs .................................................................................... 59
Ministry of Urban Development
[v]] Draft City Development Plan – Hubli-Dharwad
4.4 Workforce Participation Rate ................................................................................................ 60
4.4.1 State work participation ........................................................................................... 60
4.4.2 HDMC work participation rate .................................................................................. 60
4.5 Worker Classification ............................................................................................................ 60
4.6 Horticulture ............................................................................................................................ 61
4.7 Key Issues ............................................................................................................................. 62
5. Physical Planning and Growth Management ........................................................................... 63
5.1 Background ........................................................................................................................... 63
5.2 Constituents of Planning Area............................................................................................... 63
5.3 Projected Population under Development Plan .................................................................... 63
5.4 Spatial Growth Trends .......................................................................................................... 65
5.5 Spatial Distribution of Population .......................................................................................... 65
5.6 Critical Appraisal of the Master Plan/Development Plan ...................................................... 67
5.6.1 Land use analysis .................................................................................................... 67
5.6.2 Comparison with URDPFI guidelines ...................................................................... 70
5.6.3 Development proposals ........................................................................................... 70
5.7 Urban Planning Functions and Reforms ............................................................................... 71
5.8 Roles and Responsibilities of ULB and Parastatals .............................................................. 71
5.9 Key Issues ............................................................................................................................. 71
6. Social and Cultural Environment .............................................................................................. 73
6.1 Background ........................................................................................................................... 73
6.2 Health Facilities ..................................................................................................................... 73
6.2.1 Existing situation ...................................................................................................... 73
6.2.2 Basic public health indicators .................................................................................. 74
6.2.3 Disease pattern ........................................................................................................ 74
6.2.4 Role of HDMC in health programmes ...................................................................... 74
6.2.5 Comparison with URDPFI norms............................................................................. 75
6.2.6 Key issues ................................................................................................................ 75
6.3 Educational Facilities ............................................................................................................ 76
6.3.1 Existing situation ...................................................................................................... 76
6.3.2 Key concerns ........................................................................................................... 77
6.4 Recreational Facilities ........................................................................................................... 78
6.4.1 Parks, grounds, and open spaces ........................................................................... 78
6.4.2 Comparison with URDPFI norms............................................................................. 80
Ministry of Urban Development
[vi]] Draft City Development Plan – Hubli-Dharwad
6.4.3 Town halls and libraries ........................................................................................... 81
6.4.4 Sports facilities ......................................................................................................... 81
6.4.5 Key concerns/issues ................................................................................................ 81
7. Infrastructure and Services ....................................................................................................... 83
7.1 Water Supply ......................................................................................................................... 83
7.1.1 Existing Water Supply Situation............................................................................... 83
7.1.2 Water supply - Future demand ................................................................................ 89
7.1.3 24×7 urban water supply – A PPP attempt in Hubli-Dharwad ................................. 89
7.1.4 Critical analysis of water supply system post-1st Generation CDP ......................... 90
Status of projects .................................................................................................................. 91
7.1.5 Institutional framework for water supply system ...................................................... 91
7.1.6 Key issues ................................................................................................................ 91
7.2 Sewerage and Sanitation ...................................................................................................... 92
7.2.1 Existing sewerage and sanitation system ................................................................ 92
7.2.2 Ongoing projects ...................................................................................................... 94
7.2.3 Key issues ................................................................................................................ 95
7.3 Solid Waste Management ..................................................................................................... 95
7.3.1 Existing solid waste generation ............................................................................... 95
7.3.2 Future solid waste generation.................................................................................. 98
7.3.3 Critical analysis of solid waste management system .............................................. 99
7.3.4 Ongoing projects ...................................................................................................... 99
7.3.5 Institutional framework for SWM ............................................................................ 100
7.3.6 Key issues .............................................................................................................. 100
7.4 Storm Water Drainage ........................................................................................................ 101
7.4.1 Existing drainage system ....................................................................................... 101
7.4.2 Operation and maintenance of storm water drainage ........................................... 102
7.4.3 Service-level benchmarking ................................................................................... 102
7.4.4 Critical analysis of drainage system: Post-1st Generation CDP Scenario ............ 102
7.4.5 Key issues .............................................................................................................. 102
8. Traffic and Transportation System ......................................................................................... 104
8.1 Existing Road infrastructure ................................................................................................ 104
8.1.1 Road hierarchy system in the city .......................................................................... 105
8.1.2 Important junctions ................................................................................................ 108
8.2 Existing Traffic and Transportation System ........................................................................ 111

Ministry of Urban Development
[vii]] Draft City Development Plan – Hubli-Dharwad
8.2.1 Traffic volumes....................................................................................................... 111
8.2.2 Modes of transport ................................................................................................. 112
8.2.3 Existing Transportation Infrastructure .................................................................... 112
8.2.4 Parking facilities ..................................................................................................... 114
8.2.5 Safety and traffic management measures ............................................................. 114
8.2.6 Issues and key challenges ..................................................................................... 115
8.3 Review of Institutional and Investments .............................................................................. 115
8.3.1 Ongoing projects .................................................................................................... 116
8.4 Transit-Oriented Development ............................................................................................ 116
8.5 Street Lighting ..................................................................................................................... 118
8.6 Analysis of Post-1st Generation CDP Scenario .................................................................. 119
8.7 Review of Comprehensive Traffic and Transport Plan (CTTP) .......................................... 120
9. Housing and Urban Poverty ..................................................................................................... 126
9.1 Overall Housing Scenario in the City .................................................................................. 126
9.1.1 Present availability of housing stock ...................................................................... 126
9.1.2 Quality of housing stock ......................................................................................... 126
9.1.3 Spatial distribution of houses and settlement characteristics ................................ 127
9.1.4 Housing requirement as per the future projected population ................................ 128
9.1.5 Overview of growing housing sector in the town ................................................... 129
9.2 Urban Poverty and Slums ................................................................................................... 130
9.2.1 Slum profile in Hubli-Dharwad ............................................................................... 130
9.2.2 Existing situation of slums in HDMC ...................................................................... 133
9.2.3 Available infrastructure for slum communities ....................................................... 134
9.2.4 Housing stock requirement .................................................................................... 135
9.2.5 Urban poverty reduction and slum improvement projects ..................................... 135
9.2.6 Institutional framework ........................................................................................... 136
9.2.7 Key issues .............................................................................................................. 136
10. Baseline Environment: Urban Environment and Disaster Management ............................ 138
10.1 Pollution Level in the Town ................................................................................................. 138
10.1.1 Ambient Air Quality ................................................................................................ 138
10.1.2 Noise Quality.......................................................................................................... 138
10.1.3 Water Quality ......................................................................................................... 138
10.2 Ecology ................................................................................................................................ 140
10.3 Disaster-Proneness Assessment of the City ....................................................................... 140

Ministry of Urban Development
[viii]] Draft City Development Plan – Hubli-Dharwad
10.4 Disaster Management Mitigation Measures ........................................................................ 141
10.5 Key Observations ................................................................................................................ 141
11. Climate Change and Sustainable Development .................................................................... 142
11.1 Climate Change & City ........................................................................................................ 142
11.2 Risk of Climate Change in Karnataka ................................................................................. 143
11.2.1 Carbon emission scenario ..................................................................................... 143
11.3 Risk and impacts of Climate change in Hubli Dharwad ...................................................... 144
11.3.1 Urban Heat island .................................................................................................. 144
11.4 Initiatives for energy conservation and sustainable development ...................................... 145
11.4.1 State Action plan on climate change (SAPCC) ..................................................... 145
11.4.2 Ongoing initiatives at Sectoral level ....................................................................... 145
11.5 Initiatives in Hubli-Dharwad for sustainable development .................................................. 146
12. Cultural Resources, Heritage and Tourism ............................................................................ 148
12.1 Historical Importance of the town ........................................................................................ 148
12.2 Existing situation of Heritage Zone (Protected and un-protected) ...................................... 148
12.3 Heritage Conservation Initiatives ........................................................................................ 149
12.4 Tourism Scenario ................................................................................................................ 150
12.4.1 Strategies for Tourism Development in Hubli-Dharwad ........................................ 150
12.4.2 Key Issues ............................................................................................................. 151
13. Assessment of Institutions, Systems and Capacities .......................................................... 152
13.1 Urban governance system .................................................................................................. 152
13.2 Hubli Dharwad Municipal Corporation ................................................................................ 152
13.3 Urban reforms /transfer of function ..................................................................................... 155
13.3.1 Progress in Implementation of Reforms – State Level Reforms ........................... 157
13.4 ULB Level Reforms – Mandatory and Optional .................................................................. 157
13.4.1 Mandatory Reforms ............................................................................................... 157
13.4.2 Optional reforms .................................................................................................... 158
13.4.3 ULB Level initiatives .............................................................................................. 158
13.5 Roles and Responsibilities of various Institutions ............................................................... 160
13.6 Key Issues ........................................................................................................................... 161
14. Financial Assessment .............................................................................................................. 162
14.1 First Generation CDP– Key Features of Municipal Finance ............................................... 162
14.2 Status of Key Financial Indicators ....................................................................................... 163
14.3 As Is Assessment of Municipal Finance ............................................................................. 163
Ministry of Urban Development
[ix]] Draft City Development Plan – Hubli-Dharwad
14.4 Revenue Account ................................................................................................................ 164
14.4.1 Revenue Income ........................................................................................................ 164
14.4.2 Revenue Expenditure ................................................................................................ 170
14.5 Capital Account ................................................................................................................... 174
14.5.1 Capital Income ........................................................................................................... 174
14.5.2 Capital Expenditure ................................................................................................... 176
14.6 Salient Features .................................................................................................................. 177
14.7 Key Issues and Concerns ................................................................................................... 178
15. SWOT Analysis ......................................................................................................................... 179
15.1 SWOT Analysis ................................................................................................................... 179
15.2 City-Level SWOT ................................................................................................................ 182
16. City Vision, Development Goals and Strategies .................................................................... 183
16.1 Stakeholder consultation ..................................................................................................... 183
16.2 Focus group discussions ..................................................................................................... 184
16.3 Stakeholders workshops ..................................................................................................... 184
16.4 Issues identified in interim workshop .................................................................................. 186
16.5 Stakeholder suggestions ..................................................................................................... 187
16.6 Sub-Visions ......................................................................................................................... 188
16.7 Development Goals ............................................................................................................. 189
17. Sector Plan, Strategies and Investment Plan ......................................................................... 196
17.1 Institutionalizing CIP ............................................................................................................ 196
17.2 Water supply sector plan ..................................................................................................... 196
17.2.1 Capital Investment Plan ......................................................................................... 198
17.2.2 Project details ........................................................................................................ 199
17.2.3 Phasing of investment ........................................................................................... 200
17.2.4 Possibility of PPP ................................................................................................... 200
17.3 Sewerage and Sanitation Sector Plan ................................................................................ 201
17.3.1 Capital Investment Plan ......................................................................................... 202
17.3.2 Project details ........................................................................................................ 202
17.3.3 Phasing of investment ........................................................................................... 203
17.3.4 Possibility of PPP ................................................................................................... 203
17.4 Solid Waste Management sector plan ................................................................................ 204
17.4.1 Capital Investment Plan ......................................................................................... 206
17.4.2 Project details ........................................................................................................ 206
Ministry of Urban Development
[x]] Draft City Development Plan – Hubli-Dharwad
17.4.3 Phasing of investment ........................................................................................... 207
17.4.4 Possible PPP interventions .................................................................................... 207
17.5 Storm Water Drainage Sector Plan ..................................................................................... 208
17.5.1 Capital Investment Plan ......................................................................................... 208
17.5.2 Project details ........................................................................................................ 209
17.5.3 Phasing of investment ........................................................................................... 209
17.6 Urban Roads, Traffic and Transportation Sector Plan ........................................................ 210
17.6.1 Capital Investment Plan ......................................................................................... 212
17.6.2 Project details ........................................................................................................ 213
17.6.3 Phasing of investment ........................................................................................... 214
17.7 Plan for Basic Services for Urban Poor Sector ................................................................... 215
17.7.1 Capital Investment Plan ......................................................................................... 217
17.7.2 Project Details ........................................................................................................ 217
17.7.3 Phasing of investment ........................................................................................... 218
17.8 Social infrastructure and Heritage Sector Plan ................................................................... 218
17.8.1 Capital Investment Plan ......................................................................................... 220
17.8.2 Project Details ........................................................................................................ 221
17.8.3 Phasing of projects ................................................................................................ 221
17.9 Urban Environment, Disaster Management Sector Plan .................................................... 222
17.9.1 Capital Investment Plan ......................................................................................... 223
17.9.2 Project Details ........................................................................................................ 223
17.9.3 Phasing of investment ........................................................................................... 224
17.10 Local Economic Development Sector Plan ................................................................... 224
17.10.1 Capital Investment Plan ......................................................................................... 225
17.10.2 Project Details ........................................................................................................ 225
17.10.3 Phasing of investment ........................................................................................... 226
17.11 Tourism Sector Plan ...................................................................................................... 227
17.11.1 Capital Investment Plan ......................................................................................... 227
17.11.2 Project Details ........................................................................................................ 228
17.11.3 Phasing of investment ........................................................................................... 228
17.12 Summary of Capital Investment .................................................................................... 229
17.13 Summary of Investment Phasing .................................................................................. 230
17.14 Composition of investment ............................................................................................ 230
17.15 Priority Projects ............................................................................................................. 232
Ministry of Urban Development
[xi]] Draft City Development Plan – Hubli-Dharwad
18. Financial Operating Plan .......................................................................................................... 234
18.1 Financial Plan for the City ................................................................................................... 234
18.2 Methodology ........................................................................................................................ 234
18.3 Financing Strategies for CIP ............................................................................................... 236
18.3.1 Financial Projections .............................................................................................. 237
18.4 Investment Sustenance Capacity ....................................................................................... 237
18.4.1 Key Assumptions ................................................................................................... 238
18.5 Investible Surplus ................................................................................................................ 239
18.6 Business as Usual Scenario ............................................................................................... 239
18.7 Improved Case Scenario – Reforms Implementation ......................................................... 240
18.8 Improved Case Scenario – Debt ......................................................................................... 241
18.8.1 Key Summary ........................................................................................................ 242
18.9 Revenue Enhancement Initiatives....................................................................................... 243
18.10 Expenditure Management Initiatives ............................................................................. 244
18.11 Asset Management Initiatives ....................................................................................... 245
18.12 Financial Management Initiatives .................................................................................. 245
18.13 Projects on PPP basis ................................................................................................... 245
18.14 Land Resource Leveraging ........................................................................................... 246
18.15 Key Conclusion.............................................................................................................. 247
19. Review and Monitoring framework ......................................................................................... 248
19.1 Framework for Review and monitoring ............................................................................... 249
19.1.1 Timeline and Periodicity of review ......................................................................... 249
19.2 Reviewing of the CDP Document ....................................................................................... 250
19.2.1 Engaging with Community and Stakeholders‘ Consultation .................................. 250
19.2.2 Data Update and Mapping of the City ................................................................... 250
19.2.3 Capacity Building ................................................................................................... 250
19.3 Review and Monitoring of Reforms and Project Implementation ........................................ 250
19.3.1 Assessment of Reforms and Project Implementation............................................ 250
19.3.2 Financial Reforms .................................................................................................. 250
19.3.3 Property Tax Reforms ............................................................................................ 251
19.3.4 Sector /Ward Development Plans.......................................................................... 251
19.3.5 Review of the Project Priorities .............................................................................. 251
19.4 Monitoring of Financial Operating Plan and Capital Investment Plan................................. 251
20. Bibliography .............................................................................................................................. 252
Ministry of Urban Development
[xii]] Draft City Development Plan – Hubli-Dharwad
21. Annexures.................................................................................................................................. 253
21.1 Technical and Policy committees ........................................................................................ 253
21.2 Ward wise distribution of population in HDMC limit ............................................................ 257
21.3 Ward wise Data ................................................................................................................... 258
21.4 List of monuments identified by ASI in Dharwad District .................................................... 263
21.5 Annexure –Stakeholder Consultation ................................................................................. 264
21.6 Workshop – Attendance ...................................................................................................... 266
21.7 Workshop – Suggestions .................................................................................................... 270
Ministry of Urban Development
[xiii]] Draft City Development Plan – Hubli-Dharwad
List of Abbreviations
BPL Below Poverty Line
BSUP Basic Services to Urban Poor
CAA Constitutional Amendment Act
CAGR Compounded Annual Growth Rate
CSP City Sanitation Plan
CDP Comprehensive Development Plan
CDS City Development Strategy
CRIS CRISIL Risk and Infrastructure Solutions Limited
DEAS Double-Entry Accounting System
DMA Directorate of Municipal Affairs
DPR Detailed Project Report
DULT Directorate of Urban Land & Transport
ESR Elevated Service Reservoir
EWS Economically Weaker Sections
GAD General Administration Department
GIS Geographical Information System
GSR Ground Service Reservoir
HDMC Hubli Dharwad Municipal Corporation
HDUDA Hubli Dharwad Urban Development Authority
HESCOM Hubli Electricity Supply Company Limited
JNNURM Jawaharlal Nehru National Urban Renewal Mission
KRDCL Karnataka Road Development Corporation Ltd.
KSDB Karnataka Slum Development Board
KSRTC Karnataka State Road Transport Corporation
KUWSDB Karnataka Urban Water and Sewerage Development Board
LED Light Emitting Diode
LIG Low-Income Group
MLD Million Litres per Day
MoUD Ministry of Urban Development
MRC Municipal Reform Cell
MSL Mean Sea Level
MSW Municipal Solid Waste Management
NH National Highway
NMAM National Municipal Accounting Manual
NRW Non-Revenue Water
NULM National Urban Livelihood Mission
OBS Opening Balance Sheet
O&M Operation and Maintenance
PMIUPEP Prime Minister's Integrated Urban Poverty Eradication Programme
PPP Public-Private Partnership
RAY Rajiv Awas Yojana

Ministry of Urban Development
[xiv]] Draft City Development Plan – Hubli-Dharwad
SFCPoA Slum Free City Plan of Action
SJSRY Swarna Jayanti Shahari Rojgar Yojana
STP Sewerage Treatment Plant
SWD Strom Water Drainage
SWM Solid Waste Management
UFW Unaccounted-for Water
UGD Underground Drainage
ULB Urban Local Body
WTP Water Treatment Plant

Ministry of Urban Development
[xv]] Draft City Development Plan – Hubli-Dharwad
List of Tables
Table 1: Projects proposed in CDS ....................................................................................................... 30
Table 2: Population in various cities of Karnataka ................................................................................ 41
Table 3: Comparative population of HDMC .......................................................................................... 43
Table 4: Population Trends in HDMC ................................................................................................... 43
Table 5: Ward-wise population in HDMC .............................................................................................. 45
Table 6: Population Projections for Hubli-Dharwad (in lakhs) .............................................................. 50
Table 7: Population projections using various methods ....................................................................... 52
Table 8: Projected population in Hubli-Dharwad................................................................................... 52
Table 9: District-wise performance ....................................................................................................... 55
Table 10: Existing industrial units in Dharwad ...................................................................................... 56
Table 11: Existing industrial units in Navanagar ................................................................................... 57
Table 12: Major crops grown in the region ............................................................................................ 58
Table 13: Occupational structure .......................................................................................................... 61
Table 14: Change in the occupational structure - 199-2011 ................................................................. 61
Table 15: Hubli-Dharwad: Land-use distribution in 1986 and 2000 ...................................................... 67
Table 16: Land use comparison ............................................................................................................ 70
Table 17: Status of Hospital .................................................................................................................. 73
Table 18: Health facilities owned by HDMC.......................................................................................... 74
Table 19: The comparison of Health care facilities as per URDPFI guidelines .................................... 75
Table 20: City-wise distribution of educational institutions in Hubli and Dharwad ................................ 76
Table 21: The comparison of Educational facilities as per URDPFI guidelines .................................... 77
Table 22: List of parks/open spaces in the city, owned by HDMC........................................................ 78
Table 23: The comparison of recreational facilities as per URDPFI guidelines .................................... 81
Table 24: List of ESRs and GSRs in the city ........................................................................................ 85
Table 25: Type of water connections .................................................................................................... 86
Table 26: Connection charges and water tariff ..................................................................................... 87
Table 27: HDMC: Water supply – O&M recovery ................................................................................. 87
Table 28: Demand-collection statement ............................................................................................... 88
Table 29: Service delivery indicators .................................................................................................... 88
Table 30: Water supply demand projections......................................................................................... 89
Table 31: As per the CDS 2006, over view of the water supply system in Hubli-Dharwad .................. 90
Ministry of Urban Development
[xvi]] Draft City Development Plan – Hubli-Dharwad
Table 32: Strategies Proposed in CDS 2006 ........................................................................................ 91
Table 33: Rating and categorization of cities based on sanitation practices ........................................ 92
Table 34: Sanitation arrangements in Hubli-Dharwad .......................................................................... 93
Table 35: Service-level benchmarking .................................................................................................. 93
Table 36: Future sewerage generation ................................................................................................. 94
Table 37: Key status of sewerage section in 1st generation CDP ......................................................... 94
Table 38: HDMC: Solid Waste Generated per Day .............................................................................. 96
Table 39: Solid waste management facilities ........................................................................................ 97
Table 40: User fee - SWM ..................................................................................................................... 98
Table 41: Service-level indicators ......................................................................................................... 98
Table 42: Future solid waste generation ............................................................................................... 99
Table 43: Details of drains and natural channels ................................................................................ 101
Table 44: Service-level benchmarking in storm water drainage ......................................................... 102
Table 45: Types of roads in HDMC ..................................................................................................... 105
Table 46: Composition of vehicles in Hubli and Dharwad .................................................................. 111
Table 47: Public transport scenario on PB Road ................................................................................ 113
Table 48: Multiple organizations are involved with the transport sector in Hubli-Dharwad ................ 116
Table 49: Availability of various types of lamps for streetlights in Hubli-Dharwad .............................. 119
Table 50: Housing requirement for the future years ........................................................................... 129
Table 51: Real estate rates ................................................................................................................. 129
Table 52: Details of slums over the years ........................................................................................... 131
Table 53: Category-wise distribution of slums .................................................................................... 133
Table 54: Housing stock demand ....................................................................................................... 135
Table 55: Natural hazards vulnerability mapping Hubli Dharwad ....................................................... 140
Table 56: Natural hazards Vulnerability mapping Hubli Dharwad ...................................................... 143
Table 57: Framework for the heritage conservation ........................................................................... 150
Table 58: Legal framework of Governing Institutions ......................................................................... 152
Table 59: Karnataka: Decentralization of functions to HDMC ............................................................ 156
Table 60: Compliance of the 74th Amendment Act Provisions........................................................... 157
Table 61: Roles and Responsibilities of various Institutions ............................................................... 160
Table 62: 1st generation CDP key features of municipal finance ........................................................ 162
Table 63: Municipal financial status, HDMC ....................................................................................... 163
Table 64: HDMC: Number of properties ............................................................................................. 167
Table 65: HDMC: Property tax demand-collection statement ............................................................. 167
Ministry of Urban Development
[xvii]] Draft City Development Plan – Hubli-Dharwad
Table 66: Competitive position of the city ........................................................................................... 179
Table 67: Strengths of the city ............................................................................................................ 180
Table 68: Weaknesses of the city ....................................................................................................... 180
Table 69: Opportunities in the city ...................................................................................................... 181
Table 70: Threats to the city................................................................................................................ 181
Table 71:.SWOT Analysis for Hubli-Dharwad ..................................................................................... 182
Table 72: Stakeholder priority sectors ................................................................................................ 183
Table 73: Key issues raised by the stakeholders................................................................................ 186
Table 74: Goals and strategies suggested by the stakeholders ......................................................... 187
Table 75: Sector-wise developmental goals ....................................................................................... 189
Table 76: Water supply sector plan .................................................................................................... 197
Table 77: Water supply capital investment plan ................................................................................. 198
Table 78: Water supply project details ................................................................................................ 199
Table 79: Water Supply Phasing ........................................................................................................ 200
Table 80: Sewerage sector plan ......................................................................................................... 201
Table 81: Projects identified and phasing – Sewerage and sanitation ............................................... 202
Table 82: Projects Details – Sewerage and sanitation ....................................................................... 203
Table 83: Project Phasing – Sewerage and sanitation ....................................................................... 203
Table 84: Solid Waste Management sector plan ................................................................................ 204
Table 85: Projects identified – Solid waste management ................................................................... 206
Table 86: Project Details – Solid waste management ........................................................................ 206
Table 87: Phasing of investment – Solid waste management ............................................................ 207
Table 88: Storm Water Drainage sector plan ...................................................................................... 208
Table 89: Projects identified – Storm water drainage ......................................................................... 209
Table 90: Projects Details – Storm water drainage ............................................................................ 209
Table 91: Phasing of Investment – Storm water drainage .................................................................. 209
Table 92: Urban Roads and Traffic and Transportation ..................................................................... 210
Table 93: Projects identified – Traffic and transportation ................................................................... 212
Table 94: Project Details– Traffic and transportation .......................................................................... 213
Table 95: Phasing of investment – Traffic and transportation ............................................................ 214
Table 96: Basic Services for Urban Poor sector plan ......................................................................... 216
Table 97: Urban poverty alleviation – Projects identified .................................................................... 217
Table 98: Urban poverty alleviation – Projects Details ....................................................................... 217
Table 99: Urban poverty alleviation – Phasing of investment ............................................................. 218
Ministry of Urban Development
[xviii]] Draft City Development Plan – Hubli-Dharwad
Table 100: Social infrastructure sector plan ........................................................................................ 218
Table 101: Socio-cultural infrastructure – Projects identified .............................................................. 220
Table 102: Socio-cultural infrastructure – Projects Details ................................................................. 221
Table 103: Socio-cultural infrastructure – Phasing of projects ........................................................... 221
Table 104: Urban environment sector strategy ................................................................................... 222
Table 105: Urban environment– Projects identified ............................................................................ 223
Table 106: Urban environment – Project Details ................................................................................ 223
Table 107: Urban Environment– Phasing of investment .................................................................... 224
Table 108: Local Economic Development sector strategy .................................................................. 225
Table 109: Local Economic Development – Projects ......................................................................... 225
Table 110: Local Economic Development – Project Details ............................................................... 226
Table 111: Local Economic Development – Phasing of investment ................................................... 226
Table 112: Tourism Development sector strategy .............................................................................. 227
Table 113: Tourism Development sector – Project details ................................................................. 228
Table 114: Tourism Development sector – Project details ................................................................. 228
Table 115: Tourism Development sector – Phasing of investment .................................................... 228
Table 116: Summary of capital investments ....................................................................................... 229
Table 117: Summary of investment phasing....................................................................................... 230
Table 118: Implementing agency-wise breakup of investment ........................................................... 231
Table 119: Priority projects ................................................................................................................. 232
Table 120: Methodology for City Financial Plan ................................................................................. 234
Table 121: Key assumptions ............................................................................................................... 238
Table 122: FoP- Business as usual scenario...................................................................................... 240
Table 123: FoP- Improved case scenario – Reforms implementation ................................................ 241
Table 124: FoP- Improved case scenario – Debt ............................................................................... 242
Table 125: Projects on PPP basis ...................................................................................................... 246
Table 126: Framework for Monitoring and Evaluation of various components in the CDP ................ 249
Table 127: Ward wise distribution of slums in Hubli-Dharwad ............................................................ 258

Ministry of Urban Development
[xix]] Draft City Development Plan – Hubli-Dharwad
List of Figures
Figure 1: CBUD project components .................................................................................................... 23
Figure 2: CDP Approach ....................................................................................................................... 27
Figure 3: Revised CDP Preparation Methodology ................................................................................ 28
Figure 4: Inception meeting at HDMC ................................................................................................... 31
Figure 5: Stakeholder consultations ...................................................................................................... 33
Figure 6: Regional setting of Hubli-Dharwad ........................................................................................ 35
Figure 7: Location map of Hubli-Dharwad ............................................................................................ 36
Figure 8: Urbanization Trends in Karnataka ......................................................................................... 40
Figure 9: Major Urban Centres in Karnataka ........................................................................................ 41
Figure 10: Major Urban Centres in Dharwad district ............................................................................. 42
Figure 11: Population growth trends in HDMC ..................................................................................... 44
Figure 12: Density trends in HDMC ...................................................................................................... 44
Figure 13: Density trends in major cities of Karnataka ......................................................................... 45
Figure 14: Sex ratio trends .................................................................................................................... 49
Figure 15: Population projections using various methods .................................................................... 51
Figure 16: Sector-wise contribution in GSDP ....................................................................................... 54
Figure 17: Sector-wise contribution in GDDP ....................................................................................... 56
Figure 18: Work participation profile - Kollam 1980-2011 ..................................................................... 60
Figure 19: Year-wise distribution of workers and non-workers in Hubli-Dharwad ................................ 61
Figure 20: Planning Area of Hubli-Dharwad ......................................................................................... 64
Figure 21: Ward-wise density pattern ................................................................................................... 66
Figure 22: Land-use Plan 2000 ............................................................................................................. 68
Figure 23: Proposed land use - 2021 .................................................................................................... 69
Figure 24: Performance comparison of health indicator ....................................................................... 74
Figure 25: Location of recreational facilities in HDMC .......................................................................... 79
Figure 26: Unkal Lake and the park ...................................................................................................... 80
Figure 27: Existing water supply system of Hubli-Dharwad .................................................................. 84
Figure 28: Organization structure of Health Department/SWM of HDMC .......................................... 100
Figure 29: Existing status of open drains in Hubli ............................................................................... 101
Figure 30: Existing road network in HDMC ......................................................................................... 105
Figure 31: Right of way map for Hubli-Dharwad ................................................................................. 107
Ministry of Urban Development
[xx]] Draft City Development Plan – Hubli-Dharwad
Figure 32: Important Junctions in Hubli .............................................................................................. 108
Figure 33: Map traffic junctions in Hubli-Dharwad .............................................................................. 109
Figure 34: Composition of vehicles in HDMC ..................................................................................... 112
Figure 35: Vehicle share vs. passenger share - PB Road .................................................................. 113
Figure 36: Road accident data for HDMC ........................................................................................... 114
Figure 37: Transit-oriented development concept .............................................................................. 117
Figure 38: Fig existing land use in 2000 and proposed land use in 2031 .......................................... 127
Figure 39: Locations of slums in Hubli and Dharwad, ........................................................................ 132
Figure 40: Sectoral break up of Karnataka GHG emission percentage ............................................. 143
Figure 41: Organization Structure of HDMC ....................................................................................... 154
Figure 42: HDMC – Revenue Income Growth Trend .......................................................................... 164
Figure 43: Revenue Income – Contributions ...................................................................................... 165
Figure 44: Tax Revenue Growth trends .............................................................................................. 166
Figure 45: Tax Revenue Composition ................................................................................................ 166
Figure 46: Non-Tax Revenue Trends ................................................................................................. 168
Figure 47: Non-Tax Revenue Trends ................................................................................................. 169
Figure 48: Revenue grants trends ...................................................................................................... 169
Figure 49: Revenue Grants - Composition ......................................................................................... 170
Figure 50: Revenue Expenditure ........................................................................................................ 170
Figure 51: Revenue Expenditure Composition ................................................................................... 171
Figure 52: Salary expenditure composition ......................................................................................... 172
Figure 53: O&M expenditure Trends ................................................................................................... 172
Figure 54: O&M expenditure Composition .......................................................................................... 173
Figure 55: Revenue Surplus: Trends .................................................................................................. 174
Figure 56: Revenue Surplus margin trends ........................................................................................ 174
Figure 57: Capital Grants Trends ........................................................................................................ 175
Figure 58: Capital grants composition ................................................................................................ 176
Figure 59: Capital Expenditure Trends ............................................................................................... 177
Figure 60: Capital Expenditure Composition ...................................................................................... 177
Figure 61 – Media coverage for stakeholder workshop ...................................................................... 186
Figure 62: Milestones .......................................................................................................................... 189
Figure 63: Capital investment for 2021 (figures in Rs. crores) ........................................................... 230
Figure 64: Implementing agency-wise breakup of investment for 2041 ............................................. 232
Figure 65: Investible surplus – Base and improved case ................................................................... 239
Ministry of Urban Development
[xxi]] Draft City Development Plan – Hubli-Dharwad
Figure 66: Financial capacity – Key scenarios.................................................................................... 242

Ministry of Urban Development
[22]] Draft City Development Plan – Hubli-Dharwad
1. Project Background
1.1 Context
The need for an overall urban improvement and development to sustain the economic growth momentum post the liberalization era first found its expression in the mandate of Jawaharlal Nehru National Urban Renewal Mission (JnNURM) launched by the Government of India (GoI) in 2005. The project endeavored to bring about an improvement in urban quality of life and make them as investment destinations. The programme derived its initial rationale from the ―National Common Minimum Programme‖ of the GoI that laid stress on expansion of physical infrastructure and therefore, comprehensive urban renewal and slum development could be taken up. The second rationale for such a large scale programme was derived from India‘s International commitment to achieving the Millennium Development Goals and therefore, the GoI proposed to
Facilitate investments in the urban sector; and Strengthen the existing policies in order to achieve these goals.
In recognition to the above mandate, the JnNURM programme was conceived. The scale of the programme was aimed to be in a mission mode primarily to make the cities realize their full potential and become engines for growth. It is argued that the urban sector contributes to over 50% of the country‘s Gross Domestic Product (GDP) and therefore, focused attention is required for urban infrastructure development.
As already mentioned above, the JnNURM is the first flagship national programme for urban development of this nature and size by the GoI. The programme sought to bring about a change in the way urban development has been perceived. It recognized the importance of two major aspects for urban development in the country including
The need for urban infrastructure improvement in order to improve quality of life and sustain the local economy as well as to attract more investments; and
The need for investment for carrying out the urban infrastructure improvements.
In doing the above, the programme brought about the necessary awareness among the Urban Local bodies (ULBs) for planning and implementation of projects, need for systematizing the urban services and their management, the need for involving stakeholders in project planning and raising revenues for the urban areas that can sustain the urban infrastructure. Significant emphasis was given to urban governance reforms and the need to link reforms with investments. Assistance therefore, to the state governments and ULBs was proposed to flow through a reforms linked plan. Introduction of such reforms were considered crucial for developing sustainable infrastructure that would include,
Efficient management of created physical assets so as to increase self-sustainability; and Enhance efficient service delivery.
Both these aspects were to be achieved through the agenda of reforms in the cities.
Progress
Over the past nine years, the programme has committed over Rs. 286 billion for 552 projects involving a total investment of over Rs. 620 billion. Some of the key achievements of the project include:
The mission has been successful in catalyzing multi-year investments and reformed development in urban infrastructure;
There has been visible improvement in the delivery of municipal services in many cities; Some cities have prepared development/master plans for the first time. There is also greater
awareness in the ULBs for the need to develop systematic plans for improvement in infrastructure. There is also an increase in aspiration levels among communities and there is a demand for better infrastructure and services;
Several projects especially in transport sector have been taken up within the JnNURM framework that has significantly improved the quality of life in the cities; and
There has been good progress in implementation of reforms at policy level at state and central

Ministry of Urban Development
[23]] Draft City Development Plan – Hubli-Dharwad
level. Most of the states have framed their policies on reforms and started implementing the same. ULBs have started implementing the reforms in the areas of accounting, e-governance, and property tax and user charges.
While there has been significant change in the urban sector due to JnNURM, challenges have emerged which will need to be addressed going forward:
CDP was seen as an investment plan for projects in the immediate term and not as a vision document for the city with very limited cities revising the same;
While preparing the CDP, consultations with the stakeholders was limited and mostly restricted to the line departments and Parastatals agencies;
The pace of project execution has been found to be slow. Some states have been able to take greater advantage of the programme than others;
Cities have also not been very successful in leveraging JnNURM funds to raise finances on their own or to attract private or PPP-based investment;
The ULBs are not in a position to take over all the functions mentioned under 12th schedule of 74th Constitutional Amendment Act (CAA) at present. Most ULBs are also not in a position to take over functions like roads and bridges, water supply sewerage, drainage and urban forestry due to their present incapacity to do so; and
Institutional strengthening and capacity buildings initiatives are yet to initiate in most of the ULBs. Most of the ULBs are facing capacity related issues such as lack of staff (staff recruitment has not been carried since long).
The Planning Commission of GoI, through a committee has devised a framework for JnNURM Phase-II. This framework has been prepared after studying and analyzing the success and challenges arising from JnNURM and the initiatives taken by other Ministries.
The High Powered Expert Committee (HPEC) report, 2011 further identified about Rs. 39,000 billion of investment in infrastructure in the urban areas of India.
1.2 Revised CDP under CBUD Project
1.2.1 CBUD Programme
In order to give an impetus to reforms under JnNURM, the Ministry of Urban Development (MoUD) and Ministry of Housing and Urban Poverty Alleviation (MoHUPA) have launched a new project called ―Capacity Building of Urban Development” (CBUD). The project has been launched with support from The World Bank (WB). The GoI has received the financing from the WB/International Development Association (IDA) towards CBUD project. The broad aim of the CBUD project is to address the major constraints of urban development and specifically focus on the capacity building requirements for successful urban management and poverty reduction across the selected ULBs in India.
The project will contribute to GoI‘s overarching objective of creating economically productive, efficient, equitable and responsive cities. Achieving this objective, will help sustain high rates of economic growth, accelerate poverty reduction, and improve services, especially to the urban poor.
The project has three components as presented in the figure below.
Figure 1: CBUD project components
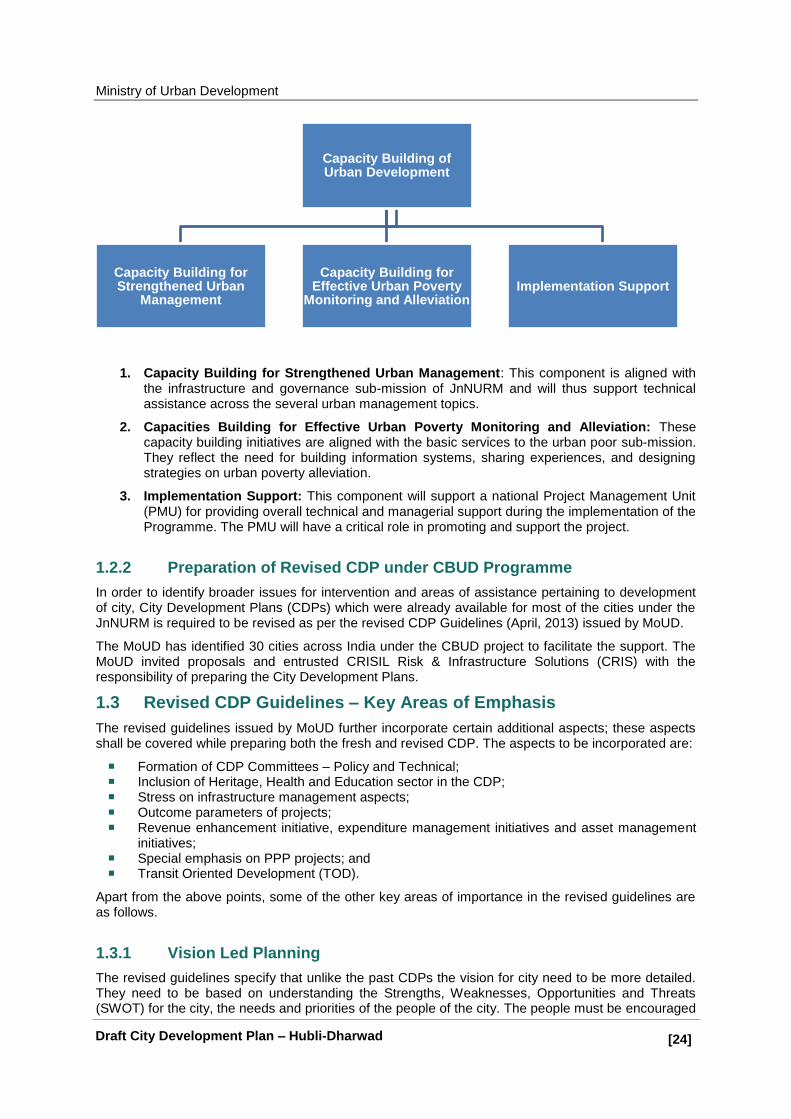
Ministry of Urban Development
[24]] Draft City Development Plan – Hubli-Dharwad
1. Capacity Building for Strengthened Urban Management: This component is aligned with the infrastructure and governance sub-mission of JnNURM and will thus support technical assistance across the several urban management topics.
2. Capacities Building for Effective Urban Poverty Monitoring and Alleviation: These capacity building initiatives are aligned with the basic services to the urban poor sub-mission. They reflect the need for building information systems, sharing experiences, and designing strategies on urban poverty alleviation.
3. Implementation Support: This component will support a national Project Management Unit (PMU) for providing overall technical and managerial support during the implementation of the Programme. The PMU will have a critical role in promoting and support the project.
1.2.2 Preparation of Revised CDP under CBUD Programme
In order to identify broader issues for intervention and areas of assistance pertaining to development of city, City Development Plans (CDPs) which were already available for most of the cities under the JnNURM is required to be revised as per the revised CDP Guidelines (April, 2013) issued by MoUD.
The MoUD has identified 30 cities across India under the CBUD project to facilitate the support. The MoUD invited proposals and entrusted CRISIL Risk & Infrastructure Solutions (CRIS) with the responsibility of preparing the City Development Plans.
1.3 Revised CDP Guidelines – Key Areas of Emphasis
The revised guidelines issued by MoUD further incorporate certain additional aspects; these aspects shall be covered while preparing both the fresh and revised CDP. The aspects to be incorporated are:
Formation of CDP Committees – Policy and Technical; Inclusion of Heritage, Health and Education sector in the CDP; Stress on infrastructure management aspects; Outcome parameters of projects; Revenue enhancement initiative, expenditure management initiatives and asset management
initiatives; Special emphasis on PPP projects; and Transit Oriented Development (TOD).
Apart from the above points, some of the other key areas of importance in the revised guidelines are as follows.
1.3.1 Vision Led Planning
The revised guidelines specify that unlike the past CDPs the vision for city need to be more detailed. They need to be based on understanding the Strengths, Weaknesses, Opportunities and Threats (SWOT) for the city, the needs and priorities of the people of the city. The people must be encouraged
Capacity Building of Urban Development
Capacity Building for Strengthened Urban
Management
Capacity Building for Effective Urban Poverty
Monitoring and Alleviation Implementation Support

Ministry of Urban Development
[25]] Draft City Development Plan – Hubli-Dharwad
at workshops and consultation sessions to visualize their future of the city, their aspirations and the consequent growth that they anticipate in the city. This vision finally can be translated into respective sectoral visions.
1.3.2 Resource based planning
Every city in India in the context of its regional location has particular strengths in terms of its resource endowments. Such resources need to be assessed and their strengths realized for city development. The approach for plan preparation could be: a) national resource led planning for cities endowed with natural resources like water bodies) OR b) Economy based (for an industrial or trading city), OR c) Tourism based for heritage cities OR d) combination of the above. This helps in settling the city apart from the rest. This approach can be identified based on:
a) Existing city strengths and its opportunities, b) Regional role of city in the context of state development, and c) Needs of the city.
1.3.3 Participatory approach
As already mentioned above, the revised CDP guidelines have specified that the CDP be treated as a ―living document‖. For this periodic revision and updation of the CDP is necessary. Such revisions have to and must be conducted with a participatory planning approach. The CDP outlines that local area plans need to be prepared in consultation with the ward committees to fulfill the expectations of the citizens. Also, the guidelines specify that such an approach is necessary to ensure equity concerns and poverty issues are integrated in the CDP. Consultations also need to be carried out at every stage of the plan preparation and implementation. The citizens must be able to prioritize and choose their needs for infrastructure development.
1.3.4 Equity concerns, poverty and local economy development
Poverty and local economy development go hand in hand. Understanding of the local economy would help in devising appropriate infrastructure development strategies that can help in/be conducive to the growth of local economy and thereby nurture local talent and resources. These need to be given adequate focus in the present CDP exercises and therefore help in not just local economy development but also in regional economy development.
The 12th five year plan has also started a mission for National Urban Poverty Alleviation (NUPAM) for
targeting housing and poverty alleviation based on recommendations of the NUPAM identifying the issues of poverty and housing in city and implementation status of programmes such as Rajiv Awas Yojana, Integrated Housing and Slum Development Programme (IHSDP), etc. Integration of these aspects would be crucial in making the CDP relevant to state and central government policies.
1.3.5 Capacity Building in ULB
The ULBs presently face serious human resource shortage for planning, development and urban management activities (including operations and maintenance, monitoring and evaluation, financial management and procurement). This issue has been highlighted by the study on appraisal of JnNURM projects as well. The guidelines have proposed that the CDPs must address this issue as to the gaps in such capacity can be addressed.
Also, it has been suggested in the guidelines that urban reforms need to be done with greater participatory approach. The strategies to arrive at the vision for the city should be linked to the reform agenda. ULBs should be asked to furnish the reforms and propose a time line to achieve the same. Administrative and structural reform should be made mandatory and carried out as soon as possible. Financial thresholds need to be decided and adhered to in terms of the central assistance under JnNURM being given as a soft loan or a grant. This approach would help in designing an appropriate capacity building strategy.
Ministry of Urban Development
[26]] Draft City Development Plan – Hubli-Dharwad
1.3.6 Sectoral Action Plans with Goal Oriented Targets
The revised guideline specifically also lay out the need for preparation of sectoral action plans that have targets that are oriented towards specific goals. Action plans are specifically required for sectors including Local Economic Development Plan, Infrastructure Development Action Plan, Housing and Poverty Alleviation Action Plan, City Mobility Plan (CMP), Heritage Management Plan (Where needed), Financial Management Plan, Institutional and Capacity Building Action Plan and Environment Management Plan (including disaster management). Such sectoral plans would be based on clearly identified goals. Also, Inter-sectoral as well as intra-sectoral linkages need to be addressed through the CDP.
1.3.7 Monitoring and Evaluation Arrangements
The guideline clearly spells out the need for monitoring and evaluation at regular intervals as to the extent of implementation of the CDP. Also, development of such monitoring arrangements would go a long way in securing community participation who can be involved in the process of monitoring.
1.4 Objective of the Assignment
The CDP aims to identify an integrated solution to the challenges facing the city. It recognizes the economic growth strategy as well as the actions that would be required by various agencies to ensure the sustainable development of the city. The CDP is the ULB‘s strategy that presents the vision of a desired future for the city, and the mission statements on how the ULB, together with other stakeholders, intends to work towards achieving this long-term vision. The City Development Plan incorporates the assessment of city on majorly four levels: Socio Cultural and Economic Environment; Physical Environment; Infrastructure Services and Institutions; Urban Poverty and Heritage.
The primary objective of this assignment is – to revise and update the existing CDP.
The scope of work in brief shall entail –
Profiling the present status of the city, giving an in-depth analysis of its demographic, economic, financial, infrastructure, physical, environmental and institutional aspects;
Based on the above analysis, the consultant shall develop a perspective and a vision for the city, which would be prepared in consultation with its relevant stakeholders. In order to achieve the vision, a formulation strategy for bridging the gap between where the city is at present and where it wishes to reach need to be prepared;
The CDP should provide for a City Investment Plan (CIP), based on which the concerned ULB will be able to access funds under central/ state government schemes as well as from own and other sources based on priority actions and projects identified in the CDP;
The document should also provide Financial Operating Plan (FOP) to direct the ULBs for mobilizing various financial resources to implement the identified projects. The inter-sectoral and intra-sectoral issues need to be addressed by the CDP;
Preparation of the CDP will consist of city development strategies that will emerge out of a structured consultative process. The process will enable elected representatives, key staff of departments of Municipal Corporation/ Municipal Council, Parastatals agencies and other institutions, policy makers and the citizens to participate and plan for spatial, social and economic development of the concern cities; and
The CDP has to adhere to the latest revised toolkit prepared by the MoUD for CDP preparation published on its website www.jnnurm.nic.in in April 2013.
1.5 Approach and Methodology
The approach to the assignment would be based on consultative and analytical assessment of the existing situation. The inputs from stakeholders would be used to prioritize areas of development and to formulate the strategies in order to make the revised CDP an implementable document. The approach of revised CDP preparation is presented in the figure below.

Ministry of Urban Development
[27]] Draft City Development Plan – Hubli-Dharwad
Figure 2: CDP Approach
The revised CDP would be prepared for the period of next 30 years, i.e. 2041. It will be a forward-looking consensus program for the city that outlines the path with respect to the following aspects:
Infrastructure Development – Assessment, gap analysis, arriving at investment requirement (short term and long term) and prioritization of various services provided by Municipal Corporation - water supply, sewerage, storm water drainage, roads, traffic & transportation, street-lighting, solid waste management, firefighting, education, health, etc.
Slum Development – Prepare a programme for the development of slum pockets in the city. This includes access to all the basic services as well as housing for urban poor.
Economic Development – The revised CDP will focus critically on tapping the existing potential and identifying key economic development opportunities for the city.
Social Development – The revised CDP will take into account the social development needs of the city such as the need for hospitals, education institutes, and recreational centers.
Institutional Development – Assessment of capacity-building required for ULBs to undertake development of city.
Financial sustainability -The revised CDP will assess the revenue sources, areas of expenditure and current and future investment requirement of the city. Based on this, it would arrive at a sustainable investment capacity and would suggest measures to improve revenues and control expenditures.
Reform Assessment Plan –The revised CDP will also discuss status of various reforms undertaken by the ULBs to bring about improvements. These reforms are in the areas of accounting, e-Governance, property tax, user changes, building byelaws, etc.
Moreover, the approach will be based on the philosophy of developing workable solutions. The methodology for undertaking the work of preparation of revised CDP is presented in the figure below. Broadly there are five steps in a sequential order to undertake this work.
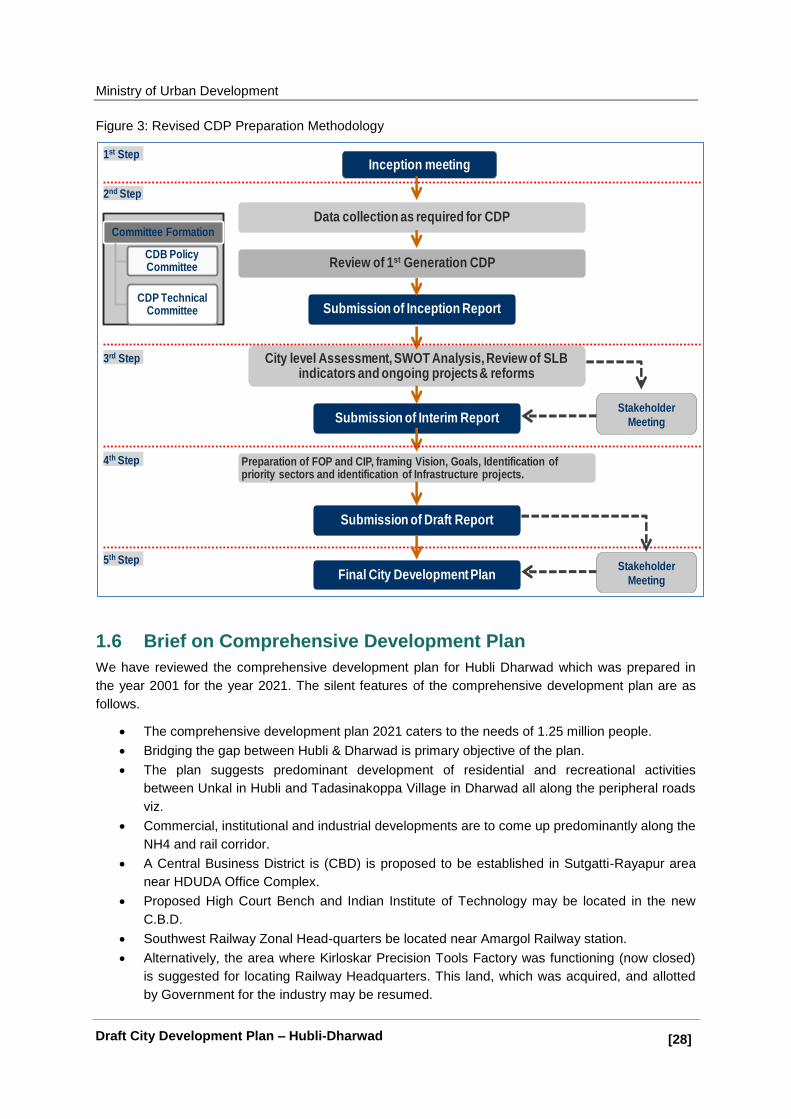
Ministry of Urban Development
[28]] Draft City Development Plan – Hubli-Dharwad
Figure 3: Revised CDP Preparation Methodology
1.6 Brief on Comprehensive Development Plan
We have reviewed the comprehensive development plan for Hubli Dharwad which was prepared in
the year 2001 for the year 2021. The silent features of the comprehensive development plan are as
follows.
The comprehensive development plan 2021 caters to the needs of 1.25 million people.
Bridging the gap between Hubli & Dharwad is primary objective of the plan.
The plan suggests predominant development of residential and recreational activities
between Unkal in Hubli and Tadasinakoppa Village in Dharwad all along the peripheral roads
viz.
Commercial, institutional and industrial developments are to come up predominantly along the
NH4 and rail corridor.
A Central Business District is (CBD) is proposed to be established in Sutgatti-Rayapur area
near HDUDA Office Complex.
Proposed High Court Bench and Indian Institute of Technology may be located in the new
C.B.D.
Southwest Railway Zonal Head-quarters be located near Amargol Railway station.
Alternatively, the area where Kirloskar Precision Tools Factory was functioning (now closed)
is suggested for locating Railway Headquarters. This land, which was acquired, and allotted
by Government for the industry may be resumed.
Inception meeting
City level Assessment, SWOT Analysis, Review of SLB indicators and ongoing projects & reforms
Submission of Interim ReportStakeholder
Meeting
Preparation of FOP and CIP, framing Vision, Goals, Identification of priority sectors and identification of Infrastructure projects.
Submission of Draft Report
Stakeholder
MeetingFinal City Development Plan
Committee Formation
CDB Policy Committee
CDP Technical Committee
1st Step
2nd Step
3rd Step
4th Step
5th Step
Data collection as required for CDP
Review of 1st Generation CDP
Submission of Inception Report
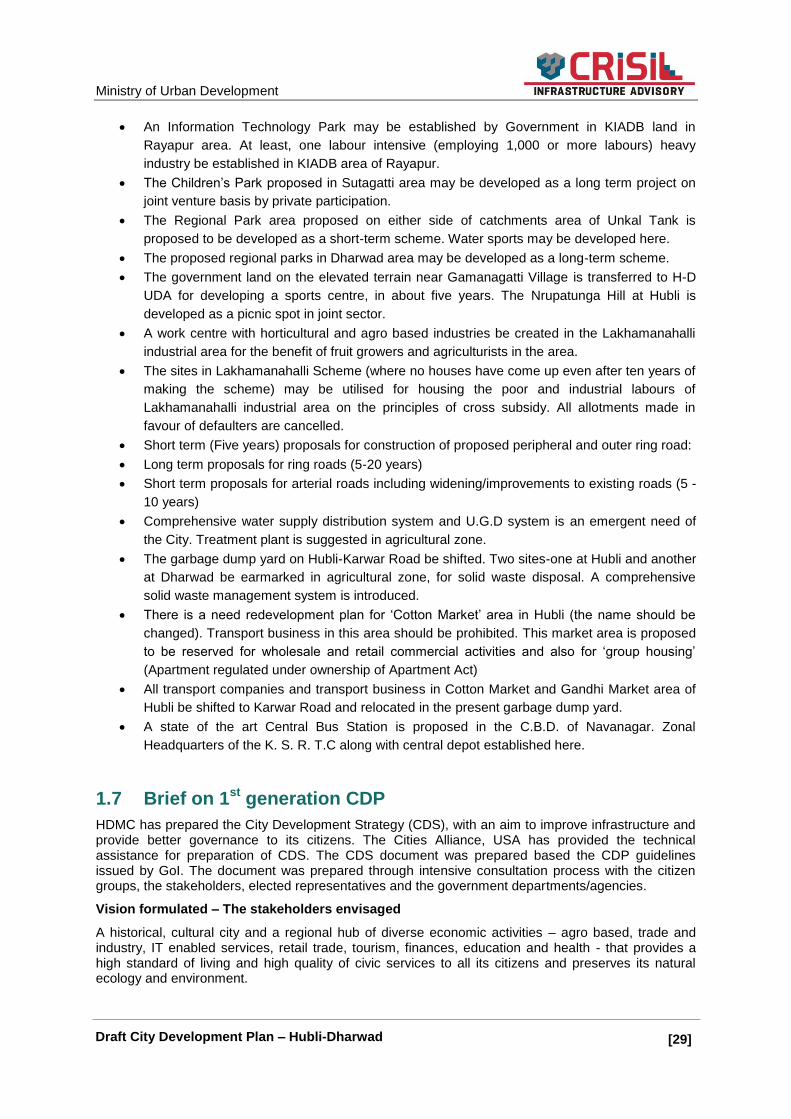
Ministry of Urban Development
[29]] Draft City Development Plan – Hubli-Dharwad
An Information Technology Park may be established by Government in KIADB land in
Rayapur area. At least, one labour intensive (employing 1,000 or more labours) heavy
industry be established in KIADB area of Rayapur.
The Children‘s Park proposed in Sutagatti area may be developed as a long term project on
joint venture basis by private participation.
The Regional Park area proposed on either side of catchments area of Unkal Tank is
proposed to be developed as a short-term scheme. Water sports may be developed here.
The proposed regional parks in Dharwad area may be developed as a long-term scheme.
The government land on the elevated terrain near Gamanagatti Village is transferred to H-D
UDA for developing a sports centre, in about five years. The Nrupatunga Hill at Hubli is
developed as a picnic spot in joint sector.
A work centre with horticultural and agro based industries be created in the Lakhamanahalli
industrial area for the benefit of fruit growers and agriculturists in the area.
The sites in Lakhamanahalli Scheme (where no houses have come up even after ten years of
making the scheme) may be utilised for housing the poor and industrial labours of
Lakhamanahalli industrial area on the principles of cross subsidy. All allotments made in
favour of defaulters are cancelled.
Short term (Five years) proposals for construction of proposed peripheral and outer ring road:
Long term proposals for ring roads (5-20 years)
Short term proposals for arterial roads including widening/improvements to existing roads (5 -
10 years)
Comprehensive water supply distribution system and U.G.D system is an emergent need of
the City. Treatment plant is suggested in agricultural zone.
The garbage dump yard on Hubli-Karwar Road be shifted. Two sites-one at Hubli and another
at Dharwad be earmarked in agricultural zone, for solid waste disposal. A comprehensive
solid waste management system is introduced.
There is a need redevelopment plan for ‗Cotton Market‘ area in Hubli (the name should be
changed). Transport business in this area should be prohibited. This market area is proposed
to be reserved for wholesale and retail commercial activities and also for ‗group housing‘
(Apartment regulated under ownership of Apartment Act)
All transport companies and transport business in Cotton Market and Gandhi Market area of
Hubli be shifted to Karwar Road and relocated in the present garbage dump yard.
A state of the art Central Bus Station is proposed in the C.B.D. of Navanagar. Zonal
Headquarters of the K. S. R. T.C along with central depot established here.
1.7 Brief on 1st generation CDP
HDMC has prepared the City Development Strategy (CDS), with an aim to improve infrastructure and provide better governance to its citizens. The Cities Alliance, USA has provided the technical assistance for preparation of CDS. The CDS document was prepared based the CDP guidelines issued by GoI. The document was prepared through intensive consultation process with the citizen groups, the stakeholders, elected representatives and the government departments/agencies.
Vision formulated – The stakeholders envisaged
A historical, cultural city and a regional hub of diverse economic activities – agro based, trade and industry, IT enabled services, retail trade, tourism, finances, education and health - that provides a high standard of living and high quality of civic services to all its citizens and preserves its natural ecology and environment.

Ministry of Urban Development
[30]] Draft City Development Plan – Hubli-Dharwad
1.7.1 Projects proposed in 1st generation CDP
The CDS has envisaged the projects along the strategic direction identified for the city to achieve the vision and also to improve the urban services in the city. The following table lists out the major projects identified in the CDS. The CDS submitted to the GoI however the CDS was not approved as the city wasn‘t a JNNURM city hence it is not been referred for any development activity in the city.
Table 1: Projects proposed in CDS
Sr.No Sector Investment Envisaged (Rs in crores)
% to total
1 Water Supply 678.10 23%
2 Sewerage 543.70 18%
3 SWM 96.00 3%
4 Storm Water Drainage 387.40 13%
5 Roads/ Traffic/ Transportation 612.00 21%
6 Street lighting 0.00 0%
7 Urban Poor 649.00 22%
8 Environment 0.00 0%
9 Others 0.00 0%
Total 2966.20 100%
Source: CDS Hubli-Dharwad
The estimated investment required for the identified projects would be Rs. 2966 crores. The water
supply project accounts for 23% of the total investment followed by slum development with 22% and
roads and traffic and transportation sector with 21% of total investment. Further, the sewerage sector
accounts for 18% of the investment; the rest of the investment is towards storm water drainage and
solid waste management. The breakup of the proposed investment has been presented in the figure
below.
1.8 Brief scenario after 1st generation CDP
The CDS was not approved by the GoI and hence it was not referred any of the development
activities. The CDS was prepared in 2006 and since then significant change has occurred in the
socio-economic and demographic characters of HDMC. Also, the demand for services has increased
further the gap has been widened between the demand and supply.
23%
18%
3%
13%
21%
22%
Water Supply Sewerage
SWM Storm Water Drainage
Roads/ Traffic/ Transportation Urban Poor
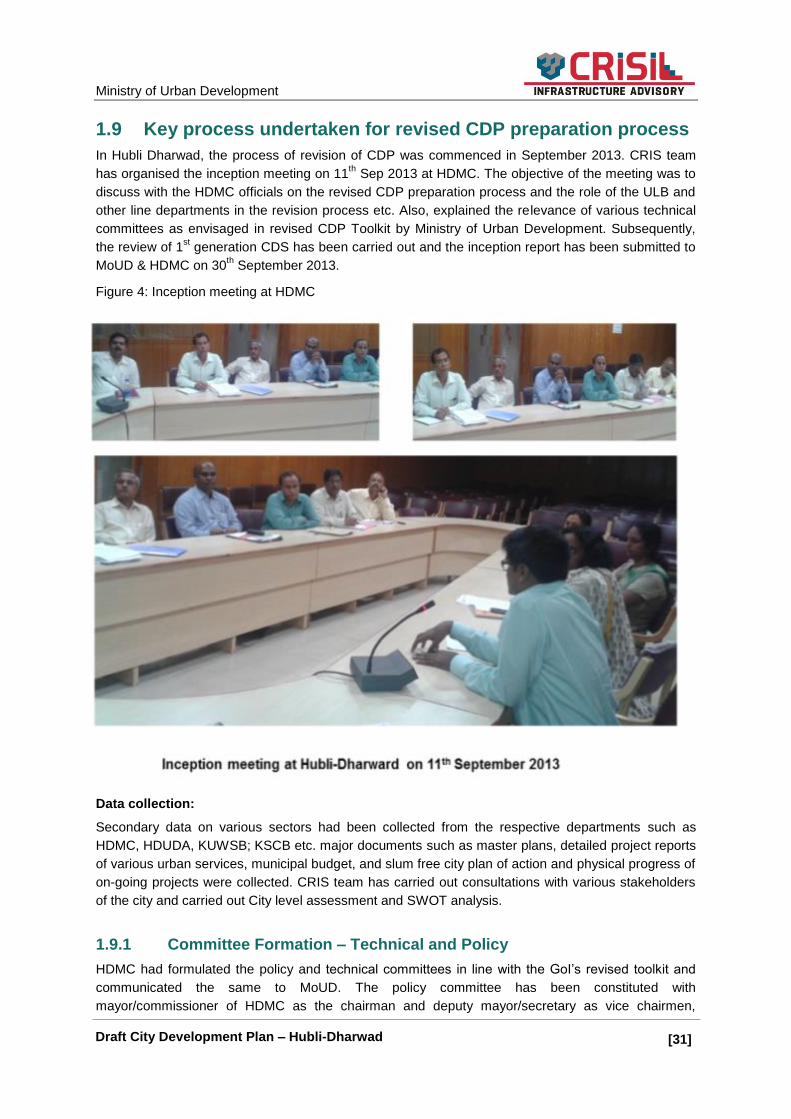
Ministry of Urban Development
[31]] Draft City Development Plan – Hubli-Dharwad
1.9 Key process undertaken for revised CDP preparation process
In Hubli Dharwad, the process of revision of CDP was commenced in September 2013. CRIS team
has organised the inception meeting on 11th Sep 2013 at HDMC. The objective of the meeting was to
discuss with the HDMC officials on the revised CDP preparation process and the role of the ULB and
other line departments in the revision process etc. Also, explained the relevance of various technical
committees as envisaged in revised CDP Toolkit by Ministry of Urban Development. Subsequently,
the review of 1st generation CDS has been carried out and the inception report has been submitted to
MoUD & HDMC on 30th September 2013.
Figure 4: Inception meeting at HDMC
Data collection:
Secondary data on various sectors had been collected from the respective departments such as
HDMC, HDUDA, KUWSB; KSCB etc. major documents such as master plans, detailed project reports
of various urban services, municipal budget, and slum free city plan of action and physical progress of
on-going projects were collected. CRIS team has carried out consultations with various stakeholders
of the city and carried out City level assessment and SWOT analysis.
1.9.1 Committee Formation – Technical and Policy
HDMC had formulated the policy and technical committees in line with the GoI‘s revised toolkit and
communicated the same to MoUD. The policy committee has been constituted with
mayor/commissioner of HDMC as the chairman and deputy mayor/secretary as vice chairmen,

Ministry of Urban Development
[32]] Draft City Development Plan – Hubli-Dharwad
officials from the following organisation HDUDA, KUWSB; KSCB, KUIDFC, BSNL,KIADB,KSSIDC,
KPTCL, Chairmen of DPC, DTCP, PWD and National Highway superintending engineer, HDMC and
Deputy Commissioner have nominated as members of policy committee.
Further, seven technical committees have been formed such as land use and infrastructure, Municipal institutional strengthening, Environment sustainable development and disaster management, Social and livelihoods and economic development, Heritage and conservation and culture and tourism development, water supply, sewerage and SWM and Traffic and transportation. The details of the policy and technical committees have been annexed (annexure 21.1) with this report.
1.9.2 Stakeholder’s consultation brief
1. Kick off meeting
CRIS team has organised the inception meeting on 11th Sep 2013 at HDMC. The objective of the
meeting was to discuss with the HDMC officials on the revised CDP preparation process and the role of the ULB and other line departments in the revision process etc.
2. Interim workshop
In order to ensure a participatory and inclusive development process CRIS team in association with HDMC organized a consultative workshop on 12
th February 2013 at Kannada Bhavan in Hubli. The
Objective of the workshop was to discuss about status and performance of service delivery mechanism in Hubli-Dharwad, City SWOT analysis, to understand aspirations of the citizen on city development and framing of the vision for the twin cities. The workshop was attended by 110 participants who include the elected representatives, representatives from Parastatals agencies, HDMC officials, NGOs and academicians.
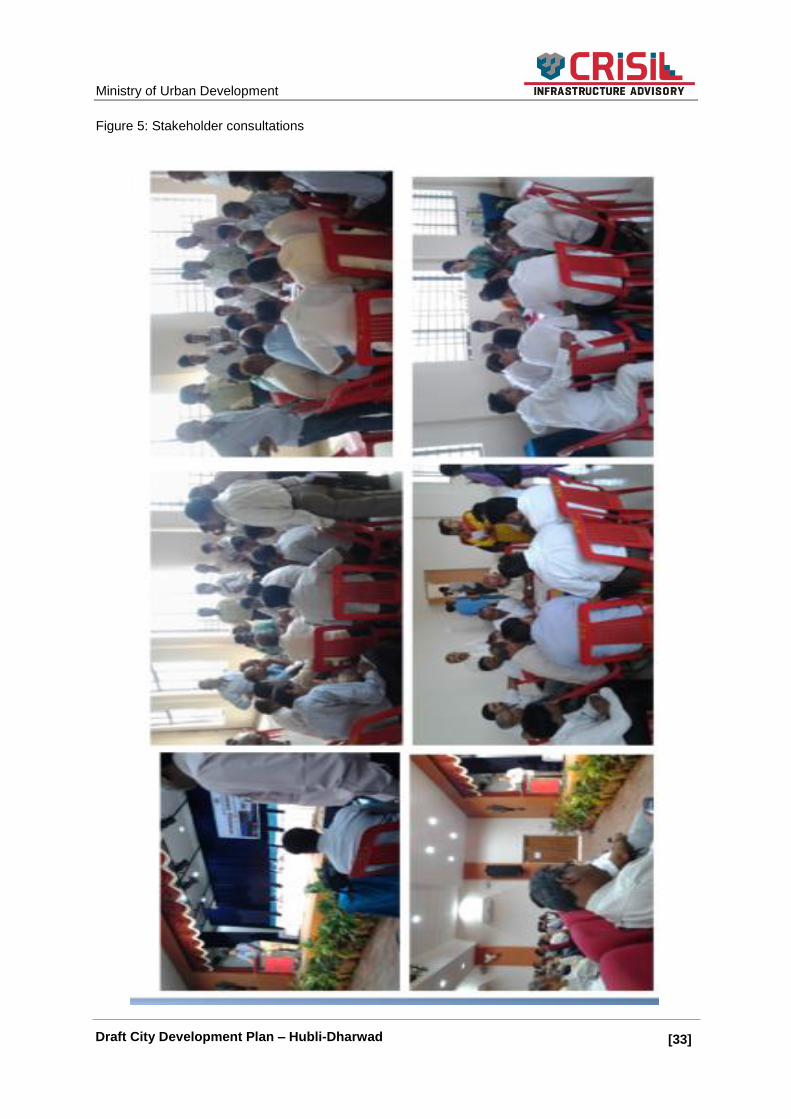
Ministry of Urban Development
[33]] Draft City Development Plan – Hubli-Dharwad
Figure 5: Stakeholder consultations
Ministry of Urban Development
[34]] Draft City Development Plan – Hubli-Dharwad
2. Introduction to the City
Hubli and Dharwad are twin cities in the state of Karnataka and are referred as Hubli-Dharwad. The Hubli-Dharwad is the oldest city in Karnataka state with strong cultural and historical importance, and is also the second-largest urban settlement in Karnataka after Bengaluru. Hubli-Dharwad has historical significance dating back to the Vijayanagar Empire and the Marathas. The British captured the town in the early 19
th century and established it as an administrative and educational centre. Hubli
was identified as an important commercial and trade centre for the entire northern Karnataka region by the British.
Hubli local body was constituted in 1865 with an area of 2.06 sq. km and a population of 35,278. Hubli and Dharwad were separate municipal entities, but these two cities were so interdependent that a common municipal borough was constituted in the year 1925 for the combined population of 69,940. Further, Hubli-Dharwad municipality was upgraded to a corporation in the year 1962. After the formation of Karnataka state in the year 1956, many regional offices were set up in the city, and the increased importance of the city in the region resulted in a population growth.
2.1 Regional Setting
Hubli and Dharwad are separated by a distance of 20 km. Dharwad is the district headquarters and Hubli is the business hub. Hubli was identified as an important commercial hub for the entire northern Karnataka region with respect to its connectivity to Bengaluru, Pune, Panjim, Hospet, Bellary, Karwar, and Bijapur through highways and rail network.
The city attracts floating population from neighbouring urban centres such as Karwar and other towns from north Karnataka as well as Dharwad district, for the purpose of trade and commerce, health, and education. Dharwad is being the district headquarters attracts population from across the district to avail the administrative services provided at various district offices both in Hubli and Dharwad. Hubli is the educational hub of north Karnataka and attracts population from the north Karnataka region for educational purpose.
As indicated in the figure below, cities such as Belgaum, Karwar, Devengere, and Bellary are located within 50 km radius of the city. The cities are connected with intercity bus services. The city‘s connectivity and historic significance played a major role in making it an important city of the region. However, the city is also facing competition from Belgaum, Bellary, etc.

Ministry of Urban Development
[35]] Draft City Development Plan – Hubli-Dharwad
Figure 6: Regional setting of Hubli-Dharwad

Ministry of Urban Development
[36]] Draft City Development Plan – Hubli-Dharwad
2.2 Administrative Boundary
Dharwad is the administrative headquarters of Dharwad district. Hubli Dharwad Municipal Corporation (HDMC) is a part of Dharwad district. As per Census 2011, the population of HDMC is about 9.3 lakhs and covers an area of 202 sq.kms. HDMC has been divided into the 67 wards for administrative purpose.
2.3 Location and Connectivity
Hubli is located between 15°11' - 15°31' north latitude and 75°01' - 75°28' east longitude at an altitude of 627.97 m above sea level, while Dharwad is located between 15°19' - 15°41' north latitude and 75°15' - 75°36' east longitude at an altitude of 696.97 m above sea level in Dharwad district of Karnataka and about 480 km north of Bengaluru.
The twin cities have excellent road connectivity to every part of Karnataka and even to neighbouring states and other popular destinations. In addition, Hubli is well connected by rail and air. The national highway from Bengaluru to Pune passes through the twin cities and the highway has enhanced the connectivity of the twin cities with the two major urban centres. The twin cities are also connected to other urban centres Panjim via NH8.
The rail links connect the city with Hotgi, Sholapur, Marmagoa, and Bellary. Hubli is has a railway station and most of the trains on the south central line stop at Hubli. Dharwad is dependent on Hubli for rail and air connectivity.
Figure 7: Location map of Hubli-Dharwad
Ministry of Urban Development
[37]] Draft City Development Plan – Hubli-Dharwad
2.4 Defining the Study Area
The jurisdiction of HDMC is about 202 sq. km. The CDP has been updated and revised for the existing HDMC limits. The existing population of the study area as per Census 2011 is about 9.43 lakhs.
2.5 Physical Setting
2.5.1 Topography and Geology
Hubli-Dharwad is situated on the edge of Western Ghats. Dharwad is a hilly city spread over small hills at an average altitude of 700 m above sea level. Hubli is located on the sides of a natural valley leading to Unkal Lake and has a flat terrain compared to Dharwad.
There is a variation in the quality and type of soil found in different parts of the region. Mostly black cotton soil is found towards the northern and eastern sides of the region of the twin cities, but slight variation on the quality and type of soils is observed in between areas. The soil in the southern and western regions of the city is medium red and gravelly, which attributes to the current spread of the city.
2.5.2 Climate
Hubli-Dharwad experiences a tropical climate with distinct wet and dry seasons. Owing to the location, Dharwad enjoys a pleasant weather with moderate climate throughout the year. The coolest month is December with an average low temperature of 15.4 °C and the hottest month is April with an average high temperature of 32.8 °C. The region receives rainfall from both northeast and southwest monsoons, and the wettest months are September and October. The average annual rainfall is around 675 mm for Hubli and 812 mm for Dharwad. The summer heat is moderated by fairly frequent thunderstorms, which occasionally cause power outages and local flooding.
During the colonial era, Britishers settled in Dharwad due to its pleasant climate. Also, the pleasant climate of the region attracted many health and educational institutions to the city. Also, owing to its locational advantage, the cities are resistant to natural calamities like earthquake, cyclones, and landslides.
2.5.3 Agriculture, Mineral, and Industry
Hubli-Dharwad lies on the Deccan Plateau. Mineral deposits like manganese, iron, and copper are available here.
2.5.4 Water Resources
The twin cities had nine lakes, of which only two exist today, Kelgari and Sadankeri. During earlier times, people in the twin cities drew water mainly from dug wells and water harvesting tanks, which collected surface run-off during monsoons. Open wells are typically 10-15 m deep and dry up during March-June. Later, the primary source of drinking water for the people of Hubli was Unkal Lake, and Neerasagar Lake. Dharwad depended on the Kelgari tank.
Groundwater in the HDMC area occurs mainly in the fractured and weathered zone in an unconfined state. The increasing numbers of boreholes are abstracting groundwater from a deeper confined aquifer, which fluctuates less than the open wells. Maximum yields are achieved in boreholes drilled between 40 and 80 m depth, which can be interpreted as the zone of most intensive fracture in the greywackes, with the fractures tending to be less well developed or closing below 100 m. Measured values for the lower aquifer transmissivity ranged from 12 to 66 m
2/day (average 30 m
2/day) and
specific yield was in the range of 1.8E-06 – 2.5E-01 (average 0.03). The specific yield of 0.03 implies that every 10 mm of effective recharge would raise the water table by 0.3 m.
Growing water shortages in the twin cities have resulted in the uncontrolled extraction of groundwater. In the absence of a licensing plan, bore wells are being drilled in twin cities for both domestic as well
Ministry of Urban Development
[38]] Draft City Development Plan – Hubli-Dharwad
as agricultural purpose. Over-extraction has led to lowering of the groundwater table, and further increasing salinity in the peri-urban areas of the city.
2.5.5 Forest Resources
Deciduous forests and thorn and scrub forests are the two major types of forests seen in this region, and these types of forests are conducive for the growth of timber yielding trees like rose wood, teak, honne, and nandi. The average forest area in the district is about 0.04 hectares and none of them fall within the HDMC limits.

Ministry of Urban Development
[39]] Draft City Development Plan – Hubli-Dharwad
3. Demographic Profile of the Town
The chapter presents a detailed overview of the demographic profile of the city and its overall position with reference to the state and district. It also describes the population growth trends, spatial distribution, and other demographic characteristics of the city. In addition, based on the past trends and potential of the city, the future population has been estimated through various scientific methods.
3.1 Background
As per Census 2011, the level of urbanisation in Karnataka has increased from 29% in 1981 to 39% in 2011. Karnataka state has been divided into coastal, Malnad, southern Maidan, and northern Maidan regions. The southern Maidan region has reported the highest urbanisation (50.6%) due to its location advantages and infrastructure facilities, and has also recorded the highest urban population growth in the state. At the same time, the coastal region (7.4%) has reported the least urbanization. Both Malnad (21.4%) and northern Maidan (20.6%), for obvious constraints, have medium levels of urbanisation.
3.2 Population and Urbanization
The urban population in Karnataka has grown from 16.40 lakhs in 1901 to 236.26 lakhs in 2011. As per Census 2011, the proportion of urban population to the total population of Karnataka state is about 39%, higher than the national average of 27.78%. The state accounts for 6.28% of the country‘s urban population.
Karnataka state has been divided into 27 districts for administrative purpose. Among the 27 districts of the state, Bengaluru urban district has the highest concentration of urban population, with 88.08% of the district population residing in urban areas. The Bengaluru urban district accounts for over 32% of the state‘s urban population. The next highest concentration of urban population is in Belgaum district. The current urbanization in the state has been promoting uneven urban development both functionally and spatially. The higher concentration of population and higher levels of urbanization is experiencing particular in the regions adjoining to Bengaluru, which is located almost in the southern tip of the state boundary.
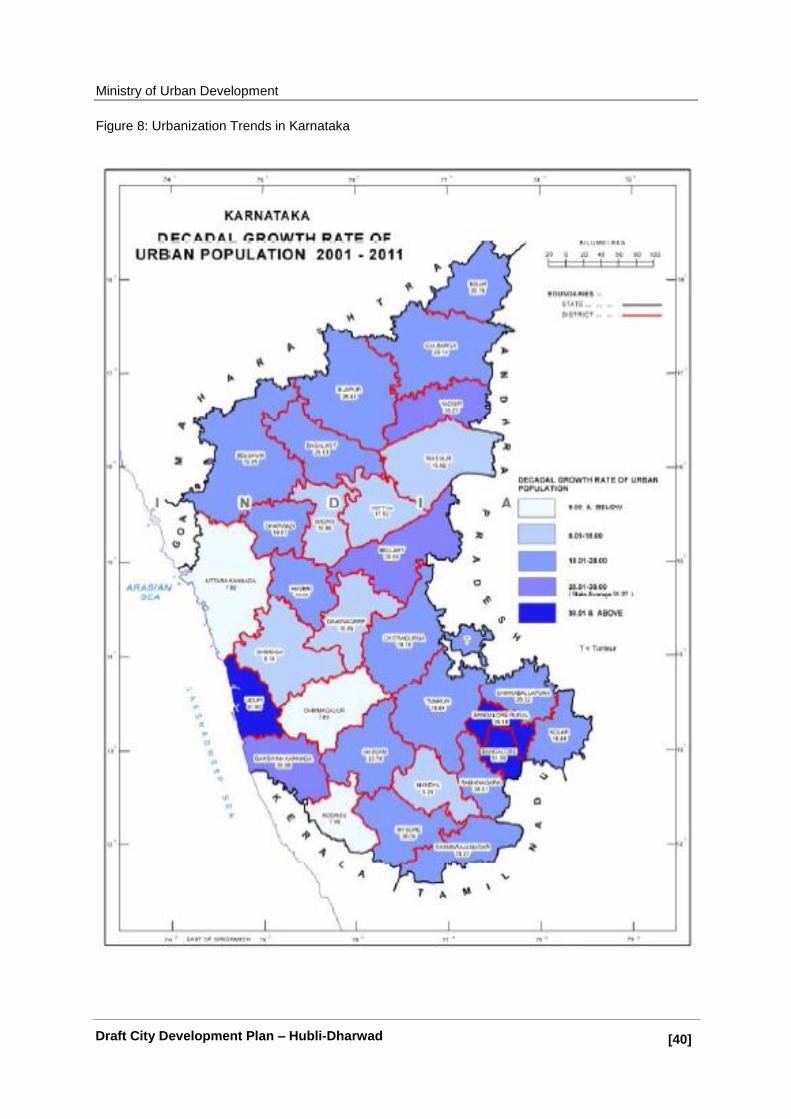
Ministry of Urban Development
[40]] Draft City Development Plan – Hubli-Dharwad
Figure 8: Urbanization Trends in Karnataka

Ministry of Urban Development
[41]] Draft City Development Plan – Hubli-Dharwad
Karnataka has about 214 ULBs. Further, the ULBs have been divided into 8 city corporations, 44 city municipal councils, 68 town municipal councils, and 94 town panchayats in the state as per the population size. The Directorate of Municipal Administration (DMA) supervises the functioning of the municipalities. Out of the 8 city corporations, 5 municipal corporations have population above 5 lakhs. However, Bengaluru is only city has the population more than one million and the remaining 5 corporations have population within the 5-10 lakh category. The remaining ULBs fall in the 0.2 to 3.0 lakh category.
Figure 9: Major Urban Centres in Karnataka
It can be observed from the following table that Hubli-Dharwad stood next to Bengaluru city and
reported a growth rate of 20% over the last decade. Gulbarga and Belgaum have also reported a
growth rate of about 20% over the last decade. At the same time, Mysore has reported least growth in
the 5 lakh category. Gulbarga has reported a gross density of about 8,310 persons per sq. km,
whereas HDMC has reported a density of about 4,292 persons per sq. km.
Table 2: Population in various cities of Karnataka
Sr. No.
Name of the city/state
Area (sq. km)
Population (in lakhs)
Growth rate (%)
Density (Persons/Sq. km)
1 Bengaluru 6911 84.74 51 7500
2 Hubli-Dharwad 202 9.43 20 4292
3 Mysore 128 8.87 13 6911
4 Gulbarga 64 5.32 26 8310
5 Belgaum 95 5.10 20 5389
Source: Census 2011
3.2.1 Dharwad district population
Dharwad district accounts for 2.2% of the total area of the state and accommodates 3% of the state‘s
population. As per Census 2001, the total population of the district was about 13,74,895, with 47.47%
of the total population residing in rural areas and the rest 52.52% residing in urban areas. The
average population density of the region is about 377 persons per sq. km. Dharwad district have five
Ban
galo
re
Hu
bli
- D
harw
ad
Myso
re
Gu
lbarg
a
Belg
au
m
-20.0
0.0
20.0
40.0
60.0
80.0
100.0
Po
pu
lati
on
in
lakh
s
Urban Centers in Karnataka
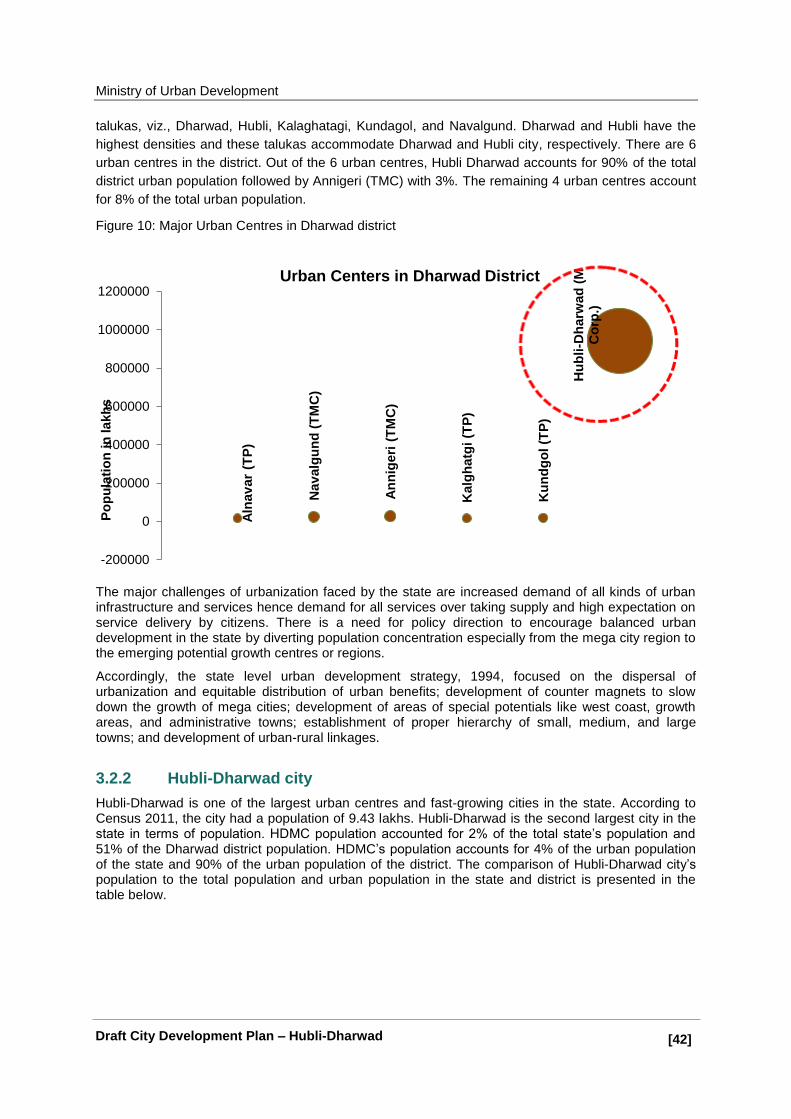
Ministry of Urban Development
[42]] Draft City Development Plan – Hubli-Dharwad
talukas, viz., Dharwad, Hubli, Kalaghatagi, Kundagol, and Navalgund. Dharwad and Hubli have the
highest densities and these talukas accommodate Dharwad and Hubli city, respectively. There are 6
urban centres in the district. Out of the 6 urban centres, Hubli Dharwad accounts for 90% of the total
district urban population followed by Annigeri (TMC) with 3%. The remaining 4 urban centres account
for 8% of the total urban population.
Figure 10: Major Urban Centres in Dharwad district
The major challenges of urbanization faced by the state are increased demand of all kinds of urban infrastructure and services hence demand for all services over taking supply and high expectation on service delivery by citizens. There is a need for policy direction to encourage balanced urban development in the state by diverting population concentration especially from the mega city region to the emerging potential growth centres or regions.
Accordingly, the state level urban development strategy, 1994, focused on the dispersal of urbanization and equitable distribution of urban benefits; development of counter magnets to slow down the growth of mega cities; development of areas of special potentials like west coast, growth areas, and administrative towns; establishment of proper hierarchy of small, medium, and large towns; and development of urban-rural linkages.
3.2.2 Hubli-Dharwad city
Hubli-Dharwad is one of the largest urban centres and fast-growing cities in the state. According to Census 2011, the city had a population of 9.43 lakhs. Hubli-Dharwad is the second largest city in the state in terms of population. HDMC population accounted for 2% of the total state‘s population and 51% of the Dharwad district population. HDMC‘s population accounts for 4% of the urban population of the state and 90% of the urban population of the district. The comparison of Hubli-Dharwad city‘s population to the total population and urban population in the state and district is presented in the table below.
Aln
av
ar
(TP
)
Nav
alg
un
d (
TM
C)
An
nig
eri
(T
MC
)
Kalg
hatg
i (T
P)
Ku
nd
go
l (T
P)
Hu
bli
-Dh
arw
ad
(M
C
orp
.)
-200000
0
200000
400000
600000
800000
1000000
1200000
Po
pu
lati
on
in
lakh
s
Urban Centers in Dharwad District

Ministry of Urban Development
[43]] Draft City Development Plan – Hubli-Dharwad
Table 3: Comparative population of HDMC
Indicator Population (In Lakhs)
% of Urban Population w.r.t. Total Population
Urban population comparison
Total population comparison
Total Rural Urban
Karnataka State
610.95 374.69 236.26 39% 4% 2%
Dharwad District
18.47 7.97 10.50 57% 90% 51%
HDMC 9.43 0 9.43 100% 100% 100%
Source: Census 2011
3.3 Population Growth Trend
In Hubli-Dharwad, growth of population was highest after the formation of Karnataka state in 1956. A number of regional offices of the state government for North Karnataka were set up in Dharwad district, which resulted in increased migration to the twin cities during 1961-71. During the decade 1961-71, the population of Hubli-Dharwad has to 3.79 lakhs from 2.49 lakhs and reported a decadal change of 1.32 lakhs and decadal growth of 53%. However, since 1981, growth rate has been declining primarily due to the development of other district centres in the region and also due to the lack of new economic activities. In the subsequent decades, HDMC witnessed a declining trend in population.
Table 4: Population Trends in HDMC
Year Area in Sq. km Population Decadal Change Decadal Growth (%)
1961 190.9 248489
1971 190.9 379166 130677 52.59
1981 190.9 527108 147942 39.02
1991 190.9 648298 121190 22.99
2001 202.3 786018 137720 21.24
2011 202.3 943857 157839 20.08
Source: Census 2011
Further, during Census 2011, the population increased to 9.43 lakhs from 7.86 lakhs in the previous decade and registered a decadal growth of 20%. Despite being the largest centre for trade and commerce in the north Karnataka region, the city experienced a low population growth during the past three decades as compared to the decades 1961-71.
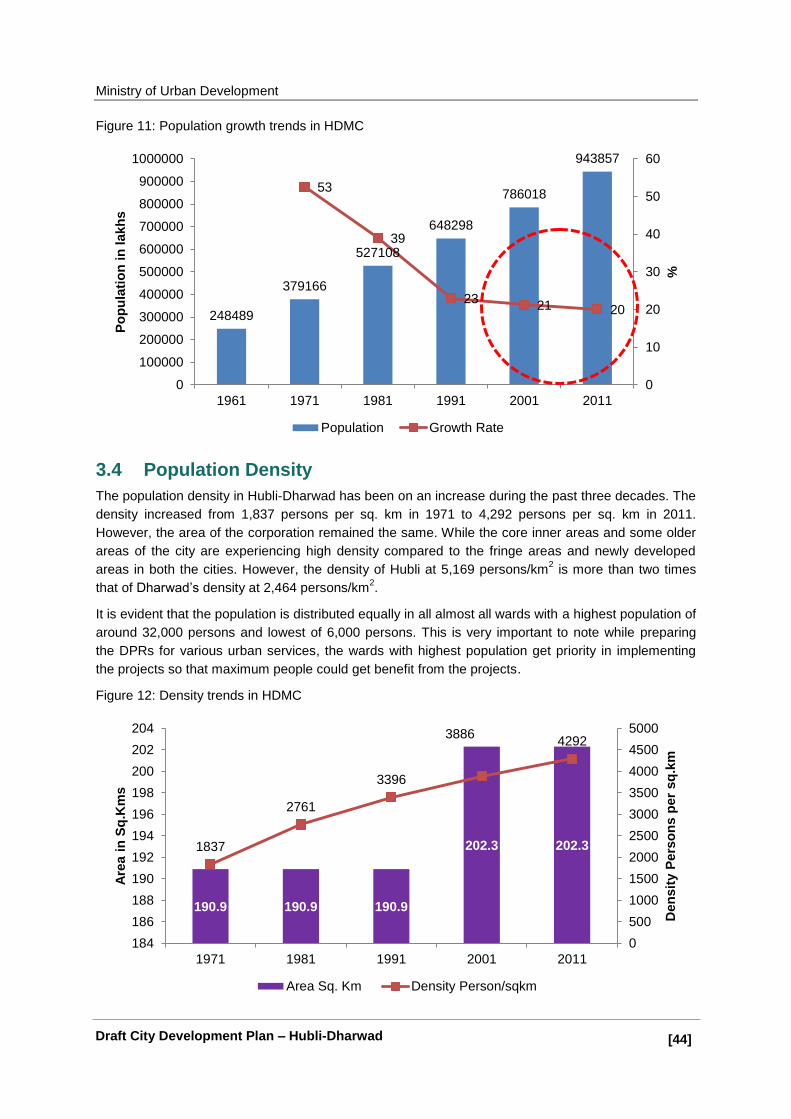
Ministry of Urban Development
[44]] Draft City Development Plan – Hubli-Dharwad
Figure 11: Population growth trends in HDMC
3.4 Population Density
The population density in Hubli-Dharwad has been on an increase during the past three decades. The
density increased from 1,837 persons per sq. km in 1971 to 4,292 persons per sq. km in 2011.
However, the area of the corporation remained the same. While the core inner areas and some older
areas of the city are experiencing high density compared to the fringe areas and newly developed
areas in both the cities. However, the density of Hubli at 5,169 persons/km2 is more than two times
that of Dharwad‘s density at 2,464 persons/km2.
It is evident that the population is distributed equally in all almost all wards with a highest population of
around 32,000 persons and lowest of 6,000 persons. This is very important to note while preparing
the DPRs for various urban services, the wards with highest population get priority in implementing
the projects so that maximum people could get benefit from the projects.
Figure 12: Density trends in HDMC
248489
379166
527108
648298
786018
943857
53
39
23 21 20
0
10
20
30
40
50
60
0
100000
200000
300000
400000
500000
600000
700000
800000
900000
1000000
1961 1971 1981 1991 2001 2011
%
Po
pu
lati
on
in
lakh
s
Population Growth Rate
190.9 190.9 190.9
202.3 202.3 1837
2761
3396
3886 4292
0
500
1000
1500
2000
2500
3000
3500
4000
4500
5000
184
186
188
190
192
194
196
198
200
202
204
1971 1981 1991 2001 2011
Den
sit
y P
ers
on
s p
er
sq
.km
Are
a i
n S
q.K
ms
Area Sq. Km Density Person/sqkm
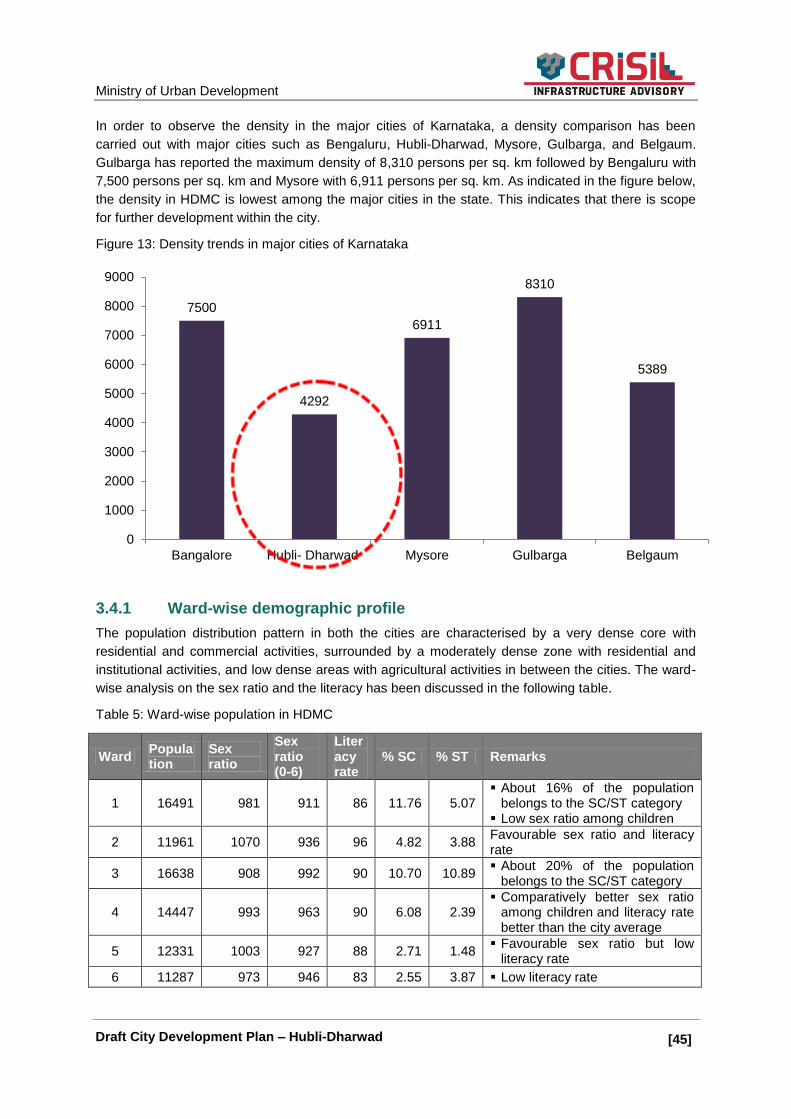
Ministry of Urban Development
[45]] Draft City Development Plan – Hubli-Dharwad
In order to observe the density in the major cities of Karnataka, a density comparison has been
carried out with major cities such as Bengaluru, Hubli-Dharwad, Mysore, Gulbarga, and Belgaum.
Gulbarga has reported the maximum density of 8,310 persons per sq. km followed by Bengaluru with
7,500 persons per sq. km and Mysore with 6,911 persons per sq. km. As indicated in the figure below,
the density in HDMC is lowest among the major cities in the state. This indicates that there is scope
for further development within the city.
Figure 13: Density trends in major cities of Karnataka
3.4.1 Ward-wise demographic profile
The population distribution pattern in both the cities are characterised by a very dense core with
residential and commercial activities, surrounded by a moderately dense zone with residential and
institutional activities, and low dense areas with agricultural activities in between the cities. The ward-
wise analysis on the sex ratio and the literacy has been discussed in the following table.
Table 5: Ward-wise population in HDMC
Ward Population
Sex ratio
Sex ratio (0-6)
Literacy rate
% SC % ST Remarks
1 16491 981 911 86 11.76 5.07 About 16% of the population
belongs to the SC/ST category Low sex ratio among children
2 11961 1070 936 96 4.82 3.88 Favourable sex ratio and literacy rate
3 16638 908 992 90 10.70 10.89 About 20% of the population
belongs to the SC/ST category
4 14447 993 963 90 6.08 2.39 Comparatively better sex ratio
among children and literacy rate better than the city average
5 12331 1003 927 88 2.71 1.48 Favourable sex ratio but low
literacy rate
6 11287 973 946 83 2.55 3.87 Low literacy rate
7500
4292
6911
8310
5389
0
1000
2000
3000
4000
5000
6000
7000
8000
9000
Bangalore Hubli- Dharwad Mysore Gulbarga Belgaum

Ministry of Urban Development
[46]] Draft City Development Plan – Hubli-Dharwad
Ward Population
Sex ratio
Sex ratio (0-6)
Literacy rate
% SC % ST Remarks
7 14806 993 978 85 8.78 1.53 Around 10% of the population
belongs to the SC/ST category and low literacy rate
8 13128 966 997 88 6.79 1.76 Low literacy rate and low sex
ratio
9 10942 1002 977 86 1.77 5.38 Favourable sex ratio but low
literacy rate
10 12367 1035 922 88 14.01 2.83 Favourable sex ratio but low
literacy rate
11 10986 1007 936 89 4.75 2.00 Favourable sex ratio but low
literacy rate
12 9816 979 985 96 9.19 1.61 About 20% of the population
belongs to the SC/ST category High literacy rate
13 10379 1016 880 94 8.17 4.87 Favourable sex ratio and high
literacy rate but low sex ratio among children
14 13576 1010 982 95 4.68 2.55 Favourable sex ratio and high
literacy rate
15 11007 1041 968 91 8.13 1.93 Favourable sex ratio and high
literacy rate
16 11358 1012 981 71 24.56 7.60 Favourable sex ratio and low
literacy rate
17 17015 986 942 92 8.83 4.66 About 12% of the population
belongs to SC/ST category and high literacy rate
18 16325 979 940 86 13.48 5.21 About 19% of the population
belongs to the SC/ST category Low sex ratio and literacy rate
19 11161 980 996 91 9.64 3.30 About 12% of the population
belongs to the SC/ST category
20 17258 1003 982 87 10.62 3.58 Favourable sex ratio but low
literacy rate
21 12060 975 1031 76 6.61 3.51 Favourable sex ratio among
children but low literacy rate
22 22926 980 1008 80 10.48 18.44 Favourable sex ratio among
children but low literacy rate
23 14821 968 896 89 5.42 5.71 Low sex ratio and low literacy
24 15627 995 915 86 7.65 1.57 Low sex ratio and low literacy
25 22232 979 980 84 6.50 3.64 Low sex ratio and low literacy Ward with second highest
population
26 11585 985 943 87 4.63 1.32 Low sex ratio and low literacy
27 11782 991 977 87 8.27 2.30 Low sex ratio and low literacy
28 12892 981 901 90 11.88 2.47 About 15% of the population
belongs to the SC/ST category
29 16998 983 961 84 12.79 3.79 Low literacy
30 19036 1007 959 91 13.96 4.52 About 20% of the population
belongs to the SC/ST category Favourable sex ratio
31 14816 1000 947 96 6.15 2.42 Favourable sex ratio and literacy
rate
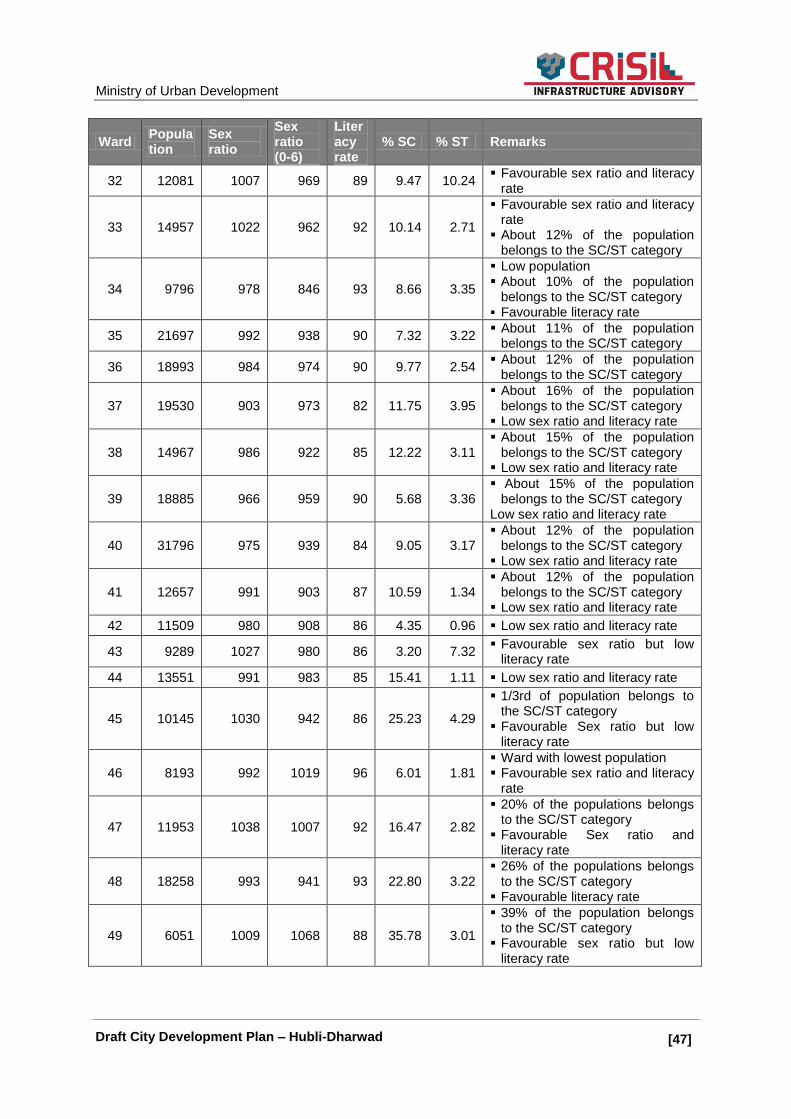
Ministry of Urban Development
[47]] Draft City Development Plan – Hubli-Dharwad
Ward Population
Sex ratio
Sex ratio (0-6)
Literacy rate
% SC % ST Remarks
32 12081 1007 969 89 9.47 10.24 Favourable sex ratio and literacy
rate
33 14957 1022 962 92 10.14 2.71
Favourable sex ratio and literacy rate
About 12% of the population belongs to the SC/ST category
34 9796 978 846 93 8.66 3.35
Low population About 10% of the population
belongs to the SC/ST category Favourable literacy rate
35 21697 992 938 90 7.32 3.22 About 11% of the population
belongs to the SC/ST category
36 18993 984 974 90 9.77 2.54 About 12% of the population
belongs to the SC/ST category
37 19530 903 973 82 11.75 3.95 About 16% of the population
belongs to the SC/ST category Low sex ratio and literacy rate
38 14967 986 922 85 12.22 3.11 About 15% of the population
belongs to the SC/ST category Low sex ratio and literacy rate
39 18885 966 959 90 5.68 3.36 About 15% of the population
belongs to the SC/ST category Low sex ratio and literacy rate
40 31796 975 939 84 9.05 3.17 About 12% of the population
belongs to the SC/ST category Low sex ratio and literacy rate
41 12657 991 903 87 10.59 1.34 About 12% of the population
belongs to the SC/ST category Low sex ratio and literacy rate
42 11509 980 908 86 4.35 0.96 Low sex ratio and literacy rate
43 9289 1027 980 86 3.20 7.32 Favourable sex ratio but low
literacy rate
44 13551 991 983 85 15.41 1.11 Low sex ratio and literacy rate
45 10145 1030 942 86 25.23 4.29
1/3rd of population belongs to the SC/ST category
Favourable Sex ratio but low literacy rate
46 8193 992 1019 96 6.01 1.81 Ward with lowest population Favourable sex ratio and literacy
rate
47 11953 1038 1007 92 16.47 2.82
20% of the populations belongs to the SC/ST category
Favourable Sex ratio and literacy rate
48 18258 993 941 93 22.80 3.22 26% of the populations belongs
to the SC/ST category Favourable literacy rate
49 6051 1009 1068 88 35.78 3.01
39% of the population belongs to the SC/ST category
Favourable sex ratio but low literacy rate

Ministry of Urban Development
[48]] Draft City Development Plan – Hubli-Dharwad
Ward Population
Sex ratio
Sex ratio (0-6)
Literacy rate
% SC % ST Remarks
50 19572 1018 876 88 19.48 2.39
22% of the population belongs to the SC/ST category
Favourable sex ratio but low sex ratio among children and low literacy rate
51 10345 1044 885 88 10.25 1.44
12% of the population belongs to the SC/ST category
Favourable sex ratio but low sex ratio among children and low literacy rate
52 9999 994 1047 95 1.98 0 .47 Favourable sex ratio among
children and high literacy rate
53 11138 995 929 91 0.57 1.05 High literacy rate
54 11273 982 947 91 0.15 1.45 High literacy rate
55 10934 951 927 92 0.66 0.54 High literacy rate
56 10324 984 944 89 3.22 0.99 Comparatively low literacy rate
57 13876 1017 939 81 28.24 0.96 Favourable sex ratio but low
literacy rate
58 10767 1001 938 86 8.47 1.77 Favourable sex ratio but low
literacy rate
59 14946 987 976 79 14.61 2.74 Low sex ratio and low literacy
rate
60 10974 956 923 87 2.66 0.99 Low sex ratio and low literacy
rate
61 11662 981 978 75 10.11 4.90 Low sex ratio Lowest literacy rate among the
wards
62 11072 993 930 81 22.99 0.92
24% of the persons belongs to the SC/ST category
Low sex ratio and low literacy rate
63 15338 956 940 83 6.19 2.30 Low sex ratio and low literacy
rate
64 15579 961 970 78 1.26 0.51 Low sex ratio and low literacy
rate
65 23409 982 976 76 4.56 2.11 Low sex ratio and low literacy
rate
66 14326 968 962 86 3.27 5.14 Low sex ratio and low literacy
rate
67 15892 1027 966 73 27.24 9.82 Favourable sex ratio but low
literacy rate
Source: Census 2011
3.5 Average Household Size
As per Census 2011, the average household size in the twin cities is about 4.7 persons per
household, which is slightly higher than state average of 4.5 persons per family, and in the urban
areas of Karnataka, the household size is about 4.4 people per family.

Ministry of Urban Development
[49]] Draft City Development Plan – Hubli-Dharwad
3.6 Literacy Rate
As per Census 2011, the twin cities are witnessing a steady increase in the literacy rate. It has
increased from 81.8% to 87% in the last one decade. But female literacy is yet to catch up with male
literacy, which is on the higher side. The higher literacy rate in the Hubli-Dharwad city is attributed to
the educational infrastructure in the city.
The average literacy rate of Dharwad district is about 80%, but higher than the state average of
75.36%. The literacy rate is higher than that of Bengaluru and Karnataka. During the last decade, In
Karnataka, male literacy has increased from 76.10% to 82.47%; female literacy rate has increased
from 56.87% to 68.08% The increase in the female literacy by 11.21% points against a male literacy
rate increase of 6.37 percentage points has substantially narrowed the gap between male-female
literacy rates.
3.7 Sex Ratio1
As per Census 2011, sex ratio in Hubli-Dharwad city is 988, which is higher than the state and national urban average. Between 1971 and 1981, the ratio has recorded a continuous decline from 950 to 912. But it has shown significant improvement in the last three decades to reach 988. The following chart describes the trends in sex ratio over the past four decades.
Figure 14: Sex ratio trends
3.7.1 Age-sex distribution
The age-sex pyramid has been analysed to estimate the working group population, and further to
determine the dependant population in the city. As per the socio-economic survey of Hubli-Dharwad
city conducted by the Centre for Multi-Disciplinary Development Research (CMDR), Dharwad,
children (in the age group of 0-14 years) and adolescents (in the age group of 15-24 years)
constituted 47% of the total population, while the proportion of population in the actively working and
employable age group of 25-49 years constituted 37%. This can be considered as a positive feature
as it makes available human resources for development in the present and future.
1 As per Census 2011, the sex ratio is defined as the number of females for every 1000 males.
950
912 922
949
988
860
880
900
920
940
960
980
1000
1971 1981 1991 2001 2011
Sex Ratio
Sex Ratio
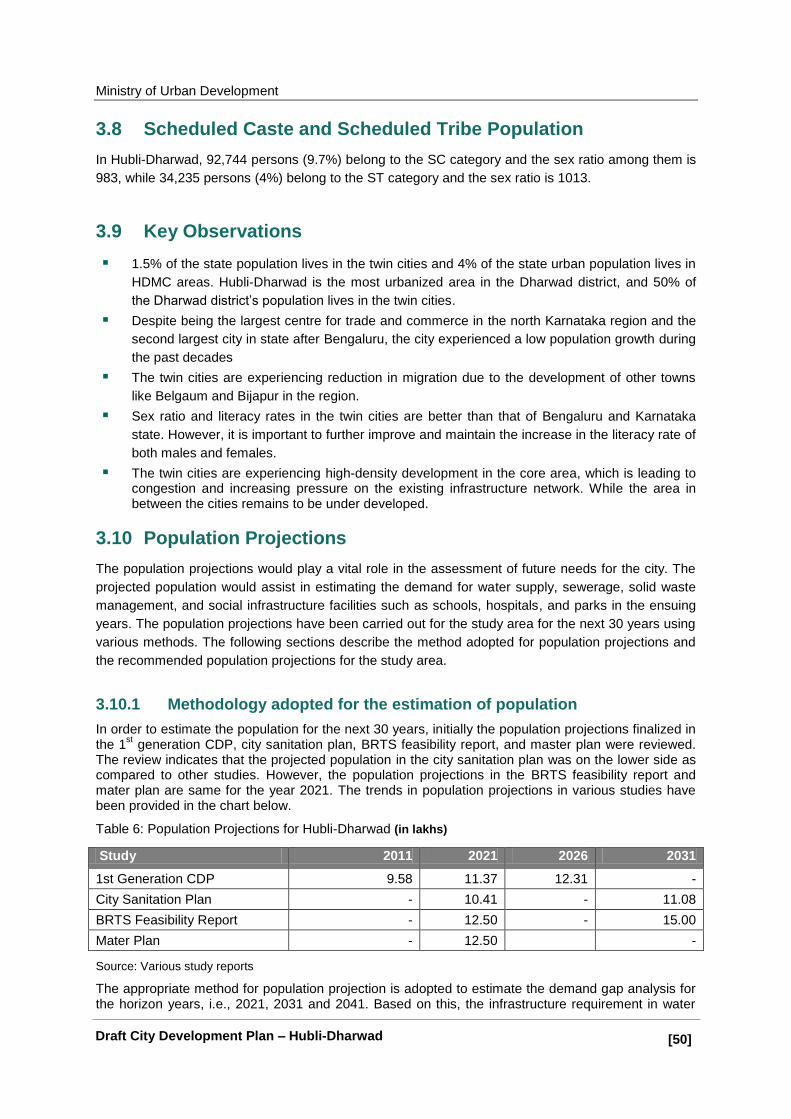
Ministry of Urban Development
[50]] Draft City Development Plan – Hubli-Dharwad
3.8 Scheduled Caste and Scheduled Tribe Population
In Hubli-Dharwad, 92,744 persons (9.7%) belong to the SC category and the sex ratio among them is
983, while 34,235 persons (4%) belong to the ST category and the sex ratio is 1013.
3.9 Key Observations
1.5% of the state population lives in the twin cities and 4% of the state urban population lives in
HDMC areas. Hubli-Dharwad is the most urbanized area in the Dharwad district, and 50% of
the Dharwad district‘s population lives in the twin cities.
Despite being the largest centre for trade and commerce in the north Karnataka region and the
second largest city in state after Bengaluru, the city experienced a low population growth during
the past decades
The twin cities are experiencing reduction in migration due to the development of other towns
like Belgaum and Bijapur in the region.
Sex ratio and literacy rates in the twin cities are better than that of Bengaluru and Karnataka
state. However, it is important to further improve and maintain the increase in the literacy rate of
both males and females.
The twin cities are experiencing high-density development in the core area, which is leading to congestion and increasing pressure on the existing infrastructure network. While the area in between the cities remains to be under developed.
3.10 Population Projections
The population projections would play a vital role in the assessment of future needs for the city. The
projected population would assist in estimating the demand for water supply, sewerage, solid waste
management, and social infrastructure facilities such as schools, hospitals, and parks in the ensuing
years. The population projections have been carried out for the study area for the next 30 years using
various methods. The following sections describe the method adopted for population projections and
the recommended population projections for the study area.
3.10.1 Methodology adopted for the estimation of population
In order to estimate the population for the next 30 years, initially the population projections finalized in the 1
st generation CDP, city sanitation plan, BRTS feasibility report, and master plan were reviewed.
The review indicates that the projected population in the city sanitation plan was on the lower side as compared to other studies. However, the population projections in the BRTS feasibility report and mater plan are same for the year 2021. The trends in population projections in various studies have been provided in the chart below.
Table 6: Population Projections for Hubli-Dharwad (in lakhs)
Study 2011 2021 2026 2031
1st Generation CDP 9.58 11.37 12.31 -
City Sanitation Plan - 10.41 - 11.08
BRTS Feasibility Report - 12.50 - 15.00
Mater Plan - 12.50 -
Source: Various study reports
The appropriate method for population projection is adopted to estimate the demand gap analysis for the horizon years, i.e., 2021, 2031 and 2041. Based on this, the infrastructure requirement in water

Ministry of Urban Development
[51]] Draft City Development Plan – Hubli-Dharwad
supply, sewerage and sanitation, solid waste management, storm water drainage, traffic and transportation, and other amenities is forecasted.
Under the BRTS project, HDMC has forecasted the population for the said horizon years. The project has been sanctioned and is currently being implemented. Hence, it is considered that projections for the study area should be in line with the projections made during the BRTS project.
Further, based on the population trends during the past four decades, CRISIL has projected the population for the study area using the following methods:
Arithmetic;
Geometric;
Incremental increase;
Exponential;
Power;
Log;
2nd order polynomial; and
3rd order polynomial.
It can be observed from the chart below that the population projected through the power and log methods is on the lower side. The exponential method projects the population on a higher side as compared to the other methods. It is estimated that the population would increase to 23.8 lakhs by the end of 2041. Similarly, methods such as the geometric method projected the population on a moderately higher side. The population projections made using the 3
rd order polynomial method are
reasonable and in line with the BRTS project projections. It is estimated that the population would increase to 18.3 lakhs by the end of 2041. The population projections made through various methods for the next three decades have been presented in the chart and table below.
Figure 15: Population projections using various methods
11.6
14.5
18.3
10.9
12.3
13.7
11.4
13.8
16.8
12.5
16.7
22.1
15.2
19.0
23.8
10.8 11.7
12.4
6.5 7.0 7.4
0.0
5.0
10.0
15.0
20.0
25.0
2021 2031 2041
Polynomial 2nd order Polynomial 3rd order Arithmetic
Incremental Geometric Exponential
Power Log

Ministry of Urban Development
[52]] Draft City Development Plan – Hubli-Dharwad
Table 7: Population projections using various methods
Year 2021 2031 2041
2nd order polynomial 10.9 12.5 14.1
3rd order polynomial 11.6 14.5 18.3
Arithmetic 10.9 12.3 13.7
Incremental 11.4 13.8 16.8
Geometric 12.5 16.7 22.1
Exponential 15.2 19.0 23.8
Power 10.8 11.7 12.4
Log 6.5 7.0 7.4
Source: CRIS analysis
3.10.2 Basic assumptions made for population projection
While adopting the population for the next three decades, the following factors were considered which would influence the city‘s future growth:
Urbanization trends in the district and the city;
Economic activities such as trade and commerce, industrial development, and social infrastructure-related activities;
Assuming the growth rate will increase because of new infrastructure projects in the city
The growth rate will be high due to development imparted by the newly developed infrastructure projects like BRTS, ToD, Industrial investment etc.
In 2041, assuming stabilization of growth in the city due to development in other parts of the region and the state.)
3.10.3 Recommended population projection
The projected population under various methods has been compared with the population projections finalized in the 1
st generation CDP, city sanitation plan, BRTS feasibility report, and master plan. The
3rd
order polynomial projections are slightly on the higher side as compared to the population finalized in the BRTS feasibility report.
Based on the above factors, the population trends during the past four decades, and the projected population in various studies and methods, the 3
rd order polynomial projections were found
appropriate. The population projections made using this method have been provided in the below table.
Table 8: Projected population in Hubli-Dharwad
Year 3rd order polynomial (In Lakhs)
2021 11.6
2031 14.5
2041 18.3

Ministry of Urban Development
[53]] Draft City Development Plan – Hubli-Dharwad
Transport
Education
sector
Industrial
Activities
Trade and
Commerce
Hubli
Dharwad
4. Economic Profile of the Town
The chapter presents a detailed assessment of the economic profile of the city such as key economic drivers of the city, spatial distribution of economic activity, industrial profile, workforce participation rate, workers‘ classification, state-level economic policies that impact the city‘s economy, key economic indicators with reference to the state and the district, and a brief on informal sector activity in the city. The sector-wise workforce projections have been carried out for future years. Further, the key issues with respect to the economic base have been detailed out at the end of the chapter.
4.1 Background
The four pillars of the city‘s economy are trade and commerce, the services sector, industries, the education sector. Hubli-Dharwad is the most urbanized area in north Karnataka. The city serves as the commercial hub of the region. The primary drivers of Hubli-Dharwad city‘s economy are tertiary-based activities, namely, trade and commerce including agro-based activities, transport, and the education sector. More than half of the city‘s working population is involved in the tertiary sector.
The cities economic growth was triggered by the establishment of the railway workshop during the 1880s. The workshop manufactures passenger coaches and goods wagons. Also, the Karnataka Central Co-operative Textile Mill was started during that period. Industrialisation progressed in course of time.
Dharwad was developed as an administrative capital by the British, and many educational and cultural institutions were also established in the city even before the independence. Major industries in Dharwad are Plywood Factory, Karnataka Paper Mill, and other wood industries, which are based on forest produce. As Hubli and Navanagar are more suitable for industries compared to Dharwad, Dharwad‘s remains an administrative, educational, and cultural centre.
Some of the key functions related to development that the city provides are:
Acting as the main centre of capital market for the entire northern region of Karnataka and as
a centre of economic activities including industry, trade, and commerce;
Functioning as a very important regional node for traffic and transport - both passenger and
freight;
Providing the location for regional headquarters for several state government
organizations/departments;
Functioning as centre cultural and recreational activities.
4.2 Overview of Economic Situation of the State and Town
Karnataka is one of the fastest growing states in the country and is known as the IT capital of the
country. The state also has a significant share of India‘s agriculture production. The state has shown

Ministry of Urban Development
[54]] Draft City Development Plan – Hubli-Dharwad
significant increase in production of cereals, pulses, cotton, sugarcane, and tobacco. However, the
share in production of oilseeds has declined, which is mainly due to diversion of area to other crops.
However, the share of agriculture in the GSDP has been declining over the years. Karnataka has
been spearheading the growth of Indian industry, particularly in terms of high-technology industries in
the areas of electrical and electronics, information and communication technology (ICT),
biotechnology, and, more recently, nanotechnology.
4.2.1 Karnataka state economic profile
The industrial structure of Karnataka presents a blend of modern high-tech capital goods and
knowledge intensive industries on the one hand and traditional consumer goods industries on the
other. The annual survey of industries (ASI) statistics show that Karnataka accounted for 5.07% of the
total number of registered factories in 2010-11 in the country. The contribution of registered factories
of Karnataka stood at 6.76% of the total fixed capital, 6.10% of the total output, and 5.86% of the
gross value added (GVA) in the same year.
As per the economic survey of Karnataka, the state has made notable progress in all sectors during
the course of the 11th Plan. The increase in state income has been satisfactory in spite of the global
slowdown in recent years. The increase in the state gross domestic product was 6.9% during the
11th Plan.
The agriculture sector has particularly performed well by achieving a growth of 5.1%, while the growth
in the services sector was at 8.7% and the industrial sector recorded a growth of 4.8%. The major
factor for the slow growth in the industrial sector was the global slowdown witnessed since the
beginning of 2008. Due to an uncertain and challenging macroeconomic situation globally and
nationally and the widespread drought situation in the state, the economy could not grow at the pace
as planned during the 11th Five Year Plan.
The per capita GSDP during 2008–2009 was US$1034.9. Karnataka recorded the highest growth
rates in terms of GDP and per capita GDP in the last decade as compared to other states. In 2008–
09, the tertiary sector contributed the most to the GSDP amounting to US$31.6 billion (55%), followed
by the secondary sector, contributing US$17 billion (29%), and the primary sector, contributing
US$9.5 billion (16%).
Figure 16: Sector-wise contribution in GSDP
19%
26% 55%
Sector wise constribution-GSDP (2008-09)
Primary Secondary Tertiary

Ministry of Urban Development
[55]] Draft City Development Plan – Hubli-Dharwad
4.2.2 Gross district domestic product (GDDP)2
In 2013-14, advance estimates show that Karnataka's gross state domestic product (GSDP) at
constant (2004-05) price is expected to grow at 5.0% and reach Rs. 311628 crores. The agriculture
and allied sector showed a negative growth of 4.9% during 2012-13. The industry sector (comprising
mining and quarrying, manufacturing, construction and electricity, gas, and water supply) is estimated
to grow at 1.2% during 2013-14. The rate of the service sector in 2012-13 was 7.2%. Real estate,
Ownership of dwellings and Business services, and public administration and other services have
each grown by more than 9% during 2013-14.
4.2.3 Dharwad district economic profile
In Karnataka, Bengaluru is the major contributor to the GSDP, followed by Belgaum. The contribution
of Mysore and Bellary to the state‘s economy is higher than that of Dharwad district. Though Dharwad
district is the second highest urbanized district, it ranks sixth in terms of contribution to the GSDP.
Also the per capita GDP in Dharwad is less than the state average. However, the per capita share of
Dharwad is higher than the state share when it is computed without Bengaluru‘s contribution.
Table 9: District-wise performance
State/District
Primary Secondary Tertiary GDP Per capita
Rs. Lakhs
% State
Rs. Lakhs
% State
Rs. Lakhs % State
Rs. Lakhs % State
GDP (Rs)
Bengaluru
89184 2.7 1933177 40.1 2879993 33.8 4902354 29.5 71636
Belgaum 266275 8.1 285812 5.9 428216 5.0 980304 5.9 22219
Dharwad 27647 0.8 131237 2.7 291952 3.4 459254 2.8 27345
Mysore 174781 5.3 260470 5.4 371218 4.4 806469 4.8 29169
Karnataka
3299330 100.0 4817924 100.0 8513314 100.0 16630569 100.
0 30059
Source: Directorate of Economics & Statistics, Bengaluru
4.2.4 Economic profile – Hubli-Dharwad
Hubli-Dharwad is the most urbanized area in north Karnataka and also the city serves as the
commercial hub of the region. The primary drivers of Hubli-Dharwad city‘s economy are tertiary-based
activities, namely, trade and commerce including agro-based activities, transport and Education
sector. Hubli is the commercial hub of north Karnataka and major economic activities include
industrial activities and trade and commerce. Hubli is an important industrial centre of the region with
more than 3,000 small and medium industries. Approximately 55% of the city‘s population is involved
in the tertiary sector.
The railway workshop and Karnataka Central Co-operative Textile Mill were established in the city
during the British regime. A number of ginning and pressing units were established during the early
2 The GDDP has been analysed on the basis of 2009-10 figures available in the AP Economic Survey, 2012-13.
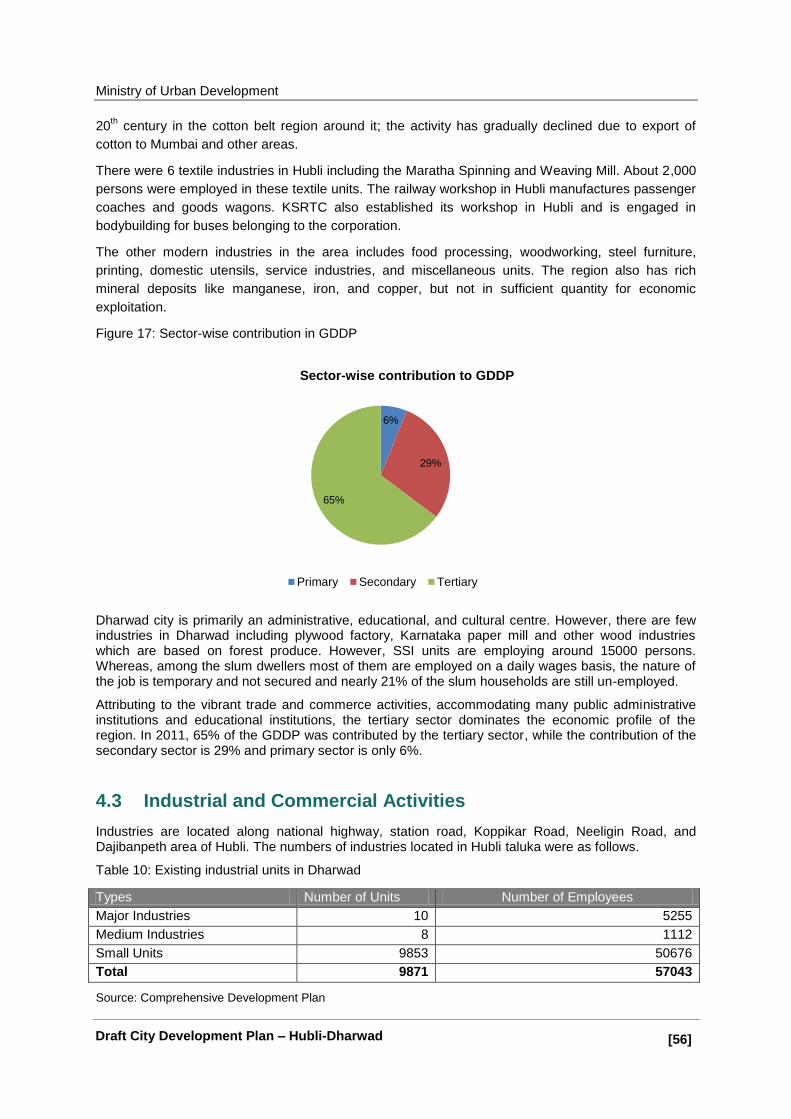
Ministry of Urban Development
[56]] Draft City Development Plan – Hubli-Dharwad
20th century in the cotton belt region around it; the activity has gradually declined due to export of
cotton to Mumbai and other areas.
There were 6 textile industries in Hubli including the Maratha Spinning and Weaving Mill. About 2,000
persons were employed in these textile units. The railway workshop in Hubli manufactures passenger
coaches and goods wagons. KSRTC also established its workshop in Hubli and is engaged in
bodybuilding for buses belonging to the corporation.
The other modern industries in the area includes food processing, woodworking, steel furniture,
printing, domestic utensils, service industries, and miscellaneous units. The region also has rich
mineral deposits like manganese, iron, and copper, but not in sufficient quantity for economic
exploitation.
Figure 17: Sector-wise contribution in GDDP
Dharwad city is primarily an administrative, educational, and cultural centre. However, there are few industries in Dharwad including plywood factory, Karnataka paper mill and other wood industries which are based on forest produce. However, SSI units are employing around 15000 persons. Whereas, among the slum dwellers most of them are employed on a daily wages basis, the nature of the job is temporary and not secured and nearly 21% of the slum households are still un-employed.
Attributing to the vibrant trade and commerce activities, accommodating many public administrative institutions and educational institutions, the tertiary sector dominates the economic profile of the region. In 2011, 65% of the GDDP was contributed by the tertiary sector, while the contribution of the secondary sector is 29% and primary sector is only 6%.
4.3 Industrial and Commercial Activities
Industries are located along national highway, station road, Koppikar Road, Neeligin Road, and Dajibanpeth area of Hubli. The numbers of industries located in Hubli taluka were as follows.
Table 10: Existing industrial units in Dharwad
Types Number of Units Number of Employees
Major Industries 10 5255
Medium Industries 8 1112
Small Units 9853 50676
Total 9871 57043
Source: Comprehensive Development Plan
6%
29%
65%
Sector-wise contribution to GDDP
Primary Secondary Tertiary
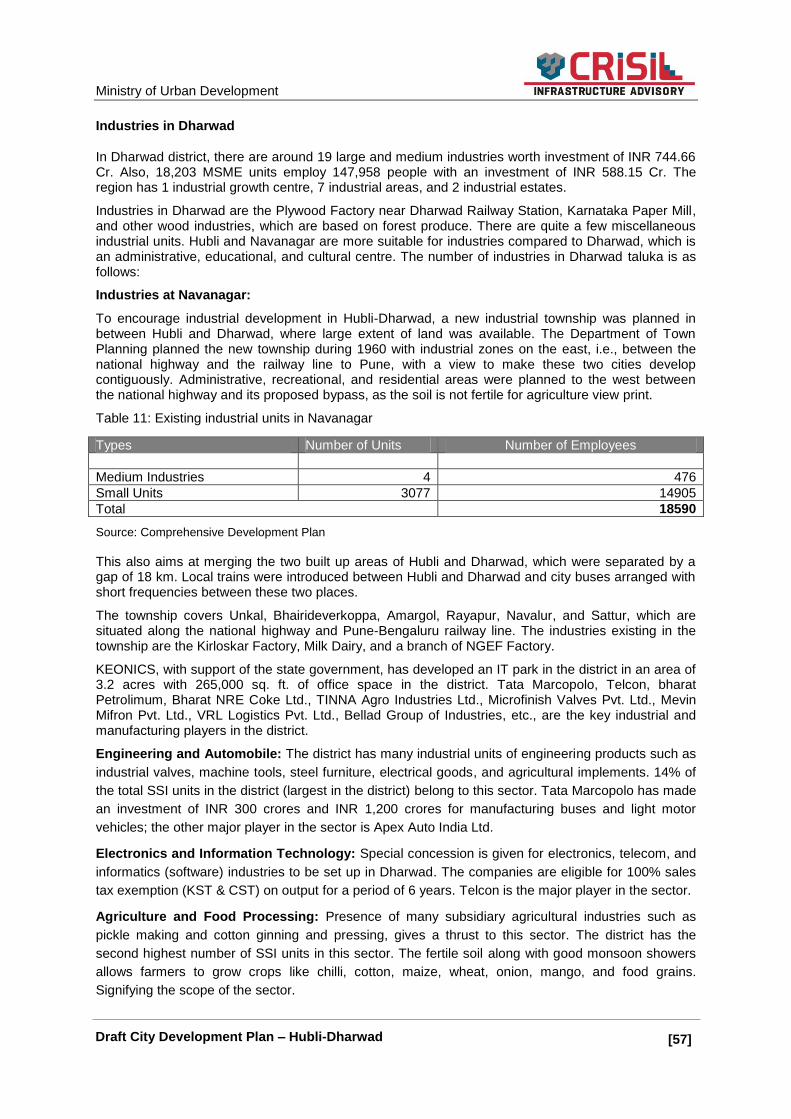
Ministry of Urban Development
[57]] Draft City Development Plan – Hubli-Dharwad
Industries in Dharwad
In Dharwad district, there are around 19 large and medium industries worth investment of INR 744.66 Cr. Also, 18,203 MSME units employ 147,958 people with an investment of INR 588.15 Cr. The region has 1 industrial growth centre, 7 industrial areas, and 2 industrial estates.
Industries in Dharwad are the Plywood Factory near Dharwad Railway Station, Karnataka Paper Mill, and other wood industries, which are based on forest produce. There are quite a few miscellaneous industrial units. Hubli and Navanagar are more suitable for industries compared to Dharwad, which is an administrative, educational, and cultural centre. The number of industries in Dharwad taluka is as follows:
Industries at Navanagar:
To encourage industrial development in Hubli-Dharwad, a new industrial township was planned in between Hubli and Dharwad, where large extent of land was available. The Department of Town Planning planned the new township during 1960 with industrial zones on the east, i.e., between the national highway and the railway line to Pune, with a view to make these two cities develop contiguously. Administrative, recreational, and residential areas were planned to the west between the national highway and its proposed bypass, as the soil is not fertile for agriculture view print.
Table 11: Existing industrial units in Navanagar
Types Number of Units Number of Employees
Major Industries 5 3029
Medium Industries 4 476
Small Units 3077 14905
Total 18590
Source: Comprehensive Development Plan
This also aims at merging the two built up areas of Hubli and Dharwad, which were separated by a gap of 18 km. Local trains were introduced between Hubli and Dharwad and city buses arranged with short frequencies between these two places.
The township covers Unkal, Bhairideverkoppa, Amargol, Rayapur, Navalur, and Sattur, which are situated along the national highway and Pune-Bengaluru railway line. The industries existing in the township are the Kirloskar Factory, Milk Dairy, and a branch of NGEF Factory.
KEONICS, with support of the state government, has developed an IT park in the district in an area of 3.2 acres with 265,000 sq. ft. of office space in the district. Tata Marcopolo, Telcon, bharat Petrolimum, Bharat NRE Coke Ltd., TINNA Agro Industries Ltd., Microfinish Valves Pvt. Ltd., Mevin Mifron Pvt. Ltd., VRL Logistics Pvt. Ltd., Bellad Group of Industries, etc., are the key industrial and manufacturing players in the district.
Engineering and Automobile: The district has many industrial units of engineering products such as
industrial valves, machine tools, steel furniture, electrical goods, and agricultural implements. 14% of
the total SSI units in the district (largest in the district) belong to this sector. Tata Marcopolo has made
an investment of INR 300 crores and INR 1,200 crores for manufacturing buses and light motor
vehicles; the other major player in the sector is Apex Auto India Ltd.
Electronics and Information Technology: Special concession is given for electronics, telecom, and
informatics (software) industries to be set up in Dharwad. The companies are eligible for 100% sales
tax exemption (KST & CST) on output for a period of 6 years. Telcon is the major player in the sector.
Agriculture and Food Processing: Presence of many subsidiary agricultural industries such as
pickle making and cotton ginning and pressing, gives a thrust to this sector. The district has the
second highest number of SSI units in this sector. The fertile soil along with good monsoon showers
allows farmers to grow crops like chilli, cotton, maize, wheat, onion, mango, and food grains.
Signifying the scope of the sector.
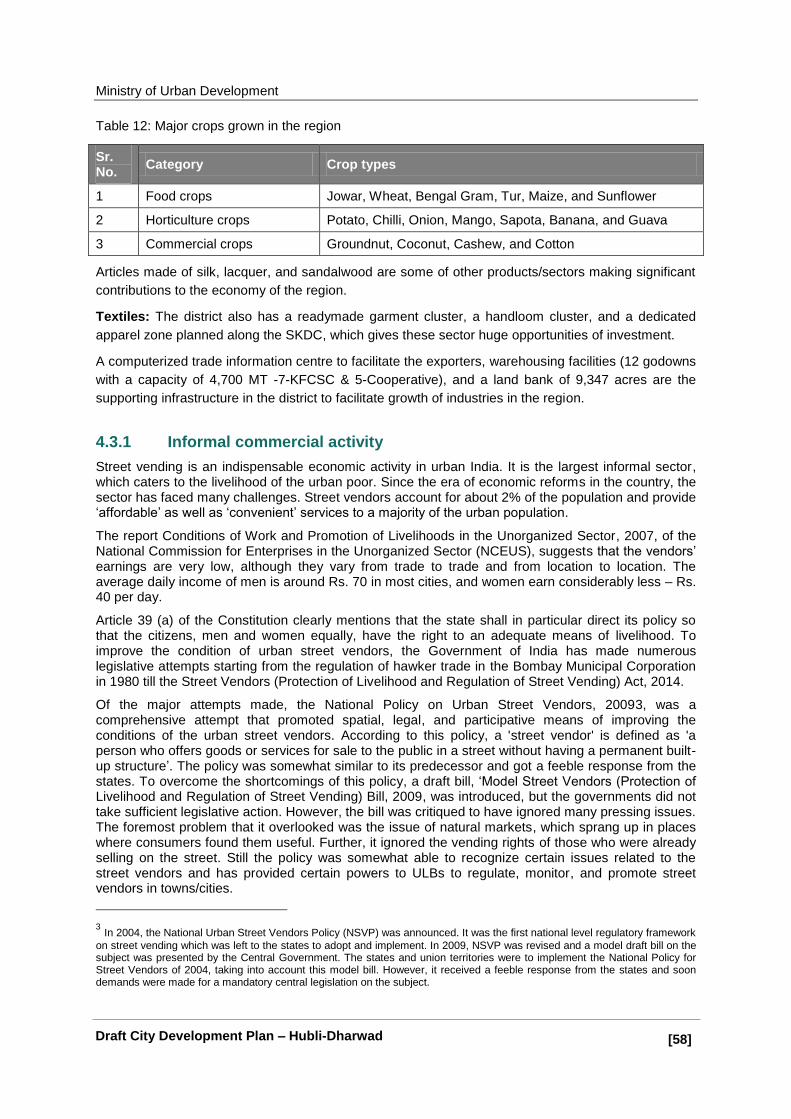
Ministry of Urban Development
[58]] Draft City Development Plan – Hubli-Dharwad
Table 12: Major crops grown in the region
Sr. No.
Category Crop types
1 Food crops Jowar, Wheat, Bengal Gram, Tur, Maize, and Sunflower
2 Horticulture crops Potato, Chilli, Onion, Mango, Sapota, Banana, and Guava
3 Commercial crops Groundnut, Coconut, Cashew, and Cotton
Articles made of silk, lacquer, and sandalwood are some of other products/sectors making significant
contributions to the economy of the region.
Textiles: The district also has a readymade garment cluster, a handloom cluster, and a dedicated
apparel zone planned along the SKDC, which gives these sector huge opportunities of investment.
A computerized trade information centre to facilitate the exporters, warehousing facilities (12 godowns
with a capacity of 4,700 MT -7-KFCSC & 5-Cooperative), and a land bank of 9,347 acres are the
supporting infrastructure in the district to facilitate growth of industries in the region.
4.3.1 Informal commercial activity
Street vending is an indispensable economic activity in urban India. It is the largest informal sector, which caters to the livelihood of the urban poor. Since the era of economic reforms in the country, the sector has faced many challenges. Street vendors account for about 2% of the population and provide ‗affordable‘ as well as ‗convenient‘ services to a majority of the urban population.
The report Conditions of Work and Promotion of Livelihoods in the Unorganized Sector, 2007, of the National Commission for Enterprises in the Unorganized Sector (NCEUS), suggests that the vendors‘ earnings are very low, although they vary from trade to trade and from location to location. The average daily income of men is around Rs. 70 in most cities, and women earn considerably less – Rs. 40 per day.
Article 39 (a) of the Constitution clearly mentions that the state shall in particular direct its policy so that the citizens, men and women equally, have the right to an adequate means of livelihood. To improve the condition of urban street vendors, the Government of India has made numerous legislative attempts starting from the regulation of hawker trade in the Bombay Municipal Corporation in 1980 till the Street Vendors (Protection of Livelihood and Regulation of Street Vending) Act, 2014.
Of the major attempts made, the National Policy on Urban Street Vendors, 20093, was a comprehensive attempt that promoted spatial, legal, and participative means of improving the conditions of the urban street vendors. According to this policy, a 'street vendor' is defined as 'a person who offers goods or services for sale to the public in a street without having a permanent built-up structure‘. The policy was somewhat similar to its predecessor and got a feeble response from the states. To overcome the shortcomings of this policy, a draft bill, ‗Model Street Vendors (Protection of Livelihood and Regulation of Street Vending) Bill, 2009, was introduced, but the governments did not take sufficient legislative action. However, the bill was critiqued to have ignored many pressing issues. The foremost problem that it overlooked was the issue of natural markets, which sprang up in places where consumers found them useful. Further, it ignored the vending rights of those who were already selling on the street. Still the policy was somewhat able to recognize certain issues related to the street vendors and has provided certain powers to ULBs to regulate, monitor, and promote street vendors in towns/cities.
3 In 2004, the National Urban Street Vendors Policy (NSVP) was announced. It was the first national level regulatory framework
on street vending which was left to the states to adopt and implement. In 2009, NSVP was revised and a model draft bill on the subject was presented by the Central Government. The states and union territories were to implement the National Policy for Street Vendors of 2004, taking into account this model bill. However, it received a feeble response from the states and soon demands were made for a mandatory central legislation on the subject.

Ministry of Urban Development
[59]] Draft City Development Plan – Hubli-Dharwad
The policy recognized and explicated the positive role of street vendors in providing essential commodities to people at affordable prices and at convenient places. It also recognized the need for regulation of street vending by way of designated ‗restriction-free vending‘, 'restricted vending' and ‗no vending‘ zones based on certain objective principles. Overall, the policy meant to foster a congenial environment for the urban street vendors to carry out their vocation and at the same time, ensure that it does not lead to overcrowding or unsanitary conditions at public spaces and streets.
4.3.2 Specific norms for the ULBs
I. Spatial planning norms - Demarcation of vending zones
The demarcation of hawking zones should be city/town specific. The master plans, zonal plans,
etc., should take into account the natural propensity of the street vendors to locate in certain
places at certain times in response to patterns of demand for their goods/services.
City authorities should provide sufficient spaces, designated as ‗vendors markets‘, in layout plans
at locations of natural markets, and they should permit mobile vending in all areas even outside
the designated markets, unless designated as ‗no-vending zone‘ through a participatory process.
Designation of vendors markets/no-vending zones should not be left to the sole discretion of any
civic or police authority, but must be accomplished by a participatory process by a Town Vending
Committee (which for large towns/cities may be constituted on the basis of wards) whose
membership may be as follows: municipal authority, traffic and local police, public land owning
authority, associations, representatives from associations of street vendors, representatives from
lead nationalized banks/commercial banks.
II. Quantitative norms - refer to the norms on amount of space and facilities to be provided for
vendors‘ markets by the civic authorities. At the town/city level, enough space should be
designated for vendor markets at least to the extent of 2% to 2.5% of the total city population. The
facilities required at the vendor markets invariably include solid waste disposal facilities, public
toilets to maintain cleanliness4, Aesthetic design of mobile stalls/ push carts, electricity, drinking
water facilities, protective covers to protect their wares as well as themselves from heat, rain and
dust, and storage facilities including cold storages.
III. Regulatory process - The policy thrusts on having a system of registration of hawkers and non-
discretionary regulation of access to public spaces in accordance with the planning standards and
nature of trade/service. The Town Vending Committee5/Ward Vending Committee has the
power to register the vendors6. All vendors in each city should be registered at a nominal fee and
the registration should be renewed after every three years. The TVC should issue identity cards to
the vendors and charge a monthly fee for access to various services. For better regulation, there
should be a direct linkage between the urban local bodies (ULBs) and hawkers for the collection
of registration fee, monthly maintenance charges7, and fines, if any. The Town Vending
Committee/Ward Vending Committee should monitor the hawking activity of a particular ward and
4 In spite of the government‘s fervent concern regarding public sanitation and safety, a number of public events, bazaars,
religious festivals, and other activities take place on our streets with the whole-hearted approval of government authorities.
5 The committee has no fixed tenure and there is no removal mechanism mentioned.
6 The National Policy on Urban Street Vendors, 2009. Under Provision 4.5.4 of this policy, the municipal authority is under an
obligation to undertake a comprehensive census of the existing vendors in consultation with the Town Vending Committee for the purpose of granting them lease to vend. Hence, we see that here the burden of registration is on the municipality, which significantly smoothens the exercise of registration and to a large extent simplifies the process for street vendors.
7 Every street vendor is under an obligation to pay periodic maintenance charges for the civic amenities and facilities provided
in the vending zone, as may be determined by the local authority. Thus, these provisions impose a monetary burden on street vendors.

Ministry of Urban Development
[60]] Draft City Development Plan – Hubli-Dharwad
the quality of the services provided, take corrective action, if required, report to the city level
committee, if required, and recommend revaluation/changes in the specified norms for hawking.8
4.4 Workforce Participation Rate
4.4.1 State work participation
According to Census 2011, the work participation rate (WPR) in the state is 2,78,72,597 persons constituting 45.6% of the total population have enumerated themselves as workers. 59% of the total male population and 31.8% of the total female population are in the workforce.
As per Census 2001, the WPR in the state was 44.5% comprising 56.6% male workers and 31.9% female workers. The WPR in 2011 increased in general, irrespective of gender and more significantly in urban areas (4%), compared to 2001. while the female WPR has marginally declined in rural Karnataka.
4.4.2 HDMC work participation rate
According to Census 2011, the workforce participation in Hubli-Dharwad city is about 35.4%. The workforce participation rate of urban Dharwad (Hubli-Dharwad) in 1991 was 29.7%. The positive factor is the growth in workforce participation rate in urban areas by about 4% over the last decades. In terms of classification of workers, the percentage of main workers has increased.
Figure 18: Work participation profile - Kollam 1980-2011
4.5 Worker Classification
Hubli being the economic centre of the region, it is providing employment which is more regular in nature as the table shows 90% of the workers are in the main category. It is also evident that the percentage of women in the total workforce is about 15%, while among male it is 55%. Also, it is interesting to note that the proportion of women among the marginal workers is comparatively high in the city. The city also has a large dependent population, especially the elderly, females, and children.
8 Concentration of powers in the hands of the municipal authorities that do not have any representation of street vendors
29.7
33.2
35.4
26
27
28
29
30
31
32
33
34
35
36
1991 2001 2011
Work Particiation Rate
WPR

Ministry of Urban Development
[61]] Draft City Development Plan – Hubli-Dharwad
Table 13: Occupational structure
Sr. No.
Workers
Non-Workers Category Main Marginal Total
No % No % No % No %
1 Total 298264 89.29 35773 10.71 334037 35.4 609751 64.6
2 Male 239500 91.23 23034 8.77 262534 55.2 211984 44.54
3 Female 58764 82.18 12739 17.82 71503 15.3 397767 85.02
Source: Census 2011
The figure below clearly highlights that in the last two decades, there has been a considerable increase in the number of main workers and hence the total workforce. However, the number of non-workers has also increased and it is a matter of concern and needs to be studied further.
Figure 19: Year-wise distribution of workers and non-workers in Hubli-Dharwad
It is evident that the proportion of the main workers has increased from 28.6% to 32% in during 1991-2011. Also, the share of marginal workers has increased from 0.6% to 3.79% in the last two decades. In absolute terms, the number of marginal workers has increased from 4,083 to 35,773. This indicates the growth of employment in unorganized sectors.
Table 14: Change in the occupational structure - 199-2011
Classification of workers 1991 2001 2011
Population % Population %
Main workers 181723 28 232120 29.5 298264 31.6
Marginal workers 4083 0.6 18692 2.4 35773 3.79
Non-workers 462492 71.3 535206 68.1 609751 64.61
Grand total 648298 100 786018 100 943788 100
Source: Census 1991-2011
4.6 Horticulture
The climate and soil in this region are conducive to horticultural segments. Dharwad district is blessed with 3 agro-climatic zones, high-end research-based agriculture universities, and testing labs. Chilli, onion, mango, guava, and sapota are the dominant varieties grown in the region. Mango, sapota, coconut, cashew, and guava are grown widely in Hubli and Dharwad talukas. The region has the
181723
4083
185806
462492
232120
18692
250812
535206
298264
35773
334037
609751
0
100000
200000
300000
400000
500000
600000
700000
Main Marginal Total Workers Non workers
1991 2001 2011

Ministry of Urban Development
[62]] Draft City Development Plan – Hubli-Dharwad
potential for enhancing agriculture and horticulture activities in the region. There is scope for introducing floriculture and new crops/herbs of medicinal, aromatic qualities.
Animal husbandry is also a regular activity in this region. Animal husbandry is a growing sector in the district with increasing production trends. Milk production in the district has increased from 49,523 to 74,800 tons during 2002-06; also, the region has many milk cooperatives. Egg production has increased from 12.3 to 17.9 mn and meat production increased from 2,578 to 3,890 tons. Also, the district has 109 veterinary institutions, 2 livestock breeding farms, and 1 semen collection centre (source: KSAPPEC).
4.7 Key Issues
There is a decline in the primary and secondary sector activities in terms of employment and
economic contribution.
Many of the industries in the manufacturing sectors are being closed down.
There is no focused plan at the ULB level for local economic development.
Land is reserved for industrial development and commercial development; however, growth is
not happening as envisaged in the master plan due to lack of supporting infrastructure
facilities.
The city has the second highest population in the state; however, its economic contribution is
only the fourth highest in the state.
The city is not getting priority for investments. Also, new developments are moving towards
Belgaum, Mysore, Bijapur, etc.
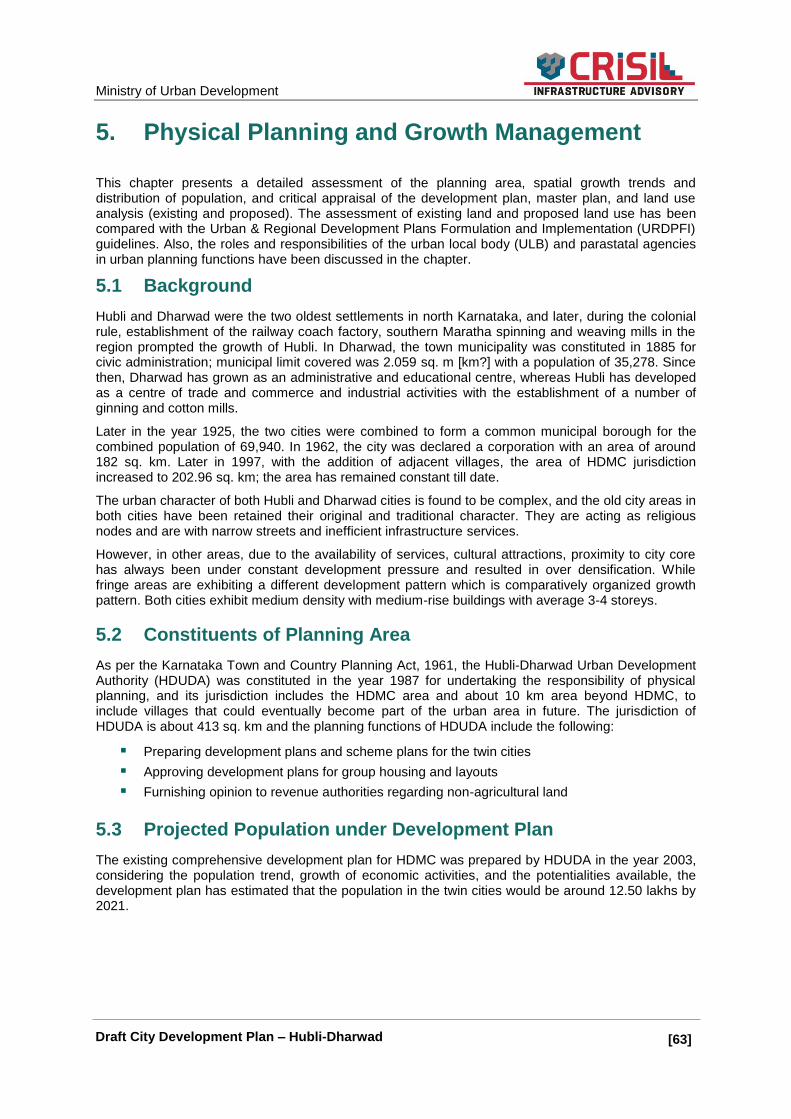
Ministry of Urban Development
[63]] Draft City Development Plan – Hubli-Dharwad
5. Physical Planning and Growth Management
This chapter presents a detailed assessment of the planning area, spatial growth trends and distribution of population, and critical appraisal of the development plan, master plan, and land use analysis (existing and proposed). The assessment of existing land and proposed land use has been compared with the Urban & Regional Development Plans Formulation and Implementation (URDPFI) guidelines. Also, the roles and responsibilities of the urban local body (ULB) and parastatal agencies in urban planning functions have been discussed in the chapter.
5.1 Background
Hubli and Dharwad were the two oldest settlements in north Karnataka, and later, during the colonial rule, establishment of the railway coach factory, southern Maratha spinning and weaving mills in the region prompted the growth of Hubli. In Dharwad, the town municipality was constituted in 1885 for civic administration; municipal limit covered was 2.059 sq. m [km?] with a population of 35,278. Since then, Dharwad has grown as an administrative and educational centre, whereas Hubli has developed as a centre of trade and commerce and industrial activities with the establishment of a number of ginning and cotton mills.
Later in the year 1925, the two cities were combined to form a common municipal borough for the combined population of 69,940. In 1962, the city was declared a corporation with an area of around 182 sq. km. Later in 1997, with the addition of adjacent villages, the area of HDMC jurisdiction increased to 202.96 sq. km; the area has remained constant till date.
The urban character of both Hubli and Dharwad cities is found to be complex, and the old city areas in both cities have been retained their original and traditional character. They are acting as religious nodes and are with narrow streets and inefficient infrastructure services.
However, in other areas, due to the availability of services, cultural attractions, proximity to city core has always been under constant development pressure and resulted in over densification. While fringe areas are exhibiting a different development pattern which is comparatively organized growth pattern. Both cities exhibit medium density with medium-rise buildings with average 3-4 storeys.
5.2 Constituents of Planning Area
As per the Karnataka Town and Country Planning Act, 1961, the Hubli-Dharwad Urban Development Authority (HDUDA) was constituted in the year 1987 for undertaking the responsibility of physical planning, and its jurisdiction includes the HDMC area and about 10 km area beyond HDMC, to include villages that could eventually become part of the urban area in future. The jurisdiction of HDUDA is about 413 sq. km and the planning functions of HDUDA include the following:
Preparing development plans and scheme plans for the twin cities
Approving development plans for group housing and layouts
Furnishing opinion to revenue authorities regarding non-agricultural land
5.3 Projected Population under Development Plan
The existing comprehensive development plan for HDMC was prepared by HDUDA in the year 2003, considering the population trend, growth of economic activities, and the potentialities available, the development plan has estimated that the population in the twin cities would be around 12.50 lakhs by 2021.
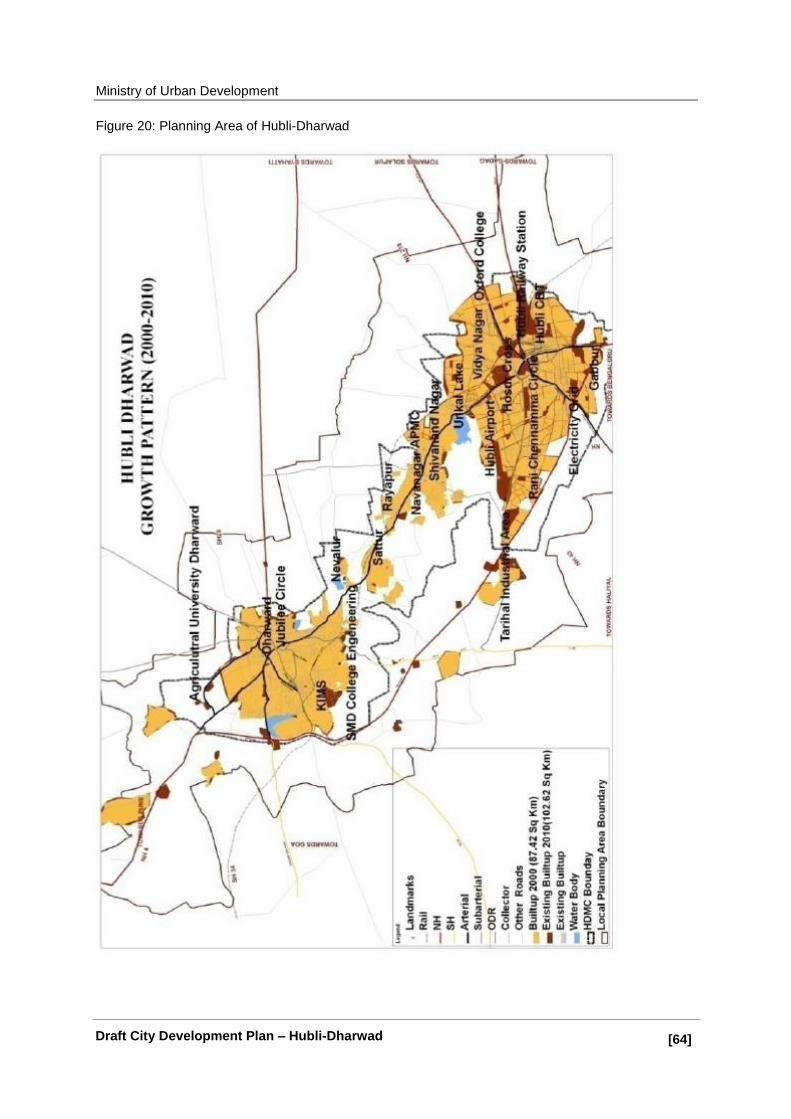
Ministry of Urban Development
[64]] Draft City Development Plan – Hubli-Dharwad
Figure 20: Planning Area of Hubli-Dharwad

Ministry of Urban Development
[65]] Draft City Development Plan – Hubli-Dharwad
5.4 Spatial Growth Trends
As envisaged in the comprehensive development plan, recently the growth is promoted along the Hubli Dharwad high way. This region offers good connectivity to both cities and also easy access to the educational and economic centres. Navanagar, the area between the two cities, is emerging as a major urban centre.
The BRTS proposed along this network is expected to enhance the connectivity to both cities and facilitate growth in the region along the corridor. The scope for TOD in and around Navanagar is also being assessed along with the BRTS project. Also, the areas along Gokul Road and Keshavpur are developing rapidly. The area near Vidhyanagar being an educational hub, the entire economy of the locality revolves around it. There are mainly shops to cater to the needs of the educational institutions and students, like food joints, internet café, bookshops, photocopying and printing centres, and garment stores.
A multi-modal/integrated logistics transport centre with warehouses, inland container depots, domestic railhead, and air cargo centres are proposed in 56 acres near Anchatgeri village on Karwar road in Hubli. The project would be implemented through the PPP model and is expected to help in reducing traffic congestion in Hubli.
5.5 Spatial Distribution of Population
The overall density of the city is around 4,000 persons per sq. km. However, the map above indicates that the wards in the core city area of both the cities are experiencing very high density, more than 60,000 persons/sq. km. This implies the need to regulate growth within the old city areas of both Hubli and Dharwad. However, the density decreases towards the outskirts.
The average density in the city peripheral areas is 4,000-10,000 people per sq. km; however, the average density in Hubli is higher than that in the Dharwad city core. Also, the percentage developed area in Hubli is higher than that in Dharwad. The newly merged areas such as Keshavpur and corridor along Gokul road are experiencing medium density growth.
However, the area in between Hubli and Dharwad remains thinly populated with an average density less than 4,000 persons per sq. km. These areas have hinterlands where agriculture is practiced. It is clear from the map that the area in between the cities remains underdeveloped and a huge reserve of developable land is available within the HDMC limits.

Ministry of Urban Development
[66]] Draft City Development Plan – Hubli-Dharwad
Figure 21: Ward-wise density pattern

Ministry of Urban Development
[67]] Draft City Development Plan – Hubli-Dharwad
5.6 Critical Appraisal of the Master Plan/Development Plan
5.6.1 Land use analysis
The first comprehensive development plan was successful in promoting development along the highway between the cities, but the plan did not directly address the growth trends in the urban area. Therefore, the plan was revised in the year 2003 to address the developmental issues and to meet the future requirements. CDP 2003 for Hubli-Dharwad envisaged a continuous development between the twin cities by developing a system parallel to the old highway in the form of a ring road.
As per the comprehensive development plan, the percentage of land under residential use has gone up from 25% to 31% between 1986 and 2000. However, this is still low compared to the suggested norm of 35% to 40% of land under residential use, indicating the availability of potential land for residential development. Growth in commercial land use is also not happening as envisaged in the comprehensive development plan due to overcrowding in the existing CBD at Hubli and lack of demand for commercial space in CBD at Navanagar. Similarly, insufficient and inefficient infrastructural support for the new/existing industrial establishments has also reflected in the growth pattern.
Table 15: Hubli-Dharwad: Land-use distribution in 1986 and 2000
Sr. No. Land Use 1986 2000
Category Area (Ha) % Area (Ha) %
1 Residential 1,356 25% 3,196 31%
2 Commercial 194 4% 336 3%
3 Industrial 296 5% 528 5%
4 Public and Semi-Public 719 13% 1,750 17%
5 Recreational 409 8% 663 6%
6 Transportation and Communication 1,531 28% 2,269 22%
7 Water Bodies, Agricultural & Others 935 17% 1,632 16%
Total 5,440 100 10,374 100
Source: Comprehensive Development Plan (2003), HDUDA
The revised comprehensive development plan has projected a population of 12.5 lakhs by 2021. The growth rate envisioned in Comprehensive Development Plan 2021 gives the residential sector prime importance with the focus on enhancing commercial areas. The public and transportation uses remain more or less the same therefore aiming at a higher density. The expansion of residential and institutional areas however remains along the old highway between the twin cities. The comprehensive development plan claims that the Zoning Regulations were simplified to encourage planned development and to make it easy for the public to get the approval for building and layout plans.

Ministry of Urban Development
[68]] Draft City Development Plan – Hubli-Dharwad
Figure 22: Land-use Plan 2000
Ministry of Urban Development
[69]] Draft City Development Plan – Hubli-Dharwad
Figure 23: Proposed land use - 2021

Ministry of Urban Development
[70]] Draft City Development Plan – Hubli-Dharwad
5.6.2 Comparison with URDPFI guidelines
As per the population projections carried out in the demography section, the city would have a population of 11.6 lakhs by 2021. Hence, the comparison has been carried out with URDPFI guidelines for the medium towns. Following table presents the land use comparison with the URDPFI guidelines.
Table 16: Land use comparison
Sr. No.
Land Use 2021 proposed URDPFI Met the
benchmark
Category Area (Ha) %
1 Residential 5,717 42% 35-40% Yes
2 Commercial 835 6% 4-5% Yes
3 Industrial 738 5% 10-12% No
4 Public and Semi-Public 2,021 15% 12-14% Yes
5 Recreational 1,431 10% 18-20% No
6 Transportation and Communication 3,005 22% 12-14% Yes
7 Water Bodies, Agricultural & Others Balance
Total 13,747 100
Source: Comprehensive Development Plan (2003), HDUDA
As indicated in the table above, the proposed land use meets the requirement in the case of residential, commercial, and transportation categories. Interestingly, unlike in other major cities, the percentage share of transportation is 22% and is very impressive for the development of the new roads and widening of existing roads. However, in other categories like industrial and recreational categories, the proposed land use share is grossly low with respect to the URDPFI guidelines.
5.6.3 Development proposals
The comprehensive land use plan recognized that land is a key resource and therefore provided enough flexibility to accommodate the changing needs. Comprehensive Development Plan 2021 has been prepared to cater to the needs of 1.25 million population. The primary objective of the plan is to bridge the gap between Hubli and Dharwad. The CDP [use either the full form or the abbreviation consistently throughout the document.] focused on the physical, geographic, historic, and cultural characteristics of the city, its habitat, and sectoral development plans and proposed harmonious development. The plan suggests predominant development of residential and recreational activities between Unkal in Hubli and Tadasinakoppa village in Dharwad all along the peripheral roads. The major proposals include:
a) Road between Tarihal and Kalghatgi road via Lakhamanahalli Scheme of HDUDA and road
between Gamangatti village and Housing Board sites and service scheme at Sattur
b) Commercial, institutional, and industrial developments predominantly along NH4 and the rail
corridor
c) A CBD in Sutgatti-Rayapur area near HDUDA Office Complex
d) Southwest Railway Zonal Headquarters be located near Amargol Railway station
e) An information technology park in KIADB land in Rayapur area
f) Children‘s park in Sutagatti area to be developed under PPP
g) Regional park area on either side of catchments area of the Unkal Tank
h) The government land on the elevated terrain near Gamanagatti Village is transferred to H-D
UDA for developing a sports centre and the Nrupatunga Hill at Hubli is developed as a picnic
spot in joint sector.
i) Works centre with horticultural and agro-based industries at Lakhamanahalli industrial area
for the benefit of fruit growers and agriculturists in the area

Ministry of Urban Development
[71]] Draft City Development Plan – Hubli-Dharwad
j) The sites in Lakhamanahalli Scheme for housing the poor and industrial labours of
Lakhamanahalli industrial area
5.7 Urban Planning Functions and Reforms
Revision of Building Byelaws to Streamline Approval Process: With the introduction of the
Building Plan Approval Management System (BPAMS) with Automatic Development Control
Regulations by HDMC, residents can now get building permission within a week. Earlier they had to
wait for over 21 days to get the same.
Now, once a resident applies for building permission, the documents and details furnished by him or her are uploaded to the corporation's database. If any violations of guidelines are found in the documents, the applicant is called in for clarification. If the documents conform to the guidelines, then the authorities will courier the building permission to the applicant within seven days. The system has been made mandatory for sites with area of over 150 sq. m in approved layouts in Hubli and Dharwad from April 1, 2010.
Revision of Building Byelaws for Rainwater Harvesting and Water Conservation: The Karnataka
Housing Board (KHB) has made rainwater harvesting compulsory in all its layouts in Hubli and
Dharwad.
If owners of new buildings fail to set up a rainwater harvesting (RWH) facility in their buildings, HMDC will not issue completion certificate to them. HDMC had in 2004 enacted a building byelaw, instructing the owners to ensure a RWH facility in their new buildings.
Earmarking of Land for EWS/LIG Housing + System of Cross Subsystem: This is policy matter that needs to be decided at the state level. So far, no government order has been received by HDMC for earmarking land for EWS/LIG is only on development on Government lands.
Byelaws for Reuse of Recycled Water: No Progress, the byelaws to be formulated at the state level.
5.8 Roles and Responsibilities of ULB and Parastatals
HDMC: As per the amendment of the KM Act, 1976, in 1995, the function of urban planning including
town planning has been transferred to the ULB, but in the Hubli-Dharwad region (including the twin
cities and surroundings), the town planning functions are performed by multiple departments. The
master plan/land use plan is prepared by HDUDA in consultation with the Karnataka State Town
Planning Board, while the implementation and monitoring are the responsibility of HDMC. In HDMC,
the Town Planning section looks after the planning related activities like sanctioning the building
approval and monitoring compliance with DCR.
Hubli-Dharwad Urban Development Authority (HDUDA): HUDA is the agency responsible for undertaking the physical planning activities including the preparation of master plans, TP schemes, infrastructure development in HDUDA area, etc. The specific of HDUDUA includes preparing development plans and scheme plans for the twin cities, approving development plans for group housing and layouts, and furnishing opinion to revenue authorities regarding non-agricultural land.
District Planning Committee (DPC): DPC was constituted in Dharwad district to coordinate the
integrated development of the region, but it is not functioning efficiently.
5.9 Key Issues
The spatial isolation and unequal distribution of infrastructure between the twin cities have
resulted in adding upon to the pressure of existing city centres and in non-contiguous
development between Hubli and Dharwad.
The development plan has proposed for commercial growth between the cities and in

Ministry of Urban Development
[72]] Draft City Development Plan – Hubli-Dharwad
Navanagar; however, lack of basic infrastructure in the area resulted in the decreasing
demand for development in these areas.
The development along the radial roads without complementary growth of ring/orbital roads is
resulting in locking up of developable plots in and around the city.
Also, the horizontal growth of residential areas has resulted in increased land prices in the
peri-urban areas.
HDMC is the agency responsible for layout approval and issue of the building permit in
accordance with land use proposed in the development plan. However, many illegal housing
constructions are taking place on the outskirts of both Hubli and Dharwad without the
permission from concern authorities. Agricultural lands are being converted into housing
layouts without proper approval from HDMC or HDUDA.
The land use reserved for the recreational purpose is about 10%, while as per URDPFI
guidelines, it is 20%. The city has many developable plots that could be developed for
recreational use.
The function of urban planning has been transferred to the ULBs, but the development plans
in the twin cities are prepared by HDUDA. There is lack of coordination between HDMC and
HDUDA in the preparation of plans and implementation of the same. Also, there is lack of
clarity on the urban planning function, implementation of the master plan, and framing of the
various building byelaws.
The team at HDMC and HDUDA lacks trainings on preparation of plans and land use
regulations and various building byelaws.
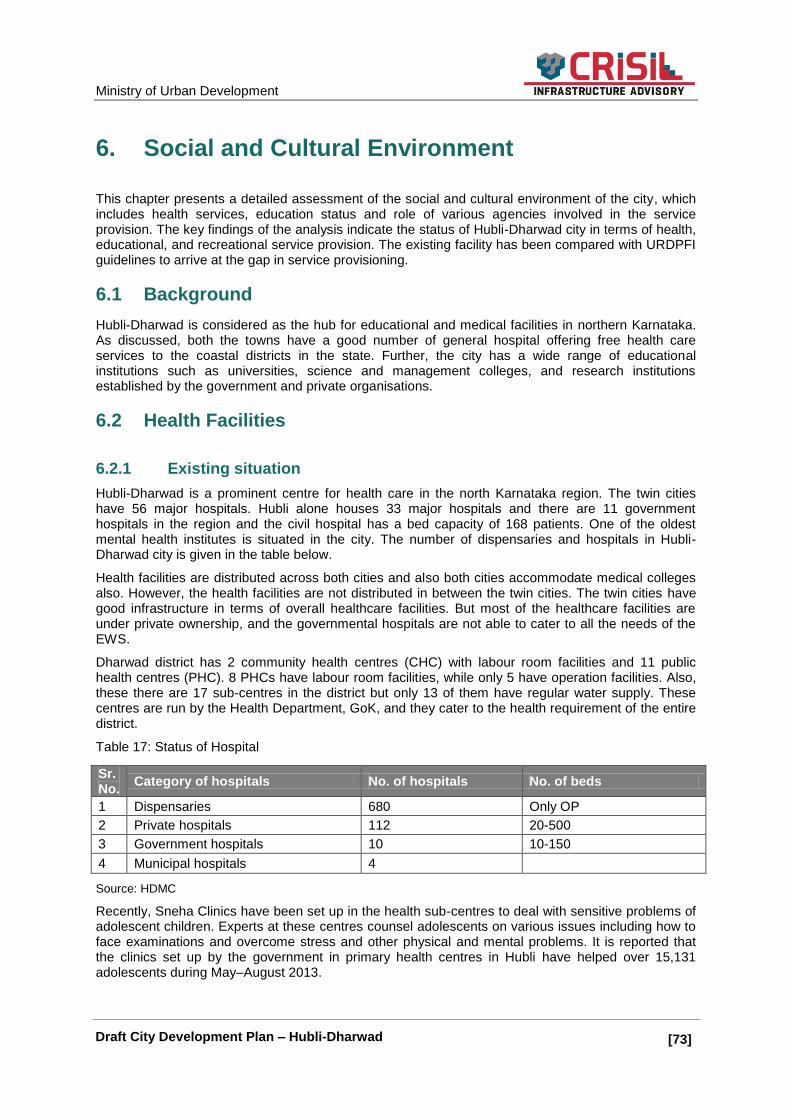
Ministry of Urban Development
[73]] Draft City Development Plan – Hubli-Dharwad
6. Social and Cultural Environment
This chapter presents a detailed assessment of the social and cultural environment of the city, which includes health services, education status and role of various agencies involved in the service provision. The key findings of the analysis indicate the status of Hubli-Dharwad city in terms of health, educational, and recreational service provision. The existing facility has been compared with URDPFI guidelines to arrive at the gap in service provisioning.
6.1 Background
Hubli-Dharwad is considered as the hub for educational and medical facilities in northern Karnataka. As discussed, both the towns have a good number of general hospital offering free health care services to the coastal districts in the state. Further, the city has a wide range of educational institutions such as universities, science and management colleges, and research institutions established by the government and private organisations.
6.2 Health Facilities
6.2.1 Existing situation
Hubli-Dharwad is a prominent centre for health care in the north Karnataka region. The twin cities have 56 major hospitals. Hubli alone houses 33 major hospitals and there are 11 government hospitals in the region and the civil hospital has a bed capacity of 168 patients. One of the oldest mental health institutes is situated in the city. The number of dispensaries and hospitals in Hubli-Dharwad city is given in the table below.
Health facilities are distributed across both cities and also both cities accommodate medical colleges also. However, the health facilities are not distributed in between the twin cities. The twin cities have good infrastructure in terms of overall healthcare facilities. But most of the healthcare facilities are under private ownership, and the governmental hospitals are not able to cater to all the needs of the EWS.
Dharwad district has 2 community health centres (CHC) with labour room facilities and 11 public health centres (PHC). 8 PHCs have labour room facilities, while only 5 have operation facilities. Also, these there are 17 sub-centres in the district but only 13 of them have regular water supply. These centres are run by the Health Department, GoK, and they cater to the health requirement of the entire district.
Table 17: Status of Hospital
Sr. No.
Category of hospitals No. of hospitals No. of beds
1 Dispensaries 680 Only OP
2 Private hospitals 112 20-500
3 Government hospitals 10 10-150
4 Municipal hospitals 4
Source: HDMC
Recently, Sneha Clinics have been set up in the health sub-centres to deal with sensitive problems of adolescent children. Experts at these centres counsel adolescents on various issues including how to face examinations and overcome stress and other physical and mental problems. It is reported that the clinics set up by the government in primary health centres in Hubli have helped over 15,131 adolescents during May–August 2013.

Ministry of Urban Development
[74]] Draft City Development Plan – Hubli-Dharwad
6.2.2 Basic public health indicators
According to the task force report on health and family welfare, the infant mortality rate (IMR) for females is quite high in Dharwad, Bellary, and Bidar districts. Similarly, the indicators such as Institutional delivery, children dying below 5 years etc. are also not favourable in the city. Besides, Dharwad has a sex ratio of 948 females per 1000 males, one of the three lowest places in the state, the other two being Haveri (942) and Bengaluru (906). The following figure depicts the performance of the health indicator at various places.
Figure 24: Performance comparison of health indicator
6.2.3 Disease pattern
A survey carried out by the Centre for Global Health Research reveals that the 57% cause of death in the city can be attributed to chronic diseases like heart problems, lung problems, stroke, and cancer, while 31% of death is caused by infectious diseases. Reports from government hospitals and health centres indicate that the incidence of waterborne diseases, respiratory diseases, and lifestyle disease is increasing among the urban dwellers in Dharwad district. This can be attributed to the deteriorated environmental conditions caused by disposal of untreated sewerages to open land, air pollution etc.
6.2.4 Role of HDMC in health programmes
The Directorate of Health, GoK, is responsible for providing major health facilities in the city. HDMC assists the state Health Department in campaigning, providing the required infrastructure, enlisting beneficiaries, etc., for various health programmes. HDMC‘s health-related obligatory functions are restricted to a few conservancies, but HDMC is responsible for the functioning of municipal hospitals in the city.
Table 18: Health facilities owned by HDMC
Sr. No.
Category Numbers No. of doctors
Bed capacity
1 Maternity-Child Welfare Centres 5 11 180
2 Hospitals 5 11 180
3 Health Centres 12 12
4 Dispensaries 5
5 PPC 3 4
Source: HDMC
2
25
18.8
5.7 2.7
65
23.5
7.9 2.5
55
22.1
7.2 3.2
63
25
8.1
0
10
20
30
40
50
60
70
Total fertility rate Infant mortality rate Crude Birth rate Crude Death rate
Hubli-Dharwad Dharwad District Karnataka India

Ministry of Urban Development
[75]] Draft City Development Plan – Hubli-Dharwad
Other responsibilities of HDMC include supervision of all hospitals in HDMC limits and functional control over employees in the health sector and authority for recommendations on health sector reforms etc. The Health Department of HDMC is responsible for public health-related activities such as:
Solid waste collection, conservancy, and sanitation
Carrying out the state/central government health-related programmes
Providing basic health facilities (essentially curative services)
Issuing birth and death certificates and maintaining relevant records
Preventing food adulteration
Monitoring and regulating trade licences
The only health centre owned by HDMC is in a deteriorate state with deteriorated infrastructure and shortage of qualified staffs. The higher income groups invariably use private sector services and therefore have least or no interest in improving the system.
6.2.5 Comparison with URDPFI norms
The existing healthcare facility has been compared with the URDPFI guidelines to identify the gap in the healthcare facilities. In the current situation, the number of dispensaries, nursing homes, polyclinics, and general hospitals is sufficient, and the existing facilities are on the higher side as compared to URDPFI guidelines. As per the guidelines, the city lacks veterinary hospitals, but has a few private dispensary facilities for pets. The nearest government veterinary hospital is 29 km from Hubli in Kalghatgi. Following table presents the existing status of health facilities and the comparison with URDPFI guidelines.
Table 19: The comparison of Health care facilities as per URDPFI guidelines
Healthcare facility URDPFI Guidelines Requirement as per guidelines
No. of facilities
Met the Benchmark
Dispensary 1 for 15000 population 63 680 Yes
Nursing home, child welfare and maternity centre
45000 to 1 lakh population 18 6 Yes
Polyclinic 1 for 1 lakh population 10 114 Yes
General Hospital (NBC) 1 for 2.5 lakh population 4 10 Yes
Diagnostic centre 1 for 0.5 lakh population 18 22 Yes
Veterinary hospital for pets and animals
1 for 5 lakh population 2 Nil No
Dispensary for pet animals and birds
1 for 1 lakh population 9 6 No
6.2.6 Key issues
The overall healthcare facilities are good in the twin cities. However, most of the health care
facilities are run by private owners, and the city has only limited public health care system.
Majority of the slum dwellers are dependent on the public health care systems.
The PHCs and other public aided health facilities are situated in the core of the city, and the slum dwellers are located in the outskirts of the cities and other residents living in between the cities doesn‘t have public health facilities within 3-5 kms.
The occurrence of waterborne diseases, respiratory diseases, and lifestyle diseases is increasing among the urban dwellers in Dharwad district. This can be attributed to the deteriorated environmental conditions caused by disposal of untreated sewerages to open land, air pollution etc.
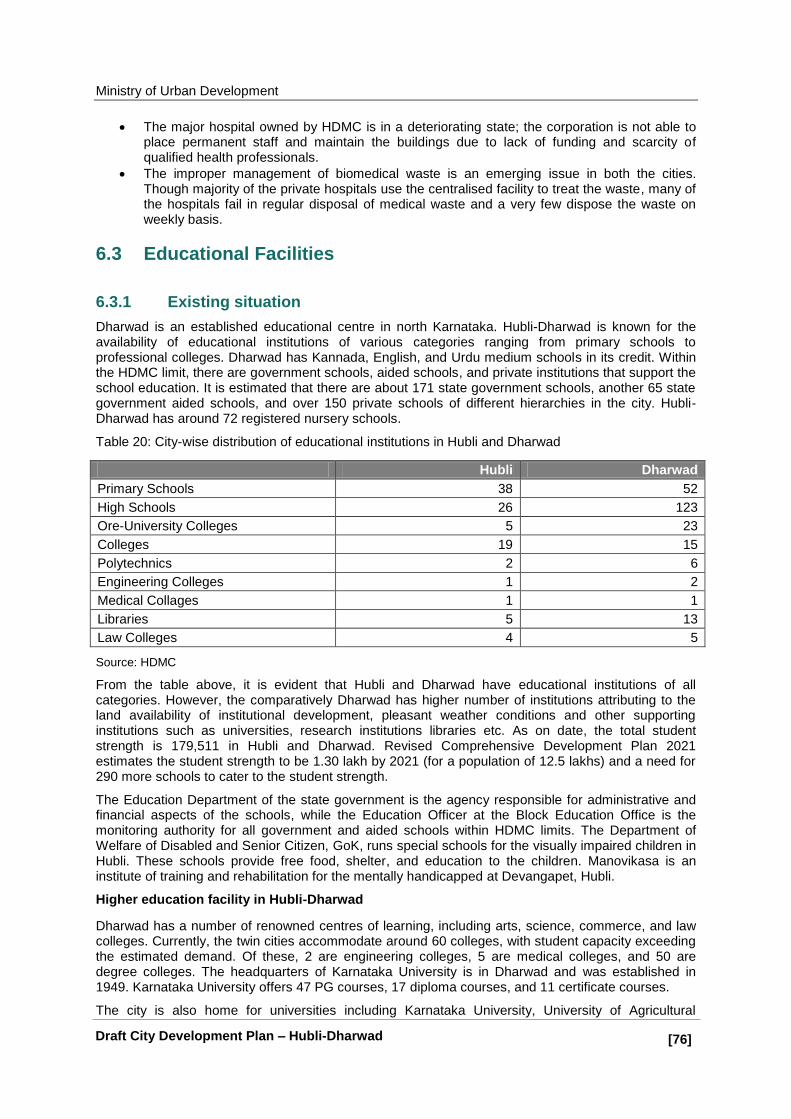
Ministry of Urban Development
[76]] Draft City Development Plan – Hubli-Dharwad
The major hospital owned by HDMC is in a deteriorating state; the corporation is not able to place permanent staff and maintain the buildings due to lack of funding and scarcity of qualified health professionals.
The improper management of biomedical waste is an emerging issue in both the cities. Though majority of the private hospitals use the centralised facility to treat the waste, many of the hospitals fail in regular disposal of medical waste and a very few dispose the waste on weekly basis.
6.3 Educational Facilities
6.3.1 Existing situation
Dharwad is an established educational centre in north Karnataka. Hubli-Dharwad is known for the availability of educational institutions of various categories ranging from primary schools to professional colleges. Dharwad has Kannada, English, and Urdu medium schools in its credit. Within the HDMC limit, there are government schools, aided schools, and private institutions that support the school education. It is estimated that there are about 171 state government schools, another 65 state government aided schools, and over 150 private schools of different hierarchies in the city. Hubli-Dharwad has around 72 registered nursery schools.
Table 20: City-wise distribution of educational institutions in Hubli and Dharwad
Hubli Dharwad
Primary Schools 38 52
High Schools 26 123
Ore-University Colleges 5 23
Colleges 19 15
Polytechnics 2 6
Engineering Colleges 1 2
Medical Collages 1 1
Libraries 5 13
Law Colleges 4 5
Source: HDMC
From the table above, it is evident that Hubli and Dharwad have educational institutions of all categories. However, the comparatively Dharwad has higher number of institutions attributing to the land availability of institutional development, pleasant weather conditions and other supporting institutions such as universities, research institutions libraries etc. As on date, the total student strength is 179,511 in Hubli and Dharwad. Revised Comprehensive Development Plan 2021 estimates the student strength to be 1.30 lakh by 2021 (for a population of 12.5 lakhs) and a need for 290 more schools to cater to the student strength.
The Education Department of the state government is the agency responsible for administrative and financial aspects of the schools, while the Education Officer at the Block Education Office is the monitoring authority for all government and aided schools within HDMC limits. The Department of Welfare of Disabled and Senior Citizen, GoK, runs special schools for the visually impaired children in Hubli. These schools provide free food, shelter, and education to the children. Manovikasa is an institute of training and rehabilitation for the mentally handicapped at Devangapet, Hubli.
Higher education facility in Hubli-Dharwad
Dharwad has a number of renowned centres of learning, including arts, science, commerce, and law colleges. Currently, the twin cities accommodate around 60 colleges, with student capacity exceeding the estimated demand. Of these, 2 are engineering colleges, 5 are medical colleges, and 50 are degree colleges. The headquarters of Karnataka University is in Dharwad and was established in 1949. Karnataka University offers 47 PG courses, 17 diploma courses, and 11 certificate courses.
The city is also home for universities including Karnataka University, University of Agricultural

Ministry of Urban Development
[77]] Draft City Development Plan – Hubli-Dharwad
Sciences, Dharwad and Karnataka Law University. The renowned institutions for higher education in the city are as follows:
New proposed IIIT (Indian Institute of Information Technology) at Dharwad
Karnataka Institute of Medical Sciences (KIMS)
SDM college of Engg., Medical & Dental Sciences
BVB College of Engineering & Technology
KLE Society‘s Polytechnic
Nettur Technical Training Foundation
Kousali Institute of Management
KLE Society‘s Institute of Management Studies
Appa College of Engineering
Government polytechnic
Other premier institutions in the region are the Karnataka Arts and Science College and Agriculture College, which was subsequently established as the Agriculture University.
Karnataka University and other private educational societies manage general educational colleges. Comprehensive Development Plan 2021 estimates a demand of 22 colleges for Hubli-Dharwad, to meet the student strength of 20,500 for 2021. In recent years, the city has experienced rapid investment into the educational sector; many private universities have shown interest in setting up their campus in the city due to various factors such as availability of land, favourable climate, and supporting policies from the state.
The existing education facilities have been compared with the URDPFI guidelines to identify the gap in the services. It is observed that the city has adequate facilities in terms of higher education and graduation schools. The city lacks sufficient schools at the primary and pre-primary school levels. As per the URDPFI norms, there is a deficit of schools at the pre-primary level. Further, the city lacks integrated schools with hostel facilities and schools for the physically and mentally challenged. Following table presents the existing status of education facilities and the comparison with URDPFI guidelines.
Table 21: The comparison of Educational facilities as per URDPFI guidelines
Educational facility URDPFI Guidelines
Requirement as per guidelines
No. of institutions
Met the Benchmark
School for physically challenged
1 for 45000 population
22 1 No
School for mentally challenged
1 for 10 lakh population
1 1 Yes
College 1 for 1.25 lakh 8 32 Yes
Technical education 1 for 10 lakh population
1 12 Yes
Engineering college 1 for 10 lakh population
1 3 Yes
Medical college 1 for 10 lakh population
1 2 Yes
Other professional college
1 for 10 lakh population
1 22 Yes
Nursing and paramedical institute
1 for 10 lakh population
1 11 Yes
6.3.2 Key concerns
Dharwad city is known for its educational infrastructure including the oldest universities, medical
and dental colleges, engineering colleges, and other professional colleges. However, most of the

Ministry of Urban Development
[78]] Draft City Development Plan – Hubli-Dharwad
newly established institutes are under private category catering to the educational needs of
students from other cities and states.
The primary schools and other major upper primary and higher secondary schools are located
within the core of twin cities. Students from the slums located on the city outskirts are forced to
depend on the private schools.
6.4 Recreational Facilities
In addition to the core urban services, HDMC also provides the recreation facilities within HDMC limits. The amenities such as gardens, libraries, swimming pool, community halls, parks, playgrounds, sports facilities and rest houses. Parks and lakes are the important places of interest within HDMC limits. Glass House and Unkal Lake in Hubli and Kittur Channamma Park in Dharwad are the major choice for recreation and outings in and near the city.
6.4.1 Parks, grounds, and open spaces
There are around 16 places where parks, playgrounds and open spaces are located in 496 plots in HDMC. The major parks in Hubli are Mahatma Gandhi Park, Kittur Chennamma Park, Azad Park, and University Park. The number of parks in each area is provided in the table below.
The educational institutions have their own smaller parks and play grounds. The major stadiums in Hubli are Karnataka University Stadium, Police Headquarters Stadium at Dharwad, and HDMC Playground. A new stadium has been constructed at Dharwad with the support of the town planning authority.
Table 22: List of parks/open spaces in the city, owned by HDMC
Sr. No. Name of the place No. of plots
1 Unakal 165
2 Krishnapur 67
3 Bengeri 58
4 Nagashettikoppa 41
5 Keshwapur 50
6 Amargol 18
7 MTS 26
8 M Aralikatti 6
9 Gopanakoppa 18
10 Ayodhya 8
11 Bhairdevarakoppa 7
12 Gamanagatti 18
13 Yallapur 1
14 Sutagatti 4
15 Ahoballapur 1
16 Raynal 8
Total 496

Ministry of Urban Development
[79]] Draft City Development Plan – Hubli-Dharwad
Figure 25: Location of recreational facilities in HDMC
Unkal Lake: Unkal is one of the large lakes in the Hubli-Dharwad region and is about 110 years old. This lake is spread across 200 acres of land. A statue of Swami Vivekananda is situated at the centre of the lake and it is a prime attraction for the public. Recently, the lake and its surrounding were developed to protect its water-shed area and also to facilitate the public to enjoy its scenic surroundings. The southeast bank of the lake is surrounded by pedestrian walkways and parks along with boating facilities. However, the residents are of the opinion that the lake is not being maintained regularly after the improvement activities.
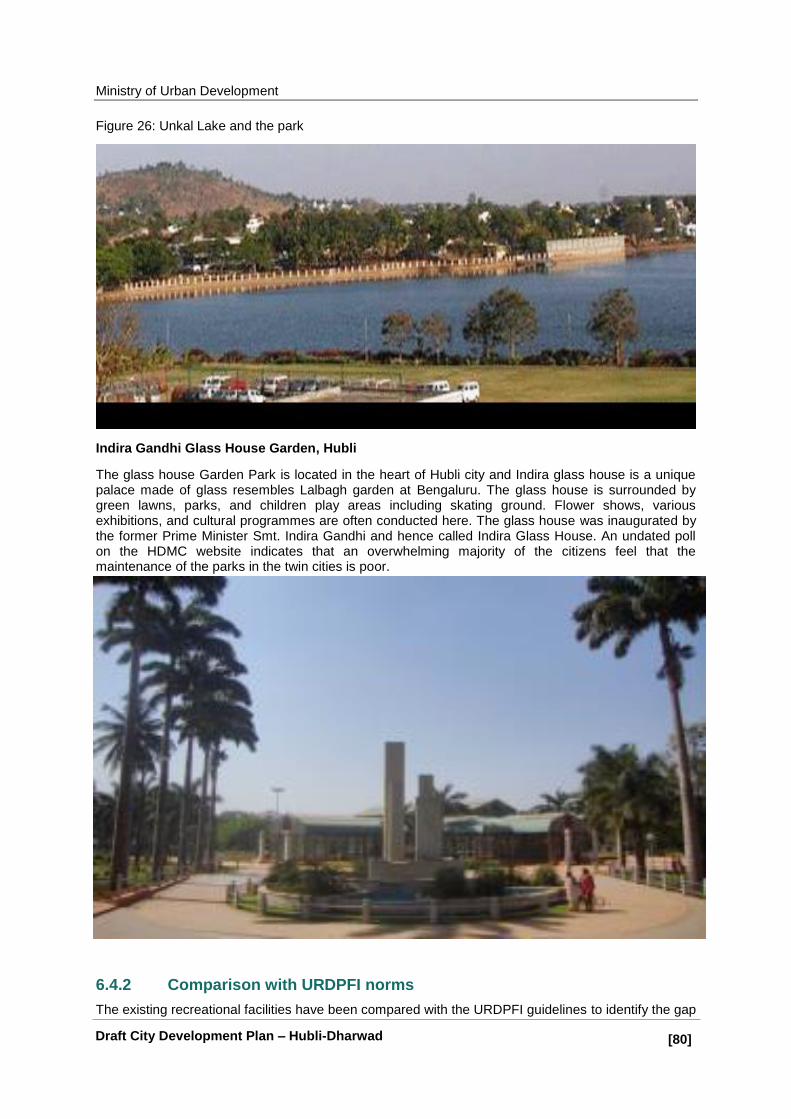
Ministry of Urban Development
[80]] Draft City Development Plan – Hubli-Dharwad
Figure 26: Unkal Lake and the park
Indira Gandhi Glass House Garden, Hubli
The glass house Garden Park is located in the heart of Hubli city and Indira glass house is a unique palace made of glass resembles Lalbagh garden at Bengaluru. The glass house is surrounded by green lawns, parks, and children play areas including skating ground. Flower shows, various exhibitions, and cultural programmes are often conducted here. The glass house was inaugurated by the former Prime Minister Smt. Indira Gandhi and hence called Indira Glass House. An undated poll on the HDMC website indicates that an overwhelming majority of the citizens feel that the maintenance of the parks in the twin cities is poor.
6.4.2 Comparison with URDPFI norms
The existing recreational facilities have been compared with the URDPFI guidelines to identify the gap
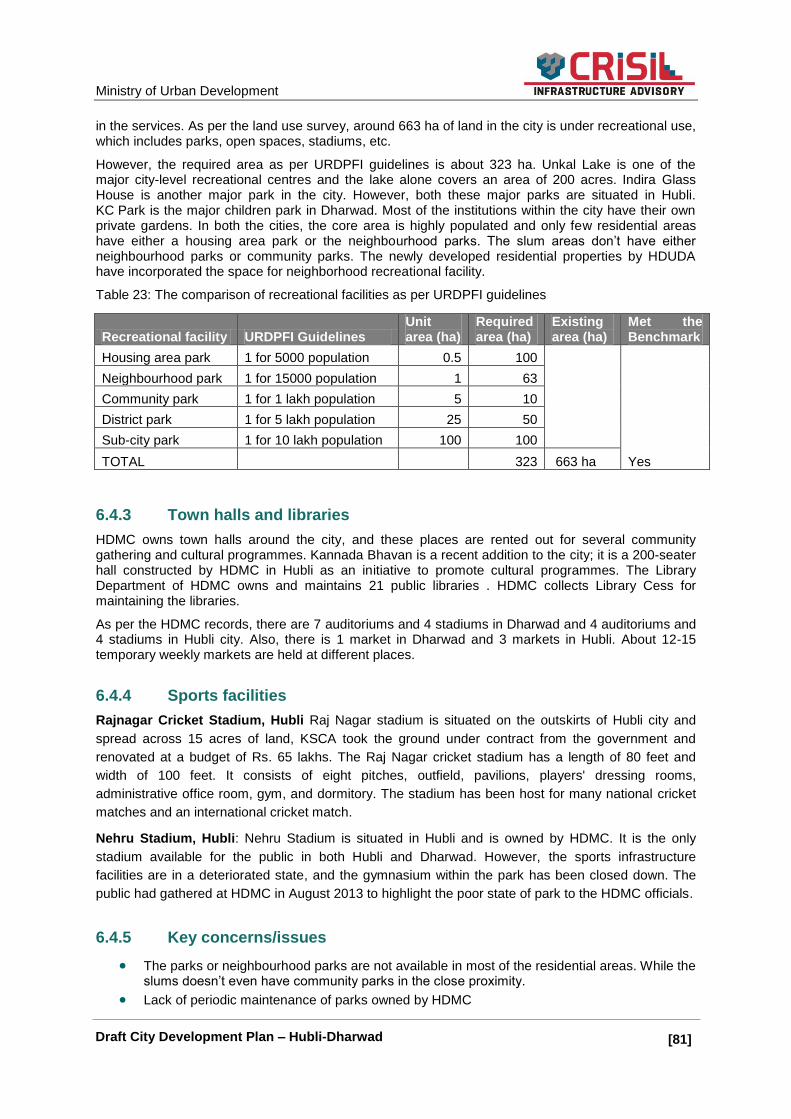
Ministry of Urban Development
[81]] Draft City Development Plan – Hubli-Dharwad
in the services. As per the land use survey, around 663 ha of land in the city is under recreational use, which includes parks, open spaces, stadiums, etc.
However, the required area as per URDPFI guidelines is about 323 ha. Unkal Lake is one of the major city-level recreational centres and the lake alone covers an area of 200 acres. Indira Glass House is another major park in the city. However, both these major parks are situated in Hubli. KC Park is the major children park in Dharwad. Most of the institutions within the city have their own private gardens. In both the cities, the core area is highly populated and only few residential areas have either a housing area park or the neighbourhood parks. The slum areas don‘t have either neighbourhood parks or community parks. The newly developed residential properties by HDUDA have incorporated the space for neighborhood recreational facility.
Table 23: The comparison of recreational facilities as per URDPFI guidelines
Recreational facility URDPFI Guidelines Unit area (ha)
Required area (ha)
Existing area (ha)
Met the Benchmark
Housing area park 1 for 5000 population 0.5 100
Yes
Neighbourhood park 1 for 15000 population 1 63
Community park 1 for 1 lakh population 5 10
District park 1 for 5 lakh population 25 50
Sub-city park 1 for 10 lakh population 100 100
TOTAL 323 663 ha
6.4.3 Town halls and libraries
HDMC owns town halls around the city, and these places are rented out for several community gathering and cultural programmes. Kannada Bhavan is a recent addition to the city; it is a 200-seater hall constructed by HDMC in Hubli as an initiative to promote cultural programmes. The Library Department of HDMC owns and maintains 21 public libraries . HDMC collects Library Cess for maintaining the libraries.
As per the HDMC records, there are 7 auditoriums and 4 stadiums in Dharwad and 4 auditoriums and 4 stadiums in Hubli city. Also, there is 1 market in Dharwad and 3 markets in Hubli. About 12-15 temporary weekly markets are held at different places.
6.4.4 Sports facilities
Rajnagar Cricket Stadium, Hubli Raj Nagar stadium is situated on the outskirts of Hubli city and
spread across 15 acres of land, KSCA took the ground under contract from the government and
renovated at a budget of Rs. 65 lakhs. The Raj Nagar cricket stadium has a length of 80 feet and
width of 100 feet. It consists of eight pitches, outfield, pavilions, players' dressing rooms,
administrative office room, gym, and dormitory. The stadium has been host for many national cricket
matches and an international cricket match.
Nehru Stadium, Hubli: Nehru Stadium is situated in Hubli and is owned by HDMC. It is the only
stadium available for the public in both Hubli and Dharwad. However, the sports infrastructure
facilities are in a deteriorated state, and the gymnasium within the park has been closed down. The
public had gathered at HDMC in August 2013 to highlight the poor state of park to the HDMC officials.
6.4.5 Key concerns/issues
The parks or neighbourhood parks are not available in most of the residential areas. While the slums doesn‘t even have community parks in the close proximity.
Lack of periodic maintenance of parks owned by HDMC

Ministry of Urban Development
[82]] Draft City Development Plan – Hubli-Dharwad
Deteriorated seating and other amenities like bathrooms and parking at the recreational places
Places reserved for the garden turning into waste dumping yards at many places in the city
Encroachment of public places by private people
Lack of sufficient playgrounds in the outskirts of the city where the majority of the slum dwellers are located
Nehru stadium is the only ground open for public however the sports infrastructure within the
stadium are in a deteriorated conditions.
City lacks neighbourhood and residential play grounds.

Ministry of Urban Development
[83]] Draft City Development Plan – Hubli-Dharwad
7. Infrastructure and Services
This chapter presents the status of key urban services such as water supply and sanitation (which
includes sewerage, solid waste management), storm water drainage, and street lighting in HDMC
jurisdiction. The chapter also elaborates on the key issues in the service delivery mechanism, service
level gaps, and the interventions required for bridging the gaps and improving service delivery in
HDMC jurisdiction.
7.1 Water Supply
Good quality drinking water supply and sanitation are the essential basic needs of every citizen.
Increasing urbanization has put pressure on the existing urban water supply and sanitation systems,
leading to increasing demand to augment the source and improve distribution and to increase the
coverage of underground drainage. It is the responsibility of the ULBs to ensure universal coverage of
water and sanitation services to its citizens.
7.1.1 Existing Water Supply Situation
The Karnataka Urban Water Supply and Drainage Board (KUWSDB) is the agency responsible for
provision and maintenance of water supply to the twin cities.
a. Water supply source and storage
HDMC meets its water requirements from two major water projects – Malaprabha Scheme and
Neersagar scheme for supply of water to HDMC were commissioned in 1969 and 1993 respectively.
At present, major portion (above 95%) of the total system draws water from the Malaprabha River,
situated North, at around 42 km from Dharwad. Water from the Malaprabha reservoir is tapped
through a stone masonry dam near Manoli village.
The Malaprabha Project is being executed in three stages.
Stage I and II of the project have been completed, including the construction of systems with
the intake works, pumping station and the trunk mains.
As a part of the third stage works, under Malaprabha Project, KUWSDB has formulated a
scheme for extraction of 63 MLD water for 2031.
While the second stage works meets the 2021 demand of 131 MLD
Third stage works is scheduled to commerce in 2011 to meet the 2031 demand, with supply
of approximately 195 MLD.
Raw water is drawn at Jack-well and pumped up to the Soundatti water treatment plant. The water is
transmitted via 26 km long gravity main to the Aminbhavi pumping station, to be supplied to Dharwad
through Sarawatpur tank and Hubli through Nruptang Betta reservoir. The treated water is supplied to
Dharwad at distance of 26 km and Hubli at 55 km.
In the Neerasagar scheme, raw water from Neersagar tank was pumped by the Dharwad pumping
station to the water treatment plant located at Kanavihonnavur. The treated water, through gravity
mains, is supplied to only Hubli. A new pumping system has been proposed for the Neersagar
scheme. The surrounding land use here is agricultural.
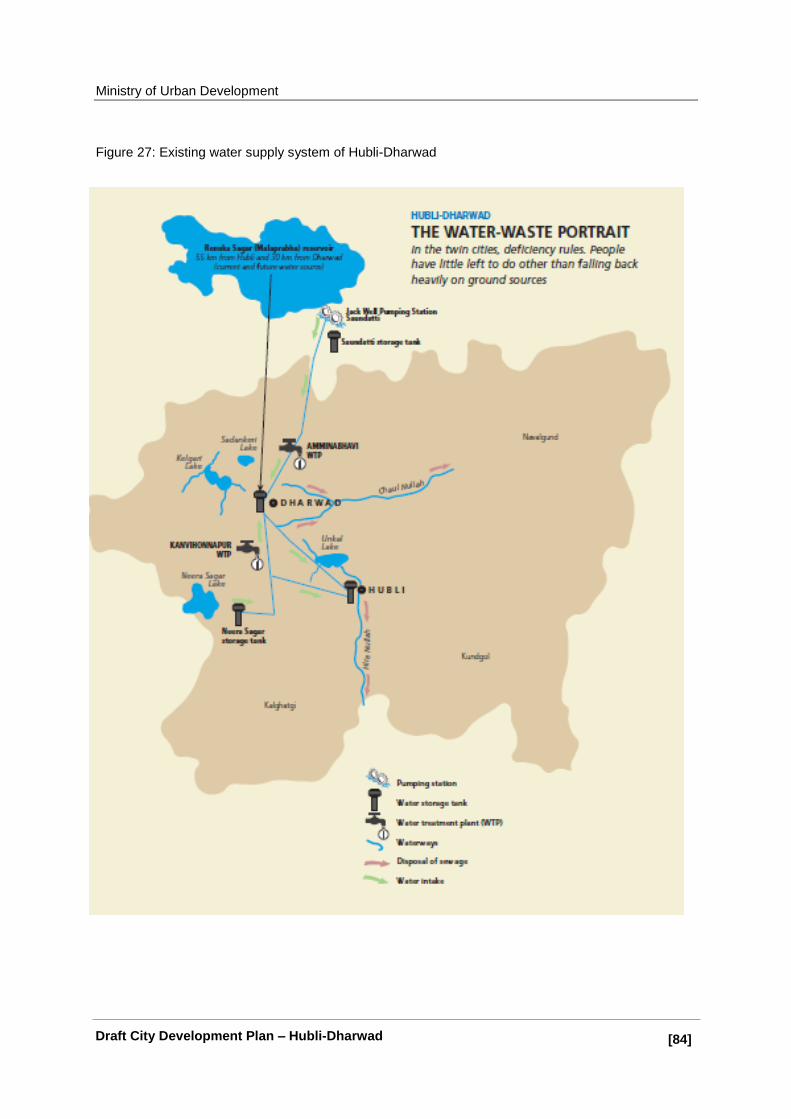
Ministry of Urban Development
[84]] Draft City Development Plan – Hubli-Dharwad
Figure 27: Existing water supply system of Hubli-Dharwad

Ministry of Urban Development
[85]] Draft City Development Plan – Hubli-Dharwad
b. Storage system
There are total 37 water reservoirs in the both the cities with an aggregated storage capacity of about
62 MLD. The storage capacity in Hubli is about 45 MLD and in Dharwad is about 17 MLD. It can be
observed from the below table that about 51 MLD of storage capacity was constructed between 1945
and 1996 and only 11 MLD of GSR/ELSR were constructed after 2003. Most of the old ESRs/GSRs
had to be rehabilitated to control the water loss and increase the storage capacity. Following table
provide the list of ESRs/GLSRs along with their location across Hubli and Dharwad.
Table 24: List of ESRs and GSRs in the city
City Sr. No.
Name of Reservoir (Location) Year of Construction
Capacity in litres lakhs
ESR/GSR
Hubli 1 NR Betta Old Tank 1967 27.240
GLSR
2 NR Betta 1996 54.480
3 Keshwapur 1955 45.400
4 HDMC Park 1996 45.400
5 Old Hubli, Karvar Road 1996 22.700
6 Old Hubli, Ayodya Nagar 1955 13.600
7 NR Betta 3 2011 68.430
8 Tabib Land 1996 13.600
ESR
9 Gabbur 1996 13.600
10 Balajinagar 2003 13.600
11 Nekar Nagar 2003 9.100
12 Keshwapur 1970 4.500
13 Bhairidevar Koppa 1990 2.250
14 Neharunagar 1996 13.600
15 Old Hubli 1996 4.500
16 HDMC Park 1996 9.080
17 Murarjinagar 2005 9.080
18 HDMC Premises (2) 2011 10.000
19 Tabib Land (2) 2011 10.000
20 Mahadevi Layout 2011 10.000
21 SM Krishana Nagar 2011 10.000
22 Sun City 2011 10.000
Dharwad 23 Saraswathpur 1995 32.680
24 DC Compound 1945 & 1965
50.850
GLSR 25 Madaramaddi 1960 27.240
26 Rajathgiri 1993 22.700
27 Gulaganjikoppa 1963 13.620
28 Rayapur Village 1998 4.540
29 Madaramaddi, Rajathgiri, DC Compound, HSR, Saraswathpur (4 Nos., 25000 Gallons Each)
4.540
ESR 30 Police Headquarters 1992 4.540
31 Mrutyunjaya Nagar 1992 4.540
32 KC Park 1992 9.080
33 Saptapur 1992 9.080
34 Tejashwi Nagar 1992 9.080
35 Navalur 2004 4.540

Ministry of Urban Development
[86]] Draft City Development Plan – Hubli-Dharwad
City Sr. No.
Name of Reservoir (Location) Year of Construction
Capacity in litres lakhs
ESR/GSR
36 Kalyan Nagar 2004 4.540
37 Sattur 1998 2.270
Grand Total 624.0
c. Water distribution network
The total length of the distribution network is about 640 km
(255 km in Dharwad and 385 km in Hubli) and that of
transmission mains is about 64 km (12 km and 52 km in
Dharwad and Hubli, respectively). Owing to the long water
network from the reservoir to the treatment plant to the
storage tanks in both the schemes, a considerable amount
of water is lost in transmission.
About 75% of the total municipal corporation area and
water supply facilities are provided to all families. While
55% of the households have access to individual piped
water supply connection.
Hubli-Dharwad has also been facing the problem of
contaminated drinking water due to an unscientific
sewerage system. Sewerage pipes were laid along drinking
water pipes. Sewerage water leaking from the pipes at several points enters the drinking water
pipeline through cracks and contaminates the drinking water. In 2007, residents of Chennpet in Old
Hubli protested against the supply of contaminated water.
d. Water connections
In Hubli-Dharwad, the water supply network is connected to
74,436 consumers, and 97% of them belong to the domestic
category. The city also has installed 774 public stand posts
(PSP) in the clusters of economically weaker sections who
otherwise cannot afford individual house connections. The
remaining areas depend on water tankers throughout the
year.
The average per capita supply at the consumer end after
water losses in transmission and distribution is estimated to
be between 80 and 90 lpcd. However, the frequency of
supply of water in the twin cities is inadequate to meet the
current demand and except in 5 wards, the supply is only once in 3 or 4 days for a duration of 2 to 3
hours.
Table 25: Type of water connections
Sr. No.
Category No. of consumers as on date
(Up to September 2013) %
1 Residential (Domestic) 72454 97.34
2 Non-Domestic 619 0.83
3 Commercial / Industrial 1363 1.83
Total 74436 100.00
Source: HDMC 2013

Ministry of Urban Development
[87]] Draft City Development Plan – Hubli-Dharwad
e. Water metering
Water meters are installed in all the domestic connections however about 53290 connections has the
functional meters. Because of low frequency of water distribution and low pressure, few areas in old
Hubli are not installed with meters. HDMC has passed a resolution to double the flat rate charges for
consumers who have not installed water meters so far.
Water is supplied once in three to four days for 2-4 hours. In some wards, there is continuous
provision of water through the 24×7 water supply initiatives. The connection charges and rates for
domestic, non-domestic, and industrial/commercial purposes are as shown in the table below.
f. Water connection and user charges
The water connection and user charges are presented in the table below. HDWSSB charges Rs.
2,000 for domestic connections and Rs. 4,000 for non-domestic users. The user charges vary for
metered and non-metered connections. HDWSSB charges Rs. 5.80 per kL for domestic connections;
for the non-metered domestic connections the tariff is about Rs 60.
Table 26: Connection charges and water tariff
Sr. No.
Type of connection Connection Charge (Rs)
Rates (Rs/kL)
Min. Charge (Rs)
Remarks
1 Domestic 2 000 5.80 60 (APL) 45
(BPL) Water quantity is 15 kl/month for Rs. 60 for metered connections and 10 kl/month for houses without metered connections
2 Non-Domestic 4000 11.60 120
3 Industrial/Commercial 8000 23.20 240
4 Government Schools
Free
Source: HDWSSB
g. Water account - O&M recovery
As mentioned above, HDWSSB is responsible for the overall operation and maintenance of water
supply in the twin cities. However, during the transfer of the function from HDMC to HDWSSB, HDMC
has transferred around 105 employees to HDWSB for the same.
HDWSSB collects the revenue from consumers and operates and maintains the water supply system.
It can be observed from the following table that, on an average, the authority collects about Rs. 20
crores as water charges. At the same time, the operating expenses are about Rs. 21 crores.
However, the authority is receiving the other grants and income from the government to meet the
O&M expenditure. Therefore, during the year 2011-12, the authority was able to recover 100% O&M
charges on water supply services.
Table 27: HDMC: Water supply – O&M recovery
Rs. Lakhs 2010-11 2011-12
Revenue
Water charges 1,587 2,584
Others 225 559
Government grants - 2,346
Total Revenue (Rs. Lakhs) 1,812 5,488
Operating Expenditure
Power charges - 2,046
HDMC salary - 300

Ministry of Urban Development
[88]] Draft City Development Plan – Hubli-Dharwad
Rs. Lakhs 2010-11 2011-12
Staff cost 326 386
Power and fuel 1,624 1,906
Others 20 14
Operating Expenditure (Rs. Lakhs) 1,970 2,305
O&M Recovery (%) 81% 112%
Source: HDWSSB
h. Water supply – Demand-collection balance statement
On an average, over the review period, HDWSSB had a current demand of about Rs. 20 crores and
arrears demand of about Rs. 20 crores. However, the collection efficiency was poor – the authority
was able to recover only 29% (Rs. 16 crores) of the total demand. However, the collection efficiency
has increased from 26% to 35% during 2008-2013. Following are the major reasons for the poor
collection efficiency:
The collection efficiency of water charges is very low at HDWSSB. After KUWSDB took over
the operation and maintenance related works in 2003, during 2005-2009, it did not send any
bills to the residents (around 40% of residents), resulting in huge arrears.
There was a severe protest from the residents against paying huge arrears, with collection of
arrears still pending.
As a result, presently about 60% of the residents pay the water bills regularly and the
remaining are with huge arrears.
Table 28: Demand-collection statement
Year/Rs. Lakhs 2007-08 2008-09 2009-10 2010-11 2011-12 2012-13 Average
Arrears-Demand 1979 2534 3161 3965 4937 4531 3518
Current-Demand 1868 1766 1908 2490 2433 2037 2084
Total Demand 3847 4300 5069 6455 7370 6567 5601
Total Collection 1091 1137 1197 1548 2709 2309 1665
Balance 2534 3163 3873 4907 4660 4258 3899
Collection efficiency 28% 26% 24% 24% 37% 35% 29%
Source: KUWSDB 2013
i. Status of service level
Following table presents the service level benchmarking for the water supply system at Hubli and
Dharwad.
Table 29: Service delivery indicators
Sr. No.
Indicators Value MoUD Benchmark
Water Supply Services
1 Coverage of water supply connections 56% 100%
2 Per capita supply of water 159 135
3 Extent of metering of water connections 45% 100%
4 Extent of non-revenue water 30% 20%
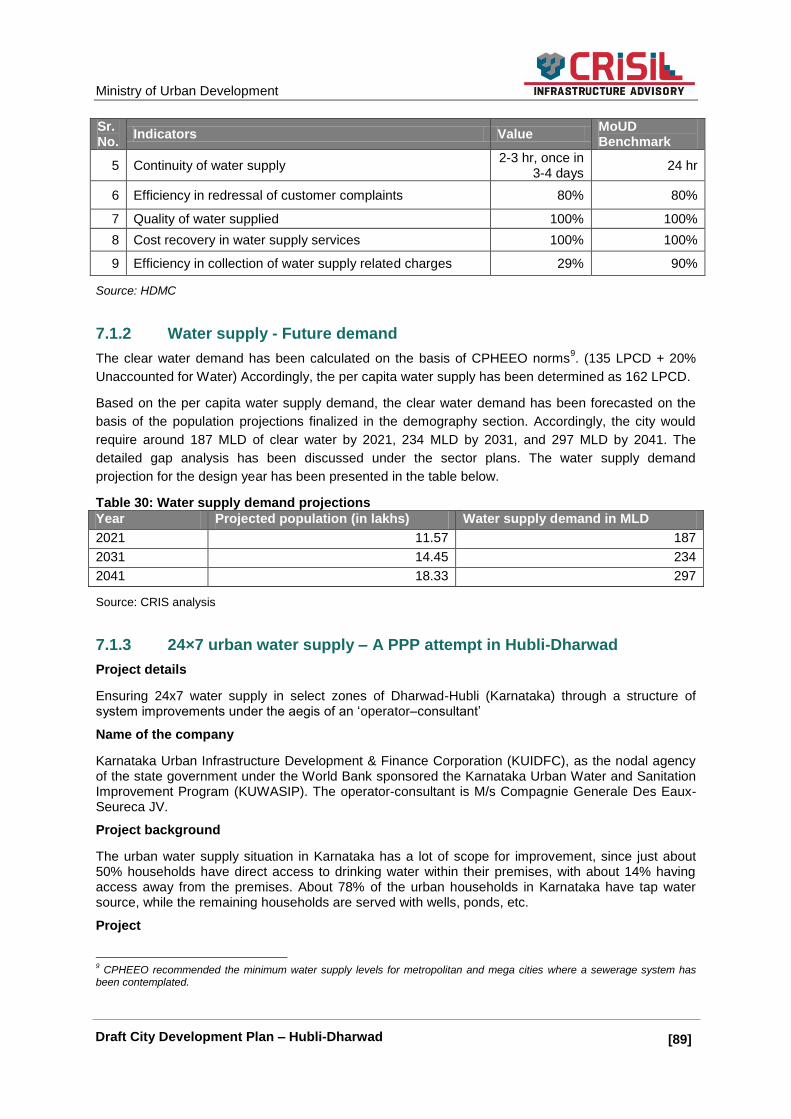
Ministry of Urban Development
[89]] Draft City Development Plan – Hubli-Dharwad
Sr. No.
Indicators Value MoUD Benchmark
5 Continuity of water supply 2-3 hr, once in
3-4 days 24 hr
6 Efficiency in redressal of customer complaints 80% 80%
7 Quality of water supplied 100% 100%
8 Cost recovery in water supply services 100% 100%
9 Efficiency in collection of water supply related charges 29% 90%
Source: HDMC
7.1.2 Water supply - Future demand
The clear water demand has been calculated on the basis of CPHEEO norms9. (135 LPCD + 20%
Unaccounted for Water) Accordingly, the per capita water supply has been determined as 162 LPCD.
Based on the per capita water supply demand, the clear water demand has been forecasted on the
basis of the population projections finalized in the demography section. Accordingly, the city would
require around 187 MLD of clear water by 2021, 234 MLD by 2031, and 297 MLD by 2041. The
detailed gap analysis has been discussed under the sector plans. The water supply demand
projection for the design year has been presented in the table below.
Table 30: Water supply demand projections
Year Projected population (in lakhs) Water supply demand in MLD
2021 11.57 187
2031 14.45 234
2041 18.33 297
Source: CRIS analysis
7.1.3 24×7 urban water supply – A PPP attempt in Hubli-Dharwad
Project details
Ensuring 24x7 water supply in select zones of Dharwad-Hubli (Karnataka) through a structure of system improvements under the aegis of an ‗operator–consultant‘
Name of the company
Karnataka Urban Infrastructure Development & Finance Corporation (KUIDFC), as the nodal agency of the state government under the World Bank sponsored the Karnataka Urban Water and Sanitation Improvement Program (KUWASIP). The operator-consultant is M/s Compagnie Generale Des Eaux-Seureca JV.
Project background
The urban water supply situation in Karnataka has a lot of scope for improvement, since just about 50% households have direct access to drinking water within their premises, with about 14% having access away from the premises. About 78% of the urban households in Karnataka have tap water source, while the remaining households are served with wells, ponds, etc.
Project
9 CPHEEO recommended the minimum water supply levels for metropolitan and mega cities where a sewerage system has
been contemplated.

Ministry of Urban Development
[90]] Draft City Development Plan – Hubli-Dharwad
KUWASIP was initiated under the aegis of the World Bank. KUWASIP had a component for carrying out technical studies in the cities of Belgaum, Gulbarga, and Hubli-Dharwad. Following the study, the process envisaged the selection of an operator consultant (a private party) who would be responsible for making improvements to the existing distribution systems within few zones (known as demo zones) within the municipal wards in these cities, supply continuous drinking water1 twenty four hours a day on all seven days of the week. KUIDFC acted as the nodal agency of the state government to undertake multilateral assisted and financed infrastructure projects. KUWSDB, a statutory entity of the state, is also a party to this contract and is responsible for supplying bulk water at the entry points to these demo zones. The project concept also includes monitoring of the contract by an independent entity known as the technical auditor. The demo zones for 24x7 water supply in Hubli-Dharwad are as follows:
Dharwad - 8, 9, 10, & 11
Hubli - 27, 28, 29 (part) & 32 (part)
The zones were selected after a feasibility study, which considered the possibility of measurement of water and wastewater at single entry and exit points. The zones were also selected to ensure a cross-section of economic strata, including economically weaker sections. The zones represented at least 10% of the total households in the city. Details on number of connections (as on the date of commencement of the project) and the proposed new connections are given in the table below.
7.1.4 Critical analysis of water supply system post-1st Generation CDP
The 1st generation CDP envisaged an investment Rs. 678 crores and key assessment of the water
supply has been presented in the table below.
Table 31: As per the CDS 2006, over view of the water supply system in Hubli-Dharwad
Description Parameters
Source of water supply Neersagar and Malaprabha Lake (located at 20 & 55 km respectively from Hubli)
Water treatment 2 WTPs - Kanvihonnapur & Amminbhavi
Storage and distribution 19 OHTs – Dharwad
44 reservoirs
House service connection Connections - 87361
PSPs – 901
Per capita consumption/duration of water supply
124 lpcd, Frequency of water supply - 2-3 hr in 3-4 days
User charge
Metered
Domestic: Rs. 5.80/kL
Non-domestic: Rs. 11.60/kL
Commercial: Rs. 23.20/kL Flat
Domestic: Rs. 60/mth
Non-domestic: Rs. 120/mth
Commercial: Rs. 240/mth
Cost recovery 35%
Key issues
supply of water is at consumer end - 80 – 90 lpcd at the consumer end Uncontrolled exploitation of underground water sources Frequency of supply varies from once in 3 to 4 days Unaccounted-for water – 40-50% - High distribution losses
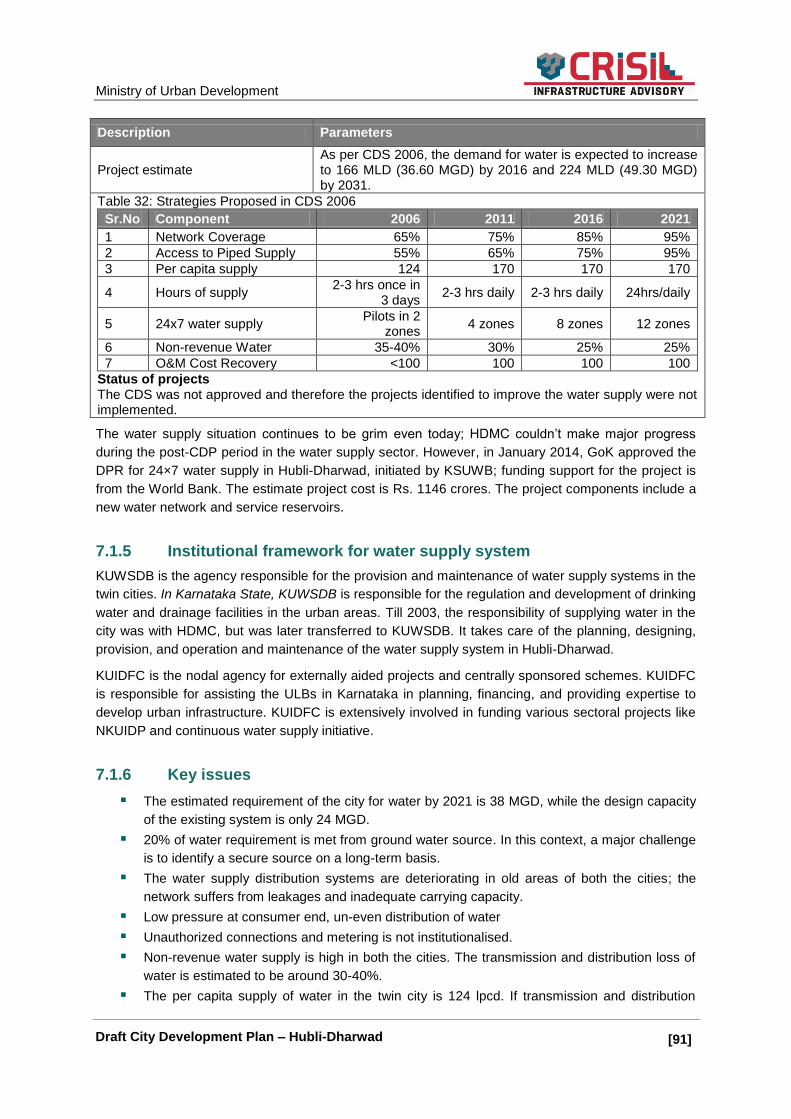
Ministry of Urban Development
[91]] Draft City Development Plan – Hubli-Dharwad
Description Parameters
Project estimate As per CDS 2006, the demand for water is expected to increase to 166 MLD (36.60 MGD) by 2016 and 224 MLD (49.30 MGD) by 2031.
Table 32: Strategies Proposed in CDS 2006
Sr.No Component 2006 2011 2016 2021
1 Network Coverage 65% 75% 85% 95%
2 Access to Piped Supply 55% 65% 75% 95%
3 Per capita supply 124 170 170 170
4 Hours of supply 2-3 hrs once in
3 days 2-3 hrs daily 2-3 hrs daily 24hrs/daily
5 24x7 water supply Pilots in 2
zones 4 zones 8 zones 12 zones
6 Non-revenue Water 35-40% 30% 25% 25%
7 O&M Cost Recovery <100 100 100 100
Status of projects The CDS was not approved and therefore the projects identified to improve the water supply were not implemented.
The water supply situation continues to be grim even today; HDMC couldn‘t make major progress
during the post-CDP period in the water supply sector. However, in January 2014, GoK approved the
DPR for 24×7 water supply in Hubli-Dharwad, initiated by KSUWB; funding support for the project is
from the World Bank. The estimate project cost is Rs. 1146 crores. The project components include a
new water network and service reservoirs.
7.1.5 Institutional framework for water supply system
KUWSDB is the agency responsible for the provision and maintenance of water supply systems in the
twin cities. In Karnataka State, KUWSDB is responsible for the regulation and development of drinking
water and drainage facilities in the urban areas. Till 2003, the responsibility of supplying water in the
city was with HDMC, but was later transferred to KUWSDB. It takes care of the planning, designing,
provision, and operation and maintenance of the water supply system in Hubli-Dharwad.
KUIDFC is the nodal agency for externally aided projects and centrally sponsored schemes. KUIDFC
is responsible for assisting the ULBs in Karnataka in planning, financing, and providing expertise to
develop urban infrastructure. KUIDFC is extensively involved in funding various sectoral projects like
NKUIDP and continuous water supply initiative.
7.1.6 Key issues
The estimated requirement of the city for water by 2021 is 38 MGD, while the design capacity
of the existing system is only 24 MGD.
20% of water requirement is met from ground water source. In this context, a major challenge
is to identify a secure source on a long-term basis.
The water supply distribution systems are deteriorating in old areas of both the cities; the
network suffers from leakages and inadequate carrying capacity.
Low pressure at consumer end, un-even distribution of water
Unauthorized connections and metering is not institutionalised.
Non-revenue water supply is high in both the cities. The transmission and distribution loss of
water is estimated to be around 30-40%.
The per capita supply of water in the twin city is 124 lpcd. If transmission and distribution

Ministry of Urban Development
[92]] Draft City Development Plan – Hubli-Dharwad
losses are considered, the average per capita supply of water is estimated to be around 80–
90 lpcd at the consumer end.
Multiple agencies in service delivery and lacks efficient cost recovery approaches
Being a very old water supply system, network mapping of distribution system is not updated
Low frequent water supply only 2-3 hours of supply in 2-3 days.
No water network in the newly developing areas in and around Hubli and Dharwad
Overextraction of ground water is resulting in the decline in the level of the ground water
table.
7.2 Sewerage and Sanitation
Sewerage and sanitation is one of the key areas of concern for HDMC. The city lacks an organized
sewerage collection system and treatment facility. A city sanitation plan (CSP) for the city has been
prepared in 2010, in line with the National Urban Sanitation Policy. The detailed assessment of the
existing sewerage system covers sewerage generation, sewerage network, treatment facilities, and
sanitation system in the city. Further, the section highlights the key issues in the sewerage and
sanitation system.
7.2.1 Existing sewerage and sanitation system
MoUD rated Indian cities on safe sanitation practices of Class-I cities based on total of 19 sanitation
parameters such as access to community toilets, safe management of human excreta, and solid
waste collection and treatment. Four colour codes have been assigned to the cities based on the
points they obtained in the rating. None of the cities fall in the green category. The distribution of the
436 cities in the said categories has been presented in the table as follows.
Table 33: Rating and categorization of cities based on sanitation practices
Sr. No. Category Marks Description
No. of cities in each category
1 RED <33
Cities on the brink of public health and environmental ―emergency‖ and need immediate remedial action 204
2 BLACK 34-66 Needing considerable improvements 228
3 BLUE 67-90 Recovering but still diseased 4
4 GREEN 91-100 Healthy and clean city 0
5
TOTAL 436
6 Hubli-Dharwad Rank 196 (35.23 marks)
7 Hubli-Dharwad Black Category
Source: CSP 2010
As per the table above, the sanitation situation in the Hubli-Dharwad areas is unsatisfactory with
regards to discharged waste water, sewerage, solid waste management and improper services and
unhygienic conditions.
a. Status of toilets
Around 70% of the total households have access to toilet facilities including toilets connected to UGD
while around 14% of the toilets are connected with septic tanks and 3% of the toilets are connected to
pit latrines.

Ministry of Urban Development
[93]] Draft City Development Plan – Hubli-Dharwad
Table 34: Sanitation arrangements in Hubli-Dharwad
Sr. No. Sanitation arrangement %
1 Toilets connected to conventional sewer line 70%
2 Toilets connected to septic tank 14%
3 Toilets connected to open nalas 10%
4 Toilets connected to pit latrine 3%
5 Households practicing open defecation 3%
6 Total 100%
Source: CSP 2010
It is a serious concern that 13% of the toilets are discharging untreated waste into the open drains.
The lines that are connected to open nalas often get blocked, leading to overflow of wastewater and
severe health hazards.
However, the CSP reveals that there are only 52 community toilets with 349 seats are functional.
Also, 6,322 (3%) of the households are practicing open defecation. Around 41 wards out of 67 wards
resort to open defecation mainly because of unavailability of community toilets, lack of water supply,
space constraint to construct toilet places, reluctance for pay and use toilets or proximity to the open
areas, behavioural attitude, etc.
b. Sewerage network and coverage
The underground drainage (UGD) system was developed in the early 1960s. The length of the
sewerage network is about 556 km, covering an area of 54 sq. km, and the coverage is only about
60% in Hubli and 40% in Dharwad. The topography of Hubli city is flat and is favourable for
developing UGD as compared to Dharwad, which has an undulating topography.
As per the table above, 70% of the households are connected to the sewer network. Most of the
newly developed areas/extension areas along Gokul road, Navanagar, etc., are not served by the
sewer network and depend on septic tanks.
c. Sewerage treatment
Sewerage treatment facilities are unavailable in both the cities, and the collected sewage is ultimately
discharged into natural streams.
d. Sewerage charges
No direct user charge is collected from the households, but minimal percentage of amount is collected
from the users annually along with the property taxes.
e. Service-level indicators
Table 35: Service-level benchmarking
Sr. No.
Indicator Value MoUD benchmark
1 Coverage of toilets (lakh toilets / lakh properties)
88% 100%
2 Coverage of sewerage network services 70% 100%
3 Collection efficiency of wastewater network 0% 100%
4 Adequacy of sewerage treatment capacity 0% 100%
5 Quality of sewerage treatment 0% 100%
6 Extent of reuse and recycling of sewerage 0% 20%
7 Extent of cost recovery in sewerage management 1% 100%

Ministry of Urban Development
[94]] Draft City Development Plan – Hubli-Dharwad
Sr. No.
Indicator Value MoUD benchmark
8 Efficiency in redressal of customer complaints 88% 80%
9 Efficiency in collection of sewerage related charges 0% 90%
Source: HDMC 2013
f. Future sewage generation
Sewage generation has been estimated at 80% of the water supplied. Accordingly, sewage generation has been projected as 150 MLD for 2021, 187 MLD for 2031, and 237 MLD by 2041. The sewage generation projected for various horizon years has been presented in the table below.
Table 36: Future sewerage generation
Year Projected population (in Lakhs) Sewage generation (in MLD)
2021 11.57 150
2031 14.45 187
2041 18.33 237
Source: CRIS analysis
g. Critical analysis of sanitation sector Post 1st Generation CDP Scenario
Table 37: Key status of sewerage section in 1st generation CDP
Description Parameters
House service connection Network coverage - 50 Access coverage - 55%
Coverage of sewerage network Waste water collected from UGD is drained into open land agri fields
Sewerage treatment Not Available
User charge Nil
Proposals
The CDP has envisaged an investment of Rs. 260 crores to improve the sanitation services in the city. The components include:
Preparation of a comprehensive sewerage master plan
Laying of 500 km sewer network
Construction of 17000 manhole chambers
Construction of 6 pumping stations
Rehabilitation of the existing sewers (50 km) and road overlays (500 km)
Construction of sewage treatment plants (2 nos. with a total capacity of 120 MLD)
The situation in the city continues to be unsatisfactory even today; HDMC couldn‘t implement any
project proposed in CDP 2006, as it was not approved by the GoI.
7.2.2 Ongoing projects
UGD project:
Under NKUSIP, a comprehensive DPR was prepared to improve the sanitation situations in the twin
cities, and the total investment for the entire city has been assessed to be of Rs. 800 crores.
Currently, NKUSIP has taken up a part of the comprehensive plan of construction of major
components like sewerage treatment plants, trunk mains, and secondary mains (selected areas with
dense population) in both Hubli and Dharwad.
An underground drainage project worth Rs. 164 crores with the support of KUIDFC and NKUSIP is
being implemented in the city. The length of sewer lines in the project is about 96 km in Hubli and

Ministry of Urban Development
[95]] Draft City Development Plan – Hubli-Dharwad
42.5 km in Dharwad. STPs are also proposed in the project and the capacity in Hubli is 40 MLD and
in Dharwad is 20 MLD; the STPs are expected to be commissioned in December 2014.
7.2.3 Key issues
Only about 50% of the HDMC area is covered with UGD, and the system is quite old and
deteriorated. Also, the network is under pressure in the old areas of both the cities where it is
densely populated.
The sewerage from UGD is not treated, but discharged into open spaces and lakes, leading
to the pollution of the surface and ground water sources and environment.
Lack of a sewer network in the peri-urban areas has led to the dependence on septic tanks.
Newly developing areas are predominately depending on individual toilets and onsite septic
tanks. However, no guideline or specification has been issued with regards to the construction
of septic tanks and septage management.
More than 50% of slum dwellers lack proper sanitation services. Though open defecation is
still practiced by the slum dwellers and needs to be addressed.
Improper disposal of sewerage, sewage, and sullage is leading to health and environmental
hazards. Occurrence of contagious diseases and waterborne diseases is frequent among
slum dwellers.
Though a sanitation project has been initiated under NKUSIP, its implementation has been
delayed due to technical and policy constraints.
7.3 Solid Waste Management
This section presents a detailed assessment of the existing SWM system, which includes waste generation, collection, transportation, and treatment facilities. Further, the section highlights the key issues in the SWM sector.
7.3.1 Existing solid waste generation
a. Solid waste generation
The primary sources of waste generation are households and other bulk waste generators such as
markets, hotels, restaurants, shops, and establishments. The total waste generated (excluding
biomedical waste) in the city is around 400 tons per day. The major contributors are households
(55%) and commercial areas, including hotels and markets (17%). DMC is responsible for the
collection, transportation, and safe disposal of solid waste within the HDMC jurisdiction, except
biomedical waste.
b. Types of wastes
Households, markets, hotels, restaurants, shops, and establishments are the major source of waste
generation in HDMC. Therefore, it is clear that more than 80% of the waste generated in the city is
degradable. The quantity and type of waste generated in the city are given in the table below.
Biomedical waste and other hazardous wastes are handled by KSPCB and are not considered as part
of municipal solid waste management. At present, Hubli-Dharwad has a privately owned and operated
biomedical waste disposal unit and another two units located in the Karnataka Institute of Medical
Science (KIMS) and SDM Medical College.

Ministry of Urban Development
[96]] Draft City Development Plan – Hubli-Dharwad
Table 38: HDMC: Solid Waste Generated per Day
Source: HDMC 2013
c. Street sweeping
HDMC is responsible for street sweeping and collection of waste from 26 wards, and the balance 41
wards are contracted out. Presently, street sweeping is carried out by 653 pourakarmikas. The streets
are swept daily, and the drains are cleaned on as-needed basis. On an average, 36 TPD of waste is
collected through sweeping, which constitutes 8% of the waste generated in the city. In October 2012,
HDMC bought two street sweeping machines at a cost of Rs. 1.10 crores.
Solid waste collection and transportation system
The total waste generated by all sources in the twin cities is 400 TPD, of which 370 TPD (93%) is
collected and transported daily to the dumping sites. The average per capita waste generation is
around 0.3 kg/day. The primary sources of waste generation are households and other bulk waste
generators including markets, hotels, restaurants, shops, and establishments. The door-to-door
collection is about 43% (81,379) of the total 189,249 households in the city. Out of the 67 wards,
door-to-door waste collection is handled by the HDMC pourakarmikas in 19 wards and is outsourced
in the remaining 48 wards. NGOs are engaged in door-to-door waste collection. Solid wastes are also
collected from the garbage bins placed on the streets.
HDMC has provided with 1,269 garbage bins (3 cu. m capacity) spaced at a distance of 200–250 m
55%
9%
8%
17%
1%
3% 5%
2%
Households Hotels Markets
Commercial Areas Institutional Areas MSW from Industries
Debris Miscellaneous
Sr. No. Source of Waste Quantity (TPD) %
1 Households 220 55%
2 Hotels 36 9%
3 Markets 34 8%
4 Commercial Areas 65 17%
5 Institutional Areas 3 1%
6 MSW from Industries 12 3%
7 Debris 20 5%
8 Miscellaneous 10 2%
Total 400 100%
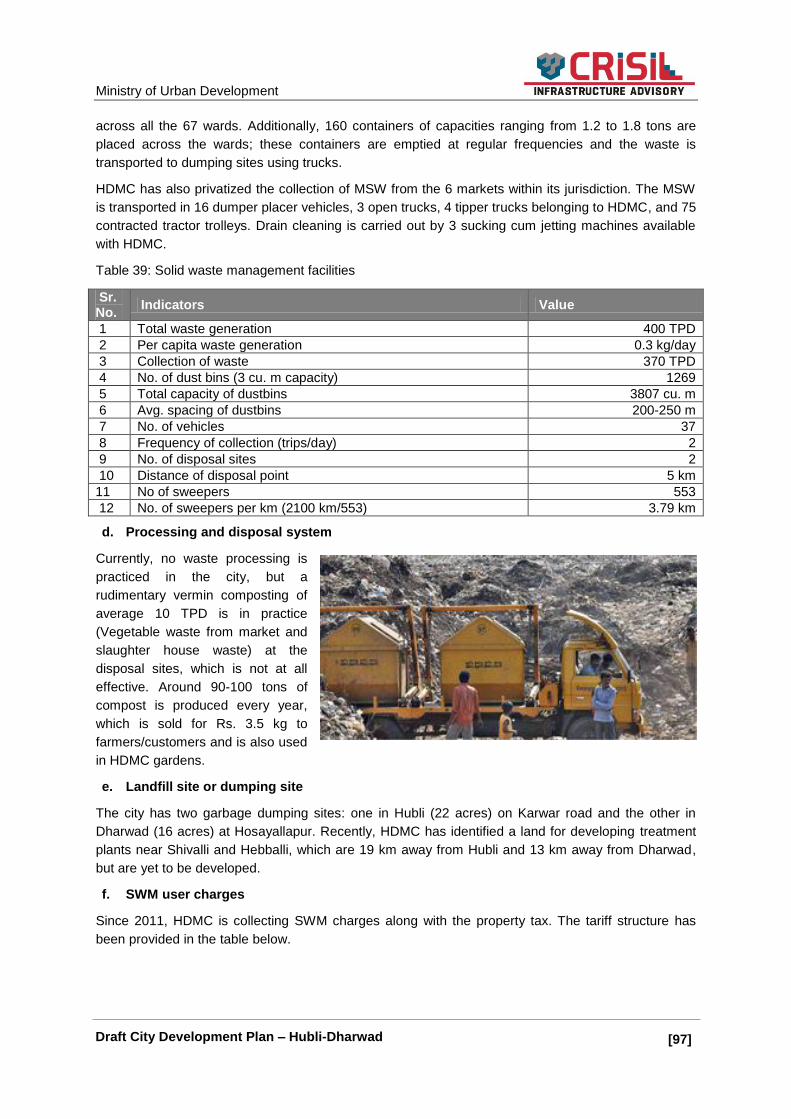
Ministry of Urban Development
[97]] Draft City Development Plan – Hubli-Dharwad
across all the 67 wards. Additionally, 160 containers of capacities ranging from 1.2 to 1.8 tons are
placed across the wards; these containers are emptied at regular frequencies and the waste is
transported to dumping sites using trucks.
HDMC has also privatized the collection of MSW from the 6 markets within its jurisdiction. The MSW
is transported in 16 dumper placer vehicles, 3 open trucks, 4 tipper trucks belonging to HDMC, and 75
contracted tractor trolleys. Drain cleaning is carried out by 3 sucking cum jetting machines available
with HDMC.
Table 39: Solid waste management facilities
Sr. No.
Indicators Value
1 Total waste generation 400 TPD
2 Per capita waste generation 0.3 kg/day
3 Collection of waste 370 TPD
4 No. of dust bins (3 cu. m capacity) 1269
5 Total capacity of dustbins 3807 cu. m
6 Avg. spacing of dustbins 200-250 m
7 No. of vehicles 37
8 Frequency of collection (trips/day) 2
9 No. of disposal sites 2
10 Distance of disposal point 5 km
11 No of sweepers 553
12 No. of sweepers per km (2100 km/553) 3.79 km
d. Processing and disposal system
Currently, no waste processing is
practiced in the city, but a
rudimentary vermin composting of
average 10 TPD is in practice
(Vegetable waste from market and
slaughter house waste) at the
disposal sites, which is not at all
effective. Around 90-100 tons of
compost is produced every year,
which is sold for Rs. 3.5 kg to
farmers/customers and is also used
in HDMC gardens.
e. Landfill site or dumping site
The city has two garbage dumping sites: one in Hubli (22 acres) on Karwar road and the other in
Dharwad (16 acres) at Hosayallapur. Recently, HDMC has identified a land for developing treatment
plants near Shivalli and Hebballi, which are 19 km away from Hubli and 13 km away from Dharwad,
but are yet to be developed.
f. SWM user charges
Since 2011, HDMC is collecting SWM charges along with the property tax. The tariff structure has
been provided in the table below.

Ministry of Urban Development
[98]] Draft City Development Plan – Hubli-Dharwad
Table 40: User fee - SWM
Area in sq. ft. Cess per month (Rs.)
A Residential
<1,000 10
1,000-3,000 30
>3,000 50
B Commercial establishments
<1,000 50
1,000-5,000 100
>5,000 200
C Hotels and choultries
<10,000 300
10,000-50,000 500
>50,000 600
D Industrial establishments
<1,000 100
1,000-5,000 200
>5,000 300
g. Service-level indicators
Table 41: Service-level indicators
Sr. No. Indicator Value MoUD
Benchmark
1 Household-level coverage of SWM services 75% 100%
2 Efficiency of collection of municipal solid waste 90% 100%
3 Extent of segregation of municipal solid waste 0% 100%
4 Extent of municipal solid waste recovered 0% 80%
5 Extent of scientific disposal of municipal solid waste 0% 100%
6 Extent of cost recovery in SWM services 1.1% 100%
7 Efficiency in redressal of customer complaints 95% 90%
8 Efficiency in collection of SWM related user related charges (SWM Cess)
66% 90%
7.3.2 Future solid waste generation
For the purpose of solid waste generation projection, the waste generated per capita for the current year has been considered as 407 gm. Accordingly, the average per day waste generation has been estimated as 400 tons and the annual waste generated as 1.46 lakh tons.
The per capita waste generation has been projected at 2.2% till 2021; further, it has been projected at 1.9% till 2031 and 1.6% till 2041. Accordingly, the annual solid waste generation has been calculated till 2041. Based on the solid waste generation estimates, the infrastructure requirement for primary and secondary collection, transportation, landfill, and treatment capacity has been estimated, and the same has been discussed in the sector plans.
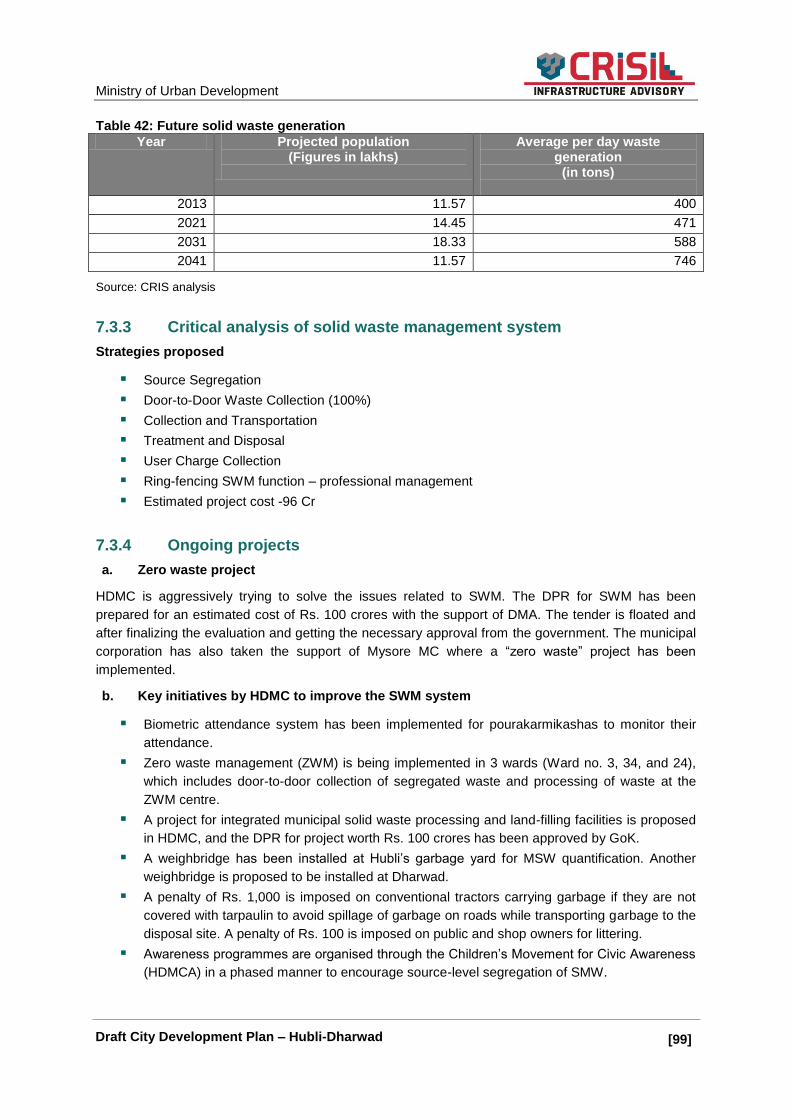
Ministry of Urban Development
[99]] Draft City Development Plan – Hubli-Dharwad
Table 42: Future solid waste generation
Year Projected population (Figures in lakhs)
Average per day waste generation
(in tons)
2013 11.57 400
2021 14.45 471
2031 18.33 588
2041 11.57 746
Source: CRIS analysis
7.3.3 Critical analysis of solid waste management system
Strategies proposed
Source Segregation
Door-to-Door Waste Collection (100%)
Collection and Transportation
Treatment and Disposal
User Charge Collection
Ring-fencing SWM function – professional management
Estimated project cost -96 Cr
7.3.4 Ongoing projects
a. Zero waste project
HDMC is aggressively trying to solve the issues related to SWM. The DPR for SWM has been
prepared for an estimated cost of Rs. 100 crores with the support of DMA. The tender is floated and
after finalizing the evaluation and getting the necessary approval from the government. The municipal
corporation has also taken the support of Mysore MC where a ―zero waste‖ project has been
implemented.
b. Key initiatives by HDMC to improve the SWM system
Biometric attendance system has been implemented for pourakarmikashas to monitor their
attendance.
Zero waste management (ZWM) is being implemented in 3 wards (Ward no. 3, 34, and 24),
which includes door-to-door collection of segregated waste and processing of waste at the
ZWM centre.
A project for integrated municipal solid waste processing and land-filling facilities is proposed
in HDMC, and the DPR for project worth Rs. 100 crores has been approved by GoK.
A weighbridge has been installed at Hubli‘s garbage yard for MSW quantification. Another
weighbridge is proposed to be installed at Dharwad.
A penalty of Rs. 1,000 is imposed on conventional tractors carrying garbage if they are not
covered with tarpaulin to avoid spillage of garbage on roads while transporting garbage to the
disposal site. A penalty of Rs. 100 is imposed on public and shop owners for littering.
Awareness programmes are organised through the Children‘s Movement for Civic Awareness
(HDMCA) in a phased manner to encourage source-level segregation of SMW.

Ministry of Urban Development
[100]] Draft City Development Plan – Hubli-Dharwad
7.3.5 Institutional framework for SWM
SWM is an obligatory function of the ULB and is undertaken by the Health Department in HDMC. The
team is headed by a health officer. A deputy environmental officer and an environmental engineer
assist the health officer in technical matters. Three health supervisors provide support to the health
officer at HDMC in monitoring the implementation of the SWM. Health Inspectors, two to three at each
of the twelve Zonal Offices, who report to the Health Supervisor at HDMC.
The zonal assistant commissioner/zonal officer at each of the zonal offices, perform the supervisory
role at the field level in implementing SWM. The total number of health inspectors/sanitary inspectors
is 39. Health jamadars, 6 to 8 in each of the zonal offices, implement SWM at the field level with the
assistance of pourakarmikas/conservancy staff. Of the 653 pourakarmikas, 553 are deployed for
sweeping and other works, and 100 are involved in loading garbage into trucks. The typical
absenteeism in the pourakarmikas is between 10-20%. 15 drivers transfer the waste from secondary
collection centres to the dumping yard.
Figure 28: Organization structure of Health Department/SWM of HDMC
7.3.6 Key issues
No integrated solid waste management mechanism
Inadequate solid waste collection, resulting in disposal of waste into streets drains and open
spaces
Containers for collection are few and far between
Ineffective primary collection mechanism leading to unhygienic conditions in the city
Inadequacy of conservancy staff for street cleaning
Segregation of waste practiced only in five wards, no segregation of waste either at
households level or at the disposal stage in the remaining wards
No treatment facility for solid waste, waste dumped in open site
Ongoing projects for SWM getting delayed due to various technical and administrative
reasons

Ministry of Urban Development
[101]] Draft City Development Plan – Hubli-Dharwad
Quantity of SWM generated increasing every year, character and type of waste changing over
the period
Solid waste management system in HDMC not compliant with the Municipal Solid Waste
(Management and Handling) Rules, 2000
7.4 Storm Water Drainage
The detailed assessment of the existing SWD systems includes existing drainage network, and water
logging areas and the existing institutional arrangement has been presented in the sub-sections
below.
7.4.1 Existing drainage system
The storm water drainage system in Hubli-Dharwad runs along 377 km and covers 49.17% of the total
road length in the twin cities. It is estimated that around 60% of the households have access to the
storm water drains. Out of the 377 km long drainage network, only 5 km stretch has closed pucca
drains. About one-third of the slums are covered with drains, and all the drains are open drains.
Clogging of drains due to dumping of solid waste and inflow of household sullage have become
common practice across the city and it makes the system inefficient.
Table 43: Details of drains and natural channels
Sr. No.
Drain type Length (in km)
1 Open drains (Pucca) 310
2 Open drains (Kutcha) 12
3 Closed drains 5
4 Natural drains 40
Total 377
Apart from the storm water drains, there is a network of natural streams running for a length of 40 km.
The city has six major natural canals: Unkal Nala, Islampur Nalla, Karigannavar Hakkal Nala, Madihal
Nala, Kelageri Nala, and Navalur Nalla. These canals dispose household and industrial wastewater
into Madihal at Dharwad and open fields to the south of Hubli.
Figure 29: Existing status of open drains in Hubli
Source: CSP 2010

Ministry of Urban Development
[102]] Draft City Development Plan – Hubli-Dharwad
Water logging areas
Dharwad is situated on hillocks and has an undulating topography, while the Hubli has a relatively flat
terrain. The lack of storm water drainage often results in the flooding of roads and residential areas for
3- days during the monsoon. The low-lying areas in both cities (around 30 areas) are prone to
flooding during the monsoon.The areas include Jannat Nagar, Laxmi Singanakeri, Bhavikatti Plots,
Supermarket, MB Nagar, and Koppadakeri in Dharwad, and Sadarsofa, Narayansofa, Mastansofa,
Banatikatti, Toravi Hakkal, Nekar Nagar, Anand Nagar, Ganeshpet, and Tabibland in Hubli.
7.4.2 Operation and maintenance of storm water drainage
HDMC is responsible for planning, designing, and implementing projects related to storm water
drainage. The Health Department of HDMC is responsible for the maintenance of the drains.
Pourakarmikas are responsible for cleaning the drains on as-needed basis along with street
sweeping, while the nalas are cleaned twice a year. From the discussions with the slum dwellers and
local households, it is understood that the storm water drains are not maintained properly in the city.
7.4.3 Service-level benchmarking
Table 44: Service-level benchmarking in storm water drainage
Sr. No.
Indicator Value MoUD
Benchmark
Storm Water Drainage
1 Coverage of storm water drainage network 49% 100%
2 Incidence of water logging / flooding 5-10 days 0
Source: HDMC - Engineering department
7.4.4 Critical analysis of drainage system: Post-1st Generation CDP Scenario
As per the CDS 2006, over view of the Storm water drainage in Hubli-Dharwad
Limited Coverage
Open drains (Pucca) - 310 km
Closed drains (Kutcha) – 12 km
Closed drains - 5 km
Cross connection of UGD and Open Drains
Unregulated Outflow of Sullage / Septic Tank Effluents
Clogging of drains, resulting in flooding
Lack of integrated drainage master plan
Strategies proposed
Comprehensive drainage master plan
Immediate rehabilitation, strengthening, and expanding of the network
Estimated investment requirement for improving storm water drainage -387.40 crores
7.4.5 Key issues
The twin cities lack a comprehensive storm drainage system, and the existing system does
not conform to the natural topography, the natural streams, and their courses. Due to this,

Ministry of Urban Development
[103]] Draft City Development Plan – Hubli-Dharwad
low-lying areas of the city get flooded during the monsoon.
The open channels do not have retaining walls, leading to sewage infested rain flow flooding
the neighbouring areas.
Due to dumping of solid waste and inflow of household sullage, the storm water drains get
blocked and the system becomes inefficient frequently.
Only half of the city area is covered with the storm water drainage systems. The network is
inadequate in the old earlier developed areas and as well as in the newly developed layouts.
Ministry of Urban Development
[104]] Draft City Development Plan – Hubli-Dharwad
8. Traffic and Transportation System
This section presents the assessment of the existing roads, traffic, and transportation system in the
city. Further, the section presents the key observations, key issues, and the institutional responsibility
for the delivery of services.
Being an educational and commercial hub, a large floating population of around one lakh per annum
from the surrounding region visits the city. Transportation infrastructure plays a dominant and vital role
in the growth and development of a metropolitan area. The transport infrastructure for Hubli-Dharwad
was mainly developed during the late 19th century. During this period, the railway network was
installed, and a number of arterial roads were constructed. Hubli-Dharwad city is well connected to
other towns in the north Karnataka region through a well-developed road network and also with other
cities of the state and country through road, rail, and air ways.
The British developed the railway network in Hubli-Dharwad in the late 19th century. Rail network
within HDMC. Hubli is well connected by the rail network to Bengaluru and other major cities such as
Mumbai in the north and Thiruvananthapuram in the south. Being an important railway junction, there
are daily trains to Bijapur, Solapur, Bellary, Pune, Ajmer, New Delhi, Hyderabad, Ahmedabad, Vasco,
Vijayawada, Mysore, Tirupati, Chennai, and Howrah.
The twin cities have an airport is situated at Hubli, and it is one of only two operational airports in
north Karnataka, with the other one in Belgaum. The airport is spread over an area of 369 acres and
has one runway of 1,670 m in length. The airport has all basic air navigation and night landing
facilities. The terminal building can handle 150 passengers. Currently, Spice Jet operates flights
to Bengaluru, Mumbai, and Hyderabad from Hubli.
8.1 Existing Road infrastructure
Hubli-Dharwad city has a well-developed road network system, connecting it to various cities across
the states. The major roads in both cities follow a radial pattern. NH4 is the major corridor of Hubli-
Dharwad passing through the central city core and connects Pune and Bengaluru. Roads originating
from the centre of Hubli city connect the city with major towns like Bijapur, Karwar, Marmagoa, and
Sholapur.
Dharwad is predominantly set to the west of NH4. In Dharwad too, all important roads radiate from the
centre. The total length of roads in the territorial jurisdiction of HDMC is about 630 km, of which 67%
are surfaced (Bitumen–top / WBM). The density of roads in the city is approximately 3.29 km/sq. km.
The per capita road length is about 0.8 km. The average width of the roads in the town is about 9.5 m.
As per the HDUDA comprehensive development plan, 22% of the land use is reserved under traffic
and transport. However, there is a need to increase the road density in the city to cater to the increase
in the vehicle population and to support the traffic management efforts otherwise quality of
transportation infrastructure would deteriorate.
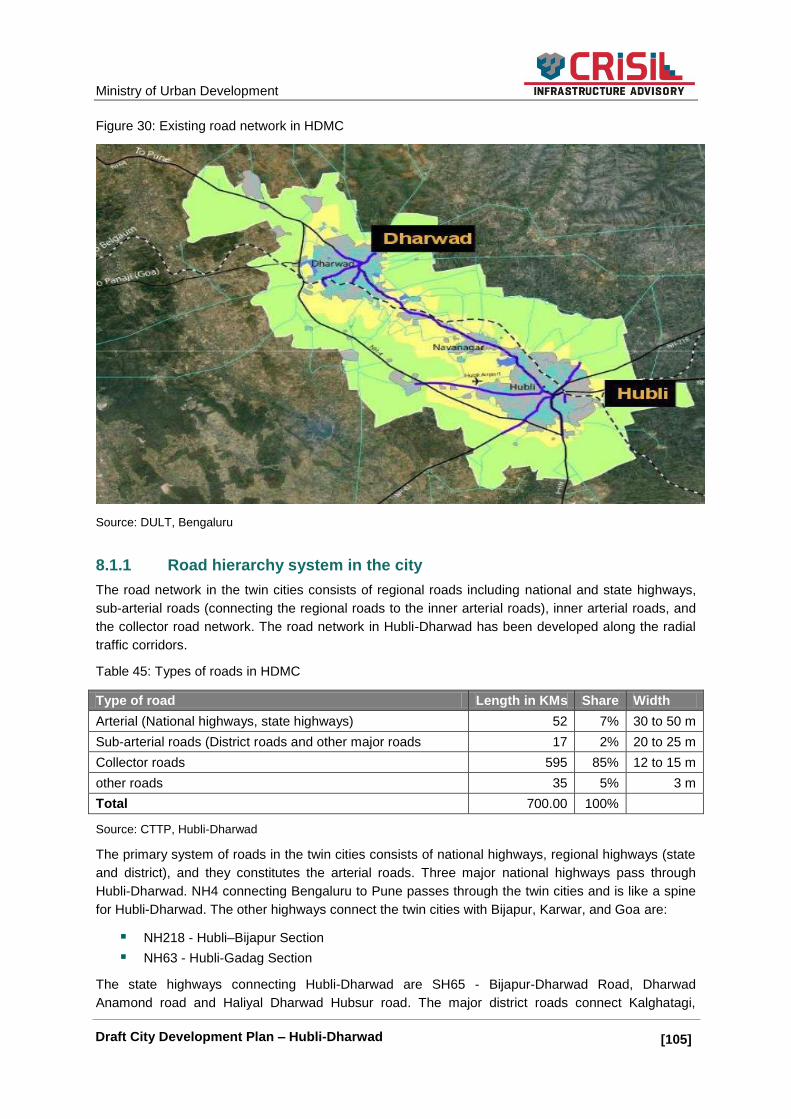
Ministry of Urban Development
[105]] Draft City Development Plan – Hubli-Dharwad
Figure 30: Existing road network in HDMC
Source: DULT, Bengaluru
8.1.1 Road hierarchy system in the city
The road network in the twin cities consists of regional roads including national and state highways,
sub-arterial roads (connecting the regional roads to the inner arterial roads), inner arterial roads, and
the collector road network. The road network in Hubli-Dharwad has been developed along the radial
traffic corridors.
Table 45: Types of roads in HDMC
Type of road Length in KMs Share Width
Arterial (National highways, state highways) 52 7% 30 to 50 m
Sub-arterial roads (District roads and other major roads 17 2% 20 to 25 m
Collector roads 595 85% 12 to 15 m
other roads 35 5% 3 m
Total 700.00 100%
Source: CTTP, Hubli-Dharwad
The primary system of roads in the twin cities consists of national highways, regional highways (state
and district), and they constitutes the arterial roads. Three major national highways pass through
Hubli-Dharwad. NH4 connecting Bengaluru to Pune passes through the twin cities and is like a spine
for Hubli-Dharwad. The other highways connect the twin cities with Bijapur, Karwar, and Goa are:
NH218 - Hubli–Bijapur Section
NH63 - Hubli-Gadag Section
The state highways connecting Hubli-Dharwad are SH65 - Bijapur-Dharwad Road, Dharwad
Anamond road and Haliyal Dharwad Hubsur road. The major district roads connect Kalghatagi,
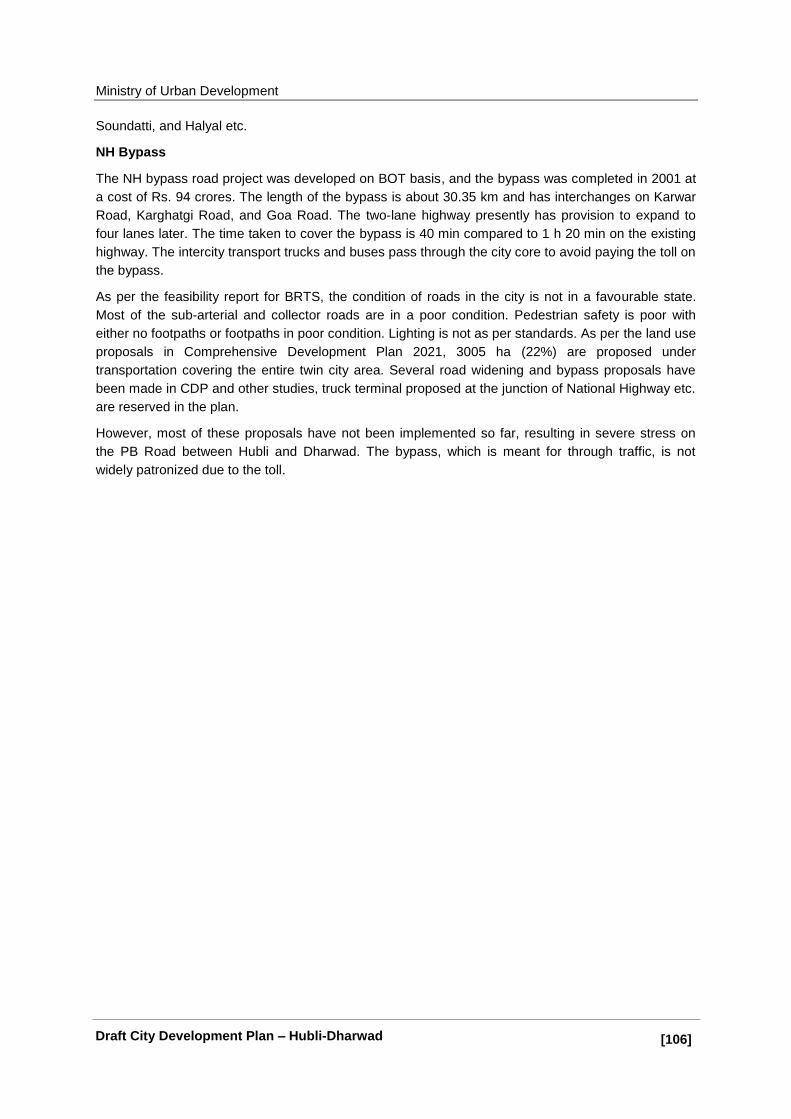
Ministry of Urban Development
[106]] Draft City Development Plan – Hubli-Dharwad
Soundatti, and Halyal etc.
NH Bypass
The NH bypass road project was developed on BOT basis, and the bypass was completed in 2001 at
a cost of Rs. 94 crores. The length of the bypass is about 30.35 km and has interchanges on Karwar
Road, Karghatgi Road, and Goa Road. The two-lane highway presently has provision to expand to
four lanes later. The time taken to cover the bypass is 40 min compared to 1 h 20 min on the existing
highway. The intercity transport trucks and buses pass through the city core to avoid paying the toll on
the bypass.
As per the feasibility report for BRTS, the condition of roads in the city is not in a favourable state.
Most of the sub-arterial and collector roads are in a poor condition. Pedestrian safety is poor with
either no footpaths or footpaths in poor condition. Lighting is not as per standards. As per the land use
proposals in Comprehensive Development Plan 2021, 3005 ha (22%) are proposed under
transportation covering the entire twin city area. Several road widening and bypass proposals have
been made in CDP and other studies, truck terminal proposed at the junction of National Highway etc.
are reserved in the plan.
However, most of these proposals have not been implemented so far, resulting in severe stress on
the PB Road between Hubli and Dharwad. The bypass, which is meant for through traffic, is not
widely patronized due to the toll.

Ministry of Urban Development
[107]] Draft City Development Plan – Hubli-Dharwad
Figure 31: Right of way map for Hubli-Dharwad
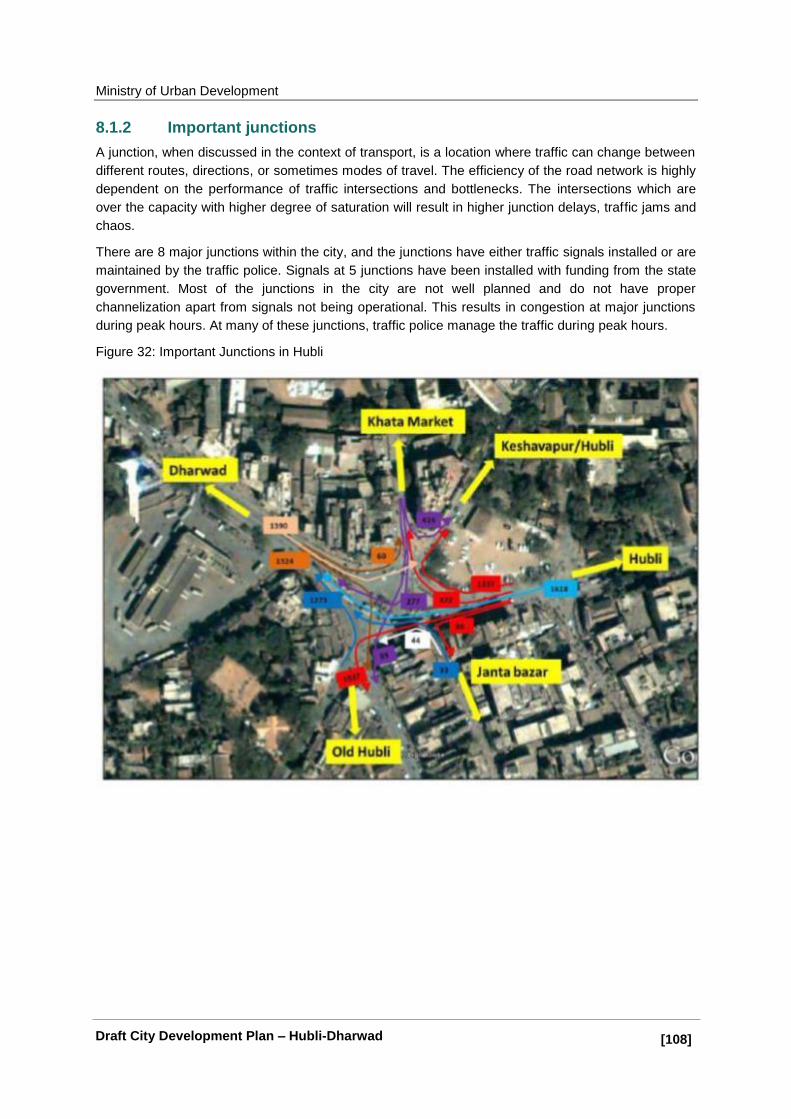
Ministry of Urban Development
[108]] Draft City Development Plan – Hubli-Dharwad
8.1.2 Important junctions
A junction, when discussed in the context of transport, is a location where traffic can change between
different routes, directions, or sometimes modes of travel. The efficiency of the road network is highly
dependent on the performance of traffic intersections and bottlenecks. The intersections which are
over the capacity with higher degree of saturation will result in higher junction delays, traffic jams and
chaos.
There are 8 major junctions within the city, and the junctions have either traffic signals installed or are
maintained by the traffic police. Signals at 5 junctions have been installed with funding from the state
government. Most of the junctions in the city are not well planned and do not have proper
channelization apart from signals not being operational. This results in congestion at major junctions
during peak hours. At many of these junctions, traffic police manage the traffic during peak hours.
Figure 32: Important Junctions in Hubli
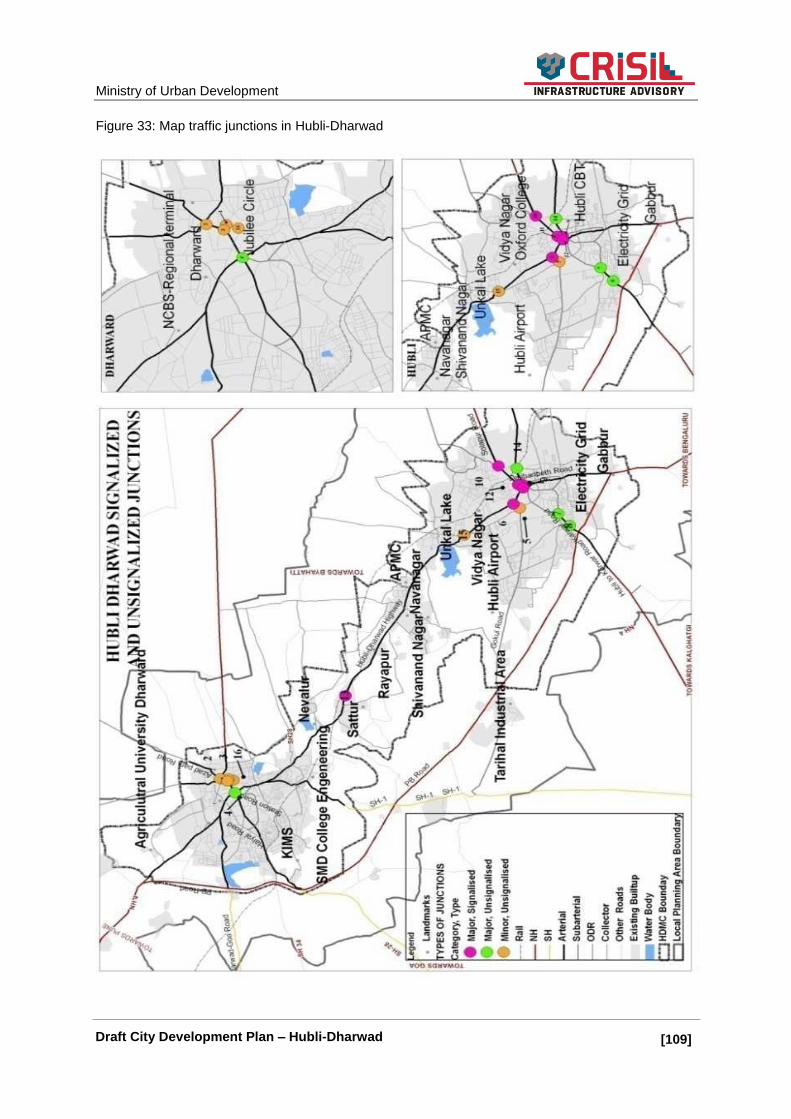
Ministry of Urban Development
[109]] Draft City Development Plan – Hubli-Dharwad
Figure 33: Map traffic junctions in Hubli-Dharwad
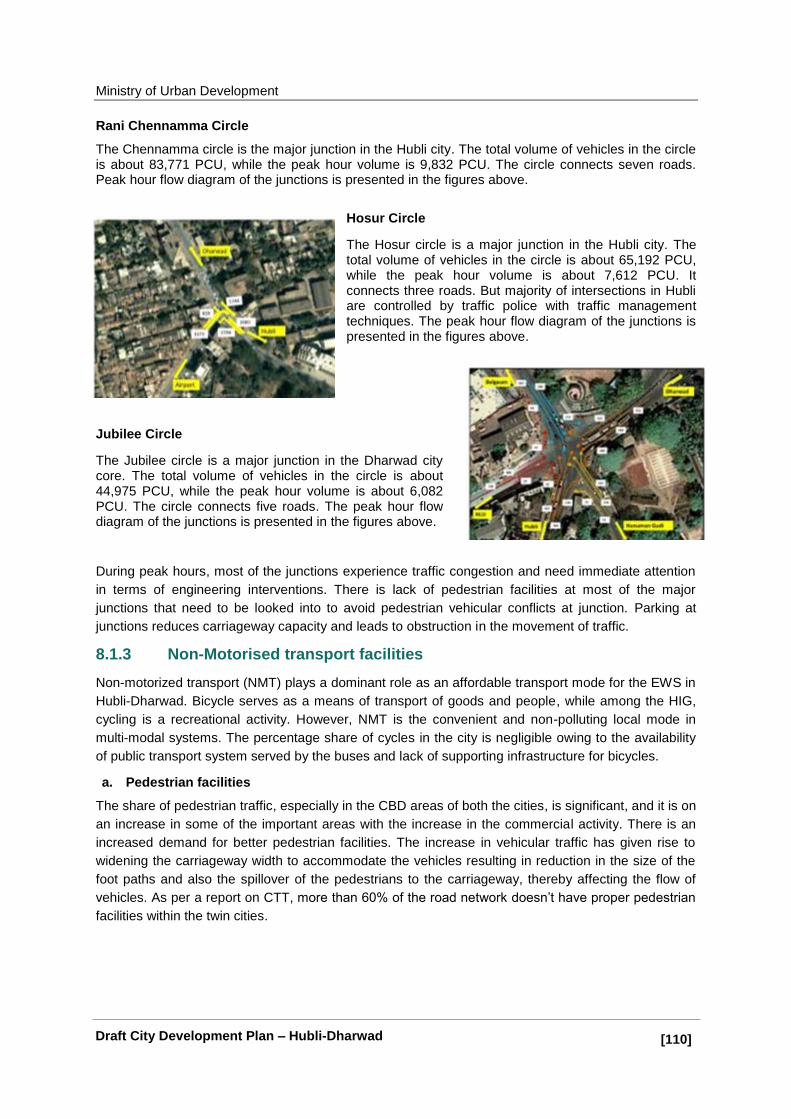
Ministry of Urban Development
[110]] Draft City Development Plan – Hubli-Dharwad
Rani Chennamma Circle
The Chennamma circle is the major junction in the Hubli city. The total volume of vehicles in the circle is about 83,771 PCU, while the peak hour volume is 9,832 PCU. The circle connects seven roads. Peak hour flow diagram of the junctions is presented in the figures above.
Hosur Circle
The Hosur circle is a major junction in the Hubli city. The total volume of vehicles in the circle is about 65,192 PCU, while the peak hour volume is about 7,612 PCU. It connects three roads. But majority of intersections in Hubli are controlled by traffic police with traffic management techniques. The peak hour flow diagram of the junctions is presented in the figures above.
Jubilee Circle
The Jubilee circle is a major junction in the Dharwad city core. The total volume of vehicles in the circle is about 44,975 PCU, while the peak hour volume is about 6,082 PCU. The circle connects five roads. The peak hour flow diagram of the junctions is presented in the figures above.
During peak hours, most of the junctions experience traffic congestion and need immediate attention
in terms of engineering interventions. There is lack of pedestrian facilities at most of the major
junctions that need to be looked into to avoid pedestrian vehicular conflicts at junction. Parking at
junctions reduces carriageway capacity and leads to obstruction in the movement of traffic.
8.1.3 Non-Motorised transport facilities
Non-motorized transport (NMT) plays a dominant role as an affordable transport mode for the EWS in
Hubli-Dharwad. Bicycle serves as a means of transport of goods and people, while among the HIG,
cycling is a recreational activity. However, NMT is the convenient and non-polluting local mode in
multi-modal systems. The percentage share of cycles in the city is negligible owing to the availability
of public transport system served by the buses and lack of supporting infrastructure for bicycles.
a. Pedestrian facilities
The share of pedestrian traffic, especially in the CBD areas of both the cities, is significant, and it is on
an increase in some of the important areas with the increase in the commercial activity. There is an
increased demand for better pedestrian facilities. The increase in vehicular traffic has given rise to
widening the carriageway width to accommodate the vehicles resulting in reduction in the size of the
foot paths and also the spillover of the pedestrians to the carriageway, thereby affecting the flow of
vehicles. As per a report on CTT, more than 60% of the road network doesn‘t have proper pedestrian
facilities within the twin cities.
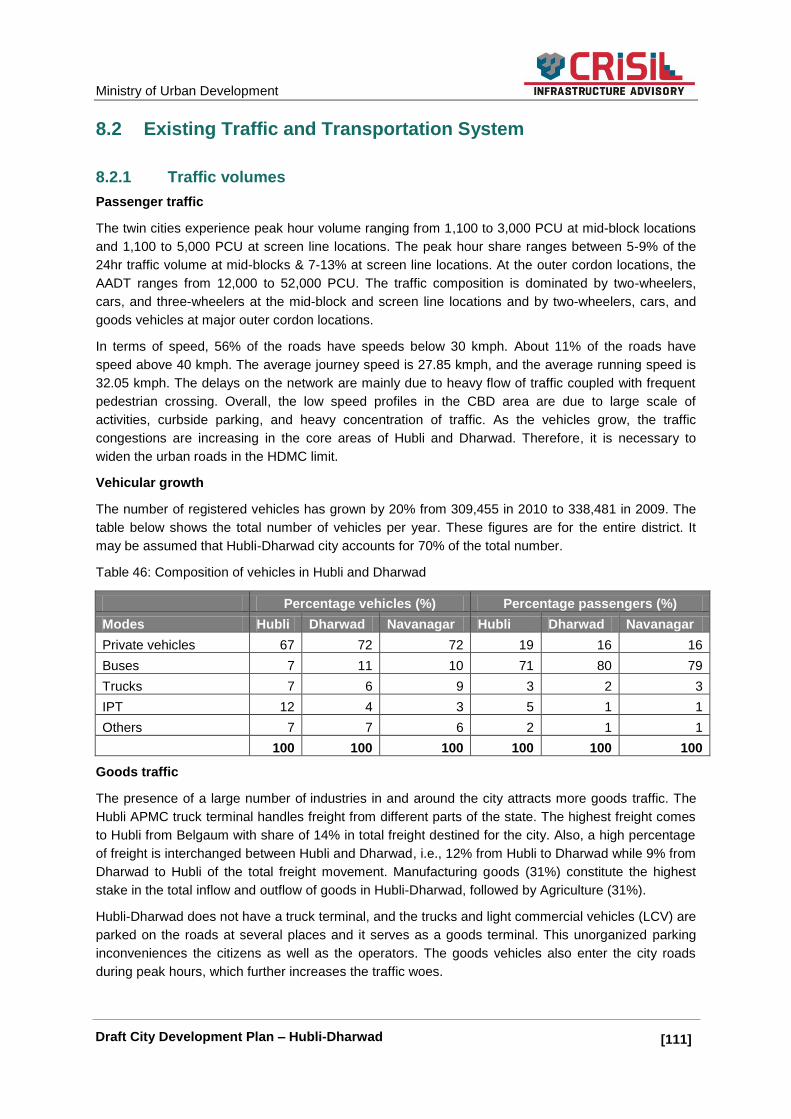
Ministry of Urban Development
[111]] Draft City Development Plan – Hubli-Dharwad
8.2 Existing Traffic and Transportation System
8.2.1 Traffic volumes
Passenger traffic
The twin cities experience peak hour volume ranging from 1,100 to 3,000 PCU at mid-block locations
and 1,100 to 5,000 PCU at screen line locations. The peak hour share ranges between 5-9% of the
24hr traffic volume at mid-blocks & 7-13% at screen line locations. At the outer cordon locations, the
AADT ranges from 12,000 to 52,000 PCU. The traffic composition is dominated by two-wheelers,
cars, and three-wheelers at the mid-block and screen line locations and by two-wheelers, cars, and
goods vehicles at major outer cordon locations.
In terms of speed, 56% of the roads have speeds below 30 kmph. About 11% of the roads have
speed above 40 kmph. The average journey speed is 27.85 kmph, and the average running speed is
32.05 kmph. The delays on the network are mainly due to heavy flow of traffic coupled with frequent
pedestrian crossing. Overall, the low speed profiles in the CBD area are due to large scale of
activities, curbside parking, and heavy concentration of traffic. As the vehicles grow, the traffic
congestions are increasing in the core areas of Hubli and Dharwad. Therefore, it is necessary to
widen the urban roads in the HDMC limit.
Vehicular growth
The number of registered vehicles has grown by 20% from 309,455 in 2010 to 338,481 in 2009. The
table below shows the total number of vehicles per year. These figures are for the entire district. It
may be assumed that Hubli-Dharwad city accounts for 70% of the total number.
Table 46: Composition of vehicles in Hubli and Dharwad
Percentage vehicles (%) Percentage passengers (%)
Modes Hubli Dharwad Navanagar Hubli Dharwad Navanagar
Private vehicles 67 72 72 19 16 16
Buses 7 11 10 71 80 79
Trucks 7 6 9 3 2 3
IPT 12 4 3 5 1 1
Others 7 7 6 2 1 1
100 100 100 100 100 100
Goods traffic
The presence of a large number of industries in and around the city attracts more goods traffic. The
Hubli APMC truck terminal handles freight from different parts of the state. The highest freight comes
to Hubli from Belgaum with share of 14% in total freight destined for the city. Also, a high percentage
of freight is interchanged between Hubli and Dharwad, i.e., 12% from Hubli to Dharwad while 9% from
Dharwad to Hubli of the total freight movement. Manufacturing goods (31%) constitute the highest
stake in the total inflow and outflow of goods in Hubli-Dharwad, followed by Agriculture (31%).
Hubli-Dharwad does not have a truck terminal, and the trucks and light commercial vehicles (LCV) are
parked on the roads at several places and it serves as a goods terminal. This unorganized parking
inconveniences the citizens as well as the operators. The goods vehicles also enter the city roads
during peak hours, which further increases the traffic woes.
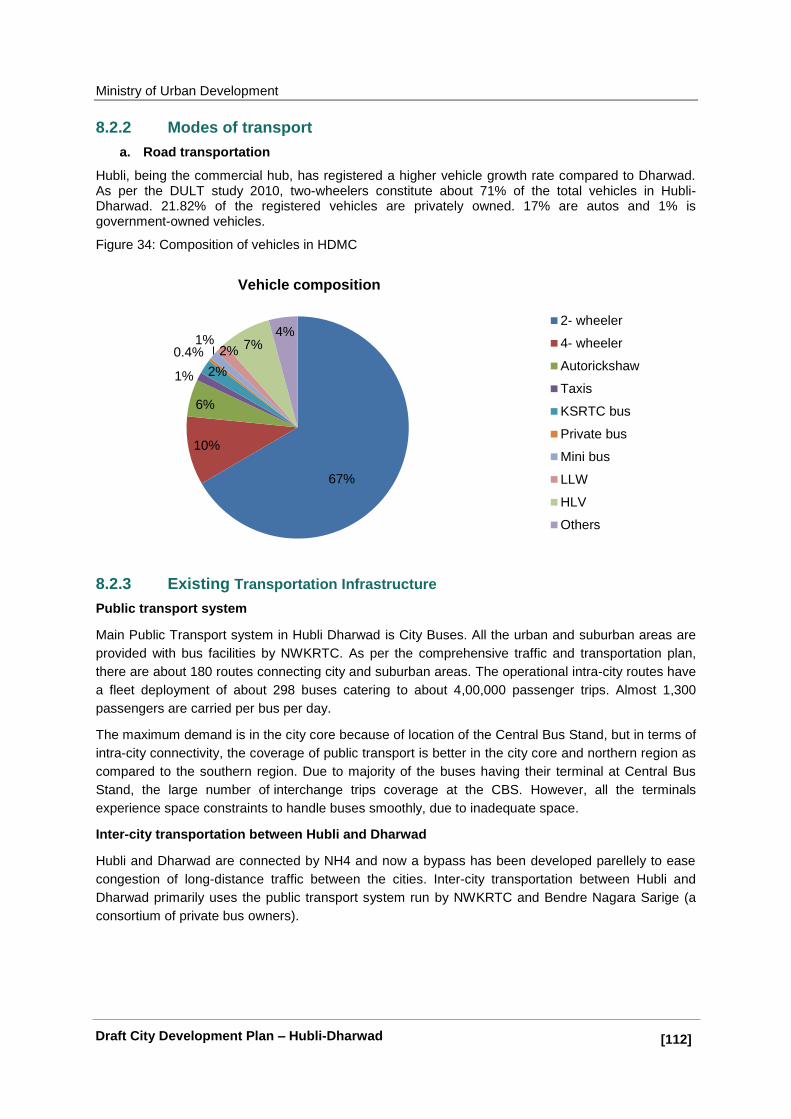
Ministry of Urban Development
[112]] Draft City Development Plan – Hubli-Dharwad
67%
10%
6%
1% 2%
0.4% 1%
2% 7% 4%
Vehicle composition
2- wheeler
4- wheeler
Autorickshaw
Taxis
KSRTC bus
Private bus
Mini bus
LLW
HLV
Others
8.2.2 Modes of transport
a. Road transportation
Hubli, being the commercial hub, has registered a higher vehicle growth rate compared to Dharwad. As per the DULT study 2010, two-wheelers constitute about 71% of the total vehicles in Hubli-Dharwad. 21.82% of the registered vehicles are privately owned. 17% are autos and 1% is government-owned vehicles.
Figure 34: Composition of vehicles in HDMC
8.2.3 Existing Transportation Infrastructure
Public transport system
Main Public Transport system in Hubli Dharwad is City Buses. All the urban and suburban areas are
provided with bus facilities by NWKRTC. As per the comprehensive traffic and transportation plan,
there are about 180 routes connecting city and suburban areas. The operational intra-city routes have
a fleet deployment of about 298 buses catering to about 4,00,000 passenger trips. Almost 1,300
passengers are carried per bus per day.
The maximum demand is in the city core because of location of the Central Bus Stand, but in terms of
intra-city connectivity, the coverage of public transport is better in the city core and northern region as
compared to the southern region. Due to majority of the buses having their terminal at Central Bus
Stand, the large number of interchange trips coverage at the CBS. However, all the terminals
experience space constraints to handle buses smoothly, due to inadequate space.
Inter-city transportation between Hubli and Dharwad
Hubli and Dharwad are connected by NH4 and now a bypass has been developed parellely to ease
congestion of long-distance traffic between the cities. Inter-city transportation between Hubli and
Dharwad primarily uses the public transport system run by NWKRTC and Bendre Nagara Sarige (a
consortium of private bus owners).
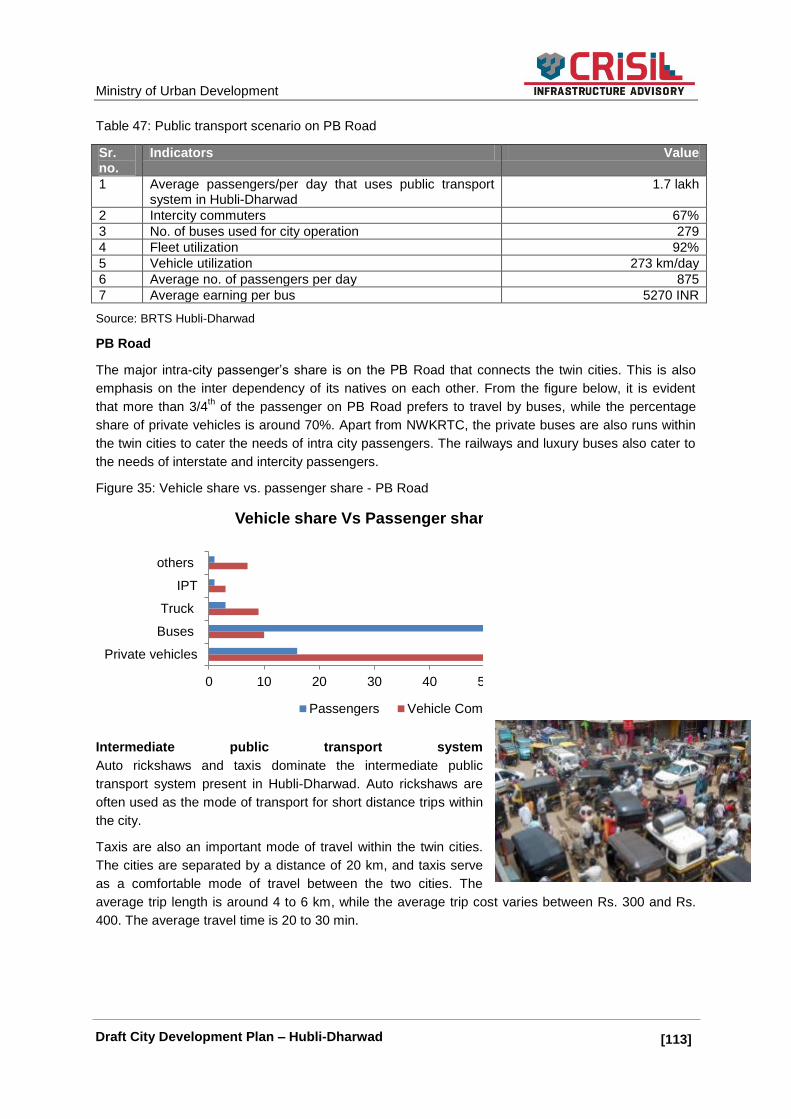
Ministry of Urban Development
[113]] Draft City Development Plan – Hubli-Dharwad
Table 47: Public transport scenario on PB Road
Sr. no.
Indicators Value
1 Average passengers/per day that uses public transport system in Hubli-Dharwad
1.7 lakh
2 Intercity commuters 67%
3 No. of buses used for city operation 279
4 Fleet utilization 92%
5 Vehicle utilization 273 km/day
6 Average no. of passengers per day 875
7 Average earning per bus 5270 INR
Source: BRTS Hubli-Dharwad
PB Road
The major intra-city passenger‘s share is on the PB Road that connects the twin cities. This is also
emphasis on the inter dependency of its natives on each other. From the figure below, it is evident
that more than 3/4th of the passenger on PB Road prefers to travel by buses, while the percentage
share of private vehicles is around 70%. Apart from NWKRTC, the private buses are also runs within
the twin cities to cater the needs of intra city passengers. The railways and luxury buses also cater to
the needs of interstate and intercity passengers.
Figure 35: Vehicle share vs. passenger share - PB Road
Intermediate public transport system
Auto rickshaws and taxis dominate the intermediate public
transport system present in Hubli-Dharwad. Auto rickshaws are
often used as the mode of transport for short distance trips within
the city.
Taxis are also an important mode of travel within the twin cities.
The cities are separated by a distance of 20 km, and taxis serve
as a comfortable mode of travel between the two cities. The
average trip length is around 4 to 6 km, while the average trip cost varies between Rs. 300 and Rs.
400. The average travel time is 20 to 30 min.
Private vehicles
Buses
Truck
IPT
others
0 10 20 30 40 50 60 70 80 90
Vehicle share Vs Passenger share - PB b Road
Passengers Vehicle Composition
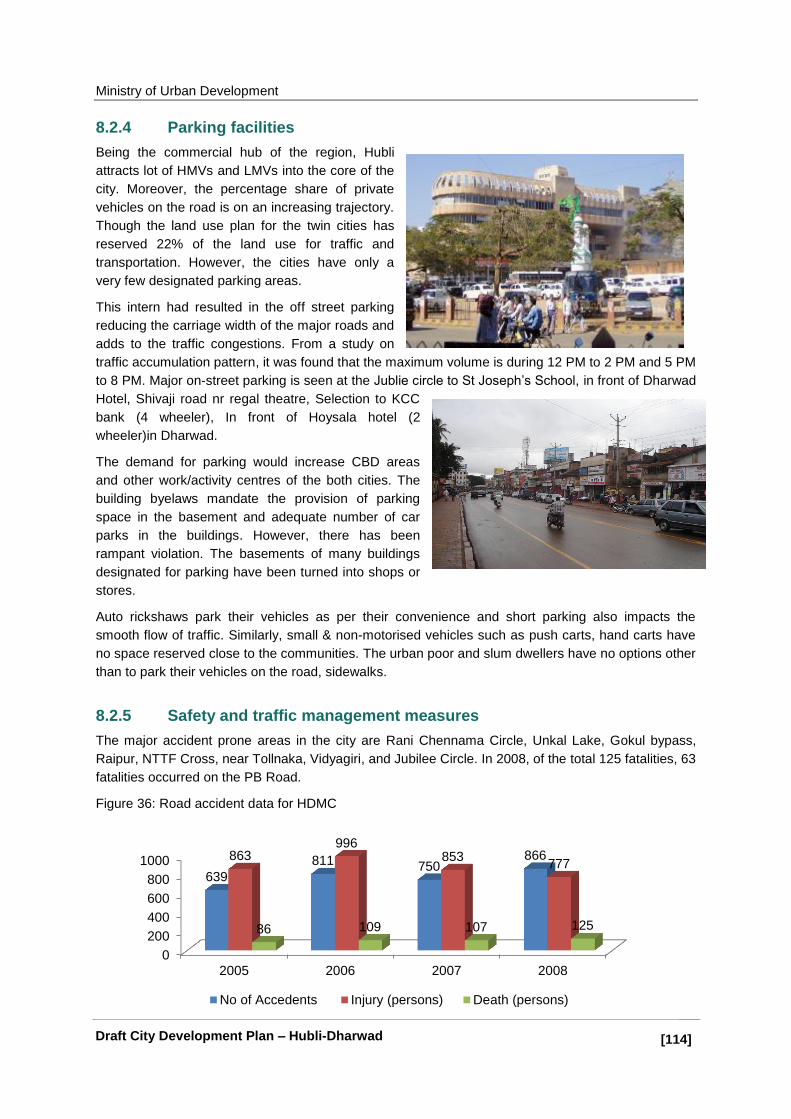
Ministry of Urban Development
[114]] Draft City Development Plan – Hubli-Dharwad
0
200
400
600
800
1000
2005 2006 2007 2008
639
811 750 866 863
996 853
777
86 109 107 125
No of Accedents Injury (persons) Death (persons)
8.2.4 Parking facilities
Being the commercial hub of the region, Hubli
attracts lot of HMVs and LMVs into the core of the
city. Moreover, the percentage share of private
vehicles on the road is on an increasing trajectory.
Though the land use plan for the twin cities has
reserved 22% of the land use for traffic and
transportation. However, the cities have only a
very few designated parking areas.
This intern had resulted in the off street parking
reducing the carriage width of the major roads and
adds to the traffic congestions. From a study on
traffic accumulation pattern, it was found that the maximum volume is during 12 PM to 2 PM and 5 PM
to 8 PM. Major on-street parking is seen at the Jublie circle to St Joseph‘s School, in front of Dharwad
Hotel, Shivaji road nr regal theatre, Selection to KCC
bank (4 wheeler), In front of Hoysala hotel (2
wheeler)in Dharwad.
The demand for parking would increase CBD areas
and other work/activity centres of the both cities. The
building byelaws mandate the provision of parking
space in the basement and adequate number of car
parks in the buildings. However, there has been
rampant violation. The basements of many buildings
designated for parking have been turned into shops or
stores.
Auto rickshaws park their vehicles as per their convenience and short parking also impacts the
smooth flow of traffic. Similarly, small & non-motorised vehicles such as push carts, hand carts have
no space reserved close to the communities. The urban poor and slum dwellers have no options other
than to park their vehicles on the road, sidewalks.
8.2.5 Safety and traffic management measures
The major accident prone areas in the city are Rani Chennama Circle, Unkal Lake, Gokul bypass,
Raipur, NTTF Cross, near Tollnaka, Vidyagiri, and Jubilee Circle. In 2008, of the total 125 fatalities, 63
fatalities occurred on the PB Road.
Figure 36: Road accident data for HDMC

Ministry of Urban Development
[115]] Draft City Development Plan – Hubli-Dharwad
The number of accidents has been increasing over the years in the city due to conflicts of heavy
vehicle, two-wheeler, and pedestrian traffic. However, the number of fatal accidents has been
stagnant.
8.2.6 Issues and key challenges
CRIS has highlighted the important issues in traffic and transportation in Hubli-Dharwad based on
filed visits and review of the comprehensive traffic study and 1st generation CDP. The traffic and
transportation issues are as follows.
The transport network and infrastructure are reasonably developed in Hubli and Dharwad and
22% of area is reserved under transport. The road network density of the developed area is
about 7 km/sq. km. However, the roads within the city are narrow and not fully functional.
Majority of the road network has no provision for service roads, which forces the traffic to use
the principal network for all its local movement. The short trips mixed with long trips severely
affect the level of service of the roadway network as short-trips try to travel at leisure as well
as friction created due to merge/diverge/turning.
It was observed that all major roads have on-street parking, which reduces the effective width
of the travel way intended for traffic movement.
Double parking on some of the major roadways (mostly near the bus stops) has significant
impact on the traffic carrying capacity of the roadway.
Absence of sidewalks on major arterials roads.
It was also observed that pedestrian crossing on the major roadways at undesignated
locations resulted in reduced capacity and unsafe traffic operations along the roadways.
Public transport vehicles account for about 7-11% of the total traffic flow; they take a
disproportionately high load of people movement. Buses carry about 70-80% of the people.
The city lacks an integrated public transportation system. Also, the public transportation hubs,
integrating different mode of public transportation are not available in both the cities.
Lack of exclusive public transportation corridors.
No Integrated transportation infrastructure plans integrated with land use planning
Footpaths/sidewalks are encroached by the hawkers.
Absence of bicycle paths and lack of pedestrian underpasses and over bridges for crossing
the road.
Lack of parking facilities hence people have force parking their vehicles on the streets
8.3 Review of Institutional and Investments
Karnataka Road Transport Corporation (KSRTC) was established in 1960 with the objective of
providing adequate, efficient, economic, and properly coordinated road services. KSRTC has four
corporations in each regions of the state. In Hubli, it is North West KSRTC (NWKSRTC). NWKSRTC
runs interstate, intercity, and intracity buses, and these buses possess the major share of public
transport within the twin cities. NWKRTC division has 540 buses. 6 depots operate under the Hubli
division. Following table presents the functions and responsibilities of various agencies in the
provision of traffic and transportation facility in HDMC limits.

Ministry of Urban Development
[116]] Draft City Development Plan – Hubli-Dharwad
Table 48: Multiple organizations are involved with the transport sector in Hubli-Dharwad
Sr. No.
Name of the Agency
Functions
1 RTO Manage the driver licensing, vehicle registration, and route licensing machinery
2 PWD Maintain major district roads and state highways, including PB Road connecting Hubli and Dharwad
3 KRDCL Construct suburban roads and bridges outside the city limits for maintenance up to first 3 years
4 Police Undertaken traffic management and enforcement of traffic laws
5 NWKRTC Operates intercity and intracity buses for public transport
6 HDMC
Manage public spaces in the city, provide water and sanitation infrastructure facilities, remove encroachments from public spaces, provision of parking spaces, street lighting, footpath development, road maintenance within Hubli and Dharwad
7 HDUDA Undertake master planning and land allocation
8 DULT Coordinate planning and implementation of urban transport projects and programmes
9 HDBRT ltd Coordinate implementation of BRTS project in the twin cities of Hubli and Dharwad
10 KPCB Prescribe and monitor emission standards
8.3.1 Ongoing projects
Bus rapid transit system (BRTS)
Currently, about 70-80% of the passengers are dependent on the bus service between Hubli and
Dharwad. In this regards, Hubli-Dharwad BRTS Company has been established by GoK for the
specific purpose of implementation of BRTS project in the twin cities of Hubli and Dharwad.
The company has an authorized share capital of Rs. 20 crores, out of which 70% is the share of GoK
and the remaining is shared by HDMC, NWKRTC, and HDUDA. The BRTS project has started and is
expected to be commissioned by 2015.
A BRTS corridor has been proposed between Hubli and Dharwad and is 22.25 km long with the width
of the cross sections ranging from 44 m to 35 m. The dedicated bus corridor shall start from Hosur
circle in Hubli to Jublie circle in Dharwad. The BRT buses ply along with the mixed traffic in following
routes:
Beyond Hosur circle up to CBT
Hubli and beyond Jubilee circle up to CBT, Dharwad
The proposal includes trunk corridor segregated bus ways, controlled bus stations, physical and fare
integration with BRT feeder, off-board ticketing through smart cards and tokens, and high quality
buses.
8.4 Transit-Oriented Development
Transit oriented development (TOD) is a recent trend in creating vibrant, livable, compact, walk-able
communities around or along transit (rail/bus) systems to achieve a higher quality life by reducing car
dependency. TOD is defined as a high density, mixed-use type of development close to transit
services.

Ministry of Urban Development
[117]] Draft City Development Plan – Hubli-Dharwad
Figure 37: Transit-oriented development concept
TOD is compact, mixed-use development near new or existing public transportation infrastructure that
provides housing, employment, entertainment, and civic functions within the walking distance of
transit. The pedestrian-oriented design features of TODs encourage residents and workers to drive
their cars less and use public transport more. A 500 m area around the transit station is considered a
5-minute walking distance in the vicinity of transit stations.
Indian cities traditionally have high-density and mixed-use type of development. In such a context,
TOD might already be a reality in some form in Indian cities.
8.4.1 Combination of public transport and land Use
TOD is an integrated approach to land use and transport planning. The primary goal of transit-
oriented development is to shift the auto-centric realm of urban living to a transit-centric realm of
urban living.
TOD is ideal for high-capacity systems such as metro rail, monorail, high-speed rail, regional rail
systems, or high-capacity bus-based mass transit systems. The systems can be selected depending
on the current and future needs, geographical factors, funds availability, etc. Unfortunately, master
plans of most of the Indian cities have not integrated the transport system plans into them.
8.4.2 TOD in India
TOD has been implemented in most developing countries since the 1980s, but this emerging trend is
slowly catching up in India, with the advent of the Mass Rapid Transit System (MRTS) in the form of
metro rail services and high speed transit corridors.
In India, as of now, Delhi has started looking towards TOD as a solution to its mobility and air quality
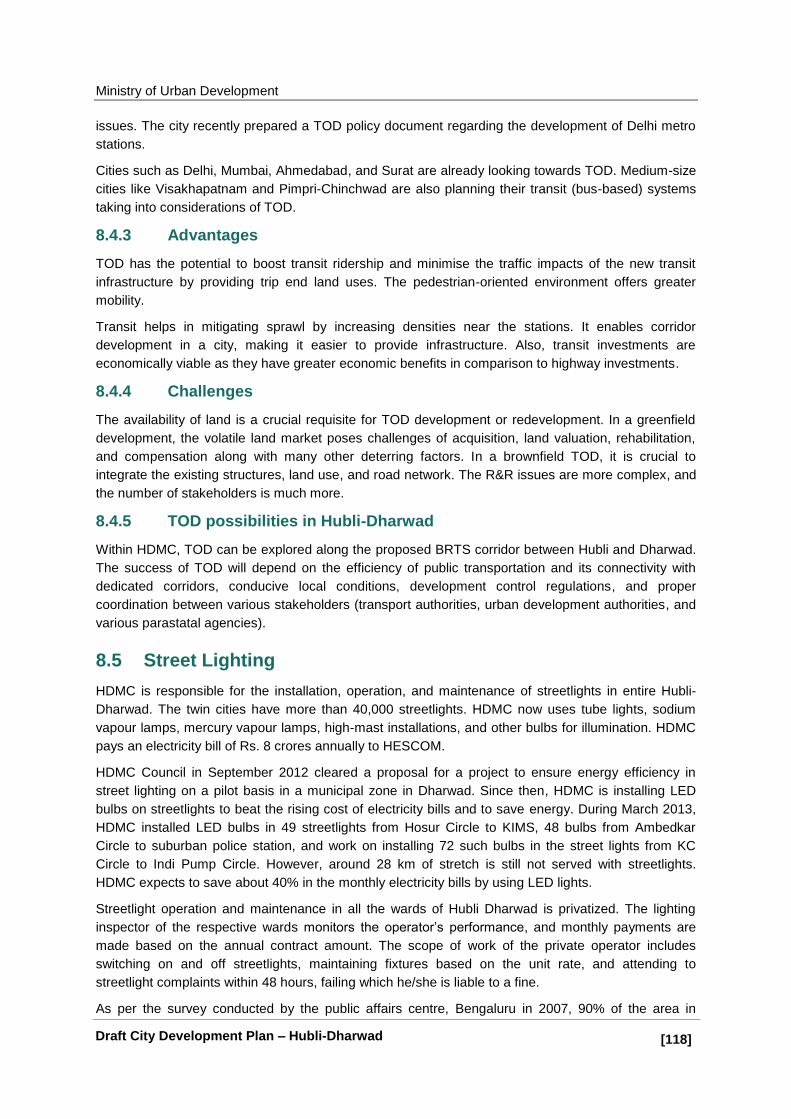
Ministry of Urban Development
[118]] Draft City Development Plan – Hubli-Dharwad
issues. The city recently prepared a TOD policy document regarding the development of Delhi metro
stations.
Cities such as Delhi, Mumbai, Ahmedabad, and Surat are already looking towards TOD. Medium-size
cities like Visakhapatnam and Pimpri-Chinchwad are also planning their transit (bus-based) systems
taking into considerations of TOD.
8.4.3 Advantages
TOD has the potential to boost transit ridership and minimise the traffic impacts of the new transit
infrastructure by providing trip end land uses. The pedestrian-oriented environment offers greater
mobility.
Transit helps in mitigating sprawl by increasing densities near the stations. It enables corridor
development in a city, making it easier to provide infrastructure. Also, transit investments are
economically viable as they have greater economic benefits in comparison to highway investments.
8.4.4 Challenges
The availability of land is a crucial requisite for TOD development or redevelopment. In a greenfield
development, the volatile land market poses challenges of acquisition, land valuation, rehabilitation,
and compensation along with many other deterring factors. In a brownfield TOD, it is crucial to
integrate the existing structures, land use, and road network. The R&R issues are more complex, and
the number of stakeholders is much more.
8.4.5 TOD possibilities in Hubli-Dharwad
Within HDMC, TOD can be explored along the proposed BRTS corridor between Hubli and Dharwad.
The success of TOD will depend on the efficiency of public transportation and its connectivity with
dedicated corridors, conducive local conditions, development control regulations, and proper
coordination between various stakeholders (transport authorities, urban development authorities, and
various parastatal agencies).
8.5 Street Lighting
HDMC is responsible for the installation, operation, and maintenance of streetlights in entire Hubli-
Dharwad. The twin cities have more than 40,000 streetlights. HDMC now uses tube lights, sodium
vapour lamps, mercury vapour lamps, high-mast installations, and other bulbs for illumination. HDMC
pays an electricity bill of Rs. 8 crores annually to HESCOM.
HDMC Council in September 2012 cleared a proposal for a project to ensure energy efficiency in
street lighting on a pilot basis in a municipal zone in Dharwad. Since then, HDMC is installing LED
bulbs on streetlights to beat the rising cost of electricity bills and to save energy. During March 2013,
HDMC installed LED bulbs in 49 streetlights from Hosur Circle to KIMS, 48 bulbs from Ambedkar
Circle to suburban police station, and work on installing 72 such bulbs in the street lights from KC
Circle to Indi Pump Circle. However, around 28 km of stretch is still not served with streetlights.
HDMC expects to save about 40% in the monthly electricity bills by using LED lights.
Streetlight operation and maintenance in all the wards of Hubli Dharwad is privatized. The lighting
inspector of the respective wards monitors the operator‘s performance, and monthly payments are
made based on the annual contract amount. The scope of work of the private operator includes
switching on and off streetlights, maintaining fixtures based on the unit rate, and attending to
streetlight complaints within 48 hours, failing which he/she is liable to a fine.
As per the survey conducted by the public affairs centre, Bengaluru in 2007, 90% of the area in

Ministry of Urban Development
[119]] Draft City Development Plan – Hubli-Dharwad
HDMC is covered by streetlights and the lights function regularly. The survey also stated that the
failure of the services is very minimal.
Table 49: Availability of various types of lamps for streetlights in Hubli-Dharwad
Sr.
No.
Type Number
1 Tube Light 23,126
2 Sodium Vapour Lamps 7078
3 Mercury vapour Lamps 3417
4 High Mast Installation 1012
5 Others 7207
Total 41840
Source: HDMC
HDMC has estimated an amount Rs. 43 crores for the replacement of street lights with energy saving
devices and automatic timers and for up-gradation and beautification of streetlights on main roads
and to install high masts.
8.6 Analysis of Post-1st Generation CDP Scenario
As per the 1st generation CDP, following were the key facts in the traffic and transportation section for
Hubli-Dharwad:
Hubli-Dharwad has a road network of 700 km.
67% of the roads are surfaced (Bitumen – top /WBM).
The density of roads in the town is approximately 3.29 km/sq. km.
The per capita road length is 0.8 km.
The average width of the roads in the town is 9.5 m.
Densification of Hubli and Dharwad road connectivity
Limited share of public transport
Lack of modern traffic management system
Inadequate infrastructure - Roads, truck terminal etc.
Increasing pressure on the core city [Please rewrite in the form of complete sentences.]
Following strategies have been proposed in the 1st generation CDP.
Road Infrastructure
Upgrading Existing Roads
Road Widening
Fly Over Junctions Improvements
Parking and Pedestrianisation
Modern traffic management
Traffic Signals and modern traffic management Enhancing the share of public transport
Dedicated Bus Corridors Rail transport Provide FOBs, footpaths, signage Constitution of an integrated transport authority
The estimated project cost is Rs. 612.00 crores.

Ministry of Urban Development
[120]] Draft City Development Plan – Hubli-Dharwad
8.7 Review of Comprehensive Traffic and Transport Plan (CTTP)
The comprehensive traffic and transport plan for the two cities was prepared by the Directorate of
Urban Land Transport (DULT). The CTTP [If you wish to use the abbreviation, please use it right from
the starting of the document.] outlined the strategies to be followed to ensure mobility and
accessibility to the growing population of the twin cities. The review of CTTP has been provided in the
sub-sections below.
Existing Traffic and Transport Situation
Hubli-Dharwad has a road network of 700 km. The total length of roads in the territorial jurisdiction of
HDMC is 630 km, of which 67% are surfaced (Bitumen –top / WBM). The density of roads in the town
is approximately 3.29 km/sq. km. The per capita road length is 0.8 km. The average width of the roads
in the town is 9.5 m. Roads cover an area of 22.69 sq. km.
The city experiences peak hour volume ranging from 1,100 to 3,000 PCU at mid-block locations and
1,100 to 5,000 PCU at screen line locations. Peak hour share ranges between 5-9% of the 24hr traffic
volume at mid-blocks & 7-13% at screen line locations. At outer cordon locations, the AADT ranges
from 12,000 to 52,000 PCUs. The traffic composition is dominated by two-wheelers, cars, and three-
wheelers at the mid-block and screen line locations & by two-wheelers, cars, and goods vehicles at
major outer cordon locations.
In terms of speed, 56% of the roads have speeds below 30 kmph. Only 11% of the roads have speed
above 40 kmph. The average journey speed is 27.85 kmph and the average running speed is
32.05 kmph. Delays on the network are mainly due to heavy flow of traffic coupled with frequent
pedestrian crossing. Overall, the low speed profiles in CBD area are due to large scale of activities,
curbside parking, and heavy concentration of traffic.
Hubli-Dharwad city is witnessing considerable pedestrian traffic, especially in the CBD areas with the
increase in the commercial activity in some of the important areas. There is an increased demand for
better pedestrian facilities. The increase in vehicular traffic has given rise to widening the carriageway
width to accommodate the vehicles resulting in reduction in the size of the foot paths. This in turn has
given room for pedestrians to spill over to the carriageway, thereby affecting the flow of vehicles.
Main Public Transport system in Hubli Dharwad is City Buses. There are about 180 routes connecting
the city and suburban areas. The city buses operate from 4 different terminals. All the urban and
suburban areas are provided with bus facilities by NWKRTC. All the terminals experience space
constraints to handle buses smoothly, due to inadequate space. Also, it is observed that in terms of
intracity connectivity, the coverage of public transport is better in the city core and northern region as
compared to the southern region, and there is overlapping component in city core area due to which
travel demand from other areas is not fully catered to.
The intermediate public transport system present in Hubli-Dharwad consists of auto rickshaws and
taxis. Auto rickshaws are often used as a mode of transport for school children. With the upsurge of
the city area, the public transport system has not been able to justify the mobility needs of the Hubli-
Dharwad citizens. Thus, there is an increase in the usage of auto rickshaws and taxis. Taxis are an
important mode of travel in the twin cities. The cities are separated by a distance of 21 km, and taxis
serve as a comfortable mode of travel between the two cities. The average trip length is around
4.0 km to 6.0 km, while the average trip cost varies between Rs. 30 and Rs. 40. The average travel
time is 20-30 min.
From the traffic flow analysis and junction inventory details, it is observed that some of the junctions
experience traffic snarls and needs immediate attention in terms of engineering interventions. There is

Ministry of Urban Development
[121]] Draft City Development Plan – Hubli-Dharwad
lack of pedestrian‘s facilities at most of the major junctions that need to be looked into to avoid
pedestrian vehicular conflicts at junction. Parking at junctions reduces the carriageway capacity and
leads to obstruction in the movement of traffic.
In Hubli-Dharwad, the growth of vehicles had been exponential with no specific parking lots designed.
As a result, the vehicles are generally found to be parked on road, causing traffic congestion and
conflict points. The parking on the road eats up the valuable space for movement leaving lesser place
for the vehicles to move. This reduces the speed of travel and reduces the level of service of the
roads. Thus, an efficient system of parking needs to be evolved, which would solve the parking woes
of the city.
Goods traffic is significantly high in Hubli-Dharwad due to the presence of a large number of industries
in and around the city. Hubli-Dharwad does not have any defined goods terminal. Presently, trucks
and light commercial vehicles (LCV) are parked on roads at several places and it serves as a goods
terminal. This unorganized parking inconveniences the citizens as well as the operators. The vehicles
also enter the city roads during peak hours, which further increase the traffic woes. The Hubli APMC
truck terminal handles freight from different parts of the state. The highest freight comes to Hubli from
Belgaum with share of 14% in total freight destined for the city. Also, a high percentage of freight is
interchanged between Hubli and Dharwad, i.e., 12% from Hubli to Dharwad while 9% from Dharwad
to Hubli of the total freight movement. Manufacturing goods (31%) constitute the highest stake in the
total inflow and outflow of goods in Hubli-Dharwad, followed by Agriculture (31%).
The existing infrastructure and facilities for transport and communication in Hubli-Dharwad are
inadequate to meet the requirements of the city. Integration of transport facilities with the economic
activity areas has not been a priority.
Travel Demand Forecast and Model
For the preparation of the comprehensive traffic and transport plan for Hubli-Dharwad, the population
projection is taken from the Hubli Dharwad City Development Strategy. The average population as
given in the strategy is 10.5 lakhs in 2021. This translates to a 1.6% annual growth rate. Based on this
growth rate the population has been projected. The strategic urban travel demand model developed
under this study is used to predict the travel patterns and modal shares for the horizon years, i.e.,
2018, 2023, and 2028, under respective land-use and transport network scenarios.
The population growth rates have been taken from the city development plan of Hubli-Dharwad. The
population of Hubli-Dharwad has been projected using the geometric method, arithmetic progress
method, incremental increase method, and trend line method. The projected population and
employment for 2018, 2023, and 2028 were used for estimating trip ends in the corresponding years.
Hubli-Dharwad is estimated to have a population of 12.66 lakhs and employment of 4.34 lakhs in
2028.
Name of the Area Projected Population in the Study Area
2009 2018 2023 2028
Hubli - Dharwad LPA
9,59,844 10,80,820 11,70,097 12,66,748
Projected Employment in the Study Area Hubli Dharwad LPA
3,29,226 3,70,721 4,01,343 4,34,495
Trip end models have been used to predict the number of trips generated from and attracted to each
of the zones in the study area for the horizon year. The projected trip ends along with the network
options in the future were provided as inputs to the trip distribution and modal split models to arrive at
future trip matrices for public and private vehicles. The proposed land use 2021 has been used for
Ministry of Urban Development
[122]] Draft City Development Plan – Hubli-Dharwad
projecting the trip ends. Following scenario has been considered for the city traffic and transportation
improvement plan.
Scenario: Construction of Outer Ring Road and Public Transport Route Rationalization
Considering the evaluation of the above scenario, the most important issue to reduce traffic will be to
increase the share of trips by public/mass transport. This will mean providing public transport services
on all corridors. The public transport network and road network has to be introduced on certain
network. The backbone to a city‘s transport system will be the Public / Mass Transport System. The
basic premise of the transport plan in terms of the National Urban Transport Policy is to create an
efficient, cost-effective, and extensive network of public transport, which could provide comfortable,
convenient, and affordable means of transport to the maximum number of commuters. In this
direction, a number of schemes are already under implementation and quite a few on board. Keeping
in view these plans, there exist a large number of requirements for additional facilities in respect of
public transport system.
There are few additions to network modification in Scenario 3:
Construction of Outer Ring Road
Expansion of public/mass transport (BRT) on to major corridors
Construction of two new bypasses
It is understood that only network changes will not be able to suffice the changing transport
requirements of the city. Thus, change in travel patterns has to be introduced. Improvements in public
transport system have to be detailed with the network improvements to achieve the targeted modal
split.
The share of person trips for public/mass transport is targeted to increase to 60% by 2028, as is
desirable for Hubli-Dharwad city in this scenario. The increase in modal split is attributed to the
expected shift of people from private to public due to the improved public transport system. This
translates to 24.4% of the users of other modes shifting to buses. At conservative year-on-year
growth, this is targeted to result in a modal split of 40% for 2018, 50% for 2023, and 60% for 2028.
The willingness to shift to the public transport system has been assumed based on secondary
research.
It is also observed that for the horizon year 2028, the peak hour peak direction traffic (p) for following
corridors is greater than 10,000. Hence, it is proposed to introduce high-capacity buses in these
corridors in order to achieve a modal split of more than 60% in the favour of public transport.
The introduction of high-capacity buses and a significant modal split will change the traffic and
transport scenario of Hubli-Dharwad. The volume by capacity ratio on major stretches after public
transport improvement and construction of ring road is calculated it indicates that certain stretches still
have unacceptable values of V/ C ratios. In such a case, it is necessary to find alternatives to control
private vehicular movement on such stretches. Some measures that can be adopted are as follows:
One-way schemes
Banning of private vehicles during peak hours
Construction of elevated / subway for these particular roads
It is important to note that the bypass around Hubli and Dharwad helps in diverting the rail-based
freight traffic entering destined or generated in Hubli and Dharwad. In addition, stringent enforcement
measures are needed (that shall ban the entry of freight vehicles on city roads) to force the external
traffic to use NH4 and Hubli-Dharwad bypass, thus reducing the loading of the internal roads.

Ministry of Urban Development
[123]] Draft City Development Plan – Hubli-Dharwad
Recommended Scenario
The transport scenario should be such that transport continues to be an induced demand and does
not changes into an activity itself, i.e., the role of transport systems should be of facilitating
connectivity and not resisting it consuming indefinite passenger hours leading to lower productivity
and high social costs. The reasoning behind considering the scenario Construction of Outer Ring
Road and Public Transport Route Rationalization to be of high utility value is:
Higher modal split in favour of PT
Provision of better public transport facilities to stimulate modal shift from private to public
Incorporation of all existing proposals regarding capacity augmentation
Capacity augmentation on critical road sections
Construction of ring road
Improvement in the public transport system includes a variety of systems that will use buses to
provide a service that is of a higher speed than an ordinary bus line. This will be achieved through
improvements to the existing infrastructure, vehicles, and scheduling. The goal of this system will be
to achieve the service quality of rail transit still enjoying the cost effectiveness of bus transit.
Proposals, Recommendations, and Institutional Framework
In accordance with the recommended scenario priorities, the proposed transport development
programme has been framed. On the basis of projected traffic, a public transport system plan
indicating different transport systems on various corridors has been suggested in order to cater to the
traffic up to the year 2028. The balance traffic should be carried by road system in order to satisfy the
needs of normal bus system and other modes such as two wheelers, cars, bicycles, trucks,
pedestrians etc. The proposed traffic and transportation plan for Hubli-Dharwad contains the following
types of proposals, which will cater to the requirements of the projected travel demand up to the year
2028:
Mass Transport System
Bus Rapid Transport System
City Bus System
Augmentation of Bus Fleet
Bus Terminal cum Traffic and Transit Management Centres (TTMC)
New Bus Stations/Bus Shelters
IT Infrastructure
HRD Infrastructure
Transport Integration
Transport System Management Measures
Pedestrian/NMT Facilities
Footpaths
Skywalks/Subways
Road Development Plan
New Roads/Missing Links
Road Widening
Construction of ROBs and RUBs
Grade Separator
Parking Facilities
Integrated Freight Complexes

Ministry of Urban Development
[124]] Draft City Development Plan – Hubli-Dharwad
While framing proposals, priority has been given to public transport and non-motorized transport such
as pedestrian facilities and public transport improvement strategies.
On the institutional framework front, HDUDA and HDMC have been envisaged as the most important
institutions responsible for the planning, development, and maintenance of the city transport system,
particularly of its road network system, parking areas, bus terminals, etc. While it is not contemplated
to restructure HDUDA/HDCC under the CTTP project, the above proposals are recommended to
enable HDUDA/HDCC to undertake and monitor CTTP projects. Other recommendations on the
institutional framework are:
Representation in Hubli Dharwad Unified Transport Authority
Establishing Traffic Engineering and Management Unit
Establishing Traffic Engineering Cells
Establishing Traffic Management Group
Establishing Transport Development Fund
Strengthening Logistics Support & Capacity Building to Traffic Police
Promoting Private Sector Participation
Cost Estimates of Proposals and Phasing of Implementation
The estimated investment for the entire traffic and transportation plan based on the public transport
oriented system for the period till 2028 is estimated to be Rs. 3,105 crores at 2009 prices. More than
three-fourth of this investment is proposed during the period 2009-18, which coincides with the
JNNURM mission period. The proposed Implementing agency and tentative financing structure for
each of the major investments proposed is dealt with briefly below.
Sr. No.
Project Implementing Agency
Funding Mechanism
Phase Cost (Rs in Crores)
Road Infrastructure Development Plan: Rs. 1109.38 crores
1.1 Construction of Hubli Ring Road
HDMC / HDUDA PPP / BOT(Annuity) Phase I 321.82
1.2 Radial Roads Improvement
Cash Contract Phase I 62.10
1.3 Hubli Dharwad Bypass (new construction plus improvement)
Cash Contract Phase I 267.93
1.4 Other City Roads Improvement
Cash Contract Phase I 22.05
1.5 Construction of Missing Links
435.48
Improvement in City Bus System and Intercity Bus Terminals: Rs. 1528.58 crores
2.1 Addition of Bus Fleet
NWKRTC Cash Contract Phase I, II, and III
140.14
2.2 Bus Terminal cum Traffic and Transit Management Centres (TTMC)
Cash Contract Phase I 292.50
2.3 New bus shelters Cash Contract Phase I 18.20
2.4 Improvement and addition of depots
PPP/BOT Phase I, II, and III
37.88
2.5 Improvement of IT infrastructure
Cash Contract Phase I 239.20
2.6 Multimodal Transit Centre at Hubli-Dharwad
Cash Contract Phase I 5.00

Ministry of Urban Development
[125]] Draft City Development Plan – Hubli-Dharwad
Sr. No.
Project Implementing Agency
Funding Mechanism
Phase Cost (Rs in Crores)
2.7 Development of HRD Centre
Cash Contract Phase I 15
2.8 Environment Protection Projects
Cash Contract Phase I 63.70
2.9 Intercity Bus Terminals
PPP/BOT Phase I 49.00
BRT Phase I, II 667.97
3. Junction improvements: Rs. 128.60 crores
3.1 Geometric Improvements
HDMC / HDUDA Cash Contract Phase I 1.10
3.2 Signalized Cash Contract Phase I 1.00
3.3 Roundabout Cash Contract Phase I 6.50
3.4 Grade Cash Contract Phase I 120.00
4 ROBs, RUBs and Rail
HDMC / HDUDA /Railways
Cash Contract Phase I 80.00
5 Pedestrian facilities
130.79
5.1 Footpath HDMC Cash Contract Phase I 105.00
5.2 Passenger subway Cash Contract Phase I 12.00
5.3 Passenger skyway Cash Contract Phase I 13.79
6 Parking facilities HDMC PPP/BOT 69.90
7 Integrated Freight Complexes
HDUDA PPP/BOT Phase I 5
8 Transport System Management Measures
HDMC Multilateral Agencies -World Bank, Asian Development Bank
Phase I 132.00
9 IPT stands HDMC / HDUDA Cash Contract Phase I 0.80
10 NMT Track Cash Contract Phase I 100.20
Grand Total 3285.25
Source: Comprehensive Traffic and Transportation Plan –Hubli Dharwad
Ministry of Urban Development
[126]] Draft City Development Plan – Hubli-Dharwad
9. Housing and Urban Poverty
The section provides a detailed overview of the existing housing scenario in the city in terms of
present housing stock, quality of housing, and housing requirement for future projected population.
Also, the housing typology in the inner city, newly developed areas, and peripheral zones has been
discussed. Based on discussions with officials and stakeholders, the future housing growth scenario
has been forecasted. The section on urban poverty explains the demographics, social profile, and
coverage of key infrastructure services in the urban poor area of the city. Also, the status of the
projects related to the urban poor has been discussed.
9.1 Overall Housing Scenario in the City
Hubli-Dharwad city exhibits a complex urban character where each area exhibits its own
characteristics. The old city areas of both the cities have retained their traditional character and ethos,
thereby acting as religious nodes. The core is thickly populated with deteriorated infrastructure and
weak service levels. The adjacent area to the city core has always been under constant development
pressure due to the availability of basic services, cultural attractions, and density is increasing.
In contrast, the peripheral areas exhibit a different development pattern with comparatively planned
development pattern and better infrastructure, thereby encouraging the population to shift from older
areas to these areas for a better living and hygienic life. The areas in between the cities more or less
retain their original character and are not so influenced by urbanization in the way it is happening in
the city centre. The city is characterized by medium-rise and high-density housing in the core city and
low-rise moderate dense housing in the peripheral areas. The last decade has witnessed
development of multi-rise residential and commercial structures.
9.1.1 Present availability of housing stock
As per Census 2011, around 2.14 lakh houses are available in Dharwad‘s urban area. It is estimated
that Hubli-Dharwad city has nearly 1.82 lakh census houses under residence and residence cum
other use categories. As per the comprehensive development plan, the number of houses estimated
in the city was around 1.40 lakhs, and houses required by the year 2021 will be about 2.20 lakhs.
This means that addition of about 80,000 houses is necessary. With the increasing urbanization and
population, the increase in housing could not match with the increasing demand, which resulted in
housing gap and insufficient infrastructure.
9.1.2 Quality of housing stock
The quality of the housing stock for residential and residential cum other use categories has been
analyzed for 2011. As per Census 2011, the city has nearly 1.82 lakh census houses under residence
and residence cum other use categories. Out of this, about 1.26 lakh houses are in a good condition,
which accounts for 69% of the total housing. And 0.53 lakh houses are in a livable condition, which
account for 29% of the total houses. About 3,615 houses are in a dilapidated condition, which account
for merely 2% of the total houses.

Ministry of Urban Development
[127]] Draft City Development Plan – Hubli-Dharwad
Figure 74: Quality of housing
9.1.3 Spatial distribution of houses and settlement characteristics
As per Comprehensive Development Plan 2003, about 31% of the total land area was developed
under the residential category. It is evident from the figure below that the major concentration of
houses was within in the core of Hubli and Dharwad. A significant percentage of land in Dharwad was
under the industrial category. The development plan has envisaged increased residential
development within and in between the twin cities and reserved around 42% of the land area under
the residential category, of which 21% is in Hubli, 11% is in Dharwad, and 9% is in Navanagar.
Figure 38: Fig existing land use in 2000 and proposed land use in 2031
The plans proposed for high intensive development in between the cities. In Navanagar, large areas
to the west of the national highway are proposed for development, covering Tadasinakoppa, Sattur,
Sutagatti, and Gamanagatti areas. However, most of the new residential developments are
concentrated around the twin cities due to the lack of infrastructure in-between areas and also the
proximity to the commercial establishments and transport nodes. KSHB has developed a residential
colony on the west side of the PB Road in Navanagar.
The old city core of both Hubli and Dharwad is getting crowded. The density analysis indicated that
the pressure on land and infrastructure is high, beyond the carrying capacity. Also, it is observed that
the buildings are in a poor condition and around 50% of the buildings in the old city area of Hubli
required to be either repaired or replaced.
In the last decade, the eastern area of Hubli has experienced high residential development;

Ministry of Urban Development
[128]] Draft City Development Plan – Hubli-Dharwad
Keshwapur has emerged as one of the best residential areas, due to its locational advantage and
proximity to the transport nodes. Keshwapur has planned layouts with wide road networks and plotted
development is more prevalent in the area. Most of the residential buildings are of independent 2-3
storied villas. The plot sizes available in the area are in the range of 1600 to 4000 sq. ft.
Gokul Road is the major investment destination emerged in Hubli, where all the new commercial and
residential projects are coming up. Most of the residential projects in the area are under the apartment
category with 3-4 storeyed buildings.
Hubli-Dharwad city has around 45 villages; the villages on the outskirts are in a deteriorate condition
compared to the upcoming areas. The residents were dependent on agriculture, and induced
urbanization has forced them sell of their fertile land for real estate development. The housing
condition in the gamathal area has clustered type of settlements with single story buildings either
thatched or tiled, but it is observed that the most of the houses are in livable condition but lacks
modern amenities and infrastructure. These clusters neither have modern facilities nor are eligible for
any government aid under slum improvement.
The slums are spread across both cities; most of the slums within the city are notified and regularized.
HDMC is providing the basic infrastructure services like drinking water, roads, and waste collection.
The slums located on the outskirts of the cities are not notified and hence not able avail all the
services offered by the municipal corporation. A detailed analysis of the slum situation is included in
the subsequent sections.
9.1.4 Housing requirement as per the future projected population
As per the projected land use for the city, 42% of the area has been earmarked for residential use for
the year 2021. In order to estimate the housing stock requirement for the next three decades, we
have adopted the following assumptions:
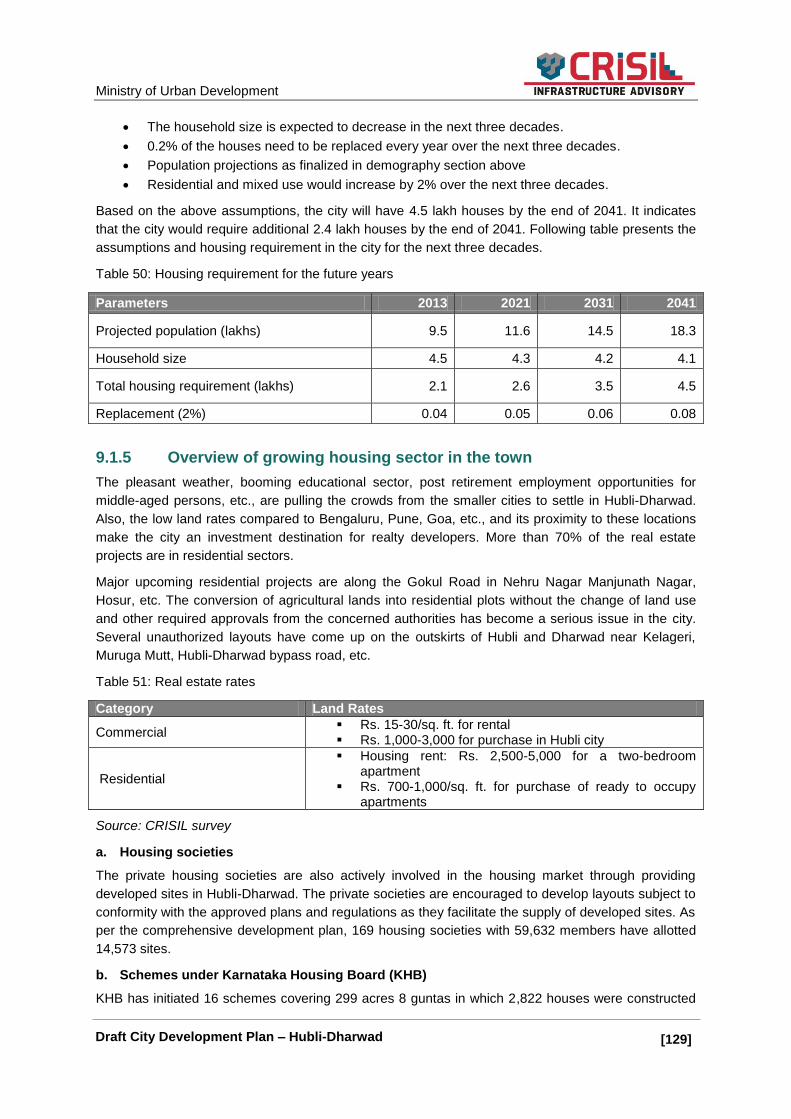
Ministry of Urban Development
[129]] Draft City Development Plan – Hubli-Dharwad
The household size is expected to decrease in the next three decades.
0.2% of the houses need to be replaced every year over the next three decades.
Population projections as finalized in demography section above
Residential and mixed use would increase by 2% over the next three decades.
Based on the above assumptions, the city will have 4.5 lakh houses by the end of 2041. It indicates
that the city would require additional 2.4 lakh houses by the end of 2041. Following table presents the
assumptions and housing requirement in the city for the next three decades.
Table 50: Housing requirement for the future years
Parameters 2013 2021 2031 2041
Projected population (lakhs) 9.5 11.6 14.5 18.3
Household size 4.5 4.3 4.2 4.1
Total housing requirement (lakhs) 2.1 2.6 3.5 4.5
Replacement (2%) 0.04 0.05 0.06 0.08
9.1.5 Overview of growing housing sector in the town
The pleasant weather, booming educational sector, post retirement employment opportunities for
middle-aged persons, etc., are pulling the crowds from the smaller cities to settle in Hubli-Dharwad.
Also, the low land rates compared to Bengaluru, Pune, Goa, etc., and its proximity to these locations
make the city an investment destination for realty developers. More than 70% of the real estate
projects are in residential sectors.
Major upcoming residential projects are along the Gokul Road in Nehru Nagar Manjunath Nagar,
Hosur, etc. The conversion of agricultural lands into residential plots without the change of land use
and other required approvals from the concerned authorities has become a serious issue in the city.
Several unauthorized layouts have come up on the outskirts of Hubli and Dharwad near Kelageri,
Muruga Mutt, Hubli-Dharwad bypass road, etc.
Table 51: Real estate rates
Category Land Rates
Commercial Rs. 15-30/sq. ft. for rental Rs. 1,000-3,000 for purchase in Hubli city
Residential
Housing rent: Rs. 2,500-5,000 for a two-bedroom apartment
Rs. 700-1,000/sq. ft. for purchase of ready to occupy apartments
Source: CRISIL survey
a. Housing societies
The private housing societies are also actively involved in the housing market through providing
developed sites in Hubli-Dharwad. The private societies are encouraged to develop layouts subject to
conformity with the approved plans and regulations as they facilitate the supply of developed sites. As
per the comprehensive development plan, 169 housing societies with 59,632 members have allotted
14,573 sites.
b. Schemes under Karnataka Housing Board (KHB)
KHB has initiated 16 schemes covering 299 acres 8 guntas in which 2,822 houses were constructed
Ministry of Urban Development
[130]] Draft City Development Plan – Hubli-Dharwad
and 1,819 sites were formed. Five schemes are proposed covering 191 acres 34 guntas at
Gopanakoppa, Amargol, Lakamanahalli, Gamangatti, and Doddanaykanakoppa. The layouts by
Karnataka Housing Boards have come up along the old highway.
c. Housing for EWS
The Karnataka Slum Clearance Board (KSCB) has notified 48 slums in Hubli-Dharwad covering 216
acres 33.5 guntas in which 9,539 houses are presented. The population in these slums is about
80,592 persons. However, in the SFCPoA, the number of notified slums has been increased to 93
and the total number of slums to 127.
The rapid growth of slums in Hubli-Dharwad has put a lot of pressure on the existing land resources
and infrastructure services, leading to further deterioration of physical infrastructure. Factors that
contribute to slum development in Hubli-Dharwad include migration of people for jobs and availability
of cheap living options such as outside temple complex where they get offerings of pilgrim and
tourists.
9.2 Urban Poverty and Slums
One of the key objectives of the city development plan is to create pro-poor and inclusive cities.
During the visit to the city, during the field study it is observed that the categories of settlements that
are the manifestation of poverty in the Hubli-Dharwad:
Low-income group settlements: Pucca and semi-pucca houses with limited urban services and
dedicated for lower income groups
Village settlement: The settlements which were earlier villages but have now become part of the
city and such settlements still retain their cluster development structure. About 45 villages were
included in HDMC jurisdiction.
Slums: Kutcha houses with unhygienic living condition and with limited urban services
Population below the Poverty Line (BPL)
As per the BPL survey conducted in the year 2000, under Nirmala Jyothi Scheme, it was estimated
that 6% (47,160) of the total population in Hubli-Dharwad were in the BPL category. In 2006, the SE
survey conducted by CMDR reported that 26% of the population in Hubli-Dharwad is the BPL and
43% of them reside in slums.
9.2.1 Slum profile in Hubli-Dharwad
The slum free city plan of action (SFCPoA) for Hubli-Dharwad has identified about 127 clusters as
slums in the city, and out of which, 93 have been declared as notified slums by KSCB. The total
population in slums is about 174,577, which is 18% of the total city population. About 37,319
households are living in slums and 84% (31225) of them belong to the BPL category.
However, as per HDMC, in 2013, the number slums in the twin cities was 138 with 201,752 people in
37,611 households. The percentage of notified slums and slum population in Hubli-Dharwad are on
an increase primarily due to rural to urban migration. This is evident from the increase in the number
of slums declared by KSCB during the previous two decades.

Ministry of Urban Development
[131]] Draft City Development Plan – Hubli-Dharwad
Table 52: Details of slums over the years
Sr. No.
Slums Source
Total Notified Non-Notified Population Household
1 70 48 22 101372 14311 KSCB 2001
2 127 93 34 174577 37319 AKM Survey 2010
3 138 100 38 201752 37611 HDMC 2013
Sources: CDP 2003, SFCPoA 2010, HDMC
As per the AKM survey, most of the working population is engaged in unorganized sectoral activities,
as daily wage labourers, cleaners, waiters, unskilled labourers, etc., resulting in a poor economic
status and weak savings.
Women are either involved in basket making or working as domestic helps. About 21% of the slum
households (notified) are still unemployed. About 15% of the slum population is illiterate, making it
difficult for them penetrate into the mainstream employment and thus forced to do low or moderately
paid jobs on a daily basis.

Ministry of Urban Development
[132]] Draft City Development Plan – Hubli-Dharwad
Figure 39: Locations of slums in Hubli and Dharwad,
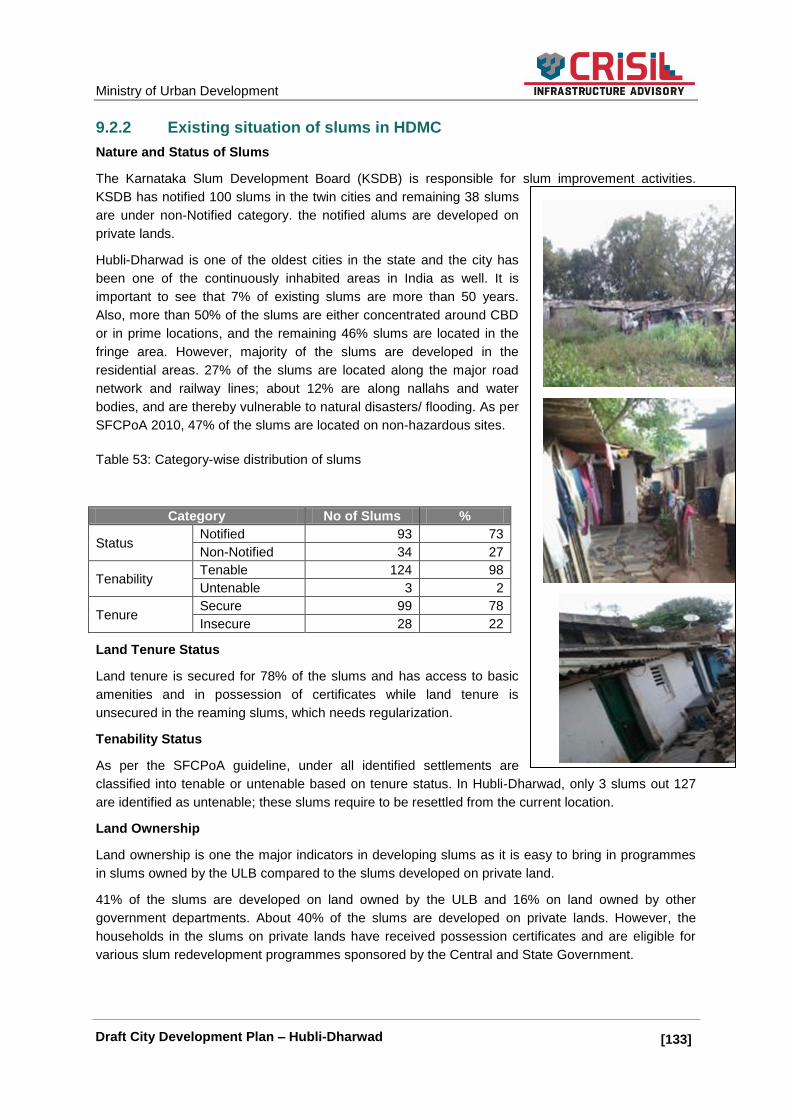
Ministry of Urban Development
[133]] Draft City Development Plan – Hubli-Dharwad
9.2.2 Existing situation of slums in HDMC
Nature and Status of Slums
The Karnataka Slum Development Board (KSDB) is responsible for slum improvement activities.
KSDB has notified 100 slums in the twin cities and remaining 38 slums
are under non-Notified category. the notified alums are developed on
private lands.
Hubli-Dharwad is one of the oldest cities in the state and the city has
been one of the continuously inhabited areas in India as well. It is
important to see that 7% of existing slums are more than 50 years.
Also, more than 50% of the slums are either concentrated around CBD
or in prime locations, and the remaining 46% slums are located in the
fringe area. However, majority of the slums are developed in the
residential areas. 27% of the slums are located along the major road
network and railway lines; about 12% are along nallahs and water
bodies, and are thereby vulnerable to natural disasters/ flooding. As per
SFCPoA 2010, 47% of the slums are located on non-hazardous sites.
Table 53: Category-wise distribution of slums
Land Tenure Status
Land tenure is secured for 78% of the slums and has access to basic
amenities and in possession of certificates while land tenure is
unsecured in the reaming slums, which needs regularization.
Tenability Status
As per the SFCPoA guideline, under all identified settlements are
classified into tenable or untenable based on tenure status. In Hubli-Dharwad, only 3 slums out 127
are identified as untenable; these slums require to be resettled from the current location.
Land Ownership
Land ownership is one the major indicators in developing slums as it is easy to bring in programmes
in slums owned by the ULB compared to the slums developed on private land.
41% of the slums are developed on land owned by the ULB and 16% on land owned by other
government departments. About 40% of the slums are developed on private lands. However, the
households in the slums on private lands have received possession certificates and are eligible for
various slum redevelopment programmes sponsored by the Central and State Government.
Category No of Slums %
Status Notified 93 73
Non-Notified 34 27
Tenability Tenable 124 98
Untenable 3 2
Tenure Secure 99 78
Insecure 28 22

Ministry of Urban Development
[134]] Draft City Development Plan – Hubli-Dharwad
Distribution of Slums by Physical Location
54% slums are situated in the core area such as near CBD and around temples and small-scale
industries, and the remaining 46% are in the fringe areas near agricultural lands. Around 37% are
located along the major transport alignment such as national highways and railway lines. About 33%
of the slums are located along drains, river beds, etc. 28% of the slums are located on the sites of
nonhazardous / non-objectionable areas. 3 slums are under hazardous and these slums require
special attention before undertaking any development.
9.2.3 Available infrastructure for slum communities
Water supply
Most of the slums are connected with the water supply
network and for individual households have access to
water distribution networks. However, the efficiency of
the water network is poor. About 41% of the slums are
fully connected to the citywide water supply system and
56% of slums are partially connected. On an average,
about 15 households share one public tap. The
remaining 3% of the slums do not have connectivity to
the city water supply system.
The frequency and duration of water supply both in city and slums are very low – about 2-3 hr in 3-4
days. In 17% of the slums, piped water supply is available for 1 to 2 hr every day.
Sanitation
In 27% of the slums, toilets are fully connected to the existing UGD, and about 42% are partially
connected to the system. The individual toilets constructed are poorly connected to the open drains
without UGD connection. As per the AKM survey, around 51% of the slum household sewerage
system is not connected, which indicates absence of toilets and open defecation or usage of
community toilets.
Storm water drainage system
About 28% of the slums are fully connected to storm water drainage. 57% of the slums are partially
linked to the system, but 15% of the slums are not covered by the citywide system. Given the
situation, it is necessary to improve the system as well as provide new connections before it infiltrates
into the environment.
Solid waste management
HDMC is responsible for solid waste collection in both notified and non-notified slums. In 36% of the
slums, solid waste is cleared on a weekly basis. From 10% of the slums, the solid waste is collected
on a daily basis. The inadequate and low frequency of collection of solid waste is resulting in
unhealthy environment in and around the slums.
Nature of approach road and internal road network
More than 50% of the slums are in the core area of the city. About 39% of the slums are accessible
through pucca roads and 48% slums are served with kutcha roads. However, 13% of the slums have
no proper approach road, making their mobility difficult. The internal road network is absent in almost
all the slums.

Ministry of Urban Development
[135]] Draft City Development Plan – Hubli-Dharwad
Mode of travel
From the AKM survey data, it is observed that 41% of households are dependent on the non-
motorized transport system, and about 32% use two-wheelers and 4% use three-wheelers.
Street lighting facility
HDMC has provided street lighting facilities in 77% of the slums.
Educational facilities
Around 80% of the slums have aganwadis run by social welfare departments and primary schools run
by the municipal corporation within the slums within a distance of 500 m. HDMC is running only one
major school, which is near the corporation office. Almost 28 slums do not have high schools run by
the government within a distance of 5 km. About 19 slums have high schools run by different
agencies within a distance of 0.5 km to 1.0 km.
Health facilities
About 57% of the slums do not have primary health facilities within their premises, and hence,
households in 69% of slums are dependent on private clinics and registered practitioners. However,
38% of slums have government hospitals within the accessibility and 43% of the slums have primary
health centres in the vicinity.
Community facilities
58 slums have community halls.
50% of the slums have slum dwellers‘ associations.
51% of the slums have women‘s associations to empower women through home-based
employment.
The slums do have self-groups as well as credit societies.
9.2.4 Housing stock requirement
The SFCPoA identified around 37,319 households that do not pucca housing facilities, and as per the
analysis, the housing deficit is about 29,698.
Table 54: Housing stock demand
Sr. No. Year Population No. of Households
1 2012-2013 176222 349
2 2013-2014 177984 352
3 2014-2015 179764 356
4 2015-2016 181561 360
5 2016-2017 183377 363
Total 1780
Source: SFCPoA, HDMC 2013
9.2.5 Urban poverty reduction and slum improvement projects
National Livelihood Mission
NULM is in continuation with SJSRY that is being implemented in HDMC. NULM targets the urban
poor who are occupationally vulnerable. The programme provides skill training to help them get
gainful employment. Besides, the scheme supports self-employment programmes and provides
financial assistance aid to individuals and groups of urban poor to set up micro-enterprise ventures.

Ministry of Urban Development
[136]] Draft City Development Plan – Hubli-Dharwad
Interest Subsidy Scheme for Housing the Urban Poor (ISHUP)
ISHUP has been conceived for providing interest subsidy on housing for the urban poor to make
housing affordable and within the repaying capacity of EWS/LIG. The scheme encourages poor
sections to avail of loan facilities through commercial banks/HUDCO for the construction of houses,
and avail 5% subsidy in interest payment for loans up to Rs. 1 lakh.
Rajiv Awas Yojana (RAY)
RAY aims at slum-free India by improving and provisioning housing, basic civic infrastructure, and
social amenities in intervened slums and enables policy intervention to facilitate the supply of
affordable housing and developed plot so as to arrest the formation of new slums.
RAY is being implemented in HDMC with the support of KUIDFC. Under RAY, AKM has carried out a
survey, and HDMC prepared the database of 127 slums in HDMC. SFCPoA was prepared to assess
the technical and financial interventions required for slum improvement projects. The DPR for
construction of 1,056 houses in 6 slums of Hubli-Dharwad has been approved by MoHUPA. Also,
DPRs for remaining slums are being prepared under this scheme.
State Sponsored Schemes
Nirmal Jyothi Project was initiated by GoK to improve the service levels in the slums in all major cities.
9.2.6 Institutional framework
Karnataka Slum Improvement Board (KSIB) is responsible for the provision of Infrastructural
facilities and housing in the declared slum areas in accordance with the provision of KSA (I & C) Act,
1973. KSIB is responsible for enabling slum dwellers to live in hygienic conditions by providing the
basic amenities, constructing new houses and upgrading the existing houses, preventing
unauthorized constructions in the said slum areas, identifying and declaring the slum areas, carrying
out socio-economic surveys, and preparing slum databases.
HDMC: As per the KM Act, 1976, under the 12th
schedule, the responsibility of urban poverty alleviation and housing for EWS has been transferred to the ULB. HDMC is responsible for implementing the poverty alleviation and slum improvement projects sponsored by MoHUPA, GoI. HDMC is implementing RAY, NULM, RIN, etc., with the technical support of KUIDFC.
9.2.7 Key issues
The housing demand is increasing in the city, but no regulated mechanism exists to ensure
housing supply and also no policy intervention to ensure supply in affordable housing category.
The newly developing residential areas are not provided with the city-wide water supply or
sewerage network.
The slums are spread across the core area of both Hubli and Dharwad. The city has a total of 127
slums, in which 93 slums are notified and the remaining 34 slums are non-notified. Where most of
these are built on lands under private ownership. About 7% of the slums have existed for more
than 50 years in the city.
The Inadequate and irregular drinking water supply system; about 44% of the slums do not have
access to drinking water sources.
59% of the households lack a storm water drainage system and 62% do not have a underground
sewer system. Lack of drainage and solid waste management is resulting in an unhealthy
environment.
Dilapidated housing structures are forcing the poor household to invest in housing every year for
Ministry of Urban Development
[137]] Draft City Development Plan – Hubli-Dharwad
non-structural maintenance.
About 84% of the slum dwellers belong to the BPL category, without a reliable income, people
living in slums are unable to invest in improving their homes and living conditions.
The weak economic status and lack of entitlement over the land have forced the poor to depend
on private money lenders or agents, who charge very high interest rates and further impoverish
them.
The hazardous conditions in slums lead to the spread of deadly diseasessuch as cholera,
malaria, and diarrhoea.

Ministry of Urban Development
[138]] Draft City Development Plan – Hubli-Dharwad
10. Baseline Environment: Urban Environment and Disaster Management
This chapter would describe the major sources of pollution in Hubli-Dharwad. Further, the chapter shall describe the various inherent issues of the urban environment. A detailed overview of the existing water bodies and the city‘s green cover has been provided. Moreover, the vulnerability of the city has been discussed.
10.1 Pollution Level in the Town
The report published by CPCB in association with CSE in March 2013 reveals that Hubli-Dharwad is in high particulate pollution category of cities that exceed the ambient air quality standards for PM10 (particulate matter 10), along with Bangalore.
10.1.1 Ambient Air Quality
As per the report for environmental clearance for Hubli Airport March 2014 and the ambient air quality with respect to a 10-km radius around theairport, the various sources of air pollution in the region are industrial, vehicular traffic-related, and related to rural activities.
The maximum and minimum concentrations for PM10 recorded were 115.2μg/m3 and 53.4μg/m3 respectively. The PM10 value is more in some locations due to dust generation activities and vehicular load.
The maximum and minimum concentrations for PM2.5 were recorded as 48.4μg/m3 at Unkal Kere and 19.7μg/m3 at Anchatgeri.
The maximum and minimum SO2 concentrations were recorded as 13.9μg/m3 at Anchatgeri, and 10.8μg/m3 at the project site.
The minimum concentration of 18.9μg/m3 for NOx was recorded at Gamangatti and the maximum concentration of 21.4μg/m3 was observed at Anchatgeri.
The maximum concentration of 1.20μg/m3 for CO was recorded at Unkal Kere with a minimum of 0.89μg/m3 observed at Gamangatti.
There is an immediate need to check massive vehicular population in Hubli-Dharwad as motor transport is the main contributor of air pollution in the city. Moreover, the dust and smoke emitted during the burning of solid waste is adding to the air pollution in the city. This has resulted in an increase in victims of asthama and other communicable diseases in the city.
10.1.2 Noise Quality
Motor transport is the major contributor of noise in Hubli and Dharwad. There are no regulations in the city for installing loud-speakers at various community halls, religious places, marriage halls, and public functions. As per the report for environmental clearance for Hubli Airport March 2014, in Hubli the Leq were recorded in the range of 46.2 to 55.4 dB(A) during daytime and 34.7 to 38.4 dB (A) during night time. The noise levels are within acceptable levels as per standards for various zones as prescribed by the Central Pollution Control Board (CPCB).
10.1.3 Water Quality
Ground water
In the HDMC area, about 22% of the water demand is met from ground water. As per the report for environmental clearance for Hubli Airport March 2014, the quality parameters for ground water in Hubli are as follows:
Ministry of Urban Development
[139]] Draft City Development Plan – Hubli-Dharwad
PH ranges between 7.2 and 7.8 and is well within the specified standard of 6.5 to 8.5.
Total hardness was observed to be ranging from 223.5 to 284.2 mg/l.
The maximum hardness (223.5 mg/l) was recorded at Tarihal and the minimum (284.2 mg/l) was recorded at Unkal city. The hardness was found to be within the acceptable limit of 300 mg/l as per IS 10500:2012.
Sulphate was found to be in the range of 8.9 mg/l to 11.8 mg/l. The maximum value was observed at Amargoal whereas the minimum value was observed at Gokul and that is well within the specified standard of 200 mg/l, as per IS 10500:2012.
It can be concluded that the ground water quality meets the standards of IS 10050:2012 and can be used for drinking purposes. It is observed that the concentrations of all the parameters are in comparison with IS: 10500-2012 and does not indicate any industrial contamination.
Unregulated drilling of bore wells is taking place throughout the city. The individual owners of plots in the developing areas are installing bore wells for domestic purposes while entrepreneurs amongst them have been extracting ground water for selling during the drought period. Even HDMC has drilled a number of bore wells to meet the drinking water demand. Recently, it has been made mandatory to set up rainwater harvesting facilities in building structures with more than 200 sq. m built-up area.
Surface Water
Hubli-Dharwad was known for its lakes but several of them have dried up. Many of the lakes have now been converted into residential layouts of the rich and EWS. Moreover the existing tanks also face the threat of silting and being converted into residential layouts.
Currently, there are 6 water bodies in the city namely, Unkalkeri Hubli, Sadhankeri, Rayapur kere, Kelagerikeri, Navalur kere and Koli kere. Sadhankeri is a manmade lake created during the British rule and is almost 100 years old. As per the report for environmental clearance for Hubli Airport March 2014, the quality parameters for surface water in Hubli are as follows:
PH value is in the range of 7.3 to 7.8; these values were observed at Sanatorium and at Devragudihal respectively.
TDS was observed in the range of 412 mg/l to 564 mg/l, indicating that the surface water bodies have TDS values within permissible limits as per IS-2296, Class-C code. The water is suitable for drinking after conventional treatment followed by disinfection as per IS-2296, Class-C.
DO was found to be in the range of 2.4 to 3.1 mg/l. It indicates that water is suitable for irrigation and other agricultural purposes.
Chloride and sulphate were in the range of 94.8 to 138.4mg/l and 10.4 to 15.2 mg/l respectively and are well within permissible limits.
The BOD levels in the water samples are very high compared to the specified standards with 10.8mg/l as the minimum value observed at Nirsagar and 18.2mg/l as the maximum value observed at Dumvada. This was mainly due to discharge of sewerage and bathing of humans and cattle in these water bodies. Consequently, the COD of the water samples was found to be high.
As per IS:2296, the surface water quality meets the criteria for Class C and Class-E (for DO and BOD); therefore, it can be used for drinking purpose after conventional treatment and disinfection. It was observed that the surface water could be used for drinking after conventional treatment and for irrigation purpose.
Contamination of water is another major concern in both the cities. Open defecation is observed near the water bodies which needs to be eliminated in the near future to keep the water bodies in healthy condition. Untreated sewerage from UGD and unscientific disposal of solid waste has resulted in the contamination of both surface and underground water. Hirekeri which is also known as Koli Keri is a major lake in the heart of the city of Dharwad; it is highly polluted and poses severe danger to the people living nearby. Conservation of water bodies is the responsibility of HDMC but maintenance of lakes is taken care of by the state‘s irrigation department.

Ministry of Urban Development
[140]] Draft City Development Plan – Hubli-Dharwad
10.2 Ecology
The Dharwad district accommodates varied type of flora. The forest type seen in the outskirts of the city is scrub forest. The Forest Department has recorded the presence of a few Schedule I species in the district, but no such species exist within the city area.
10.3 Disaster-Proneness Assessment of the City
The risk of natural disaster is very low in the twin cities. As per the seismic zoning map of India, Dharwad district falls under Seismic Zone II which is a low-damage risk zone (MSK VI or less). However, being a land-locked city, the city faces no risk from cyclones, landslides and tsunamis. Flooding is frequent during the monsoon near water bodies; the canals and other low-lying areas and EWS settlements are predominant in these areas. Also, road accidents involving two-wheeler riders are common in both the cities.
Table 55: Natural hazards vulnerability mapping Hubli Dharwad
Category Peril Risk in Hubli Dharwad
Climate Related Hazards
Drought Moderate
Flood Moderate
Cloudburst Low
Hailstorm Safe zone
Lightning Safe zone
Coastal Erosion Safe zone
Storm Surge Safe zone
Cyclone Safe zone
Geological Hazards
Earthquake Zone II and has low damage risk zone
Landslide Moderate Risk
Tsunami Safe zone
Hydrological Hazards
Groundwater depletion Moderate risk
Aquifer Salinity Moderate Risk
Biological Hazards Plant :
Pest and Insect attack Moderate Risk
Human: Plague, SARS, Bird Flu, Dengu Moderate Risk
Source: KSNDMC
Hazard Vulnerability in Dharwad
Dharwad District receives average annual rainfall of 776 mm. In September 2007, the entire district faced unprecedented continuous heavy rainfall. The intensity and period of the rainfall was so severe that it caused extensive flooding in many parts of the district. The excessive rain and resultant overflowing of rivulets caused major losses, flooding in the low-lying villages, extensive damage to standing crops, house damage, death of livestock, disruption of communication and damages to roads and bridges. Due to this, more than 40 villages covering Kundgol taluka, 41 villages in Navalgund taluk and 8 villages in the Hubli taluka were badly affected.

Ministry of Urban Development
[141]] Draft City Development Plan – Hubli-Dharwad
10.4 Disaster Management Mitigation Measures
Disaster mitigation at the city level is a holistic management of disasters (both manmade and natural). It involves the management of events to minimize damage during a disaster and the development of preparedness to cope with disasters, to reduce risks and losses. As per the general disaster management structure in India, the district collector is the responsible agency for disaster management within a district. The district plays a key role in disaster management and relief activities.
Karnataka State Disaster Management Authority (KSDMA): KSDMA is the state-level agency responsible for carrying out various activities under disaster management in Karnataka.
Karnataka State Natural Disaster Monitoring Centre (KSNDMC):
An autonomous body, registered under the Society Registration Act and affiliated to the Department of Science & Technology, Government of Karnataka, KSNDMC is providing a formal common platform to achieve synergy in the field of disaster management in Karnataka. The responsibility of KSNDMC includes hazard mapping and vulnerability studies, strengthening of information technology for natural disasters‘ management, monitoring and impact assessment of natural hazards, and human resource development, mainly by imparting training.
DC and Revenue department
The revenue department coordinates DM‘s activities in the Dharwad district. The District Commissioner is the nodal officer for overall control and supervision of DM activities, including damage assessment, finalization of reports and declaration of L1/L2 disasters and mobilization of finance.
Police department
Any emergency situation pertaining to law and order anywhere in Hubli city is handled by the Hubli Dharwad Police. The Hubli Dharwad Police has special emergency departments and has also set up police stations at key locations in the city.
Fire and Safety department
Under the 12th Schedule, fire and safety services are not devolved to the ULBs in Karnataka. The department is under the direct control of home affairs. The city as of today has two fire stations, which are responsible for tackling any fire accident that happens in the city. They are located in the Old Hubli area and the Amargol area.
HDMC
HDMC has a section for emergency responses and around 30 employees are working in this department. The major activities of this section is to clean the overflowing storm water drains and nalas which usually create flood-like situation during heavy rains.
10.5 Key Observations
Inadequate and inefficient infrastructure led to the degradation of environmental elements such as water, land and soil.
Lakes are drying up and no major programmes for conservation and rejuvenation of lakes and ponds are afoot.
Growth of vehicles contributed to air pollution. Unscientific disposal of sewerage from UGD is causing land degradation, and contamination
of both surface and ground water. Over-extraction of ground water has led to a decline in the water table and salinity. Hubli-Dharwad is in high particulate pollution category of cities that exceed the ambient air
quality standards for PM10 (particulate matter 10).
Ministry of Urban Development
[142]] Draft City Development Plan – Hubli-Dharwad
11. Climate Change and Sustainable Development
For centuries, human activities have released large amounts of carbon dioxide and other greenhouse gases into the atmosphere. The majority of greenhouse gases come from burning fossil fuels to produce energy, heating houses, and transportation purpose. Deforestation, industrial processes, and some agricultural practices also emit gases into the atmosphere. This has led to Climate change which is refers to any significant change in the measures of climate lasting for an extended period of time. In other words, the climate change includes major changes in temperature, precipitation, or wind patterns, among other effects, that occur over several decades or longer. Various evident impacts of the ongoing climate change at broad level are as follows;
Rise in global average temperature near Earth's surface.
Change in the monsoon pattern.
Change in the pattern of wind.
Increase in incidents of natural calamities such as floods, droughts, earthquake, severe heat waves, cyclones, etc.
Decline in agriculture yields
Melting of ice and rise in sea level, etc.
The impacts of the climate change are evident from the past incidents around the countries and presents challenges for the societies and environment. Thus, planning to mitigate the impact of climate change and reduce the emission of greenhouse gases is becoming more important for sustenance of our present societies and to save for future generation. This is possible by adopting sustainable and low carbon emission development measures.
11.1 Climate Change & City
In 12th Five-Year Plan of the country urges for low carbon growth. The strategies are proposed to
reduce India‘s emission intensity from 20% to 25% by 2020 with respect to the emissions in 2005.This includes policy interventions to reduce emission intensity through fuel-efficiency standards, green building codes and energy efficiency certificates. In this context, numerous challenges that are to be addressed include the growing population coupled with urbanization, industrialization and provision of infrastructure and transport facilities. Decentralised mitigation strategies are necessary to minimize carbon emissions which require sector wise and region wise interventions.
a. Climate Change on cities
As per the International Panel for Climate Change (IPCC) 5th assessment report, the cities across the world, due to their rapid population growth and large-scale developmental and economic investments, are at high risk to the impacts of climate change. Most of the rapid growth will take place in the urban areas of Asia and Africa. In view of this, the cities should focus on developing adaptation capacity towards the climate variability.
Indian cities are characterized by high density of population, housing stock, and poor infrastructure, which make them all the more vulnerable to climate change. Given that the most valued infrastructure is usually located in cities, the economic and social costs of climate change will be much higher in cities. For example, cities house valuable communications infrastructure as they do physical infrastructure such as buildings, roads, bridges, and flyovers. Hence, any climate change impacts in the form of damage will be quite expensive. Climate change impacts the physical assets used within cities for economic production, the costs of raw materials and inputs to economic production, the subsequent costs to businesses, and thus output and competitiveness.
b. Learning from the Past
Extreme climate events are expected to become more frequent as a result of climate change. The climate extremes can have devastating effects on human societies. The effects of climate change are expected to have substantial impacts on our human settlements and our development trajectory.
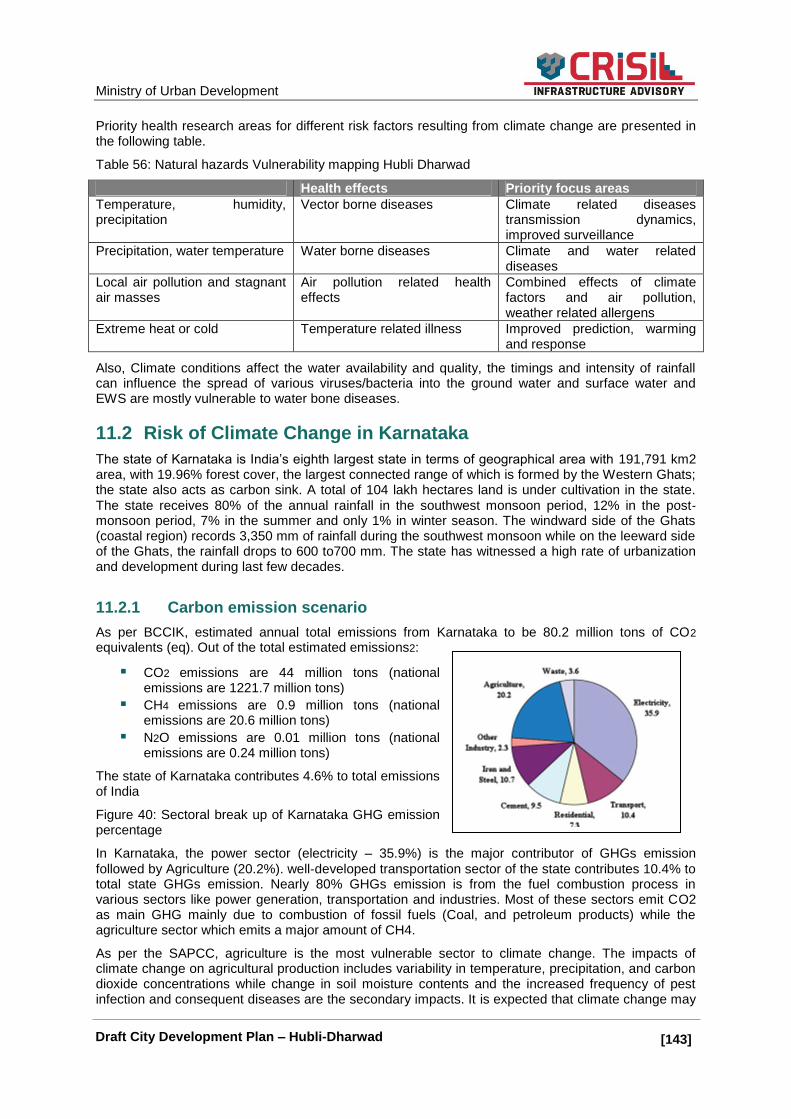
Ministry of Urban Development
[143]] Draft City Development Plan – Hubli-Dharwad
Priority health research areas for different risk factors resulting from climate change are presented in the following table.
Table 56: Natural hazards Vulnerability mapping Hubli Dharwad
Health effects Priority focus areas
Temperature, humidity, precipitation
Vector borne diseases Climate related diseases transmission dynamics, improved surveillance
Precipitation, water temperature Water borne diseases Climate and water related diseases
Local air pollution and stagnant air masses
Air pollution related health effects
Combined effects of climate factors and air pollution, weather related allergens
Extreme heat or cold Temperature related illness Improved prediction, warming and response
Also, Climate conditions affect the water availability and quality, the timings and intensity of rainfall can influence the spread of various viruses/bacteria into the ground water and surface water and EWS are mostly vulnerable to water bone diseases.
11.2 Risk of Climate Change in Karnataka
The state of Karnataka is India‘s eighth largest state in terms of geographical area with 191,791 km2 area, with 19.96% forest cover, the largest connected range of which is formed by the Western Ghats; the state also acts as carbon sink. A total of 104 lakh hectares land is under cultivation in the state.
The state receives 80% of the annual rainfall in the southwest monsoon period, 12% in the post‐monsoon period, 7% in the summer and only 1% in winter season. The windward side of the Ghats (coastal region) records 3,350 mm of rainfall during the southwest monsoon while on the leeward side of the Ghats, the rainfall drops to 600 to700 mm. The state has witnessed a high rate of urbanization and development during last few decades.
11.2.1 Carbon emission scenario
As per BCCIK, estimated annual total emissions from Karnataka to be 80.2 million tons of CO2
equivalents (eq). Out of the total estimated emissions2:
CO2 emissions are 44 million tons (national emissions are 1221.7 million tons)
CH4 emissions are 0.9 million tons (national emissions are 20.6 million tons)
N2O emissions are 0.01 million tons (national emissions are 0.24 million tons)
The state of Karnataka contributes 4.6% to total emissions of India
Figure 40: Sectoral break up of Karnataka GHG emission percentage
In Karnataka, the power sector (electricity – 35.9%) is the major contributor of GHGs emission
followed by Agriculture (20.2%). well‐developed transportation sector of the state contributes 10.4% to total state GHGs emission. Nearly 80% GHGs emission is from the fuel combustion process in various sectors like power generation, transportation and industries. Most of these sectors emit CO2 as main GHG mainly due to combustion of fossil fuels (Coal, and petroleum products) while the agriculture sector which emits a major amount of CH4.
As per the SAPCC, agriculture is the most vulnerable sector to climate change. The impacts of climate change on agricultural production includes variability in temperature, precipitation, and carbon dioxide concentrations while change in soil moisture contents and the increased frequency of pest infection and consequent diseases are the secondary impacts. It is expected that climate change may

Ministry of Urban Development
[144]] Draft City Development Plan – Hubli-Dharwad
induce phonological changes (timing of life history) in fishes specially species with shorter life spans such as such as plankton and small pelagic fish. Many tropical fish stocks are already exposed to high temperature and may experience regional extinction or migration towards higher latitudes. The changing climate with altered feed resources is adversely affecting the general immune status of animals leading to more incidences of diseases and lower productivity. However, Ruminants release methane (CH4) as a part of their natural digestive process.
The changing pattern of temperature, precipitation would cause extreme weather events like floods, drought etc. Not only these events will affect the availability of water for agriculture and animal husbandry, but also cause decreased resistance in local varieties of crops, animals etc.
11.3 Risk and impacts of Climate change in Hubli Dharwad
Like any other city Hubli-Dharwad, is also under threat of climate change. The major risks with regard to Climate Change in the city includes growing vehicular population, reduction in the green cover due to change in the land use from agriculture to non-agriculture uses, absence of scientific solid waste and sewerage management systems, in the absence of treatment facilities, the sewage is disposed into natural streams, the recent studies on ground water have indicated that the water table is rising in central parts of the city due to percolation of sewage water. The twin city of Hubli Dharwad lies in the semiarid zone of South India. Rainfall is highly variable as it is located in the rain shadow zone of Western Ghat at the drainage divide between West flowing rivers and Deccan Plateau. As a result, the surrounding region has traditionally been drought prone.
Water scarcity, occasional floods, and temperature increase are the expected direct risks to the city. Since Hubli-Dharwad lies in the rain shadow zone, climate change related deviation in rainfall either ways is likely to impact the city. Likely impacts of climate change in the city could be of various dimensions.
The population is expected to increase from 9.5 lakhs in 2011 to nearly 19 lakhs in 2041. This would more than double the water demand and would neutralize any effects of the increased rainfall. Water scarcity may become even more acute in the event of an increase in temperature-leading to likelihood of droughts. Droughts can impact the city in terms of water scarcity and rise in food prices and also indirectly though seasonal migration from rural areas. Impact on food security will lead to severe health impacts. The acute shortage in water is also likely to increase the incidence of waterborne diseases. As per the study of (Bhattacharya, 2006)
The major contributors of greenhouse gases in the city includes the growing vehicular population, anaerobic decaying of municipal solid waste at disposal site and in the septic tanks, manure from poultry and animal farms, industrial areas etc. Therefore decentralized source specific interventions are necessary to formulate to minimize carbon emissions in the city.
11.3.1 Urban Heat island
The studies have stated that urbanization has led to micro-climate changes, particularly with regard to the thermal structure of the location. Major factors leading to the excess heat of towns are primarily due to high specific heat capacity of building materials and their emissivity changes in comparison to the natural surroundings, impervious engineered surfaces like roads and paved spaces, change in surface roughness, blockage of wind due to buildings, blockage of outgoing long wave radiation from surfaces due to high density of structures, reduction in vegetation and associated reduction in cooling through evapotranspiration, etc.
Major contributors of urban island in both Hubli and Dharwad are the concrete and the tarred roads, pavements, stored heat energy released by the concrete and glass buildings, industries and through traffic combustion process. Urban heat island formation usually reduces the cooling rate at night and raises the air temperature. In Hubli the difference in temperature between the city and adjacent rural areas is only 5.0 to 5 degree Celsius.
While in Dharwad attributing its high altitude topography and low density development compared to Hubli the existing temperate difference between the urban core and adjacent rural areas is only 2.0 to 2.5 degree Celsius only. In major metros like Chennai, Delhi etc. the temperate variation is in the range of 8-10 degree Celsius in Dharwad. However, the high cooling rate of the urban island in Hubli

Ministry of Urban Development
[145]] Draft City Development Plan – Hubli-Dharwad
Dharwad compared metro cities because of the presence of lakes canals and the green cover in between and adjacent areas of both the cities. The water body absorbs a large amount of heat and the moist soils of agricultural land enhance cooling in the city.
11.4 Initiatives for energy conservation and sustainable development
11.4.1 State Action plan on climate change (SAPCC)
In Karnataka SAPCC was prepared in line with NAPCC by EMPRI and TERI. As per the SAPCC analysis, Agriculture and allied sectors are having the highest risk due to climate change. The changing pattern of temperature, precipitation would cause extreme weather events like floods, drought etc. Not only these events will affect the availability of water for agriculture and animal husbandry, but also cause decreased resistance in local varieties of crops, animals etc., shift in cropping pattern, loss of traditional species, increased vulnerability of crops and animals to various vector borne disease is also projected to overall decrease the productivity of this sector.
Tumkur, Mandya, Hassan and Haveri have around 34% of the population dependent on primary sector and hence they will be the most vulnerable to erratic climate pattern. While Udupi, Kodagu, Dakishna Kannada and Bangalore districts are affected least as they have lowest percent of population dependent on agriculture and associated sector.
As per BCCIK (2011) prepared on composite vulnerability indices (Demographicand Social, Occupational, Agriculture and Climate), Gulbarga and Bijapur districts of North Karnataka are most vulnerable to Agricultural and Climatic vulnerability respectively. Kannada, Kodagu and Bangalore are least vulnerable districts. This indicates that districts falling in north region of states are to be vulnerable. Hubli Dharwad falls in the North Karnataka region.
11.4.2 Ongoing initiatives at Sectoral level
a. Agriculture and allied sectors
Introduction of water tariffs in irrigation
Provision of crop insurance under the National Agricultural Insurance Scheme and (NAIS) and Weather Based Crop Insurance Scheme (WBCIS)
Bhoo Chetana (land improvement) programme
Promotion of organic farming
Sookshma Neeravari (Micro irrigation) scheme
Implementation of the Rashtriya Krishi Vikas Yojana (National Agriculture Development
Scheme)
Implementation of the Rashtriya Krishi Bima Yojana (National Agricultural Insurance Scheme) programme
Implementation of the Suvarna Gramodhya (village development) scheme
Implementation of the Suvarna Bhoomi (land prosperity) scheme b. Water resources
Mandatory use of rainwater harvesting in residential and commercial buildings in certain areas
Passing of the Karnataka Groundwater (Regulation and Control of Development and Management) Bill, 2011 in Assembly for better protection of groundwater resources
Rainwater harvesting by creating barricade of about 3 feet around roadside trees
Watershed development and construction of groundwater recharge structures
Launch of the Jalasiri (water recharge) programme
Mandatory dual piping in new layouts for use of treated water c. Forestry and Biodiversity
Approximately 80,000 ha of plantation were planted by KFD in 2010-11
Development of carbon sinks and potential
Protection of forests, enhancement of resources productivity & growing of medicinal
Ministry of Urban Development
[146]] Draft City Development Plan – Hubli-Dharwad
plants
Establishment of the Western Ghats Task Force d. Coastal zone
Initiation of the construction of a sea wall to prevent salt water entry into paddy fields. However, poor quality of construction destroys the wall and the problem persists.
e. Energy
Mandatory use of solar water heaters, CFLs, ISI marked motor pump sets and integration of energy efficiency and renewable energy in new buildings
Incentivisation of installation of solar water heater by BESCOM through tariff discounts
Tariffs for power purchase from renewable energy sources
Decision of creating a Green Energy Fund (Akshaya Shakti Nidhi) to generate financial resources within the state to implement its policy
Belaku (light) scheme to replace up to four incandescent bulbs with CFLs at a subsidized rates per household
Decision to introduce a Green Energy Cess of Rs. 0.05 (five paise) per kWh on commercial and industrial consumers to generate about INR 55 crore annually through the Karnataka Renewable Energy policy 2009 to 2014.
Decision to reserve 10 % of land in SEZ‘s for development of renewable energy
11.5 Initiatives in Hubli-Dharwad for sustainable development
Hubli Dharwad city has moderate risk of both environmental degradation and climate change. Over extraction of ground water, erratic rainfall, increasing temperate are causing challenges to the citizens everyday life. HDMC is the primary agency involved in the planning and development of the Hubli Dharwad city. Though functions such as water supply, slum clearance, urban planning, protection of weaker section have not been devolved completely to HDMC. These functions are carried by the state government and Parastatals organizations. HDMC and other departments with the support of GoK have initiated many unique innovative programmes for promoting sustainable development, protection of environment and to reduce the emissions and increase the absorption of carbon. However, HDMC has been effective in improving the public services and urban governance. HDMC is one of the few municipal corporations in the country to get the certification of ISO 9001:2000. HDMC is the first corporation to have got the roads insured by citizens.
a. Solid and Liquid waste management projects under KUIDFC
Anaerobic composting of untreated waste is the one of the major contributor of methane gas in Hubli Dharwad. However, integrated solid waste and liquid waste management projects are being implemented in the city under KUIDFC for safe disposal and treatment of waste in the city.
b. Rain water harvesting
Rainwater harvesting is gaining momentum in the twin cities. The measures have been initiated by HDMC to make rain water harvesting mandatory. The Karnataka Housing Board (KHB) has made rainwater harvesting compulsory in all its layouts in Hubli and Dharwad. The rain water harvesting has been implemented in the eight layouts of KHB. The KHB has setup rainwater harvesting units in gardens developed in all layouts.
c. Initiatives reduce the energy consumptions
HDMC has initiated a project to replacing all streetlights with CFLs. HDMC have used tube lights, sodium vapour lamps, mercury vapour lamps, high-mast installations and other bulbs for illumination. The twin cities have more than 40,000 streetlights. The HDMC expect to save about 40% energy and Rs 3 crores in electricity bills by using CFLs and LED lamps.
d. HBRTS tree planting initiatives
The tree planting drive was initiated in Hubli Dharwad by HDBRTS ltd to compensate for the ecological losses caused by the felling of trees during the implementation of the BRTS project. The project has proposed to plant around eight thousand on the campuses of different schools and colleges in the city.

Ministry of Urban Development
[147]] Draft City Development Plan – Hubli-Dharwad
e. Children's movement for civic awareness- CMCA
HDMC in association with NGOs has initiated CMCA with aim of inculcating civic awareness in the children and make them ambassadors of HDMC. ‗Civic clubs‘ are established in all 123 schools of the city. Activities under CMCA include regular interaction of the students with Mayor and Commissioner, trips to water supply installations, etc.
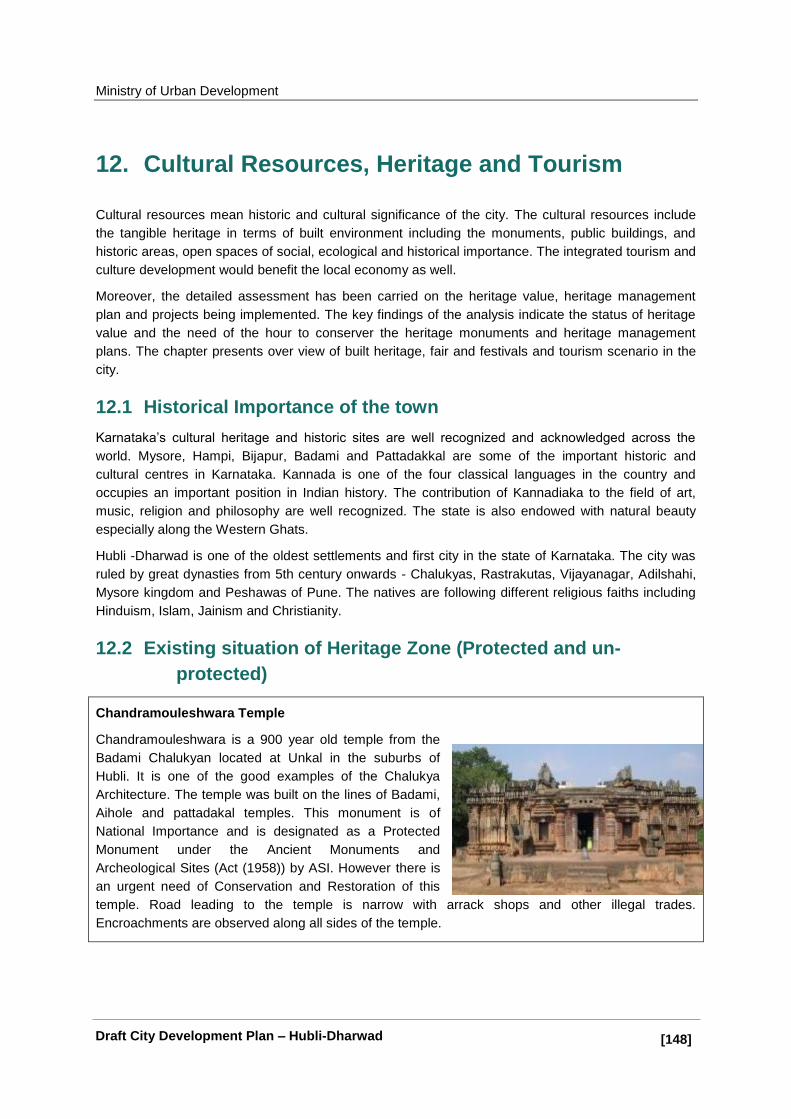
Ministry of Urban Development
[148]] Draft City Development Plan – Hubli-Dharwad
12. Cultural Resources, Heritage and Tourism
Cultural resources mean historic and cultural significance of the city. The cultural resources include
the tangible heritage in terms of built environment including the monuments, public buildings, and
historic areas, open spaces of social, ecological and historical importance. The integrated tourism and
culture development would benefit the local economy as well.
Moreover, the detailed assessment has been carried on the heritage value, heritage management
plan and projects being implemented. The key findings of the analysis indicate the status of heritage
value and the need of the hour to conserver the heritage monuments and heritage management
plans. The chapter presents over view of built heritage, fair and festivals and tourism scenario in the
city.
12.1 Historical Importance of the town
Karnataka‘s cultural heritage and historic sites are well recognized and acknowledged across the
world. Mysore, Hampi, Bijapur, Badami and Pattadakkal are some of the important historic and
cultural centres in Karnataka. Kannada is one of the four classical languages in the country and
occupies an important position in Indian history. The contribution of Kannadiaka to the field of art,
music, religion and philosophy are well recognized. The state is also endowed with natural beauty
especially along the Western Ghats.
Hubli -Dharwad is one of the oldest settlements and first city in the state of Karnataka. The city was
ruled by great dynasties from 5th century onwards - Chalukyas, Rastrakutas, Vijayanagar, Adilshahi,
Mysore kingdom and Peshawas of Pune. The natives are following different religious faiths including
Hinduism, Islam, Jainism and Christianity.
12.2 Existing situation of Heritage Zone (Protected and un-
protected)
Chandramouleshwara Temple
Chandramouleshwara is a 900 year old temple from the
Badami Chalukyan located at Unkal in the suburbs of
Hubli. It is one of the good examples of the Chalukya
Architecture. The temple was built on the lines of Badami,
Aihole and pattadakal temples. This monument is of
National Importance and is designated as a Protected
Monument under the Ancient Monuments and
Archeological Sites (Act (1958)) by ASI. However there is
an urgent need of Conservation and Restoration of this
temple. Road leading to the temple is narrow with arrack shops and other illegal trades.
Encroachments are observed along all sides of the temple.

Ministry of Urban Development
[149]] Draft City Development Plan – Hubli-Dharwad
Banashankari Temple, Amargol, Hubli
A temple of Shankarlinga built by Jakkanacharya in the early
13th century. Amargol is located at around 5km from Unkal
towards Dharwad on SH73. The temple has nagara articulation,
built in the stepped diamond and the square plan natural to a
nagara superstructure. Similar to Unkal, the temple here is not
maintained and also not a healthy surrounding.
Someshwara temple is one of the oldest temple was built during the Chalukya dynasty. It is one of
the great religious places in the city. The idols of Chatrubhuja and Mahishasur Mardini are the major
attraction in the temple, which are very old and were established here by the Chalukya ruler. Ganesha
Chaturthi is the major festival which is celebrated here and lots of people visit this temple every here
during the festival. Lush green grasslands and beautiful plants surrounded by the temple add to the
value of the place.
Amruteshwara Temple at Annigeri was built in10th centaury with
dravida articulation, and was the first temple made of soapstone. The
large and black stone Amruteshwar Temple is in the Kalyani Chalukyas
style. The temple has a roof supported by 76 pillars and carvings of
mythological figures on its walls. Car festival is the major festival at
Amruteshwara temple and it is celebrated during December and
January. This temple is located 20 km west of Gadag en route to Hubli
and 35 km from Hubli.
12.3 Heritage Conservation Initiatives
ASI is the organization for the archaeological researches and protection of the cultural heritage of the
country set up under ministry of culture. Maintenance of ancient monuments and archaeological sites
and remains of national importance is the prime concern of the ASI. Besides it regulate all
archaeological activities in the country as per the provisions of the Ancient Monuments and
Archaeological Sites and Remains Act, 1958. It also regulates Antiquities and Art Treasure Act, 1972.
For the maintenance of ancient monuments and archaeological sites and remains of national
importance the entire country is divided into 24 Circles. The Circles carry out archaeological fieldwork,
research activities including carrying out village-to-village survey of antiquarian remains; exploration of
archaeological sites, documentation of loose sculptures, excavation of archaeological sites,
Conservation and day-to-day maintenance of protected monuments and Providing basic amenities at
the monuments for tourists etc. . There are two ASI circles in Karnataka state and they are Bangalore
Circle and Dharwad circle. There are 32 heritage sites in Dharwad district identified by ASI the list is
annexed to the report.
Though , there is no major internationally acknowledge heritage sites in Hubli-Dharwad region, the
sites of Hampi, Bijapur, Badami and Pattadakkal are conserved by the Dharwad ASI circle. This
signifies the potential of Hubli to be promoted as the tourism node that connects the major heritage
sites in the North Karnataka region. It is important to improve the basic amenities at all sites of interest
to fully explore the tourism potential and make tourism one of the largest economic and employment
contributor in city.

Ministry of Urban Development
[150]] Draft City Development Plan – Hubli-Dharwad
Table 57: Framework for the heritage conservation
Sr. No
Frame work Status
1 Legislation, policy, and planning framework
Policy frame work that guides the conservation in the country are
Ancient Monuments and Archaeological Sites and Remains Act, 1958
Antiquities and Art Treasure Act, 1972.
Departments working in the sector are
Department of Tourism, GoK
Department Archaeology, Museums &Heritage, GoK
2 Institutional framework Dharwad Circle of ASI is the only agency currently works on Heritage sector in the city.
No initiatives from HDMC for the conservation of the heritage buildings.
3 Conservation programmes
No major conservation/restoration programmes in the cities
12.4 Tourism Scenario
Hubli is not a major tourism spot within the Karnataka state, also the contribution of tourism to city‘s
economy is also not substantial. However, the position of city as the commercial hub of North
Karnataka and the accessibility to some of the internationally renowned heritage hubs like Hampi,
Bijapur makes the city potential to evolve as tourism node. No major studies are available on the
current status of tourist arrival to the twin cities, but it is evident from the discussions with the
stakeholders that the city caters to travel and resting needs of the domestic tourists to Hampi, Bijapur,
Badami, Goa etc.
12.4.1 Strategies for Tourism Development in Hubli-Dharwad
In order to capitalize the potential of Hubli-Dharwad as a tourism node, it is important to invest in
infrastructure development and proactively promote the city as the tourism node of North Karnataka.
As a first step, it is required to carry out feasibility studies to understand the important tourism
activities in the North Karnataka region in terms of the percentage share of tourist, their travel pattern
etc. and also to analysis the quality of supporting infrastructure such as road network, availability of
hotels and other options for safe and secure stay etc.
At the primarily level, it is absolutely important to improve the connectivity between the twin cities and
various tourism destinations through road, rail and air networks. The GoK has proposed to upgrade
the existing Airport at Hubli and to develop new rail connectivity between Hubli and Akola in
Maharashtra. The supporting infrastructure that would support the growth of city as a tourism node
could be
Health and Wellness Tourism promotion: Dharwad and Hubli to be positioned and promoted as
premier Health and wellness destination. The links all major existing health facilities with international
standard and interlink the health infrastructure within and around the cities through transit systems.
Also, promote Karnataka‘s potential in traditional systems of wellness and medicines like Ayurveda,
Unani, Siddha, and Yoga, etc. project the cities as a unique destination for health and wellness.
Ministry of Urban Development
[151]] Draft City Development Plan – Hubli-Dharwad
Education Tourism: Dharwad to be positioned and promoted as premier destination for all types of
education and academic researches. The guidelines to be issued in consultation with the national and
international agencies. Only the certified institutions to be made be eligible for incentives that are
available for tourism projects and interlink and integrate the institutions.
Exhibition and Convention Complexes: Adequate number of world-scale, world-class exhibition
and convention complexes to be established with appropriate PPP model.
Theme and Entertainment Parks: Theme and Entertainment parks to be promoted and established
with appropriate PPP model.
Wayside Amenities: Wayside amenities including gender distinct toilets, cafeteria, mini
store/Pharmacy and an information / souvenir booth to be established along the major corridor
gateways could be developed through private entrepreneurs /franchisees.
Hotels and public accommodations: Promote and facilitate the investment in the hospitality sector
to increase the availability of quality accommodations for the international tourists. Also, all
accommodation available with the government to be consolidated into a public accommodation
network and makes it available for the domestic tourists.
12.4.2 Key Issues
In spite of being the oldest urban settlement in the North Karnataka region, the history, culture
and heritage of Hubli Dharwad is not getting enough attention in the development process.
City required a comprehensive plan for heritage management but lack of initiatives from
HDMC to promote the culture and tradition.
Though many old buildings with heritage value are available in the city, they are not yet
identified or listed by HDMC or any other government authority. Even the monuments and the
sites identified by ASI are in a deteriorated condition
The twin cities has lots of scope for promoting it as tourism node however potential for
integrating heritage with tourism is not being explored.
Lack of awareness among the general public on heritage value of the city.
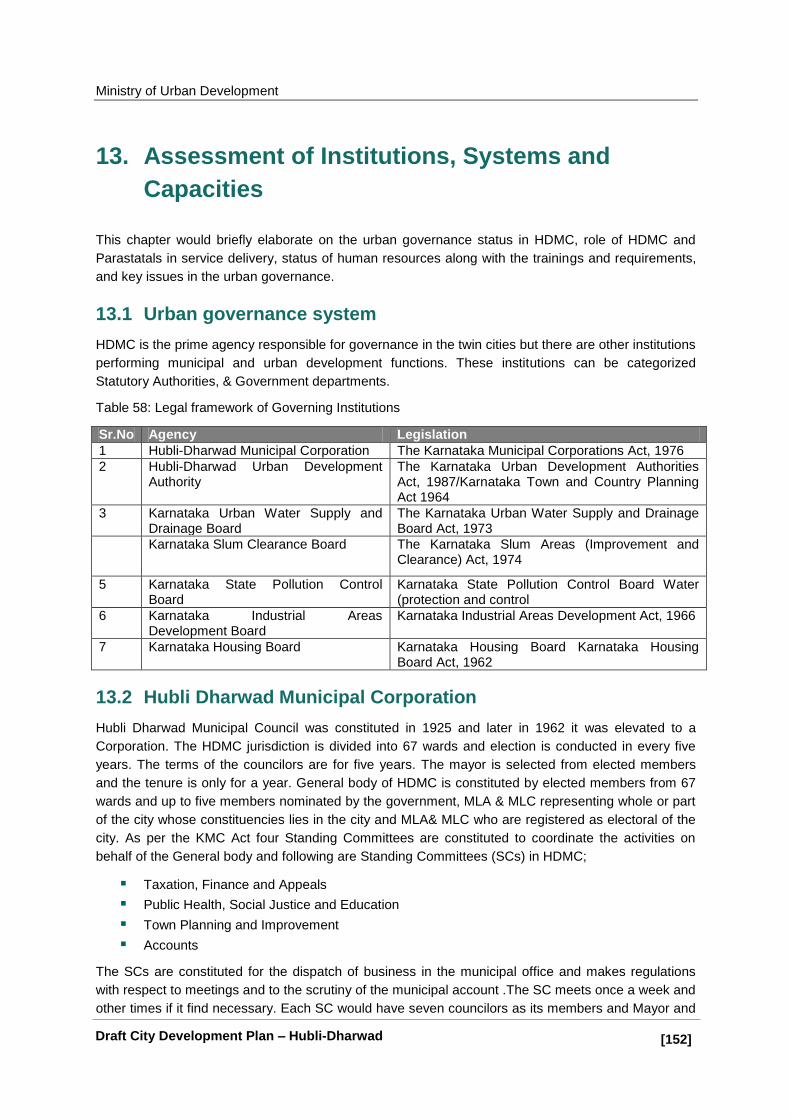
Ministry of Urban Development
[152]] Draft City Development Plan – Hubli-Dharwad
13. Assessment of Institutions, Systems and
Capacities
This chapter would briefly elaborate on the urban governance status in HDMC, role of HDMC and
Parastatals in service delivery, status of human resources along with the trainings and requirements,
and key issues in the urban governance.
13.1 Urban governance system
HDMC is the prime agency responsible for governance in the twin cities but there are other institutions
performing municipal and urban development functions. These institutions can be categorized
Statutory Authorities, & Government departments.
Table 58: Legal framework of Governing Institutions
Sr.No Agency Legislation
1 Hubli-Dharwad Municipal Corporation The Karnataka Municipal Corporations Act, 1976
2 Hubli-Dharwad Urban Development Authority
The Karnataka Urban Development Authorities Act, 1987/Karnataka Town and Country Planning Act 1964
3 Karnataka Urban Water Supply and Drainage Board
The Karnataka Urban Water Supply and Drainage Board Act, 1973
Karnataka Slum Clearance Board The Karnataka Slum Areas (Improvement and Clearance) Act, 1974
5 Karnataka State Pollution Control Board
Karnataka State Pollution Control Board Water (protection and control
6 Karnataka Industrial Areas Development Board
Karnataka Industrial Areas Development Act, 1966
7 Karnataka Housing Board Karnataka Housing Board Karnataka Housing Board Act, 1962
13.2 Hubli Dharwad Municipal Corporation
Hubli Dharwad Municipal Council was constituted in 1925 and later in 1962 it was elevated to a
Corporation. The HDMC jurisdiction is divided into 67 wards and election is conducted in every five
years. The terms of the councilors are for five years. The mayor is selected from elected members
and the tenure is only for a year. General body of HDMC is constituted by elected members from 67
wards and up to five members nominated by the government, MLA & MLC representing whole or part
of the city whose constituencies lies in the city and MLA& MLC who are registered as electoral of the
city. As per the KMC Act four Standing Committees are constituted to coordinate the activities on
behalf of the General body and following are Standing Committees (SCs) in HDMC;
Taxation, Finance and Appeals
Public Health, Social Justice and Education
Town Planning and Improvement
Accounts
The SCs are constituted for the dispatch of business in the municipal office and makes regulations
with respect to meetings and to the scrutiny of the municipal account .The SC meets once a week and
other times if it find necessary. Each SC would have seven councilors as its members and Mayor and
Ministry of Urban Development
[153]] Draft City Development Plan – Hubli-Dharwad
Deputy Mayor are ex-officio members of all the standing committees. The KMC Act has the provisions
for the formation of Ward Committees in larger cities where populations is more than 3 lakhs and a
WC could be constituted for one or more wards but no ward committees are constitute in HDMC. The
recent election for HDMC was held during May 2013, but the council hasn‘t been constituted yet due
to legal issue as the leading party in the council doesn‘t have majority in the general body of HDMC.
Administrative Wing
Commissioner is the head of the executive body and is appointed by the state government after the
consultation with the Mayor and ordinarily holds the office for a term of two years. The Administrative
wing implements the Council decisions based on the resolutions adopted by the Council. He reports
compliance to the Council and exercises powers and discharges duties conferred under the KM Act.
The Commissioner implements all the decisions/directions of the Mayor, ensures safe custody of the
Municipal Fund and attends to all litigations for or against the HDMC.
For administrative conveniences, the corporation is organized into various functional departments and
the departments are PWD, DDTP, Revenue and Accounting and Education. The other functional
areas are Health, Hospitals, HRD, and Horticulture etc.
General Administration Department
General Administration Department (GAD) is responsible for overall administration in the Corporation;
the department manages staff postings and transfers, defines staff duties and responsibilities,
prepares administration reports and ensures proper communication between the departments and the
Corporation Council.
Accounts Department
Accounts department manages HDMC finances and monitors the use of allocated funds for different
schemes. It plays a major role in the formulation of the budget. Chief Accounts Officer (CAO) is
responsible for supervising all the financial transactions related to the HDMC, advising the Secretary
on all internal financial matters, maintaining records of financial receipts and expenditure in
accordance with the purpose and utilization of funds, reporting deviations in utilization of funds in any
of the approved schemes, assisting the MC in budget preparation, maintaining accounts regarding
stamp duty surcharge and State grants, maintaining petty cash book and general cash book and
attending to audit requirements and other such accounts-related duties.
The Accounts Department is also responsible for internal audit of all bills for payment, audit
clearances, preparation of annual financial statements and the Demand, Collection and Balance
statement (DCB). In HDMC, customised software system has been developed to manage the
accounts systematically with limited time and to bring in more transparency in all transactions.
Engineering Department
A Superintending Engineer (SE) heads the Engineering Department. The major duties and
responsibilities of the Engineering Department include construction and maintenance of roads, drains
and other public works. An Executive Engineer (EE) in-charge of projects handles the major projects
of the Municipal Corporation. There are eight EEs in HDMC looking after general projects, water
works, environment-swm, electrical, IT and horticulture The EE is supported by an AEE and an AE in
overseeing construction of major projects like shopping complexes, bus terminals, etc. AE in the
Drawing Section supports the Engineering Department in preparing requisite detailed engineering
drawings for undertaking works

Ministry of Urban Development
[154]] Draft City Development Plan – Hubli-Dharwad
Figure 41: Organization Structure of HDMC

Ministry of Urban Development
[155]] Draft City Development Plan – Hubli-Dharwad
Revenue Department
The Revenue Department is another key department in HDMC and it is headed by a revenue office.
Major responsibilities of the Revenue department includes collecting taxes such as, property tax,
advertisement tax, and entertainment tax; issuing notices for recovery of tax; and monitoring revenue
collections of the Municipal Corporation etc.
Town Planning Department
A Town Planning Officer heads the HDMC‘s Town Planning Department (DDTP). The department is
primarily responsible for enforcing Master Plan regulations, awarding building permissions and
facilitating land acquisitions for major schemes. The TPD also conducts routine inspection of HDMC
properties. TPOs and Building Inspectors carry out the department‘s functions.
Zonal offices
The HDMC has adopted a decentralized administration process and is divided into 12 zones and are
headed by Assistant Commissioners. The Zonal offices coordinate the activities of on behalf of the
HDMC for the provision of municipal services in their respective zones.
However, the zonal office does not have adequate staff to perform all the stipulated functions and
staffs are forced to take the responsibilities of more than three zones at a time. Especially in case of
specialized experts like environmental engineer, revenue officers etc. are addressing the issues of
multiple zones and lead to customer dissatisfaction
13.3 Urban reforms /transfer of function
One of the pre-requisite for assistance under the JnNURM was timeline implementation of urban
sector reforms. In Karnataka, a State Level Steering Committee (SLSC), under the Chairmanship of
the Chief Minister, has been constituted to identify, prioritize and recommend the project proposals
under JnNURM as per the Guidelines. Also, a State Level Empowered Committee (SLEC), under the
chairmanship of Chief Secretary to Government, is constituted to facilitate timely decisions on project
approvals and achieve co-ordination of the various agencies and departments under JnNURM. State
Government has appointed Karnataka Urban Infrastructure Development & Finance Corporation
(KUIDFC) as the State Level Nodal Agency (SLNA) for JnNURM to assist Urban Local Bodies (ULBs),
place proposals to SLSC for approval, manages grants, release funds to ULBs, maintain revolving
fund and monitor the physical and financial progress and implementation of reforms as committed in
the Memorandum of Agreement.
Under JnNURM certain reforms were to be undertaken by the State Governments in implementing the
74th CAA, which included the transfer of functions listed under the 12th Schedule of the CAA by
incorporating into the Municipal Act. In Karnataka state, the 12th Schedule has been in corporate in
the Municipal Act 1976, in 1995. The revised Act has provision for constituting DPCs, MPCs and Area
sabhas. Also, 16 functions except fire service and town planning have been transferred to the ULBs.
The transfer of fire service is not envisaged because of its specialized nature but Urban Planning is
not yet transferred to the ULBs.
The functions that have not been devolved to the ULB include urban planning, regulation of land use
and building regularisation activity, planning of economic and social development, and fire services.
Even though certain functions have been transferred to the ULBs in Karnataka, there are certain
functions that are performed by other agencies. For instance, the function of water supply and
drainage systems is being performed by the Karnataka Urban Water Supply and Drainage Board
(KUWSDB), which under takes capital projects related to water supply (in all the ULBs except

Ministry of Urban Development
[156]] Draft City Development Plan – Hubli-Dharwad
Bangalore).
Since 2003, KUWSDB is responsible for both capital and operation and maintenance of water supply
in Hubli-Dharwad. Similarly, slum clearance and improvement is the responsibility of the Karnataka
Slum Clearance Board (KSCB).The town planning functions is performed by the Hubli-Dharwad
Urban Development Authority (HDUDA), the Karnataka State Town Planning Board, and the Town
Planning Department.
Table 59: Karnataka: Decentralization of functions to HDMC
Sr. No. Function Transferred
1 Urban planning and town planning No HDUDA‘s are performing these functions
2 Regulation of land-use and building activity
No
3 Planning economic and social development
Yes
4 Roads and bridges Yes
5 Water supply-industrial, commercial, and domestic
Yes
6 Public health, sanitation, conservancy, and solid waste management
Yes
7 Fire services No Under Fire Services Department
8 Urban forestry, protection of environment, and promotion of ecological aspects
ULB/Forest Department
9 Safeguarding the interests of the weaker sections, physically handicapped, and mentally retarded
Yes
10 Slum improvement and up-gradation ULBs have responsibility to provide services to undeclared slums. KSCB, a special purpose agency, has the mandate for development programmes in the notified slums.
11 Urban poverty alleviation Yes
12 Provision of urban amenities like parks, gardens, playgrounds, and others
Yes
13 Promotion of aspects like education, aesthetics, and others
Yes
14 Burial and burial grounds, cremations, cremations grounds, and electric crematoria
Yes
15 Cattle ponds and prevention of cruelty to animals
Yes
16 Vital statistics, registration of births and deaths
Yes
17 Public amenities like, street lighting, parking lots, bus shelters, public conveniences, and others
Yes
18 Regulation of slaughterhouses and tanneries
Yes

Ministry of Urban Development
[157]] Draft City Development Plan – Hubli-Dharwad
Source: HDMC
13.3.1 Progress in Implementation of Reforms – State Level Reforms
Table 60: Compliance of the 74th Amendment Act Provisions
Sr.No
Karnataka Impact at ULB level
1 Constitution of ULBs Yes HDMC in place
2 Reservation of Seats Yes
Seats reserved to ensure the representation of weaker sections and women in the council 50% seats reserved for women
3 Regular conduct of Elections Yes
Regular and fair conduct of municipal elections periodically (in every five years).
4 Constitution of WCs No
Ward Sabhas are not constituted in all wards of HDMC. But provisions for Area sabhas included in the municipal act.
5 Constitution of DPCs Yes District planning Committees formed in Dharwad district but it is not functioning.
6 Constitution of MPCs No
Section 54 of KM Act, 1994 provides for constitution of MPC but not applicable for Hubli-Dharwad
7 In cooperation of 12
th Schedule
into municipal act Yes
Karnataka Municipal Act was revised in 1995 to in cooperate the 12
th Schedule.
8 Constitution of SFCs Yes
Second State Finance Commission has submitted its Report, its recommendations are implemented and third SFC has been constituted.
13.4 ULB Level Reforms – Mandatory and Optional
As mentioned, HDMC is not part of the JNNURM scheme. However, HDMC has taken initiatives to
implement the reforms at the city level. Following is the status of mandatory reforms at HDMC.
13.4.1 Mandatory Reforms
Adoption of modern accrual based double entry system of accounting
Identification of all the properties with reference to G.I.S. mapping, in 2011-12 the tax
collection was to the tune of 80%. And it is expected that the tax collection efficiency will
increase to more than 85% in years to come.
24x7 water supply is implemented on pilot basis in 8 of the 67 wards in HDMC and, the plan
to extend this system to other wards in phased manner is also approved by the State
government.
Water tariff from wards with continuous water supply is based on the quantity of water used
and expected to collect at least 50% of the O& M cost of the water supply, by levying the
water charges suitably.
HDMC is also planning for 100% coverage of door to door waste collection, and to collect
user charges for SWM.
Internal ear marking of the corporation budget for the weaker section, moreover programmes
are being implemented under RAY, NULM and other state sponsored schemes.

Ministry of Urban Development
[158]] Draft City Development Plan – Hubli-Dharwad
13.4.2 Optional reforms
Building bye-laws have been reformed and stream lined and the building permission and
building completion certificates are being issued by ―Auto Development and control
Regulations‖
Corporation is having in-house quality control cell
―Management Information System‖ has been introduced to support the administrative
activities and to have financial control over the expenditure.
Citizen charters have been released
13.4.3 ULB Level initiatives
HDMC has initiated several initiatives to improve service delivery and strengthen municipal
performance in the city and they are
Status of e-governance implementation
The Municipal Reforms Cell (MRC) was created in 2005 as the Nirmala Nagar Project under the DMA
of GoK, exclusively for the implementation of computerization and other reforms in all the ULBs of
Karnataka. These reforms are being implemented in selected 49 ULBs (including HDMC) of
Karnataka under the Asian Development Bank funded ‗Nirmala Nagar Project‘ and in the remaining
164 ULBs, under World Bank funded ‗Karnataka Municipal Reforms Project‘. The Municipal Reforms
Cell is headed by the Joint Director.
The Municipal Reforms Cell coordinates with the project partners, namely, e-Governments
Foundation (application support organization), Survey of India (technical advice support agency in
GIS implementation), Karnataka Urban Infrastructure Development Finance Corporation (funding
agency), and Software Technology Parks of India, Bangalore (for O&M of data Centre).
A state-level municipal data centre has been established within the Municipal Reforms Cell and a
centralized database of all the ULBs is being maintained by them. The entire process of rolling out of
municipal applications of ULBs is handled by the IT professionals of the Municipal Reforms Cell, duly
appointed by the department, directly from the market. The Municipal Reforms Cell handholds the
ULBs in the implementation of computerization and maintenance. The task of capacity building and
training of the municipal staff is also vested with the cell.
HDMC is a pioneer in developing integrated management information system (MIS) software –
designed to conduct day-to-day activities and transactions of ULBs. In fact, HDMC has given this MIS
software to Mangalore, Mysore, and Belgaum city corporations. The software is an integration of
various software programmes developed by the MIS Cell, HDMC (The MIS Cell was set up to
facilitate computerization of the HDMC). HDMC now has custom-made software for handling birth and
death registrations and issuing certificates, and accounting software for transfer and receipt of funds
and tax collection.
The MIS Cell has also developed various working modules for different departments and software that
would ensure adherence to administrative procedures and guidelines. For instance, the software
developed for the corporation‘s PWD enables the concerned officers to keep track of the all the
pending, sanctioned, and on-going works.
Building Plan Approval Management System
HDMC is the first corporation in Karnataka to implement the Building Plan Approval Management
System (BPAMS) with Automatic Development Control Regulations (AutoDCR). It is a single window
Ministry of Urban Development
[159]] Draft City Development Plan – Hubli-Dharwad
for the architects and license engineers to submit their proposal for getting Building Permission.
The software facilitates the mapping of scanned Auto CAD drawings and to Development Rules. The
BPAMS has facilitated workflow management, saves time from long manual process of checking the
development regulations for building plan approval and standardize the drawing process, and also
resulted in increased Fee collection. During 2012-13 Building Permission is integrated with property
tax resulted in an improvement in the tax collection
24x7 Public Grievance Redressal System
HDMC has established an Emergency Response Centre which is working round the clock with an
average response time of 30 minutes. During normal days it also acts as Public Grievance Redressal
Centre to facilitate efficient service.
Services to the citizens – 24/7 water supply
Karnataka Urban Water and Sanitation Improvement Program was initiated by KUIDFC under the
assistance of world Bank in 2005 and the project was implemented in 4 wards of Dharwad and in
whole area of 4 wards in few areas of five wards in Hubli.
A total of 11,225 houses are covered under this project in the first phase. As a part of the initiative, the
entire supply network in the demonstration zones in Hubli-Dharwad was replaced. The project is
expected to be extended to all the wards in Hubli-Dharwad in next 5 years.
HD-One Counter
Hubli-Dharwad One counter were introduced in the twin cities on the lines of Bangalore One, for
facilitating easy payment of bills. Services of multiple government departments and private companies
are available in a single window. At present these centres are providing around 20 services along with
seasonal services like university application forms, PUC application forms, election roll services and
regular services like payment of water tax, municipal tax, Hescom services, BSNL, life and vehicle
insurance, income tax and bus pass fees. There are around 8 such centers across the twin cities.
Reforms for Improving Administration/Governance
Decentralised Administration
Decentralization of HDMC‘s administration by dividing the twin cities into 12 Zones, administered by
Zonal offices headed by the Assistant Commissioners and this helped in improving efficiency of
administration and management.
Transparency in Expenditures
HDMC has developed website to enable the interface between citizens to know about their civic
organization, service and receive information. It has also tried to publish the details of all the works
including the listing of bills in the website every month through transparent information system readily
available to its citizens. Complaints against the work done by the HDMC are systematically enquired
by senior officials and resolutions are made at the earliest. Management information System (MIS)
HDMC has developed a MIS to facilitate and organise the functioning of the HDMC. Database of all
departmental function, activities etc. are created and made available through MIS. The other
information systems functioning in the HDMC includes.
File and Letter Tracking System: online system to track the actions taken on letters received by
HDMC
Record Management System- To track inter and intra departmental movements of records.

Ministry of Urban Development
[160]] Draft City Development Plan – Hubli-Dharwad
Biometric Attendance System- HDMC has installed Biometric Attendance System which is linked
with the Payroll
Online payment through IPG, Net Banking and IVRS system through which Citizens can pay the tax
and other fees to HDMC by cash to the banks as cheque DD also the online payment.
ISO Certification
ISO certification had been awarded to HDMC for upgrading the quality of service and administration
of the corporation. Certification has helped to increase the confidence of its citizen on its services
provided by HDMC.
13.5 Roles and Responsibilities of various Institutions
HDMC and other Parastatals agencies are involved in providing the key services to the citizens and
planning and implementation of the projects within the jurisdictions of HDMC. Following section
provides the key functions, role, and responsibilities of HDMC and other agencies.
The Directorate of Municipal Administration (DMA) Acts as the chief controlling authority in
respect of all matters relating to the administration of the KM Act. It is responsible for supervising the
functioning of the municipalities, formulating suitable human resource development policies,
exercising disciplinary control over the staff of municipalities, monitoring the tax collection of ULBs,
laying down policies for transparency in expenditures, hearing appeals against the decisions of
municipalities, releasing the government transfers to the ULBs, as well as implementing schemes like
SJSRY (for urban poverty alleviation), IDSMT, and Nirmala Nagar Project.
The Public Works Department (PWD) is responsible for road works including maintenance of state
highways and major district roads and construction and maintenance of government buildings.
The Karnataka Industrial Areas Development Board (KIADB) is an infrastructure agency
responsible for establishing infrastructure for orderly development of industries.
The Directorate of Social Welfare (DSW) is responsible for the implementation of various schemes
and programmes, funded by both central and state governments for the welfare of scheduled caste
population within the state.
Table 61: Roles and Responsibilities of various Institutions
Sr. No.
Key Infrastructure Services
Planning and Design Construction/ Implementation
O&M
1 Water Supply KUWSDB,HDMC,KUIDFC KUWSDB, HDMC HDMC
2 Sewerage HDMC, KUIDFC HDMC HDMC
3 Storm Water Drains
HDMC HDMC HDMC
4 Solid Waste Management
HDMC , DMA HDMC HDMC
5 Urban Transport NWKRTC, DMLT,HDBRT ltd
NWKRTC,DMLT,HDBRTltd
NWKRTC,HDBRT ltd
6 Municipal Roads HDMC, PWD, HDUDA HDMC, PWD, HDUDA HDMC, PWD, HDUDA
7 Street Lighting HDMC HDMC HDMC
8 Preparation of Master Plan/Development Plan
HDUDA HDMC HDUDA

Ministry of Urban Development
[161]] Draft City Development Plan – Hubli-Dharwad
Sr. No.
Key Infrastructure Services
Planning and Design Construction/ Implementation
O&M
9 Housing for the Urban Poor
KSDB,HDMC KSDB, HDMC HDMC
13.6 Key Issues
In Hubli-Dharwad the municipal elections were held during May 2013, however no Council,
Mayor and General body in place due to legal issues.
Key functions such as water supply and urban planning are transferred to HDMC but no
clarity about their role and responsibility and also lack proper coordination between HDMC
and KUWSDB. Eventually, service delivery is affected in HDMC.
Master Plan, Land use plan and TP schemes for the area are prepared by the HDUDA and
HDMC has no role in the plan preparation hence any participation of public in plan
preparation.
HDMC is yet to constitute the ward committees to initiate the people participations in the
planning and implementation of the projects. Due to this, the ward/zone works are carried
without consensus and people‘s participation.
Inadequate staff at zonal office of HDMC to carry out the zonal works. As a result, there is an
additional pressure on the technical staff and eventually they have to monitor multiple zone
works. This is further leading to inefficient service delivery in the zones.
Frequent transfer of key officials such as Commissioner and Joint Commissioner is a matter
of concern. As a result of the transfers, priorities of HDMC keep changing affecting the overall
efficiency of the system.
DPC is constituted in the Dharwad district as an initiative to strengthen the decentralized
governance but the DPC is not in function.

Ministry of Urban Development
[162]] Draft City Development Plan – Hubli-Dharwad
14. Financial Assessment
The administration of finance in HDMC is looked after by the accounts department. The department is
headed by the Chief Accounts Officer, supported by the Chief Audit Officer, Assistant Revenue
Officer, Accountant, clerks, computer operators, and peons. The main functions of department
include:
Preparing the budget every year and monitor account head wise income and expenditure
Giving status regarding financial matters
Checking income and expenditure periodically
Preparing periodical reports on income/expenditure
Coordinating payments and Depositing funds in various banks
Repaying loans obtained from the government and other financial institutions.
Budgeting is an essential element of the financial planning, control and evaluation processes of ULBs.
HDMC prepares budget to arrive at a scientific framework for building linkage between the nature of
receipt or payment with the functions and services. In HDMC budget is prepared with the participation
of public representatives along with the HoDs. Introduction of pre-budget public consultations during
budget preparation has resulted in higher transparency, general awareness about HDMC‘s
accounts/finances, and increased accountability. The process of budget preparation starts in October
and draft budget is placed in Council after the approval of the Municipal Commissioner (MC) in
February.
14.1 First Generation CDP– Key Features of Municipal Finance
The 1st generation CDP has provided the financial status of HDMC for the review period 2000-02 to
2005-06. The status of Revenue account, capital account and collection of taxes and charges is
shown in the table below:
Table 62: 1st
generation CDP key features of municipal finance
Component 2005-06 1st generation CDP scenario
(Rs. In lakhs)
2011-12 Post CDP scenario
(Rs. In lakhs)
Revenue Income 6605 15982
Revenue Expenditure 5034 12335
Capital Income 1165 2033
Operating ratio 0.76 0.78
Capital Expenditure 2472 3641
Source: 1st generation CDP and HDMC annual accounts
Key Issues identified under 1st
generation CDP
High dependence on state devolutions/grants
Steady increase in revenue income through property tax reforms
Current revenue growth cannot match requirements – especially capital investment programs
Increased expenditure on pensions
Increased O & M liability in view of cap investment
Need to identify additional sources of revenue - user charges, impact fee, licenses, and
advertisement tax
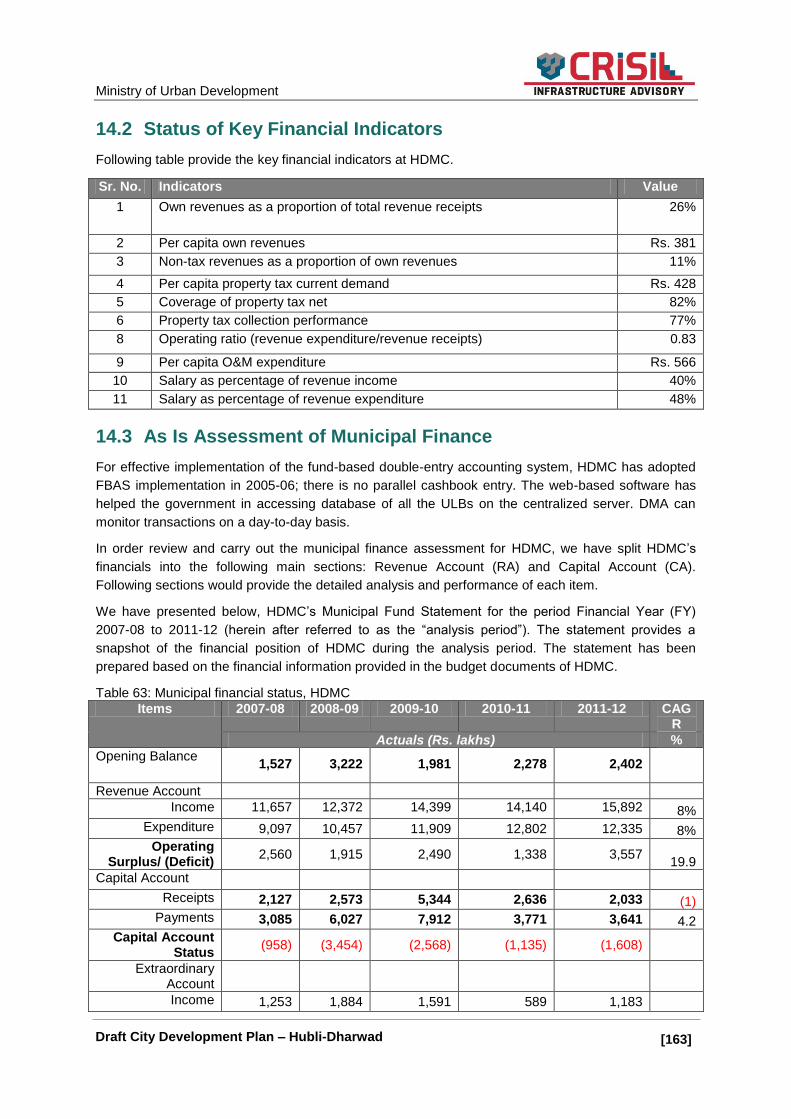
Ministry of Urban Development
[163]] Draft City Development Plan – Hubli-Dharwad
14.2 Status of Key Financial Indicators
Following table provide the key financial indicators at HDMC.
Sr. No. Indicators Value
1 Own revenues as a proportion of total revenue receipts 26%
2 Per capita own revenues Rs. 381
3 Non-tax revenues as a proportion of own revenues 11%
4 Per capita property tax current demand Rs. 428
5 Coverage of property tax net 82%
6 Property tax collection performance 77%
8 Operating ratio (revenue expenditure/revenue receipts) 0.83
9 Per capita O&M expenditure Rs. 566
10 Salary as percentage of revenue income 40%
11 Salary as percentage of revenue expenditure 48%
14.3 As Is Assessment of Municipal Finance
For effective implementation of the fund-based double-entry accounting system, HDMC has adopted
FBAS implementation in 2005-06; there is no parallel cashbook entry. The web-based software has
helped the government in accessing database of all the ULBs on the centralized server. DMA can
monitor transactions on a day-to-day basis.
In order review and carry out the municipal finance assessment for HDMC, we have split HDMC‘s
financials into the following main sections: Revenue Account (RA) and Capital Account (CA).
Following sections would provide the detailed analysis and performance of each item.
We have presented below, HDMC‘s Municipal Fund Statement for the period Financial Year (FY)
2007-08 to 2011-12 (herein after referred to as the ―analysis period‖). The statement provides a
snapshot of the financial position of HDMC during the analysis period. The statement has been
prepared based on the financial information provided in the budget documents of HDMC.
Table 63: Municipal financial status, HDMC
Items 2007-08 2008-09 2009-10 2010-11 2011-12 CAGR
Actuals (Rs. lakhs) %
Opening Balance 1,527 3,222 1,981 2,278 2,402
Revenue Account
Income 11,657 12,372 14,399 14,140 15,892 8%
Expenditure 9,097 10,457 11,909 12,802 12,335 8%
Operating Surplus/ (Deficit)
2,560 1,915 2,490 1,338 3,557 19.9
Capital Account
Receipts 2,127 2,573 5,344 2,636 2,033 (1)
Payments 3,085 6,027 7,912 3,771 3,641 4.2
Capital Account Status
(958) (3,454) (2,568) (1,135) (1,608)
Extraordinary Account
Income 1,253 1,884 1,591 589 1,183
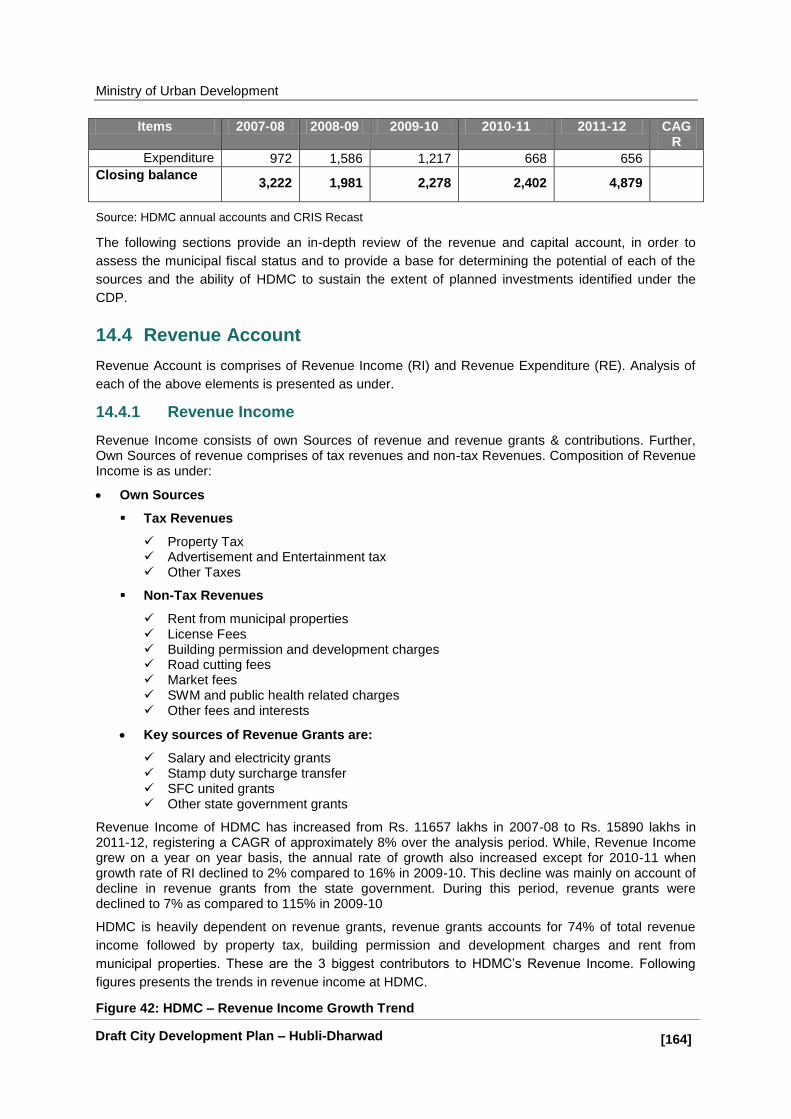
Ministry of Urban Development
[164]] Draft City Development Plan – Hubli-Dharwad
Items 2007-08 2008-09 2009-10 2010-11 2011-12 CAGR
Expenditure 972 1,586 1,217 668 656
Closing balance 3,222 1,981 2,278 2,402 4,879
Source: HDMC annual accounts and CRIS Recast
The following sections provide an in-depth review of the revenue and capital account, in order to
assess the municipal fiscal status and to provide a base for determining the potential of each of the
sources and the ability of HDMC to sustain the extent of planned investments identified under the
CDP.
14.4 Revenue Account
Revenue Account is comprises of Revenue Income (RI) and Revenue Expenditure (RE). Analysis of
each of the above elements is presented as under.
14.4.1 Revenue Income
Revenue Income consists of own Sources of revenue and revenue grants & contributions. Further, Own Sources of revenue comprises of tax revenues and non-tax Revenues. Composition of Revenue Income is as under:
Own Sources
Tax Revenues
Property Tax Advertisement and Entertainment tax Other Taxes
Non-Tax Revenues
Rent from municipal properties License Fees Building permission and development charges Road cutting fees Market fees SWM and public health related charges Other fees and interests
Key sources of Revenue Grants are:
Salary and electricity grants Stamp duty surcharge transfer SFC united grants Other state government grants
Revenue Income of HDMC has increased from Rs. 11657 lakhs in 2007-08 to Rs. 15890 lakhs in 2011-12, registering a CAGR of approximately 8% over the analysis period. While, Revenue Income grew on a year on year basis, the annual rate of growth also increased except for 2010-11 when growth rate of RI declined to 2% compared to 16% in 2009-10. This decline was mainly on account of decline in revenue grants from the state government. During this period, revenue grants were declined to 7% as compared to 115% in 2009-10
HDMC is heavily dependent on revenue grants, revenue grants accounts for 74% of total revenue
income followed by property tax, building permission and development charges and rent from
municipal properties. These are the 3 biggest contributors to HDMC‘s Revenue Income. Following
figures presents the trends in revenue income at HDMC.
Figure 42: HDMC – Revenue Income Growth Trend
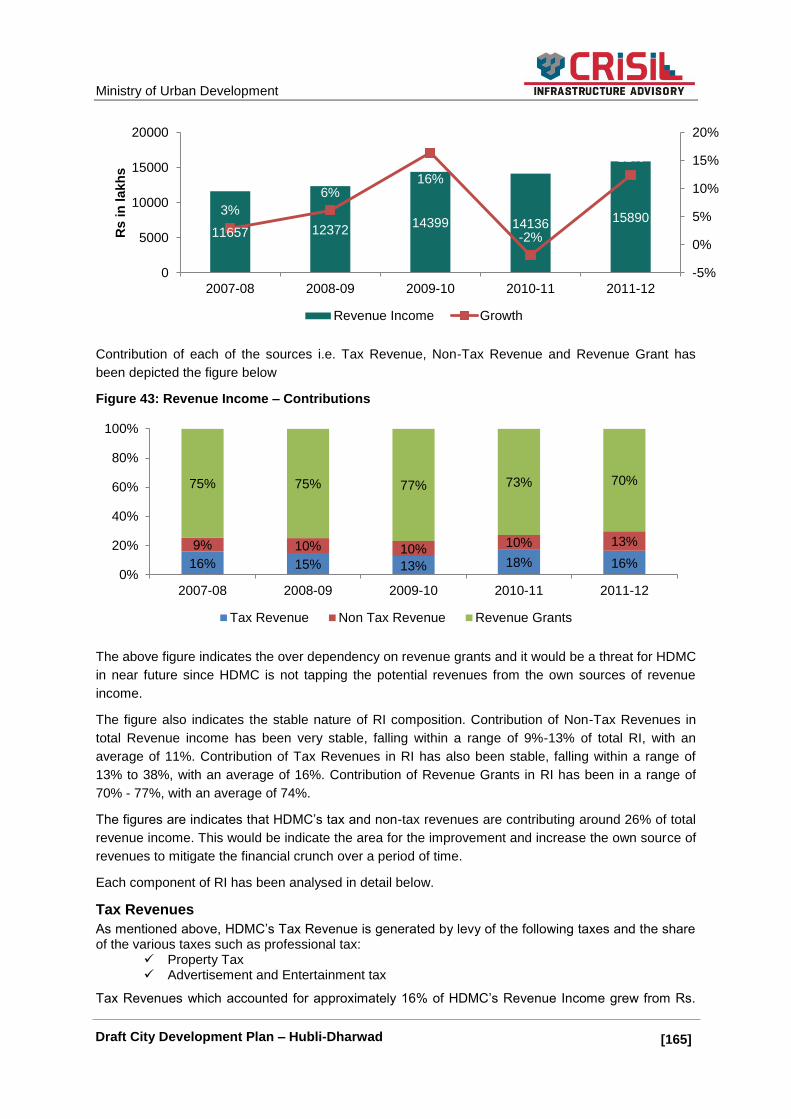
Ministry of Urban Development
[165]] Draft City Development Plan – Hubli-Dharwad
Contribution of each of the sources i.e. Tax Revenue, Non-Tax Revenue and Revenue Grant has
been depicted the figure below
Figure 43: Revenue Income – Contributions
The above figure indicates the over dependency on revenue grants and it would be a threat for HDMC
in near future since HDMC is not tapping the potential revenues from the own sources of revenue
income.
The figure also indicates the stable nature of RI composition. Contribution of Non-Tax Revenues in
total Revenue income has been very stable, falling within a range of 9%-13% of total RI, with an
average of 11%. Contribution of Tax Revenues in RI has also been stable, falling within a range of
13% to 38%, with an average of 16%. Contribution of Revenue Grants in RI has been in a range of
70% - 77%, with an average of 74%.
The figures are indicates that HDMC‘s tax and non-tax revenues are contributing around 26% of total
revenue income. This would be indicate the area for the improvement and increase the own source of
revenues to mitigate the financial crunch over a period of time.
Each component of RI has been analysed in detail below.
Tax Revenues
As mentioned above, HDMC‘s Tax Revenue is generated by levy of the following taxes and the share of the various taxes such as professional tax:
Property Tax Advertisement and Entertainment tax
Tax Revenues which accounted for approximately 16% of HDMC‘s Revenue Income grew from Rs.
11657 12372 14399 14136 15890
3%
6% 16%
-2%
12%
-5%
0%
5%
10%
15%
20%
0
5000
10000
15000
20000
2007-08 2008-09 2009-10 2010-11 2011-12
Rs i
n lakh
s
Revenue Income Growth
16% 15% 13% 18% 16%
9% 10% 10% 10% 13%
75% 75% 77% 73% 70%
0%
20%
40%
60%
80%
100%
2007-08 2008-09 2009-10 2010-11 2011-12
Tax Revenue Non Tax Revenue Revenue Grants

Ministry of Urban Development
[166]] Draft City Development Plan – Hubli-Dharwad
1866 lakhs in 2007-08 to Rs. 2618 lakhs in 2011-12, translating into a CAGR of approximately 9%.
Year-on-year growth rate is inconsistent with Tax Revenue growing by around 8% every year.
However, during the year 2008-09, growth rate has been declined to 1% as compared to 3% in
previous year. The growth rate has been decreased on account of negative growth rate reported in
property tax revenues. During this period, the property tax collection was declined by 1% as
compared to previous year collection.
Figure 44: Tax Revenue Growth trends
On an average, property tax accounts for approximately 98% of Tax Revenue followed by
advertisement tax 2% of total tax revenues. Composition of Tax Revenue is presented in the figure
below.
Figure 45: Tax Revenue Composition
Assessment of property tax system at HDMC
HDMC has implemented property taxes reforms and property related GIS. Municipal Geographic
Information System (MGIS) was developed and it enables the user for self-assessment of property
tax. Citizens pay property tax through the Self-Assessment Scheme (SAS). Zonal offices also
facilitate door to door collection of taxes. The taxes could be paid in the banks as well. As per the
1866 1856 1850
2478 2618
3%
-1% -0.3%
34%
6%
-5%
0%
5%
10%
15%
20%
25%
30%
35%
40%
0
500
1000
1500
2000
2500
3000
2007-08 2008-09 2009-10 2010-11 2011-12
Rs i
n L
akh
s
Tax Revenue Growth
99% 99%
98% 98% 98%
1% 1%
2% 2% 2%
96%
97%
97%
98%
98%
99%
99%
100%
100%
2007-08 2008-09 2009-10 2010-11 2011-12
Property Tax Advertisment Tax
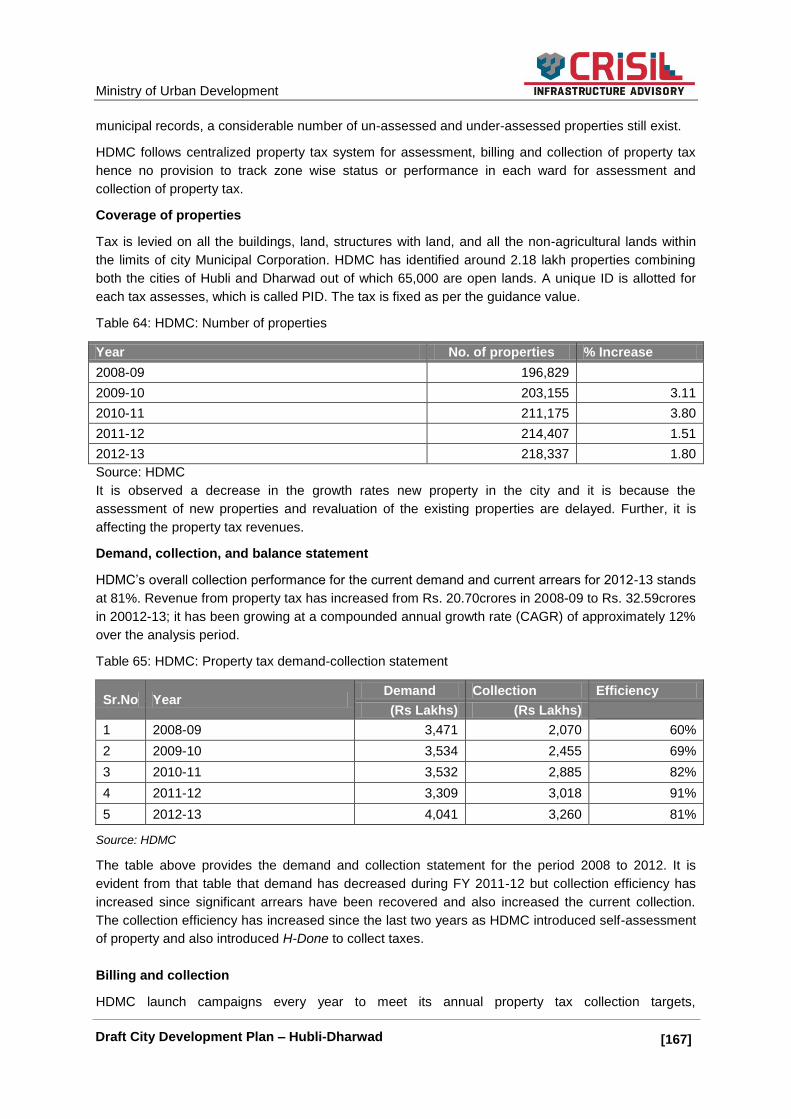
Ministry of Urban Development
[167]] Draft City Development Plan – Hubli-Dharwad
municipal records, a considerable number of un-assessed and under-assessed properties still exist.
HDMC follows centralized property tax system for assessment, billing and collection of property tax
hence no provision to track zone wise status or performance in each ward for assessment and
collection of property tax.
Coverage of properties
Tax is levied on all the buildings, land, structures with land, and all the non-agricultural lands within
the limits of city Municipal Corporation. HDMC has identified around 2.18 lakh properties combining
both the cities of Hubli and Dharwad out of which 65,000 are open lands. A unique ID is allotted for
each tax assesses, which is called PID. The tax is fixed as per the guidance value.
Table 64: HDMC: Number of properties
Year No. of properties % Increase
2008-09 196,829
2009-10 203,155 3.11
2010-11 211,175 3.80
2011-12 214,407 1.51
2012-13 218,337 1.80
Source: HDMC
It is observed a decrease in the growth rates new property in the city and it is because the
assessment of new properties and revaluation of the existing properties are delayed. Further, it is
affecting the property tax revenues.
Demand, collection, and balance statement
HDMC‘s overall collection performance for the current demand and current arrears for 2012-13 stands
at 81%. Revenue from property tax has increased from Rs. 20.70crores in 2008-09 to Rs. 32.59crores
in 20012-13; it has been growing at a compounded annual growth rate (CAGR) of approximately 12%
over the analysis period.
Table 65: HDMC: Property tax demand-collection statement
Sr.No Year Demand Collection Efficiency
(Rs Lakhs) (Rs Lakhs)
1 2008-09 3,471 2,070 60%
2 2009-10 3,534 2,455 69%
3 2010-11 3,532 2,885 82%
4 2011-12 3,309 3,018 91%
5 2012-13 4,041 3,260 81%
Source: HDMC
The table above provides the demand and collection statement for the period 2008 to 2012. It is
evident from that table that demand has decreased during FY 2011-12 but collection efficiency has
increased since significant arrears have been recovered and also increased the current collection.
The collection efficiency has increased since the last two years as HDMC introduced self-assessment
of property and also introduced H-Done to collect taxes.
Billing and collection
HDMC launch campaigns every year to meet its annual property tax collection targets,

Ministry of Urban Development
[168]] Draft City Development Plan – Hubli-Dharwad
announcements were made over loudspeakers and distributed pamphlets. Till 2012-13, Tax
collections were through zonal office centres/online/nationalised banks. During the financial year
2013-14, HDMC initiated door-to-door collection of property tax from July 1. Bill collectors were
appointed by the corporation visit houses and issue notices for the annual property tax. Point-of-sale
(PoS) machines are provided to bill collectors and they issue the tax notice, collect the money and
issue receipts to property owners. Earlier, the notice was issued to defaulters manually within the first
three months of the financial year. However, the corporation faced problems in collection due to lack
of manpower.
Online property tax system (e-payment) was introduced by HDMC in 2012. Hubli-DharwadOne
counter were introduced for facilitating easy payment of bills. Services of multiple government
departments and private companies are available under the one roof. At present these centres are
providing regular services like payment of water tax, municipal tax etc. Under the new system, tax
could be assessed by the individual but many people still prefer manual payment of property tax at
various counters of Hubli-Dharwad One Centre.
Non-Tax Revenues
Non-tax revenues are generated from the following sources
Rent from municipal properties
License Fees
Building permission and development charges
Road cutting fees
Market fees
SWM and public health related charges
Other fees and interests
Non-tax revenue of HDMC has been growing. Non-tax revenue has increased from Rs. 1093 lakhs in
2007-08 to Rs. 2125 lakhs in 2011-12, translating into a CAGR of approximately 18%. On an average,
building permission and development charges have contributed 49% of non-tax revenues, while fee
for municipal properties accounted for 19% and licenses accounted for 16 of the total non-tax
revenues. Trend of non-tax revenues is indicated in the figures below:
Figure 46: Non-Tax Revenue Trends
1093 1256
1478 1388
2125
3%
15% 18%
-6%
53%
-10%
0%
10%
20%
30%
40%
50%
60%
0
500
1000
1500
2000
2500
2007-08 2008-09 2009-10 2010-11 2011-12
Rs i
n lakh
s
Non Tax Revenue Growth
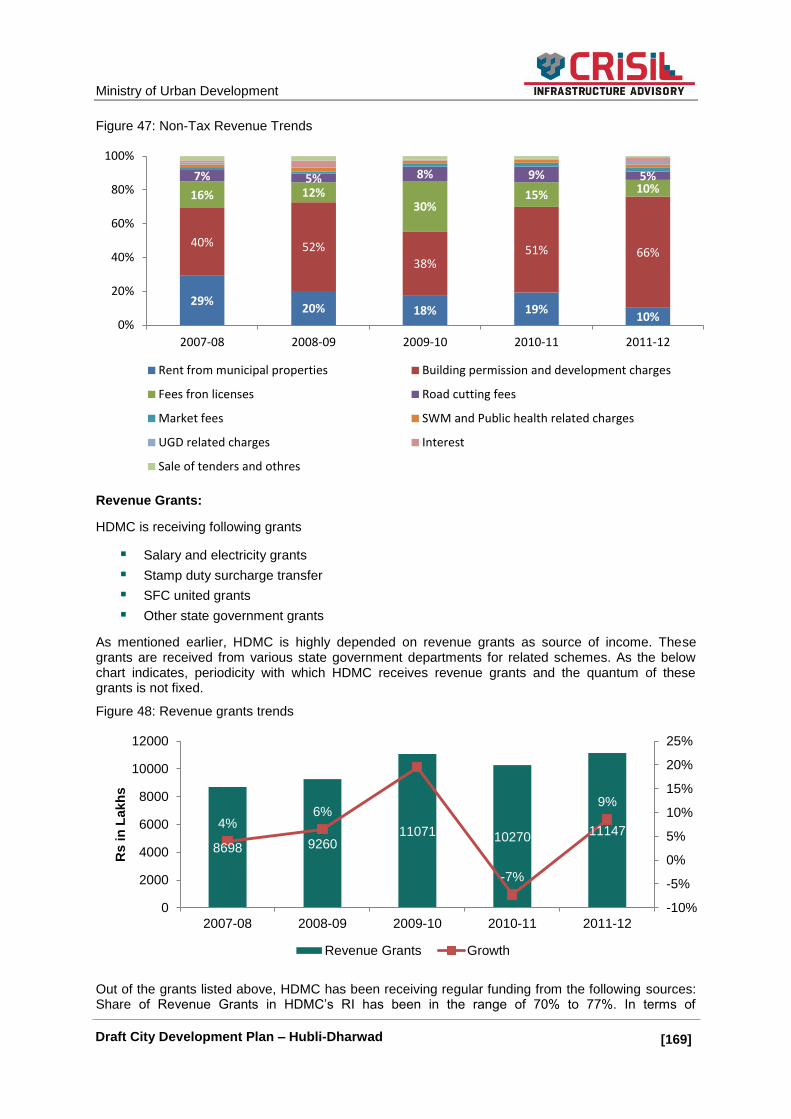
Ministry of Urban Development
[169]] Draft City Development Plan – Hubli-Dharwad
Figure 47: Non-Tax Revenue Trends
Revenue Grants:
HDMC is receiving following grants
Salary and electricity grants
Stamp duty surcharge transfer
SFC united grants
Other state government grants
As mentioned earlier, HDMC is highly depended on revenue grants as source of income. These grants are received from various state government departments for related schemes. As the below chart indicates, periodicity with which HDMC receives revenue grants and the quantum of these grants is not fixed.
Figure 48: Revenue grants trends
Out of the grants listed above, HDMC has been receiving regular funding from the following sources: Share of Revenue Grants in HDMC‘s RI has been in the range of 70% to 77%. In terms of
29% 20% 18% 19%
10%
40% 52%
38% 51% 66%
16% 12% 30%
15% 10% 7% 5% 8% 9% 5%
0%
20%
40%
60%
80%
100%
2007-08 2008-09 2009-10 2010-11 2011-12
Rent from municipal properties Building permission and development charges
Fees fron licenses Road cutting fees
Market fees SWM and Public health related charges
UGD related charges Interest
Sale of tenders and othres
8698 9260 11071 10270 11147
4% 6%
20%
-7%
9%
-10%
-5%
0%
5%
10%
15%
20%
25%
0
2000
4000
6000
8000
10000
12000
2007-08 2008-09 2009-10 2010-11 2011-12
Rs i
n L
akh
s
Revenue Grants Growth

Ministry of Urban Development
[170]] Draft City Development Plan – Hubli-Dharwad
composition, salary grant accounts for 44% of total grants received followed by electricity grant 26% and SFC unity grants 24%. Composition of Revenue Grants received between 2007-07 and 2011-12 is presented as under.
Figure 49: Revenue Grants - Composition
14.4.2 Revenue Expenditure
Revenue Expenditure (RE) covers expenditure incurrred by HDMC on its day to day operations. Key componets of RE are:
Salary expenditure
Operation and Maintanance
Debt repayment
Overall, the revenue expenditure has been increased from Rs 9097 lakhs in 2007-08 and Rs 12335
lakhs in 2011-12 and registered a CAGR of 8% over the review period. The trends in revenue
expenditure have been presented in below chart.
Figure 50: Revenue Expenditure
Composition of Revenue expenditure over the recent years has been consistent. During the review
period, the salary expenditure in the range of 40-50%; the average salary expenditure is about 49% of
40% 42% 41% 46% 50%
26% 19% 14%
25% 23%
27% 29%
21%
20% 24%
4% 8%
23%
8% 1%
0%
20%
40%
60%
80%
100%
2007-08 2008-09 2009-10 2010-11 2011-12State government gratns SFC united grant
Stamp duty surcharge Grant received for reimbursement of Expenses
Electricity Grant Salary Grant
9097 10457
11909 12802 12335
8%
15% 14%
8%
-4%
-5%
0%
5%
10%
15%
20%
0
2000
4000
6000
8000
10000
12000
14000
2007-08 2008-09 2009-10 2010-11 2011-12
Rs i
n L
akh
s
Revenue Expenditure Growth
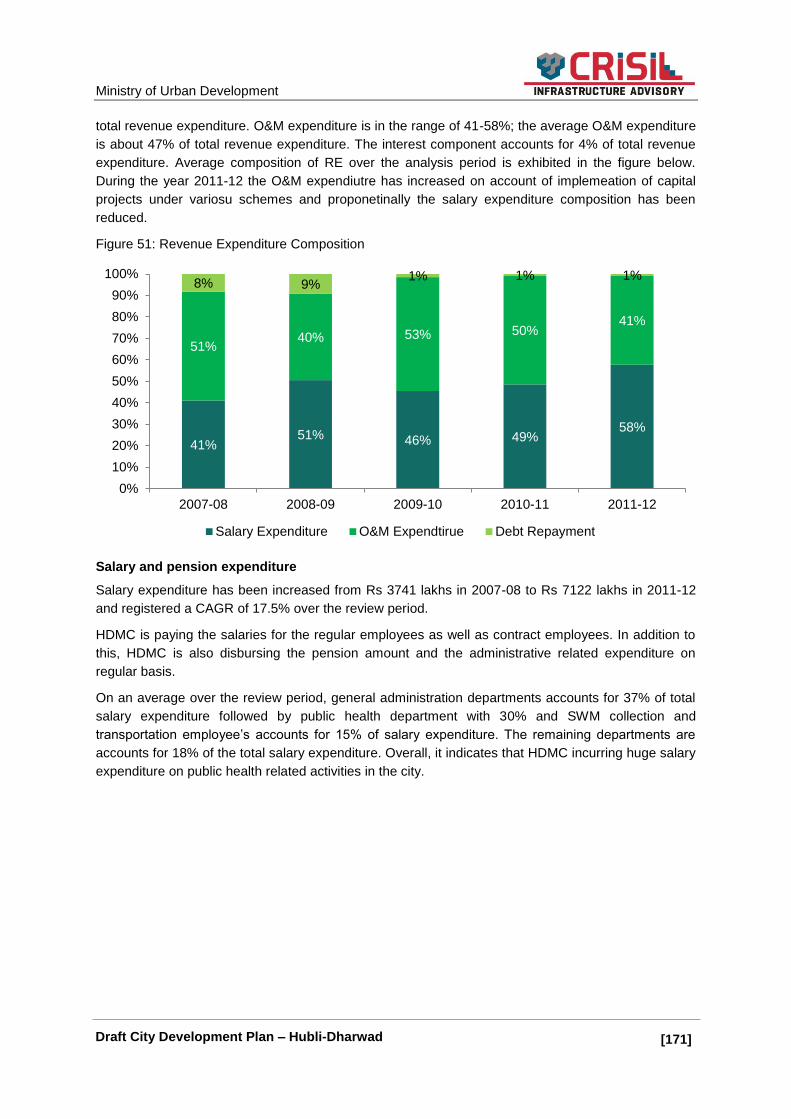
Ministry of Urban Development
[171]] Draft City Development Plan – Hubli-Dharwad
total revenue expenditure. O&M expenditure is in the range of 41-58%; the average O&M expenditure
is about 47% of total revenue expenditure. The interest component accounts for 4% of total revenue
expenditure. Average composition of RE over the analysis period is exhibited in the figure below.
During the year 2011-12 the O&M expendiutre has increased on account of implemeation of capital
projects under variosu schemes and proponetinally the salary expenditure composition has been
reduced.
Figure 51: Revenue Expenditure Composition
Salary and pension expenditure
Salary expenditure has been increased from Rs 3741 lakhs in 2007-08 to Rs 7122 lakhs in 2011-12
and registered a CAGR of 17.5% over the review period.
HDMC is paying the salaries for the regular employees as well as contract employees. In addition to
this, HDMC is also disbursing the pension amount and the administrative related expenditure on
regular basis.
On an average over the review period, general administration departments accounts for 37% of total
salary expenditure followed by public health department with 30% and SWM collection and
transportation employee‘s accounts for 15% of salary expenditure. The remaining departments are
accounts for 18% of the total salary expenditure. Overall, it indicates that HDMC incurring huge salary
expenditure on public health related activities in the city.
41% 51% 46% 49%
58%
51% 40% 53% 50%
41%
8% 9% 1% 1% 1%
0%
10%
20%
30%
40%
50%
60%
70%
80%
90%
100%
2007-08 2008-09 2009-10 2010-11 2011-12
Salary Expenditure O&M Expendtirue Debt Repayment
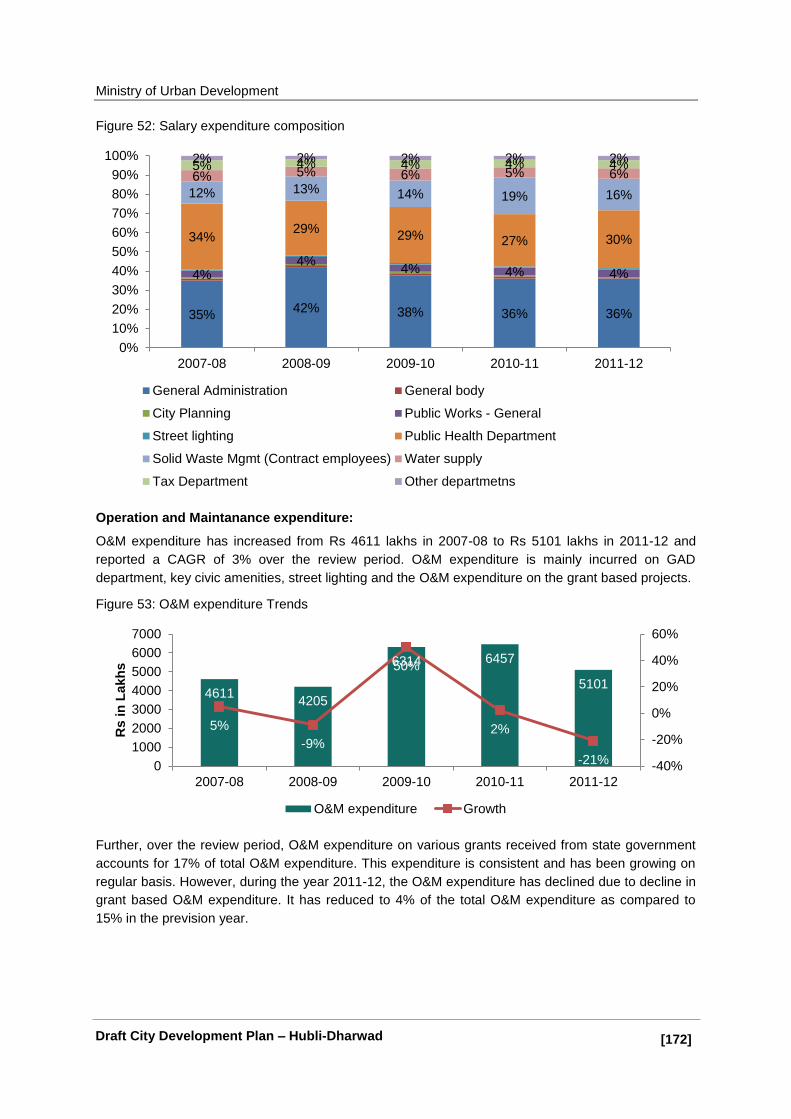
Ministry of Urban Development
[172]] Draft City Development Plan – Hubli-Dharwad
Figure 52: Salary expenditure composition
Operation and Maintanance expenditure:
O&M expenditure has increased from Rs 4611 lakhs in 2007-08 to Rs 5101 lakhs in 2011-12 and
reported a CAGR of 3% over the review period. O&M expenditure is mainly incurred on GAD
department, key civic amenities, street lighting and the O&M expenditure on the grant based projects.
Figure 53: O&M expenditure Trends
Further, over the review period, O&M expenditure on various grants received from state government
accounts for 17% of total O&M expenditure. This expenditure is consistent and has been growing on
regular basis. However, during the year 2011-12, the O&M expenditure has declined due to decline in
grant based O&M expenditure. It has reduced to 4% of the total O&M expenditure as compared to
15% in the prevision year.
35% 42% 38% 36% 36%
4% 4%
4% 4% 4%
34% 29%
29% 27% 30%
12% 13% 14% 19% 16%
6% 5% 6% 5% 6% 5% 4% 4% 4% 4% 2% 2% 2% 2% 2%
0%
10%
20%
30%
40%
50%
60%
70%
80%
90%
100%
2007-08 2008-09 2009-10 2010-11 2011-12
General Administration General body
City Planning Public Works - General
Street lighting Public Health Department
Solid Waste Mgmt (Contract employees) Water supply
Tax Department Other departmetns
4611 4205
6314 6457
5101
5%
-9%
50%
2%
-21% -40%
-20%
0%
20%
40%
60%
0
1000
2000
3000
4000
5000
6000
7000
2007-08 2008-09 2009-10 2010-11 2011-12
Rs i
n L
akh
s
O&M expenditure Growth

Ministry of Urban Development
[173]] Draft City Development Plan – Hubli-Dharwad
On an average, water works 10
department accounts for 23% of total O&M expenditure followed by
street lighting accounts for 22% of total O&M expenditure. Rest of the departments accounts for 21%
of the total O&M expenditure. Overall, the O&M expenditure is consistent for the remaining
departments.
Figure 54: O&M expenditure Composition
Debt reapayment
HDMC has taken loans from the banks and financial institutors to implement the projects within in the
city. In accordance with loans, HDMC is repaying the interest component on regular basis. On an
average, over the review period, HDMC is repaying around Rs 423 lakhs towards interest and capital
component for the loans taken. Over the past five year, HDMC has paid Rs 2118 lakhs as repayment
towards the loans.
Revenue Surplus
Revenue Account of HDMC has been in surplus across the analysis period. This clearly indicates the
sufficiency of Revenue Income to meet the Revenue Expenditure on an on-going basis. As indicated
in the figure below, revenue surplus earned by HDMC has been growing steadily, increasing from Rs.
2560 lakhs in 2007-08 to Rs. 3555 lakhs in 2011-12. However, during the year 2010-11, HDMC has
reported revenue surplus of Rs 1334 lakhs; this was due to increase in salary expenditure; during this
period the salary expenditure has increased from Rs 5420 lakhs to Rs 6224 lakhs and also the salary
expenditure has increased in the subsequent year as well.
10
However, the function is being handled by line departments. But, at the same time, the accounts reflect the expenditure towards water works. Hence, this would be corrected while finalizing the draft CDP for the city after discussion with the officials
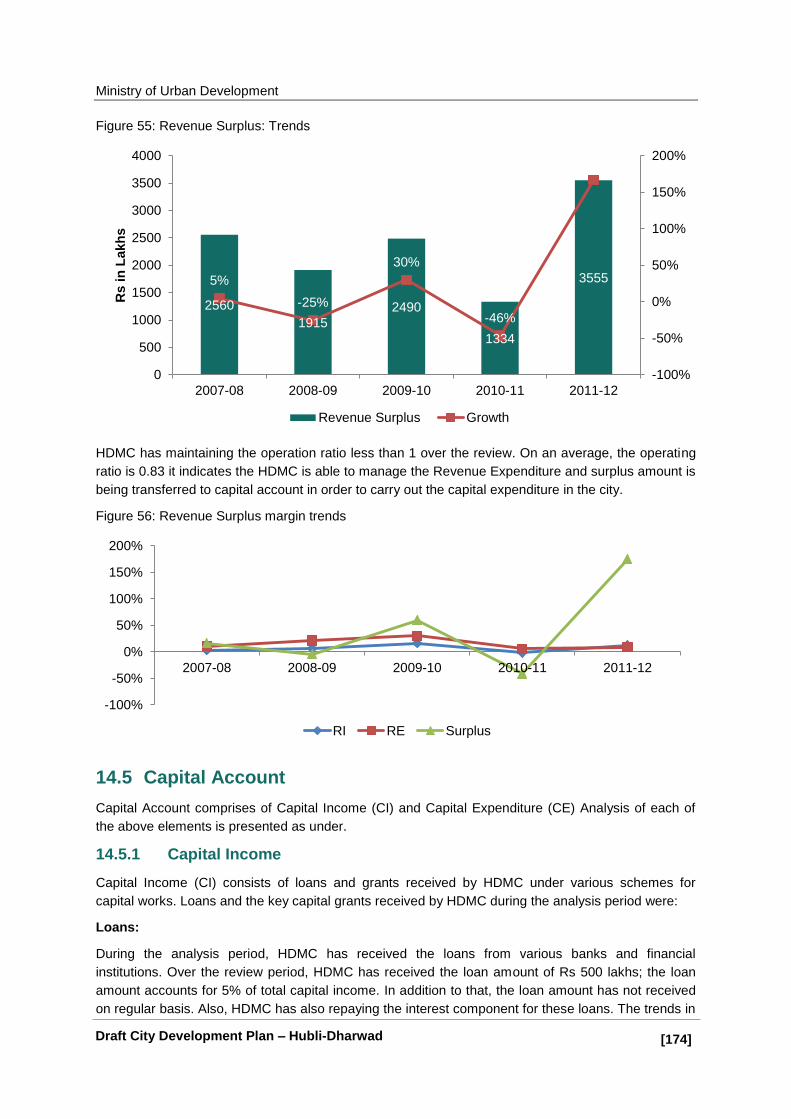
Ministry of Urban Development
[174]] Draft City Development Plan – Hubli-Dharwad
Figure 55: Revenue Surplus: Trends
HDMC has maintaining the operation ratio less than 1 over the review. On an average, the operating
ratio is 0.83 it indicates the HDMC is able to manage the Revenue Expenditure and surplus amount is
being transferred to capital account in order to carry out the capital expenditure in the city.
Figure 56: Revenue Surplus margin trends
14.5 Capital Account
Capital Account comprises of Capital Income (CI) and Capital Expenditure (CE) Analysis of each of
the above elements is presented as under.
14.5.1 Capital Income
Capital Income (CI) consists of loans and grants received by HDMC under various schemes for
capital works. Loans and the key capital grants received by HDMC during the analysis period were:
Loans:
During the analysis period, HDMC has received the loans from various banks and financial
institutions. Over the review period, HDMC has received the loan amount of Rs 500 lakhs; the loan
amount accounts for 5% of total capital income. In addition to that, the loan amount has not received
on regular basis. Also, HDMC has also repaying the interest component for these loans. The trends in
2560
1915
2490
1334
3555 5%
-25%
30%
-46%
167%
-100%
-50%
0%
50%
100%
150%
200%
0
500
1000
1500
2000
2500
3000
3500
4000
2007-08 2008-09 2009-10 2010-11 2011-12
Rs i
n L
akh
s
Revenue Surplus Growth
-100%
-50%
0%
50%
100%
150%
200%
2007-08 2008-09 2009-10 2010-11 2011-12
RI RE Surplus

Ministry of Urban Development
[175]] Draft City Development Plan – Hubli-Dharwad
loans have been presented in the below figure.
Grants:
HDMC is receiving following capital grants to take-up the capitals works and improve the service
delivery in the city.
Deferred income in respect of asset created out of grants and contributions (UIDSSMT, SFC,
Additional)
Road Grants
Health Grant
MP, MLC and MP grants
Finance commission grants
NKUSIP and KUWISIP
State government grants
Overall, capital grants accounts for 96% of total capital income. On a regular basis, HDMC is
receiving the above mentioned capital grants from the state government and other sources. On an
average, HDMC is receiving capital about Rs 2300 lakhs. However, during the year 2009-10, HDMC
has received Rs 5344 lakhs and it is reported top in the review period. During this, period, HDMC has
received Rs 3946 lakhs as capital grant due to this, there is a sudden increase in the grants. Apart
from this year, the trends are normal during the review period.
Figure 57: Capital Grants Trends
Road development grants accounts for 37% of total capital grants, followed by the finance
commission grants with 26%, state government grants are accounts for 14% of total capital grants
and rest of the grant sources are accounts for 20% of total grants.
Apart from these, HDMC is receiving the MLA and MP grants to improve the roads, sanitation, and
drainage and storm water service in the city. NKUSIP and KUWSIP grants are aimed for particular
sector and the projects; currently the sewerage related projects are being planned in the city.
2,127 2,573
5,344
2,636 2,033
5% 21%
108%
-51%
-23%
-100%
-50%
0%
50%
100%
150%
0
1,000
2,000
3,000
4,000
5,000
6,000
2007-08 2008-09 2009-10 2010-11 2011-12
Rs i
n l
akh
s
Capital Grants Growth

Ministry of Urban Development
[176]] Draft City Development Plan – Hubli-Dharwad
Figure 58: Capital grants composition
14.5.2 Capital Expenditure
Capital Expenditure (CE) consists of regular capital works as well as capital works funded by specific
grants / scheme e.g. NKUSIP and KUWSIP. As indicated in the figure below, HDMC‘s expenditure on
capital works has increased during the period 2007-08 to 2011-12. Capital expenditure indicates the
uneven trends during the review period since the capital expenditure is mainly on the grants revived
from the various sources.
During the periods 2008-09 and 2009-10, HDMC has incurred huge capital expenditure and
remaining year the capital expenditure is about Rs 3300 lakhs. Since HDMC could not submit the
DPRs under JNNURM/UIDSSMT and hence there was no huge capital works at HDMC.
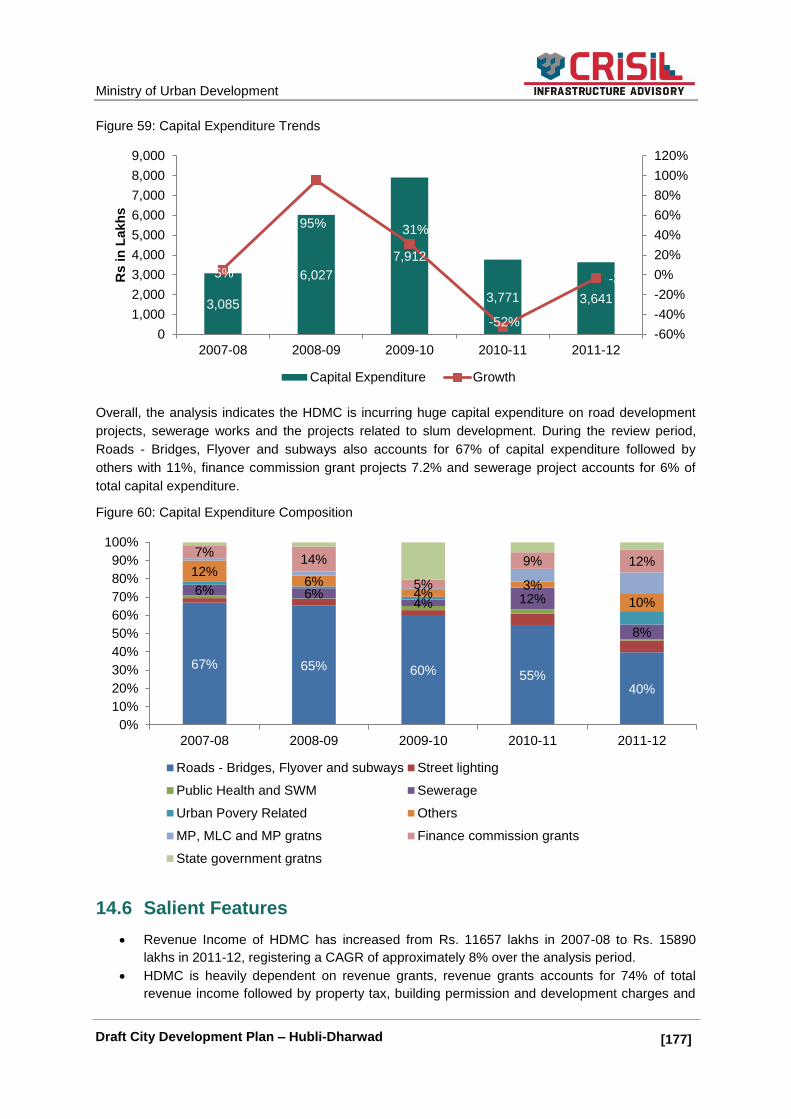
Ministry of Urban Development
[177]] Draft City Development Plan – Hubli-Dharwad
Figure 59: Capital Expenditure Trends
Overall, the analysis indicates the HDMC is incurring huge capital expenditure on road development
projects, sewerage works and the projects related to slum development. During the review period,
Roads - Bridges, Flyover and subways also accounts for 67% of capital expenditure followed by
others with 11%, finance commission grant projects 7.2% and sewerage project accounts for 6% of
total capital expenditure.
Figure 60: Capital Expenditure Composition
14.6 Salient Features
Revenue Income of HDMC has increased from Rs. 11657 lakhs in 2007-08 to Rs. 15890
lakhs in 2011-12, registering a CAGR of approximately 8% over the analysis period.
HDMC is heavily dependent on revenue grants, revenue grants accounts for 74% of total
revenue income followed by property tax, building permission and development charges and
3,085
6,027
7,912
3,771 3,641
5%
95% 31%
-52%
-3%
-60%
-40%
-20%
0%
20%
40%
60%
80%
100%
120%
0
1,000
2,000
3,000
4,000
5,000
6,000
7,000
8,000
9,000
2007-08 2008-09 2009-10 2010-11 2011-12
Rs i
n L
akh
s
Capital Expenditure Growth
67% 65% 60% 55% 40%
6% 6% 4% 12%
8%
12% 6%
4% 3%
10%
7% 14%
5%
9% 12%
0%
10%
20%
30%
40%
50%
60%
70%
80%
90%
100%
2007-08 2008-09 2009-10 2010-11 2011-12
Roads - Bridges, Flyover and subways Street lighting
Public Health and SWM Sewerage
Urban Povery Related Others
MP, MLC and MP gratns Finance commission grants
State government gratns

Ministry of Urban Development
[178]] Draft City Development Plan – Hubli-Dharwad
rent from municipal properties
On an average, property tax accounts for approximately 98% of Tax Revenue followed by
advertisement tax 2% of total tax revenues. Composition of Tax Revenue is presented in the
figure below.
Non-tax revenue has increased from Rs. 1093 lakhs in 2007-08 to Rs. 2125 lakhs in 2011-12,
translating into a CAGR of approximately 18%
the revenue expenditure has been increased from Rs 9097 lakhs in 2007-08 and Rs 12335
lakhs in 2011-12 and registered a CAGR of 8% over the review period
Composition of Revenue expenditure over the recent years has been consistent
HDMC has maintaining the operation ratio less than 1 over the review. On an average, the
operating ratio is 0.83 it indicates the HDMC is able to manage the Revenue Expenditure
capital grants accounts for 96% of total capital income
14.7 Key Issues and Concerns
Lack of technically qualified staff in the accounts department of HDMC, is affecting the
efficiency.
The outcome and performance budgets yet to be prepared for HDMC. Hence, HDMC is
unable to prepare the outcome of each budget head/ outcome of the work such as
improvement of services.
There is delay in the assessment of new properties, revaluation of the existing properties,
Collection of property tax. Further, it is affecting the property tax revenues; eventually it is
hitting the collection efficiency. The arrears collection is also major concern for HDMC.
HDMC follows the centralized property tax system for assessment, billing and collection of
property tax. Hence, there is no system to track the status/performance in each ward/zone for
assessment and collection of property tax. As a result, HDMC has reported poor assessment
and collection efficiency in property tax.
HDMC don‘t have dedicated vigilance team to track and monitor unauthorized constructions,
un-assessed properties, and violations in the buildings. As a result, the number of properties
are out of the property tax net; further it is adversely hitting the substantial revenues from the
property tax
User Charges are not levied on SWM service, due to this, there is no cost recovery of O&M of
SWM service.
HDMC is recovering only 35% of O & M by way of water charges, indicating both low tariff
and poor collection efficiency, thus affecting the O&M of water supply service.

Ministry of Urban Development
[179]] Draft City Development Plan – Hubli-Dharwad
15. SWOT Analysis The transformation of Hubli-Dharwad into an urban centre has been the result of a combination of factors including climate, academic strengths, skill base, and industrialization. The twin cities have some impressive and incontestable advantages, which have propelled the growth of the cities. However, it is imperative to ensure that the infrastructure needs of the city are met, and that the social fabric is coherent on a sustainable basis.
Table 66: Competitive position of the city
Parameter Scale Remarks
Efficiency in Governance
High E – Governance systems – Online tax , Building approval system, Citizen facilitation centers- HD , 24X 7, 24x7 Public Grievance Redressal System
Competitive economic growth
High Primary economic drivers are tertiary-based activities (trade and commerce including agro-based activities, transport and service sector).
Economic/market center for the surrounding villages
Rich mineral deposits like manganese, iron and copper are available.
The city has a diversified industrial base with human resources like laborers, technicians, engineers and managers to support in all categories of work.
Social cohesion & prosperity
Medium Divide between rich and poor is widening.
It is a safe city but percentage and absolute number of urban poor is on the increase.
Sustainable environment
Low Over-extraction of ground water
Ther is contamination of land and water due to untreated UGD and dumping of solid waste
Lakes are disappearing.
Air pollution- vehicular pollution and dust
Efficient Infrastructure
Medium Water is available for 2-3 hours in 2-3 days.
No integrated SWM, sewerage management
New projects from water, swm and ugd are being implemented.
BRT and ToD along Hubli-Dharwad high way
Skilled & motivated workforce
High More than 1/3rd of the people are in the workforce.
Ther is good availability of educational institutes and skilled human resources.
Labour force in secondary sectors – construction workers and factory factors
Slum dwellers - unorganized force
Female work participation rate is very low-15%
Protected Heritage Low There is no major focus on heritage conservation and preservation.
32 sites are listed by ASI in and around the cities.
There are no major initiatives by HDMC.
15.1 SWOT Analysis
Hubli-Dharwad is the second-largest urban settlement in Karnataka next to Bangalore and the commercial hub of the North Karnataka region. However, in spite of the conducive position of the city in the region‘s economy, the city is not getting priority for investment in comparison to Bangalore. The current urbanisation pattern in Karnataka is concentrated primarily in and around Bangalore and this has resulted in an uneven regional growth. In this context, Hubli-Dharwad has the advantage of
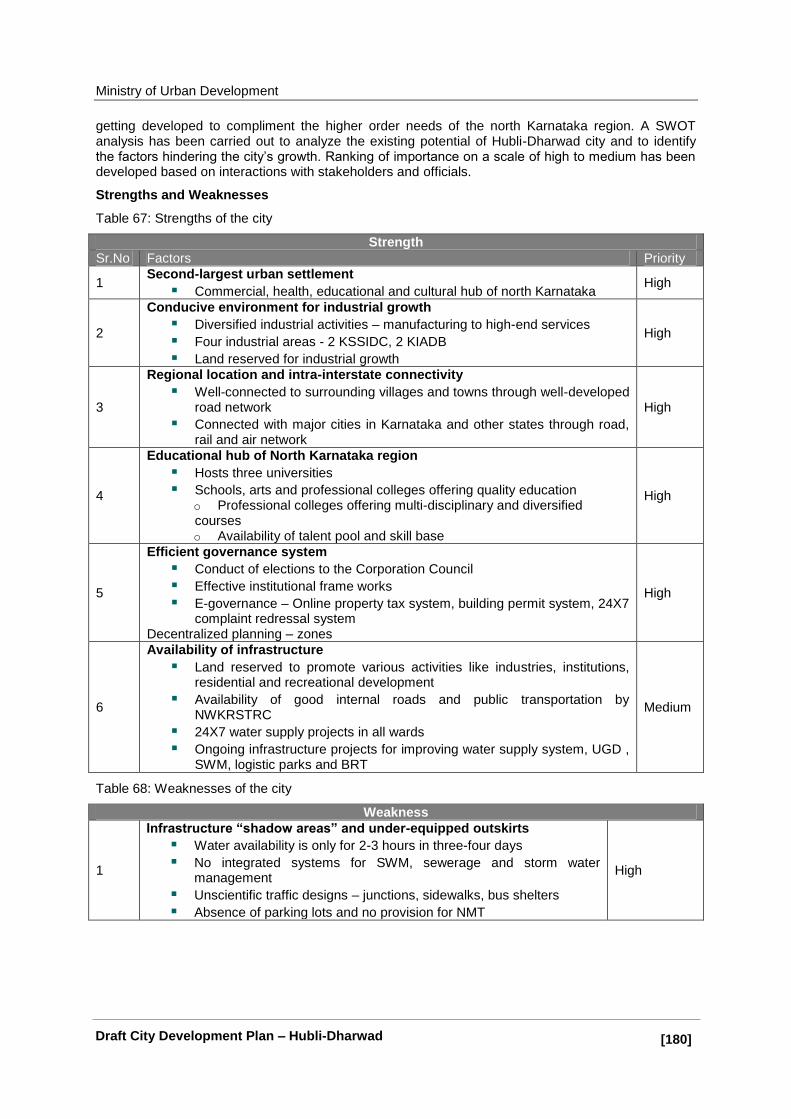
Ministry of Urban Development
[180]] Draft City Development Plan – Hubli-Dharwad
getting developed to compliment the higher order needs of the north Karnataka region. A SWOT analysis has been carried out to analyze the existing potential of Hubli-Dharwad city and to identify the factors hindering the city‘s growth. Ranking of importance on a scale of high to medium has been developed based on interactions with stakeholders and officials.
Strengths and Weaknesses
Table 67: Strengths of the city
Strength
Sr.No Factors Priority
1 Second-largest urban settlement
Commercial, health, educational and cultural hub of north Karnataka High
2
Conducive environment for industrial growth
Diversified industrial activities – manufacturing to high-end services
Four industrial areas - 2 KSSIDC, 2 KIADB
Land reserved for industrial growth
High
3
Regional location and intra-interstate connectivity
Well-connected to surrounding villages and towns through well-developed road network
Connected with major cities in Karnataka and other states through road, rail and air network
High
4
Educational hub of North Karnataka region
Hosts three universities
Schools, arts and professional colleges offering quality education o Professional colleges offering multi-disciplinary and diversified courses
o Availability of talent pool and skill base
High
5
Efficient governance system
Conduct of elections to the Corporation Council
Effective institutional frame works
E-governance – Online property tax system, building permit system, 24X7 complaint redressal system
Decentralized planning – zones
High
6
Availability of infrastructure
Land reserved to promote various activities like industries, institutions, residential and recreational development
Availability of good internal roads and public transportation by NWKRSTRC
24X7 water supply projects in all wards
Ongoing infrastructure projects for improving water supply system, UGD , SWM, logistic parks and BRT
Medium
Table 68: Weaknesses of the city
Weakness
1
Infrastructure “shadow areas” and under-equipped outskirts
Water availability is only for 2-3 hours in three-four days
No integrated systems for SWM, sewerage and storm water management
Unscientific traffic designs – junctions, sidewalks, bus shelters
Absence of parking lots and no provision for NMT
High
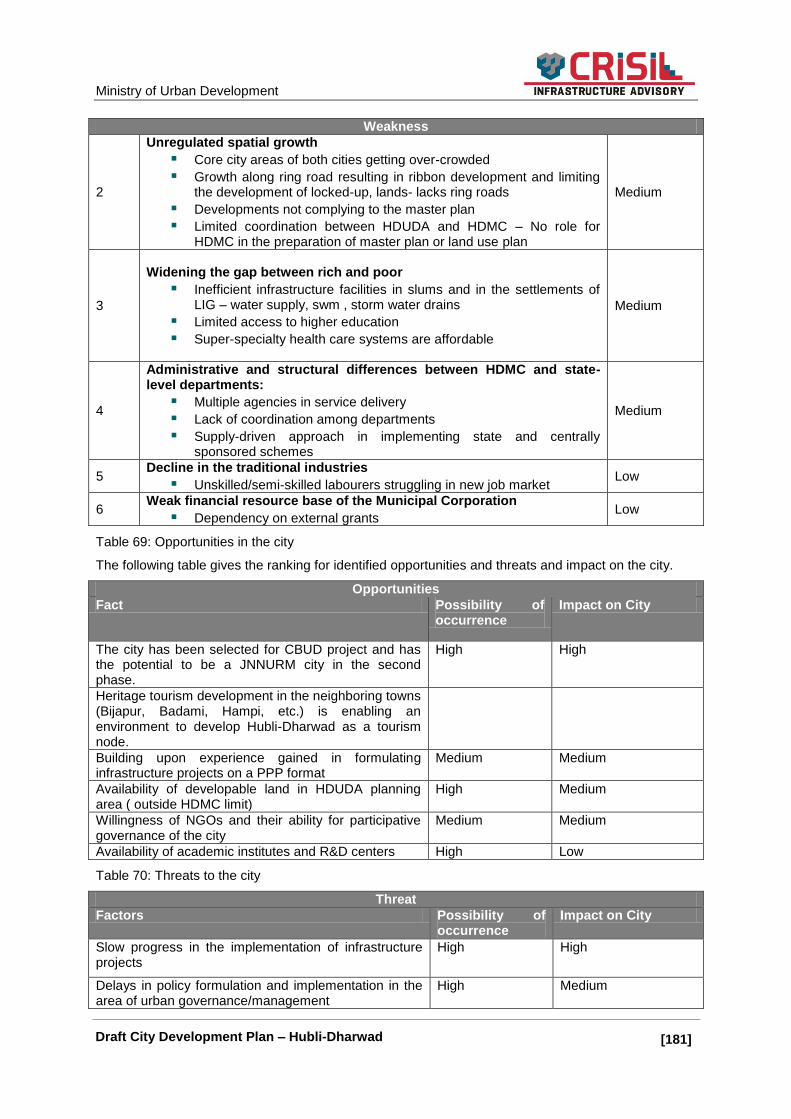
Ministry of Urban Development
[181]] Draft City Development Plan – Hubli-Dharwad
Weakness
2
Unregulated spatial growth
Core city areas of both cities getting over-crowded
Growth along ring road resulting in ribbon development and limiting the development of locked-up, lands- lacks ring roads
Developments not complying to the master plan
Limited coordination between HDUDA and HDMC – No role for HDMC in the preparation of master plan or land use plan
Medium
3
Widening the gap between rich and poor
Inefficient infrastructure facilities in slums and in the settlements of LIG – water supply, swm , storm water drains
Limited access to higher education
Super-specialty health care systems are affordable
Medium
4
Administrative and structural differences between HDMC and state-level departments:
Multiple agencies in service delivery
Lack of coordination among departments
Supply-driven approach in implementing state and centrally sponsored schemes
Medium
5 Decline in the traditional industries
Unskilled/semi-skilled labourers struggling in new job market Low
6 Weak financial resource base of the Municipal Corporation
Dependency on external grants Low
Table 69: Opportunities in the city
The following table gives the ranking for identified opportunities and threats and impact on the city.
Opportunities
Fact Possibility of occurrence
Impact on City
The city has been selected for CBUD project and has the potential to be a JNNURM city in the second phase.
High High
Heritage tourism development in the neighboring towns (Bijapur, Badami, Hampi, etc.) is enabling an environment to develop Hubli-Dharwad as a tourism node.
Building upon experience gained in formulating infrastructure projects on a PPP format
Medium Medium
Availability of developable land in HDUDA planning area ( outside HDMC limit)
High Medium
Willingness of NGOs and their ability for participative governance of the city
Medium Medium
Availability of academic institutes and R&D centers High Low
Table 70: Threats to the city
Threat
Factors Possibility of occurrence
Impact on City
Slow progress in the implementation of infrastructure projects
High High
Delays in policy formulation and implementation in the area of urban governance/management
High Medium

Ministry of Urban Development
[182]] Draft City Development Plan – Hubli-Dharwad
Threat
Factors Possibility of occurrence
Impact on City
Environmental degradation High High
Competition from other cities, especially Bellary, Belgaum, etc.
Medium Medium
Outmigration of skilled human resources High Medium
Based on the review of the current city-level assessment, the growth drivers for Hubli-Dharwad, the competitiveness of Hubli-Dharwad and discussions with various stakeholders at Hubli-Dharwad, the following are strengths, weaknesses, opportunities, and threat (SWOT) for the city‘s future development have been identified.
15.2 City-Level SWOT
Table 71:.SWOT Analysis for Hubli-Dharwad
Strength Weakness
Favorable climatic condition and safe city Regional settings and inter and intra-state
connectivity with attractive tourist spots in surrounding areas
Main commercial and cultural centre of north Karnataka
Educational hub of the north Karnataka region
Availability of talent pool and skill base Diverse and balanced industrial base Four industrial areas - 2 KSSIDC, 2 KIADB
Increasing economic disparity in the society and increasing slum population
Unregulated growth pattern: Land use/ planning issues of clear CBD
Infrastructure ―shadow areas‖ and under-equipped outskirts
Shortage of middle and low-income housing stock
Weak financial resource base of institutions Industrial decline
Opportunities Threat
Eco-friendly high-technology industries and R&D
Availability of land and capacity for planned unlocking of land in the city and its periphery
Utilizing citizens/NGOs‘ willingness and ability for participative governance of the city
Building upon experience gained in formulating infrastructure projects on a PPP format
CBUD project and potential to be a new mission city to be launched by MoUD
Slow implementation of infrastructure projects
Competition from Bellary, Belgaum, etc. Delay in policy formulation and
implementation in the area of urban governance/management
Lack of high-end service sector employment opportunities leading to out-migration of skilled human resources
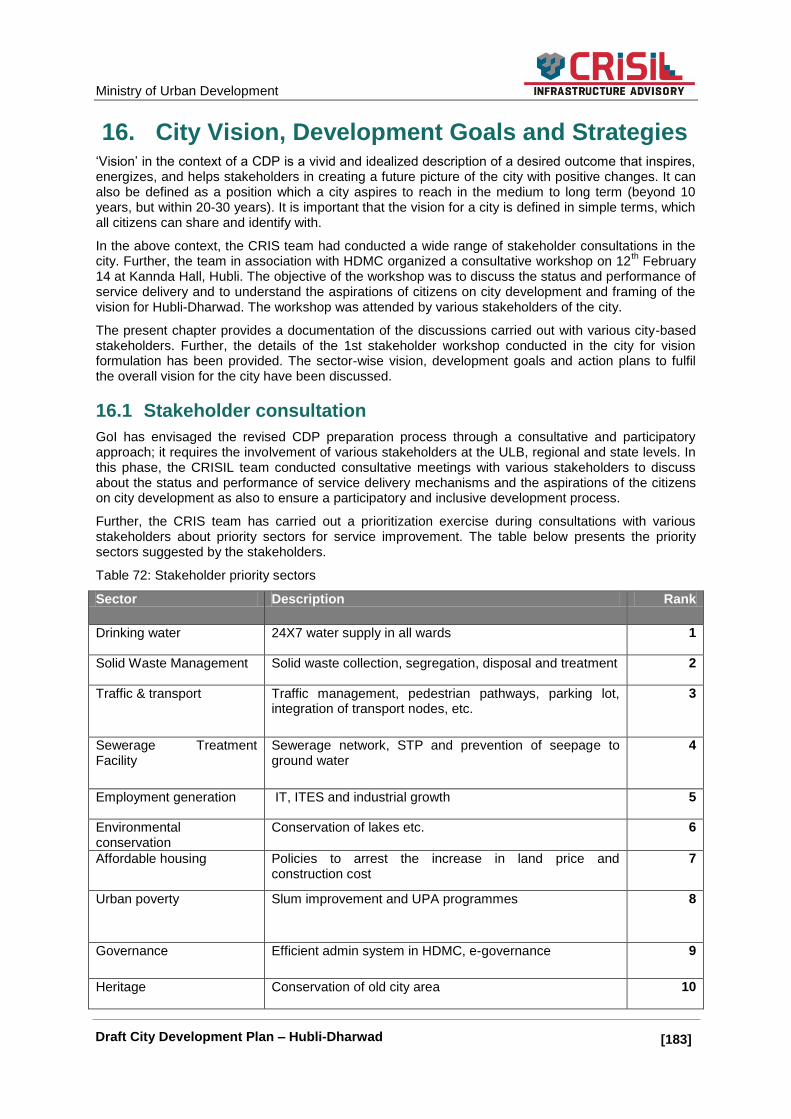
Ministry of Urban Development
[183]] Draft City Development Plan – Hubli-Dharwad
16. City Vision, Development Goals and Strategies ‗Vision‘ in the context of a CDP is a vivid and idealized description of a desired outcome that inspires, energizes, and helps stakeholders in creating a future picture of the city with positive changes. It can also be defined as a position which a city aspires to reach in the medium to long term (beyond 10 years, but within 20-30 years). It is important that the vision for a city is defined in simple terms, which all citizens can share and identify with.
In the above context, the CRIS team had conducted a wide range of stakeholder consultations in the city. Further, the team in association with HDMC organized a consultative workshop on 12
th February
14 at Kannda Hall, Hubli. The objective of the workshop was to discuss the status and performance of service delivery and to understand the aspirations of citizens on city development and framing of the vision for Hubli-Dharwad. The workshop was attended by various stakeholders of the city.
The present chapter provides a documentation of the discussions carried out with various city-based stakeholders. Further, the details of the 1st stakeholder workshop conducted in the city for vision formulation has been provided. The sector-wise vision, development goals and action plans to fulfil the overall vision for the city have been discussed.
16.1 Stakeholder consultation
GoI has envisaged the revised CDP preparation process through a consultative and participatory approach; it requires the involvement of various stakeholders at the ULB, regional and state levels. In this phase, the CRISIL team conducted consultative meetings with various stakeholders to discuss about the status and performance of service delivery mechanisms and the aspirations of the citizens on city development as also to ensure a participatory and inclusive development process.
Further, the CRIS team has carried out a prioritization exercise during consultations with various stakeholders about priority sectors for service improvement. The table below presents the priority sectors suggested by the stakeholders.
Table 72: Stakeholder priority sectors
Sector Description Rank
Drinking water 24X7 water supply in all wards 1
Solid Waste Management Solid waste collection, segregation, disposal and treatment 2
Traffic & transport Traffic management, pedestrian pathways, parking lot, integration of transport nodes, etc.
3
Sewerage Treatment Facility
Sewerage network, STP and prevention of seepage to ground water
4
Employment generation IT, ITES and industrial growth 5
Environmental conservation
Conservation of lakes etc. 6
Affordable housing Policies to arrest the increase in land price and construction cost
7
Urban poverty Slum improvement and UPA programmes 8
Governance Efficient admin system in HDMC, e-governance 9
Heritage Conservation of old city area 10
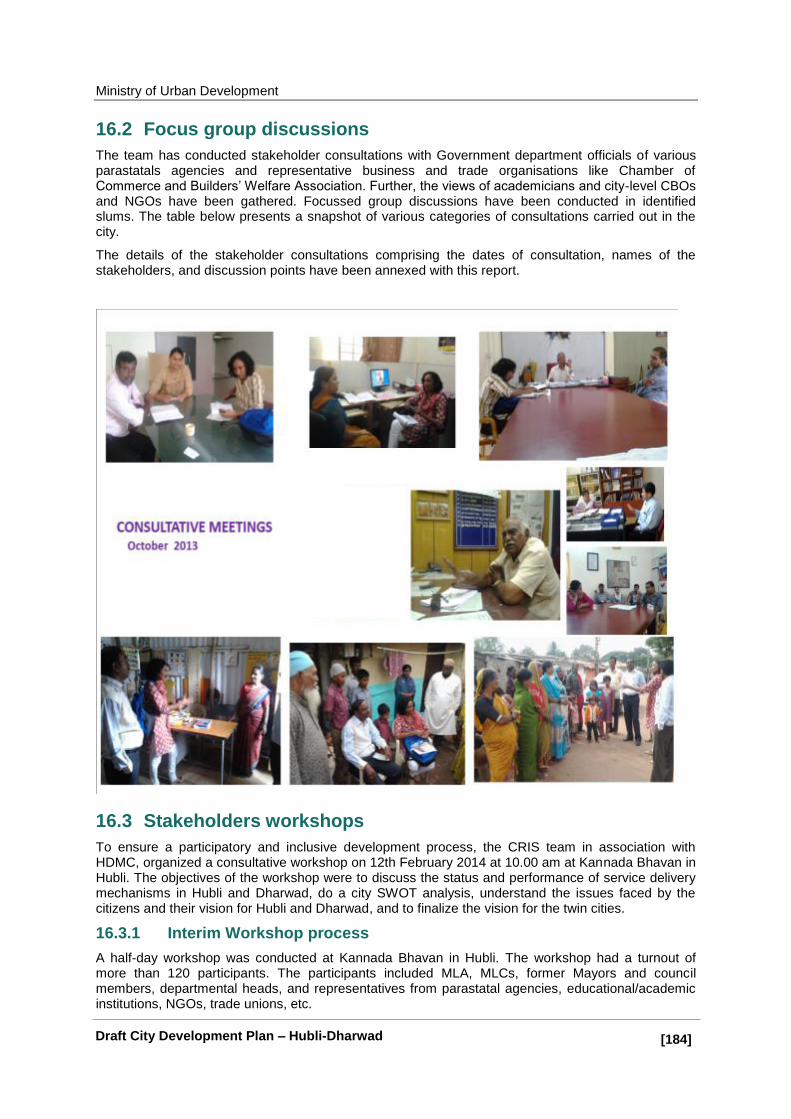
Ministry of Urban Development
[184]] Draft City Development Plan – Hubli-Dharwad
16.2 Focus group discussions
The team has conducted stakeholder consultations with Government department officials of various parastatals agencies and representative business and trade organisations like Chamber of Commerce and Builders‘ Welfare Association. Further, the views of academicians and city-level CBOs and NGOs have been gathered. Focussed group discussions have been conducted in identified slums. The table below presents a snapshot of various categories of consultations carried out in the city.
The details of the stakeholder consultations comprising the dates of consultation, names of the stakeholders, and discussion points have been annexed with this report.
16.3 Stakeholders workshops
To ensure a participatory and inclusive development process, the CRIS team in association with HDMC, organized a consultative workshop on 12th February 2014 at 10.00 am at Kannada Bhavan in Hubli. The objectives of the workshop were to discuss the status and performance of service delivery mechanisms in Hubli and Dharwad, do a city SWOT analysis, understand the issues faced by the citizens and their vision for Hubli and Dharwad, and to finalize the vision for the twin cities.
16.3.1 Interim Workshop process
A half-day workshop was conducted at Kannada Bhavan in Hubli. The workshop had a turnout of more than 120 participants. The participants included MLA, MLCs, former Mayors and council members, departmental heads, and representatives from parastatal agencies, educational/academic institutions, NGOs, trade unions, etc.

Ministry of Urban Development
[185]] Draft City Development Plan – Hubli-Dharwad
The consultative meetings started with a formal inaugural session. HDMC Commissioner Mr. Ramndeep Chowadary IAS welcomed the participants and briefed them on the revised city development plan process, scope of CBUD, and the possible impact on Hubli and Dharwad. The welcome speech was followed by a formal inauguration – lighting of the lamp by MLA and former mayors; later they outlined the city‘s profile and aspirations.
After the inaugural session, the CRIS team presented the outcomes of city-level assessment of various sectors like demography, economy, land use planning, service delivery, urban poverty, heritage and municipal finance. Subsequent to the presentation, the participants were grouped for detailed discussions on each sector.
Formation of Groups
The participants were divided into five different groups namely: Spatial Planning, Heritage & Tourism, Local Economic Development, Urban Infrastructure, Social infrastructure & Urban Poverty Alleviation, and Municipal Finance & Governance. Experts and officials from each sector participated in the group discussions.
Each group deliberated on various challenges, issues, potential and scope for improvement of the respective sectors, and also discussed broad-level strategies to solve the identified issues in the sector. The findings and recommendations of each group were presented to the rest of the participants and their suggestions were recorded also.
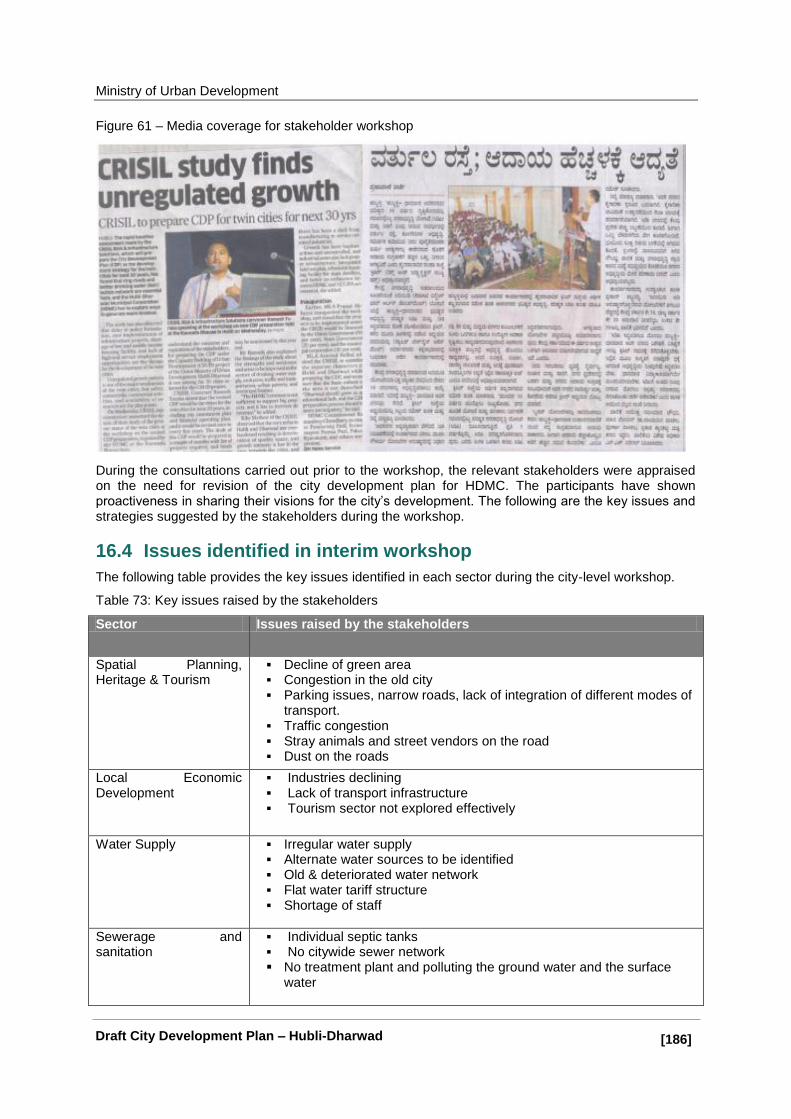
Ministry of Urban Development
[186]] Draft City Development Plan – Hubli-Dharwad
Figure 61 – Media coverage for stakeholder workshop
During the consultations carried out prior to the workshop, the relevant stakeholders were appraised on the need for revision of the city development plan for HDMC. The participants have shown proactiveness in sharing their visions for the city‘s development. The following are the key issues and strategies suggested by the stakeholders during the workshop.
16.4 Issues identified in interim workshop
The following table provides the key issues identified in each sector during the city-level workshop.
Table 73: Key issues raised by the stakeholders
Sector Issues raised by the stakeholders
Spatial Planning, Heritage & Tourism
Decline of green area
Congestion in the old city
Parking issues, narrow roads, lack of integration of different modes of transport.
Traffic congestion
Stray animals and street vendors on the road
Dust on the roads
Local Economic Development
Industries declining
Lack of transport infrastructure Tourism sector not explored effectively
Water Supply Irregular water supply
Alternate water sources to be identified
Old & deteriorated water network
Flat water tariff structure
Shortage of staff
Sewerage and sanitation
Individual septic tanks
No citywide sewer network
No treatment plant and polluting the ground water and the surface water
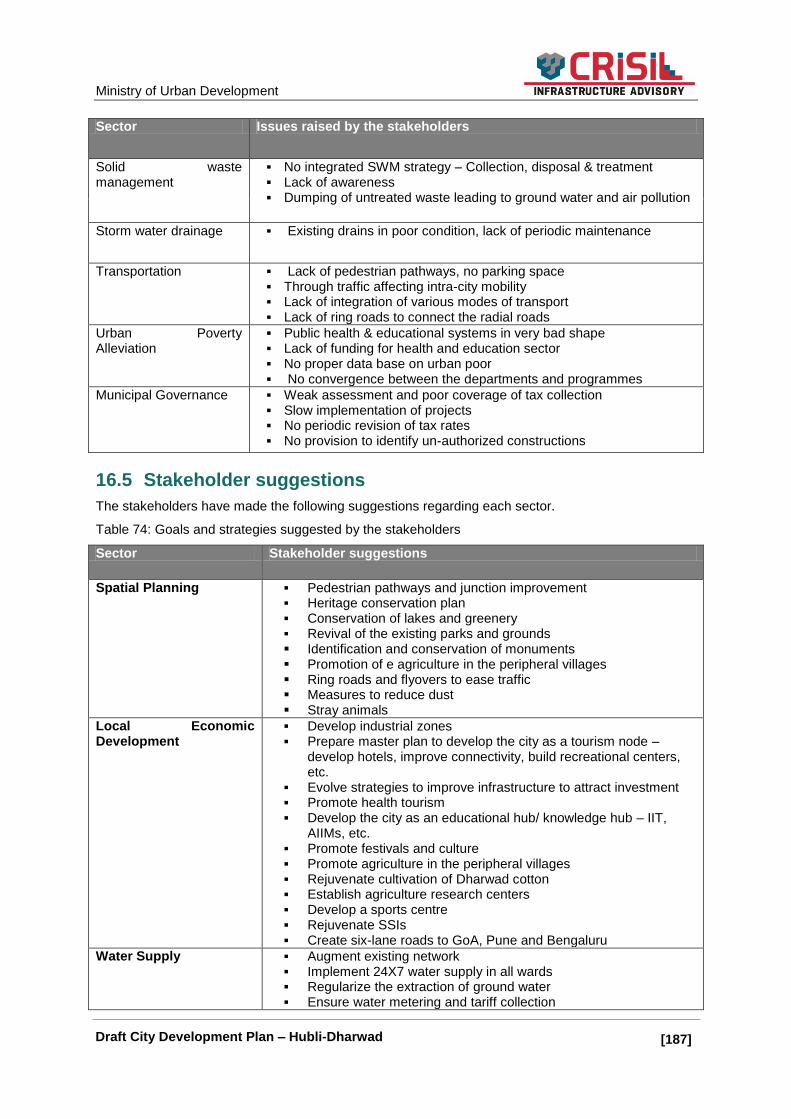
Ministry of Urban Development
[187]] Draft City Development Plan – Hubli-Dharwad
Sector Issues raised by the stakeholders
Solid waste management
No integrated SWM strategy – Collection, disposal & treatment Lack of awareness
Dumping of untreated waste leading to ground water and air pollution
Storm water drainage Existing drains in poor condition, lack of periodic maintenance
Transportation Lack of pedestrian pathways, no parking space
Through traffic affecting intra-city mobility
Lack of integration of various modes of transport Lack of ring roads to connect the radial roads
Urban Poverty Alleviation
Public health & educational systems in very bad shape
Lack of funding for health and education sector No proper data base on urban poor No convergence between the departments and programmes
Municipal Governance Weak assessment and poor coverage of tax collection
Slow implementation of projects No periodic revision of tax rates No provision to identify un-authorized constructions
16.5 Stakeholder suggestions
The stakeholders have made the following suggestions regarding each sector.
Table 74: Goals and strategies suggested by the stakeholders
Sector Stakeholder suggestions
Spatial Planning Pedestrian pathways and junction improvement Heritage conservation plan
Conservation of lakes and greenery
Revival of the existing parks and grounds
Identification and conservation of monuments Promotion of e agriculture in the peripheral villages Ring roads and flyovers to ease traffic Measures to reduce dust Stray animals
Local Economic Development
Develop industrial zones
Prepare master plan to develop the city as a tourism node – develop hotels, improve connectivity, build recreational centers, etc.
Evolve strategies to improve infrastructure to attract investment Promote health tourism
Develop the city as an educational hub/ knowledge hub – IIT, AIIMs, etc.
Promote festivals and culture Promote agriculture in the peripheral villages Rejuvenate cultivation of Dharwad cotton
Establish agriculture research centers
Develop a sports centre
Rejuvenate SSIs
Create six-lane roads to GoA, Pune and Bengaluru
Water Supply Augment existing network Implement 24X7 water supply in all wards
Regularize the extraction of ground water Ensure water metering and tariff collection

Ministry of Urban Development
[188]] Draft City Development Plan – Hubli-Dharwad
Sector Stakeholder suggestions
Sewerage and sanitation Complete all the ongoing activities Connect the whole city area with sewerage network
Discourage use of individual septic tanks
Solid waste management Ensure 100% door-to-door solid waste collection
Ensure segregation of waste at origin
Require treatment plants Decentralize SWM plants
Equipments and vehicles for SWM
Instutute measures to reduce air pollution Use plastic for road construction
Fertilizers from waste
Storm water drainage All the streets and roads should be covered with sewerage network
Transportation Effective traffic management, BRTS
Multistoried parking options
Integration of various modes of transport Truck terminals and logistics hubs
Improve the major junctions
Rehabilitate street vendors
Pedestrian pathways
Social Infrastructure & Urban Poverty Alleviation
Strategies to provide for affordable health services
Improve the public educational infrastructure
Convergence between the departments and programmes
Enure skill up-gradation for livelihood promotion
Encourage group enterprises
Implement programmes under NUHM Improve infrastructure PHCs in every ward
Rehabilitate street vendors
Municipal finance and Governance
Conduct tax revision to increase corporation revenue
Construct more shopping complexes to improve revenue Regularize illegal constructions
Agenda groups to monitor the activities of various departments
Vision statement
Subsequent to the group discussion on issues and strategies, a discussion was carried out on the city‘s vision. The city vision has been framed based on the common consensus that emerged among the stakeholders during the workshop. The vision statement has been framed to balance the competing demands rising from various sectors as well as from different stakeholders in the city.The vision for Hubli-Dharwad city has been framed as such. (Please change this vision statement wherever it appears into the following)
Turn Hubli-Dharwad into a commercial, cultural and educational hub of north Karnataka and create opportunities for growth for all segments of people
16.6 Sub-Visions
The city vision has been built on the three pillars of development which are economic growth, quality of life and environmental sustainability. In order to achieve the overall vision within the horizon period, sub-visions have been developed. The figure below presents the sub-visions to be achieved within 2041, to fulfil the city vision.
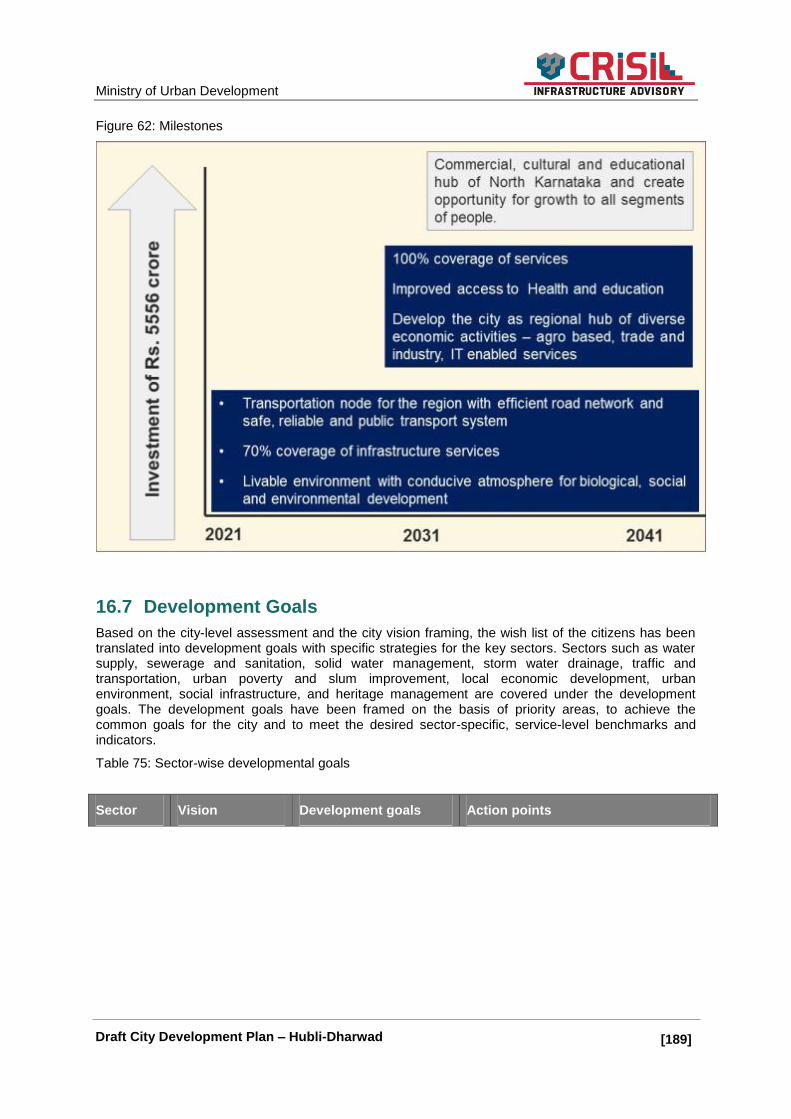
Ministry of Urban Development
[189]] Draft City Development Plan – Hubli-Dharwad
Figure 62: Milestones
16.7 Development Goals
Based on the city-level assessment and the city vision framing, the wish list of the citizens has been translated into development goals with specific strategies for the key sectors. Sectors such as water supply, sewerage and sanitation, solid water management, storm water drainage, traffic and transportation, urban poverty and slum improvement, local economic development, urban environment, social infrastructure, and heritage management are covered under the development goals. The development goals have been framed on the basis of priority areas, to achieve the common goals for the city and to meet the desired sector-specific, service-level benchmarks and indicators.
Table 75: Sector-wise developmental goals
Sector Vision Development goals Action points

Ministry of Urban Development
[190]] Draft City Development Plan – Hubli-Dharwad
Sector Vision Development goals Action points
Local Economic Development
To develop the city as a regional hub of diverse economic activities – agro-based, trade and industry, IT-enabled services, retail trade, tourism, finances, education and health
Promoting economic growth drivers through the cluster-based approach (SEZ model)
Integrated development of infrastructure and land use for economic development
Incentives and business-friendly environment
Livelihood development action plan for the poor
Holding investors‘ conclave
Branding Hubli Dharwad as a tourism, IT and investment destination through media campaign.
There is a need to set up a large-scale economic unit such as an automobile company or IT player to support these units and promote demand.
There is also a need to set up a national- level educational institution such as IIT or IIM to support a number of universities and engineering colleges and to strengthen the role of the education sector in the city.
A cluster-based approach should be adopted by allocating land and infrastructure at appropriate places. Right kind of incentives and support should be provided
The industrial and economic policy should be favourable and needs to be simplified in terms of procedures and time taken for granting approvals and clearances. There is a need to set up single window cell to clear the applications at one point.
A comprehensive scheme should be prepared for the development of new markets.
Social infrastructure
To ensure quality services to the citizens in health and education and ensure recreational facilities such as playgrounds, parks, gardens, and community halls to adequately cater to the citizens‘ needs.
Development of health and education infrastructure to meet the URDPFI guidelines for the horizon year.
Identification of areas for development of new schools and hospitals
Development of night shelters and old age home in the city limits
Provision for marketing facilities in areas with dense population in the north, east and west corners of the city
Establishing a clear system outlining the role of HDMC in education and demarcating responsibilities regarding regulation and monitoring of education and associated facilities with the state education department
Improving quality of education in the municipal schools and transforming the school buildings from dilapidated to well-equipped structures, with proper investment
Renovation and improvement of the children‘s zoo, which is in dilapidated condition
Providing for more town halls, conventional centers and recreational centers

Ministry of Urban Development
[191]] Draft City Development Plan – Hubli-Dharwad
Sector Vision Development goals Action points
Water supply
To provide water supply to all and 24 x 7 water supply with adequate pressure and quality
Provide 24 X 7 water supply
The quality of the water should meet the CPHEEO standards.
Undertake tariff revision and reduction to achieve 100% O&M cost recovery
Minimize the energy consumption during water supply operations
Increasing coverage and access Shifting the priority to distribution
management Source augmentation for water
security
Lowering connection costs and promoting individual taps
Targeting subsidies to the poor (important)
Upgrading and providing a distribution network
Reduction in NRW Installing bulk and consumer
meters Adopting various leak detection
techniques to detect invisible leaks
Kick-starting a communication strategy
Legitimizing illegal connections
Ensuring effective billing and collection, realistic pricing and cost recovery
Improving billing, collection efficiencies
IT enablement Rationalization of tariff structure Targeted subsidies
Conducting energy audit Protecting water bodies including
RWH
Ground water regulation
Sewerage
Hubli-Dharwad city should aim to provide 100% UGD in the long run.
Develop decentralised sewerage collection, treatment, and disposal system within HDMC limits
Ensure 100% treatment of sewerage water and safe discharge into the rivers
Explore the reuse and recycled of wastewater
Preparation of a comprehensive sewerage master plan
Increased coverage and access to sewerage network
Remodelling of old sewers‘ line
Laying of new sewers
Kick-starting communication strategy
Sewage treatment and disposal Construction of sewage treatment
plants (STP) Recycle and reuse of treated waste
water for various purposes Out-sourcing of O&M for UGD Regularization of illegal
connections
Regulation of septic tank usage – important
Cost recovery – user charges

Ministry of Urban Development
[192]] Draft City Development Plan – Hubli-Dharwad
Sector Vision Development goals Action points
Strom water drainage
Providing 100% pucca drainage system to all and upgrading the existing system by 2021
Improve storm water collection efficiency with proper drainage system
Minimize water logging of areas and flooding incidence in the city
Need for a comprehensive drainage master plan
Immediate rehabilitation and strengthening and expanding the network
Map the entire water regime of the city and changes in natural course
Channelize and desilt the major natural drainage course in the city and further provide green belt along the natural courses
Solid waste management
To provide its citizens an environmentally friendly and sustainable waste management system with complete safe disposal facilities
100% door-to-door collection and segregation of waste at source
Maximize recycling and reuse capacity and minimize disposal at landfill
Disposal mechanism should be followed as per the CPHEEO norms
In a phased manner, the door-to-door collection system by mobilizing, facilitating, organizing and supporting community activities and with the help of NGOs.
Installation of community storage bins in areas where house-to-house collection cannot be implemented
Expanding voluntary garbage disposal scheme for more restaurants/hotels and commercial establishments and collection of user charges
Placement of dumper placers in sufficient numbers in markets to ensure that all vendors place the waste in the containers
Identification of a suitable and potential private partner to treat and safely dispose the waste under Public-Private Partnership
Build capacities of health section of HDMC over a period of time to implement complete SWM practices on their own
Enhance capacities of the private partner and HDMC to adhere to Solid Waste (Handling and Management) Rules 2000t.
Undertake awareness campaigns and capacity-building initiatives to elicit the support of stakeholders and communities in achieving complete source segregation and collection of waste
Strengthen the ‗Emergency Response Centre‘ to provide accountable, transparent and responsive solid waste management services
The existing dumping yards are located near human settlements. These may be closed once a proper and scientific landfill facility is developed.
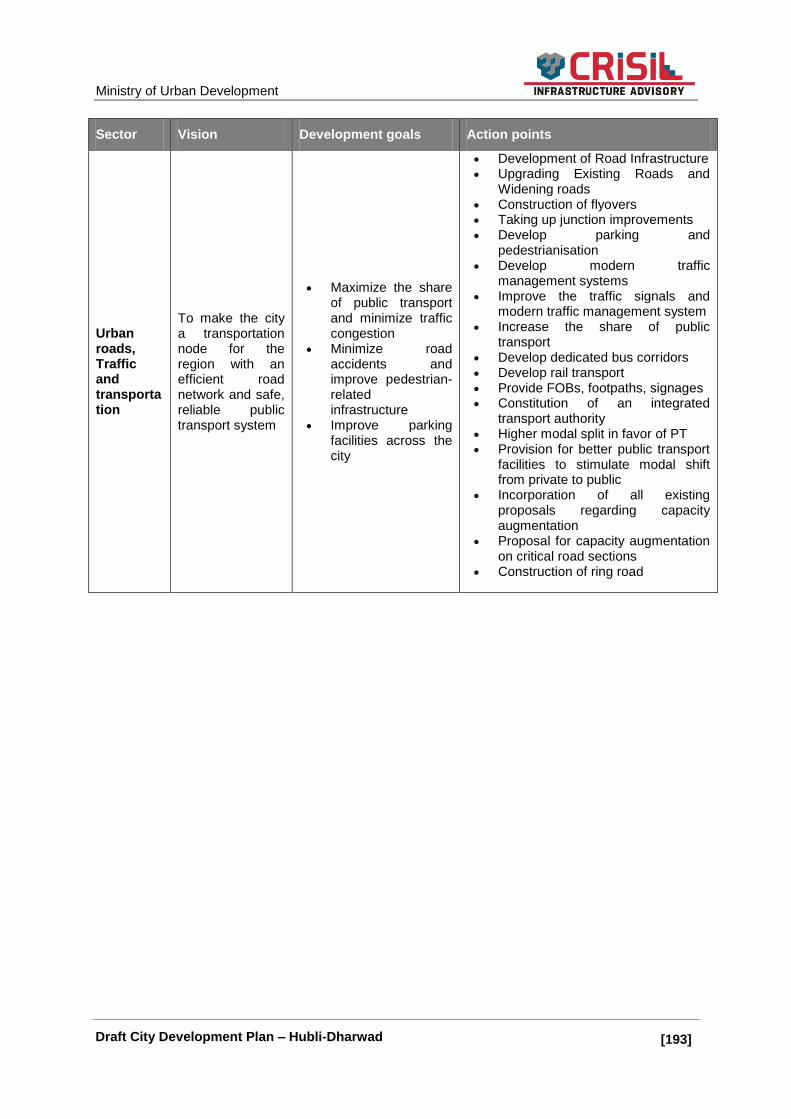
Ministry of Urban Development
[193]] Draft City Development Plan – Hubli-Dharwad
Sector Vision Development goals Action points
Urban roads, Traffic and transportation
To make the city a transportation node for the region with an efficient road network and safe, reliable public transport system
Maximize the share of public transport and minimize traffic congestion
Minimize road accidents and improve pedestrian-related infrastructure
Improve parking facilities across the city
Development of Road Infrastructure Upgrading Existing Roads and
Widening roads
Construction of flyovers
Taking up junction improvements
Develop parking and pedestrianisation
Develop modern traffic management systems
Improve the traffic signals and modern traffic management system
Increase the share of public transport
Develop dedicated bus corridors
Develop rail transport Provide FOBs, footpaths, signages
Constitution of an integrated transport authority
Higher modal split in favor of PT
Provision for better public transport facilities to stimulate modal shift from private to public
Incorporation of all existing proposals regarding capacity augmentation
Proposal for capacity augmentation on critical road sections
Construction of ring road

Ministry of Urban Development
[194]] Draft City Development Plan – Hubli-Dharwad
Sector Vision Development goals Action points
Urban Poverty
To become a slum-free city by 2021
Improve the access to physical and social infrastructure for slum-dwellers
Develop livelihood strategies to improve work force participation
Ensure that every household living in slums has access to basic services
Improve overall health status through preventive and curative community-based methods
Increase the education status by making critical innovative interventions
Enable long-term sustenance of Integrated Slum Development Programmes through community participation in planning, implementation, management and financial contribution
Integrate municipal, state and NGO/private sector initiatives.
Increase and reinforce earning skills of slum residents and design appropriate livelihood options
Increase options and infrastructure for increasing incomes
Enable savings and access to formal credit and reduce dependence on private money lenders
Establish women's self-help groups (SHG) with the help of NGOs, and build their capacity through training and awareness generation. Provide adequate financial assistance for the same.
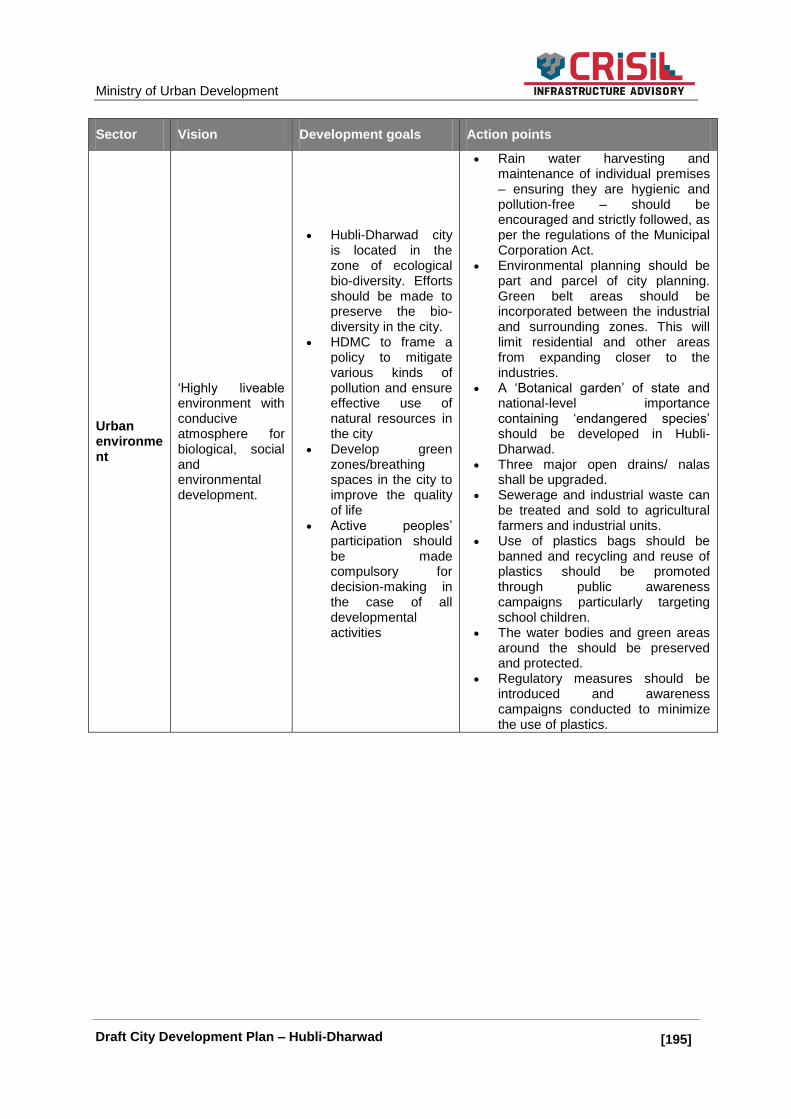
Ministry of Urban Development
[195]] Draft City Development Plan – Hubli-Dharwad
Sector Vision Development goals Action points
Urban environment
‗Highly liveable environment with conducive atmosphere for biological, social and environmental development.
Hubli-Dharwad city is located in the zone of ecological bio-diversity. Efforts should be made to preserve the bio-diversity in the city.
HDMC to frame a policy to mitigate various kinds of pollution and ensure effective use of natural resources in the city
Develop green zones/breathing spaces in the city to improve the quality of life
Active peoples‘ participation should be made compulsory for decision-making in the case of all developmental activities
Rain water harvesting and maintenance of individual premises – ensuring they are hygienic and pollution-free – should be encouraged and strictly followed, as per the regulations of the Municipal Corporation Act.
Environmental planning should be part and parcel of city planning. Green belt areas should be incorporated between the industrial and surrounding zones. This will limit residential and other areas from expanding closer to the industries.
A ‗Botanical garden‘ of state and national-level importance containing ‗endangered species‘ should be developed in Hubli-Dharwad.
Three major open drains/ nalas shall be upgraded.
Sewerage and industrial waste can be treated and sold to agricultural farmers and industrial units.
Use of plastics bags should be banned and recycling and reuse of plastics should be promoted through public awareness campaigns particularly targeting school children.
The water bodies and green areas around the should be preserved and protected.
Regulatory measures should be introduced and awareness campaigns conducted to minimize the use of plastics.
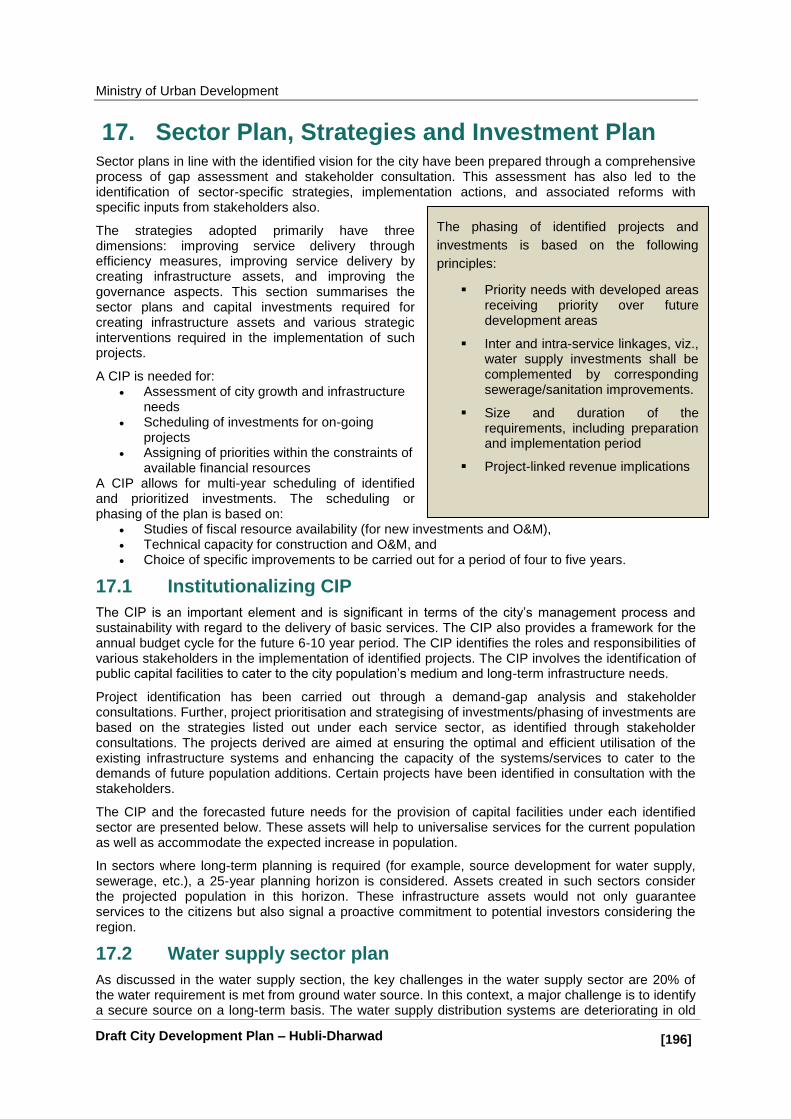
Ministry of Urban Development
[196]] Draft City Development Plan – Hubli-Dharwad
The phasing of identified projects and
investments is based on the following
principles:
Priority needs with developed areas receiving priority over future development areas
Inter and intra-service linkages, viz., water supply investments shall be complemented by corresponding sewerage/sanitation improvements.
Size and duration of the requirements, including preparation and implementation period
Project-linked revenue implications
17. Sector Plan, Strategies and Investment Plan Sector plans in line with the identified vision for the city have been prepared through a comprehensive process of gap assessment and stakeholder consultation. This assessment has also led to the identification of sector-specific strategies, implementation actions, and associated reforms with specific inputs from stakeholders also.
The strategies adopted primarily have three dimensions: improving service delivery through efficiency measures, improving service delivery by creating infrastructure assets, and improving the governance aspects. This section summarises the sector plans and capital investments required for creating infrastructure assets and various strategic interventions required in the implementation of such projects.
A CIP is needed for: Assessment of city growth and infrastructure
needs Scheduling of investments for on-going
projects Assigning of priorities within the constraints of
available financial resources A CIP allows for multi-year scheduling of identified and prioritized investments. The scheduling or phasing of the plan is based on:
Studies of fiscal resource availability (for new investments and O&M), Technical capacity for construction and O&M, and Choice of specific improvements to be carried out for a period of four to five years.
17.1 Institutionalizing CIP
The CIP is an important element and is significant in terms of the city‘s management process and sustainability with regard to the delivery of basic services. The CIP also provides a framework for the annual budget cycle for the future 6-10 year period. The CIP identifies the roles and responsibilities of various stakeholders in the implementation of identified projects. The CIP involves the identification of public capital facilities to cater to the city population‘s medium and long-term infrastructure needs.
Project identification has been carried out through a demand-gap analysis and stakeholder consultations. Further, project prioritisation and strategising of investments/phasing of investments are based on the strategies listed out under each service sector, as identified through stakeholder consultations. The projects derived are aimed at ensuring the optimal and efficient utilisation of the existing infrastructure systems and enhancing the capacity of the systems/services to cater to the demands of future population additions. Certain projects have been identified in consultation with the stakeholders.
The CIP and the forecasted future needs for the provision of capital facilities under each identified sector are presented below. These assets will help to universalise services for the current population as well as accommodate the expected increase in population.
In sectors where long-term planning is required (for example, source development for water supply, sewerage, etc.), a 25-year planning horizon is considered. Assets created in such sectors consider the projected population in this horizon. These infrastructure assets would not only guarantee services to the citizens but also signal a proactive commitment to potential investors considering the region.
17.2 Water supply sector plan
As discussed in the water supply section, the key challenges in the water supply sector are 20% of the water requirement is met from ground water source. In this context, a major challenge is to identify a secure source on a long-term basis. The water supply distribution systems are deteriorating in old

Ministry of Urban Development
[197]] Draft City Development Plan – Hubli-Dharwad
areas of both the cities; the network suffers from leakages, inadequate carrying capacity, low pressure at consumer end, and un-even distribution of water.
To estimate the investment priorities in this sector, a gap analysis has been carried out, to analyse the current deficit in the system and future requirement for the design year 2041. The sector plan for water supply improvement in the city has been presented in the table below.
Table 76: Water supply sector plan
Water Supply Sector
Sector goals
Provide 24 X 7 water supply in both the cities The quality of the water should meet CPHEEO standards. Undertake tariff revision and reduction to achieve 100% O&M cost recovery Minimize the energy consumption during water supply operations
Design parameters
Base year as 2013 and design year as 2041
Demand estimation based on the projected population for HDMC Daily water supply demand (162 LPCD) calculated on the basis of daily per
capita water supply norm (135 LPCD +20% unaccounted-for water) Quality of water as per CPHEEO standards
100% treatment capacity 33% of water supplied as storage capacity Distribution network coverage – 100% of road network
Cost recovery through user charges (100% O&M expenses)
Demand gap assessment
Component 2013 Current
gap
2021 (Short term)
2041 (long term)
Demand Gap Demand Gap
Source (Daily Supply in MLD)
150.00 9.26 187 37 297 147
Distribution network coverage (km)
730.00 84.74 1024 294 1326 596
Elevated Storage capacity (MLD)
19.51 33.58 62 43 99 79
Treatment capacity (% of Water Supply)
111.00 48.26 187 76 297 186
Desired outcomes
2013 2017 2019 2021 Remarks
Network coverage to households
56% 65% 80% 100% -
Per capita supply (LPCD)
153 135 135 135 -
24x7 water supply 111
50% 70% 100% -
Quality of water 100% 100% 100% 100% -
Non-revenue water 50% 30% 30% 20% -
Consumer metering
2% 50% 70% 100% -
Action Plans Activities
Increase the household-level coverage
Increase water supply coverage through individual service connections. Provide water supply to uncovered areas.
Water Supply System Rehabilitation Plan
The old, defunct, and inadequate piping system needs to be replaced by a proper distribution network.
11
24X7 is implemented in one zone (total 8 wards) in Hubli and Dharwad

Ministry of Urban Development
[198]] Draft City Development Plan – Hubli-Dharwad
Water Supply Sector
Comprehensive Water Supply Plan
HDWSSB should implement 24X7 water supply project on priority basis
This focuses on source augmentation, adequate storage, and distribution network and treatment facilities for future requirement.
Operation and Maintenance Plan
This focuses on development of the asset inventory. Organising workshops on water supply and other services to create
awareness among the citizens
Preparation of training calendar to impart training to all the staff members throughout the year on O&M of assets
Imparting training for expenditure control and reduction
Unit Rates
Component Unit Unit Cost (Rs in Lakhs)
Source Development (Daily Supply) MLD 50.00
Distribution Network (% Roads Covered) Kms
25.00
Elevated Storage capacity (% of Water Supply) MLD
140.00
Treatment capacity (% of Water Supply) MLD
50.00
Refurbishment of old Pipelines Km 20.00
Domestic Meters NO 0.02
SCADA system Per zone 25.00
17.2.1 Capital Investment Plan
Based on the above key requirements in the water supply sector, a capital investment plan for a water supply project is presented in the table below. Table 77: Water supply capital investment plan
Project Sub project Estimated cost in Rs. Crores
Remarks
A) Augmentation of Water supply source and construction of raw water mains for the city
1. Augmentation of additional 147 MLD water supply system of Hubli and Dharwad
73
HDWSSB is implementing the 24X7 water supply project under World Bank funding.
B)Treatment capacity and clear water mains
1. Construction of Water Treatment Plants (WTPs) with a capacity of 186 MLD for both the cities for 2041 demand
93
c) Elevated storage capacity
1. Construction of ESRs with a storage capacity of 79 MLD and refurbishment of old ESRs across the city.
111
D) Distribution network
1. Laying of new distribution network of 596 kms
193
2. Replacement of old distribution network (30% of existing network)
E) Metering and leak detection and installation of SCADA system
1) Installation of 0.74 lakh domestic water meters across the city
18
2) Installation of the SCADA system to monitor water supply losses in distribution
Total investment identified 489
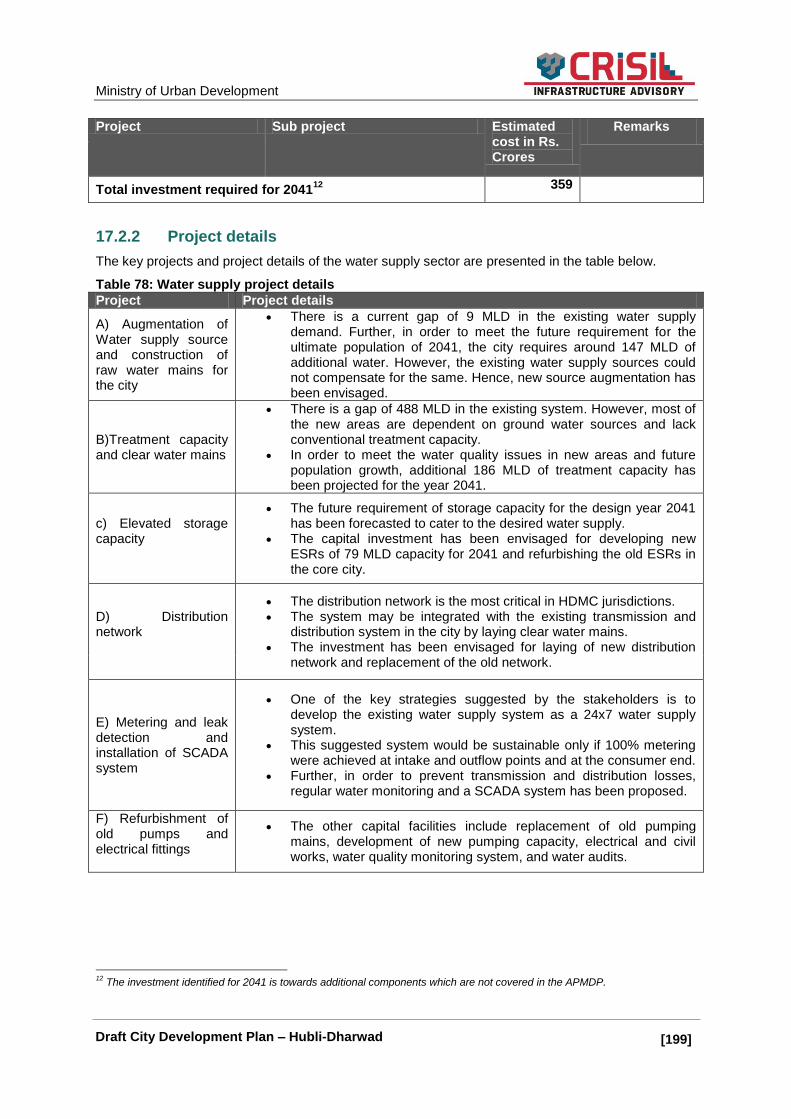
Ministry of Urban Development
[199]] Draft City Development Plan – Hubli-Dharwad
Project Sub project Estimated cost in Rs. Crores
Remarks
Total investment required for 204112
359
17.2.2 Project details
The key projects and project details of the water supply sector are presented in the table below.
Table 78: Water supply project details
Project Project details
A) Augmentation of Water supply source and construction of raw water mains for the city
There is a current gap of 9 MLD in the existing water supply demand. Further, in order to meet the future requirement for the ultimate population of 2041, the city requires around 147 MLD of additional water. However, the existing water supply sources could not compensate for the same. Hence, new source augmentation has been envisaged.
B)Treatment capacity and clear water mains
There is a gap of 488 MLD in the existing system. However, most of the new areas are dependent on ground water sources and lack conventional treatment capacity.
In order to meet the water quality issues in new areas and future population growth, additional 186 MLD of treatment capacity has been projected for the year 2041.
c) Elevated storage capacity
The future requirement of storage capacity for the design year 2041 has been forecasted to cater to the desired water supply.
The capital investment has been envisaged for developing new ESRs of 79 MLD capacity for 2041 and refurbishing the old ESRs in the core city.
D) Distribution network
The distribution network is the most critical in HDMC jurisdictions. The system may be integrated with the existing transmission and
distribution system in the city by laying clear water mains. The investment has been envisaged for laying of new distribution
network and replacement of the old network.
E) Metering and leak detection and installation of SCADA system
One of the key strategies suggested by the stakeholders is to develop the existing water supply system as a 24x7 water supply system.
This suggested system would be sustainable only if 100% metering were achieved at intake and outflow points and at the consumer end.
Further, in order to prevent transmission and distribution losses, regular water monitoring and a SCADA system has been proposed.
F) Refurbishment of old pumps and electrical fittings
The other capital facilities include replacement of old pumping mains, development of new pumping capacity, electrical and civil works, water quality monitoring system, and water audits.
12
The investment identified for 2041 is towards additional components which are not covered in the APMDP.
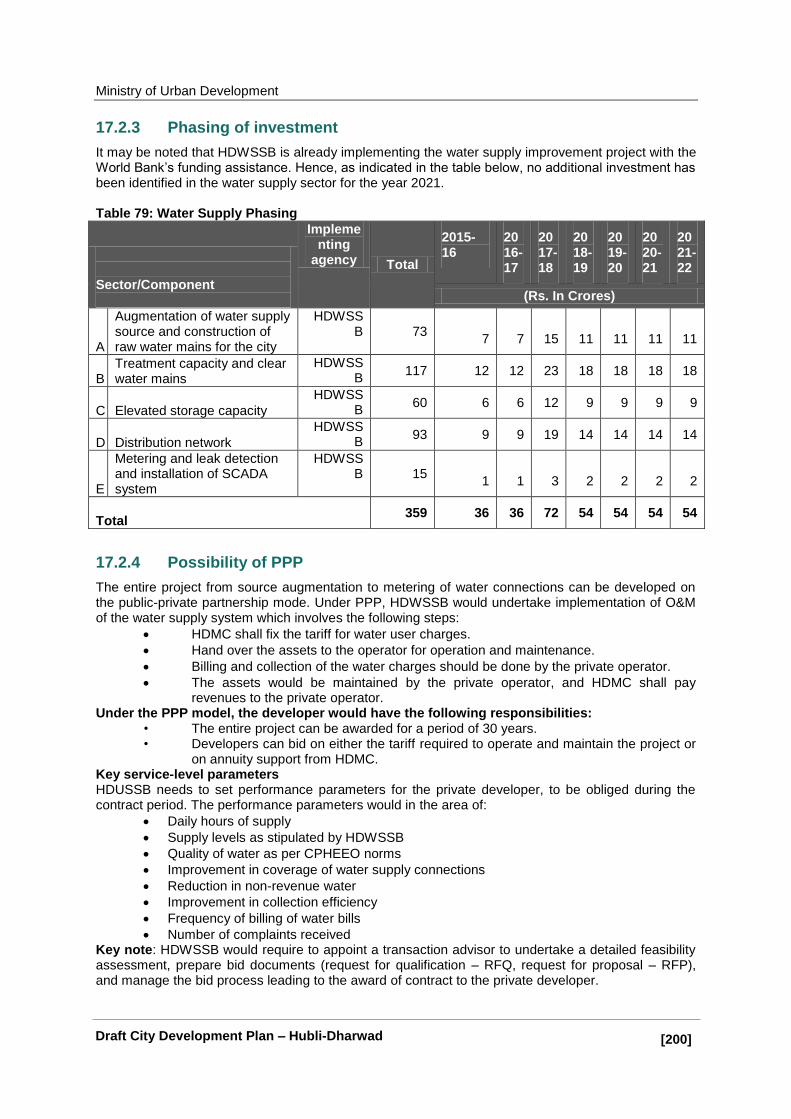
Ministry of Urban Development
[200]] Draft City Development Plan – Hubli-Dharwad
17.2.3 Phasing of investment
It may be noted that HDWSSB is already implementing the water supply improvement project with the World Bank‘s funding assistance. Hence, as indicated in the table below, no additional investment has been identified in the water supply sector for the year 2021. Table 79: Water Supply Phasing
Sector/Component
Implementing
agency Total
2015-16
2016-17
2017-18
2018-19
2019-20
2020-21
2021-22
(Rs. In Crores)
A
Augmentation of water supply source and construction of raw water mains for the city
HDWSSB 73
7 7 15 11 11 11 11
B Treatment capacity and clear water mains
HDWSSB
117 12 12 23 18 18 18 18
C Elevated storage capacity
HDWSSB
60 6 6 12 9 9 9 9
D Distribution network
HDWSSB
93 9 9 19 14 14 14 14
E
Metering and leak detection and installation of SCADA system
HDWSSB 15
1 1 3 2 2 2 2
Total 359 36 36 72 54 54 54 54
17.2.4 Possibility of PPP
The entire project from source augmentation to metering of water connections can be developed on the public-private partnership mode. Under PPP, HDWSSB would undertake implementation of O&M of the water supply system which involves the following steps:
HDMC shall fix the tariff for water user charges.
Hand over the assets to the operator for operation and maintenance.
Billing and collection of the water charges should be done by the private operator.
The assets would be maintained by the private operator, and HDMC shall pay revenues to the private operator.
Under the PPP model, the developer would have the following responsibilities: • The entire project can be awarded for a period of 30 years. • Developers can bid on either the tariff required to operate and maintain the project or
on annuity support from HDMC. Key service-level parameters HDUSSB needs to set performance parameters for the private developer, to be obliged during the contract period. The performance parameters would in the area of:
Daily hours of supply
Supply levels as stipulated by HDWSSB
Quality of water as per CPHEEO norms
Improvement in coverage of water supply connections
Reduction in non-revenue water
Improvement in collection efficiency
Frequency of billing of water bills
Number of complaints received Key note: HDWSSB would require to appoint a transaction advisor to undertake a detailed feasibility assessment, prepare bid documents (request for qualification – RFQ, request for proposal – RFP), and manage the bid process leading to the award of contract to the private developer.

Ministry of Urban Development
[201]] Draft City Development Plan – Hubli-Dharwad
17.3 Sewerage and Sanitation Sector Plan
As mentioned in the sewerage assessment section, about 75% of the area has been covered by the sewerage network within HDMC. However, the sewerage system is quite old. At the same time, there is no sewerage treatment plant in the city.
However, an underground sewerage project worth Rs. 164 crores is being implemented in the city under the NKUSIP project. Under this project, sewer lines of length 96 km approx. are being laid in Hubli and lines of 42.5 km length in Dharwad. STPs are also proposed with capacities of 40 MLD and 20 MLD in Hubli and Dharwad respectively. The STPs shall be commissioned by the end of December 2014.
As per the gap analysis, the city requires 238 MLD capacity of sewerage treatment plan by the end of 2041. Also, for the short term (till 2021), the city requires 150 MLD STPs and 1165 km of branch sewer lines and trunk sewers of 52 kms. The sector plan for sewerage and sanitation system in the city has been presented in the table below.
While estimating the overall investment required for the city in the sewerage sector, the above project components have been taken into account. Accordingly, the investment plan for the sewerage sector has been prepared and the same has been presented in the table below.
Table 80: Sewerage sector plan
Sewerage and Sanitation Sector
Sector goals
Develop decentralised sewerage collection, treatment, and disposal system within HDMC limits
Ensure 100% treatment of sewerage water and safe discharge into the rivers
Explore the reuse and recycling of wastewater Maximize cost recovery and collection efficiency
Design parameters
Base year as 2013 and design year as 2041
Treatment capacity – 80% of water supply Sewerage pumping systems – as per the system design and topography of the
city
Sewer network would cover 75% of the road network in the city Household-level coverage – Sewerage connections as percentage of water
supply connections (80-90%) Public toilets as per requirement in the slums and public areas
Demand gap assessment
Component 2013 Current
gap
2021 (Short term)
2041 (long term)
Demand Gap Demand Gap
UGD network (km) 674 1024 350 1326 652
Sewerage Treatment Plant (MLD)
60 (under NKUSIP Project)
150 90 237 177
Desired outcomes
2013 2017 2019 2021 Remarks
Households covered with UGD
75% 80% 90% 100% -
Treatment capacity 40% 60% 80% 100% -
Reuse and recycling of wastewater
0% 5% 10% 20% -
Cost recovery on sewerage services
0-5% 60% 80% 100% -
Sewerage user charges -collection efficiency
0% 60% 70% 80% -
Action Plans
Activities
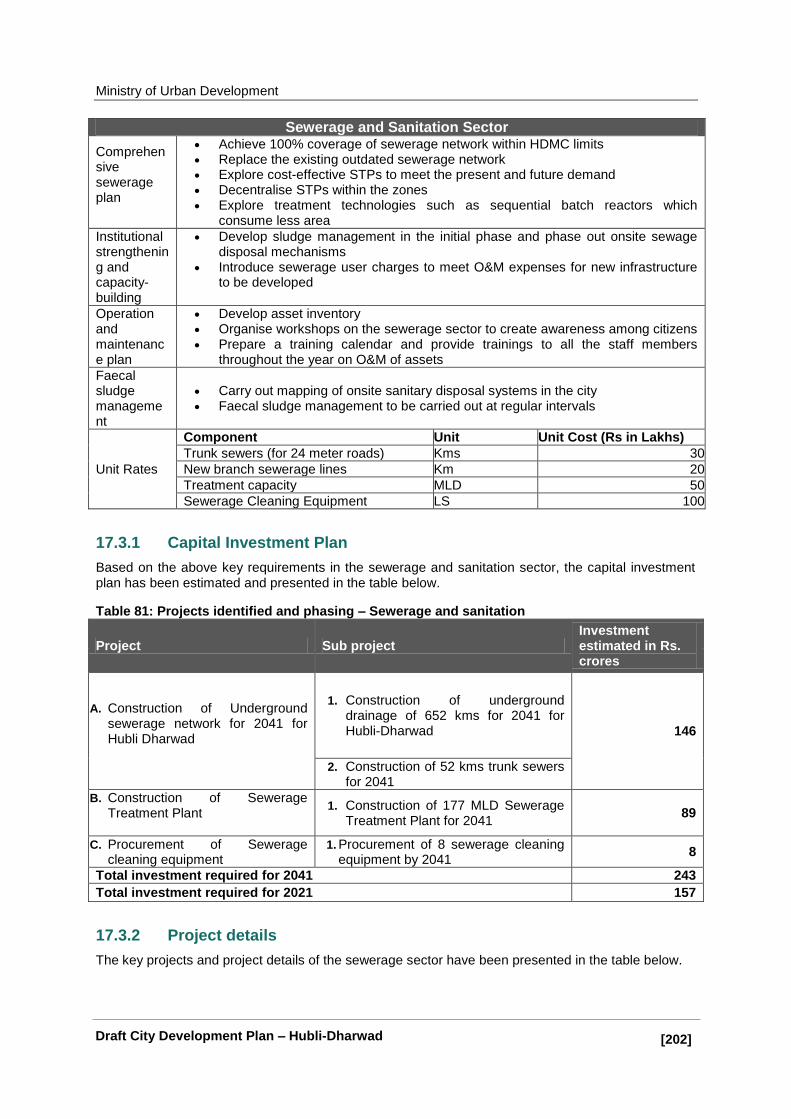
Ministry of Urban Development
[202]] Draft City Development Plan – Hubli-Dharwad
Sewerage and Sanitation Sector
Comprehensive sewerage plan
Achieve 100% coverage of sewerage network within HDMC limits
Replace the existing outdated sewerage network
Explore cost-effective STPs to meet the present and future demand Decentralise STPs within the zones
Explore treatment technologies such as sequential batch reactors which consume less area
Institutional strengthening and capacity-building
Develop sludge management in the initial phase and phase out onsite sewage disposal mechanisms
Introduce sewerage user charges to meet O&M expenses for new infrastructure to be developed
Operation and maintenance plan
Develop asset inventory
Organise workshops on the sewerage sector to create awareness among citizens Prepare a training calendar and provide trainings to all the staff members
throughout the year on O&M of assets
Faecal sludge management
Carry out mapping of onsite sanitary disposal systems in the city Faecal sludge management to be carried out at regular intervals
Unit Rates
Component Unit Unit Cost (Rs in Lakhs)
Trunk sewers (for 24 meter roads) Kms 30
New branch sewerage lines Km 20
Treatment capacity MLD 50
Sewerage Cleaning Equipment LS 100
17.3.1 Capital Investment Plan
Based on the above key requirements in the sewerage and sanitation sector, the capital investment plan has been estimated and presented in the table below.
Table 81: Projects identified and phasing – Sewerage and sanitation
Project Sub project Investment estimated in Rs. crores
A. Construction of Underground sewerage network for 2041 for Hubli Dharwad
1. Construction of underground drainage of 652 kms for 2041 for Hubli-Dharwad 146
2. Construction of 52 kms trunk sewers for 2041
B. Construction of Sewerage Treatment Plant
1. Construction of 177 MLD Sewerage Treatment Plant for 2041
89
C. Procurement of Sewerage cleaning equipment
1. Procurement of 8 sewerage cleaning equipment by 2041
8
Total investment required for 2041 243
Total investment required for 2021 157
17.3.2 Project details
The key projects and project details of the sewerage sector have been presented in the table below.

Ministry of Urban Development
[203]] Draft City Development Plan – Hubli-Dharwad
Table 82: Projects Details – Sewerage and sanitation
Project Details
A. Construction of underground sewerage network for 2041 for Hubli-Dharwad
It has been estimated that a network of 1326 km of branch/house sewers would be required by 2041.
The project also comprises laying of trunk sewers (approximately 52 km).
B. Construction of Sewerage Treatment Plant
It is assumed that the city requires about 237 MLD of STP by the end of 2041.
C. Procurement of sewerage cleaning equipment
Procurement of 8 sewerage cleaning equipment by 2021 and 4 by 2041 to carry out desiltation of drains
17.3.3 Phasing of investment
The phasing of investment has been carried out for a short-term horizon (till 2021). The sewerage project has been divided into various components and timelines have been proposed for implementation purpose. The phasing of investment and implementing agencies for the sewerage and sanitation sector for 2021 have been presented in the table below. Table 83: Project Phasing – Sewerage and sanitation
Sector/Component
Implementing agency
Total 2015-16
2016-17
2017-18
2018-19
2019-20
2020-21
2021-22
(Rs. In Crores)
A
Construction of underground sewerage network for 2041 for Hubli-Dharwad
HDMC
70 7 7 14 10 10 10 10
B Trunk sewer lines
HDMC 16 2 2 3 2 2 2 2
C
Construction of sewerage treatment plants
HDMC 64 6 6 13 10 10 10 10
D
Procurement of sewerage cleaning equipment
HDMC 8 1 1 2 1 1 1 1
Total 157 16 16 31 24 24 24 24
17.3.4 Possibility of PPP
HDMC could undertake construction, operation, and maintenance of STPs under the PPP model:
Invest HDMC‘s financial contribution and take care of any additional cost under the project. The project can be awarded for a period of 30 years.
Under the PPP model, the developer would have the following responsibilities: HDMC shall hand over the land for construction of STPs. O&M of STPs has to be carried out by the private operator as per the contract period. The operator would be responsible for the O&M of STPs and further selling of the treated
sewerage water to potential users. Revenue-sharing between HDMC and the private operator can be explored. HDMC can ask the private developer to consider selling treated water as part of the contract. HDMC needs to set performance parameters for the private developer to be obliged during
the contract period. The annuity payment should be a factor of performance parameters achieved by the
developer
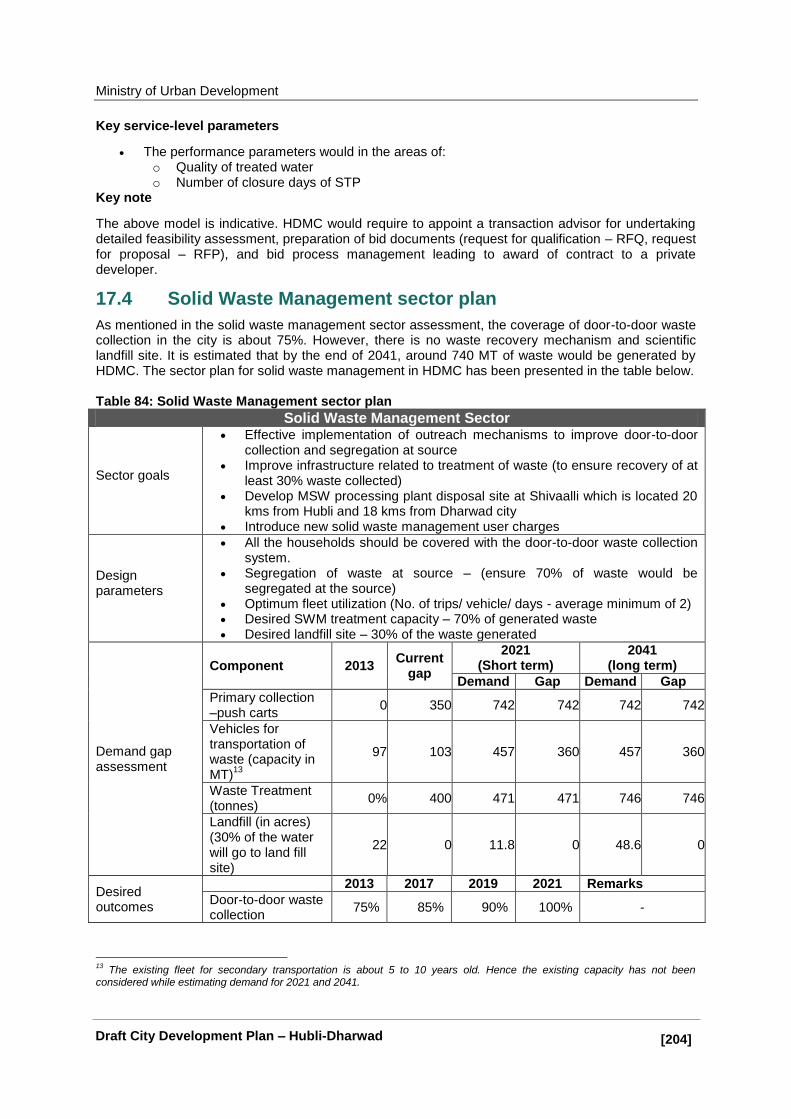
Ministry of Urban Development
[204]] Draft City Development Plan – Hubli-Dharwad
Key service-level parameters
The performance parameters would in the areas of: o Quality of treated water o Number of closure days of STP
Key note
The above model is indicative. HDMC would require to appoint a transaction advisor for undertaking detailed feasibility assessment, preparation of bid documents (request for qualification – RFQ, request for proposal – RFP), and bid process management leading to award of contract to a private developer.
17.4 Solid Waste Management sector plan
As mentioned in the solid waste management sector assessment, the coverage of door-to-door waste collection in the city is about 75%. However, there is no waste recovery mechanism and scientific landfill site. It is estimated that by the end of 2041, around 740 MT of waste would be generated by HDMC. The sector plan for solid waste management in HDMC has been presented in the table below. Table 84: Solid Waste Management sector plan
Solid Waste Management Sector
Sector goals
Effective implementation of outreach mechanisms to improve door-to-door collection and segregation at source
Improve infrastructure related to treatment of waste (to ensure recovery of at least 30% waste collected)
Develop MSW processing plant disposal site at Shivaalli which is located 20 kms from Hubli and 18 kms from Dharwad city
Introduce new solid waste management user charges
Design parameters
All the households should be covered with the door-to-door waste collection system.
Segregation of waste at source – (ensure 70% of waste would be segregated at the source)
Optimum fleet utilization (No. of trips/ vehicle/ days - average minimum of 2) Desired SWM treatment capacity – 70% of generated waste Desired landfill site – 30% of the waste generated
Demand gap assessment
Component 2013 Current
gap
2021 (Short term)
2041 (long term)
Demand Gap Demand Gap
Primary collection –push carts
0 350 742 742 742 742
Vehicles for transportation of waste (capacity in MT)
13
97 103 457 360 457 360
Waste Treatment (tonnes)
0% 400 471 471 746 746
Landfill (in acres) (30% of the water will go to land fill site)
22 0 11.8 0 48.6 0
Desired outcomes
2013 2017 2019 2021 Remarks
Door-to-door waste collection
75% 85% 90% 100% -
13
The existing fleet for secondary transportation is about 5 to 10 years old. Hence the existing capacity has not been considered while estimating demand for 2021 and 2041.
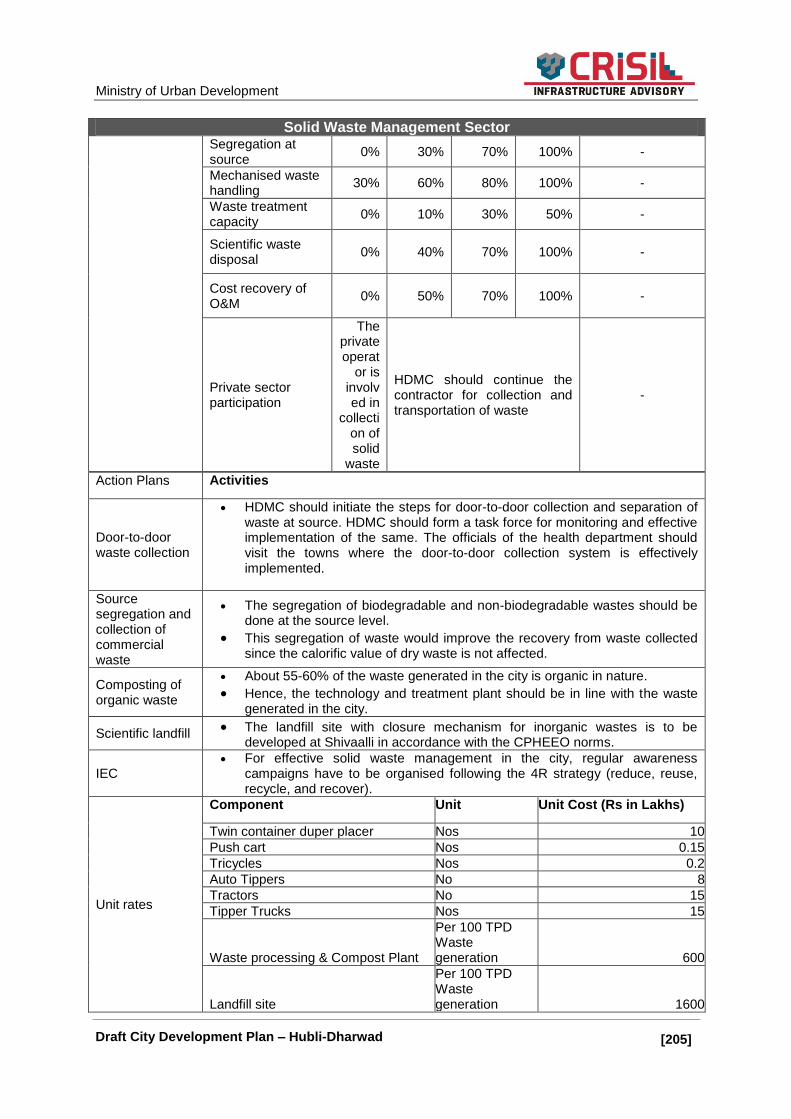
Ministry of Urban Development
[205]] Draft City Development Plan – Hubli-Dharwad
Solid Waste Management Sector
Segregation at source
0% 30% 70% 100% -
Mechanised waste handling
30% 60% 80% 100% -
Waste treatment capacity
0% 10% 30% 50% -
Scientific waste disposal
0% 40% 70% 100% -
Cost recovery of O&M
0% 50% 70% 100% -
Private sector participation
The private operat
or is involved in
collection of solid
waste
HDMC should continue the contractor for collection and transportation of waste
-
Action Plans Activities
Door-to-door waste collection
HDMC should initiate the steps for door-to-door collection and separation of waste at source. HDMC should form a task force for monitoring and effective implementation of the same. The officials of the health department should visit the towns where the door-to-door collection system is effectively implemented.
Source segregation and collection of commercial waste
The segregation of biodegradable and non-biodegradable wastes should be done at the source level.
This segregation of waste would improve the recovery from waste collected since the calorific value of dry waste is not affected.
Composting of organic waste
About 55-60% of the waste generated in the city is organic in nature.
Hence, the technology and treatment plant should be in line with the waste generated in the city.
Scientific landfill The landfill site with closure mechanism for inorganic wastes is to be
developed at Shivaalli in accordance with the CPHEEO norms.
IEC
For effective solid waste management in the city, regular awareness campaigns have to be organised following the 4R strategy (reduce, reuse, recycle, and recover).
Unit rates
Component Unit Unit Cost (Rs in Lakhs)
Twin container duper placer Nos 10
Push cart Nos 0.15
Tricycles Nos 0.2
Auto Tippers No 8
Tractors No 15
Tipper Trucks Nos 15
Waste processing & Compost Plant
Per 100 TPD Waste generation 600
Landfill site
Per 100 TPD Waste generation 1600
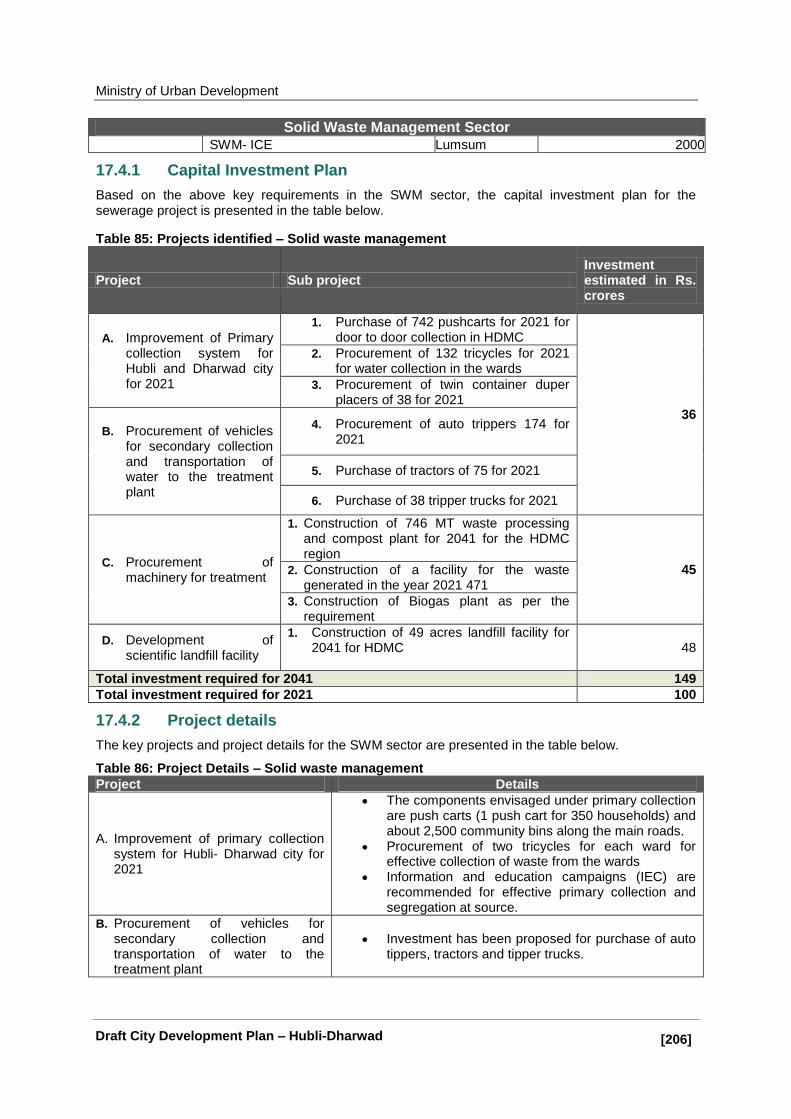
Ministry of Urban Development
[206]] Draft City Development Plan – Hubli-Dharwad
Solid Waste Management Sector
SWM- ICE Lumsum 2000
17.4.1 Capital Investment Plan
Based on the above key requirements in the SWM sector, the capital investment plan for the sewerage project is presented in the table below.
Table 85: Projects identified – Solid waste management
Project Sub project Investment estimated in Rs. crores
A. Improvement of Primary collection system for Hubli and Dharwad city for 2021
1. Purchase of 742 pushcarts for 2021 for door to door collection in HDMC
36
2. Procurement of 132 tricycles for 2021 for water collection in the wards
3. Procurement of twin container duper placers of 38 for 2021
B. Procurement of vehicles for secondary collection and transportation of water to the treatment plant
4. Procurement of auto trippers 174 for 2021
5. Purchase of tractors of 75 for 2021
6. Purchase of 38 tripper trucks for 2021
C. Procurement of machinery for treatment
1. Construction of 746 MT waste processing and compost plant for 2041 for the HDMC region
45 2. Construction of a facility for the waste generated in the year 2021 471
3. Construction of Biogas plant as per the requirement
D. Development of scientific landfill facility
1. Construction of 49 acres landfill facility for 2041 for HDMC
48
Total investment required for 2041 149
Total investment required for 2021 100
17.4.2 Project details
The key projects and project details for the SWM sector are presented in the table below.
Table 86: Project Details – Solid waste management
Project Details
A. Improvement of primary collection system for Hubli- Dharwad city for 2021
The components envisaged under primary collection are push carts (1 push cart for 350 households) and about 2,500 community bins along the main roads.
Procurement of two tricycles for each ward for effective collection of waste from the wards
Information and education campaigns (IEC) are recommended for effective primary collection and segregation at source.
B. Procurement of vehicles for secondary collection and transportation of water to the treatment plant
Investment has been proposed for purchase of auto tippers, tractors and tipper trucks.

Ministry of Urban Development
[207]] Draft City Development Plan – Hubli-Dharwad
Project Details
C. Procurement of machinery for treatment
Investment envisaged towards development of compost plant-cum-waste processing plant, RDF plant and bio-gas plant
D. Development of scientific landfill facility
It is assumed that on development of treatment facility, about 30% of the waste would be sent for landfilling.
Accordingly, the investment has been envisaged for the development of a landfill site of 49 acres with the required infrastructure.
17.4.3 Phasing of investment
The SWM project components have been divided into various components for implementation purpose. Further, the timeliness and implementing agency have been proposed for each component, and the same have been presented in the table below.
Table 87: Phasing of investment – Solid waste management
Sector/Component
Implementing agency
Total 2015-16 2016-17 2017
-18 2018-19
2019-20
(Rs. In Crores)
A
Improvement of primary collection system for Hubli-Dharwad city for 2021 HDMC
36 4 7 7 9 9 B
Procurement of vehicles for secondary collection and transportation of water to the treatment plant
HDMC/PPP operator
C
Procurement of machinery for treatment HDMC
28 3 6 6 7 7
D
Development of scientific landfill facility
HDMC 26 3 5 5 6 6
E SWM- iCE
HDMC 10 1 2 2 3 3
Total 100 10 20 20 25 25
17.4.4 Possible PPP interventions
PPPs in SWM are in accordance with the nature of work, viz., Collection and transportation of waste Landfilling Composting
Landfilling – This can be developed on BOT basis. HDMC would provide the land to the developer, and the developer shall be responsible for the construction and O&M of the facility. The private developer can bid on annuity support required to construct and operate and maintain the project.
Composting – HDMC may create a market by floating tenders whereby the developer can be asked to set up a composting facility, and the maximum contribution from the revenues bid by the developer shall be the winning bid.
HDMC would require to appoint a transaction advisor to undertake detailed feasibility and preparation of bid documents (request for qualification – RFQ, request for proposal – RFP) and bid process management leading to award of contract to a private developer.
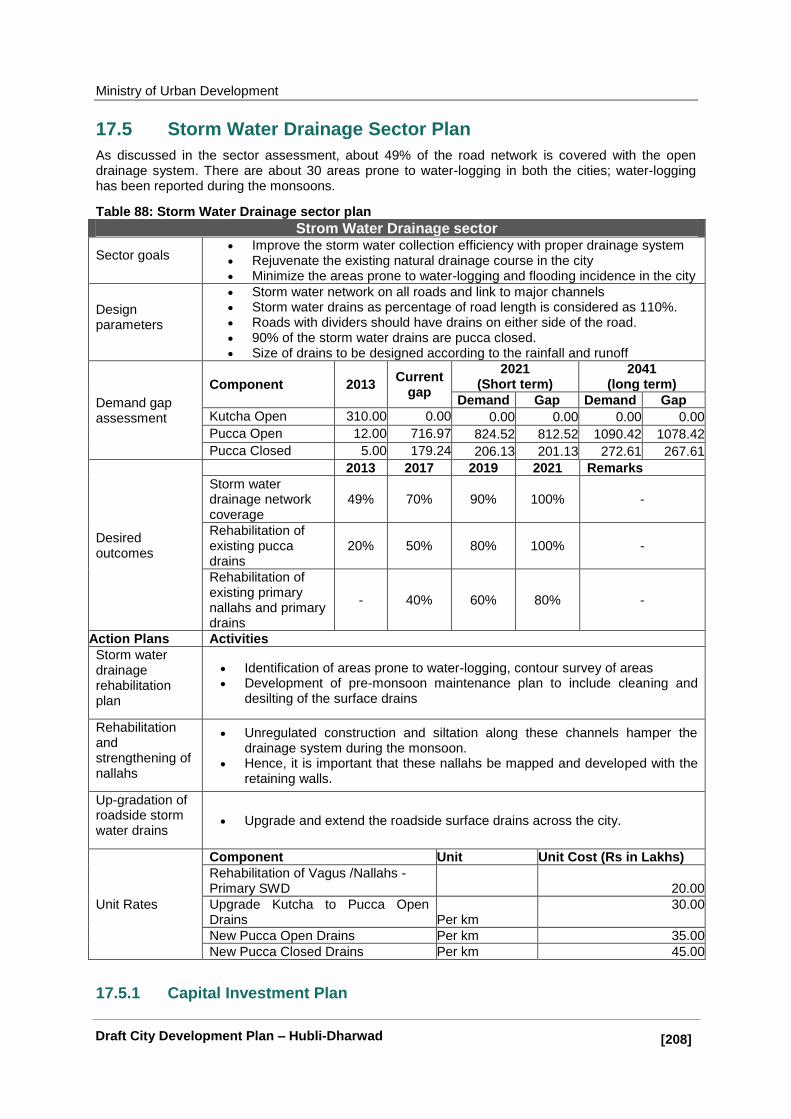
Ministry of Urban Development
[208]] Draft City Development Plan – Hubli-Dharwad
17.5 Storm Water Drainage Sector Plan
As discussed in the sector assessment, about 49% of the road network is covered with the open drainage system. There are about 30 areas prone to water-logging in both the cities; water-logging has been reported during the monsoons.
Table 88: Storm Water Drainage sector plan
Strom Water Drainage sector
Sector goals Improve the storm water collection efficiency with proper drainage system Rejuvenate the existing natural drainage course in the city
Minimize the areas prone to water-logging and flooding incidence in the city
Design parameters
Storm water network on all roads and link to major channels
Storm water drains as percentage of road length is considered as 110%. Roads with dividers should have drains on either side of the road. 90% of the storm water drains are pucca closed. Size of drains to be designed according to the rainfall and runoff
Demand gap assessment
Component 2013 Current
gap
2021 (Short term)
2041 (long term)
Demand Gap Demand Gap
Kutcha Open 310.00 0.00 0.00 0.00 0.00 0.00
Pucca Open 12.00 716.97 824.52 812.52 1090.42 1078.42
Pucca Closed 5.00 179.24 206.13 201.13 272.61 267.61
Desired outcomes
2013 2017 2019 2021 Remarks
Storm water drainage network coverage
49% 70% 90% 100% -
Rehabilitation of existing pucca drains
20% 50% 80% 100% -
Rehabilitation of existing primary nallahs and primary drains
- 40% 60% 80% -
Action Plans Activities
Storm water drainage rehabilitation plan
Identification of areas prone to water-logging, contour survey of areas Development of pre-monsoon maintenance plan to include cleaning and
desilting of the surface drains
Rehabilitation and strengthening of nallahs
Unregulated construction and siltation along these channels hamper the drainage system during the monsoon.
Hence, it is important that these nallahs be mapped and developed with the retaining walls.
Up-gradation of roadside storm water drains
Upgrade and extend the roadside surface drains across the city.
Unit Rates
Component Unit Unit Cost (Rs in Lakhs)
Rehabilitation of Vagus /Nallahs - Primary SWD 20.00
Upgrade Kutcha to Pucca Open Drains Per km
30.00
New Pucca Open Drains Per km 35.00
New Pucca Closed Drains Per km 45.00
17.5.1 Capital Investment Plan

Ministry of Urban Development
[209]] Draft City Development Plan – Hubli-Dharwad
Based on the above key requirements in the storm water drainage sector, the capital investment plan‘s sewerage project is presented in the table below.
Table 89: Projects identified – Storm water drainage
Project Sub Project Estimated cost in Rs. Crores
A. Upgrade Kutcha to Pucca Open Drains
1. Upgrade about 310 kms of Kutcha storm water network into pucca drains
93
B. New Pucca Open Drains
2. Construction of 768 kms of new Pucca open drains by 2041 for both the cities
269
C. New Pucca Closed Drains
3. Construction of 268 kms of new Pucca closed drains by 2041 for both the cities
120
D. Rehabilitation of four Major Nallahs in the city
4. Construction of retaining walls along the major nallahs
8
Total investment required for 2041 490
Total investment required for 2021 378
17.5.2 Project details
The key projects and project details of storm water drainage are presented in the table below.
Table 90: Projects Details – Storm water drainage
Projects Project Details
A. Upgrade Kutcha to Pucca Open Drains
Upgrade about 310 kms of Kutcha storm water network into pucca drains
B. New Pucca Open Drains
Construction of 768 kms of new Pucca open drains by 2041 for both the cities
C. New Pucca Closed Drains
Construction of 268 kms of new Pucca closed drains by 2041 for both the cities
D. Rehabilitation of four Major Nallahs in the city
Construction of retaining walls along the major nallahs
17.5.3 Phasing of investment
The storm water drainage project has been divided into various components for implementation purpose. Further, the timeliness and implementing agency have been proposed for each component, and the same have been presented in the table below.
Table 91: Phasing of Investment – Storm water drainage
Sector/Component
Implementing agency
Total
2015-16
2016-17
2017-18
2018-19
2019-20
2020-21
2021-22
(Rs. In Crores)
A
Upgrade Kutcha to Pucca Open Drains
HDMC 28 3 3 6 4 4 4 4
B Upgrade Kutcha to Pucca Open Drains
HDMC
251 25 25 50 38 38 38 38
c
New Pucca Closed Drains
HDMC 91 9 9 18 14 14 14 14
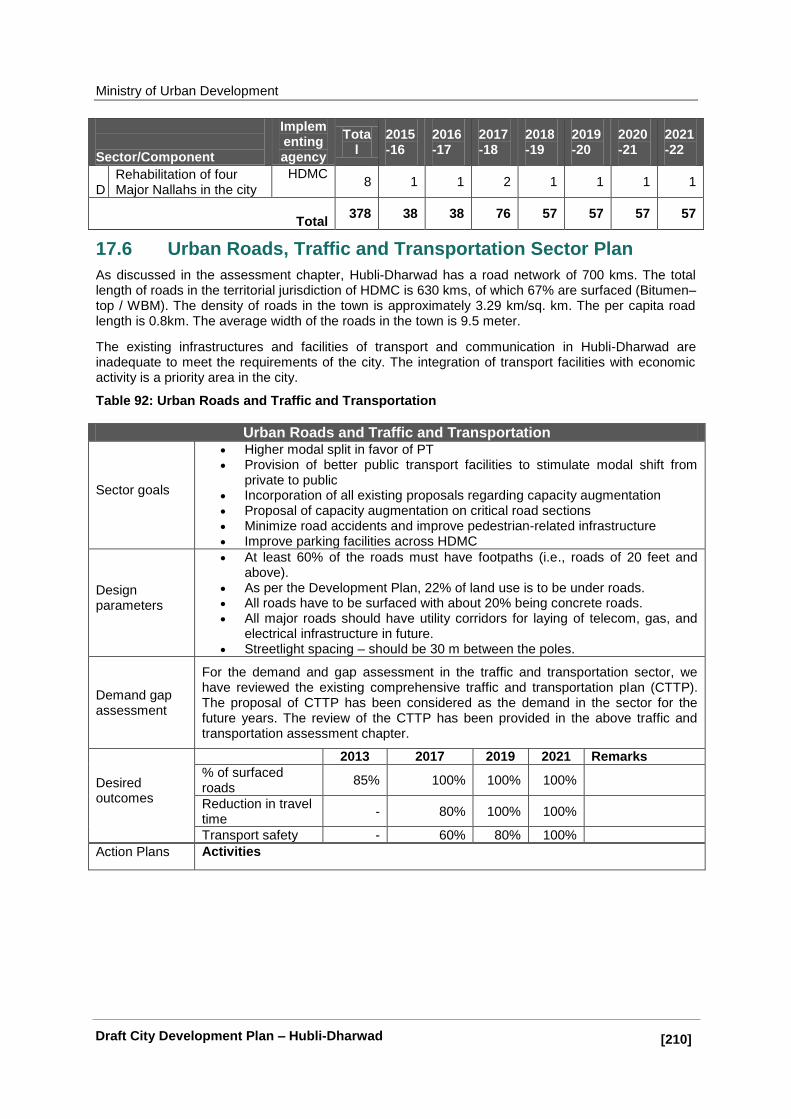
Ministry of Urban Development
[210]] Draft City Development Plan – Hubli-Dharwad
Sector/Component
Implementing agency
Total
2015-16
2016-17
2017-18
2018-19
2019-20
2020-21
2021-22
D
Rehabilitation of four Major Nallahs in the city
HDMC 8 1 1 2 1 1 1 1
Total 378 38 38 76 57 57 57 57
17.6 Urban Roads, Traffic and Transportation Sector Plan
As discussed in the assessment chapter, Hubli-Dharwad has a road network of 700 kms. The total length of roads in the territorial jurisdiction of HDMC is 630 kms, of which 67% are surfaced (Bitumen–top / WBM). The density of roads in the town is approximately 3.29 km/sq. km. The per capita road length is 0.8km. The average width of the roads in the town is 9.5 meter.
The existing infrastructures and facilities of transport and communication in Hubli-Dharwad are inadequate to meet the requirements of the city. The integration of transport facilities with economic activity is a priority area in the city.
Table 92: Urban Roads and Traffic and Transportation
Urban Roads and Traffic and Transportation
Sector goals
Higher modal split in favor of PT
Provision of better public transport facilities to stimulate modal shift from private to public
Incorporation of all existing proposals regarding capacity augmentation
Proposal of capacity augmentation on critical road sections
Minimize road accidents and improve pedestrian-related infrastructure Improve parking facilities across HDMC
Design parameters
At least 60% of the roads must have footpaths (i.e., roads of 20 feet and above).
As per the Development Plan, 22% of land use is to be under roads. All roads have to be surfaced with about 20% being concrete roads. All major roads should have utility corridors for laying of telecom, gas, and
electrical infrastructure in future. Streetlight spacing – should be 30 m between the poles.
Demand gap assessment
For the demand and gap assessment in the traffic and transportation sector, we have reviewed the existing comprehensive traffic and transportation plan (CTTP). The proposal of CTTP has been considered as the demand in the sector for the future years. The review of the CTTP has been provided in the above traffic and transportation assessment chapter.
Desired outcomes
2013 2017 2019 2021 Remarks
% of surfaced roads
85% 100% 100% 100%
Reduction in travel time
- 80% 100% 100%
Transport safety - 60% 80% 100%
Action Plans Activities
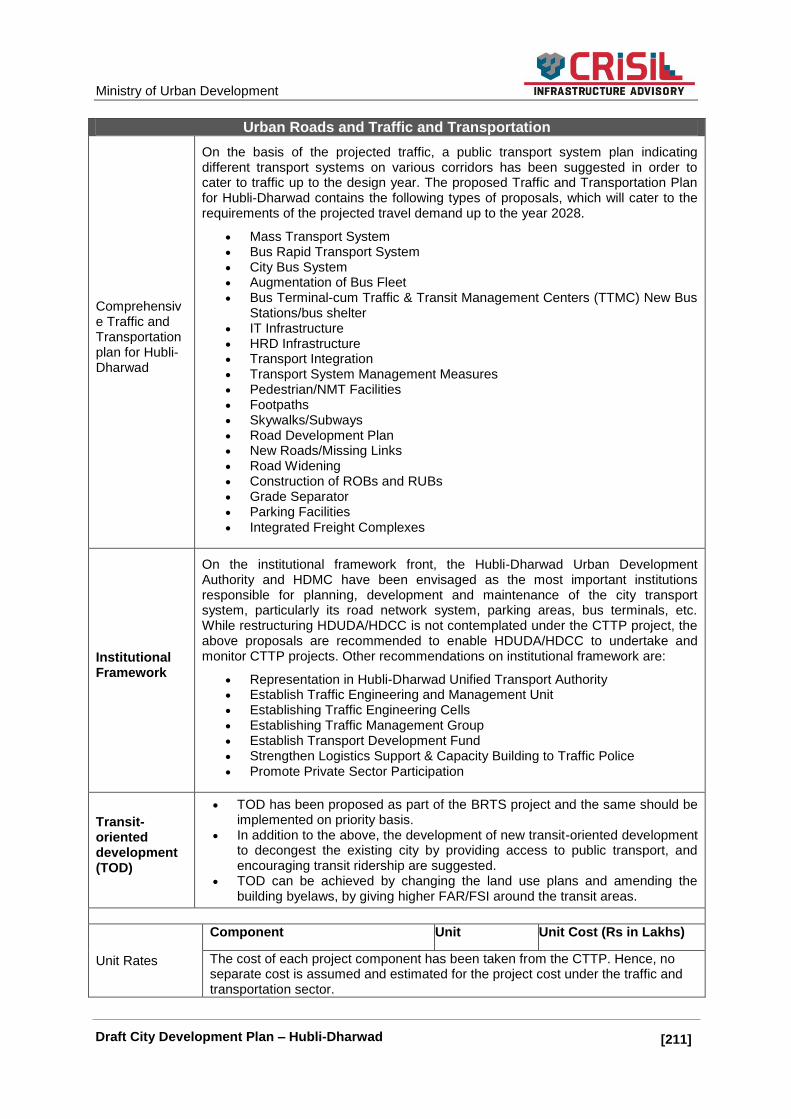
Ministry of Urban Development
[211]] Draft City Development Plan – Hubli-Dharwad
Urban Roads and Traffic and Transportation
Comprehensive Traffic and Transportation plan for Hubli-Dharwad
On the basis of the projected traffic, a public transport system plan indicating different transport systems on various corridors has been suggested in order to cater to traffic up to the design year. The proposed Traffic and Transportation Plan for Hubli-Dharwad contains the following types of proposals, which will cater to the requirements of the projected travel demand up to the year 2028.
Mass Transport System Bus Rapid Transport System
City Bus System
Augmentation of Bus Fleet Bus Terminal-cum Traffic & Transit Management Centers (TTMC) New Bus
Stations/bus shelter IT Infrastructure
HRD Infrastructure
Transport Integration
Transport System Management Measures
Pedestrian/NMT Facilities
Footpaths
Skywalks/Subways
Road Development Plan
New Roads/Missing Links
Road Widening
Construction of ROBs and RUBs
Grade Separator Parking Facilities
Integrated Freight Complexes
Institutional Framework
On the institutional framework front, the Hubli-Dharwad Urban Development Authority and HDMC have been envisaged as the most important institutions responsible for planning, development and maintenance of the city transport system, particularly its road network system, parking areas, bus terminals, etc. While restructuring HDUDA/HDCC is not contemplated under the CTTP project, the above proposals are recommended to enable HDUDA/HDCC to undertake and monitor CTTP projects. Other recommendations on institutional framework are:
Representation in Hubli-Dharwad Unified Transport Authority
Establish Traffic Engineering and Management Unit Establishing Traffic Engineering Cells
Establishing Traffic Management Group
Establish Transport Development Fund
Strengthen Logistics Support & Capacity Building to Traffic Police
Promote Private Sector Participation
Transit- oriented development (TOD)
TOD has been proposed as part of the BRTS project and the same should be implemented on priority basis.
In addition to the above, the development of new transit-oriented development to decongest the existing city by providing access to public transport, and encouraging transit ridership are suggested.
TOD can be achieved by changing the land use plans and amending the building byelaws, by giving higher FAR/FSI around the transit areas.
Unit Rates
Component Unit Unit Cost (Rs in Lakhs)
The cost of each project component has been taken from the CTTP. Hence, no separate cost is assumed and estimated for the project cost under the traffic and transportation sector.
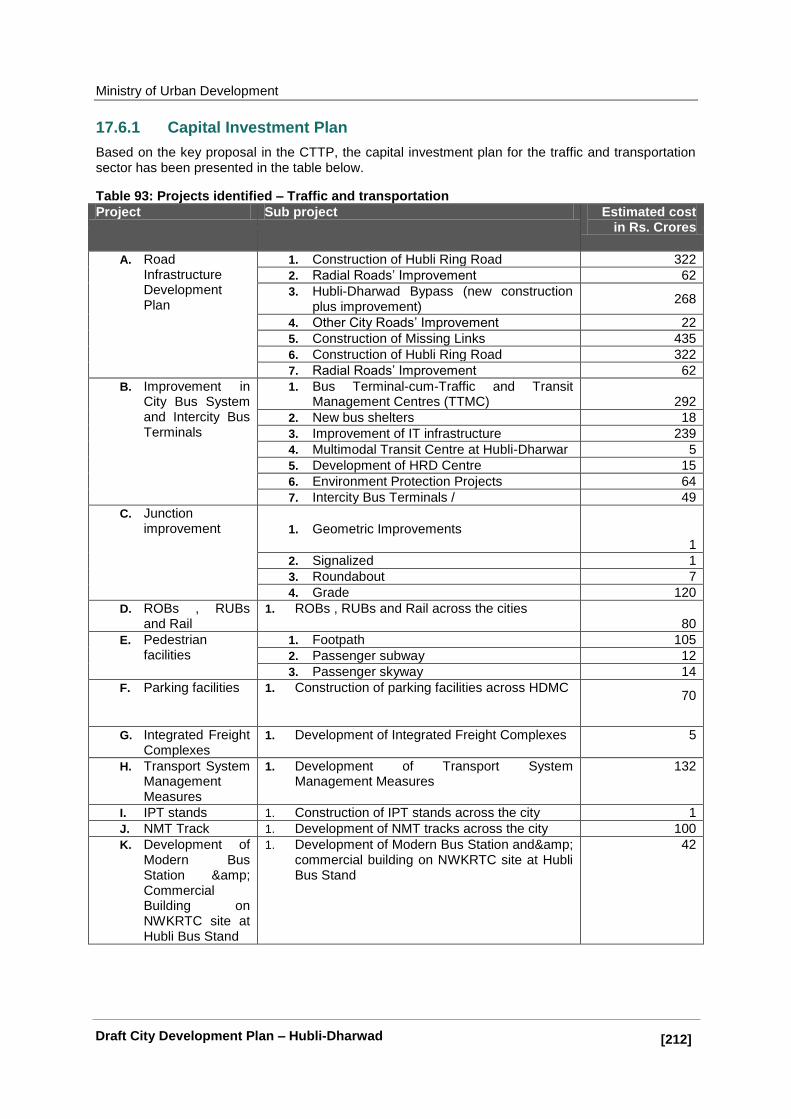
Ministry of Urban Development
[212]] Draft City Development Plan – Hubli-Dharwad
17.6.1 Capital Investment Plan
Based on the key proposal in the CTTP, the capital investment plan for the traffic and transportation sector has been presented in the table below.
Table 93: Projects identified – Traffic and transportation
Project Sub project Estimated cost in Rs. Crores
A. Road Infrastructure Development Plan
1. Construction of Hubli Ring Road 322
2. Radial Roads‘ Improvement 62
3. Hubli-Dharwad Bypass (new construction plus improvement)
268
4. Other City Roads‘ Improvement 22
5. Construction of Missing Links 435
6. Construction of Hubli Ring Road 322
7. Radial Roads‘ Improvement 62
B. Improvement in City Bus System and Intercity Bus Terminals
1. Bus Terminal-cum-Traffic and Transit Management Centres (TTMC) 292
2. New bus shelters 18
3. Improvement of IT infrastructure 239
4. Multimodal Transit Centre at Hubli-Dharwar 5
5. Development of HRD Centre 15
6. Environment Protection Projects 64
7. Intercity Bus Terminals / 49
C. Junction improvement 1. Geometric Improvements
1
2. Signalized 1
3. Roundabout 7
4. Grade 120
D. ROBs , RUBs and Rail
1. ROBs , RUBs and Rail across the cities 80
E. Pedestrian facilities
1. Footpath 105
2. Passenger subway 12
3. Passenger skyway 14
F. Parking facilities 1. Construction of parking facilities across HDMC 70
G. Integrated Freight Complexes
1. Development of Integrated Freight Complexes 5
H. Transport System Management Measures
1. Development of Transport System Management Measures
132
I. IPT stands 1. Construction of IPT stands across the city 1
J. NMT Track 1. Development of NMT tracks across the city 100
K. Development of Modern Bus Station & Commercial Building on NWKRTC site at Hubli Bus Stand
1. Development of Modern Bus Station and& commercial building on NWKRTC site at Hubli Bus Stand
42
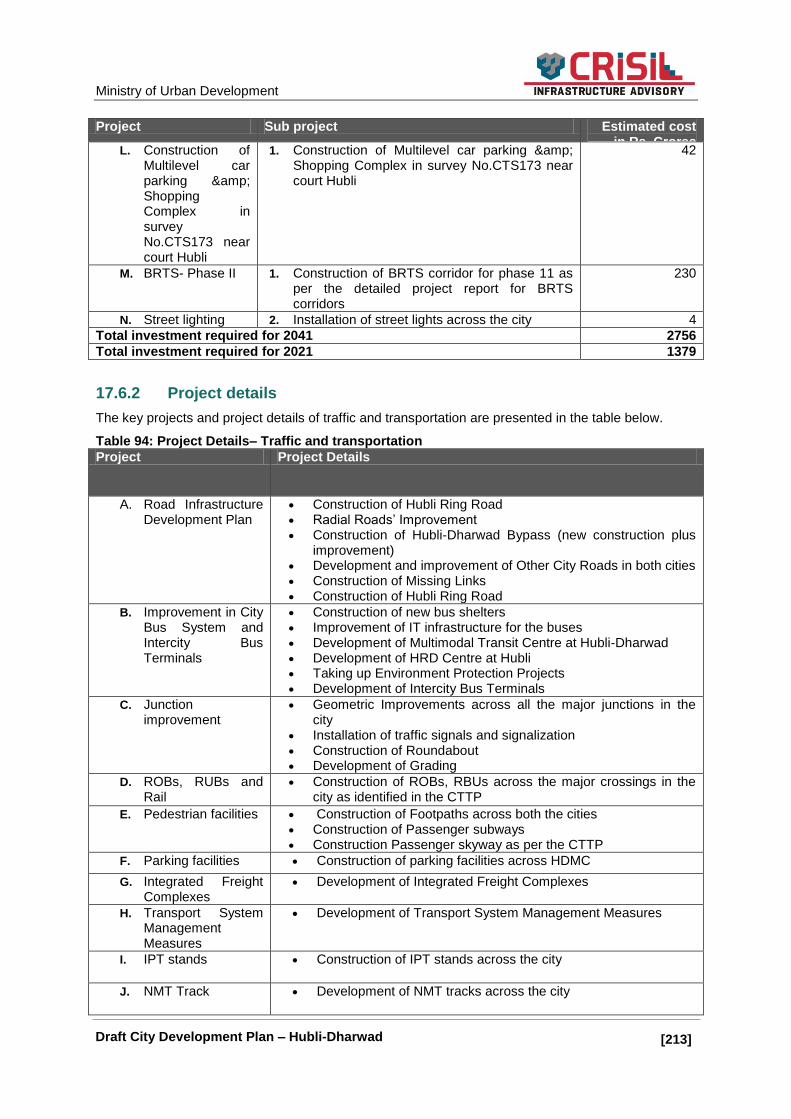
Ministry of Urban Development
[213]] Draft City Development Plan – Hubli-Dharwad
Project Sub project Estimated cost in Rs. Crores
L. Construction of Multilevel car parking & Shopping Complex in survey No.CTS173 near court Hubli
1. Construction of Multilevel car parking & Shopping Complex in survey No.CTS173 near court Hubli
42
M. BRTS- Phase II 1. Construction of BRTS corridor for phase 11 as per the detailed project report for BRTS corridors
230
N. Street lighting 2. Installation of street lights across the city 4
Total investment required for 2041 2756
Total investment required for 2021 1379
17.6.2 Project details
The key projects and project details of traffic and transportation are presented in the table below.
Table 94: Project Details– Traffic and transportation
Project Project Details
A. Road Infrastructure Development Plan
Construction of Hubli Ring Road
Radial Roads‘ Improvement Construction of Hubli-Dharwad Bypass (new construction plus
improvement) Development and improvement of Other City Roads in both cities Construction of Missing Links
Construction of Hubli Ring Road
B. Improvement in City Bus System and Intercity Bus Terminals
Construction of new bus shelters
Improvement of IT infrastructure for the buses Development of Multimodal Transit Centre at Hubli-Dharwad
Development of HRD Centre at Hubli Taking up Environment Protection Projects
Development of Intercity Bus Terminals
C. Junction improvement
Geometric Improvements across all the major junctions in the city
Installation of traffic signals and signalization Construction of Roundabout Development of Grading
D. ROBs, RUBs and Rail
Construction of ROBs, RBUs across the major crossings in the city as identified in the CTTP
E. Pedestrian facilities Construction of Footpaths across both the cities Construction of Passenger subways
Construction Passenger skyway as per the CTTP
F. Parking facilities Construction of parking facilities across HDMC
G. Integrated Freight Complexes
Development of Integrated Freight Complexes
H. Transport System Management Measures
Development of Transport System Management Measures
I. IPT stands Construction of IPT stands across the city
J. NMT Track Development of NMT tracks across the city

Ministry of Urban Development
[214]] Draft City Development Plan – Hubli-Dharwad
Project Project Details
K. Development of Modern Bus Station & Commercial Building on NWKRTC site at Hubli Bus Stand
Development of Modern Bus Station & Commercial Building on NWKRTC site at Hubli Bus Stand
L. Construction of Multilevel car parking & Shopping Complex in survey No.CTS173 near court Hubli
Construction of Multilevel car parking & Shopping Complex in survey No.CTS173 near court Hubli
M. BRTS- Phase II Construction of BRTS corridor for phase 11 as per the detailed project report for BRTS corridors
N. Street lighting Installation of street lights across the city
17.6.3 Phasing of investment
The traffic and transportation project has been divided into various components for implementation purpose. Further, timeliness and implementing agencies have been proposed for each component, and the same have been presented in the table below. Table 95: Phasing of investment – Traffic and transportation
Sector/Component
Implementing agency
Total 2015-16
2016-17
2017-18
2018-19
2019-20
2020-21
2021-22
(Rs. In Crores)
A
Construction of Hubli Ring Road
HDUDA 161 16 16 32 24 24 24 24
B Radial Roads‘ Improvement
HDUDA 31 3 3 6 5 5 5 5
C
Hubli-Dharwad Bypass (new construction-plus improvement)
HDUDA
134 13 13 27 20 20 20 20
D
Other City Roads' Improvement
HDMC 11 1 1 2 2 2 2 2
E
Construction of Missing Links
HDUDA 218 22 22 44 33 33 33 33
F
Bus Terminal-cum-Traffic and Transit Management Centres (TTMC)
NWKRTC
146 15 15 29 22 22 22 22
G New bus shelters
NWKRTC 9 1 1 2 1 1 1 1
H
Improvement of IT infrastructure
NWKRTC 120 12 12 24 18 18 18 18
I
Multimodal Transit Centre at Hubli-Dharwar
NWKRTC
3 0 0 1 0 0 0 0
J
Development of HRD Centre
NWKRTC 8 1 1 2 1 1 1 1

Ministry of Urban Development
[215]] Draft City Development Plan – Hubli-Dharwad
Sector/Component
Implementing agency
Total 2015-16
2016-17
2017-18
2018-19
2019-20
2020-21
2021-22
K
Environment Protection Projects
NWKRTC 32 3 3 6 5 5 5 5
L
Intercity Bus Terminals /
NWKRTC
25 2 2 5 4 4 4 4
M
Rotary, Junction Improvements, Signals, Flyovers etc.
HDMC
64 6 6 13 10 10 10 10
N
ROBs , RUBs and Rail
HDMC 40 4 4 8 6 6 6 6
O Pedestrian facilities HDMC 65 7 7 13 10 10 10 10
P Parking facilities HDMC 35 3 3 7 5 5 5 5
QR
Integrated Freight Complexes
HDUDA 3 0 0 1 0 0 0 0
S
Transport System Management Measures
HDMC
66 7 7 13 10 10 10 10
T IPT stands HDUDA 0 0 0 0 0 0 0 0
U NMT Track HDMC 50 5 5 10 8 8 8 8
Development of Modern Bus Station & Commercial Building on NWKRTC site at Hubli Bus Stand
NWKRTC
21 2 2 4 3 3 3 3
V
Construction of Multilevel car parking & Shopping Complex in survey No.CTS173 near court Hubli
HDMC
20 2 2 4 3 3 3 3
W BRTS- Phase II DULT 115 12 12 23 17 17 17 17
X Street lighting HDMC 3 0.5 0.5 0.5 0.5 0.5 0.5 0.3
Total 1379 138 138 276 207 207 207 207
17.7 Plan for Basic Services for Urban Poor Sector
With respect to housing and basic services for the urban poor, the key challenges are dilapidated housing and lack of service coverage in terms of individual toilets and social infrastructure facilities. The sector plan for basic services for the urban poor has been presented in the table below.

Ministry of Urban Development
[216]] Draft City Development Plan – Hubli-Dharwad
Table 96: Basic Services for Urban Poor sector plan
Basic Services for Urban Poor
Sector goals Improve access to physical and social infrastructure for slum-dwellers Develop livelihood strategies to improve work-force participation
Design parameters
New houses for households living in kutcha houses and dilapidated structures in both the cities
In-situ upgradation of existing slums in both the cities
Upgradation of slum housing in both cities Water supply – Provide individual house service connections to all the slum
households or group connections
Sewerage – Provide individual house service connections Sanitation – Construct community toilets Solid Waste Management - Coverage of all slum households under door-to-
door collection and awareness campaigns of source segregation
Desired outcomes
2017 2019 2021 Remarks
Pucca housing for the urban poor
60% 100% 100% -
Adequate access to water supply
80% 100% 100% -
Access to open drains 80% 100% 100% -
Access to sanitation 80% 100% 100% -
Percentage of CC roads 90% 100% 100% -
Access to UGD 40% 80% 100% -
Access to health and education facilities
(based on discussions with municipal public health officer)
80% 100% 100% -
Action Plans Activities
Categorization of slums
House-to-house slum survey has to be carried out for this purpose.
Integrated development of slums
Slum networking strategies have to be adopted to improve the services in the slums.
This would help in building low-cost services in the slums (especially in water supply, sewerage, and SWM sectors).
Rehabilitation of slums
Pucca housing with infrastructure facilities to be developed in feasible locations
Construction of housing
The slums in low-lying areas and along the natural drains could be proposed for relocation.
A suitable financing strategy could be developed to minimize the burden on the beneficiaries.
The beneficiaries could be provided access to banks for availing of the long-term housing loans.
Access to health and education
The health action plan should control prevalent diseases and reduce infant mortality rate.
Access to emergency medical services should be provided to the BPL population.
The education action plan should involve renovation of existing municipal schools and regular awareness campaigns to limit the dropout rates.
Livelihood restoration
Activity centres to be established for skill development programmes
Unit Rates
Component Unit Unit Cost (Rs in Lakhs)
Housing along with Infrastructure development (New layouts) Per dwelling unit 5

Ministry of Urban Development
[217]] Draft City Development Plan – Hubli-Dharwad
Basic Services for Urban Poor
In-situ upgradation of existing slums Per Hectare 10
17.7.1 Capital Investment Plan
Based on the above key requirements in the basic services to urban poor sector, the capital investment plan for projects in this sector is presented in the table below.
Table 97: Urban poverty alleviation – Projects identified
Project Sub project Estimated cost in Rs. Crores
A. Development of new housing and infrastructure
1. Construction of 1072 dwelling units for the urban poor in the city
54
B. In-situ upgradation of existing slums
1. In-situ up-gradation in 4537 houses in the tenable slums
22
C. Upgradation of existing slums
1. Upgradation of housing facilities in 5281 houses. Further, provision of basic services such as primary schools, health care centres, and community halls
264 2. Construction of primary health
centres in the slums of the city
3. Construction of community halls in the slums. Establishment of vocational training institutes will enhance the skills of the slum-dwellers.
Total investment required for 2041 544
Total investment required for 2021 544
17.7.2 Project Details
The key projects and project details of basic services to the urban poor are presented in the table below.
Table 98: Urban poverty alleviation – Projects Details
Projects
A. Development of new housing and infrastructure
New housing and infrastructure requirement for 1072 dwelling units has been projected for the year 2021.
It is recommended that in slums where relocation is possible, in-situ up-gradation may be taken up.
B. In-situ upgradation of existing slums
In-situ up-gradation of 4,537 houses in the identified slums

Ministry of Urban Development
[218]] Draft City Development Plan – Hubli-Dharwad
Projects
C. Upgradation of existing slums
Up-gradation of housing facilities in 5281 houses. Further, provision of basic services such as primary schools, health care centres, and community halls in the identified slums. Vocational training for employment generation and development of social security mechanisms
17.7.3 Phasing of investment
The basic services to the urban poor projects have been divided into various components for implementation purpose. Further, the timeliness been proposed for each component, and the same have been presented in the table below. Table 99: Urban poverty alleviation – Phasing of investment
Sector/Component
Implementing
agency Total
2015-16
2016-17
2017-18
2018-19
2019-20
2020-21
2021-22
(Rs. In Crs)
A
Development of new housing and infrastructure
HDMC
54 5 5 11 8 8 8 8
B In-situ upgradation of existing slums
HDMC 227 23 23 45 34 34 34 34
C
Upgradation of existing slums
HDMC 264 26 26 53 40 40 40 40
Total 544 54 54 109 82 82 82 82
17.8 Social infrastructure and Heritage Sector Plan
As discussed in the assessment chapter, the key challenges are lack of adequate education infrastructure for pre-primary, primary, and higher secondary education. There is a need for health care facilities such as veterinary hospitals for pets and animals. Alongside, there is a need for Intermediate Hospitals (Category B), Intermediate Hospitals (Category A) and Multi-Specialty Hospitals (NBC) for the projected population for the year 2041.
Socio-cultural infrastructure such as community centres are to be developed in the identified wards. In addition, there are four old temples in the city which need to be renovated under the heritage improvement plan for the city.
Table 100: Social infrastructure sector plan
Social Infrastructure
Design parameters
Schools, hospitals, socio-cultural, and parks and playground requirements assessed as per URDPFI guidelines
Demand gap assessment for education infrastructure
Component Existing
2021 2041
Demand Gap Demand Gap
Pre-primary, nursery school
270 463 193 578 308
Primary school 180 231 51 289 109
Senior secondary school
130 154 24 193 63
Integrated school (with hostel facility)
0 12 12 14 14
School for physically challenged
1 26 25 32 31

Ministry of Urban Development
[219]] Draft City Development Plan – Hubli-Dharwad
Social Infrastructure
School for mentally challenged
1 1 0 1 0
Demand gap assessment for healthcare infrastructure
Component Existi
ng
2021 2041
Demand Gap Demand Gap
Dispensary 680 77 -603 122 -558
Nursing home, child welfare and maternity centre
6 26 20 41 35
Polyclinic 114 12 -102 18 -96
Intermediate Hospital (Category B)
0 12 12 18 18
Intermediate Hospital (Category A)
0 12 12 18 18
Multi-Specialty Hospital (NBC)
12 12 18 18
Specialty Hospital (NBC)
12 12 18 18
General Hospital (NBC)
10 5 -5 7 -3
Family Welfare Centre
5 5 7 7
Diagnostic centre 7 23 16 37 30
Veterinary Hospital for pets and animals
0 2 2 4 4
Dispensary for pet animals and birds
6 12 6 18 12
Demand gap assessment for parks and play grounds
Component Existi
ng
2021 2041
Demand Gap Demand Gap
Organised green areas (in hectares)
663 424 -239 672 9
Action Plans
Identification of areas for development of new schools and hospitals
Action plan for improvement of facilities at the parks and recreational places in both the cities
In addition, regular operation and maintenance of the Unkal lake and the park and Indira Gandhi Glass House Garden, Hubli
Renovation of old temples in the city
Development of night shelters and old age homes within the city limits
Development of ward-level community centers and anganwadis
Heritage Management
Establishment of heritage cell at HDMC headed by an architect to carry out listing of heritage structures if any in the city
Undertaking preparation of either DPRs or feasibility studies for restoration and refurbishment of old temples on priority basis
Creation of a heritage fund to undertake small-scale restoration works of the identified heritage structures
Installation of direction signages and information boards at appropriate locations in the city
Unit Rates
Component Unit Unit Cost (Rs in Lakhs)
Preprimary, nursery school LS 4
Primary school LS 6
Senior secondary school LS 10
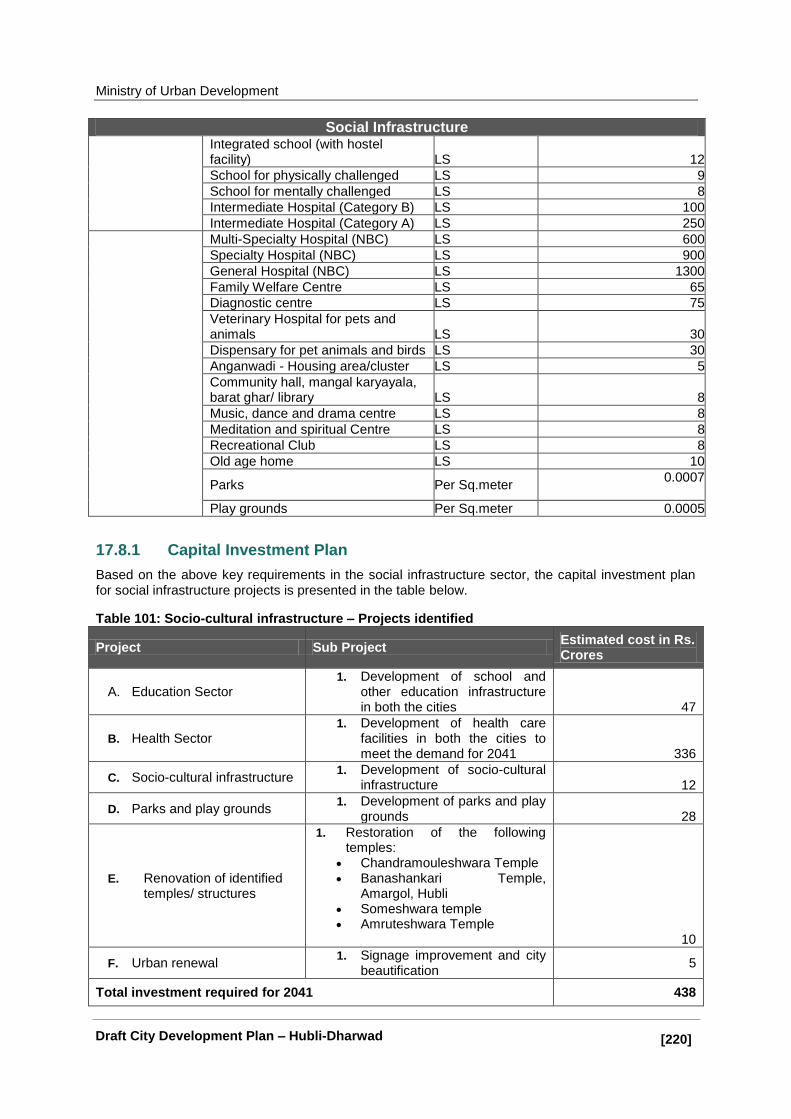
Ministry of Urban Development
[220]] Draft City Development Plan – Hubli-Dharwad
Social Infrastructure
Integrated school (with hostel facility) LS 12
School for physically challenged LS 9
School for mentally challenged LS 8
Intermediate Hospital (Category B) LS 100
Intermediate Hospital (Category A) LS 250
Multi-Specialty Hospital (NBC) LS 600
Specialty Hospital (NBC) LS 900
General Hospital (NBC) LS 1300
Family Welfare Centre LS 65
Diagnostic centre LS 75
Veterinary Hospital for pets and animals LS 30
Dispensary for pet animals and birds LS 30
Anganwadi - Housing area/cluster LS 5
Community hall, mangal karyayala, barat ghar/ library LS 8
Music, dance and drama centre LS 8
Meditation and spiritual Centre LS 8
Recreational Club LS 8
Old age home LS 10
Parks Per Sq.meter 0.0007
Play grounds Per Sq.meter 0.0005
17.8.1 Capital Investment Plan
Based on the above key requirements in the social infrastructure sector, the capital investment plan for social infrastructure projects is presented in the table below.
Table 101: Socio-cultural infrastructure – Projects identified
Project Sub Project Estimated cost in Rs. Crores
A. Education Sector 1. Development of school and
other education infrastructure in both the cities 47
B. Health Sector 1. Development of health care
facilities in both the cities to meet the demand for 2041 336
C. Socio-cultural infrastructure 1. Development of socio-cultural
infrastructure 12
D. Parks and play grounds 1. Development of parks and play
grounds 28
E. Renovation of identified temples/ structures
1. Restoration of the following temples:
Chandramouleshwara Temple
Banashankari Temple, Amargol, Hubli
Someshwara temple Amruteshwara Temple
10
F. Urban renewal 1. Signage improvement and city
beautification 5
Total investment required for 2041 438
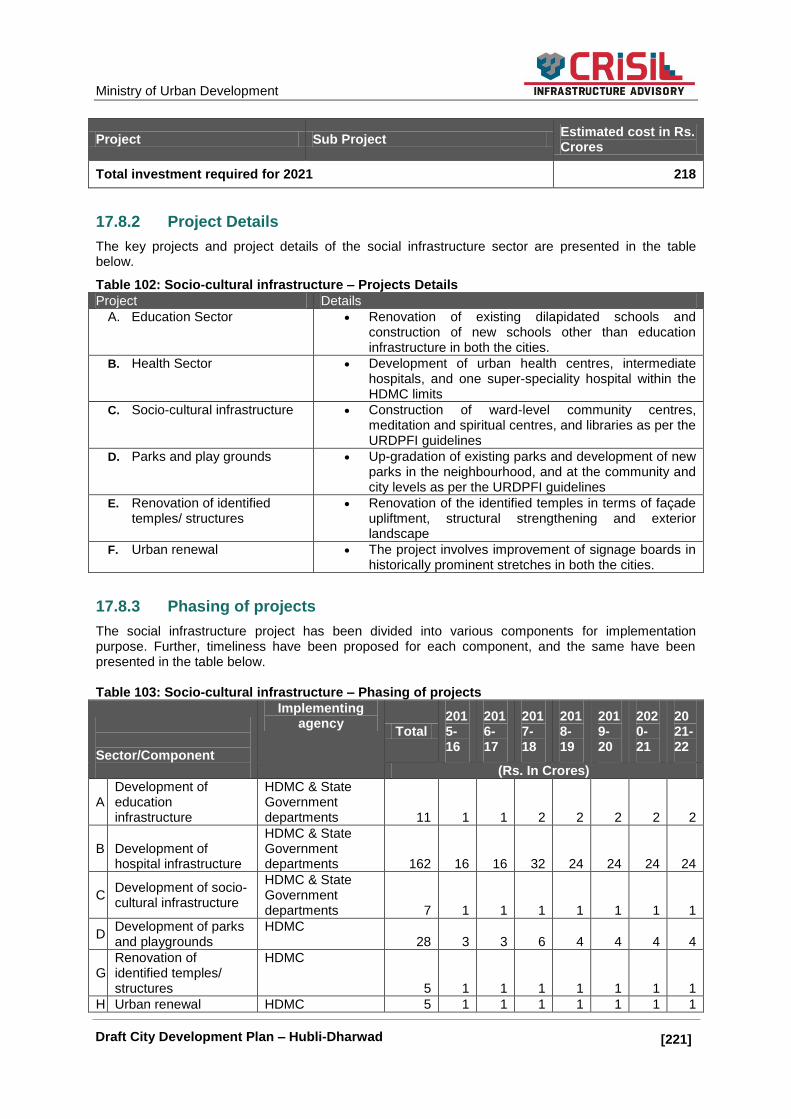
Ministry of Urban Development
[221]] Draft City Development Plan – Hubli-Dharwad
Project Sub Project Estimated cost in Rs. Crores
Total investment required for 2021 218
17.8.2 Project Details
The key projects and project details of the social infrastructure sector are presented in the table below.
Table 102: Socio-cultural infrastructure – Projects Details
Project Details
A. Education Sector Renovation of existing dilapidated schools and construction of new schools other than education infrastructure in both the cities.
B. Health Sector Development of urban health centres, intermediate hospitals, and one super-speciality hospital within the HDMC limits
C. Socio-cultural infrastructure Construction of ward-level community centres, meditation and spiritual centres, and libraries as per the URDPFI guidelines
D. Parks and play grounds Up-gradation of existing parks and development of new parks in the neighbourhood, and at the community and city levels as per the URDPFI guidelines
E. Renovation of identified temples/ structures
Renovation of the identified temples in terms of façade upliftment, structural strengthening and exterior landscape
F. Urban renewal The project involves improvement of signage boards in historically prominent stretches in both the cities.
17.8.3 Phasing of projects
The social infrastructure project has been divided into various components for implementation purpose. Further, timeliness have been proposed for each component, and the same have been presented in the table below. Table 103: Socio-cultural infrastructure – Phasing of projects
Sector/Component
Implementing agency
Total 2015-16
2016-17
2017-18
2018-19
2019-20
2020-21
2021-22
(Rs. In Crores)
A
Development of education infrastructure
HDMC & State Government departments 11 1 1 2 2 2 2 2
B Development of hospital infrastructure
HDMC & State Government departments 162 16 16 32 24 24 24 24
C Development of socio-cultural infrastructure
HDMC & State Government departments 7 1 1 1 1 1 1 1
D Development of parks and playgrounds
HDMC 28 3 3 6 4 4 4 4
G
Renovation of identified temples/ structures
HDMC
5 1 1 1 1 1 1 1
H Urban renewal HDMC 5 1 1 1 1 1 1 1

Ministry of Urban Development
[222]] Draft City Development Plan – Hubli-Dharwad
Sector/Component
Implementing agency
Total 2015-16
2016-17
2017-18
2018-19
2019-20
2020-21
2021-22
Total 218 22 22 44 33 33 33 33
17.9 Urban Environment, Disaster Management Sector Plan
Three major interventions have been identified under urban environment: 1) rejuvenation of water bodies, 2) pollution mitigation strategies, and 3) energy efficiency in street lighting. Further, it is recommended to establish a disaster management cell in HDMC to coordinate with various departments for disaster rescue operations.
Under pollution mitigation, augmentation of pollution control check devices, installation of sprinklers in identified corridors, and plantation activities have been identified. Further, projects have been identified in the areas of energy efficiency in street lighting through the uses of ESCOs, Hubli-Dharwad.
Table 104: Urban environment sector strategy
Urban Environment
Sector goals
HDMC to frame a policy to mitigate various kinds of pollution and promote effective use of natural resources in the city
Develop green zones/breathing spaces in the city to improve the quality of life
Utilize the potential for ecosystem services to improve resilience, subsistence
and livelihoods in the city
Desired outcomes
2013 2017 2019 2021 Remarks
Preservation of water bodies
40% 60% 80% 100%
Ground water recharge Nil 60% 80% 100%
Beautification of the water bodies
Nil 60% 80% 100%
Action Plans Activities
Mapping of water bodies
Mapping of water bodies to be carried out to assess their physical extent, cultural, natural and social values
Eviction of encroachments
Participatory approach for resettlement of encroachments around the water bodies
Construction of rainwater harvesting pits
Development of rainwater harvesting pits in the schools, urban health centres, HDMC main and zone offices, HDMC quarters, parks, reservoirs, stadiums, etc.
Rainwater harvesting should be made compulsory in large establishments such as shopping complexes, cinema halls, and function halls
Identifying apartments and shopping complexes without percolation pits Motivating apartment owners to install percolation pits
Pollution mitigation strategies
Increasing the green cover and buffer zones in the city to mitigate air pollution in the city
Energy conservation
HDMC may take up energy conservation measures such as solar signalling and street lighting.
Impact assessment and monitoring
Regular monitoring of air quality, water quality (surface and ground), and noise pollution
Carrying out environmental impact assessment prior to implementation of infrastructure projects

Ministry of Urban Development
[223]] Draft City Development Plan – Hubli-Dharwad
Urban Environment
Disaster Management
Developing Hubli-Dharwad as a disaster-resilient city
Development of control room or city-level service center Development of emergency control responsive system
Mapping of water inundation areas in the city
Climate Change
Energy-efficient street lighting to be introduced in HDMC limits
Energy auditing at building level in Government and institutional buildings Decentralized Solar Photovoltaic paneling in Government and institutional
buildings Creating awareness amongst citizens of suitable renewable energy and
energy efficiency technologies
Awareness activities for school children on renewable energy and energy efficiency measures
Unit Cost
Component Unit Unit Cost (Rs in Lakhs)
Walking track and landscape around water bodies
Lump Sum per water body 400
Rooftop solar panel Per MW 6.5
17.9.1 Capital Investment Plan
Based on the above key requirements in the urban environment sector, the capital investment plan for projects in this sector is presented in the table below.
Table 105: Urban environment– Projects identified
Project Sub project Estimated cost in Rs. Crores
A. Rejuvenation of water bodies
1. Construction of walking tracks around water bodies and improving physical infrastructure facilities of the water bodies in both the cities
20
B. Pollution control check devices, installation of sprinklers in identified corridors, and plantation activity
1. Pollution control check devices, installation of sprinklers in identified corridors, and plantation activity
5
C. Establishment of Disaster management cell at HDMC with Emergency response system
1. Establishment of Disaster management cell at HDMC with Emergency response system
10
D. Energy Efficiency in Street Lighting though use of ESCOs, Hubli-Dharwad
1. Solar street lighting along major arteries
2. Installation of Rooftop Photovoltaic paneling in Government and institutional buildings
20
Total investment required for 2041 55
Total investment required for 2021 55
17.9.2 Project Details
The key projects and project details of the urban environment sector are presented in the table below.
Table 106: Urban environment – Project Details
Project Details

Ministry of Urban Development
[224]] Draft City Development Plan – Hubli-Dharwad
Project Details
A. Renovation of water bodies in the city
Deweeding of water bodies in HDMC limits to control eutrophication
Construction of bunds/retaining walls along the water bodies and linking these to storm water channels
Construction of walking tracks around water bodies
B. Pollution control check devices, installation of sprinklers in identified corridors, and plantation activity
Installation of pollution control check devices along highways and major arteries
C. Establishment of disaster management cell in HDMC with emergency response system
Disaster management cell to be established at HDMC to act as the nodal point for all emergency-related activities in the city.
Installation of communication devices to facilitate information dissemination on natural disasters
D. Energy Efficiency in Street Lighting though use of ESCOs, Hubli-Dharwad
Installation of streetlights with solar panels along the major arteries of the city
17.9.3 Phasing of investment
The urban environment project has been divided into various components for implementation purpose. Further, the timeliness been proposed for each component, and the same have been presented in the table below. Table 107: Urban Environment– Phasing of investment
Sector/Component
Implementing agency
Total 2015-16
2016-17
2017-18
2018-19
2019-20
2020-21
2021-22
(Rs. In Crores)
A
Rejuvenation of water bodies HDMC 20 2 2 4 3 3 3 3
B Urban pollution mitigation
HDMC & Pollution Control board 5 1 1 1 1 1 1 1
c
Establishment of Disaster management cell at HDMC with emergency response system
HDMC and District
collector 10 1 1 2 2 2 2 2
D
Solar street lighting along major arteries HDMC 20 2 2 4 3 3 3 3
Total 55 6 6 11 8 8 8 8
17.10 Local Economic Development Sector Plan
The projects under local economy development have been identified to boost the economic development of the city and further to create employment opportunities in both the cities. As the vision suggests, the city could be developed as a commercial, cultural and educational hub of North Karnataka and create opportunities for growth for all segments of people.
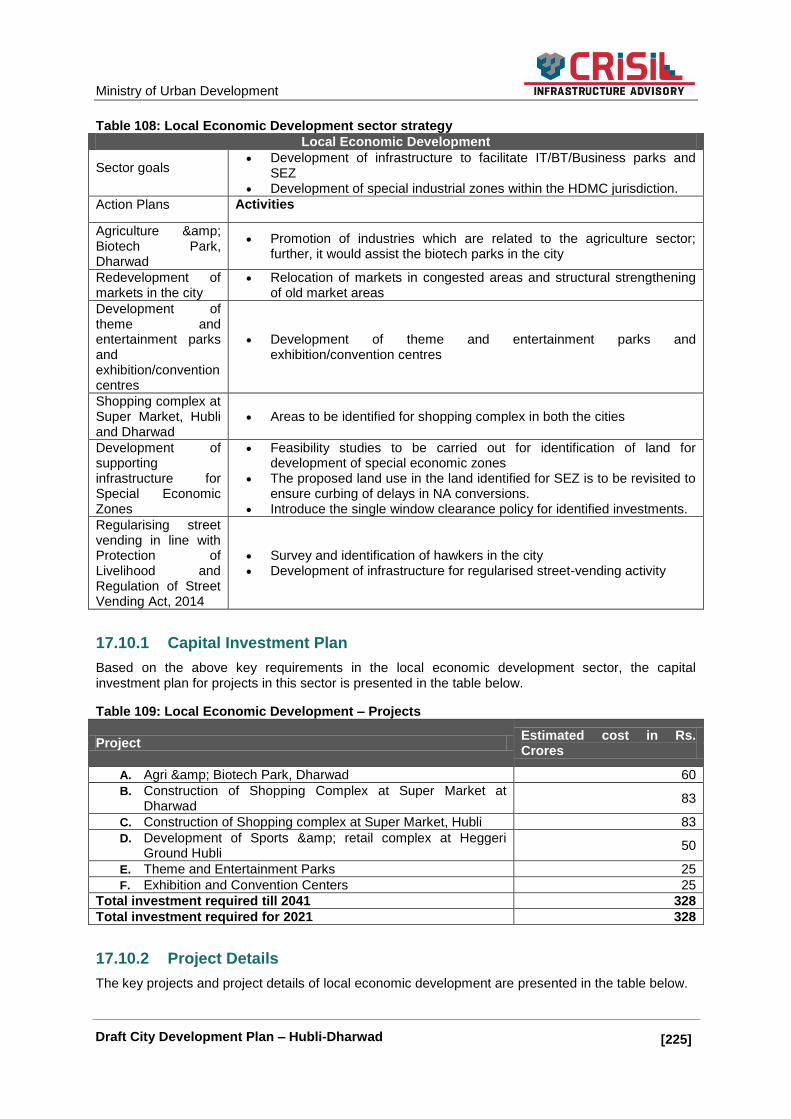
Ministry of Urban Development
[225]] Draft City Development Plan – Hubli-Dharwad
Table 108: Local Economic Development sector strategy
Local Economic Development
Sector goals Development of infrastructure to facilitate IT/BT/Business parks and
SEZ
Development of special industrial zones within the HDMC jurisdiction.
Action Plans Activities
Agriculture & Biotech Park, Dharwad
Promotion of industries which are related to the agriculture sector; further, it would assist the biotech parks in the city
Redevelopment of markets in the city
Relocation of markets in congested areas and structural strengthening of old market areas
Development of theme and entertainment parks and exhibition/convention centres
Development of theme and entertainment parks and exhibition/convention centres
Shopping complex at Super Market, Hubli and Dharwad
Areas to be identified for shopping complex in both the cities
Development of supporting infrastructure for Special Economic Zones
Feasibility studies to be carried out for identification of land for development of special economic zones
The proposed land use in the land identified for SEZ is to be revisited to ensure curbing of delays in NA conversions.
Introduce the single window clearance policy for identified investments.
Regularising street vending in line with Protection of Livelihood and Regulation of Street Vending Act, 2014
Survey and identification of hawkers in the city
Development of infrastructure for regularised street-vending activity
17.10.1 Capital Investment Plan
Based on the above key requirements in the local economic development sector, the capital investment plan for projects in this sector is presented in the table below.
Table 109: Local Economic Development – Projects
Project Estimated cost in Rs. Crores
A. Agri & Biotech Park, Dharwad 60
B. Construction of Shopping Complex at Super Market at Dharwad
83
C. Construction of Shopping complex at Super Market, Hubli 83
D. Development of Sports & retail complex at Heggeri Ground Hubli
50
E. Theme and Entertainment Parks 25
F. Exhibition and Convention Centers 25
Total investment required till 2041 328
Total investment required for 2021 328
17.10.2 Project Details
The key projects and project details of local economic development are presented in the table below.

Ministry of Urban Development
[226]] Draft City Development Plan – Hubli-Dharwad
Table 110: Local Economic Development – Project Details
Project Details
A. Agri & Biotech Park, Dharwad
The project involves development of a biotech park in Dharwad city.
B. Construction of Shopping Complex at Super Market in Dharwad
The project involves construction of a shopping complex at the super market in Dharwad city.
C. Construction of Shopping Complex at Super Market in Dharwad
The project involves construction of a shopping complex at super market in Hubli city
D. Development of Sports & retail complex at Heggeri Ground Hubli
The project involves development of a multipurpose complex which will have provisions for sports, amp and retail shops.
E. Theme and Entertainment Parks
It is suggested to develop a theme and entertainment park in Hubli and Dharwad city to boost ttourism development and further to create employment opportunities in the city
F. Exhibition and Convention centers
It is recommended to develop an exhibition center in Hubli and a convention center in Dharwad so that it could host high-profile meetings and exhibitions a la Bangalore.
17.10.3 Phasing of investment
The local economic development project has been divided into various components for implementation purpose. Further, timeliness have been proposed for each component, and the same have been presented in the table below. Table 111: Local Economic Development – Phasing of investment
Sector/Component
Implementing
agency
Total 2015-16
2016-17
2017-18
2018-19
2019-20
2020-21
2021-22
(Rs. In Crores)
A
Agri & Biotech Park, Dharwad
Karnataka Biotechnology and Information Technology Services 60 6 6 12 9 9 9 9
B
Construction of Shopping Complex at Super Market at Dharwad
HDMC
84 8 8 17 13 13 13 13
C
Construction of Shopping Complex at Super Market at Dharwad
HDMC
84 8 8 17 13 13 13 13
D
Development of Sports & retail complex at Heggeri Ground Hubli
HDMC and state government – sports department 50 5 5 10 8 8 8 8

Ministry of Urban Development
[227]] Draft City Development Plan – Hubli-Dharwad
Sector/Component
Implementing
agency
Total 2015-16
2016-17
2017-18
2018-19
2019-20
2020-21
2021-22
E
Theme and Entertainment Parks
HDMC/ and state government cultural department 25 3 3 5 4 4 4 4
F
Exhibition and Convention centers
HDMC/ and state government cultural department 25 3 3 5 4 4 4 4
Total 328 33 33 66 49 49 49 49
17.11 Tourism Sector Plan
Hubli is not a major tourism spot within the Karnataka state; also the contribution of tourism to the city‘s economy is also not substantial. However, the position of the city as a commercial hub of North Karnataka and its closeness to some internationally renowned heritage hubs like Hampi and Bijapur suggest the city‘s potential to evolve as a tourism node.
Table 112: Tourism Development sector strategy
Tourism Sector
Sector goals Hubli-Dharwad to act as transit hub for regional tourist activity in North
Karnataka
Development of local tourist points in the city
Action Plans Activities
Feasibility studies
In order to capitalize the potential of Hubli-Dharwad as a tourism node, it is important to invest in infrastructure development and proactively promote the city as the tourism node of North Karnataka.
As a first step, it is required to carry out feasibility studies to understand the important tourism activities obtaining in the North Karnataka region, in terms of the percentage share of tourists, their travel pattern, etc. and also to analyse the quality of supporting infrastructure such as road network, availability of hotels and other options for safe and secure stay, etc.
Health and Wellness Tourism promotion
Dharwad and Hubli to be positioned and promoted as premier health and wellness destination. The links all major existing health facilities with international standard and interlink the health infrastructure within and around the cities through transit systems.
Also, promote Karnataka‘s potential in the traditional systems of wellness and medicines like Ayurveda, Unani, Siddha, and Yoga; project the cities as unique destinations for health and wellness.
Education Tourism:
Dharwad to be positioned and promoted as a premier destination for all types of education and academic researches
The guidelines to be issued in consultation with national and international agencies. Only the certified institutions to be made eligible for incentives that are available for tourism projects and interlink and integrate the institutions.
Renovation of parks
Improvements in existing lakes and parks to attract tourists
17.11.1 Capital Investment Plan
Based on the above key requirements in the tourism sector, the capital investment plan is presented in the table below.

Ministry of Urban Development
[228]] Draft City Development Plan – Hubli-Dharwad
Table 113: Tourism Development sector – Project details
Project Sub project Estimated cost in Rs. Crores
A. Unkal lake and the park development - Improvements
1. To improve the physical infrastructure at Unkal lake
5
2. Regular operation and maintenance of Unkal park
B. Indira Gandhi Glass House Garden Hubli - Improvements
3. To improve the physical infrastructure at the glass house 5
4. Regular operation and maintenance of glass house
C. Feasibility study and detailing of tourist places
D. Carry out feasibility studies to understand the important tourism activities in the North Karnataka region
2
Total investment required till 2041 12
Total investment required for 2021 12
17.11.2 Project Details
The key projects and project details of the tourism sector are presented in the table below.
Table 114: Tourism Development sector – Project details
Project Details
A. Unkal lake and the park development - Improvements
Construction of bund along the water body, walk ways, landscape, play areas, boating activity
Development of other physical infrastructure facilities at the park
Regular operation and maintenance of the park and lake
B. Indira Gandhi Glass House Garden Hubli - Improvements
To improve the physical infrastructure at the glass house
C. Feasibility study and detailing of tourist places
To appoint a consultant to prepare the feasibility report-cum-detailed project report, to identify important tourism activities in the North Karnataka region
17.11.3 Phasing of investment
The tourism sector project has been divided into various components for implementation purpose. Further, timeliness have been proposed for each component, and the same have been presented in the table below. Table 115: Tourism Development sector – Phasing of investment
Sector/Component
Implementing agency
Total 2015-16
2016-17
2017-18
2018-19
2019-20
2020-21
2021-22
(Rs. In Crores)
A
Unkal lake and the park development - Improvements HDMC
5 1 1 1 1 1 1 1
B
Indira Gandhi Glass House Garden Hubli - Improvements HDMC
5 1 1 1 1 1 1 1
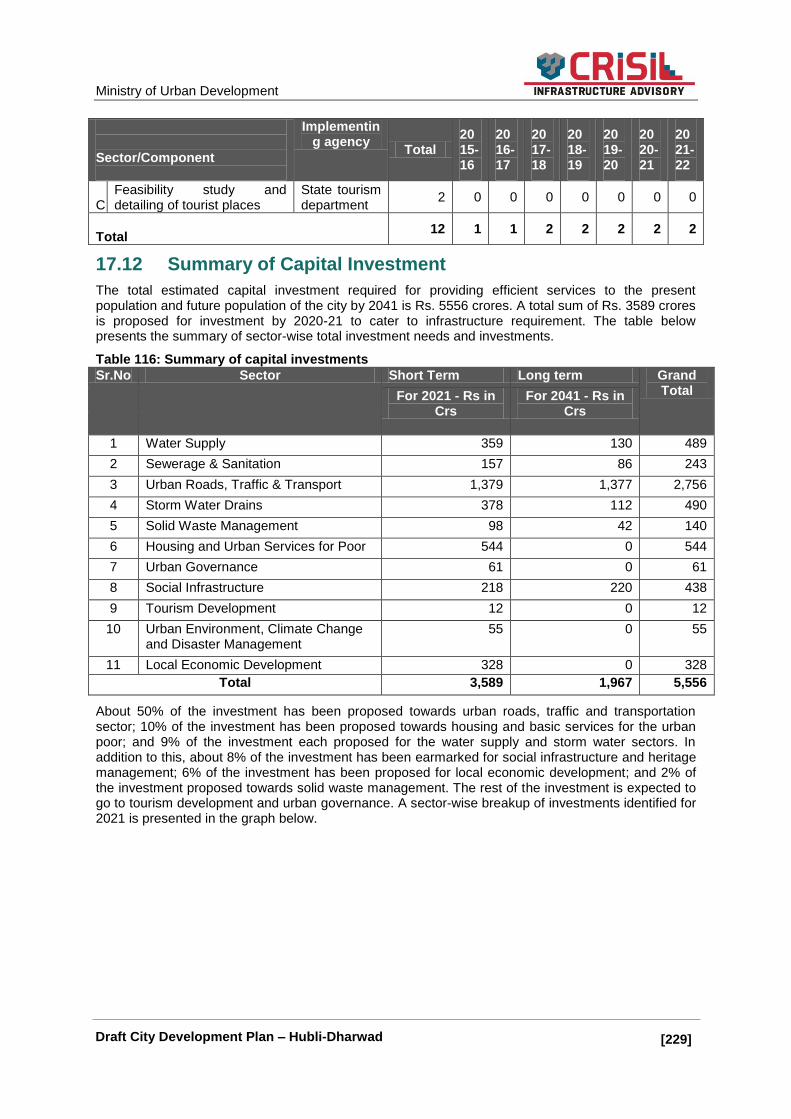
Ministry of Urban Development
[229]] Draft City Development Plan – Hubli-Dharwad
Sector/Component
Implementing agency
Total 2015-16
2016-17
2017-18
2018-19
2019-20
2020-21
2021-22
C
Feasibility study and detailing of tourist places
State tourism department
2 0 0 0 0 0 0 0
Total 12 1 1 2 2 2 2 2
17.12 Summary of Capital Investment
The total estimated capital investment required for providing efficient services to the present population and future population of the city by 2041 is Rs. 5556 crores. A total sum of Rs. 3589 crores is proposed for investment by 2020-21 to cater to infrastructure requirement. The table below presents the summary of sector-wise total investment needs and investments.
Table 116: Summary of capital investments
Sr.No Sector Short Term Long term Grand Total For 2021 - Rs in
Crs
For 2041 - Rs in Crs
1 Water Supply 359 130 489
2 Sewerage & Sanitation 157 86 243
3 Urban Roads, Traffic & Transport 1,379 1,377 2,756
4 Storm Water Drains 378 112 490
5 Solid Waste Management 98 42 140
6 Housing and Urban Services for Poor 544 0 544
7 Urban Governance 61 0 61
8 Social Infrastructure 218 220 438
9 Tourism Development 12 0 12
10 Urban Environment, Climate Change and Disaster Management
55 0 55
11 Local Economic Development 328 0 328
Total 3,589 1,967 5,556
About 50% of the investment has been proposed towards urban roads, traffic and transportation sector; 10% of the investment has been proposed towards housing and basic services for the urban poor; and 9% of the investment each proposed for the water supply and storm water sectors. In addition to this, about 8% of the investment has been earmarked for social infrastructure and heritage management; 6% of the investment has been proposed for local economic development; and 2% of the investment proposed towards solid waste management. The rest of the investment is expected to go to tourism development and urban governance. A sector-wise breakup of investments identified for 2021 is presented in the graph below.

Ministry of Urban Development
[230]] Draft City Development Plan – Hubli-Dharwad
Figure 63: Capital investment for 2021 (figures in Rs. crores)
17.13 Summary of Investment Phasing
While doing the phasing, the timelines for preparation of detailed project reports and necessary approvals have been considered. The project prioritization and detailed project phasing have been discussed in the table below.
Table 117: Summary of investment phasing
Sr.No
Sector Total investment
2015-16
2016-17
2017-18
2018-19
2019-20
2020-21
2021-22
(Figures in Rs. Crores)
1 Water Supply 359 36 36 72 54 54 54 54
2 Sewerage & Sanitation 157 16 16 31 24 24 24 24
3 Urban Roads, Traffic & Transport 1379 138 138 276 207 207 207 207
4 Storm Water Drains 378 38 38 76 57 57 57 57
5 Solid Waste Management 98 10 20 20 24 24 0 0
6 Housing and Urban Services for Poor 544 54 54 109 82 82 82 82
7 Urban Governance 61 6 6 12 9 9 9 9
8 Social Infrastructure 218 22 22 44 33 33 33 33
9 Tourism Development 12 1 1 2 2 2 2 2
10 Urban Environment, Climate Change and Disaster Management 55 6 6 11 8 8 8 8
11 Local Economic Development 328 33 33 66 49 49 49 49
Total 3589 360 370 719 549 549 525 525
Source: CRIS Analysis
17.14 Composition of investment
The following agencies would be responsible for implementing the projects identified in the CDP.
1. HDMC: HDMC would be responsible for design, construction, operation, and maintenance of the sewerage system, SWM, SWD, housing and basic services for the urban poor, municipal roads, parks, and playgrounds. HDMC would be the implementing agency for the projects identified in the above-mentioned sectors. HDMC has to contribute 44% of the total
0
157
355
378
98
544
61
45
0
40
168
0 100 200 300 400 500 600
Water Supply
Sewerage & Sanitation
Urban Roads, Traffic & Transport
Storm Water Drains
Solid Waste Management
Housing and Urban Services for…
Urban Governance
Social Infrastructure
Tourism Development
Urban Environment, Climate…
Local Economic Development
Rs. Crores

Ministry of Urban Development
[231]] Draft City Development Plan – Hubli-Dharwad
investment. 2. HDUDA: HDUDA would be responsible for revision of master plans and land use
conversions. Hence, HDUDA would be the implementing agency for all roads‘ projects – ring roads, radial roads and the proposed transit-oriented development in the city. Also, the regional transport projects such as the construction of a logistic hub, a transport nagar and truck terminals would be the responsibility of HDUDA. HDUDA has to contribute 20% of the total investment.
3. NKWKRTC: NKWKRTC would be responsible for procurement, operation and maintenance of the public transport system including rolling stock and nodal terminals. NKWKRTC has been identified as the implementing agency for the public transport system obtaining in the city. NKWRTC has to contribute 13% of the total investment.
4. HDWSSB: HDWSSB would be responsible for water supply capital works and operation and maintenance of the system. HDWSSB has been identified as the implementing agency for water supply projects taken up in the city. HDWSSB has to contribute 9% of the total investment
5. Department of Education and Health: The state department for education and health would be responsible for the development of education and health facilities identified as per the URDPFI guidelines. The education department has to contribute 1% of the total investment and the health department has to contribute 6% of the total investment.
6. Department of Urban Land Transport (DULT): The department is identified as the implementing agency for introduction of BRTS phase 11. DULT has to contribute 4% of the total investment towards the BRTS project
7. Karnataka State Small Industries Development Corporation Ltd. (KSSIDC): KSSIDC is responsible for the development of common infrastructure facilities in industrial zones and other industries to boost the economic activities in the region. KSSIDC has to contribute 3% of the total investment.
8. Karnataka State Tourism Development Corporation (KSTDC): KSTDC would be responsible for construction, operation and maintenance of tourist points within the state. KSTDC has been identified as the agency responsible for carrying out tourism development projects as identified in the CDP. KSTDC has to contribute 0.2% of the total investment.
9. Karnataka State Pollution Control Board (KSPCB): KSPCB would be responsible for the implementation of urban environment projects in the city. KSPCB has to contribute 0.3% of the total investment.
Table 118: Implementing agency-wise breakup of investment
Sr.No Name of Agency 2,021 2041
Investment Estimated -
% Investment Estimated
- 2041
%
1 HDMC 184,600 51% 244,924 44%
2 HDUDA 54,657 15% 109,313 20%
3 NKWKRTC 36,210 10% 72,420 13%
4 HDWSSB 35878 10% 48,888 9%
5 Department of Education 1,134 0% 4,698 1%
6 Department of Health 16,172 5% 33,611 6%
7 KSTDC 1,200 0% 1,200 0%
8 KSSIDC 16,000 4% 16,000 3%
9 KSPCB 1,500 0% 1,500 0%
10 DULT 11,523 3% 23,046 4%
Total 358,874 100% 555,600 100%
All figures are in Rs lakhs
Source: CRIS analysis

Ministry of Urban Development
[232]] Draft City Development Plan – Hubli-Dharwad
Figure 64: Implementing agency-wise breakup of investment for 2041
17.15 Priority Projects
Based on the stakeholder consultations and demand and gap assessment, the following have been idenitifed as priority projects for Hubli-Dharwad.
Table 119: Priority projects
Sector Projects
Drinking water 24X7 water supply in all wards
Sewerage Treatment Facility STP and prevention of seepage to ground water
Solid Waste Management Solid waste collection, segregation, disposal and treatment
Traffic & transport Traffic management, pedestrian pathways, parking lots, integration of transport nodes, etc.
Employment generation IT, ITES and industrial growth
44%
20%
13%
9%
1% 6%
0.2%
3%
0.3%
4%
HDMC HDUDA NKWKRTC
HDWSSB Department of Education Department of Health
KSTDC KSSIDC KSPCB
DULT
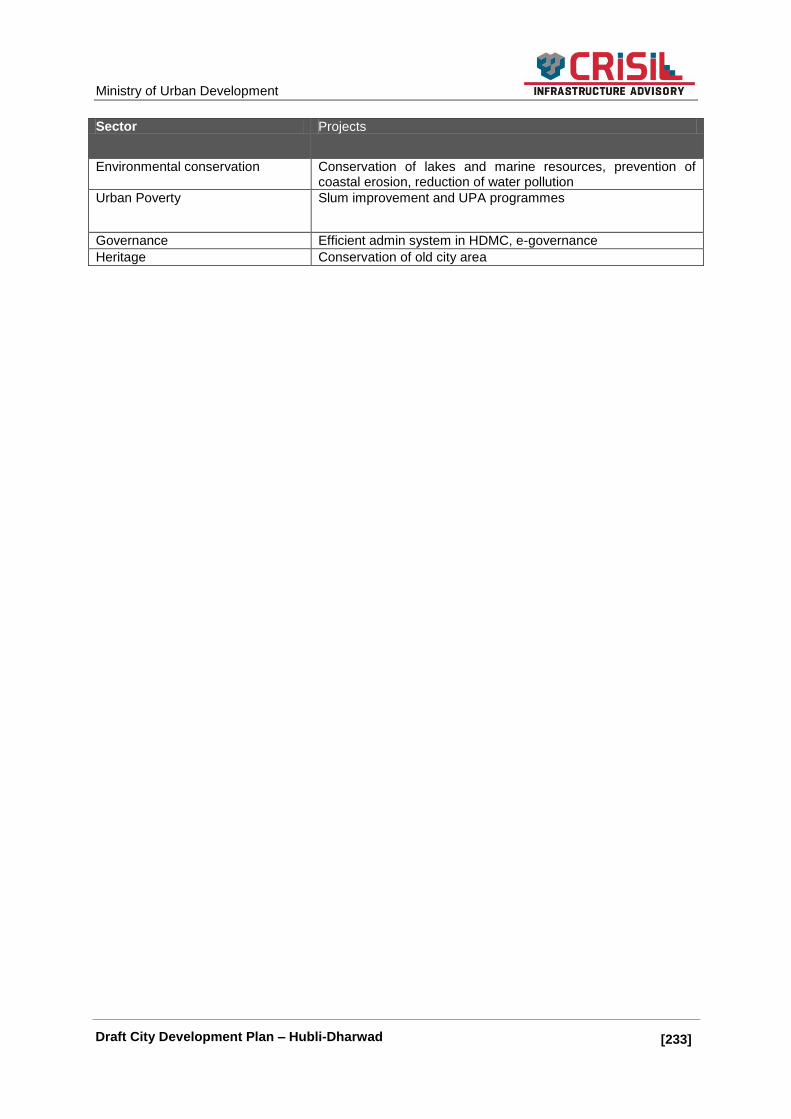
Ministry of Urban Development
[233]] Draft City Development Plan – Hubli-Dharwad
Sector Projects
Environmental conservation Conservation of lakes and marine resources, prevention of coastal erosion, reduction of water pollution
Urban Poverty Slum improvement and UPA programmes
Governance Efficient admin system in HDMC, e-governance
Heritage Conservation of old city area

Ministry of Urban Development
[234]] Draft City Development Plan – Hubli-Dharwad
18. Financial Operating Plan
The investment capacity of HDMC is assessed through a financial operating plan (FOP), which gives
a multi-year forecast of finances for the medium term. In line with the phasing of identified in the
capital investment (CIP), the FOP has been generated for the same period for HDMC. A salient
feature of the FOP is that all outstanding dues, including debt and non-debt liabilities if any, are also
taken into account.
18.1 Financial Plan for the City
ULB: HDMC is responsible for provision of basic services such as sewerage, solid waste
management, storm water drainage, roads and basic services for urban poor within its jurisdictions.
Therefore, HDMC accounts have been reviewed and further the accounts have been forecasted to
prepare the financial plan for the city. Accordingly, the annual accounts of HDMC for the period
between the financial years 2007-08 and 2011-12 are used to determine past trends for both revenue
and expenditure items and to arrive at appropriate growth assumptions for each of the income and
expense items. After forecasting the revenue account, the CIP has been loaded on to cash flow. The
FOP is generated to assess the investment sustaining capacity of HDMC.
Parastatals: HDWSSB is responsible for provision of water supply services in the HMC limits.
However, HDWSSB maintains the accounts for the Hubli division. Hence, the financials of HDWSSB
is not included in the City Financial Plan (CFP).
18.2 Methodology
For the preparation of FoP for HDMC, we have adopted the following methodology as provided in the
revised CDP toolkit. The stage wise methodology and the key references has been presented in the
below table.
Table 120: Methodology for City Financial Plan
Task Step Key Stages Description Remarks
Task1 Step 1 Defining Objectives
The key objectives have been defined for following key areas.
Revenue enhancement initiatives
Expenditure management initiatives
Asset management initiatives
Financial Management initiatives Further, it has been discussed in detailed in the subsequent sections.
The sub sections 20.9 to 20.12 has provided the details
Task2
Step 2 Data Collection
The annual accounts, balance sheets, debt schedules, DCB statements for water and sewerage have been collected from HDMC and HDWSSB for the past five years.
The recasting and trend analysis has been carried and the findings have been presented in the financial assessment chapter above.
Chapter 14 has detailed out the recasting and trend analysis.
Step3 Business-As-Usual scenario --- CFP Version I
As a first step in preparation of FoP for the city, we have prepared the Business-As-Usual scenario and provided the overall capacity of HDMC to take-up the infrastructure projects.
The scenario has been discussed in the section FOP scenario considered
The sub section 20.6 has provided the details.

Ministry of Urban Development
[235]] Draft City Development Plan – Hubli-Dharwad
Task Step Key Stages Description Remarks
Step 4 Analysis / Interpretation of the results
Post finalization of Business-As-Usual scenario, we have carried out the analysis on the revenue and expenditure to check the performance of key items. The same has been presented in the annexure.
Task3
Task5 Identification of areas of improvement / reforms
We have identified the property tax and sewerage charge are the key revenue source where the reforms can be explored to improve the coverage and collection efficiency and the same has been detailed out in the Revenue enhancement initiatives
The sub sections 20.7 and 20.9 have provided the details.
Step6 Select / priorities areas of improvement / reforms
Under the revenue enhancement initiatives, we have identified the key reforms to be implemented in the property tax and user charges.
The sub section 20.9 has provided the details.
Task4
Step7 Finalizing basic assumptions for resource mobilization forecast
Key assumptions for the income and expenditure side have been presented in the key assumptions section.
The sub section 20.4.1 has provided the details.
Step8 Ascertain investible surplus for ULB / Parastatals / Development authority
Ascertain investible surplus for HDMC has been discussed in the investible surplus section.
The sub section 20.5 has provided the details.
Task5
Step9 Ascertain combined investible surplus CFP Version II
Not Applicable Not Applicable
Step10 Component-wise allocation of combined investible surplus
Not Applicable Not Applicable
Task6
Step11 Listing of Project Proposals – linkage to CDP
The priority project as identified in the CIP section has been linked with the FOP. Further, HDMC investment capacity has been tested on various scenarios.
Chapter 19 has detailed out the CIP for HDMC.
Step12 Priorities Project Investments
The priority project investment has been finalized in the CIP section further it has been linked with the financial model for the city.

Ministry of Urban Development
[236]] Draft City Development Plan – Hubli-Dharwad
Task Step Key Stages Description Remarks
Task7 Step13 Preparation of draft CFP --- CFP Version III & Financial Plan report (prioritized project investment loaded on combined investible surplus)
The current chapter has detailed out the overall financial plan for the city under various scenarios.
Sector plans and capital investment plan chapter detailed out the CIP for HDMC.
Task8 Step14 Ascertain source and amount of funding, external borrowing, debt servicing mechanism, etc.
Under the improved investment capacity with grant plus debt support, we have tested the capacity of HDMC to go for debt and external borrowing.
The sub section 20.8 has provided the details.
Task9 Step15 CFP Appraisal and Public Verification
We shall present the findings to the stakeholder during the final city level workshop and accordingly we shall take the suggestions on the overall financial plan for the city.
This section would be presented in the final CDP.
Task10
Step16 Finalization of CFP report
Post completion of final city level workshop, we shall discuss with HDMC officials and finalize the financial plan for the city
Task10
Step17 Annual revision of CFP (linkage to annual capital investment and improvements achieved)
We will suggest this step in the way forward section in the final CDP.
18.3 Financing Strategies for CIP
The project funding structure comprises grants under the New Urban Renewal Mission14
(accounting
for 70% of the funding as per JNNURM-I structure has been assumed); internal surplus and debt are
considered to meet the balance fund requirement. The level of investment that HDMC can sustain is
determined by studying the overall surpluses/year-to-year opening balance and debt-service
coverage ratio (DSCR).
If DSCR (amount of surplus available to pay interest and to repay principal that is due) falls below
1.25 (i.e., less than 25% cushion), then the investments are reduced gradually till DSCR exceeds 1.25
in all the years in the forecast period. The main items of income and expenditure, classified into the
14
Based on the past trends, it is assumed the funding structure would remain same as it was in the JNNURM 1; the revised funding structure is yet to be announced by the ministry.
Ministry of Urban Development
[237]] Draft City Development Plan – Hubli-Dharwad
revenue account and the capital account, are projected in the FOP under the following categories.
Categories of FOP Projections are as follows.
Revenue Account Receipts:
Taxes, Non-Tax Sources, and
Grants, Contribution, and Subsidies Revenue Account Expenditure:
Establishment
Operation and Maintenance
Debt Servicing - Existing and New Loans
Phasing of Non-debt Liabilities, and
Additional O&M for New Assets Created Capital Income
New Urban Renewal Mission Capital Grants
Regular State or Central Grants
Debt
Capital Expenditure
In determining a long-term financial strategy, HDMC plans to raise resources and fund the CIP
through:
Grants available under the New Urban Renewal Mission framework (as percentage of
investment proposed in urban infrastructure sectors – (50% Central Government Grants and
20 % State Governments Grants)
Available internal resources and improving the same through
Revision of the property taxation at certain levels by HDMC and also improving the
coverage and collection
Revision of sewerage charges at specific defined intervals and also improving the
coverage and collection
Maintenance of the collection performance of taxes and charges at certain minimum
levels for current and for arrears
Borrowings
18.3.1 Financial Projections
Current revenue sources are projected under built-in growth assumptions for income and expenditure
items, to assess the impact of each such revenue enhancement measure being suggested. The
projections also aim at estimating the surplus that will be available for servicing new debt. Part of the
surplus, after meeting the additional O&M expenses on newly created assets and infrastructure, is
translated into debt size and project size (grant component plus debt component) based on certain
assumptions regarding interest rate, repayment method, and loan-grant mix.
A spread sheet FOP model has been customized to depict the financial position of HDMC. The
investment sustaining capacity of HDMC is assessed based on the FOP assumptions. The model was
used to calculate the overall surpluses under various scenarios involving combinations of internal
revenue improvement, state support, financing terms, etc.
The standard assumptions under which the projections are carried out and certain expenditure control
and revenue augmentation measures proposed in line with the mandatory and optional reforms under
the JNNURM framework are presented below.
18.4 Investment Sustenance Capacity

Ministry of Urban Development
[238]] Draft City Development Plan – Hubli-Dharwad
Given the existing financial position of HDMC, the revenue and capital accounts of HDMC are
projected against the growth scenario. The FOP is generated from the sustainable investment point of
view in line with the current growth trends against the identified investment. It has been estimated that
HDMC would require about Rs. 1846 15
crores to improve the infrastructure for meeting the current gap
and medium-term requirement. In order to check the financial capacity of HDMC, following
assumptions have been considered.
18.4.1 Key Assumptions
Table 121: Key assumptions
Head Assumptions
Guiding factor for assessing the sustaining capacity
Surplus Positive surplus - year-on-year basis
DSCR Greater than 1.25
Project Financing – For Admissible Components under New Urban Mission
Project Costing Unit Cost, with 7% price contingency and 8% physical contingency
New/Additional O&M
Water Supply 3%
Sewerage and Sanitation 5%
Urban Roads, Traffic and Transport 4%
Storm Water Drains 1%
Solid Waste Management 10%
BSUP 2%
Urban Environment 1%
Social Infrastructure 1%
For projects to be approved under New Urban Renewal Mission
Grant from GoI 50% of sanctioned cost
Grant from GoK 20% of sanctioned cost
Loan for balance funding Repayment in 15 years @11% interest rate
Regular capital expenditure
Rs. 58 crores per annum (growth rate 3% over current expenditure)
Revenue Expenditure
Growth in Expenditure
Minimum growth rate: 8%
Maximum growth rate: 10%
Pay Commission Revision
7th Pay Commission revision from 2016 and 2022 (Currently, in HDMC, the salaries are being paid from State treasuries i.e.)
Assumption for assessment of HDMC’s sustainability
Income Items
Growth in revenue income Minimum growth rate: 8%
Maximum growth rate: 12%
Income items - Property tax
Annual growth in Assessment 1.75% per annum
Revision of Tax 10% every year starting from 2015-16
Collection Performance 80% (Maximum collection performance over the last 5 years)
15
Overall the investment required for the year 2021 is Rs 3589 crores. However, HDMC would be responsible to take-up the projects worth Rs 1846 crores and the remaining investment to be taken-up by the Parastatals/state government departments. Therefore, the financial operating plan has been prepared for HDMC with an estimated investment for Rs 1846 crores.
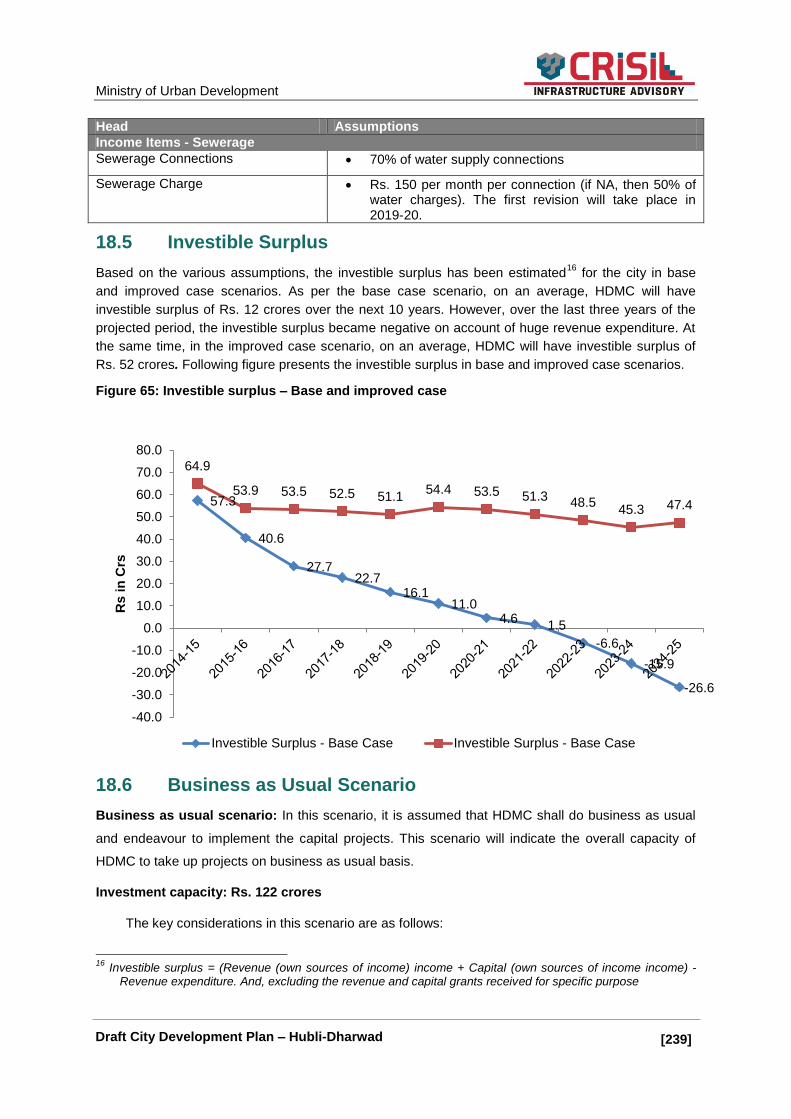
Ministry of Urban Development
[239]] Draft City Development Plan – Hubli-Dharwad
Head Assumptions
Income Items - Sewerage
Sewerage Connections 70% of water supply connections
Sewerage Charge Rs. 150 per month per connection (if NA, then 50% of water charges). The first revision will take place in 2019-20.
18.5 Investible Surplus
Based on the various assumptions, the investible surplus has been estimated16
for the city in base
and improved case scenarios. As per the base case scenario, on an average, HDMC will have
investible surplus of Rs. 12 crores over the next 10 years. However, over the last three years of the
projected period, the investible surplus became negative on account of huge revenue expenditure. At
the same time, in the improved case scenario, on an average, HDMC will have investible surplus of
Rs. 52 crores. Following figure presents the investible surplus in base and improved case scenarios.
Figure 65: Investible surplus – Base and improved case
18.6 Business as Usual Scenario
Business as usual scenario: In this scenario, it is assumed that HDMC shall do business as usual
and endeavour to implement the capital projects. This scenario will indicate the overall capacity of
HDMC to take up projects on business as usual basis.
Investment capacity: Rs. 122 crores
The key considerations in this scenario are as follows:
16
Investible surplus = (Revenue (own sources of income) income + Capital (own sources of income income) - Revenue expenditure. And, excluding the revenue and capital grants received for specific purpose
57.3
40.6
27.7 22.7
16.1 11.0
4.6 1.5
-6.6
-15.9
-26.6
64.9
53.9 53.5 52.5 51.1 54.4 53.5 51.3 48.5
45.3 47.4
-40.0
-30.0
-20.0
-10.0
0.0
10.0
20.0
30.0
40.0
50.0
60.0
70.0
80.0
Rs i
n C
rs
Investible Surplus - Base Case Investible Surplus - Base Case

Ministry of Urban Development
[240]] Draft City Development Plan – Hubli-Dharwad
Property Tax
On immediate basis, reforms are to
be implemented in property tax to
improve the coverage and
collection efficiency
State government should revise the
property tax rate
the property tax rate should be
increased about 10% every three
years
Identified the poor performing zone
in term of recovery of arrears
Restructure the property tax
department
HDMC will not take up any reform measures to improve the revenues.
The income and expenditure growth would follow the past trends.
The regular capital expenditure would grow at 3% on year-on-year basis.
HDMC should maintain the minimum closing balance of Rs 10 Crores on regular basis
Table 122: FoP- Business as usual scenario
18.7 Improved Case Scenario – Reforms Implementation
In this scenario, it is assumed that HDMC shall take up revenue improvement measures such as
property tax and sewerage charge coverage and collection efficiency improvement. Further, it is
assumed that HDMC shall receive capital grants from
the state and central governments (from New Urban
Renewal Mission). HDMC shall endeavour to implement
the capital projects. This scenario will indicate the overall
capacity of HDMC to take up projects on improved case
scenario with grant support.
Investment Capacity: Rs. 878 crores
The key considerations in this scenario are as follows:
HDMC is going to undertake reforms leading to
improved financial sustenance capacity.
The reforms are especially in the areas of
property tax and sewerage and swm charges.
HDMC shall receive grant from the state and
central governments for the approved projects
(New Urban Renewal Mission).
The regular capital expenditure would grow at 3% on year-on-year basis.
HDMC should maintain the minimum closing balance of Rs 10 Crores on regular basis.
Financial Year ------> 2009-10 2010-11 2011-12 2012-13 2013-14 2014-15 2015-16 2016-17 2017-18 2018-19 2019-20 2020-21 2021-22 2022-23 2023-24 2024-25
Figures in Rs. Lakhs
Summary
Opening Balance 1,981 2,278 2,402 4,879 4,879 8,118 12,100 13,511 13,568 12,524 11,213 9,406 8,234 6,611 5,911 4,583
1 Revenue Income 14,399 14,140 15,892 17,872 19,295 21,283 23,165 23,995 25,628 27,387 29,282 31,307 33,503 35,877 38,437 41,198
2 Revenue Expenditure 11,909 12,802 12,335 12,625 13,835 15,163 18,713 20,568 22,587 24,786 27,188 29,815 32,583 35,737 39,198 42,995
a Surplus/Deficit- Revenue Account 2,490 1,338 3,557 5,247 5,460 6,121 4,452 3,427 3,041 2,601 2,094 1,492 919 140 (760) (1,797)
b Operating Ratio 0.83 0.91 0.78 0.71 0.72 0.71 0.81 0.86 0.88 0.91 0.93 0.95 0.97 1.00 1.02 1.04
c Debt Servicing Ratio 1.2% 0.9% 0.7% 0.0% 0.0% 0.0% 0.0% 0.0% 0.0% 0.0% 0.0% 0.0% 0.0% 0.0% 0.0% 0.0%
d Investible Surplus 2490 1338 3557 5247 5460 6121 4452 3427 3041 2601 2094 1492 919 140 (760) (1797)
3 Capital Income 5,344 2,636 2,033 2,745 2,964 3,202 3,458 3,734 4,033 4,356 4,704 5,080 5,487 5,926 6,400 6,912
4 Capital Expenditure 7,912 3,771 3,641 5,034 5,185 5,340 6,498 7,104 8,117 8,267 8,606 7,744 8,030 6,765 6,968 7,177
d Surplus/Deficit- Capital Account (2,568) (1,135) (1,608) (2,289) (2,220) (2,139) (3,041) (3,370) (4,084) (3,912) (3,901) (2,664) (2,543) (839) (568) (265)
e Overall Surplus/Deficit- Municipal Account 297 124 2,477 2,958 3,240 3,982 1,411 57 (1,044) (1,311) (1,808) (1,171) (1,624) (699) (1,328) (2,062)
f Closing Balance 2,278 2,402 4,879 7,837 8,118 12,100 13,511 13,568 12,524 11,213 9,406 8,234 6,611 5,911 4,583 2,521
Actuals Projection
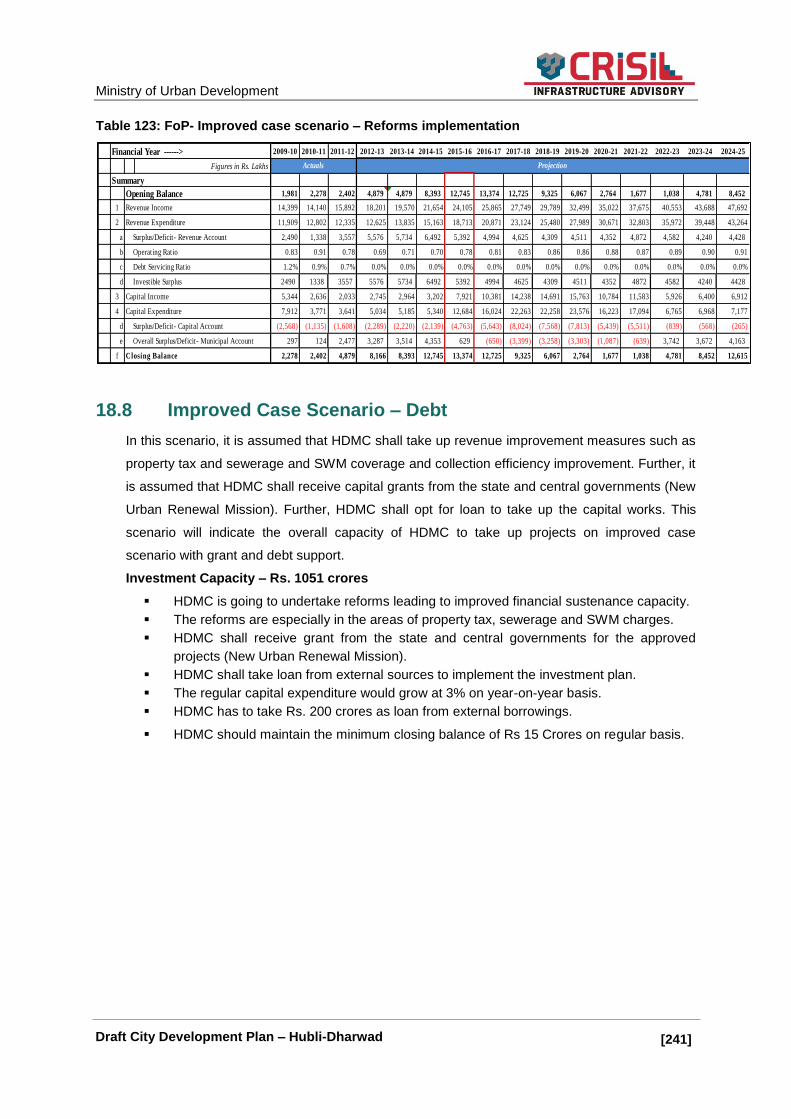
Ministry of Urban Development
[241]] Draft City Development Plan – Hubli-Dharwad
Table 123: FoP- Improved case scenario – Reforms implementation
18.8 Improved Case Scenario – Debt
In this scenario, it is assumed that HDMC shall take up revenue improvement measures such as
property tax and sewerage and SWM coverage and collection efficiency improvement. Further, it
is assumed that HDMC shall receive capital grants from the state and central governments (New
Urban Renewal Mission). Further, HDMC shall opt for loan to take up the capital works. This
scenario will indicate the overall capacity of HDMC to take up projects on improved case
scenario with grant and debt support.
Investment Capacity – Rs. 1051 crores
HDMC is going to undertake reforms leading to improved financial sustenance capacity.
The reforms are especially in the areas of property tax, sewerage and SWM charges.
HDMC shall receive grant from the state and central governments for the approved
projects (New Urban Renewal Mission).
HDMC shall take loan from external sources to implement the investment plan.
The regular capital expenditure would grow at 3% on year-on-year basis.
HDMC has to take Rs. 200 crores as loan from external borrowings.
HDMC should maintain the minimum closing balance of Rs 15 Crores on regular basis.
Financial Year ------> 2009-10 2010-11 2011-12 2012-13 2013-14 2014-15 2015-16 2016-17 2017-18 2018-19 2019-20 2020-21 2021-22 2022-23 2023-24 2024-25
Figures in Rs. Lakhs
Summary
Opening Balance 1,981 2,278 2,402 4,879 4,879 8,393 12,745 13,374 12,725 9,325 6,067 2,764 1,677 1,038 4,781 8,452
1 Revenue Income 14,399 14,140 15,892 18,201 19,570 21,654 24,105 25,865 27,749 29,789 32,499 35,022 37,675 40,553 43,688 47,692
2 Revenue Expenditure 11,909 12,802 12,335 12,625 13,835 15,163 18,713 20,871 23,124 25,480 27,989 30,671 32,803 35,972 39,448 43,264
a Surplus/Deficit- Revenue Account 2,490 1,338 3,557 5,576 5,734 6,492 5,392 4,994 4,625 4,309 4,511 4,352 4,872 4,582 4,240 4,428
b Operating Ratio 0.83 0.91 0.78 0.69 0.71 0.70 0.78 0.81 0.83 0.86 0.86 0.88 0.87 0.89 0.90 0.91
c Debt Servicing Ratio 1.2% 0.9% 0.7% 0.0% 0.0% 0.0% 0.0% 0.0% 0.0% 0.0% 0.0% 0.0% 0.0% 0.0% 0.0% 0.0%
d Investible Surplus 2490 1338 3557 5576 5734 6492 5392 4994 4625 4309 4511 4352 4872 4582 4240 4428
3 Capital Income 5,344 2,636 2,033 2,745 2,964 3,202 7,921 10,381 14,238 14,691 15,763 10,784 11,583 5,926 6,400 6,912
4 Capital Expenditure 7,912 3,771 3,641 5,034 5,185 5,340 12,684 16,024 22,263 22,258 23,576 16,223 17,094 6,765 6,968 7,177
d Surplus/Deficit- Capital Account (2,568) (1,135) (1,608) (2,289) (2,220) (2,139) (4,763) (5,643) (8,024) (7,568) (7,813) (5,439) (5,511) (839) (568) (265)
e Overall Surplus/Deficit- Municipal Account 297 124 2,477 3,287 3,514 4,353 629 (650) (3,399) (3,258) (3,303) (1,087) (639) 3,742 3,672 4,163
f Closing Balance 2,278 2,402 4,879 8,166 8,393 12,745 13,374 12,725 9,325 6,067 2,764 1,677 1,038 4,781 8,452 12,615
Actuals Projection
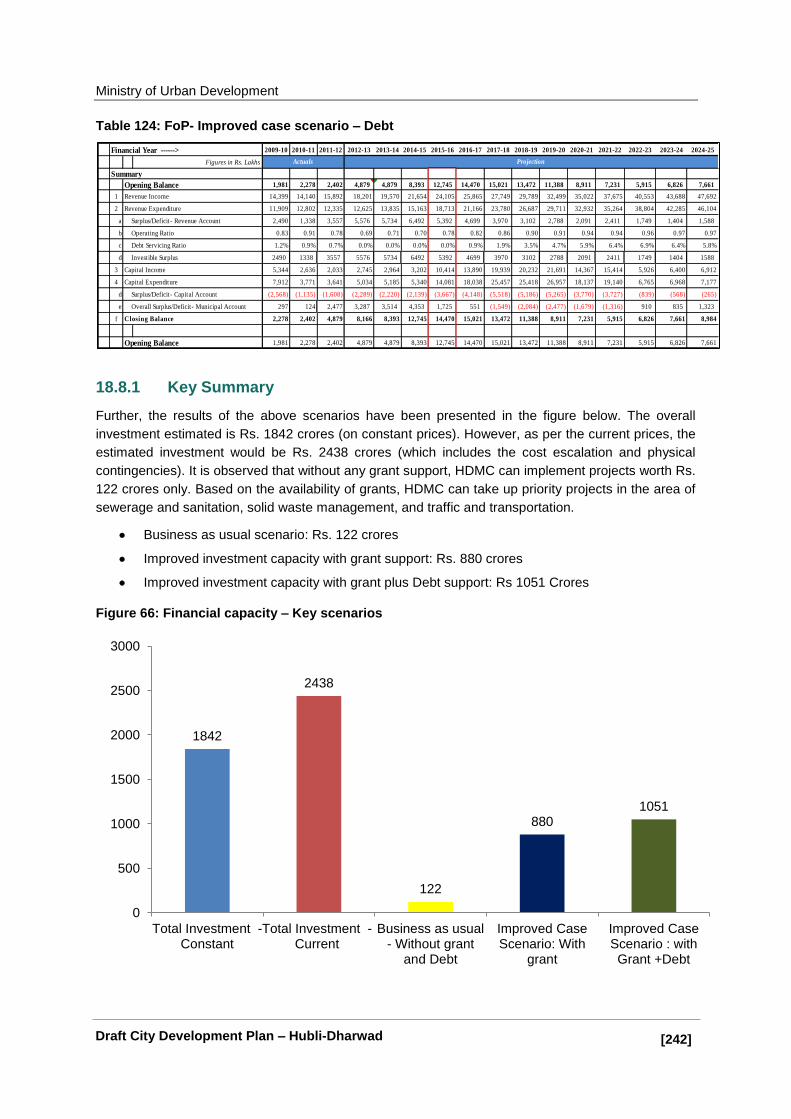
Ministry of Urban Development
[242]] Draft City Development Plan – Hubli-Dharwad
Table 124: FoP- Improved case scenario – Debt
18.8.1 Key Summary
Further, the results of the above scenarios have been presented in the figure below. The overall
investment estimated is Rs. 1842 crores (on constant prices). However, as per the current prices, the
estimated investment would be Rs. 2438 crores (which includes the cost escalation and physical
contingencies). It is observed that without any grant support, HDMC can implement projects worth Rs.
122 crores only. Based on the availability of grants, HDMC can take up priority projects in the area of
sewerage and sanitation, solid waste management, and traffic and transportation.
Business as usual scenario: Rs. 122 crores
Improved investment capacity with grant support: Rs. 880 crores
Improved investment capacity with grant plus Debt support: Rs 1051 Crores
Figure 66: Financial capacity – Key scenarios
Financial Year ------> 2009-10 2010-11 2011-12 2012-13 2013-14 2014-15 2015-16 2016-17 2017-18 2018-19 2019-20 2020-21 2021-22 2022-23 2023-24 2024-25
Figures in Rs. Lakhs
Summary
Opening Balance 1,981 2,278 2,402 4,879 4,879 8,393 12,745 14,470 15,021 13,472 11,388 8,911 7,231 5,915 6,826 7,661
1 Revenue Income 14,399 14,140 15,892 18,201 19,570 21,654 24,105 25,865 27,749 29,789 32,499 35,022 37,675 40,553 43,688 47,692
2 Revenue Expenditure 11,909 12,802 12,335 12,625 13,835 15,163 18,713 21,166 23,780 26,687 29,711 32,932 35,264 38,804 42,285 46,104
a Surplus/Deficit- Revenue Account 2,490 1,338 3,557 5,576 5,734 6,492 5,392 4,699 3,970 3,102 2,788 2,091 2,411 1,749 1,404 1,588
b Operating Ratio 0.83 0.91 0.78 0.69 0.71 0.70 0.78 0.82 0.86 0.90 0.91 0.94 0.94 0.96 0.97 0.97
c Debt Servicing Ratio 1.2% 0.9% 0.7% 0.0% 0.0% 0.0% 0.0% 0.9% 1.9% 3.5% 4.7% 5.9% 6.4% 6.9% 6.4% 5.8%
d Investible Surplus 2490 1338 3557 5576 5734 6492 5392 4699 3970 3102 2788 2091 2411 1749 1404 1588
3 Capital Income 5,344 2,636 2,033 2,745 2,964 3,202 10,414 13,890 19,939 20,232 21,691 14,367 15,414 5,926 6,400 6,912
4 Capital Expenditure 7,912 3,771 3,641 5,034 5,185 5,340 14,081 18,038 25,457 25,418 26,957 18,137 19,140 6,765 6,968 7,177
d Surplus/Deficit- Capital Account (2,568) (1,135) (1,608) (2,289) (2,220) (2,139) (3,667) (4,148) (5,518) (5,186) (5,265) (3,770) (3,727) (839) (568) (265)
e Overall Surplus/Deficit- Municipal Account 297 124 2,477 3,287 3,514 4,353 1,725 551 (1,549) (2,084) (2,477) (1,679) (1,316) 910 835 1,323
f Closing Balance 2,278 2,402 4,879 8,166 8,393 12,745 14,470 15,021 13,472 11,388 8,911 7,231 5,915 6,826 7,661 8,984
Opening Balance 1,981 2,278 2,402 4,879 4,879 8,393 12,745 14,470 15,021 13,472 11,388 8,911 7,231 5,915 6,826 7,661
Actuals Projection
1842
2438
122
880 1051
0
500
1000
1500
2000
2500
3000
Total Investment -Constant
Total Investment -Current
Business as usual- Without grant
and Debt
Improved CaseScenario: With
grant
Improved CaseScenario : withGrant +Debt

Ministry of Urban Development
[243]] Draft City Development Plan – Hubli-Dharwad
18.9 Revenue Enhancement Initiatives
Property tax, sewerage charges, and development charges are the key own sources of revenues of
HDMC. These revenues are performing within the range and account for 26% of the total revenue
income. However, there is scope for further improvement of these revenues in order to enhance the
overall sustainability of HDMC. Following sections describe the revenue enchantment measures for
key revenue sources such as property tax and water charges.
1. Property tax: The revenue enhancement measures for property tax are categorised into the
following four categories:
a) Policy-level interventions:
The property tax rate is revised by the state government every five years. Hence, it is
suggested to change the rate in every three years. Also, the system should be developed
in such a way that the changes should be reflected in the demand bills without any human
intervention.
It is also suggested that the property tax rate should be increased about 10-15% every
three years.
it is suggested that the state government should amend the municipal laws if required to
enhance the percentage of water and other tax rates. For instance, as per the existing
municipal laws, HDMC can only levy 5% as water charges. However, this can be
enhanced to 10% by considering the huge capital works to be taken up by HDMC in near
future.
The state government should take appropriate steps for the revision and accordingly
implement the same to enhance the revenues.
b) Recovery of arrears
Identified the poor performing zone in term of recovery of arrears
Prepared the list of defaulters with outstanding arrears <=Rs 10,000
Prepared the action plan to issue of warrant notices
Carried out daily the monitoring of each tasks
The recovery staff provide the sample warrant notices to defaulters
c) Revision of tax calendar
Preparation of tax demand bills latest by 30th April 2015
During 1st to 31st May 2015, all the tax demand bills must be served by using Indian
postal service or courier services etc.
30 days grace period should be given for demand bills served from 1st to 30th June 2015.
Necessary changes should be made in tax software and pre-printed stationery to show the
per day penal interest.
The collection counters should be opened at as many places across the city.
As soon as grace period ends, the ward-wise list of tax defaulter along with the demand
notice should be made available.
With rationalization of the tax calendar, various tax processes and reduction in the work
load of tax personnel; it will be possible to do work division of personnel.
In the light of above, daily targets should be provided to each team working in the tax
administration.
Monitoring of the targets vs. actual should be carried out.
d) Restructuring of Property Tax Department
The proposed structure is based on a functional-cum-geographical approach.

Ministry of Urban Development
[244]] Draft City Development Plan – Hubli-Dharwad
Expenditure
HDMC should ensure that the
contractor carries out the O&M of
the assets (STP, and SWM plant)
for a period of 5-8 years after the
completion of test run.
HDMC should curtail the regular
capital expenditure over the next 5-
10 years. HDMC should take up
only priority works in wards
Explore the outsourcing option
wherever possible
The proposed structure clearly identifies four main functions: assessment, billing and
collection, appellate, and vigilance.
The four functions are to be managed independently by different senior officers.
2. Sewerage Charges: The revenue enhancement measures for Sewerage charges are broadly
categorised into the following four categories:
HDMC should undertake the following initiatives for sewerage charges:
o Introduction of sewerage charges from the year 2015-16
o It is proposed Rs 150 as monthly flat tariff for sewerage charges
o Increase the sewerage charges in every three years
o Improve billing and collection efficiency
O&M recovery
o The first step in implementing user charge reform is to understand the real costs of
operation and maintenance for each service.
o HDMC should ring-fence all the related costs pertaining to a specific service with
clear demarcation in capital and revenue accounts.
o This permits the identification of the real costs for O&M so that the unit costs, which
need to be recovered from the users, can be assessed for the respective service.
3. SWM- Conservancy cess: In order to meet the O&M expenditure in SWM sector, it is proposed
introduce the SWM cess as part of holding tax (necessary amendments to be made in the act if
required):
HDMC should undertake the following initiatives for SWM cess:
o Introduction of SWM cess from the year 2015-16
o It is proposed that 10% of property tax to be levied as SWM cess
o Increase the percentage of SWM cess in every three years
18.10 Expenditure Management Initiatives
Over the review period, the revenue and capital expenditure of HDMC has increased. In order to
reduce the revenue and capital expenditure at HDMC, following key initiatives are to be taken up.
Reduction in establishment expenditure
Outsourcing of certain functions: HDMC should explore outsourcing of some functions in
order to reduce the establishment expenditure.
For instance, HDMC can outsource the collection,
transportation, and treatment of SWM. In addition,
maintenance of public toilets, parks, and other play
grounds on outsourcing basis.
Moreover, HDMC can outsource the clerical posts
such as data entry operator and clerks to reduce
the establishment cost.
Reduction in capital expenditure
HDMC is implementing the capital works on a
regular basis.
Overall, this would be a burden for HDMC. In near
future, if HDMC wants to take up the projects on
Central funding, then it would be difficult to fund the
projects.
Ministry of Urban Development
[245]] Draft City Development Plan – Hubli-Dharwad
Therefore, HDMC has to curtail the regular capital expenditure (say 10%); at the same time,
HDMC should take up priority projects only.
Also, HDMC should focus on projects to be implemented through central/state funding.
18.11 Asset Management Initiatives
The establishment of linkage between the asset creation and asset management should be through a
series of reforms for project sustainability. HDMC should ensure adequate funds to meet the
deficiencies in urban infrastructural services.
In order to maintain the assets over the project cycle, HDMC should allocate 5-10% of funds for
operation and maintenance of the project components. For sewerage related projects, the O&M cost
would be 3% of the project cost, and this would be on a recurring basis.
Deprecation account/fund
HDMC should ideally practice to maintain the depreciation account in order to replace the existing
asset with a new asset post its life cycle.
Key steps to be taken by HDMC for better management of assets
HDMC should focus on department wise budget and O&M cost for newly created assets,
Explore the best practice to reduce the O&M cost on sewerage and solid waste management
Study the existing status of the assets of key sectors, prepare a tangible action plan for the
maintenance of assets, provide the replacement list for the assets
Conduct workshops/trainings for the staff on management of O&M, best practices across the
states
Organize study tours for the staff and elected representatives for effective implementation of
reforms for full O&M recovery
Latest techniques and technology for management (inventory, maintenance cycle,
replacement time, etc.) of municipal assets.
Conduct trainings in the area of sewerage, asset management, new techniques in operation
and maintenance of STPs, and maintaining the power factors during the peak time
18.12 Financial Management Initiatives
In order to implement the identified projects over the project cycle, HDMC has to take-up the financial
management initiatives for smooth implementation of the projects. The key initiatives are as follows.
First and foremost, the accounts department of HDMC should maintain the separate account for
the projects. The financial transactions such as deposit the grants and release the payments
should be carried out thorough the project account.
Transfer the part of the revenue surplus (own source of revenues) to the project account to
implement the project
Internal audit of the project accounts has to be carried out on quarterly basis
External audit has to be carried on annual basis
18.13 Projects on PPP basis
HDMC may explore the PPP route in the following projects. The details of each component have been
provided in the table below.
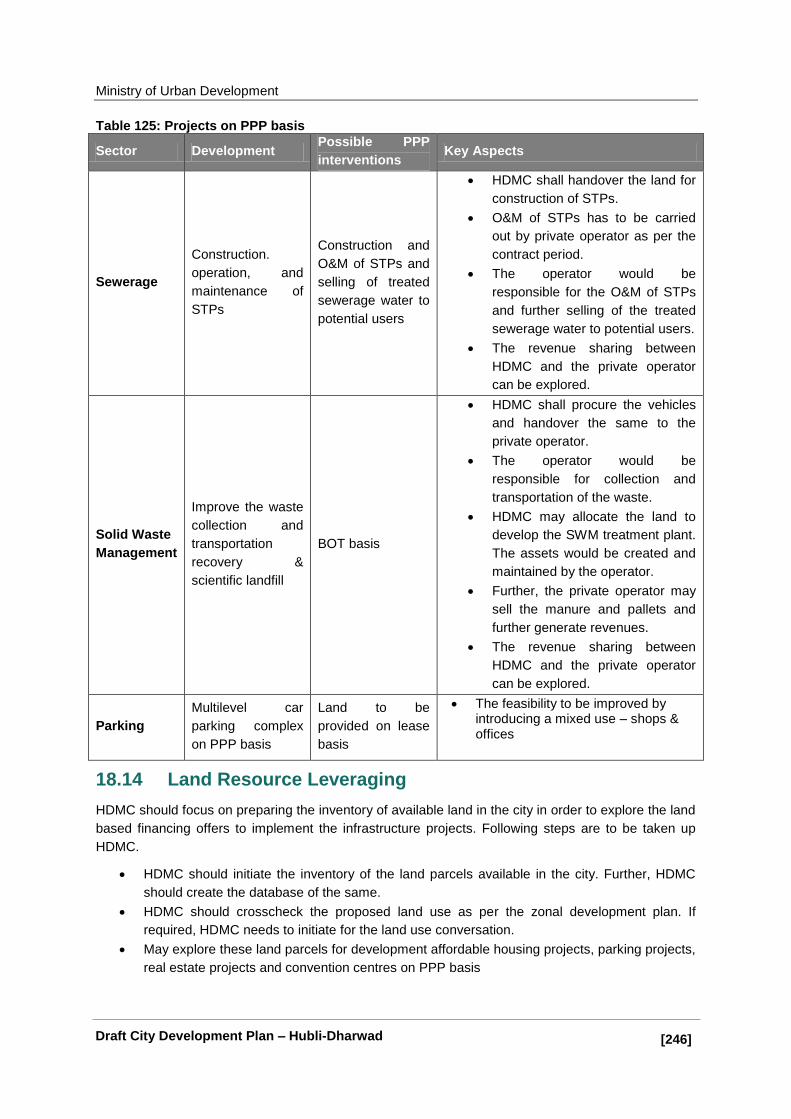
Ministry of Urban Development
[246]] Draft City Development Plan – Hubli-Dharwad
Table 125: Projects on PPP basis
Sector Development Possible PPP
interventions Key Aspects
Sewerage
Construction.
operation, and
maintenance of
STPs
Construction and
O&M of STPs and
selling of treated
sewerage water to
potential users
HDMC shall handover the land for
construction of STPs.
O&M of STPs has to be carried
out by private operator as per the
contract period.
The operator would be
responsible for the O&M of STPs
and further selling of the treated
sewerage water to potential users.
The revenue sharing between
HDMC and the private operator
can be explored.
Solid Waste
Management
Improve the waste
collection and
transportation
recovery &
scientific landfill
BOT basis
HDMC shall procure the vehicles
and handover the same to the
private operator.
The operator would be
responsible for collection and
transportation of the waste.
HDMC may allocate the land to
develop the SWM treatment plant.
The assets would be created and
maintained by the operator.
Further, the private operator may
sell the manure and pallets and
further generate revenues.
The revenue sharing between
HDMC and the private operator
can be explored.
Parking
Multilevel car
parking complex
on PPP basis
Land to be
provided on lease
basis
The feasibility to be improved by introducing a mixed use – shops & offices
18.14 Land Resource Leveraging
HDMC should focus on preparing the inventory of available land in the city in order to explore the land
based financing offers to implement the infrastructure projects. Following steps are to be taken up
HDMC.
HDMC should initiate the inventory of the land parcels available in the city. Further, HDMC
should create the database of the same.
HDMC should crosscheck the proposed land use as per the zonal development plan. If
required, HDMC needs to initiate for the land use conversation.
May explore these land parcels for development affordable housing projects, parking projects,
real estate projects and convention centres on PPP basis
Ministry of Urban Development
[247]] Draft City Development Plan – Hubli-Dharwad
18.15 Key Conclusion
Overall, on short-term basis, HDMC requires around Rs. 1846 crores to improve the municipal
services in the city. However, as per the business as usual scenario, HDMC has the financial capacity
about Rs. 122 crores to take up the infrastructure projects.
Given the importance of Hubli Dharwad city in the north Karnataka region, it is very important to
improve the basic infrastructure facilities to attract the investment and industries in the city and further
to boost the economic development in the region.
Therefore, HDMC should aim to implement the improved case investment capacity (Rs. 880
crores) with grant support for state and central governments. Following key steps to be taken
by HDMC to achieve the improved case scenario investment:
Property Tax: On immediate basis, reforms are to be implemented in property tax to improve
the coverage and collection efficiency; the reforms could be policy levels change to streamline
the department.
Sewerage: sewerage tariff structure is to be revised immediately.
SWM Charges: HDMC should levy the user charges on SWM services – HDMC may explore
this initiative as part of property tax.
Establishment Expenditure: HDMC should explore the outsourcing of certain function to
reduce establishment expenditure.
O&M new assets: HDMC should ensure that the contractor carries out the O&M of the assets
(STP, and SWM plant) for a period of 5-8 years after the completion of test run.
Regular Capital works: HDMC should curtail the regular capital expenditure over the next 5-
10 years. HDMC should take up only priority works in wards.
PPP route: HDMC should explore the PPP route to implement either the projects or project
components.
Capacity Building: It is very important that HDMC should keep on imparting training to the
staff on various aspects starting from technical to managerial skills.
Study Tours: HDMC should organise study tours to know the best practices in the sectors
and also to understand the challenges faced by others cities in the implementation of projects
and reforms.
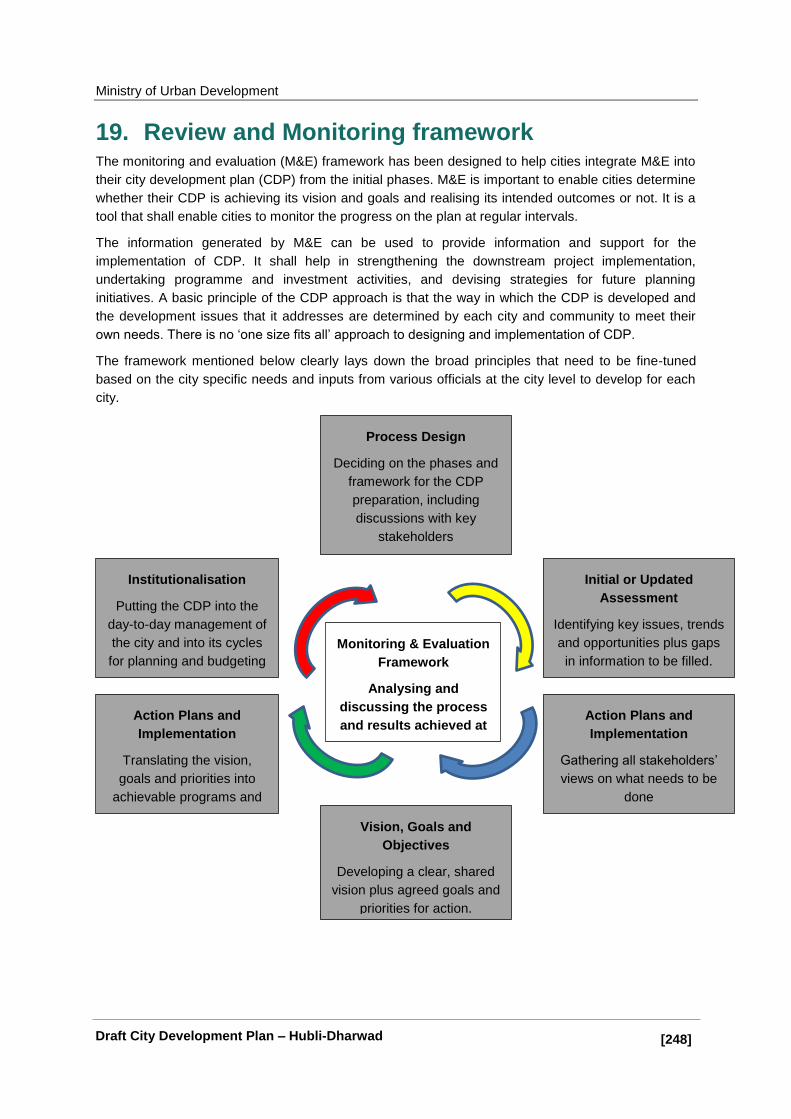
Ministry of Urban Development
[248]] Draft City Development Plan – Hubli-Dharwad
19. Review and Monitoring framework The monitoring and evaluation (M&E) framework has been designed to help cities integrate M&E into
their city development plan (CDP) from the initial phases. M&E is important to enable cities determine
whether their CDP is achieving its vision and goals and realising its intended outcomes or not. It is a
tool that shall enable cities to monitor the progress on the plan at regular intervals.
The information generated by M&E can be used to provide information and support for the
implementation of CDP. It shall help in strengthening the downstream project implementation,
undertaking programme and investment activities, and devising strategies for future planning
initiatives. A basic principle of the CDP approach is that the way in which the CDP is developed and
the development issues that it addresses are determined by each city and community to meet their
own needs. There is no ‗one size fits all‘ approach to designing and implementation of CDP.
The framework mentioned below clearly lays down the broad principles that need to be fine-tuned
based on the city specific needs and inputs from various officials at the city level to develop for each
city.
Process Design
Deciding on the phases and
framework for the CDP
preparation, including
discussions with key
stakeholders
Institutionalisation
Putting the CDP into the
day-to-day management of
the city and into its cycles
for planning and budgeting
Action Plans and
Implementation
Translating the vision,
goals and priorities into
achievable programs and
projects
Initial or Updated
Assessment
Identifying key issues, trends
and opportunities plus gaps
in information to be filled.
Action Plans and
Implementation
Gathering all stakeholders‘
views on what needs to be
done
Vision, Goals and
Objectives
Developing a clear, shared
vision plus agreed goals and
priorities for action.
Monitoring & Evaluation
Framework
Analysing and
discussing the process
and results achieved at
all stages
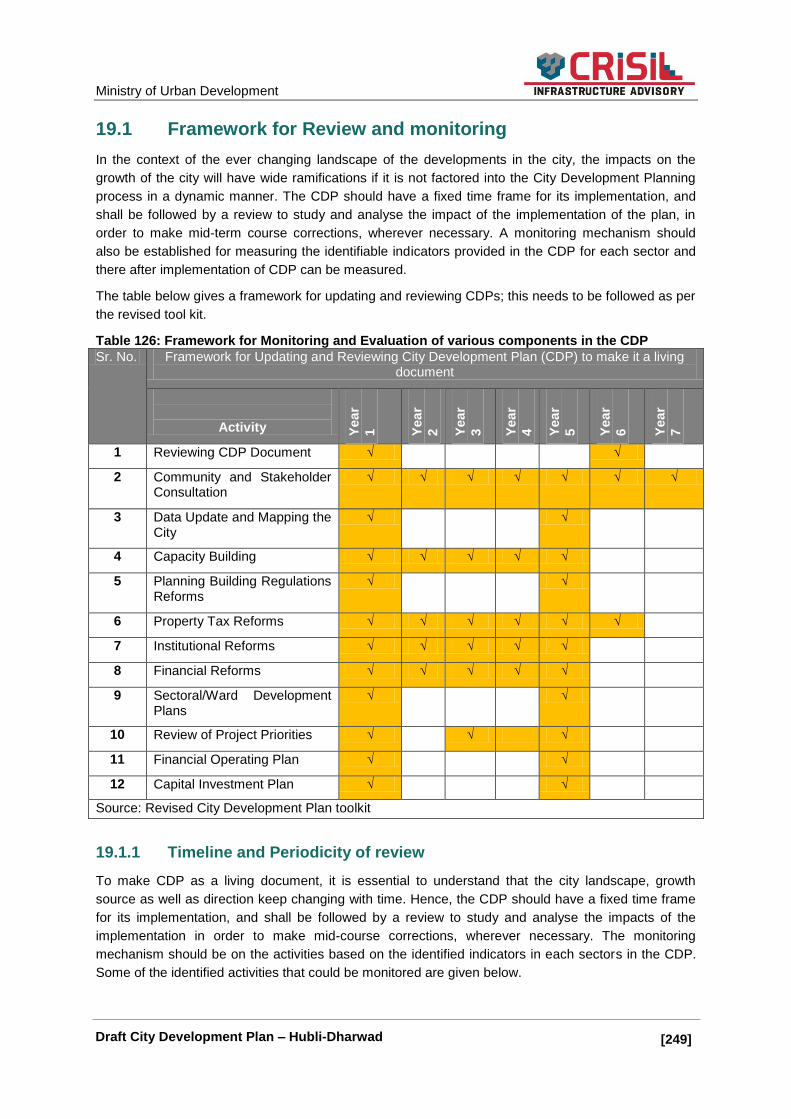
Ministry of Urban Development
[249]] Draft City Development Plan – Hubli-Dharwad
19.1 Framework for Review and monitoring
In the context of the ever changing landscape of the developments in the city, the impacts on the
growth of the city will have wide ramifications if it is not factored into the City Development Planning
process in a dynamic manner. The CDP should have a fixed time frame for its implementation, and
shall be followed by a review to study and analyse the impact of the implementation of the plan, in
order to make mid-term course corrections, wherever necessary. A monitoring mechanism should
also be established for measuring the identifiable indicators provided in the CDP for each sector and
there after implementation of CDP can be measured.
The table below gives a framework for updating and reviewing CDPs; this needs to be followed as per
the revised tool kit.
Table 126: Framework for Monitoring and Evaluation of various components in the CDP
Sr. No. Framework for Updating and Reviewing City Development Plan (CDP) to make it a living document
Activity Yea
r
1
Yea
r
2
Yea
r
3
Yea
r
4
Yea
r
5
Yea
r
6
Yea
r
7
1 Reviewing CDP Document √ √
2 Community and Stakeholder Consultation
√ √ √ √ √ √ √
3 Data Update and Mapping the City
√ √
4 Capacity Building √ √ √ √ √
5 Planning Building Regulations Reforms
√ √
6 Property Tax Reforms √ √ √ √ √ √
7 Institutional Reforms √ √ √ √ √
8 Financial Reforms √ √ √ √ √
9 Sectoral/Ward Development Plans
√ √
10 Review of Project Priorities √ √ √
11 Financial Operating Plan √ √
12 Capital Investment Plan √ √
Source: Revised City Development Plan toolkit
19.1.1 Timeline and Periodicity of review
To make CDP as a living document, it is essential to understand that the city landscape, growth
source as well as direction keep changing with time. Hence, the CDP should have a fixed time frame
for its implementation, and shall be followed by a review to study and analyse the impacts of the
implementation in order to make mid-course corrections, wherever necessary. The monitoring
mechanism should be on the activities based on the identified indicators in each sectors in the CDP.
Some of the identified activities that could be monitored are given below.

Ministry of Urban Development
[250]] Draft City Development Plan – Hubli-Dharwad
19.2 Reviewing of the CDP Document
The foremost thing that comes up is the reviewing of the CDP document. As the city‘s conditions may
change after few years, the CDP needs to be reviewed and evaluated after a particular time before a
new development plan is proposed. It is necessary to identify the sectors that are growing and sectors
that are lagging, to achieve the vision framed for the city. The CDP is prepared for a long term vision
for 30 years and the investment plan is prepared for a time frame for 7 years. Thus it mandatory that
review of the City Development Plan is taken up after every five years.
19.2.1 Engaging with Community and Stakeholders’ Consultation
CDP focuses on the holistic development and betterment of the city as looked upon by various
communities and stakeholders. Therefore, it is very important to keep consulting with them about the
process of the work to be undertaken to achieve the framed vision for the city. This could be done by
conducting a meeting every alternate year, i.e., once in every two years. The feedback should be
incorporated and the shared with citizens through a common platform like website etc.
19.2.2 Data Update and Mapping of the City
In case of any major changes in the city limits/boundaries, a complete data updation exercise should
be carried out for effective implementation. Therefore, data updates and mapping of the city become
very essential. This should always be done before the preparation of the CDP.
19.2.3 Capacity Building
Capacity building initiatives should focus on understanding the areas where in capacity needs to be
built in terms of project implementation, reform implementation etc. The regular assessment of the
needs can ensure better capacity building measures to be adopted by city.
19.3 Review and Monitoring of Reforms and Project
Implementation
The CDP Technical and Policy Committee should be involved in the monitoring and evaluation of
the CDP across various components.
19.3.1 Assessment of Reforms and Project Implementation
Regular assessment of reform and project implementation is necessary for the city to achieve its vision.
Reforms should be framed for all the institution responsible for the development process of any city. These reforms are very important for all the institution to work in a synchronized manner for the development of the city. Hence, they must be monitored every year.
19.3.2 Financial Reforms
Finance being a most important part for any ULB of the city. The funds are to be utilized according to the kind of development approach adopted to achieve the city vision. Therefore, financial reforms must be monitored and evaluated on yearly basis.

Ministry of Urban Development
[251]] Draft City Development Plan – Hubli-Dharwad
19.3.3 Property Tax Reforms
All the properties abiding under the ULB should be carefully mapped and marked, as it is an important source of revenue for a city. Hence it should be prepared before the implementation of the CDP and monitored at frequent intervals.
19.3.4 Sector /Ward Development Plans
Vision of the city could only be implemented at a macro level only if there is prominent change at the
micro level like at the ward level or the sectoral block level planning. To make a CDP document
comprehensive in approach, the M&E of these micro level plans should be evaluated at the very
beginning and impact should be reviewed in the very first year.
19.3.5 Review of the Project Priorities
The project prioritized in the CDP to achieve the vision may have to undergo changes in their priority
order once the implementation of the CDP starts. The reason may be due to any practical issues that
arise during project implementation or any other complication. Hence, it is very important to monitor
and evaluate the projects that are underway and projects that need to be taken up for the
development of the city. The updating process should be regular, but M&E should be done every
alternate year.
19.4 Monitoring of Financial Operating Plan and Capital
Investment Plan
A capital investment plan (CIP) provides a detailed understanding of anticipated investments into
tangible capital assets. The assets include basic facilities, services, and installations needed for the
functioning of the community, such as bridges, roads, water, and wastewater systems. This helps the
ULBs to formalize their priority setting and decision making process. Therefore, the M&E of CIP
should be done on regular basis every year.
A financial operating plan (FOP) outlines the revenues and expenses over a period of time. An FOP
uses past performances, incomes, and expenses to forecast what to expect in the following years. It
then incorporates the past and recent trends into the planning so as to most accurately forecast what
is to come. Therefore, for city development plan in a proper way, it is necessary to monitor and
evaluate the FOP regularly every year.
Ministry of Urban Development
[252]] Draft City Development Plan – Hubli-Dharwad
20. Bibliography
Census of India. (n.d.). 2001 Census data - A Census of India Website. Retrieved May 2014, from Census of India Web site.
Directorate of Economics and Statistics, planning Department, Government of Karnataka Pradesh. (2012-13). Economic Survey of Karnataka.
Hubli Dharwad Municipal Corporation (2009). City Development Strategy
Hubli Dharwad Urban Development Authority (2005), Comprehensive Development Plan for HDMC
Directorate Of Urban Land Transport (2010) Comprehensive traffic and transportation plan for Hubli Dharwad
National Skill Development Corporation (December 2013), District wise skill gap study for the
state of Karnataka (2012-17, 2017-22)
Ministry of Health and Family Welfare , Government of India (December 2011), Annual Report
to the people on health
Directorate of Municipal Administration Government of Karnataka (2012), City Sanitation Plan
for Hubli Dharwad
IIED Urban Climate Resilience: A review of the methodologies adopted under the ACCCRN
initiative in Indian cities,
Ministry of Urban Development (2014), Urban and Regional Development Plans Formulation
& Implementation Guidelines, 2014
Karnataka Slum Development Board (2013), Rajiv Awas Yojana (RAY) for Hubli Dharwad
Directorate Of Urban Land Transport (2013), Detailed Feasibility Report for BRTS corridor for
Hubli Dharwad
Karnataka Urban Infrastructure Development Finance Corporation (2009), North
Karnataka Urban Sector Investment Program (Tranche 2)—Hubli-Dharwad, DPR on
UGD system for Hubli Dharwad
Karnataka Urban Infrastructure Development Finance Corporation, World Bank
assisted Karnataka Urban Water Sector Improvement Project (KUWASIP) –
Experience on PPP for achieving 24X7 water Supply and control of UfW

Ministry of Urban Development
[253]] Draft City Development Plan – Hubli-Dharwad
21. Annexures
21.1 Technical and Policy committees

Ministry of Urban Development
[254]] Draft City Development Plan – Hubli-Dharwad

Ministry of Urban Development
[255]] Draft City Development Plan – Hubli-Dharwad

Ministry of Urban Development
[256]] Draft City Development Plan – Hubli-Dharwad
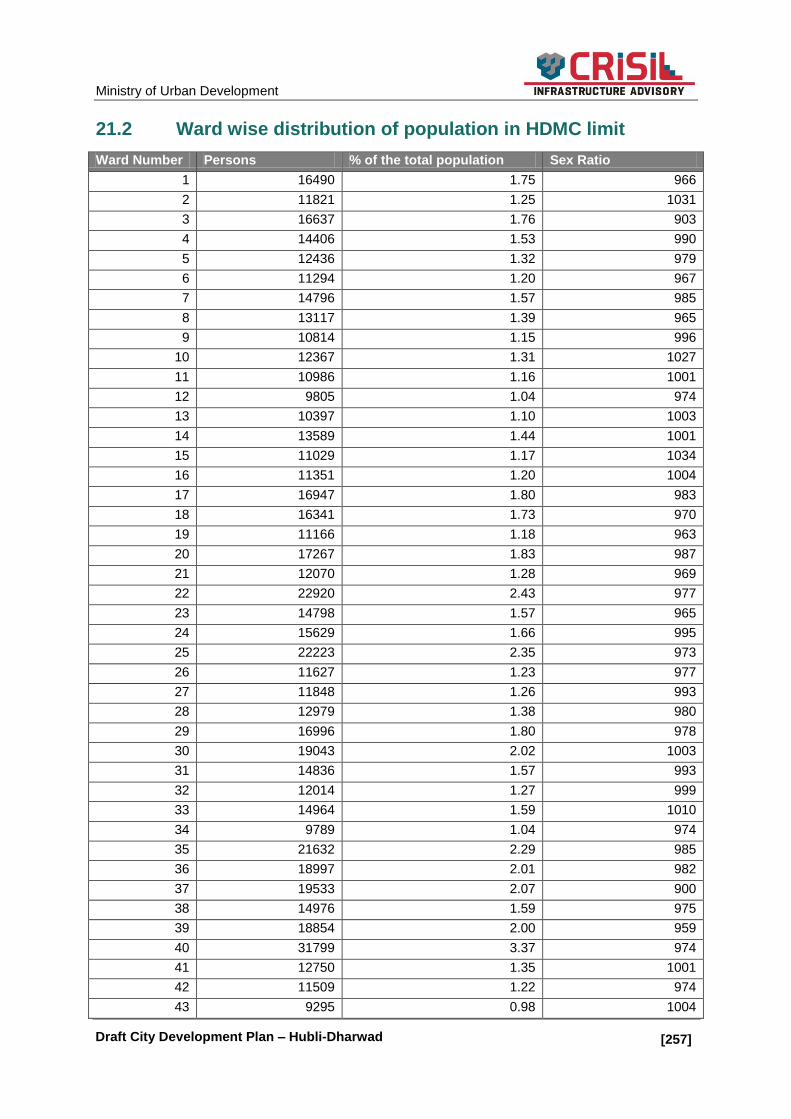
Ministry of Urban Development
[257]] Draft City Development Plan – Hubli-Dharwad
21.2 Ward wise distribution of population in HDMC limit
Ward Number Persons % of the total population Sex Ratio
1 16490 1.75 966
2 11821 1.25 1031
3 16637 1.76 903
4 14406 1.53 990
5 12436 1.32 979
6 11294 1.20 967
7 14796 1.57 985
8 13117 1.39 965
9 10814 1.15 996
10 12367 1.31 1027
11 10986 1.16 1001
12 9805 1.04 974
13 10397 1.10 1003
14 13589 1.44 1001
15 11029 1.17 1034
16 11351 1.20 1004
17 16947 1.80 983
18 16341 1.73 970
19 11166 1.18 963
20 17267 1.83 987
21 12070 1.28 969
22 22920 2.43 977
23 14798 1.57 965
24 15629 1.66 995
25 22223 2.35 973
26 11627 1.23 977
27 11848 1.26 993
28 12979 1.38 980
29 16996 1.80 978
30 19043 2.02 1003
31 14836 1.57 993
32 12014 1.27 999
33 14964 1.59 1010
34 9789 1.04 974
35 21632 2.29 985
36 18997 2.01 982
37 19533 2.07 900
38 14976 1.59 975
39 18854 2.00 959
40 31799 3.37 974
41 12750 1.35 1001
42 11509 1.22 974
43 9295 0.98 1004

Ministry of Urban Development
[258]] Draft City Development Plan – Hubli-Dharwad
Ward Number Persons % of the total population Sex Ratio
44 13673 1.45 981
45 10143 1.07 1025
46 8215 0.87 986
47 11941 1.27 1039
48 18235 1.93 986
49 6054 0.64 1005
50 19575 2.07 1013
51 10349 1.10 1043
52 9991 1.06 994
53 11134 1.18 997
54 11273 1.19 977
55 10938 1.16 946
56 10326 1.09 981
57 13866 1.47 1013
58 10770 1.14 990
59 14951 1.58 983
60 10967 1.16 951
61 11672 1.24 976
62 11068 1.17 992
63 15328 1.62 950
64 15577 1.65 957
65 23440 2.48 982
66 14330 1.52 961
67 15904 1.69 1019
Grand Total 943857 100.00 983
21.3 Ward wise Data
Table 127: Ward wise distribution of slums in Hubli-Dharwad
Sr.
No.
Ward
No
Slum Name Area
sq. Km
Slum
Status
Population
House
hold
1 1 Anjaneya Nagar 0.016 Nd 872 174
2 Bhavikatti plot 0.029 Nd 1206 232
3 Neharu nagar 0.069 Nd 3317 638
4 Shakti nagar Saptapur 0.016 Nd 0
5 Shivashakti nagar 0.018 Nd 1231 228
6 Behind Tapovan Slum area 0.013 Nd 313 54
7 Basav Nagar R.S.No. 116/1,116/2
Haliyal road
Non-Nd 1044 197
8 Patil Layout, R.S. No. 101, Haliyal
road
Non-Nd 275 53

Ministry of Urban Development
[259]] Draft City Development Plan – Hubli-Dharwad
Sr.
No.
Ward
No
Slum Name Area
sq. Km
Slum
Status
Population
House
hold
9 Shakti colony, R.S. No.25, Haliyal
road
Non-Nd 599 111
10 3 Adarsh badavane (arjant nagar)
Malligwad Road left side
Non-Nd 711 127
11 Basaveshwar nagar, Malligwad road
left side(Near Police headquarters)
Non-Nd 405 75
12 6 Haveri peth 0.022 Nd 6936 1196
13 Jirali plot, near Mahant nagar Non-Nd 371 70
14 7 Gollar colony 0.001 Nd 2491 470
15 8 Balajimath 0.028 Nd 1728 339
16 Dharwad Form, Hebballi road Non-Nd 832 160
17 9 Kolikeri area, Hosayallapur,
Navalur agasi
Non-Nd 1826 332
18 10
Hosayallapur 0.005 Nd 684 120
19 Madar oni, Hosayallapur Non-Nd 1182 219
20 11 Gavali galli 0.012 Nd 453 84
21 Kurubar Oni 0.012 Nd 1873 466
22 Mochi society 0.004 Nd 1109 188
23 13 Krupali nagar 0.001 Nd 1776 323
24 Saidapur 0.040 Nd 3024 560
25 Saidapur (Oppisite Mazid) 0.020 Nd 1372 259
26 14 Barakotri 0.004 Nd 593 108
27 Saptapur (RS No.57) 0.013 Nd 132 245
28 16 Laxmisinganakeri 0.017 Nd 9570 1709
29 Nagarkar colony 0.008 Nd 2160 400
30 Malamaddi (Gouli galli) Nd 4001 702
31 17 Shreeramnagar Nd 2802 519
32 Basava nagar portion-2,
Haliyal road left side
Non-Nd 202 39
33 Ganesh nagar (goulidaddi Haliyal
road left side)
Non-Nd 1609 298
34 Shreeramnagar Non-Nd 632 113
35 18 Attikoll (Playwood Factory) 0.040 Nd 2024 397
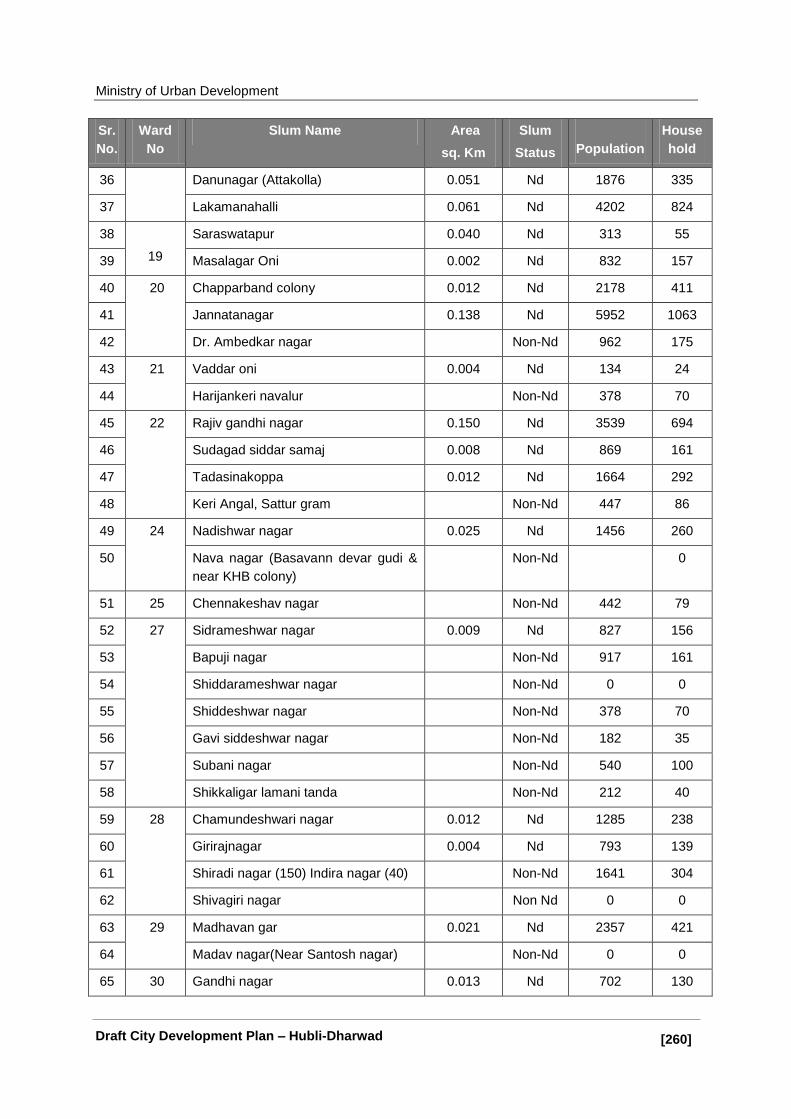
Ministry of Urban Development
[260]] Draft City Development Plan – Hubli-Dharwad
Sr.
No.
Ward
No
Slum Name Area
sq. Km
Slum
Status
Population
House
hold
36 Danunagar (Attakolla) 0.051 Nd 1876 335
37 Lakamanahalli 0.061 Nd 4202 824
38
19
Saraswatapur 0.040 Nd 313 55
39 Masalagar Oni 0.002 Nd 832 157
40 20 Chapparband colony 0.012 Nd 2178 411
41 Jannatanagar 0.138 Nd 5952 1063
42 Dr. Ambedkar nagar Non-Nd 962 175
43 21 Vaddar oni 0.004 Nd 134 24
44 Harijankeri navalur Non-Nd 378 70
45 22 Rajiv gandhi nagar 0.150 Nd 3539 694
46 Sudagad siddar samaj 0.008 Nd 869 161
47 Tadasinakoppa 0.012 Nd 1664 292
48 Keri Angal, Sattur gram Non-Nd 447 86
49 24
Nadishwar nagar 0.025 Nd 1456 260
50 Nava nagar (Basavann devar gudi &
near KHB colony)
Non-Nd 0
51 25 Chennakeshav nagar Non-Nd 442 79
52 27 Sidrameshwar nagar 0.009 Nd 827 156
53 Bapuji nagar Non-Nd 917 161
54 Shiddarameshwar nagar Non-Nd 0 0
55 Shiddeshwar nagar Non-Nd 378 70
56 Gavi siddeshwar nagar Non-Nd 182 35
57 Subani nagar Non-Nd 540 100
58 Shikkaligar lamani tanda Non-Nd 212 40
59 28 Chamundeshwari nagar 0.012 Nd 1285 238
60 Girirajnagar 0.004 Nd 793 139
61 Shiradi nagar (150) Indira nagar (40) Non-Nd 1641 304
62 Shivagiri nagar Non Nd 0 0
63 29
Madhavan gar 0.021 Nd 2357 421
64 Madav nagar(Near Santosh nagar) Non-Nd 0 0
65 30 Gandhi nagar 0.013 Nd 702 130

Ministry of Urban Development
[261]] Draft City Development Plan – Hubli-Dharwad
Sr.
No.
Ward
No
Slum Name Area
sq. Km
Slum
Status
Population
House
hold
66 31 Jems land 0.001 Nd 108 20
67 Shabari nagar Non-Nd 518 96
68 32 Barakotri Keshwapur 0.012 Nd 1089 198
69 Nagashettikoppa 0.001 Nd 649 114
70 Nagashetti koppa keri tank side huts Non-Nd 763 144
71 Dayanand colony keshwapur Non-Nd 432 80
72 33 Uday nagar Bengeri 0.001 Nd 1139 211
73 34 Lokkappa hakkal 0.012 Nd 2064 356
74 Vaddar oni Deshapande nagar 0.005 Nd 769 148
75 35 Timmasagar Oni 0.004 Nd 637 125
76 Hosur plot 0.008 Nd 1350 250
77 Mayur Ngar Hosur Jopadi 0.013 Nd 577 107
78 36 Ramlingeshwar nagar Nd 9497 1696
79 37 Gokul Harijankeri colony 0.006 Nd 168 33
80 Nanda gokul 0.025 Nd 858 156
81 Tarihall - Nd 2228 398
82 38
Krishna colony 0.013 Nd 1134 210
83 Nava Anand nagar 0.036 Nd 3837 724
84 Shakti colony 0.021 Nd 0 0
85 40 Jagadeesh nagar (Shikkaligar tanda) Nd 1560 300
86 Maruti nagar heggeri 0.029 Nd 4326 759
87 Shivaputra nagar 0.013 Nd 1353 246
88 Jagadish nagar Non-Nd 467 85
89 Arjun nagar Non-Nd 259 49
90 41 J.P. Nagar 0.000 Nd 769 145
91 42 Assarhonda 0.008 Nd 3369 581
92 43 Kolikeri plot 0.037 Nd 4360 765
93 Narayan Sofa 0.001 Nd 785 151
94 Myadar oni 0.016 Nd 1160 200
95 44 Ambedkar nagar (Chennapeth) Nd 1063 197
96 Toravi hakkal 0.042 Nd 3328 640
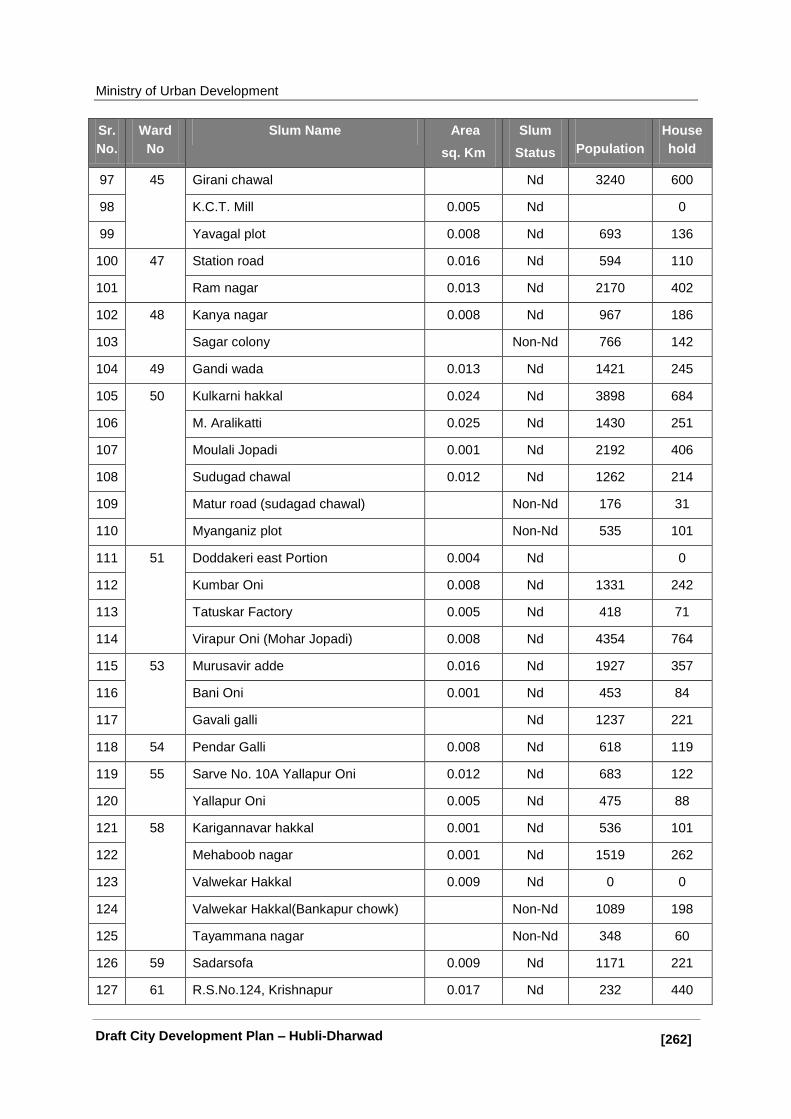
Ministry of Urban Development
[262]] Draft City Development Plan – Hubli-Dharwad
Sr.
No.
Ward
No
Slum Name Area
sq. Km
Slum
Status
Population
House
hold
97 45 Girani chawal Nd 3240 600
98 K.C.T. Mill 0.005 Nd 0
99 Yavagal plot 0.008 Nd 693 136
100 47
Station road 0.016 Nd 594 110
101 Ram nagar 0.013 Nd 2170 402
102 48 Kanya nagar 0.008 Nd 967 186
103 Sagar colony Non-Nd 766 142
104 49 Gandi wada 0.013 Nd 1421 245
105 50 Kulkarni hakkal 0.024 Nd 3898 684
106 M. Aralikatti 0.025 Nd 1430 251
107 Moulali Jopadi 0.001 Nd 2192 406
108 Sudugad chawal 0.012 Nd 1262 214
109 Matur road (sudagad chawal) Non-Nd 176 31
110 Myanganiz plot Non-Nd 535 101
111 51 Doddakeri east Portion 0.004 Nd 0
112 Kumbar Oni 0.008 Nd 1331 242
113 Tatuskar Factory 0.005 Nd 418 71
114 Virapur Oni (Mohar Jopadi) 0.008 Nd 4354 764
115 53 Murusavir adde 0.016 Nd 1927 357
116 Bani Oni 0.001 Nd 453 84
117 Gavali galli Nd 1237 221
118 54 Pendar Galli 0.008 Nd 618 119
119 55 Sarve No. 10A Yallapur Oni 0.012 Nd 683 122
120 Yallapur Oni 0.005 Nd 475 88
121 58 Karigannavar hakkal 0.001 Nd 536 101
122 Mehaboob nagar 0.001 Nd 1519 262
123 Valwekar Hakkal 0.009 Nd 0 0
124 Valwekar Hakkal(Bankapur chowk) Non-Nd 1089 198
125 Tayammana nagar Non-Nd 348 60
126 59 Sadarsofa 0.009 Nd 1171 221
127 61 R.S.No.124, Krishnapur 0.017 Nd 232 440
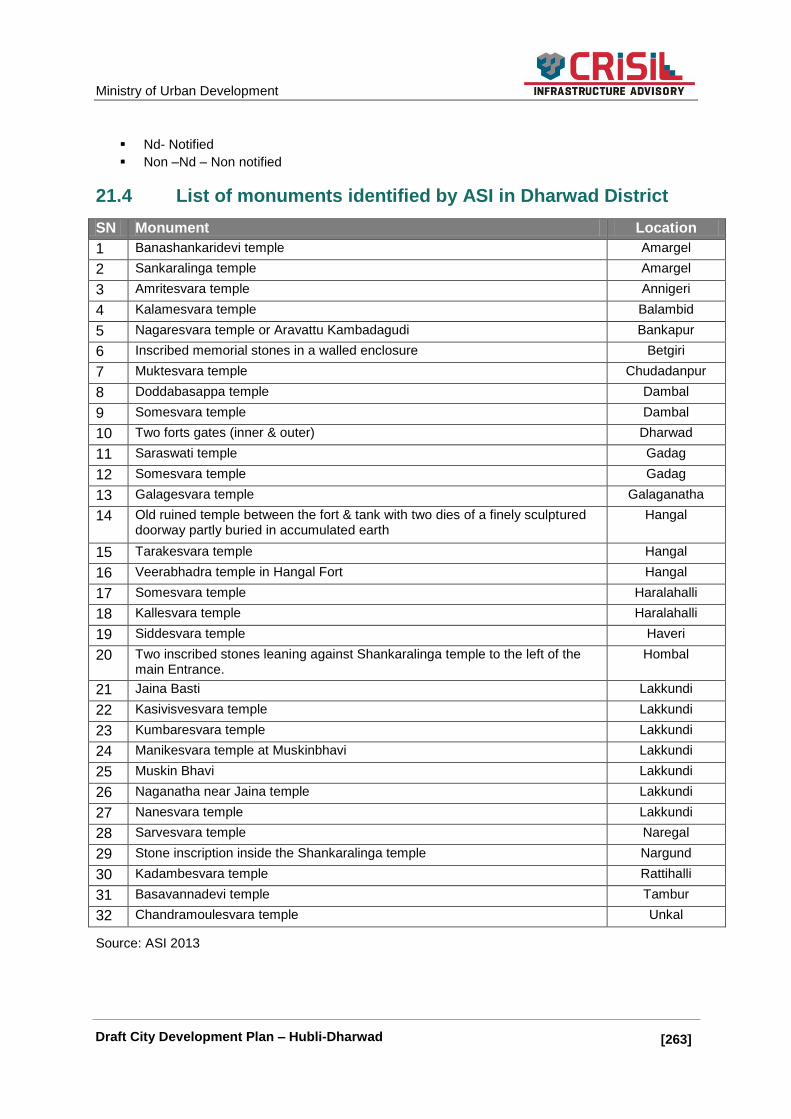
Ministry of Urban Development
[263]] Draft City Development Plan – Hubli-Dharwad
Nd- Notified
Non –Nd – Non notified
21.4 List of monuments identified by ASI in Dharwad District
SN Monument Location
1 Banashankaridevi temple Amargel
2 Sankaralinga temple Amargel
3 Amritesvara temple Annigeri
4 Kalamesvara temple Balambid
5 Nagaresvara temple or Aravattu Kambadagudi Bankapur
6 Inscribed memorial stones in a walled enclosure Betgiri
7 Muktesvara temple Chudadanpur
8 Doddabasappa temple Dambal
9 Somesvara temple Dambal
10 Two forts gates (inner & outer) Dharwad
11 Saraswati temple Gadag
12 Somesvara temple Gadag
13 Galagesvara temple Galaganatha
14 Old ruined temple between the fort & tank with two dies of a finely sculptured doorway partly buried in accumulated earth
Hangal
15 Tarakesvara temple Hangal
16 Veerabhadra temple in Hangal Fort Hangal
17 Somesvara temple Haralahalli
18 Kallesvara temple Haralahalli
19 Siddesvara temple Haveri
20 Two inscribed stones leaning against Shankaralinga temple to the left of the main Entrance.
Hombal
21 Jaina Basti Lakkundi
22 Kasivisvesvara temple Lakkundi
23 Kumbaresvara temple Lakkundi
24 Manikesvara temple at Muskinbhavi Lakkundi
25 Muskin Bhavi Lakkundi
26 Naganatha near Jaina temple Lakkundi
27 Nanesvara temple Lakkundi
28 Sarvesvara temple Naregal
29 Stone inscription inside the Shankaralinga temple Nargund
30 Kadambesvara temple Rattihalli
31 Basavannadevi temple Tambur
32 Chandramoulesvara temple Unkal
Source: ASI 2013

Ministry of Urban Development
[264]] Draft City Development Plan – Hubli-Dharwad
21.5 Annexure –Stakeholder Consultation
Stakeholder Suggestions
Dr Patil ,Former
Mayor
Venue : HDMC, 12 pm 22nd
October 2013
Infrastructure investment alone would not ensure city development and City Should be developed in line with culture of the people.
The city has developed over the years and city is in the path of progress
Lack of financial capacity even after the CAA -1992 Funds are still in form of grants and no regular fund allocation No qualified staff and only one DDTP HDMC hospitals should be adopted by the private medical colleges Develop as a tourist zone Strategies to attract investment in IT/ITES sector.
Mr.Veeranna
Sawadi , Former
Mayor
Venue : Residence of Mr. Veranna Savadi
9.30 am, 22nd
October 2013
Vision Hubli-Dharwad to be developed as Commercial Hub of North
Karnataka Major Issue : No new employment is generated in the area Suggestions
o 100% UGD o 100% network coverage and supply of water o UG cabling of electric lines o Mayors tenure to be for 5 years o Improve the inter departmental coordination o Invest to develop cultural centres o Develop Hwakers zones o Small markets in extension areas o Improve the collection efficiency of all types of taxes o Revived with hospitals under HDMC should be revived with
help of private practioners. Industrial Corridor between Tumkur and Kolhapur
Mr .Altaff Kitu,
Coporator, JDS
Venue :HDMC
Vision : Green Clean City
Special focus on Urban Poor Infrastructure development Solid Waste Management
Focused Group
Discussions
Venue :HDMC
Issues /Concerns
Irregular water supply NO provisions for Solid waste management Lack of awareness among the citizen regarding Rights &
Responsibilities, the SWM No measures for pollution control No bus bays and Bus shelter Frequent theft and robbery

Ministry of Urban Development
[265]] Draft City Development Plan – Hubli-Dharwad
Stakeholder Suggestions
FGD : Slums
Locations : Sidha Rameshwar Nagar and Gandhi Nagr
Migrants from villages Slums are increasing and no land ownership for slum dwellers infrastructure services are poor in slums No sanitation facility Kucha access road and no internal roads Poor housing condition Illiteracy, and School dropouts Poverty and poor food habits
Dr Neelam
Mr. Stanely George
Deshpane
Foundation
Deshpande Foundation , 11.00 am 23rd
October 2013
Issues/Concerns
Illegal construction along the urban periphery Area under green cover is decreasing Disparity among rich and poor is on increase, Weak livelihood
activities in slums Deteriorated CBD and market areas Poor traffic management
Suggestions
Enforcement of DCR and regulate illegal construction Conserve and protect the water bodies and lakes Proper signage, foot paths and traffic management Make city affordable for EWS and LIG
FGD Dept. of Architecture , BVB College Hubli,23rd
October 2013
Concerns issues :
Improper traffic management, bus shelters and bus bays Urban growth led by pvte developers Lack of social interaction spaces, City plaza, and Open spaces are not
connected. No participatory mode of governance and planning Area under green cover is decreasing Non-qualified people preparing the land use plans at HDUDA.
Dr Pushpa
Director, CMDR,
Dharwad
Concerns/Issues
Increasing number of Urban poor Poor Solid waste collection practices Water supply is not frequent

Ministry of Urban Development
[266]] Draft City Development Plan – Hubli-Dharwad
21.6 Workshop – Attendance

Ministry of Urban Development
[267]] Draft City Development Plan – Hubli-Dharwad

Ministry of Urban Development
[268]] Draft City Development Plan – Hubli-Dharwad

Ministry of Urban Development
[269]] Draft City Development Plan – Hubli-Dharwad
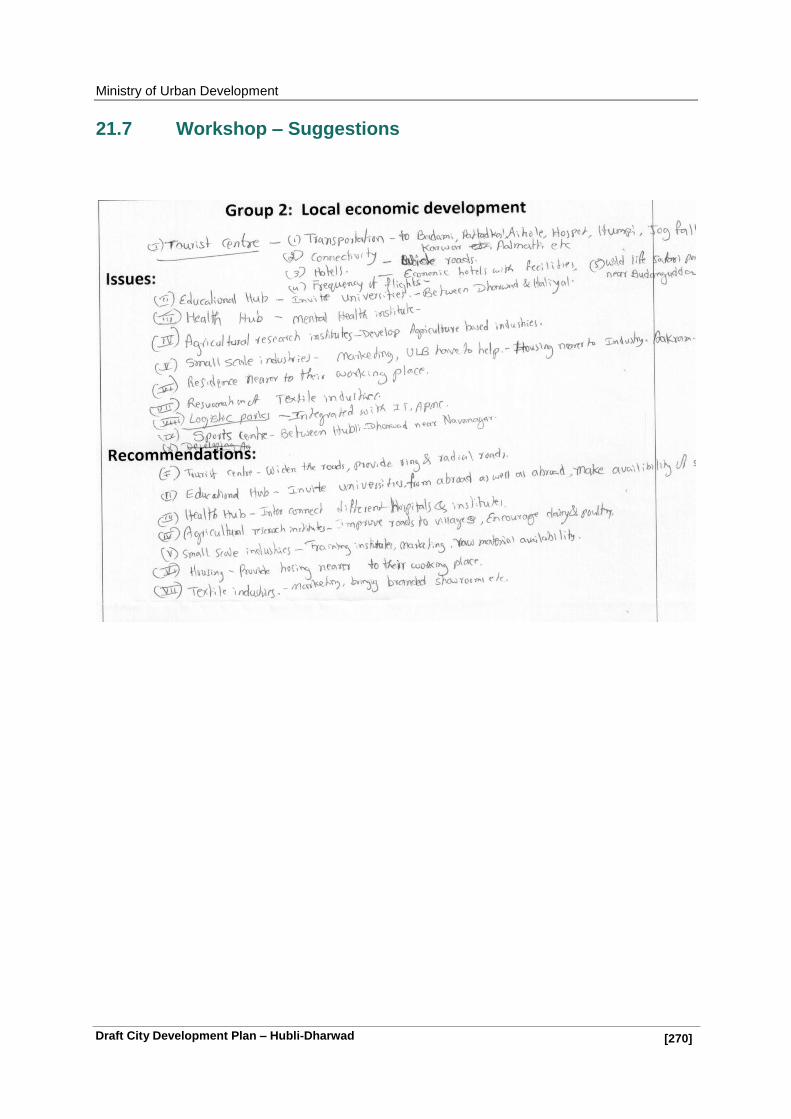
Ministry of Urban Development
[270]] Draft City Development Plan – Hubli-Dharwad
21.7 Workshop – Suggestions

Ministry of Urban Development
[271]] Draft City Development Plan – Hubli-Dharwad

Ministry of Urban Development
[272]] Draft City Development Plan – Hubli-Dharwad
Ministry of Urban Development
[273]] Draft City Development Plan – Hubli-Dharwad
Ministry of Urban Development
[274]] Draft City Development Plan – Hubli-Dharwad


Offices / Contact us:
Registered Office – Mumbai
CRISIL House, Central Avenue, Hiranandani Business Park, Powai, Mumbai- 400 076 Phone : 91-22-3342 3000 Fax : 91-22-3342 3810
New Delhi
Plot No. 46 (Opposite Provident Fund Office), Sector 44, Gurgaon 122 003, Haryana, India Phone : 91-124-672 2000 Fax : 91-124-672 2495
Hyderabad
3rd Floor, Uma Chambers Plot No. 9&10, Nagarjuna Hills, Near Punjagutta Cross Road Hyderabad - 500 082 Phone : 91-40-40328200 Fax : 91-40-2335 7507
Bengaluru
W-101, Sunrise Chambers, 22, Ulsoor Road, Bengaluru - 560 042 Phone : 91-80-2558 0899 Fax : 91-80-2559 4801
Ahmedabad
706, Venus Atlantis, Near Reliance Petrol Pump Prahladnagar, Ahmedabad - 380 015 Phone : 91-79-4024 4500 Fax : 91-79-2755 9863
Visit us at: www.crisil.com
About CRISIL Infrastructure Advisory
CRISIL Infrastructure Advisory is a division of CRISIL Risk and Infrastructure Solutions Limited, a 100% subsidiary of CRISIL
Limited – India‘s leading Ratings, Research, Risk and Policy Advisory Company.
CRISIL Infrastructure Advisory is India‘s premier advisor focusing on policy issues, as well as commercial and contractual issues in the areas of transport, energy and urban infrastructure. We also provide support to international firms planning investments in India. Over a period of time, CRISIL Infrastructure Advisory has built a unique position for itself in these domains and is considered the preferred consultant by governments, multilateral agencies and private-sector clients. We have extended our operations beyond India and are present in other emerging markets in Africa, Middle East and South Asia.
CRISIL Ltd is a Standard & Poor's company
CRISIL Limited CRISIL House, Central Avenue, Hiranandani Business Park, Powai, Mumbai – 400076. India Phone: + 91 22 3342 3000 Fax: + 91 22 3342 3001 Email: [email protected] (optional) www.crisil.com
LinkedIn YouTube Facebook Stay Connected | | | | Twitter