retailinstruments solution for shopping malls
TRANSCRIPT
© RetailInstruments Ltd www.retailinstruments.ee [email protected]
Decision support system based on Consumer behavior analytics
Retail Instruments Communication with loyal visitors

© RetailInstruments Ltd www.retailinstruments.ee [email protected]
Wifi – analytics: what is it for?
CONCERNS
ANSWERS
• For how long people stay in the shopping mall? • Stores synergy • Each store’s value for the shopping mall • Cross-audience of different stores • Most popular “paths” in your shopping mall • What are the days with more % of returning visitors?
• Tenant Mix optimization • Campaigns Effectiveness • Optimization of zones, displays, layout, advertisements, etc. • Store rent rates optimization • Benchmarking: Industrial & per Shopping Mall • Analysis of cross-audience
© RetailInstruments Ltd www.retailinstruments.ee [email protected]
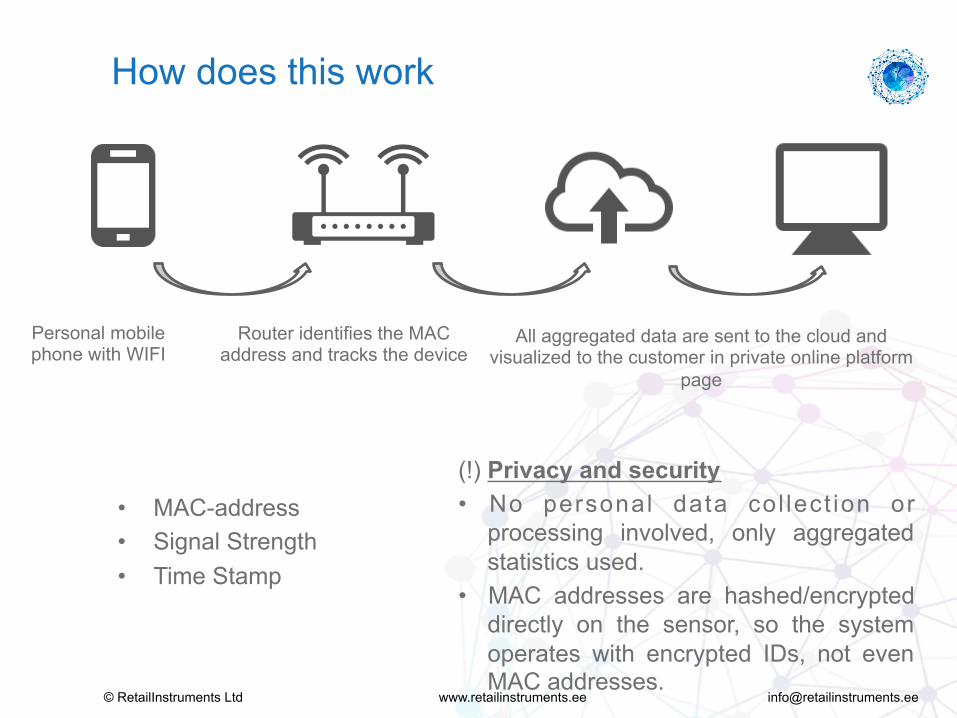
(!) Privacy and security • No personal data col lect ion or
processing involved, only aggregated statistics used.
• MAC addresses are hashed/encrypted directly on the sensor, so the system operates with encrypted IDs, not even MAC addresses.
How does this work
• MAC-address • Signal Strength • Time Stamp
Personal mobile phone with WIFI
Router identifies the MAC address and tracks the device
All aggregated data are sent to the cloud and visualized to the customer in private online platform
page

© RetailInstruments Ltd www.retailinstruments.ee [email protected]
• Footfall around the store
• Capture rate
• Dwell time
• Bounce rate
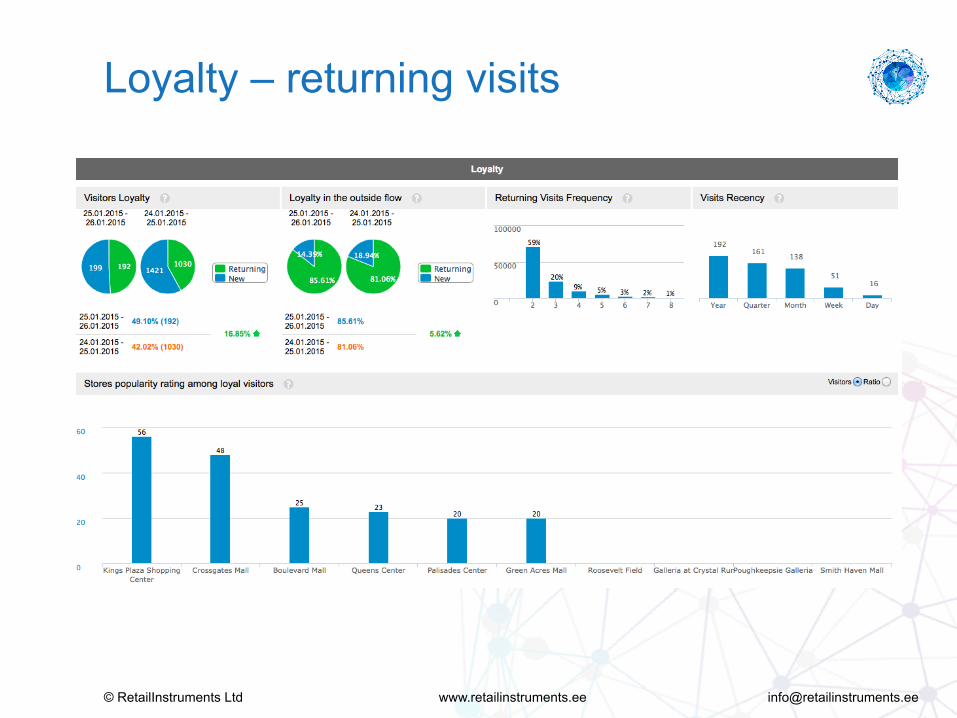
• Loyalty/ RF-analysis:
• Level % of returned visitors
• Frequency of visits
• Recency of visits
System collects and analyses the following data
Main characters
© RetailInstruments Ltd www.retailinstruments.ee [email protected]
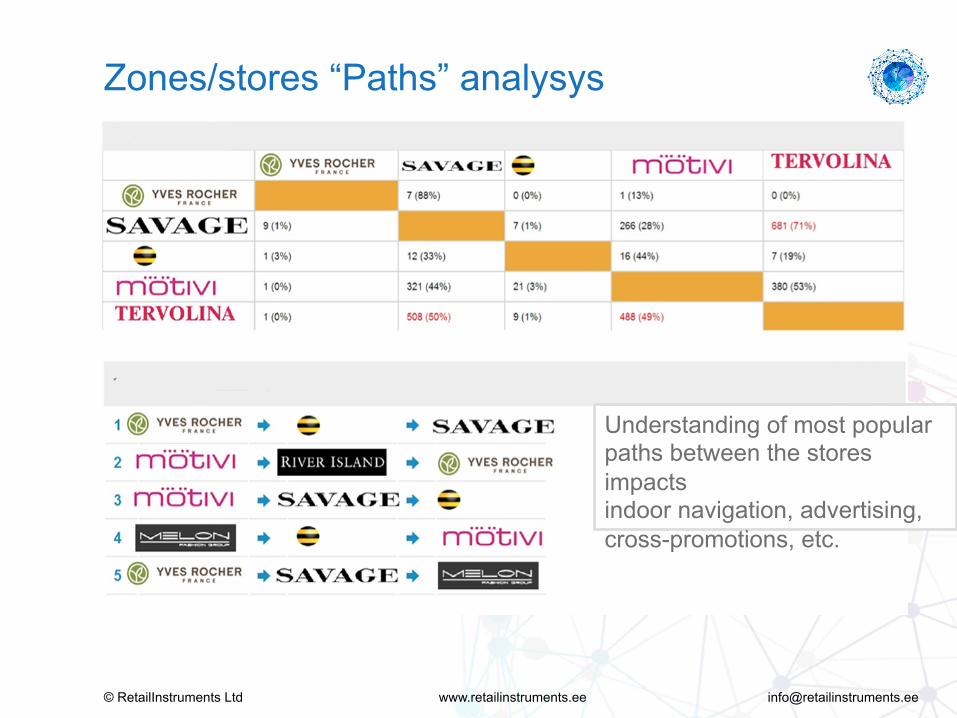
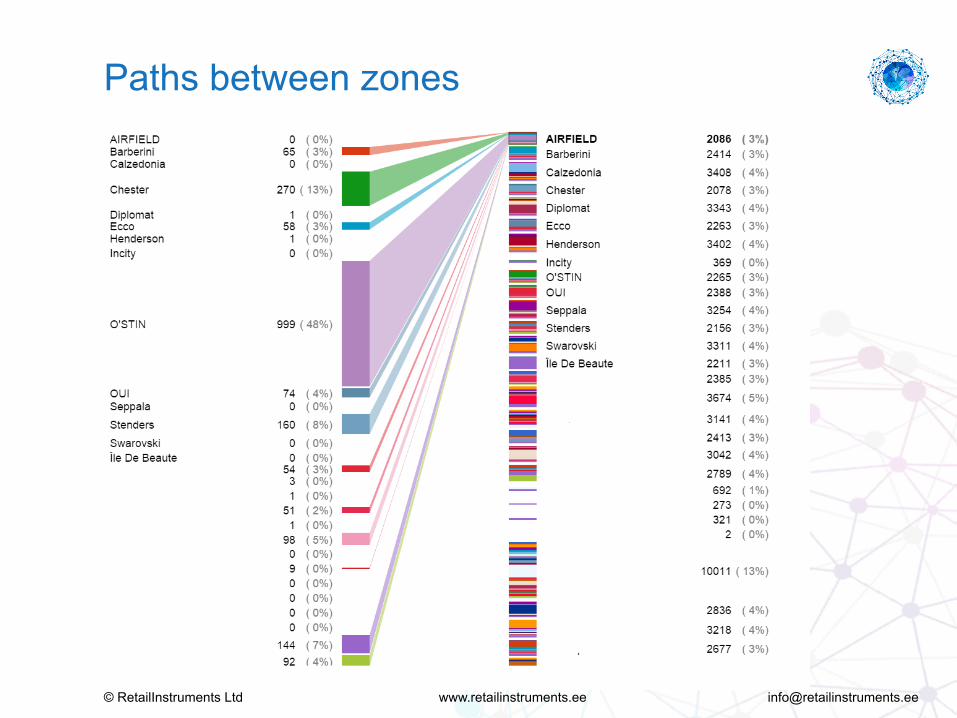
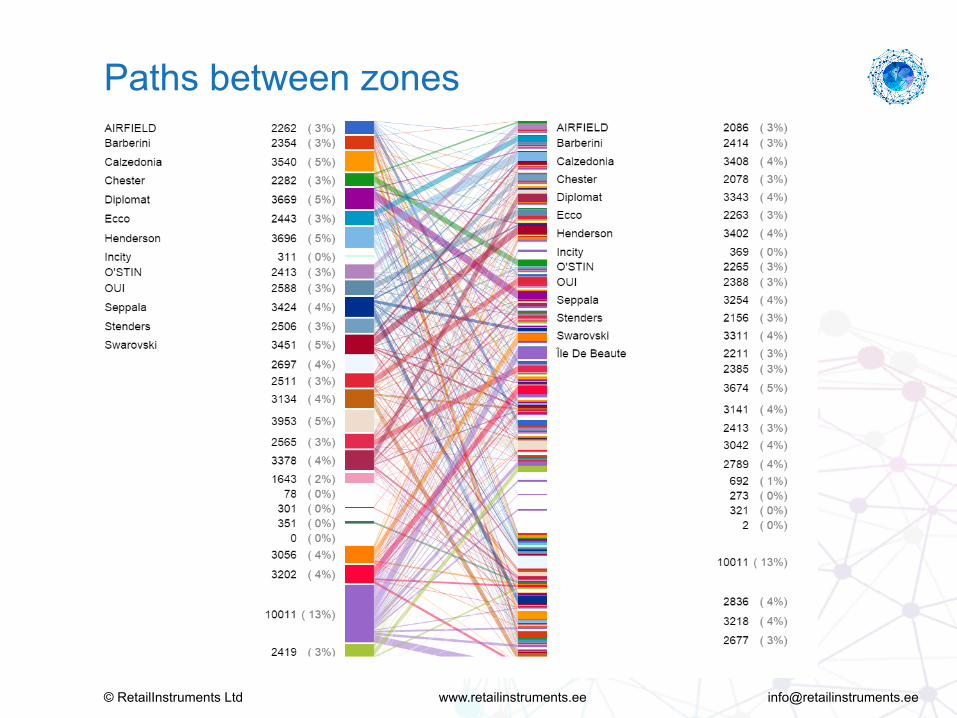
Understanding of most popular paths between the stores impacts indoor navigation, advertising, cross-promotions, etc.
Zones/stores “Paths” analysys
© RetailInstruments Ltd www.retailinstruments.ee [email protected]
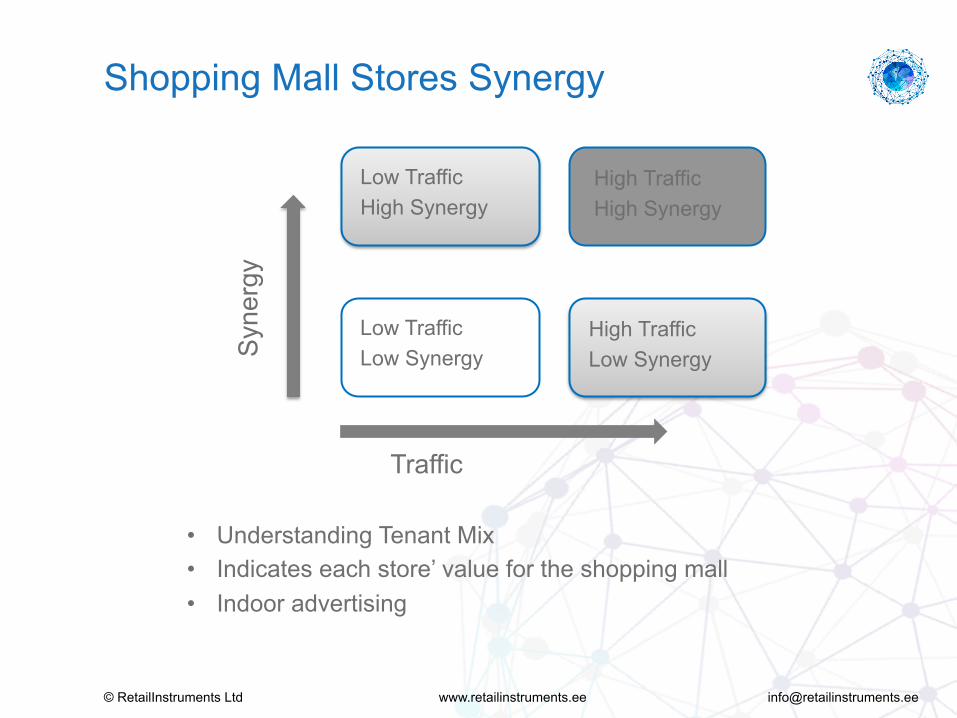
Traffic
Syn
ergy
High Traffic Low Synergy
Low Traffic High Synergy
Low Traffic Low Synergy
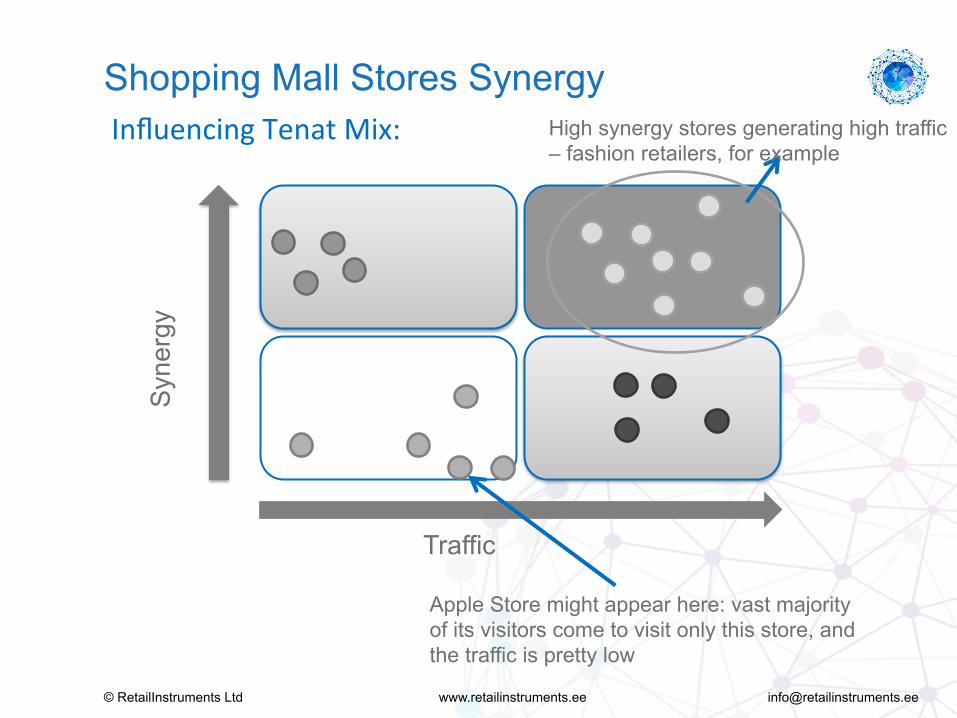
Shopping Mall Stores Synergy
High Traffic High Synergy
• Understanding Tenant Mix • Indicates each store’ value for the shopping mall • Indoor advertising
© RetailInstruments Ltd www.retailinstruments.ee [email protected]
High synergy stores generating high traffic – fashion retailers, for example
Apple Store might appear here: vast majority of its visitors come to visit only this store, and the traffic is pretty low
Influencing Tenat Mix:
Traffic
Syn
ergy
Shopping Mall Stores Synergy
© RetailInstruments Ltd www.retailinstruments.ee [email protected]
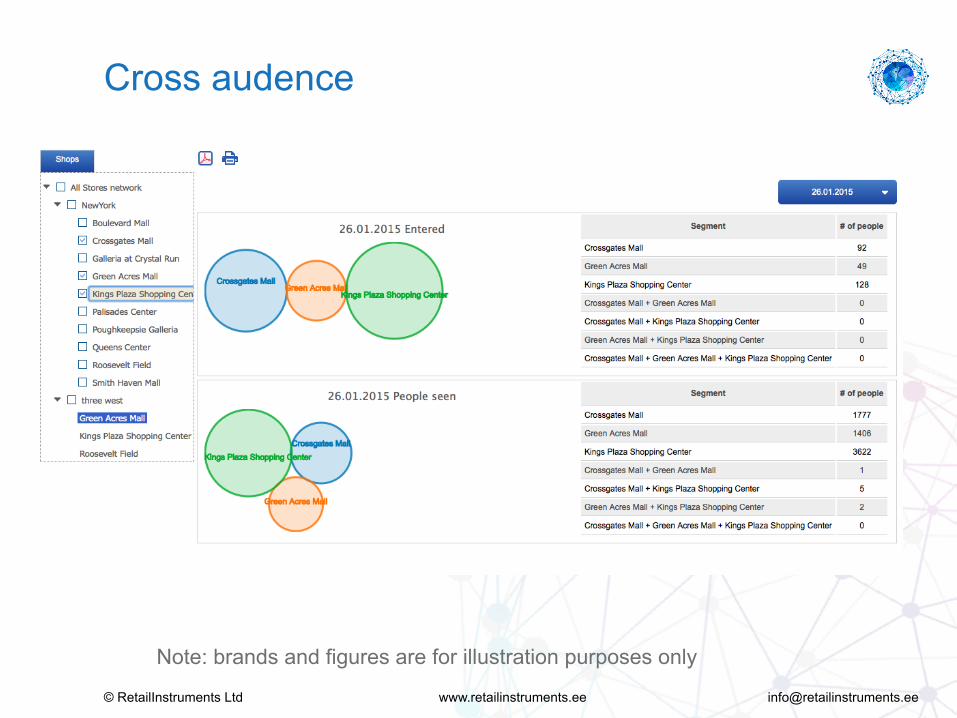
Cross audence
Note: brands and figures are for illustration purposes only
© RetailInstruments Ltd www.retailinstruments.ee [email protected]
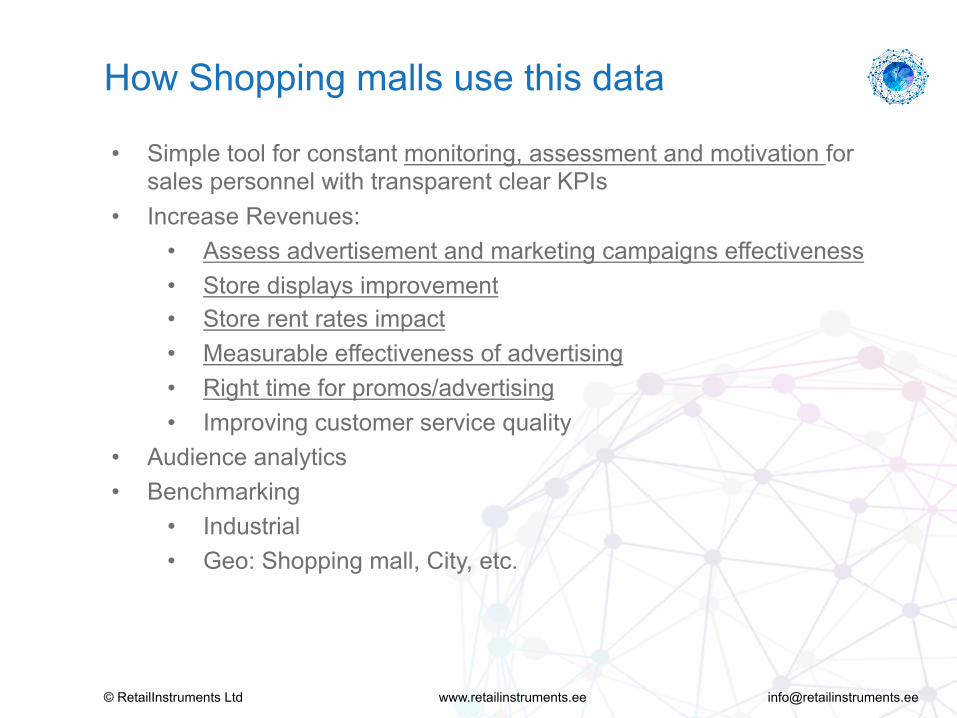
• Simple tool for constant monitoring, assessment and motivation for sales personnel with transparent clear KPIs
• Increase Revenues: • Assess advertisement and marketing campaigns effectiveness • Store displays improvement • Store rent rates impact • Measurable effectiveness of advertising • Right time for promos/advertising • Improving customer service quality
• Audience analytics • Benchmarking
• Industrial • Geo: Shopping mall, City, etc.
How Shopping malls use this data
© RetailInstruments Ltd www.retailinstruments.ee [email protected]
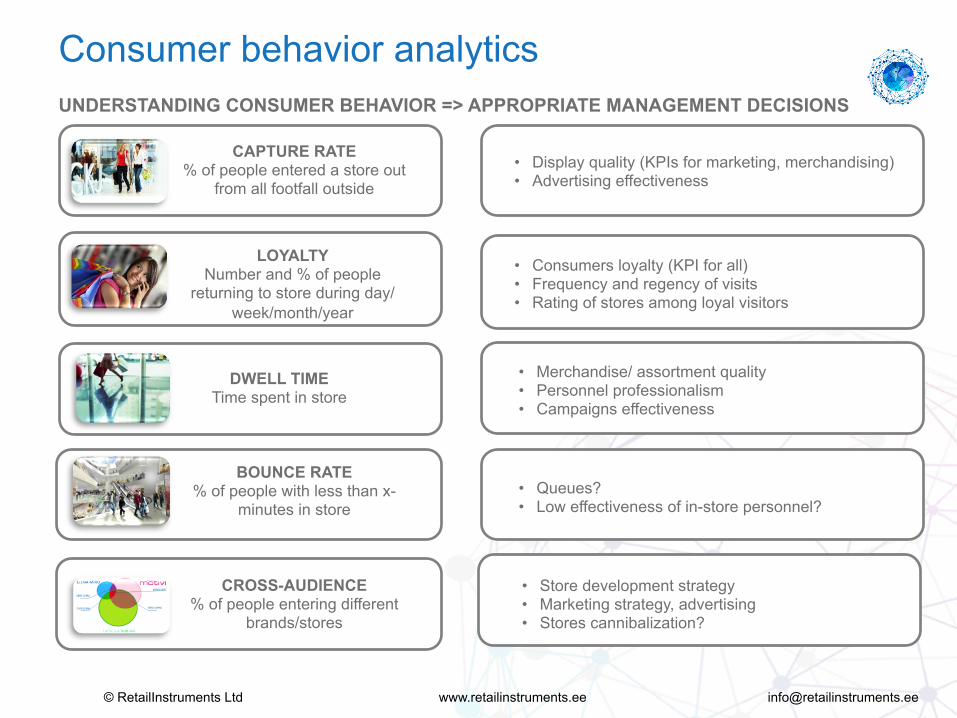
UNDERSTANDING CONSUMER BEHAVIOR => APPROPRIATE MANAGEMENT DECISIONS
Consumer behavior analytics
CAPTURE RATE % of people entered a store out
from all footfall outside • Display quality (KPIs for marketing, merchandising) • Advertising effectiveness
LOYALTY Number and % of people
returning to store during day/week/month/year
DWELL TIME Time spent in store
BOUNCE RATE % of people with less than x-
minutes in store
CROSS-AUDIENCE % of people entering different
brands/stores
• Consumers loyalty (KPI for all) • Frequency and regency of visits • Rating of stores among loyal visitors
• Merchandise/ assortment quality • Personnel professionalism • Campaigns effectiveness
• Queues? • Low effectiveness of in-store personnel?
• Store development strategy • Marketing strategy, advertising • Stores cannibalization?
© RetailInstruments Ltd www.retailinstruments.ee [email protected]
Platform
• SaaS based • Real-time BI and decision support system, 24*7 access, any
browser • Predefined and customizable reports and dashboards • Fully configurable and flexible system • Easy integration with ANY existing ERP, BI, CRM systems • Reports export to excel, pdf • Configurable automatic reports sending to relevant employees • Automatic notifications and alerts upon configurable triggering
events • Eiler-Venn diagrams for joint audience of different stores • Smart search of events and cases with an automatic alerts if
searched once event happens in the future

© RetailInstruments Ltd www.retailinstruments.ee [email protected]
• Each router should be connected to the internet and plugged into electricity 220V.
• Visitors aggregated statistics is being gathered by passive monitoring of Wi-Fi devices 2,4 GHz. System collects only MAC address, signal level and time stamp. MAC address is hashed directly on the sensor so there is no even MACs that are transmitted in the open manner. Secured connection with server is done inside ssh-tunnel.
• Collected data is sent to NPO Analitika’ data center. Resulted aggregated data is placed then into a dedicated database that can be accessed by client authorized representatives only. NPO Analitika takes all imaginable security measures to store Client data in a secured and safe manner.
Hardware
• In every measure zone/store it is needed to install a standard wifi router TP-Link TL-WR941ND

© RetailInstruments Ltd www.retailinstruments.ee [email protected]
How to contact loyal visitors?
Welcome _BRAND_ store!
In order to receive personal offers and discounts next time you visit us – please
provide your phone number:
+37258172099
Yes, please send me personalized offers!
BRAND STORE Free WiFi
• Make a personalized offer right at the moment returning visitors enter a store • Ability to offer special price/discount/coupon for returning visitor • Get an approval from every person to receive such personalized offers
© RetailInstruments Ltd www.retailinstruments.ee [email protected]
• Projects: Moscow, St-Petersburg, cities with >1M population • Benchmarking for 50+ shopping malls in Tallinn, Saint-Petersburg and
Moscow • Presented in 120+ shopping malls in Russia • Vast experience in retail and deep business processes understanding • Strong R&D Team • Technical support: own and by partners • Cooperation with big consulting and engineering companies
About US

© RetailInstruments Ltd www.retailinstruments.ee [email protected]
INDUSTRIES • Fashion • Cosmetics • Electronics • DIY • Mobile phones • Shopping Malls • Fast Food
Retailers using WIFI - analytic
TARGET AUDIENCE / KEY USERS • TOP-Management • Operations Management • Marketing • Merchandising • Sales, Commercial • HR • Business development/Rent

© RetailInstruments Ltd www.retailinstruments.ee [email protected]
We’re proud to serve industry leaders
© RetailInstruments Ltd www.retailinstruments.ee [email protected]
• Nielsen research: Q1’2013: 46% smartphones, 30% to 70% - wifi on • IDC: worldwide Q1 2013 smartphones share – 51,6% • Telecoms Companys : smartphones share - 51%-58%, depending on
regions • Retail Analitika statistics - 3 “categories” of stores:
• “Bad” street-retail: 10% - 15%
• Average location, city center, average shopping mall: 20% - 35%
• Good location, good shopping mall: 30% - 60%
How representative WIFI is
© RetailInstruments Ltd www.retailinstruments.ee [email protected]
Retailinstruments ltd Lõõtsa 6 Tallinn, Estonia [email protected] www.retailinstruments.ee
For more information or personal presentation please feel free to contact us:
Contact information
Jelisei Lokotar +372 5853 2007 [email protected]