results and model for single-gate ratchet charge pumping
TRANSCRIPT

Results and model for single-gate ratchetcharge pumping
Cite as: J. Appl. Phys. 127, 094301 (2020); doi: 10.1063/1.5133967
View Online Export Citation CrossMarkSubmitted: 1 November 2019 · Accepted: 11 February 2020 ·Published Online: 2 March 2020
Roy Murray,1 Justin K. Perron,2 M. D. Stewart, Jr.,1 Antonio L. Levy,1 Patrick See,3 Stephen P. Giblin,3
Jonathan D. Fletcher,3 Masaya Kataoka,3 and Neil M. Zimmerman1,a)
AFFILIATIONS
1National Institute of Standards and Technology, Gaithersburg, Maryland 20899, USA2Department of Physics, California State University San Marcos, San Marcos, California 92096, USA3National Physical Laboratory, Teddington TW11 0LW, United Kingdom
a)Author to whom correspondence should be addressed: [email protected]
ABSTRACT
We show experimentally that, in the same Si devices, we can demonstrate multiple two-gate pumping modes but not single-gate mode. Wecontrast this with GaAs devices, which do show single-gate pumping at a high yield. We propose four mechanisms to explain the lack ofplateaus in the Si devices in single-gate ratchet mode: operating the dot with a large number of electrons, a large ratio between the changein electrochemical potential energy and the change in the energy of the barrier (plunger-to-barrier ratio, Δptb) compared to the chargingenergy (Δptb/EC), nonlinear tunnel barriers, and phase offset leading to nonequilibrium heating. Our analysis shows that each of these couldcontribute to the lack of plateaus in single-gate ratchet pumping on Si devices but allow two-gate pumping methods to work with robustplateaus. It is easier for GaAs pumps to avoid these failure mechanisms due to their different architectures and cleaner gate turnoff curves.We propose several methods to reduce these sources of error, including reducing cross capacitances between gates. These recommendationsmay prove useful to other researchers in producing more robust, higher yield single-gate ratchet pumps.
https://doi.org/10.1063/1.5133967
I. INTRODUCTION
Transferring single electrons accurately is a key technology indeveloping image sensors with single photon sensitivity,1 quantuminformation with quantum dots,2 low-power single electron devices,3
and closing the metrological triangle.4 In particular, the ability to trans-fer electrons one-by-one offers the possibility of providing a funda-mental standard for electrical current based on the charge of theelectron.5 In pursuit of a metrological standard, some groups haveachieved very high accuracy single electron transfer using chargepumps.6–10 The ideal charge pump creates current I ¼ nef , where n isan integer, e is the electron charge, and f is the frequency of an appliedelectrical bias. One attractive mode for operating these charge pumpsis known as the “single-gate ratchet;”11–13 this mode provides the coun-terintuitive ability to get a DC current in the absence of a DC voltage,similar to Brownian motors.14 This ability results in subtle depen-dences of this pumping mechanism on various parameters; some ofthese dependences have not been previously investigated in detail.
In addition to the basic scientific interest in the single-gateratchet charge pumping mechanism, there are also significant
technological reasons for studying this mechanism. To producean appreciable current useful for metrology, we need n to be large,f to be large, or many of these pumps to be run in parallel. Moststudies have found that increasing n also increases error rates,15 son = 1 is typically used. The highest reported frequency for integerpumping reported is over 7 GHz,16 but most high accuracy publica-tions report frequencies between 0.5 and 1 GHz.7–10 This leavesparallel pumps as the most feasible option, of which several smallscale devices have been demonstrated.17–20 To reach a metrologi-cally relevant current, one would need on the order of 100 pumpsoperating in parallel. Industrial scale manufacturing of silicondevices, combined with studies showing that Si single electrondevices can be quite stable over time and demonstrate a low chargeoffset drift,21 make Silicon a desirable material for charge pumps.GaAs pumps have a high yield (over 90% of fabricated devicesproduce expected pumping behavior), near the requisite for a largescale current standard, but the yield on Si single electron pumpsappears to be much lower than this, around 20% based on our owngroup’s experience and conversations with other research groups.
Journal ofApplied Physics ARTICLE scitation.org/journal/jap
J. Appl. Phys. 127, 094301 (2020); doi: 10.1063/1.5133967 127, 094301-1

Basic failure modes include gate leakage, mistargeted gate capaci-tance, and unintentional quantum dots that can form under gatesor within the channel.
Why this yield is so low remains a pressing question. Basic con-siderations, such as increasing charging energy and operating thedevice at proper biases, are well known.22 Some design criteria havebeen presented, such as the plunger-to-barrier ratio Δptb
23,24
(Δ ptb ¼ τ dεdt where τ is the time for the barrier tunneling rate to
change by a factor of Euler’s number ≈2.718, and ε is the electro-chemical potential level of the dot), or the closely related “g” factor25
(g ¼ αIαLG�αI
, where αI is the capacitive lever arm of the pumpinggate to the dot, and αLG is the conversion factor from the gatevoltage to barrier height). Biasing arrangements have also been dis-cussed elsewhere, with custom AC control signals8 and AC signalcoordination26 identified as methods to increase plateau width. Noneof these yield-related issues provide a satisfactory explanation for ourresults, leading us to explore other error mechanisms.
In this paper, we demonstrate successful pumping in our Siarchitecture with several two-gate pumping modes. However, weobserve a total lack of plateaus when attempting to pump with asingle gate in the same architecture. We investigate the absence ofsingle-gate ratchet pumping through modeling to determine thedependencies on (i) the dot not fully unloaded, (ii) subtle depen-dence on energy parameters, (iii) nonlinear tunneling, and (iv) phaseoffset and nonequilibrium heating. We finally discuss various mitiga-tion techniques to avoid these mechanisms in the future.
II. EXPERIMENTAL METHODS
In this work, we use Si devices fabricated in asilicon-on-insulator (SOI) architecture,27 as seen in Fig. 1, as wellas GaAs devices, whose fabrication has been covered elsewhere.28,29
To summarize the Si process, we start with a silicon-on-insulator(SOI) wafer, with 100 nm of Si on top of a 200 nm buried oxide(BOX). After etching the Si layer, the resulting device consists of a100 nm wide Si nanowire (NW), encapsulated by a 25 nm gateoxide. On top of the gate oxide is a layer of poly-Si patterned intothree 100 nm long barrier gates spaced by 100 nm, used for
pinching off the two-dimensional electron gas (2DEG). In thiswork, we only use two adjacent barrier gates and leave the thirdgrounded. After growing a 25 nm layer of isolation oxide, anotherlayer of poly-Si is deposited and patterned to cover the Si nanowire,labeled “Upper Gate” in Fig. 1. This layer is used to invert thenanowire and accumulate electrons in the 2DEG. By applying apositive voltage to the Upper Gate and negative voltages to twolower gates, we can isolate a small region of the 2DEG to create aquantum dot with a total capacitance in the range of 40–100 aF[EC ¼ e2
CΣ¼ (1:6–4)meV]. All measurements take place in a
cryogen free dilution refrigerator with a base thermometer temper-ature of 8 mK. Effective electron temperatures caused by noise areestimated to be well above that, approximately 200 mK. AC signalswere generated with a Tektronix AWG 70002a 2 channel 25GSa/sarbitrary waveform generator. Current was measured using aFemto DLPCA-200 current pre-amplifier. GaAs device measure-ment has been very thoroughly covered in a recent paper.29
III. EXPERIMENTAL RESULTS
Once the device has been properly biased with DC voltages tocreate the isolated quantum dot, verified by Coulomb blockademeasurements and stability diagrams,26 we proceed with AC chargepumping measurements. Several papers have already covered thedetailed bias procedure for running a device as a single-gateratchet,30 two-gate ratchet, or two-gate turnstile.26 Following themethods outlined there, we tuned up our Si device as a robustpump using two AC signals. We successfully demonstrated plateaususing two different two-gate pumping modes.
The Si two-gate results are shown in Fig. 2, with Fig. 2(a)showing ratchet results from a no-bias pumping mode similar to thatshown in other work.15,31 Here, we see flat plateaus and the numberof pumped electrons, n, behaving as expected with respect to gatevoltage and AC signal phase offset. In Fig. 2(b), we show results froma turnstile pumping mode32,33 following the expected trend where nis determined by the gate voltage and bias voltage. These resultsconfirm that AC signals are reaching the device as expected, EC≫ kT,and that the device is functioning as a quantum dot.
FIG. 1. Schematic of the devices and basic measuring circuits used in this study. (a) Si device, showing the two gates used in this work (a third was fabricated but is leftgrounded for this study and is not pictured here). The active region of the device is entirely made of Si (white), SiOX (dark gray), and poly-Si (light gray). The 2DEG wasinduced in the Si nanowire (NW). (b) GaAs device, where the 2DEG exists in the top of the GaAs substrate and is confined to the region directly under the Si-AlGaAsdoped layer, which is 1 μm wide. The two metal gates are used to pinch off the 2DEG and create a quantum dot between them.
Journal ofApplied Physics ARTICLE scitation.org/journal/jap
J. Appl. Phys. 127, 094301 (2020); doi: 10.1063/1.5133967 127, 094301-2

After confirming that the Si devices were operating asexpected with DC measurements and two-gate charge pumpingmeasurements, we proceeded to operate the device with a singleAC bias. When only one AC signal was applied, to operate thedevice as a one-gate ratchet as described in several papers,12,13,24 wedid not observe the expected plateaus. In Fig. 3, we see thepumping map formed by an RF sine wave applied to the entrancegate of a quantum dot. This should produce plateaus similar to theones seen in Appendix Fig. 8. However, when attempting this mea-surement with several devices at a wide range of frequencies andRF powers, we were unable to observe any plateaus. Figure 3(a)shows a pumping map from the device used in Fig. 2, where gatevoltage limitations prevented us from seeing the entire pumpingmap. A second device was also measured, which had a less negative
turn-off voltage. This allowed us to apply larger amplitude signalsand image the entire one-gate pumping region. Linecuts throughthe pumping maps of both devices show the expected linear trendalong each axis [Figs. 3(b) and 3(d)]. GaAs devices did show goodone-gate pumping results, with ideal pumping maps shown inother works.7,30,34
IV. ANALYSIS
The featureless current seen in Figs. 3(a) and 3(c) does notresemble the expected plateaus, seen in other publications usingsimilar devices. In this section, we present evidence that the fea-tureless current corresponds to the single-gate ratchet mode butwithout any quantization plateaus. To better understand this
FIG. 2. 50 MHz pumping results for Sidevice 1, showing expected plateaususing (a) two-gate ratchet pumping withno bias, PRF =−10 dBm, VDC = 0 V,VUG = 2.3 V, Vent =−2.7 V to −2.41 V,and Vexit =−2.99 V, and (b) two-gateturnstile pumping with applied bias asshown and equal amplitude, 180° phaseshifted AC signals, PRF =−10 dBm,VDC = 0 V, VUG = 2.3 V, Vent =−2.63 V to−2.52 V, Vexit =−3.14 V to −3.07 V, andT = 10 mK. Here, the effective gate
voltage Veff ¼ �ffiffiffiffiffiffiffiffiffiffiffiffiffiffiffiffiffiffiffiffiV2ent þ V2
exit
q.
FIG. 3. One-gate ratchet pumpingcurrent: (a) Pumping map from device1, showing the current from pumping inthe lower left corner, and rectificationcurrent in the upper right corner with a−14 dBm 50 MHz sine wave applied toone gate, VUG = 2.3 V. The dotted blackline at Vexit =−3.05 V corresponds tothe exit barrier turn-off point. (b)Linecuts through (a) showing the linearportions of the current and fits to thedata. (c) Device 2 showing a pumpingmap from a 10 dBm 500 MHz sinewave, with lines showing where line-cuts were taken. The current directionis opposite from device 1 due to con-necting the current pre-amplifier to theentrance lead instead of the exit lead.The bright yellow flat region is due tothe current preamplifier saturatingabove 10 nA. As in (a), the dottedblack line corresponds to the barrierturn-off. (d) Linecuts from (c), showinglinear regions in the pumping region,with the fits shown here.
Journal ofApplied Physics ARTICLE scitation.org/journal/jap
J. Appl. Phys. 127, 094301 (2020); doi: 10.1063/1.5133967 127, 094301-3

current, we started by considering the ideal pumping map [shownin (A1)]. This was originally described by Kaestner andKashcheyevs,24 and the equations governing the plateau transitionswere described by d’Hollosy et al.35 This prediction of a one-gateratchet pumping map has been observed many times in the litera-ture,30,36,37 and also holds true for other situations, such aspumping where the dot is not fully emptied35 or where the sweptgate is a plunger gate and not the exit barrier gate.13 If the plateauwidth goes to zero due to some large error mechanism, we losequantization and expect a sweep along either the entrance or exitbarrier to be linear within the pumped current region. Theexpected slope of the linecut in the entrance direction can bedescribed simply by
mVent ¼dI
dVent¼ fCent-dot : (1)
Here, Cent-dot is the capacitance between the entrance gate and thedot. Equation (1) was derived from standard expressions for theenergy of a quantum dot, under the assumption that the single-particle energy spacing is much smaller than the electrostatic charg-ing energy.35,38 The expected slope of the linecut along the exit gateis also linear, and a full physical description can be found else-where.35 Figure 3(b) shows the linecuts along the entrance and exitbarrier compared to a linear fit, showing that the trend is linear.
To support our thesis that the featureless current correspondsto single-gate ratchet mode, but without any quantization plateaus,we have compared capacitances derived from DC measured valuesto those derived from the linecuts (Table I). The DC measuredvalues of all capacitances are taken from Coulomb blockade oscilla-tion measurements and diamond diagrams. These measurementswere all taken using DC transport, which occurs in the range whereboth barrier gates allow conduction. As seen in Figs. 3(a) and 3(c),pumping occurs at more negative gate values, when no DC trans-port can occur. The “Pumping Fit Value” is obtained from Eq. (1),using data from two independent sets of experiments (in particular,by switching “ent” and “exit” directions). We expect the gate capac-itances in the DC transport regime to differ from the values in the
pumping regime; however, the apparent agreement between DCand Pumping Fit Values leads us to believe that the featurelesscurrent corresponds to single-gate ratchet mode, but without anyquantization plateaus.
The reasonable device parameters extracted from the linecutsand the shape of the pumping map are both good evidence that thecurrent is due to one-gate ratchet charge pumping but withoutquantization. Another requisite feature of the pumped current is itsreaction to applied frequency. Figure 4 shows the current at a spe-cific value of gate voltage as a function of frequency. While no pla-teaus were visible in the pumped current, the current still obeys theexpected relation with frequency. Rectification current (discussedfurther in Appendix B) appears in Figs. 3(a) and 3(c) when the exitbarrier becomes conductive (to the right of the vertical dashed line)but does not affect the current in the pumped region. This con-firms that the current visible in Fig. 3(a) is due to charge pumpingand not from some other effect.
We can augment these detailed results on lack of single-gateratchet pumping with an additional statistical study, which doesnot include testing two-gate pumping. Part of our team has beenmaking mesa-etched GaAs pumps with a single layer of surfacegates.34 After fabrication optimization of size and shape, we havetested a large number of devices for single-gate ratchet pumping.Out of approximately 135 devices tested at 4.2 K, approximately125 (over 90%) showed correct pumping characteristics withcurrent quantization plateaus (although generally the plateaus werenot flat without applying a magnetic field). The most commonfailure is the presence of an additional pump, probably formed dueto the disorder potential, in parallel with the lithographicallydefined pump.
FIG. 4. Current vs frequency for device 1 under single gate operation, showingthe expected linear trend and giving further evidence that current seen inFig. 3(a) is due to charge pumping. The Upper Gate voltage for this data islower than that used in Fig. 3(a): VUG = 2 V, Vent =−2.18, Vexit =−2.88 V,PRF =−14 dBm.
TABLE I. Comparison of capacitances and capacitive lever arms deduced from DCtransport, and from linecuts of pumping data in Fig. 3. Pumping Fit Values αent andαexit are derived from the charging energy measured with the two-gate turnstile,given by the plateau spacing along the bias voltage axis in Fig. 2(b). Relative errorsare estimated to be less than 10%. The agreement supports the thesis that the fea-tureless current corresponds to single-gate ratchet mode but without any quantiza-tion plateaus. We note that the agreement of αent and αexit simply represents theagreement of EC derived from DC and pumping data. EC for devices 1 and 2 mea-sured from DC data = 3.5 and 1.6 meV, respectively.
Variable
Device 1 DCmeasuredvalue
Device 1pumpingfit value
Device 2 DCmeasuredvalue
Device 2pumpingfit value
Cent-dot 2.1 aF 3.2 aF 11.4 aF 6.7 aFCexit-dot 2 aF 1.9 aF 8.4 aF 6.2 aFαent 0.045 0.07 0.12 0.11αexit 0.043 0.04 0.09 0.1
Journal ofApplied Physics ARTICLE scitation.org/journal/jap
J. Appl. Phys. 127, 094301 (2020); doi: 10.1063/1.5133967 127, 094301-4

In the later sections of this work, we will describe severalmechanisms to explain the combination of our success in generat-ing two-gate pumping but fail to see single-gate ratchet pumping inthe Si devices, as described above. We did not test any of theapproximately ten GaAs devices that failed to show single-gatepumping to see if they work in two-gate modes described above;however, we will also discuss how these mechanisms are consistentwith over 90% of GaAs devices that show single-gate ratchetpumping. For this later discussion, some of the significant featuresof the GaAs devices are as follows:
(1) The GaAs base carrier density is determined by modulationdoping, rather than an enhancement mode using a top gate.This requires only a single layer of gates.
(2) The GaAs devices generally have very smooth turnoff curves(i.e., the current is a smooth function of the gate voltage for asingle tunnel barrier, rather than showing resonances). This isgenerally due to cleaner epitaxial interfaces, unlike oxide layerspresent in Si devices.
(3) The GaAs devices operate in the N = 1 limit and have a smallernumber of electrons (∼10) loaded onto the dot and then back-tunneling from the dot to the source; in the Si devicesdescribed in this paper, there are a larger number of electronsbeing loaded and unloaded.
V. ERROR MECHANISMS
While the linecuts and frequency behavior indicate that thedevice is operating as a charge pump, they do not suggest what ispreventing plateaus from forming. The DC performance of thedevice, coupled with successful pumping using two separate ACsignals as shown in Fig. 2, suggest that simple problems, such asEC/kT being too low, poor AC transmission to the device, or thedot forming in an unintentional location, are not the limitingfactor. Here, we explore several possibilities as to what is eliminat-ing plateaus, investigating the plunger to barrier ratio Δptb, crosscapacitances in the device, and resonances in the tunnel barriers.
A. Dot not fully emptying
Due to the lack of a separate plunger gate and the large capaci-tive lever arm of the Upper Gate, the Si device is operating with alarge number of electrons on the quantum dot. Most studies(as well as the GaAs devices in this study) have focused on the dotcompletely emptying during unloading (bottom of the pumpingmap in Fig. 8). This has several benefits, including a larger EC dueto the smaller capacitance at more negative barrier gate voltagesand the lack of errors when unloading. A large number of electronscan also cause state preparation errors. Because of nonadiabaticstate transition and electron–electron interactions, we cannotassume that the dot is always in the ground state in our dynamicsystem. Each time we capture multiple electrons, the configurationof their state occupation can be different from previous cycles. Thisresults in a different total energy of the system between cyclesand smears out the plateaus. The larger the number of capturedelectrons, the larger the smearing effect. This loading of excitedstates has been observed in previous studies.34 However, all studies
showing data similar to that in Fig. 3 show several plateaus wherethe dot is not fully unloading, and indeed one study seems to takeplace where no plateau fully empties the dot.35
Although studies such as d’Hollosy et al.35 indicate that quan-tized pumping is possible without fully emptying the dot, it is pos-sible that this single error mechanism is preventing visible plateaus.Regardless, this should not impact the analysis of other possibleerror mechanisms that follow. This error mechanism also does notaffect two-gate pumping methods, as the loading of the dot can becontrolled to always position the Fermi level of the lead in reso-nance with the first empty occupation level of the dot, preventingloading of excited states.
B. Dependence on energy parameters
Several papers have discussed Δptb and its effect on pumping,investigating Δptb vs the critical time τ,23 the temperature kT,30,39
and briefly discussing it with respect to the charging energy EC.24
For the one-gate ratchet pumping mechanism to work, we requiresome cross capacitance between the gate and the dot. The smallerthis cross capacitance, the larger the necessary AC signal becomesto elevate the dot’s electrochemical potential above the exit barrier.This sets a lower limit that Δptb > 0. In practice, a large AC signalproduces local heating, and this sets a somewhat higher value forthe lower limit on Δptb. An upper limit on Δptb however, has notbeen studied.
To better investigate the effect of Δptb on pumping, we used amaster equation approach40–42 to determine how many electronsare left on the dot after the loading phase,
En(t) ¼ �EC F � n� Δ ptb
EC
tτ
� �þ eVG, (2)
Γ n ¼ Γ 0,n(1þ e�βEn(t))�1e�tτ , (3)
dPn(t)dt
¼ �Γ n(t)Pn(t)þ Γ nþ1(t)Pnþ1(t), (4)
where F is the Fermi level in units of EC, VG is the gate voltage, Γnis the tunnel rate of the nth electron out of the dot, β = 1/kT, andPn is the probability that the dot has n electrons (starting with theinitial condition Pn(0) ¼ 0, PN (0) ¼ 1). We also used a barrierwidth of 30 nm with a starting height of 100meV in determiningΓ0,n. We calculated Pn by numerically integrating Eq. (4) to t > 10τand then calculated the average number of captured electrons byusing the expectation value. The number of expected electrons lefton the dot after the loading step is shown in Fig. 5. Figure 5(a)shows the number of electrons captured as a function of a plungergate voltage. This shows the expected plateaus, with more electronsbeing captured as the dot is plunged further. When we vary the ratioΔptb/EC, we see the plateaus begin to degrade, becoming nearlycompletely washed out by the time Δptb/EC is 0.4. In their device,Giblin et al.30 estimated Δptb = 1meV with a charging energy thatappears to be larger than 10meV, resulting in a ratio of less than 0.1.
The most relevant work in exploring error rates when loadingis the universal decay cascade model, first outlined in 2010 by
Journal ofApplied Physics ARTICLE scitation.org/journal/jap
J. Appl. Phys. 127, 094301 (2020); doi: 10.1063/1.5133967 127, 094301-5
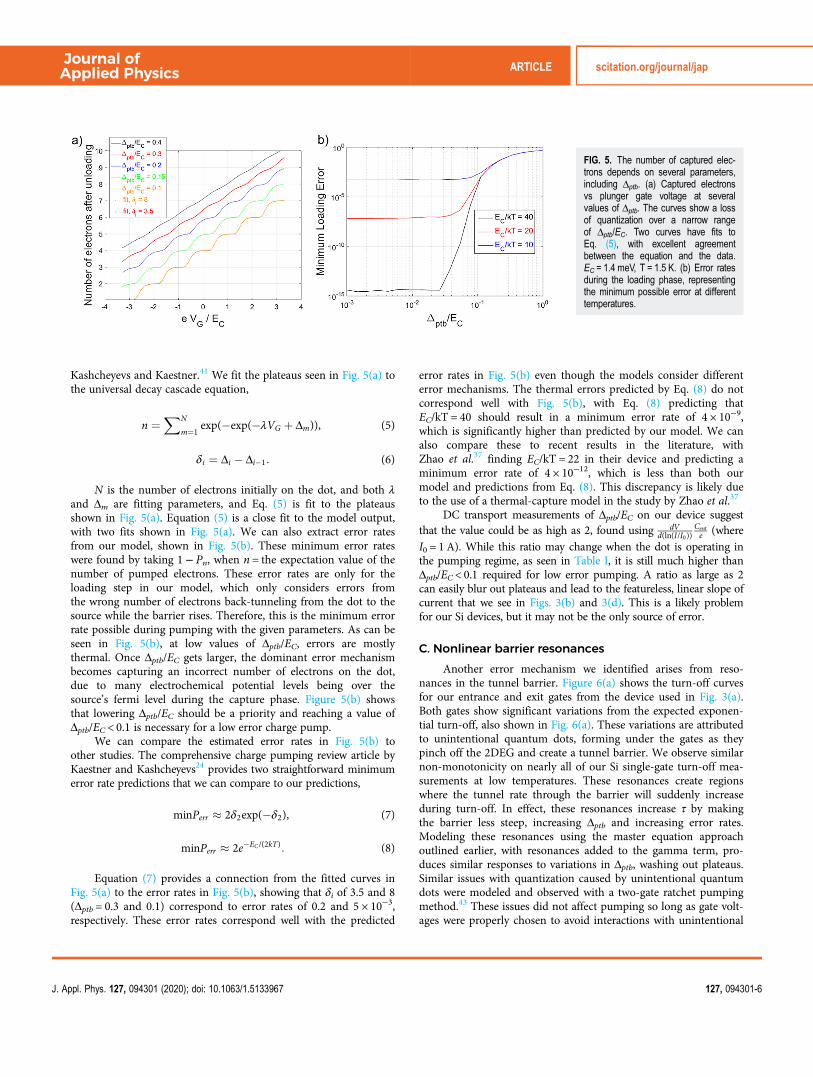
Kashcheyevs and Kaestner.41 We fit the plateaus seen in Fig. 5(a) tothe universal decay cascade equation,
n ¼XN
m¼1exp(�exp(�λVG þ Δm)), (5)
δi ¼ Δi � Δi�1: (6)
N is the number of electrons initially on the dot, and both λand Δm are fitting parameters, and Eq. (5) is fit to the plateausshown in Fig. 5(a). Equation (5) is a close fit to the model output,with two fits shown in Fig. 5(a). We can also extract error ratesfrom our model, shown in Fig. 5(b). These minimum error rateswere found by taking 1− Pn, when n = the expectation value of thenumber of pumped electrons. These error rates are only for theloading step in our model, which only considers errors fromthe wrong number of electrons back-tunneling from the dot to thesource while the barrier rises. Therefore, this is the minimum errorrate possible during pumping with the given parameters. As can beseen in Fig. 5(b), at low values of Δptb/EC, errors are mostlythermal. Once Δptb/EC gets larger, the dominant error mechanismbecomes capturing an incorrect number of electrons on the dot,due to many electrochemical potential levels being over thesource’s fermi level during the capture phase. Figure 5(b) showsthat lowering Δptb/EC should be a priority and reaching a value ofΔptb/EC < 0.1 is necessary for a low error charge pump.
We can compare the estimated error rates in Fig. 5(b) toother studies. The comprehensive charge pumping review article byKaestner and Kashcheyevs24 provides two straightforward minimumerror rate predictions that we can compare to our predictions,
minPerr � 2δ2exp(�δ2), (7)
minPerr � 2e�EC /(2kT): (8)
Equation (7) provides a connection from the fitted curves inFig. 5(a) to the error rates in Fig. 5(b), showing that δi of 3.5 and 8(Δptb = 0.3 and 0.1) correspond to error rates of 0.2 and 5 × 10⁻³,respectively. These error rates correspond well with the predicted
error rates in Fig. 5(b) even though the models consider differenterror mechanisms. The thermal errors predicted by Eq. (8) do notcorrespond well with Fig. 5(b), with Eq. (8) predicting thatEC/kT = 40 should result in a minimum error rate of 4 × 10⁻⁹,which is significantly higher than predicted by our model. We canalso compare these to recent results in the literature, withZhao et al.37 finding EC/kT = 22 in their device and predicting aminimum error rate of 4 × 10⁻¹², which is less than both ourmodel and predictions from Eq. (8). This discrepancy is likely dueto the use of a thermal-capture model in the study by Zhao et al.37
DC transport measurements of Δptb/EC on our device suggestthat the value could be as high as 2, found using dV
d(ln(I/I0))Cente (where
I0 = 1 A). While this ratio may change when the dot is operating inthe pumping regime, as seen in Table I, it is still much higher thanΔptb/EC < 0.1 required for low error pumping. A ratio as large as 2can easily blur out plateaus and lead to the featureless, linear slope ofcurrent that we see in Figs. 3(b) and 3(d). This is a likely problemfor our Si devices, but it may not be the only source of error.
C. Nonlinear barrier resonances
Another error mechanism we identified arises from reso-nances in the tunnel barrier. Figure 6(a) shows the turn-off curvesfor our entrance and exit gates from the device used in Fig. 3(a).Both gates show significant variations from the expected exponen-tial turn-off, also shown in Fig. 6(a). These variations are attributedto unintentional quantum dots, forming under the gates as theypinch off the 2DEG and create a tunnel barrier. We observe similarnon-monotonicity on nearly all of our Si single-gate turn-off mea-surements at low temperatures. These resonances create regionswhere the tunnel rate through the barrier will suddenly increaseduring turn-off. In effect, these resonances increase τ by makingthe barrier less steep, increasing Δptb and increasing error rates.Modeling these resonances using the master equation approachoutlined earlier, with resonances added to the gamma term, pro-duces similar responses to variations in Δptb, washing out plateaus.Similar issues with quantization caused by unintentional quantumdots were modeled and observed with a two-gate ratchet pumpingmethod.43 These issues did not affect pumping so long as gate volt-ages were properly chosen to avoid interactions with unintentional
FIG. 5. The number of captured elec-trons depends on several parameters,including Δptb. (a) Captured electronsvs plunger gate voltage at severalvalues of Δptb. The curves show a lossof quantization over a narrow rangeof Δptb/EC. Two curves have fits toEq. (5), with excellent agreementbetween the equation and the data.EC = 1.4 meV, T = 1.5 K. (b) Error ratesduring the loading phase, representingthe minimum possible error at differenttemperatures.
Journal ofApplied Physics ARTICLE scitation.org/journal/jap
J. Appl. Phys. 127, 094301 (2020); doi: 10.1063/1.5133967 127, 094301-6

quantum dots but reduced or eliminated pumping quantizationwhen an unintentional dot could be loaded or unloaded duringthe pumping steps. Resonances were also observed to complicatepumping with the one-gate ratchet method,44 though this studyfound a regime of operation where the resonances did not impactaccuracy.
D. Phase offset and heating
In Figs. 3(a) and 3(c), we can see a region where the sign ofthe current changes from negative to positive (right of the verticaldashed line). This current change is likely due to rectificationcurrent,45 a result of cross capacitances in the device. We can usethe rectification current model laid out by Giblin et al.45 to gainsome information about capacitances in our device. Furtherdescription of the model can be found in Appendix B. The rectifi-cation model reveals an induced bias of 8 mVpp while pumping.This induced AC signal is still small compared to the barrier heightused while pumping but indicates that the applied AC signal iscapacitively coupling to other parts of the device.
To estimate the induced AC signal on different gates, wecreated a simple circuit of the device (shown in Appendix B,Fig. 10). This circuit used estimates of the capacitive coupling,inductances, and resistances, taken from the design of the deviceand DC measurements. We can use the circuit model to estimatethe phase difference between the applied AC signal and the dotwhen taking into account the induced AC signal.
The phase difference between the applied AC signal and thedot is shown in Fig. 7, with the phase of the dot being greater thanthe phase of the barrier modulation. We assume the barrier heightmoves in phase with the applied AC signal. The source of this
phase difference is capacitive coupling between the gate and theUpper Gate, and the Upper Gate and the dot, combined with resis-tances and inductances in the device. The capacitive couplingbetween the Upper Gate and the dot is two to three times largerthan the coupling between the barrier gate and the dot, so anyinduced AC signal on the Upper Gate will cause a change in the
FIG. 6. (a) Single gate sweep from Si device 1, showing resonances as the gates turn-off conduction through the channel (For red and black curves, VDC = 0.8 mV,VUG = 2.3 V, and all other gates are grounded). The figure also shows, for example, an ideal exponential turnoff curve with no resonances and a steepness of 20 mV/decade. (b) Simulation using the master equation approach from Eq. (4) with an exponential tunneling rate (No Resonances), and an exponential tunneling rate with largeresonances included (With Resonances). The curves in (b) are intentionally offset.
FIG. 7. An RC model of the system (Appendix B) predicts phase offsetbetween the applied AC signal and the dot, with the phase of the dot beinggreater than the phase of the applied AC signal. This phase offset can lead tohot electrons loading onto the dot.
Journal ofApplied Physics ARTICLE scitation.org/journal/jap
J. Appl. Phys. 127, 094301 (2020); doi: 10.1063/1.5133967 127, 094301-7

dot’s electrochemical potential level during pumping. If there is aphase difference between the applied AC signal and the AC signalon the Upper Gate, it will cause some phase difference between theapplied AC signal and the dot. This phase difference can causeproblems while pumping if the phase of the dot’s electrochemicalpotential level is different from the phase of the barrier.
If the phase of the dot is greater than the phase of the barriermodulation, the dot’s electrochemical potential level will be wellbelow the source’s Fermi level before the entrance barrier tunnelingrate becomes high enough to allow tunneling. This can result in alarge energy loss for each electron that tunnels onto the dot, causinglocalized heating. For the large 10 dBm pumping signal shown inFig. 3(c), a 12° phase difference would lead to the dot being 8meVbelow the source Fermi level when Γentrance < 1/τ. This will cause twoto three electrons to rush onto the dot, converting (3 + 2 + 1)EC∼N2/2EC (∼14meV for our device) into phonons. The electron–phonon cooling is proportional to (T5
e–T5latt),
40 resulting in an elec-tron temperature increase of Te∼N2/5, or 2.5× hotter than if the dotand barrier oscillated in phase. Following the procedure byZimmerman et al.,40 with a 10 dBm, 500MHz signal, the 12° phaseoffset can result in an electron temperature of 3.5 K. This localizedheating significantly raises kT, reducing plateaus and contributing tothe featureless pumping map shown in Figs. 3(a) and 3(c). It shouldbe noted that N in this analysis is the number of electrons originallyloaded onto the dot, not the number captured, as electrons cantunnel back off the dot before the capture phase is complete.
If the dot lags behind the barrier, the main error mechanismwould be the entrance barrier beginning to fall when the dot’s elec-trochemical potential is still rising. If the entrance barrier is of similarheight to the exit barrier when the dot’s electrochemical potential isnear the height of both barriers, then the electron could tunnel backto the source, causing a significant error. Whether the phase of thedot is greater or less than the phase of the barrier, error rates increase,and this capacitive coupling should be minimized. This capacitivecoupling is not a limiting factor in the two-gate pumping schemesdue to the second AC signal, which is of similar amplitude andshifted by nearly 180°. These two AC signals will cancel the inducedAC signal in other parts of the device, eliminating potential issuesand creating robust pumping plateaus. This capacitive coupling isalso reduced in GaAs devices due to the lack of an Upper Gate.
E. Methods to reduce error mechanisms
The four error mechanisms we have laid out here can eachindependently increase errors or eliminate pumping altogether.Each of these mechanisms is reduced or eliminated in pumpingmodes using a second phase-shifted AC signal. They are also each
reduced or eliminated in GaAs devices. In order to reduce theseerrors in devices using only a single AC signal, several designchanges could be beneficial. The first is to reduce the number ofelectrons remaining on the dot after pumping, ideally to 0. Thiscan be accomplished with a separate plunger gate, allowing theelectrochemical potential of the dot to be modulated independentof the leads or the barriers. The second is to reduce Δptb, whichholds true regardless of the materials system. This can be accom-plished in several ways, but the simplest is to reduce the oxide/spacer thickness between the barrier gate and the 2DEG. As thisthickness decreases, it will increase the capacitive coupling betweenthe barrier gate and the barrier, lowering Δptb. Another possibilitywould be to increase the barrier gate length, which would decreasethe “transverse energy”24,40 and make the barrier turn-off steeper.However, we do not recommend increasing the barrier length, as ittends to increase the number of resonances due to unintentionalquantum dots under the barrier in Si devices. In fact, to decreaseresonances in the device, a shorter barrier gate is beneficial.This optimal barrier length, short enough to reduce/eliminateresonances and long enough to minimize the transverse energy,and thus Δptb, depends greatly on device specifics and must be opti-mized for specific materials and fabrication methods.
The most apparent method to minimize issues due to crosscapacitance (rectification, phase shifts of the dot, etc.) is to reducecapacitance between gates and between DC gates and the dot. GaAsdevices, which have no Upper Gate and often have larger spacingsbetween gates, naturally have a lower cross capacitance than Sidevices. Nippon Telegraph and Telephone (NTT) has created Sidevices with a similar design to our own, which have a ratio betweenthe Upper Gate lever arm and the barrier gate lever arm of 0.313 andhave demonstrated one-gate pumping. This lower capacitance helpsto eliminate complications due to phase shifts in the dot.Alternatively, reducing the capacitance between the Upper Gate andthe barrier gate will also help reduce the induced signal on the device.This can be achieved by splitting the Upper Gate into a plunger gateand two other gates to invert the ohmic leads to the device, resultingin a device similar to those fabricated at the University of New SouthWales (UNSW), which have been shown to operate as robustpumps.37,46 It also helps to lower Δptb by reducing the extra plungereffect from induced AC signals on non-controlled gates.
Reducing the impedance to ground of DC controlled gates canalso reduce the induced AC signal. This can be achieved by increas-ing capacitance between the gate and ground near the device orreducing the series impedance from the gate to the DC voltagesource. Either of these approaches will reduce the unintentional ACsignal at the device and should reduce errors in one-gate ratchetpumping mode (Table II).
TABLE II. Summary of main error mechanisms with suggestions to reduce these errors.
Type Result Parameter Solution
I. Dot not emptying Plateaus not visible Nelectrons > 0 Separate plunger gateII. Δptb/EC Plateaus not visible Δptb/EC > 0.4 Decrease Cgate − island
III. Resonances Plateaus reduced by 90% Many resonances Reduce defects in Si barrierIV. Phase offset Plateaus reduced by 30% ΔΦ = 12° Decrease Cgate − island
Journal ofApplied Physics ARTICLE scitation.org/journal/jap
J. Appl. Phys. 127, 094301 (2020); doi: 10.1063/1.5133967 127, 094301-8

VI. CONCLUSIONS
We have shown pumping results from Si devices fabricated inan SOI architecture, with plateaus using two AC signals, but no pla-teaus with only a single AC signal. The one-gate current producedby two of our devices agrees with the expected pumping currentwith no visible plateaus. This lies in contrast to GaAs devices, whichhave a much higher yield and have demonstrated one-gate pumping.We proposed four possible reasons for the lack of plateaus: a largenumber of electrons on the dot, a plunger-to-barrier ratio that is toohigh, resonances in the tunnel barrier, and cross capacitances in thedevice. Future Si devices will benefit from several design changes,notably reducing the gate oxide thickness, reducing the barrierlength, and reducing capacitances in the device. These recommenda-tions may prove useful to the community at large in producing morerobust, higher yield one-gate ratchet pumps.
ACKNOWLEDGMENTS
The authors would like to thank Tuomo Tanttu, SlavaKashcheyevs, Bernd Kaestner, and Gento Yamahata for providinginformation about their experiences and valuable insights intodevice operation.
APPENDIX A: ONE-GATE RATCHET PUMPING MAP
To determine what a pumping map should look like if theplateau width went to 0, we started by considering the ideal
one-gate pumping map. When pumping a quantized number ofelectrons each cycle, plateaus should occur within the solid blacklines shown in Fig. 8. As the AC signal shrinks or the plunger gatevoltage increases, the loading line moves up to higher entrance gatevoltages, and the tall plateaus in the figure shrink and eventually allplateaus become equal in size once we reach the large N limit. Theslopes and equations governing the shape of this pumping map aredescribed elsewhere35 and typically describe step functions of currentto trace out the expected plateaus. If some error mechanism is largeenough to cause plateaus to completely disappear, so that current islinear in any direction, a gate sweep of the entrance or exit barrierwould produce a linear change of current. That linear current wouldhave the following slope along the entrance gate axis,
mVent ¼ fCent-dot , (A1)
where mVent is the slope along the entrance barrier axis. Figures 3(b)and 3(d) in the main text show that these fits to a small portion ofthe pumping curve, limited by the gate voltages. If there were noerror mechanisms, one would expect the pumping maps shown inFig. 3 to closely resemble the sketch below in Fig. 8.
APPENDIX B: RECTIFICATION CURRENT
The effect of cross capacitances in a charge pump has beenexplored previously by Giblin et al.,45 where an AC signal applied
FIG. 8. Pumping map with plateau regions and slope of loading line indicated.The solid black lines indicate transition regions where the number of pumpedelectrons, n, changes. ΔN is the number of electrons captured after the loadingphase ends, and n is the total number of pumped electrons.
FIG. 9. Single gate turn-off sweeps, illustrating DC and AC response, fromdevice 2. The blue curve shows the data from a single gate sweep scaled downby a factor of 100, with a small DC bias, where the current turns on once thegate voltage reaches a high enough value. The red curve shows a sweep of thesame gate, with no DC bias and an applied AC signal. The black curve isthe model, fit to the red curve, producing the fit parameters of VDC = 25 μV(expected value of 0 V), VAC = 95 mV (expected value of 100 mV), and acoupling parameter k of −2.2 × 10⁻³. Blue curve taken at VDC = 0.8 mV,VUG = 2.5 V, VLGC = VLGD = 1 V, no VAC. Red curve taken at VDC = 0 mV,VUG = 2.5 V, VLGC = VLGD = 1 V, VAC on LGS = 5 MHz 50 mVpp sine wave.
Journal ofApplied Physics ARTICLE scitation.org/journal/jap
J. Appl. Phys. 127, 094301 (2020); doi: 10.1063/1.5133967 127, 094301-9

to a single barrier can create current flow. This is a useful tool forexploring cross capacitances in a device, and we applied the modelproposed by Giblin to our device. The model is applied to everypoint on the gate sweep and reduces to I ¼ mean(kV(t)G(t)), wherek is a fitting parameter to determine the capacitances, V is theapplied AC voltage, and G is the conductivity of the barrier measuredwith DC transport. In Fig. 9, we see that the current changes signifi-cantly from the DC to the AC case, and that the rectification modelfits the data very well. This suggests a large capacitive coupling at thedevice and a large induced AC signal (at least 8mV under typicalpumping conditions).
In Fig. 10(b), we compare the estimate from our circuit model[Fig. 10(a)] to the induced AC bias deduced from the rectificationcurrent model. The original estimates of the circuit parameterswere used to set ranges, and the model was varied within thatrange to produce the best fit to the rectification data. We see thatour circuit model follows the same trend as the data from the recti-fication current model, suggesting that our circuit model is a closeestimate of the actual device. Resonances and reflections due tonon-idealities in the device are the most likely culprit for the varia-tions in the rectification current.
The agreement between the circuit model and the data mea-sured from rectification current showed that our circuit modelapproximates the device. This allowed us to extract the phase of thedot compared to the AC circuit applied to the barrier. Since the ACsignal on the node in Fig. 10(a) is phase shifted from the appliedAC signal, and knowing the capacitance between various nodeson the device and the dot, we approximated the phase. This isdiscussed further in the main text.
Further details on the devices can be found here for future ref-erence. Device 1: MS-3GGL4-25, 100 nm dot with 100 nm longgates, L:\internal\SET_data\dry DR I\Runs\MS-3GGL4-25,Entrance Gate = LGS, Exit Gate = LGC
Device 2: MS-3GGL4-36, 100 nm dot with 200 nm longgates, L:\internal\SET_data\dry DR I\Runs\MS-3GGL4-36, EntranceGate = LGC, Exit Gate = LGD
Figure raw files in L:\internal\SET_team\Roy\Charge pumping\Device Design Manuscript
REFERENCES1J. Ma and E. R. Fossum, J. Electron Device Soc. 3, 73 (2015).2M. Veldhorst, C. H. Yang, J. C. C. Hwang, W. Huang, J. P. Dehollain,J. T. Muhonen, S. Simmons, A. Laucht, F. E. Hudson, K. M. Itoh, A. Morello,and A. S. Dzurak, Nature 526, 410 (2015).3K. Nishiguchi, A. Fujiwara, Y. Ono, H. Inokawa, and Y. Takahashi, Appl. Phys.Lett. 88, 183101 (2006).4M. J. T. Milton, J. M. Williams, and A. B. Forbes, Metrologia 47, 279 (2010).5N. Feltin and F. Piquemal, Eur. Phys. J. Spec. Top. 172, 267 (2009).6M. W. Keller, J. M. Martinis, N. M. Zimmerman, and A. H. Steinbach,Appl. Phys. Lett. 69, 1804 (1996).7S. P. Giblin, S. J. Wright, J. D. Fletcher, M. Kataoka, M. Pepper,T. J. B. M. Janssen, D. A. Ritchie, C. A. Nicoll, D. Anderson, and G. A. C. Jones,New J. Phys. 12, 073013 (2010).8S. P. Giblin, M. Kataoka, J. D. Fletcher, P. See, T. J. B. M. Janssen, J. P. Griffiths,G. A. C. Jones, I. Farrer, and D. A. Ritchie, Nat. Commun. 3, 930 (2012).9F. Stein, D. Drung, L. Fricke, H. Scherer, F. Hohls, C. Leicht, M. Götz,C. Krause, R. Behr, E. Pesel, K. Pierz, U. Siegner, F. J. Ahlers, H. W. Schumacher,F. Hohls, C. Krause, R. Behr, E. Pesel, and K. Pierz, Appl. Phys. Lett. 103501, 0(2015).10F. Stein, R. Behr, M. Gotz, E. Pesel, T. Weimann, K. Pierz, H. W. Schumacher,and F. Hohls, Metrologia 54, S1 (2017).11L. E. F. Foa Torres, Phys. Rev. B 72, 245339 (2005).12B. Kaestner, V. Kashcheyevs, S. Amakawa, M. D. Blumenthal, L. Li,T. J. B. M. Janssen, G. Hein, K. Pierz, T. Weimann, U. Siegner, andH. W. Schumacher, Phys. Rev. B Condens. Matter Mater. Phys. 77, 153301 (2008).13A. Fujiwara, K. Nishiguchi, and Y. Ono, Appl. Phys. Lett. 92, 2006 (2008).14P. Hänggi and F. Marchesoni, Rev. Mod. Phys. 81, 387 (2009).15X. Jehl, B. Voisin, T. Charron, P. Clapera, S. Ray, B. Roche, M. Sanquer,S. Djordjevic, L. Devoille, R. Wacquez, and M. Vinet, Phys. Rev. X 3, 021012(2013).16G. Yamahata, S. P. Giblin, M. Kataoka, T. Karasawa, and A. Fujiwara, Sci. Rep.7, 3 (2017).17S. J. Wright, M. D. Blumenthal, M. Pepper, D. Anderson, G. A. C. Jones,C. A. Nicoll, and D. A. Ritchie, Phys. Rev. B Condens. Matter Mater. Phys.80, 113303 (2009).18V. F. Maisi, Y. A. Pashkin, S. Kafanov, J. S. Tsai, and J. P. Pekola, New J. Phys.11, 113057 (2009).19P. Mirovsky, C. Leicht, B. Kaestner, V. Kashcheyevs, K. Pierz, andH. W. Schumacher, in CPEM 2010—Conference on Precision ElectromagneticMeasurements. Conference Digest (IEEE, 2010), p. 119.
FIG. 10. (a) Circuit model of the device,including a capacitance to ground distribu-ted among the gate resistance. (b) Fitsfrom rectification data similar to Fig. 9from device 2 showing voltage at thenode indicated in (a) as a function offrequency, compared to the inducedvoltage measured with the rectificationmodel, using the parametersCContact = 1 × 10
−15 F, RContact = 6 × 10⁵Ω,
CGate = 9 × 10⁻¹⁶ F, CStray = 6 × 10
−14 F,RGate = v6 × 10
4Ω.
Journal ofApplied Physics ARTICLE scitation.org/journal/jap
J. Appl. Phys. 127, 094301 (2020); doi: 10.1063/1.5133967 127, 094301-10

20S. Nakamura, Y. A. Pashkin, J. S. Tsai, and N. H. Kaneko, IEEE Trans.Instrum. Meas. 64, 1696 (2015).21N. M. Zimmerman, W. H. Huber, B. Simonds, E. Hourdakis, A. Fujiwara,Y. Ono, Y. Takahashi, H. Inokawa, M. Furlan, and M. W. Keller, J. Appl. Phys.104, 033710 (2008).22W. G. Van Der Wiel, Rev. Mod. Phys. 75, 1 (2002).23V. Kashcheyevs and J. Timoshenko, Phys. Rev. Lett. 109, 216801 (2012).24B. Kaestner and V. Kashcheyevs, Rep. Prog. Phys. 78, 103901 (2015).25G. Yamahata, K. Nishiguchi, and A. Fujiwara, Phys. Rev. B Condens. MatterMater. Phys. 89, 165302 (2014).26R. Murray, J. K. Perron, M. D. Stewart, and N. M. Zimmerman,Nanotechnology 29, 065202 (2018).27P. J. Koppinen, M. D. Stewart, and N. M. Zimmerman, IEEE Trans. ElectronDevices 60, 78 (2013).28M. D. Blumenthal, B. Kaestner, L. Li, S. Giblin, T. J. B. M. Janssen, M. Pepper,D. Anderson, G. Jones, and D. A. Ritchie, Nat. Phys. 3, 343 (2007).29S. P. Giblin, A. Fujiwara, G. Yamahata, M. H. Bae, N. Kim, A. Rossi,M. Möttönen, and M. Kataoka, Metrologia 56, 044004 (2019).30S. P. Giblin, M. Bae, N. Kim, Y. Ahn, and M. Kataoka, Metrologia 54, 299 (2017).31Y. Ono and Y. Takahashi, Appl. Phys. Lett. 82, 1221 (2003).32L. P. Kouwenhoven, A. T. Johnson, N. C. van der Vaart, andC. J. P. M. Harmans, Phys. Rev. Lett. 67, 1626 (1991).33A. Fujiwara, N. M. Zimmerman, Y. Ono, and Y. Takahashi, Appl. Phys. Lett.84, 1323 (2004).34M. Kataoka, J. D. Fletcher, P. See, S. P. Giblin, T. J. B. M. Janssen,J. P. Griffiths, G. A. C. Jones, I. Farrer, and D. A. Ritchie, Phys. Rev. Lett. 106,126801 (2011).35S. D’hollosy, M. Jung, A. Baumgartner, V. A. Guzenko, M. H. Madsen,J. Nygård, and C. Schönenberger, Nano Lett. 15, 4585 (2015).
36G. Yamahata, S. P. Giblin, M. Kataoka, T. Karasawa, and A. Fujiwara,Appl. Phys. Lett. 109, 013101 (2016).37R. Zhao, A. Rossi, S. P. Giblin, J. D. Fletcher, F. E. Hudson,M. Möttönen, M. Kataoka, and A. S. Dzurak, Phys. Rev. Appl. 8, 044021 (2017).38L. P. Kouwenhoven, C. M. Marcus, P. L. McEuen, S. Tarucha,R. M. Westervelt, and N. S. Wingreen, “Electron transport in quantum dots,” inMesoscopic Electron Transport. NATO ASI Series (Series E: Applied Sciences),edited by L. L. Sohn and L. P. Kouwenhoven (Springer, Dordrecht, 1997),Vol. 345.39V. Kashcheyevs and J. Timoshenko, in IEEE Conference on PrecisionElectromagnetic Measurements (IEEE, 2014), p. 536.40N. M. Zimmerman, E. Hourdakis, Y. Ono, A. Fujiwara, and Y. Takahashi,J. Appl. Phys. 96, 5254 (2004).41V. Kashcheyevs and B. Kaestner, Phys. Rev. Lett. 104, 186805 (2010).42L. Fricke, M. Wulf, B. Kaestner, V. Kashcheyevs, J. Timoshenko, P. Nazarov,F. Hohls, P. Mirovsky, B. MacKrodt, R. Dolata, T. Weimann, K. Pierz, andH. W. Schumacher, Phys. Rev. Lett. 110, 126803 (2013).43P. Clapera, J. Klochan, R. Lavieville, S. Barraud, L. Hutin, M. Sanquer,M. Vinet, A. Cinins, G. Barinovs, V. Kashcheyevs, and X. Jehl, IEEE ElectronDevice Lett. 38, 414 (2017).44A. Rossi, J. Klochan, J. Timoshenko, F. E. Hudson, M. Möttönen, S. Rogge,A. S. Dzurak, V. Kashcheyevs, and G. C. Tettamanzi, Nano Lett. 18, 4141(2018).45S. P. Giblin, M. Kataoka, J. D. Fletcher, P. See, T. J. B. M. Janssen,J. P. Griffiths, G. A. C. Jones, I. Farrer, and D. A. Ritchie, J. Appl. Phys. 114,164505 (2013).46A. Rossi, T. Tanttu, K. Y. Tan, I. Iisakka, R. Zhao, K. W. Chan,G. C. Tettamanzi, S. Rogge, A. S. Dzurak, and M. Mottonen, Nano Lett. 14, 3405(2014).
Journal ofApplied Physics ARTICLE scitation.org/journal/jap
J. Appl. Phys. 127, 094301 (2020); doi: 10.1063/1.5133967 127, 094301-11