response to follow-up questions - 26 february 2015 web view2. icon water limited ... the chief...
TRANSCRIPT

Response to follow-up questions26 February 2015
Industry Panel review of the Price Direction for regulated water and sewerage services determined by the Independent Competition and Regulatory Commission in June 2013

2 Icon Water Limited
Icon Water Limited (formerly ACTEW Corporation Limited) is an unlisted public company that owns and operates the water and sewerage assets and business in the ACT. The company is owned by the ACT Government and has two voting shareholders: the Chief Minister and Deputy Chief Minister of the ACT.

Icon Water Limited 3
ContentsContents.........................................................................................................................................................3
A. Alternative proposed price path and WACC...........................................................................................4
B. Deadband...............................................................................................................................................6
C. Risk of a revenue shortfall.....................................................................................................................14
D. Demand................................................................................................................................................15
E. Equity beta............................................................................................................................................29
F. Water Abstraction Charge pass-through...............................................................................................33
G. Feedback on proposed annual reporting requirements........................................................................34
H. Questions from the public....................................................................................................................35

Panel questions
1) Please confirm, in tabular form, the alternative price path and weighted average cost of capital that it is contending for in its response the Panel’s draft decision. Preferably the tables should be in the same format as those in Table 14.6 and 10.1 of the Draft Decision.
4 Icon Water Limited
A. Alternative proposed price path and WACC
Table 1: Icon Water’s alternative weighted average cost of capital
Parameter Panel’s draft decision Approach to parameter estimationRisk-free rate 3.22% Icon Water is not contesting the draft decisionDebt margin 3.13% Icon Water is not contesting the draft decisionDebt raising cost 0.125% Icon Water is not contesting the draft decisionEquity beta 0.90 Equity beta estimated by SFG (as per SOFC, with
further evidence submitted in relation to asymmetric exposure to market conditions)
Market risk premium 7.23% Icon Water is not contesting the draft decisionGearing 60% Icon Water is not contesting the draft decisionCost of debt 6.48% Icon Water is not contesting the draft decisionCost of equity Risk-free rate + beta x MRPNominal vanilla WACC 7.78% Nominal vanilla WACC = Cost of debt x 60% + Cost
of equity x 40%Gamma 0.25 Australian Competition Tribunal and other
regulatory precedentsInflation 2.5% Icon Water is not contesting the draft decision
Table 2: Icon Water’s alternative price path for sewerage services
2013-14 2014-15 2015-16 2016-17 2017-18Prices payable under original price
directionIndicative estimates
SewerageSupply ($ pa) 492.02 505.41 578.77 593.24 608.07Fixtures ($ pa) 481.18 494.28 566.03 580.18 594.68
% Change on Previous YearSupply -18.1% 2.7% 14.5% 2.5% 2.5%Fixtures -18.1% 2.7% 14.5% 2.5% 2.5%

Icon Water Limited 5
Table 3: Icon Water’s alternative price path for water
2013-14 2014-15 2015-16 2016-17 2017-18Prices payable under original price
directionIndicative estimates
WaterFixed ($ pa) 100.00 102.56 116.53 119.44 122.43Tier 1 ($/kL) 2.55 2.64 3.00 3.07 3.15Tier 2 ($/kL) 5.10 5.29 6.01 6.16 6.31
% Change on Previous YearFixed 0.2% 2.6% 13.6% 2.5% 2.5%Tier 1 4.9% 3.5% 13.6% 2.5% 2.5%Tier 2 4.9% 3.7% 13.6% 2.5% 2.5%

Panel questionsIs a 7% deadband expected to adversely affect Icon Water’s financial viability? If so please give details of the impact and period of any likely detriment.Will service levels be impacted at the lower bound of the 7% deadband? If so to what extent will Icon Water seek out further operating efficiencies before reducing service quality? If there is any likely detriment to service levels, please identify the nature and extent of the impact.
6 Icon Water Limited
B. Deadband
Icon Water contends that the key focus should be recovery of efficient costs, since this will provide incentives for efficient investment, which is in the long-term interests of consumers. In its response to Question 4, Icon Water discusses in further detail the considerations to which other regulators have had regard and their applicability in this case.
While questions of impacts of service levels and financial viability are relevant to the Panel’s decision on form of control, they would not be greatly impacted within a three-year timeframe by water sales revenue falling 7 per cent short of the target. The major impact of this revenue outcome would be a distortion of incentives for efficient investment. Revenue fell short of forecast efficient costs in the 2008- 2013 period by around $263 million due to the control mechanism and demand forecasts set by the regulator. Another major revenue shortfall in the 2013-2018 period would further undermine Icon Water’s confidence in the regulatory system and the credibility of regulators’ commitment to provide reasonable opportunity to recover the efficient costs that it incurs in operating, maintaining and investing in water and sewerage services.
A 7 per cent shortfall in water sales revenue would probably lead Icon Water to defer investment, resulting in less productive efficiency going forward. Icon Water has planned a managed transition to a more efficient business. A key component of this transition will be investments in information and communication technology (ICT); in particular, the replacement of out-dated and obsolete assets, investment in core operational systems and the establishment of new business capabilities.
The majority of these ICT investments will look to replace end of useful life assets and take advantage of contemporary proven technology to enable real business benefits at a reasonable cost. Initially there will be increased licence and maintenance fees associated with bringing the new assets on line. Benefits (reductions in both cost and risk) will initially be small in the first two years as the emphasis is on replacing assets which have come to the end of their useful life. Benefits increase progressively in later years as extension projects begin to be implemented which will generate operating and capital expenditure savings due to the elimination of manual functions and the avoidance of maintenance costs associated with ageing infrastructure and supporting obsolete application servers.
A 7 per cent shortfall in water sales revenue would lead to delays in these investments and the subsequent efficiency benefits.

Panel question4) How was Icon Water’s alternative proposal of a 3% deadband established?
Icon Water Limited 7
Icon Water notes that this response also addresses Question 18.
Icon Water’s alternative proposal of a 3 per cent deadband was established by balancing considerations of:
Cost recovery; Price stability over this regulatory period and next; Incentives for demand-side management or utilisation; Incentives to set efficient tariffs; and Implications of inaccurate demand forecasting.
These are considerations to which the Australian Energy Regulator (AER) has had regard in its recent assessments of whether to apply a revenue cap or a weighted average price cap to electricity distribution
network service providers in Australia.1 These considerations are relevant to weighing trade offs associated with specifying the deadband, since a very large deadband results in a form of control similarto a price cap, while a very small deadband results in a form of control similar to a revenue cap.
Table 4 outlines a discussion of each of these considerations. It shows that only one of the considerations supports a larger deadband. Three of the considerations support a smaller deadband and one of the considerations is not relevant in Icon Water’s case.
Table 4: Considerations when specifying the deadband
Consideration Implication for the deadband
Reasons
Cost recovery Smaller deadband The deadband sets a limit on the over- or under-recovery of revenue relative to efficient costs. A smaller deadband would more closely match revenue with efficient costs in present value terms. Section 20(2)(e) of the ICRC Act requires the Panel to have regard to the cost of providing water and sewerage services.
Price stability over this regulatory period and next
Larger deadband Reducing the size of the deadband would increase both the likelihood and magnitude of any revenue (and corresponding price) adjustment to take place in the next regulatory period. Section 20(2)(g) and (j) require the Panel to have regard to social impacts and the effect on general price inflation.
1 AER 2013, Stage 1 Framework and approach paper, Ausgrid, Endeavour Energy and Essential Energy, Transitional regulatory control period 1 July 2014 to 30 June 2015, Subsequent regulatory control period 1 July 2015 to 30 June 2019, March

8 Icon Water Limited
Consideration Implication for the deadband
Reasons
Incentives for demand-side management or utilisation
Smaller deadband Depending on specific circumstances, it may be more appropriate to apply a price cap to encourage increased sales (utilisation) or to apply a revenue cap to encourage demand-side management. For example, the AER has decided to apply a revenue cap control mechanism to NSW electricity distribution network service providers in part because it provides better incentives for demand- side management. A smaller deadband is more appropriate in Icon Water’s case, since Icon Water is not in a position to increase utilisation. Connections are mandated and the ACT Water Strategy 2014-44 is targeting reductions in potable water use. Section 20(2)(h) of the ICRC Act requires the Panel to have regard to considerations of demand management.
Incentives to set efficient tariffs
Not applicable A justification for applying a weighted average price cap form of control has been that it provides an incentive to set more efficient tariffs that better align with costs. This consideration is not relevant in this case, since the Panel’s draft decision is to set tariffs for the remainder of the regulatory period and not allow Icon Water to adjust its tariff structure.
Implications of inaccurate demand forecasting
Smaller deadband When forecasting demand, there is ‘model uncertainty’ over and above the uncertainty resulting from the potential impacts of the weather. If the forecast is wrong in an ex ante sense, then systematic under or over recovery of revenue will result. Put another way, if weather uncertainty were to be characterised as a roll of the dice, model uncertainty could be characterised aswhether the dice are loaded.2 There are considerabledifferences between the forecasts derived by Icon Water, the Panel, and the ICRC. If the Panel were of the view that these differences indicate model uncertainty, then it would be prudent to adopt a smaller deadband to limit any resulting bias in revenue outcomes (either up or down). Icon Water notes that this issue was considered by the AER as part of its decision to apply revenue caps toNSW electricity distribution businesses.3
Even if only the first two considerations are taken into account – cost recovery and price stability – Icon Water’s view is that a deadband of 3 per cent of water sales would strike a better balance than a 7 per cent deadband. Our analysis shows that a $50 million revenue adjustment under the DVAM would lead to a water and sewerage bill impact in the order of 3 per cent in the next regulatory period. Putting aside uncertainty over the forecasting model and focussing only on weather uncertainty, there is almost no
2 For a discussion of uncertainty in the context of the requirement in the National Electricity Law to provide the opportunity to recover at least efficient costs, see Application by Energy Australia and Others [2009] ACompT 8 (with Corrigendum) at [81]-[82]3 AER 2013, Stage 1 Framework and approach paper Ausgrid, Endeavour Energy and Essential Energy,Transitional regulatory control period 1 July 2014 to 30 June 2015, Subsequent regulatory control period 1 July 2015 to 30 June 2019, June, pp.52-53.

- 4. 0 - 3. 6 - 3. 2 - 2. 8 - 2. 4 - 2. 0 - 1. 6 -
Icon Water Limited 9
chance of an adjustment exceeding this level under a 7 per cent deadband. Under a 3 per cent deadband, there is a 6 per cent chance of an adjustment exceeding this level (in absolute terms). In our view, the cost to the community of this 6 per cent chance of a price shock in excess of ±3 per cent is more than offset by the benefit of reducing the scope for revenue under or over recovery from ±$60 million to ±$25 million. This trade off is illustrated in Table 5 and Figure 1.
Table 5: Trade off between cost recovery and price stability
Deadband specificationApproximate limit on revenue
divergenceApproximate impact on price
stability
3% of water sales revenue ±$25 million6% chance of a price impact
exceeding ±3% in 2018
7% of water sales revenue ±$60 millionAlmost no chance of a price
impact exceeding ±3% in 2018
Figure 1: Probability of revenue adjustments under different deadband specifications
80.0 6%
60.0
40.0
20.0
0.0
-20.0
5%
Probability based on4% historical weather
sequences
3% Revenue adjustment(3% deadband)
-40.0
-60.0
-80.0
2% Revenue adjustment(7% deadband)
1%
-100.0 0%
Variance in demand from forecast (GL pa on average)
Reve
nue
adju
stm
ent (
$201
8-

10 Icon Water Limited
Panel question5) How will a 3% deadband benefit consumers if demand is lower than forecast?
Reducing the size of the deadband would benefit customers in an ex ante sense by:
providing more certainty with respect to the total amount the consumers will pay to Icon Water over the next two regulatory periods (see Question 6),
reducing the scope for Icon Water to generate revenue above what’s needed (thereby allowing the Panel to give more weight to Icon Water’s demand forecast), and
reducing the risk that Icon Water will have insufficient revenue to undertake investments that would improve productive efficiency going forward.
The Panel’s question refers in an ex post sense to the specific case in which demand turns out to be lower than forecast. When demand is lower than forecast over the regulatory period, customers pay less than the amount required to cover efficient costs (a revenue shortfall). Reducing the magnitude of the deadband on the demand volatility adjustment mechanism (DVAM) increases both the likelihood and the amount of any revenue adjustment at the end of the period. Over the course of this regulatory period and next, a 3 per cent deadband would limit the revenue shortfall on account of the current period to be around $25 million (in 2014-15 dollar terms), while a 7 per cent deadband would limit the revenue shortfall on account of the current period to be around $60 million. If demand were significantly lower than forecast, leading to a revenue shortfall of $60 million, a 3 per cent deadband would lead to a partially offsetting revenue adjustment in the order of $35 million (in 2014-15 dollar terms) in the next regulatory period.
Although customers would pay more over the course of the two regulatory periods under a 3 per cent (as distinct from a 7 per cent) deadband in this specific demand realisation, they will benefit over time because the provision for a revenue adjustment based on a 3 per cent deadband will provide the certainty needed to allow Icon Water to undertake investments that will improve productive efficiency going forward (see Question 2 and Question 3). Incentives for efficient investment are recognised as being in the long-term interest of consumers and are according to some authors the very purpose of
regulation.4
Icon Water notes that under a demand realisation in which demand is higher than forecast, customers will pay less over the course of the two regulatory periods under a 3 per cent (as distinct from a 7 per cent) deadband.
4 For example, “…the origins of regulatory governance is rooted in providing investment incentives…” (Spiller, P. T., 2010. Transaction Cost Regulation, Journal of Economic Behavior and Organization, p17)

Panel question6) Adopting a 3% deadband means that it is more likely that the deadband will be triggered and greater shortfalls or over recoveries will need to be dealt with in the following regulatory period. How will the adoption of a lower deadband increase predictability of consumer bills over time as claimed on page 10 of Icon Water’s submission?
Panel question7) With the exception of one water business in Victoria, all of the other regulated metropolitan water businesses in Australia are subject to a price cap or hybrid price and revenue cap form of control. Is there anything different about Icon Water’s business or its customers that should lead the Panel to adopt an alternative approach to other regulators? Has Icon Water now conceded its proposal for a pure revenue cap as articulated in its Statement of Facts and Contentions (dated 31 July 2014) in favour of a hybrid price and revenue cap? The Panel’s current view is that the adoption of a lower deadband level will likely mean that the form of control more closely mimics a revenue cap than a price cap. If Icon does not agree, please provide any further comments you wish the Panel to consider.
Icon Water Limited 11
As discussed in our response to Question 4, reducing the deadband would not increase the predictability of unit prices over time. The point being made in our submission is that reducing the deadband would increase the predictability of the total amount of consumer bills (that is, the amount paid by customers to Icon Water in total) over this regulatory period and next. Consider a situation in which extremely hot and dry weather conditions eventuate over the next two years. Customers would use more water and receive much larger bills than in the past. With a smaller deadband in place, customers would have more assurance that their bills would be lower in future to compensate for the larger bills being paid now.
Icon Water’s preferred control mechanism remains a revenue cap with annual demand forecast updates as proposed in its SOFC. Given the Panel’s draft decision to apply a hybrid price and revenue cap, Icon Water’s submission of 23 January 2015 provided views on how an amendment to this control mechanism could improve the balance between price stability and cost recovery and recognise Icon Water’s limited ability to manage demand risk. Icon Water is focussing on demonstrating the merit of this minor amendment, rather than continuing to press its original proposal, in recognition of the clear preference expressed by the Panel in its draft report for a hybrid price and revenue cap.
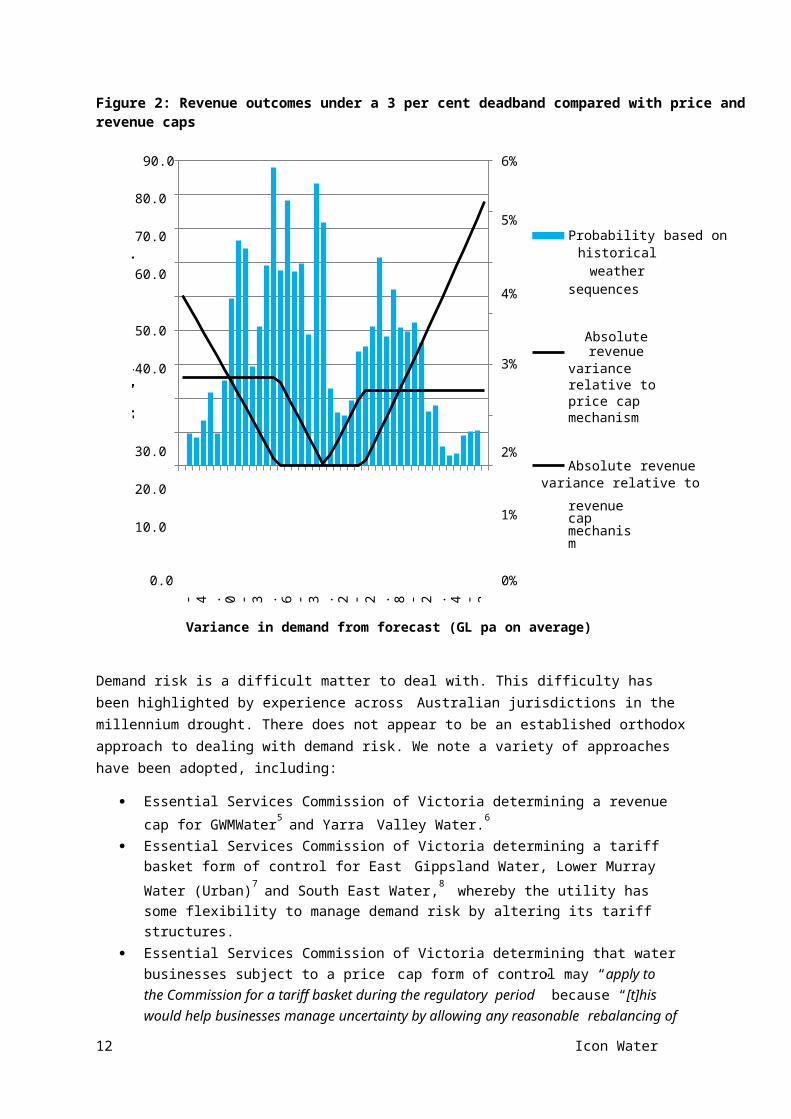
Icon Water does not agree that its proposed deadband would mean that the form of control more closely mimics a revenue cap than a price cap. Icon Water’s analysis indicates that the outcomes under a hybrid control mechanism with a deadband on the DVAM of 3 per cent of water sales more closely mimic outcomes under a price cap than outcomes under a revenue cap. Figure 2 shows that when the difference between actual and forecast demand is within ±2.5 GL per annum on average, the outcomes under the 3 per cent deadband more closely mimic price cap outcomes (than revenue cap outcomes).Relatively low probabilities are attached to the demand outcomes outside this range. Consequently, the expected value of the absolute revenue variance relative to revenue cap outcomes is around $20 million, while the equivalent figure for price cap outcomes is only $13 million.

- 4. 0 - 3. 6 - 3. 2 - 2. 8 - 2. 4 - 2. 0 - 1. 6 -
12 Icon Water Limited
Figure 2: Revenue outcomes under a 3 per cent deadband compared with price and revenue caps
90.0 6%
80.0
70.0
60.0
5%Probability based onhistorical weather
4% sequences
50.0
40.0
Absolute revenue3% variance relative to
price cap mechanism
30.0
20.0
10.0
2%Absolute revenuevariance relative to
1% revenue cap mechanism
0.0 0%
Variance in demand from forecast (GL pa on average)
Demand risk is a difficult matter to deal with. This difficulty has been highlighted by experience across Australian jurisdictions in the millennium drought. There does not appear to be an established orthodox approach to dealing with demand risk. We note a variety of approaches have been adopted, including:
Essential Services Commission of Victoria determining a revenue cap for GWMWater5 and Yarra Valley Water.6
Essential Services Commission of Victoria determining a tariff basket form of control for East Gippsland Water, Lower Murray Water (Urban)7 and South East Water,8 whereby the utility has some flexibility to manage demand risk by altering its tariff structures.
Essential Services Commission of Victoria determining that water businesses subject to a price cap form of control may “apply to the Commission for a tariff basket during the regulatory period” because “[t]his would help businesses manage uncertainty by allowing any reasonable
rebalancing of tariffs that can be justified during the regulatory period.”9, 10
IPART’s decisions to adopt the demand forecasts proposed by Sydney Water11 and Gosford and Wyong Councils12 and apply a demand volatility adjustment mechanism with a deadband of 10 per cent. 13
5 ESC 2013, Price review: Regional urban water businesses, Final Decision, p108.6 ESC 2013, Price review: Greater metropolitan water businesses, Final Decision, p129.7 ESC 2013, Price review: Regional urban water businesses, Final Decision, p108.8 ESC 2013, Price review: Greater metropolitan water businesses, Final Decision, p129.9 ESC 2013, Price review: Regional urban water businesses, Final Decision, p109.10 ESC 2013, Price review: Greater metropolitan water businesses, Final Decision, p129.11 IPART 2012, Review of prices for Sydney Water Corporation’s water, sewerage, stormwater drainage and other services from 1 July 2012 to 30 June 2016, Water – Final Report, June, p91.
Abso
lute
reve
nue
varia
nce
($20
14-

Icon Water Limited 13
IPART determining a revenue volatility allowance in the revenue requirement for State Water to compensate for exposure “to annual variability in the availability of water because of the inherent difficulty in forecasting variable year-to-year climatic conditions.”14
The QCA finding that “short term volume risks (that is, both demand and supply) are outside SunWater’s control” and consequently determining “that short term volume risks should be assigned to customers through a tariff structure that recovers fixed costs through fixed charges
and variable costs through volumetric charges.”15
The ICRC determining a price cap, with a revenue pass-through provision to apply at the end of the regulatory period for variation in revenue outside a deadband of 3 per cent.16
The ACCC indicating that regulators may adopt a revenue cap or a price cap under the Water Charge Infrastructure Rules 2010, depending on the trade off between revenue stability and price stability in the particular circumstance.17
With such a variety of approaches employed in recent regulatory decisions, it would be incorrect to characterise the Panel’s draft decision as taking the same approach as other regulators and Icon Water’s proposal as an alternative approach to other regulators. Neither the Panel draft decision nor Icon Water’s proposal are significantly out of step with regulatory precedent. However, Icon Water notes that few regulators have adopted the approach in the Panel draft decision of imposing alternative demand forecasts developed by the regulator and affording the business no flexibility to rebalance tariffs.Victorian businesses can elect to manage demand risk by rebalancing tariffs. NSW businesses are facing demand risk associated with their own forecasts (and not forecasts imposed by a regulator).
12 IPART 2013, Final Report: Gosford City Council and Wyong Shire Council – Prices for water sewerage and stormwater drainage services from 1 July 2013 to 20 June 2017, May, p109.13 IPART 2012, Review of prices for Sydney Water Corporation’s water, sewerage, stormwater drainage andother services from 1 July 2012 to 30 June 2016, Water – Final Report, June, p38.14 IPART 2010, Review of bulk water charges for State Water Corporation from 1 July 2010 to 30 June 2014, Final Report, pp50-56.15 QCA 2012, SunWater Irrigation Price Review: 2012-17, May, pp26-27.16 ICRC 2008, Water and Wastewater Price Review Final Report and Price Determination, Report 1 of 2008, April, p167.17 ACCC 2011, Pricing principles for price approvals and determinations under the Water Charge (Infrastructure) Rules 2010, July, pp50-51.

Panel question
8) Does the $34 million revenue shortfall and asymmetry cited in Icon Water’s written submission only arise because Icon Water has taken a different view to the Panel on water sales forecasts, or is there something else inherent in the draft decision that gives rise to the shortfall and asymmetry? If so please give details of the other factors which in Icon’s view give rise to the likelihood of a $34 million revenue shortfall.
14 Icon Water Limited
C. Risk of a revenue shortfall
Icon Water’s comments about asymmetry are primarily driven by its differing view on water sales forecasts. However, it is worth noting that Icon Water is able to encourage conservation to an extent, but can’t encourage consumption due to the policy environment in the ACT, including the ACT Water Strategy 2014-44 of which a central focus is further reductions in per capita consumption of potable water. Connections are mandated and there is no scope for Icon Water to rebalance tariffs or tariff structure under the form of control adopted by the Panel in its draft decision. There is therefore an asymmetry in the sense that Icon Water is not in a position to manage its revenue risk, only customers’ revenue risk.

Panel question
9) With a return to severe restrictions unlikely for the foreseeable future, does Icon Water contend that per capita consumption will continue to fall or does Icon Water expect per capita water consumption to stabilise? Under whichever scenario is contended for, at what time, and at what level?
Icon Water Limited 15
D. DemandThe level of demand forecasts as distinct from growth
Icon Water notes that all of the Panel’s questions in relation to demand are focussed on assumptions about how population growth will affect water sales. We wish to emphasise that in trying to generate as accurate a forecast as possible we are more concerned about the base level from which the growth is applied than we are about the growth rate in the Panel’s draft forecast over time. We would urge the Panel to focus not only on the potential effect of population growth, but also on the question – what is the level of expected water sales for the current population? As outlined in our submission, the Panel’s draft forecast for the current population of 44.0 GL:
is high when considering the 41.9 GL observed in 2013-14; appears to be inconsistent with the ACT Water Strategy 2014-44; and may be overestimated because water restrictions have been modelled using a single cardinal
variable that imposes equality in the incremental impacts of each stage of water restrictions.
The use of an estimate rather than a forecast for 2014-15
Icon Water also notes that estimated water sales for 2014-15 have continued to fall as the summer has progressed and the weather has remained relatively wet and cool. Based on data up to 26 February 2015, the estimate is 39.5 GL, which is 4.5 GL below the forecast of 44.0 GL included in the draft decision. This equates to around $20 million in revenue terms. Most of the consumption that will be billed in 2014-15 has now taken place, since consumption occurring as early as April 2014 was billed in 2014-15 and some of the consumption that will take place from April 2015 will be billed in 2015-16. Up-to-date data on releases from storage can therefore provide a relatively accurate estimate of 2014-15 sales. Icon Water’s estimate has utilised this data on releases and is set out in Table 6.
Icon Water continues to propose that the Panel replace its 2014-15 forecast with a 2014-15 estimate, taking account of actual observations to date, so that Icon Water has reasonable opportunity to recover its efficient costs. This approach would be consistent with the typical regulatory practice of using estimated capital expenditure for the year in which a decision is being made.
Table 6: Estimated water sales 2014-15
Consumption at tier 1 price (ML) 23,924Consumption at tier 2 price (ML) 15,623Total billed consumption (ML) 39,547
Icon Water contends that per capita water consumption will fall slightly from its current level. As discussed, in our submission of 23 January 2015, per capita consumption has been in decline for 25 years.

Stage 2Stage 3restrictionsrestrictions
16 Icon Water Limited
Figure 3 shows weather-corrected consumption per capita over the past 13 years. The figure highlights several important points:
The millennium drought and associated severe water restrictions represented a shock to the long-term trend, with marked reductions in weather-corrected per capita consumption over the periods of restrictions.
The recovery from the shock appears to have taken place over 2010-11 and 2011-12, with a 13 per cent increase in weather-corrected per capita consumption above the minimum observed in 2009-10.
In the last two years, changes in per capita consumption appear to have returned to the long- term trend of gradual decline.
Icon Water’s forecasts are consistent with this trend. Even at its lowest level in 2017-18, Icon Water’s forecast remains 5 per cent higher than the
minimum observed under severe water restrictions.
Figure 3: Weather-corrected billed consumption per capita
200
180
160
140
120
100
80
60
Weather-corrected actual consumption per capita
Forecast
40
20
-
Financial year ending
Icon Water’s forecast is consistent with government policy. Reducing per capita use of potable water is a “central focus” of the ACT Water Strategy 2014-44, which states that “[i]nnovative ways of using water more efficiently, and demand reduction initiatives that reduce per capita use and overall consumption,
will continue to be pursued.”18 An example of how the government is giving effect to this strategy is the displacement of potable water by stormwater harvesting, such as the Inner North Stormwater
Reticulation Network being constructed as part of the Canberra Integrated Urban Waterways project.19
18 ACT Government 2014, ACT Water Strategy 2014-44, August, p4.19 For example, see http://www.environment.act.gov.au/water/constructed_wetlands/flemington_road_ponds_project
Bille
d kL
per
capi
ta p
er
20 02 20 03 20 04 20 05 20 06 20 07 20 08 20 09 20 10

Panel question
10) What are Icon’s estimates for per capita consumption over the regulatory period? Does this allow for any “bounceback” from the period of water restrictions? If no bounceback in per capita consumption is expected, please explain what an increasing population will mean for water sales?
Icon Water Limited 17
The ACT Government has indicated that this network, when fully constructed, will reduce potable supply by reusing up to 855 ML per annum (more than 2 kL per capita per annum) of collected stormwater for urban irrigation.20 The ACT Government has further federal funding to undertake more of these sorts of initiatives. The ACT Government are also continuing to promote efficiency in existing developments through education and rebate programs (like ACT Smart)21 and in new and renovated dwellings through Water Sensitive Urban Design targets.22
Although Icon Water believes its water sales forecast is reasonable given the available evidence, significant inherent uncertainty remains. As discussed in Table 4 on page 7, a smaller deadband would be warranted to protect Icon Water and its customers from the risk of systematic under or over collection of revenue.
The per capita consumption forecasts implicit in the total consumption forecasts submitted by Icon Water on 23 January 2015 are set out in Table 7. These figures are based on a population forecast obtained from BIS Shrapnel in December 2014.
20 ACT Government 2014, Canberra Integrated Urban Waterways Project, Final Report, February, pp39-40.21 http://www.actsmart.act.gov.au/tools_topics/water_saving 22 ACT Government 2014, ACT Water Strategy 2014-44, August, p30.

18 Icon Water Limited
Table 7: Actual and forecast water consumption
Year Ending JuneConsumption
(ML)
Weather corrected actual
consumption (ML)
Resident population
Consumption per capita (kL)
Weather corrected actual consumption per
capita (kL)2002 55,834 58,854 324,627 172.82 182.16
2003 55,580 51,320 327,357 170.50 157.432004 44,222 41,147 328,940 134.76 125.392005 43,507 40,834 331,399 131.77 123.682006 48,160 42,541 335,170 144.50 127.64
2007 45,589 38,860 342,644 134.52 114.662008 36,732 36,225 348,368 106.31 104.852009 38,222 36,187 354,785 108.72 102.932010 37,780 36,188 361,766 105.45 101.01
2011 33,823 40,809 367,985 92.70 111.842012 35,423 42,576 375,183 95.33 114.582013 40,463 42,541 381,488 106.95 112.442014 41,956 42,541 386,422 109.27 110.80
2015 estimate 39,547 42,558 391,129 101.72 109.472016 forecast 42,552 42,552 395,368 108.21 108.212017 forecast 42,545 42,545 399,961 106.99 106.992018 forecast 42,542 42,542 405,056 105.69 105.69
As discussed in our response to Question 9, these forecasts do allow for some “bounce back” following restrictions. The column on the far right hand side of the table shows that even at its lowest level in 2017- 18, our forecast remains 5 per cent above the level of weather-corrected per capita consumption observed in 2009-10.
The evidence from other jurisdictions is mixed and Icon Water’s experience and forecast assumptions are not inconsistent with the evidence. In terms of regulatory decisions, Icon Water notes that:
In 2012, IPART accepted Sydney Water’s demand forecasts and noted that “Sydney Water expects that increases in water use due to growth will be offset by increases in water efficiency.”23 In its subsequent 2013 decision for Gosford and Wyong Councils, IPART noted that “slower than predicted demand bounce-back following the lifting of restrictions has also been evident in Sydney and may signal a permanent shift in community attitudes and usage.”24
In 2013, the ESC determined water consumption forecasts for City West Water, South East Water and Yarra Valley Water that are approximately static, with average annual growth over the period 2013-14 to 2017-18 of 0.1 per cent, 0.2 per cent and 0.2 per cent.25
Also in 2013, ESCOSA stated “In relation to demand “bounce-back”, the Draft Revenue Determination adopted the position that water demand would return to 75% of level 1 restriction
23 IPART 2012, Final Report: Review of Prices for Sydney Waters Water Sewerage Stormwater Drainage and other services, Jul 2012 to June 2016, May, p92.24 IPART 2013, Final Report: Gosford City Council and Wyong Shire Council – Prices for water sewerage andstormwater drainage services from 1 July 2013 to 20 June 2017, May, p109.25 Essential Services Commission 2013, Price Review 2013: Greater Metropolitan Water Businesses —final decision, June, p125.
Icon Water Limited 19
levels over three years. A full bounce-back to level 1 restriction levels was not considered to be reasonable given the likelihood that a proportion of customers will have made permanent changes to their water installations, and the likelihood of a more gradual shift in customers’
behaviour during the regulatory period.”26
In 2014, the QCA noted that “SEQ residents have continued to maintain water consumption below Target 200. In 2011-12, average daily residential water use in SEQ was 158 l/p/d.” As a result, the QCA revised down its assumed level of post-bounce back residential consumption
from 200 l/p/d to “a whole-of-SEQ forecast of 185 l/p/d in 2016-17.”27
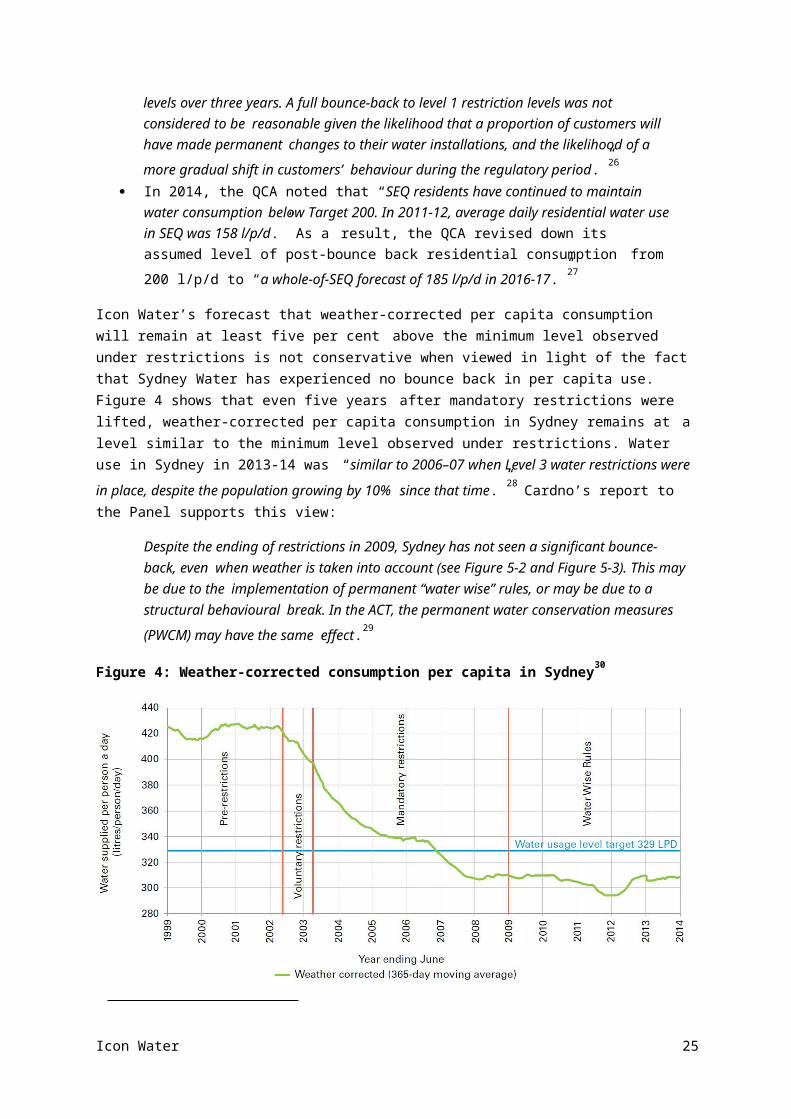
Icon Water’s forecast that weather-corrected per capita consumption will remain at least five per cent above the minimum level observed under restrictions is not conservative when viewed in light of the fact that Sydney Water has experienced no bounce back in per capita use. Figure 4 shows that even five years after mandatory restrictions were lifted, weather-corrected per capita consumption in Sydney remains at a level similar to the minimum level observed under restrictions. Water use in Sydney in 2013-14 was “similar to 2006–07 when Level 3 water restrictions were in place, despite the population growing by 10%
since that time.”28 Cardno’s report to the Panel supports this view:
Despite the ending of restrictions in 2009, Sydney has not seen a significant bounce-back, even when weather is taken into account (see Figure 5-2 and Figure 5-3). This may be due to the implementation of permanent “water wise” rules, or may be due to a structural behavioural break. In the ACT, the permanent water conservation measures (PWCM) may have the same
effect.29
Figure 4: Weather-corrected consumption per capita in Sydney30
26 ESCOSA 2013, SA Water’s Water and Sewerage Revenues 2013-14 – 2015-16, Final Determination, Statement of Reasons, May, p44. The discussion focusses on the draft determination because the Treasurer made a pricing order which mandated a demand figure for the final determination.27 Queensland Competition Authority 2014, SEQ Price Monitoring Final Report Part B- QUU, March, p1828 Sydney Water, Water Efficiency Report 2013-14, p329 Cardno 2014, Independent review of ICRC price direction, Technical report, 3604 67, Prepared for Industry Panel, November, p52.30 Sydney Water, Water Efficiency Report 2013-14, p2

20 Icon Water Limited
Panel question
11) How does Icon Water reconcile the view that absolute demand is not expected to increase (and has been declining "despite significant population growth" for the past 25 years), with the decision to invest in major water security projects?
Panel question
12) Has Icon Water investigated in detail the expected effects of changes in housing, behaviour and internal water efficiency infrastructure? Has Icon water developed a medium term view on non- residential consumption patterns and expected changes (in industrial / commercial use?). If so please provide details.
The modest ‘bounce back’ observed in Brisbane needs to be viewed in the context of the extreme severity of the restrictions that were applied there. In addition to the specific water use bans that were applied in Canberra, South-East Queensland implemented:
a residential use target of 140 L/person/day (Target 140); tough penalties (fines and restricted supply) for houses using more than 800 L/day or 200
L/person/day; and 25 per cent water savings for large water users.
It is to be expected that greater bounce back will take place in Brisbane following the removal of these measures.
The largest driver for the water security projects was not growth in demand, but increasing risk of more severe and longer droughts and reduced inflows. Icon Water concluded that it was more likely than not that Canberra’s water supply system was already experiencing a permanent shift to reduced dam inflows that would result in more frequent water restrictions in the future. The suite of water security projects was designed to improve the overall resilience of the supply system and diversify water supply sources outside of the ACT.
Further, the decision to build the Enlarged Cotter Dam was made in 2007-2009. Icon Water assumed based on the 2003 ACT Government water strategy, Think Water, Act Water, that per capita water demand would reduce by 25 per cent from pre-drought levels, and that this reduction would occur gradually between 2003 and 2023. This demand reduction has already been achieved and the new ACT Water Strategy 2014-44 is now aiming for further reductions in per capita water use.
Further, in contrast to forecasting for pricing, which is concerned with the expected or average outcome, forecasting for long-term infrastructure planning is concerned with the distribution of outcomes, including the outcomes in the tail of the distribution. Assumptions about potential high population and demand scenarios were relevant considerations in assessment of water security options. These differing emphases sometimes manifest as different assumptions in forecasts for pricing and infrastructure
planning.31
31 For example, see DSE Guide, Sydney Water 5-10-50 strategy

Re
Icon Water Limited 21
Icon Water, as well as the water industry and other partners in water management such as the Commonwealth and ACT governments have conducted a number of studies into the impact of changes in housing, behaviour, and internal water efficiency infrastructure. These studies have gone beyond considerations of consumption by new connections, which were considered by Cardno, to also consider consumption by established connections.
As many of the drivers under consideration have changed simultaneously in the last ten years, it can be difficult to determine the specific impact of any one driver. However, general trends and impacts can be interpreted.
Residential water use
Despite a growth in the population and the number of households, there has been a significant decrease (of around 30 per cent) in total water use in detached dwellings (Figure 5). This decrease is driven by decreases to both indoor and outdoor water use. Total demand in non-detached dwellings (units and multi residential) has increased slightly over the same period, driven by a large increase in the number of multi-unit dwellings (by 32 per cent from 2006 to 2011 based on ABS Census Data). While there have been reductions in indoor water use over this time, this has been offset by the growth in this dwelling class.
Figure 5: Total water use from 2001 to 2013 for residential dwellings
40Water Restrictions
35
Severe Water Restrictions Wet years
30
25 sidential- detached
20
15
10Residential-nondetached
5
02000 2001 2002 2003 2004 2005 2006 2007 2008 2009 2010 2011 2012 2013 2014 2015
Year (ending December)
Figure 6 shows that the proportion of total water demand attributable to units has increased from 9 per cent to 12 per cent between 2003 and 2013.
Tota
l Ann
ual W
ater
use

22 Icon Water Limited
Figure 6: Estimated split in customer water use in 2003 and 2013
Secondary Water Use
Avoidable Losses
2%4%
Unavoidable Losses 5%
Large Scale Irrigation 6%
Government 4%
Industrial 1%
Commercial 14%
2003
Detached Houses 55%
Kitchen: 6%
Laundry: 13%
Toilet: 18%
Bathroom: 25%
Garden: 36%
Other: 3%
Units 9% Total Metered Potable Demand: 57 GL/year
Secondary Water Use 2013Unavoidable Losses
1%
Avoidable 3%
Losses5%
Large Scale Irrigation 3%
Government 6%
Industrial 1%
Commercial 16%
Units 12%
Detached Housing53%
Kitchen: 6%Laundry: 11%
Toilet: 16%
Bathroom:38%
Garden: 29%
Other: 1%
Total Metered Potable Demand: 42 GL/year
Historical trends in drivers of water consumption
Demand for water by residential users is impacted by a number of drivers. These trends had been evident for some time during the 1990s. However, the millennium drought and subsequent national response – including temporary water restrictions, rebates and efficiency schemes – provided a significant shock to demand. In the medium term (3 – 4 years) there is no expectation of a similar shock. Other drivers, which have an impact on demand include pricing and source substitution.

Icon Water Limited 23
Table 8: Historical trends in drivers of water consumption
Driver DescriptionClimate/weather Hotter and drier weather leads to higher consumption due (predominantly)
to increases in outdoor water useDemography – ageing and smaller households
An aging population will have smaller average household size. Smaller households lead to higher water use per capita, as additional members of a household use less water than the initial person in the house. This will also mean that household formation growth is faster than population growth.
Appliances and fixtures Appliances are becoming increasingly more efficient, particularly with the introduction of minimum water efficiency standards and the water efficiency labelling scheme. Efficient appliances are also more common as rebates (for existing houses) and mandated standards (WSUD Code for new houses) have increased the percentage of households with efficient appliances.
Water use practices (behaviour)
Significant increase in water efficient behaviours, encouraged by several years of severe water restrictions. In the ACT, over 90 per cent of individuals reported at least one behaviour change, with most reporting five changes to behaviour. Around 90 per cent of households have modified their garden(replaced lawn or replanted with a low-water use garden).32
Housing – urban consolidation
Decreases in block size for detached houses and an increasing proportion of multi-unit dwellings will tend to decrease per capita water use. However, these developments may have a lower household size than existing developments. Additionally, extensions and garden renovations (paving) will decrease the permeable area in existing dwellings and therefore decrease outdoor water use.
Projected trends in drivers of water consumption
There are a range of potential scenarios for each of these drivers over the next few years. These are generally outside of Icon Water’s control, however the impact of a range of these scenarios has been considered. Icon Water’s best estimates indicate that the effects of these drivers will largely offset each other, leading to a net effect on total consumption of approximately zero.
Table 9: Projected impacts of drivers of water consumption
Driver Description Annual net impact on
consumption
Cumulative impact per
annumDemography Total household numbers could increase by
around 1.5% p.a. Growth in lone person households could be around 2% p.a. (ABS). Median age in the ACT is expected to increase,with an increase in the number of individual older (>65 years) households.33
+1.5% +1.5%
32 McNair, B.J. and Ward, M.B. 2012. Willingness to pay research project. Report to ACTEW Corporation. March.33 ACT Government (2010). Population Aging in the ACT: Issues and Analysis.

24 Icon Water Limited
Driver Description Annual net impact on
consumption
Cumulative impact per
annumHousing – Urban consolidation
Average block size for new detached housing (400m2) is around half the average block size of existing dwellings (800m2); resulting in 70% lower outdoor water use in new relative to existing dwellings.
For 2014/15 – 2018/19 proposed land release of around 13,500 dwellings. Around 30% will be detached dwellings and 50% apartments. 55% will be infill development.
All new dwellings will use around 40% less water compared to existing dwellings in compliance with the ACT government WSUD Code.
-0.5% to -1.0%
+0.5% to+1.0%
Appliances and fixtures
New appliances and fixtures (washing machines, dishwaters, toilets, shower heads etc) are expected to be around 5% – 10% more efficient in 2016 than equivalent models sold after 2003.34
The expected replacement rate is 5%-10% per year (depending on the appliance).
-0.5% to -1.0%
-0.5% to+0.5%
Water use practices (behaviour)
No shocks to water use behaviour are anticipated. Behaviour is anticipated to be similar to that observed in the four years since restrictions ended.
Nil -0.5% to+0.5%
Icon Water’s view on non-residential consumption
Icon Water’s view on non-residential consumption behaviour over the next four years is informed by:
the nature of non-residential consumption in the ACT, which is quite different to consumption of this type in regions with a major manufacturing industry;
recent trends in non-residential consumption; and projected influences on demand over the next four years.
Nature of non-residential consumption
Non-residential water consumption makes up about around 30 per cent of the ACT’s potable water demand and is dominated by three main categories:
Commercial and retail office space responsible for most of the non-residential demand Government and related services including education (universities, schools, childcare), health
(hospitals and aged care services) and emergency services Urban open space irrigation.
34 www.waterrating.gov.au

Icon Water Limited 25
Figure 7: Breakdown on customer demand in the ACT in 2013
Non-Residential: Irrigation (Public Open
Space)
Non-Residential: Schools, Hospitals
Non-Residential:Commercial or Retail
Residential- nondetached
Residential- detached
Notably absent from these categories is manufacturing and industrial water use. This is because there is little manufacturing in the ACT. Areas classified as industrial are dominated by big-box retailers, warehouses and services – such as mechanics.
Recent trends in non-residential consumption
Temporary water restrictions did not apply only to residential customers. The restrictions scheme was designed so that non-residential customers would also contribute water savings. There are two main observations of consumption over the last 12 years:
Non-residential consumption as a share of total consumption has remained at around 30 per cent over this period (see Table 10), and
Non-residential consumption has decreased in absolute terms over this period (see Figure 8)

WaterRestrictions
Severe Water RestrictionsWet years
26 Icon Water Limited
Table 10: Percentage of potable water used by non-residential customers in the ACT, 2001 - 2013
Year Non-residential consumption as a shareof total consumption
2001 29%2002 29%2003 30%2004 29%2005 29%2006 29%2007 29%2008 28%2009 28%2010 26%2011 26%2012 27%2013 27%
Figure 8: Non-residential consumption in the ACT from 2001 to 2014
14
12
10
8
6
4
2
02000 2001 2002 2003 2004 2005 2006 2007 2008 2009 2010 2011 2012 2013 2014 2015
Year (ending December)
In addition to temporary water restrictions from 2006 to 2010, the ACT Government has actively encouraged water conservation through:
programs such as “Where will we play?” (2007) – where all sportsgrounds have access to non- potable water and irrigation systems on ACT Government open space have been upgraded; and
Tota
l ann
ual w
ater
use
- no
n-re
siden
tial

Icon Water Limited 27
audit and rebate programs like ACTSmart – where the ACT Government may pay up to half of the cost of upgrading to more efficient appliances and fixtures for small businesses.
Icon Water (as ACTEW at the time) also ran a Large Customer Demand Management Program with around 100 large customers which detected leaks and anomalies in water use patterns.
Additionally, the Water Sensitive Urban Design target of a “40% reduction in mains water use for all new developments and dwellings including … commercial, institutional and industrial developments”35 led to decreased consumption in new non-residential developments.
Projected influences over next four years
The recently released ACT Water Strategy 2014-44 includes a strategy to “Manage and promote efficient and sustainable use of water.” The report outlines a number of actions to “encourage water users to conserve and use water wisely” such as:
15.2 Improve efficiency of non-residential water use:
Develop a Permanent Water Conservation Scheme for non-residential water users in consultation with industry
15.3 Deliver water efficiency programs and education to ACT residents, schools and businesses through ACTSmart Programs.36
These actions are likely to continue to constrain non-residential water consumption, particularly in existing developments. New commercial and industrial developments will continue to use less water than existing developments through the application of the Water Sensitive Urban Design Code.
A selection of key reports to which Icon Water has had regard in relation to this topic are listed in Table 11.
Table 11: Reports relevant to Question 12
Topic Paper/ReportAppliances ACT Government. (2011, February 25). Water Savings. Retrieved January 23, 2012, from ACTSmart:
http://www.actsmart.act.gov.au/tools_topics/water_savingAppliances ActewAGL. (2008). Canberra end Use Model: Summary of Changes to PWCMs (DM#403596).
Appliances Chong, J., Kazaglis, A., & Giurco, D. (2008). Cost Effectiveness of WELS - the Water Efficiency Labelling and Standards Scheme. Australian Government, Department of the Environment, Water Heritage and the Arts. Sydney: Institute of Sustainable Futures.
Appliances Institute for Sustainable Futures. (2011). Think Water, act Water Evaluation: Electricity, Water and Greenhouse Gas Savings. Canbera: Environment and Sustainable Development Directorate.
Behaviour ABS. (2013). ENVIRONMENTAL ISSUES: WATER USE AND CONSERVATION (4602.0.55.003).Canberra: Australian Bureau of Statistics
Behaviour Colmar Brunton Social Research. (2008). ACT Water Users Research Final Report.
Behaviour McNair, B. J., & Ward, M. B. (2012). Willingness to Pay Research Project. Canberra: ANU for ACTEW
Climate ACT Govt. (2011). Weathering the Change - Draft Action Plan 2. Canberra: Environment & Sustainability Directorate
Climate ACTEW. (2011). 2011 Review of Planning Variables for Water Supply and Demand Assessment.
35 ACT Government 2009, Water Sensitive Urban Design General Code, July.36 ACT Government 2014, ACT Water Strategy 2014–44 Implementation Plan 1 (2014–18), August, p9.

28 Icon Water Limited
Topic Paper/ReportClimate ActewAGL. (2004). Future Water Options Demand Modelling report (DM#314508)
Demographics ACT Government. (2010). Population Aging in the ACT: Issues and Analysis
Demographics ABS. (2010). Household and family Projections, Australia, 2006-2031 (3236.0)
Demographics Productivity Commission. (2011). Australia's Urban water Sector, Report No 55, Final Inquiry Report. Technical Supplement 2: Insights in to Residential water Consumption and Expenditure using Combined Census and Utility Billing Data. Canberra
Demographics WSAA. (2010). Occasional Paper No 25 - Implications of population growth in Australian on urban water resources. WSAA
Demographics WSAA. (2009). Occastional Paper 23 - Meeting Australia's water Challenges - Case studies in Commericial nd industrial water use. WSAA.
Housing ActewAGL. (2008). Impact of Demographic Change and Urban Consolidation on Demand (DM#334668)
Housing Birrell, B. (2005). Occasional Paper 15 - Impact of Demographic Change and Urban consolidation on Domestic Water Use. Melbourne: WSAA

Panel questions
Icon Water contends that the equity beta should be 0.9 and has submitted a report prepared by SFG, which suggests that a higher equity beta should be adopted because water utilities tend to exhibit an asymmetric equity beta. Please advise whether:Icon Water is aware of any other regulator that has accepted the approach proposed by SFG in relation to determining the value of the equity beta? If so give details.Icon Water is able to provide a description of why water utility businesses might exhibit the asymmetry SFG refers to. Please provide a description in layman’s terms (for the benefit of members of the public) in addition to any technical response.Why is Icon Water contending for a 0.9 equity beta when SFG’s advice is that it should be 0.8?
Icon Water Limited 29
E. Equity beta
(13)
IPART’s December 2011 decision on prices for Sydney Desalination Plant relied on advice from SFG for
the equity beta which took account of asymmetric exposure to market conditions.37 The advice obtained by Icon Water from SFG in 2012 applied the same method to Icon Water, with some refinements. SFG stated, “We have refined the technique used in prior analysis of the Sydney Desalination Plant for the Independent Pricing and Regulatory Tribunal (“IPART”) (SFG, 2011). Rather than rely upon monthly returns, we rely upon four-weekly returns and repeat the analysis 20 times with start points at each day of
the four-weekly period.”38
The reason SFG arrived at a higher recommended beta for Icon Water than it had for Sydney Desalination Plant was that the Sydney Desalination Plant “is characterised by contractual terms which transfer considerable risk away from the Sydney Desalination Plant and to the plant operator.”39
(14)
First Icon Water would like to note that its consultant, SFG, has undertaken analysis of all the industries in the US to check that the weighted average of the industries’ up and down beta is 1, consistent with the theory. SFG’s analysis shows that this is the case and that the utility sector is one of the most exposed to downturn beta.
37 SFG Consulting 2011, Cost of capital parameters for Sydney Desalination Plant, August.38 SFG Consulting 2012, Systematic risk of Actew’s water and sewerage business, May, p1. (Attachment 15 to Icon Water’s July 2012 submission to the ICRC).39 SFG Consulting 2012, Systematic risk of Actew’s water and sewerage business, May, p2. (Attachment 15 to Icon Water’s July 2012 submission to the ICRC).

30 Icon Water Limited
Table 12: Beta in the US by industry
United StatesIndustry Beta Beta Up Beta Dn WeightBasic_materials 1.07 1.05 1.08 0.03Consumer_goods 0.83 0.82 0.84 0.06Consumer_services 1.01 1.02 1.00 0.13Financials 1.22 1.34 1.11 0.18Health_care 0.67 0.64 0.69 0.17Industrials 1.10 1.14 1.07 0.10Oil_and_gas 0.79 0.63 0.91 0.08Technology 1.32 1.41 1.25 0.16Telecom 0.82 0.82 0.81 0.05Utilities 0.56 0.36 0.73 0.04Value-weighted
average 1.00 1.01 0.98
1.00
One reason for this outcome could be that utilities are capital-intensive businesses characterised by fixed assets that often cannot be allocated to alternative uses, or downsized in response to an adverse shock. Capital-intensive businesses are exposed to two important elements of risk:
shocks to their cash flows; and increases in the cost of capital.
In comparison to a business with higher degree of variable costs, there is less that a capital-intensive business can do to offset the effects of a reduction in demand. This means that cash flows are negatively impacted by a reduction in demand. But the positive impact on demand is often not as great because the fixed assets have a finite capacity. This theory is supported by the fact that, during the global financial crisis, the utilities index in Australia decreased at a rate of almost one to one with the All Ordinaries Index (see Figure 9).

Icon Water Limited 31
Figure 9: Utilities index and the All Ordinaries index 2006-2010
180
160
140
120
100
80ASA30 Index
ASA6UTIL index
60
40
20
04/01/2006 4/01/2007 4/01/2008 4/01/2009 4/01/2010
Secondly, it is not just cash flow impacts that form part of the risk exposure of a capital-intensive business. Changes in the cost of capital play a role. When there is an increase in the cost of capital (which occurs because investors are more concerned about risk) asset prices fall. As noted above, there is little that can be done at an operational level to mitigate this impact on value by a business with lots of fixed assets that have a single use, and which have a fixed capacity. Other businesses will respond to the reduction in asset values by reducing costs to a greater degree.
Finally, Icon Water notes that water businesses, like energy networks, are likely to have strong exposure to risk premiums other than beta risk. One such risk is a strong, positive exposure to value premium, as identified by Fama French for energy network businesses.40
(15)
In our submission of 23 January 2015, we stated:
SFG Consulting has advised that the implied equity beta estimate would be approximately 0.8 if only the implications of asymmetrical exposure to market conditions were to be considered (and not the two further reasons that lead SFG Consulting to recommend an overall equity beta of 0.9 in its
40 SFG Consulting 2014, The Fama-French Model, A report for Jemena Gas Networks, ActewAGL, Transend, TransGrid and SA Power Networks, 13 May, paragraph 144 (available at http://www.aer.gov.au/sites/default/files/ActewAGL%20-%20E5%20SFG%20-%20The%20Fama- French%20model%20-%202014.pdf)
32 Icon Water Limited
previous report to Icon Water; namely, the imprecision of the beta estimates and limitations of the Sharpe-Lintner CAPM)41 regardless of what the expected return on the overall market is at a point in time, which is what the Panel expressed concern about.
Consistent with this, Icon Water’s contention for an equity beta of 0.9 is based on SFG’s detailed earlier recommendation in 2012, which took account of all relevant considerations, including:
asymmetrical exposure to market conditions; the imprecision of the beta estimates; and limitations of the Sharpe-Lintner CAPM.
The letter from SFG attached to our January 2015 submission was a more specific piece of work focussing only on the first of these considerations. It found that, on the basis of that consideration alone , the equity beta would be increased from 0.7 to 0.8. The contentions we have made and supported with evidence in relation to the other two considerations above would see the equity beta rise further to 0.9.
41 SFG Consulting, 2015, Impact on the cost of equity from asymmetry in beta estimates according to market conditions, January, pp3-4

Panel question
16) Please provide details of the nature and an estimate of the administrative costs Icon Water would incur if the WAC cost pass-through mechanism remains as it is in the draft decision.
Icon Water Limited 33
F. Water Abstraction Charge pass-through
Our concern with the Water Abstraction Charge (WAC) pass-through mechanism in the Panel’s draft decision is not derived from the associated administrative costs, which would be minor and would relate to preparing additional submission material to the ICRC. Our concern relates to the consistency in treatment of demand risk in relation to revenue and expenditure. The Panel’s draft decision is to achieve full accuracy via ‘true up’ adjustments in relation to the effect of water volumes on WAC expenditure, but to make no adjustment in relation to the effect of water volumes on revenue unless that effect exceeds 7 per cent of sales revenue. Our proposal to align these treatments would ensure that where lower water sales lead to a revenue shortfall, Icon Water would offset some of this shortfall against a lower-than- forecast WAC amount.
Based on historical data, the mechanism would be more likely to be triggered by including changes in water releases. The WAC rate has changed only twice since 2006.
Table 13: Changes in the WAC rate
Date March 2000
January 2004 July 2005 July 2006 July 2008 July 2014
WAC (c/kL) 10* 20* 25* 55* 51 54* Prior to 1 July 2008, the WAC was applied to water charged to users (rather than releases from storage)

Panel questionAs noted in chapter 4 of its draft report, the Panel intends to suggest to the ICRC that it consider:implementing an operating and capital expenditure incentive scheme in the next regulatory period, and also consider whether a service-level incentive scheme should be introduced, andrequiring ACTEW to submit a report each year, which sets out:the actual operating and capital expenditure it incurred in the previous financial year, and an explanation for any major deviation from the expenditure allowances approved in the price directionthe revenue it received from the provision of water and sewerage services in the previous financial year and revenue received from other sources, andits actual water sales, water and sewerage customer numbers, fixture numbers, dam releases and sewerage volumes in the previous financial year.17) What is Icon Water’s view about whether the proposed reporting requirement needs to sit within the price direction, or if the ICRC can otherwise obtain this information from Icon Water through its information gathering powers?
34 Icon Water Limited
G. Feedback on proposed annual reporting requirements
Icon Water would be comfortable with a provision being included in the Price Direction that would allow the ICRC to request a report setting out the information outlined in the bullet points above, provided the process is cost effective, the requested information is relevant to the determination, and a reasonable timeframe is given for Icon Water’s response.

Panel questionsAfter reviewing the transcript of the public hearing held in Canberra on 6 February 2015, the Panel has developed the following list of questions based on input from members of the public at the hearing, which the Panel regards as being relevant to the consideration of its final decision.What does Icon Water consider to be the appropriate balance in the sharing of demand risk between customers and Icon, and why?Can you provide an explanation of why you believe water demand will fall, and how have you taken into account the growth of Canberra is making forecasts about water demand?How does Icon Water reconcile an 11% rise in water charges with a $3 increase in household bills?
Icon Water Limited 35
H. Questions from the public
(18)
Please refer to the response to Question 4. However, Icon Water would also make the following comments.
The answer to this question depends on how customers’ demand risk is characterised. From Icon Water’s perspective, demand risk relates to revenue. If demand is lower than the forecasts included in the Panel’s final decision, Icon Water will generate less revenue than it needs to cover efficient costs. From customers’ perspective, demand risk could be characterised as the reverse of Icon Water’s risk; that is, the risk that demand will be higher than forecast and customers will pay more than the amount needed to cover Icon Water’s efficient costs. Under this characterisation of customer demand risk, the deadband on the Panel’s DVAM does not share the risk, but rather sets a limit on the risk faced by both Icon Water and customers. If the deadband were reduced to zero, neither Icon Water nor customers would face demand risk, since both would be assured that only the amount required to recover efficient costs would be paid (in present value terms).
An alternative characterisation of customers’ demand risk relates to unit prices. If demand is lower (higher) than forecast and there is a DVAM in place, unit prices will be temporarily higher (lower) in the next regulatory period than they otherwise would have been. The lower the deadband applying to the DVAM, the larger and more likely the adjustments to unit prices will be. Under this characterisation of customer demand risk (in which Icon Water cares about revenue and customers care only about unit prices), the deadband does share risk between Icon Water and customers. A higher deadband will place more demand risk on revenue, while a lower deadband will place more demand risk on unit prices. This trade off is discussed in detail in the response to Question 4.
(19)
Please refer to the responses to Question 9, Question 10 and Question 12.
(20)
Table 14 shows the calculations that were used to derive the bill impacts referred to in Question 20. The prices used in these calculations are the same as those set out in the response to Question 1. These impacts are calculated for a typical residential customer using 200 kL per annum. The bill impacts in dollar terms at other consumption levels will differ.

36 Icon Water Limited
Table 14: Calculation of bill impacts
2014-15 2015-16 2016-17 2017-18
Sewerage service supply charge (nominal $ pa) 505.41 578.77 593.24 608.07Water supply charge (nominal $ pa) 102.56 116.53 119.44 122.43Tier 1 water consumption price (nominal $/kL) 2.64 3.00 3.07 3.15Tier 2 water consumption price (nominal $/kL) 5.29 6.01 6.16 6.31
Typical annual consumption at Tier 1 price (kL) 191 191 191 191
Typical annual consumption at Tier 2 price (kL)42 9 9 9 9Typical annual consumption (kL) 200 200 200 200
Typical bill (nominal $ pa) 1160 1323 1356 1390
Increase in typical bill on previous year (nominal $ pa) 163 33 34Increase in typical bill on previous year (nominal $ per week) 3 1 1
Typical bill (real $2014-15 pa) 1160 1291 1291 1291
Real increase in typical bill on previous year (%) 11 0 0
42 The consumption step threshold is 0.548 kL per day based on average daily use between meter readings. This bill impact calculation assumes typical seasonality in consumption across four meter readings.