research open access relationships between leaf anatomy
TRANSCRIPT

Silva et al. Revista Chilena de Historia Natural 2014, 87:13http://www.revchilhistnat.com/content/87/1/13
RESEARCH Open Access
Relationships between leaf anatomy, morphology,and water use efficiency in Aloe vera (L) Burm f.as a function of water availabilityHerman Silva1*, Susana Sagardia1, Mauricio Ortiz1, Nicolás Franck1, Marcela Opazo1, Madeleine Quiroz1,Cecilia Baginsky1 and Cristián Tapia2*
Abstract
The effects of water availability were evaluated on the photosynthetic tissue anatomy in Aloe vera (L) Burm f. and itsrelationship with morphological, physiological parameters, and water use efficiency as a function of aerial biomassand gel production. Plants were subjected to four levels of water availability equivalent to 20% (T1), 15% (T2), 10%(T3), and 5% (T4) of the atmospheric evaporative demand. The plants exhibited anatomical, morphological, andphysiological responses to the different watering treatments. The extreme treatments produced negative responsesdue to excess water in T1 and water deficit in T4. Treatments T2 and T3 elicited positive responses in cellcharacteristics and productivity. Anatomical and structural characteristics were closely linked to physiology.Increased stomata number was negatively related to leaf length, width, and thickness (r = −0.85, −0.81, and −0.59,respectively) and to biomass production (r = −0.84), and positively related to the increase of cuticle thickness (r = 0.78).Treatment T2 showed the maximum efficiency of water use for biomass production (24.6 g L−1), which was closelyrelated to cell size (r = 0.68) and number of stomata (r = −0.70).
Keywords: Anatomical adaptations; Biomass production; Growth; Stomata
BackgroundSome plant species possess specific pathway of carbonfixation that allow them to survive and even grow underconditions of severe water stress. The best known arethe crassulacean acid metabolism (CAM) plants, particu-larly the species of the genera Opuntia, Agave, and a lili-aceous species, Aloe vera. Most of the anatomical andmorphological studies of CAM plants have been descrip-tive and make little mention of the water relationshipsand gas exchange, except for the work of Nobel (1980),Herrera et al. (2000), Nelson et al. (2005), and Herrera(2009). Although CAM species exhibit great variabilityin structure, adaptation to stressful environments, and inCAM metabolism expression (Borland and Taybi 2004),they share characteristics that reflect enhanced drought
* Correspondence: [email protected]; [email protected] Relación Suelo Agua Planta, Facultad de Ciencias Agronómicas,Universidad de Chile, Santa Rosa 11.315, La Pintana, Casilla 1004, Santiago,Chile2Laboratorio de Operaciones Unitarias, Facultad de Ciencias Químicas yFarmacéuticas, Universidad de Chile, Sergio Livingstone 1007, Independencia,Santiago, Chile
© 2014 Silva et al.; licensee Springer. This is anAttribution License (http://creativecommons.orin any medium, provided the original work is p
tolerance (Nelson et al. 2005). These plants are charac-terized by the maintenance of a favorable water statethrough their ability to minimize transpiration by closingtheir stomata during the day and opening them at nightwhen the vapor pressure deficit is low (Pierce et al.2002; Caird et al. 2007).Another common feature of CAM plants is succu-
lence, characterized by cells with large vacuoles, calledhydrenchyma. Succulence is more frequently found inxeric than in mesic CAM species (Borland et al. 2009),which further contributes to water use efficiency (Borlandet al. 2009; Herrera et al. 2008). Compared to C3 and C4species, CAM plants characteristically have lower stomataldensity which is modified by plant water availability (Silvaet al. 2001). In many cases, water restrictions reportedlyreduce the number of stomata (Silva and Acevedo 1984;Silva et al. 1999, 2001). The frequency is regulated byasymmetric division of epidermal cells and cell-to-cell sig-nals that determine where the epidermal cell shouldundergo a new asymmetric division (Bergman and Sack2007; Nadeau 2009). Plant water status may also be a
Open Access article distributed under the terms of the Creative Commonsg/licenses/by/2.0), which permits unrestricted use, distribution, and reproductionroperly cited.

Silva et al. Revista Chilena de Historia Natural 2014, 87:13 Page 2 of 10http://www.revchilhistnat.com/content/87/1/13
signal that can modify gene expression to control the fre-quency at which epidermal cells undergo this asymmetriccell division. Guard cell size may also be modified bywater restriction (Nadeau 2009).The leaf of CAM species may be divided into two prin-
cipal parts, the grey-green external area including fromthe cuticle to the vascular bundles on both the abaxial andadaxial surfaces, and a clear internal zone comprising cellswith large vacuoles containing the gel or hydrenchyma.The mesophyll has chloroplasts, making it a photosyn-
thetically active tissue, and it can directly influence CO2
capture due to its effects on diffusive resistance (Nobel1999). The intercellular air space (IAS) (Nelson et al.2005) is the proportion of photosynthetic tissue that actsas the effective surface for CO2 diffusion, and it affectsphotosynthesis and water use efficiency (Evans et al.1994; Warren 2008).In plants, water loss can be reduced by increased wax
deposition in the cuticle, a reduced number of stomataper unit area, the presence of trichomes, reduction in leafsize, and by the disposition of leaves with respect to theincident radiation (Nobel 1995). In CAM plants, waterloss is reduced by the nocturnal CO2 uptake with an effi-cient synthesis of sugars and osmolytes which allow waterretention (Borland et al. 2009). However, the cuticle mayalso contribute to the energy balance due to the reductionof net radiation and increase of reflectance. Variations inthe anatomy of gas exchange tissues such as the thicknessof the mesophyll and cuticle, cell dimensions, and the re-lation between the cell wall surfaces of the chlorenchymaand the external surface (Ames/A) all function as adapta-tions to hot and dry climates (Nobel et al. 1975; Nobel1980; Silva et al. 2001). A. vera L. is a perennial liliaceousplant with succulent green leaves joined at the steam in awhorled pattern. It is highly appreciated due to its shortgrowth period and high economic value among all thealoe species and is used in pharmaceutical, folk medi-cine, healthcare, cosmetic products, and food products(Reynolds and Dweek 1999). This plant is different fromother CAM species because it is a native of the semi-tropical regions of South Africa (Cowling 1982). Thus,the behavior of such plants cultivated under a semiaridenvironment may be different from that of the nativespecies. We postulate that water availability induces ana-tomical and morphological changes that help to maintainthe water use efficiency in A. vera. Our objective was todetermine the effect of the four levels of water availabil-ity on the anatomy of the photosynthetic tissue of A.vera and its relation with water use efficiency.
MethodsMaterials and study siteThe trial was performed during the 2006 to 2007 seasonin the Campo Experimental Las Cardas, located in the
community of Coquimbo, Region IV of Chile, at about31° south latitude. The area has an arid Mediterraneanclimate, with a water deficit of 94% per year and a dryseason of 10 months. The mean maximum temperatureof the warmest month is 29°C; no freezes occur. The soilis Tambillo Series; the site has a slight inclination (1% to2%) with micro-relief and abundant pebbles on the sur-face and in the soil (50%). The soil texture in profile issandy loam. The N level is low, while the levels of P andK are normal for this type of soil (Aburto et al. 2008;INIA 2010).
Field experiment and experimental designIn May 2006, approximately 3-year-old plants wereestablished at a density of 6,666 plants ha−1. The borderof the plantation was 1 × 1.5 m, giving a total area of720 m2.The experimental design was completely randomized
blocks with four block irrigation treatments randomizedwith four replications. The experimental unity was a plotof 45 m2, with five rows and six plants per row.
Irrigation treatmentsBased on previous information regarding the atmos-pheric evaporative demand at the experimental site, theavailable metabolic information about the species (Genetand Van Schooten 1992), and the water retaining charac-teristics of the soil, we designed four irrigation treat-ments representing 20% (T1), 15% (T2), 10% (T3), and5% (T4) of the reference evapotranspiration (ETo). An ir-rigation system was installed with independent electricalvalves for each water treatment, along with a volumetricwater meter to quantify each applied amount. Drip irri-gation was used, with a double drip line for each row ofplants. For treatments T1, T2, T3, and T4, respectively,an emission flow of 4 L h−1 was applied for 60, 45, 30,and 15 min to deliver 8, 6, 4, and 2 L h−1. Irrigation wasperformed every 7 days during of greatest atmosphericevaporative demand (no precipitation) from October toMay.
Histological studiesAt the end of the experimental period, histological stud-ies of photosynthetic tissue were performed, measuringboth abaxial and adaxial tissues. Histological studies ofphotosynthetic tissue were performed at the end of theexperimental period, measuring both abaxial and adaxialtissues. Samples from eight individuals per each treatmentwere taken with a 0.5-cm-diameter punch, sampling bothsides of the central part of the leaf simultaneously. Afterelimination of the central (gel-containing) portion separat-ing the surfaces, four sections per treatment were fixed in2.5% glutaraldehyde in 0.1 M phosphate buffer at pH 7.2for scanning electronic micrographs, and four sections per
Silva et al. Revista Chilena de Historia Natural 2014, 87:13 Page 3 of 10http://www.revchilhistnat.com/content/87/1/13
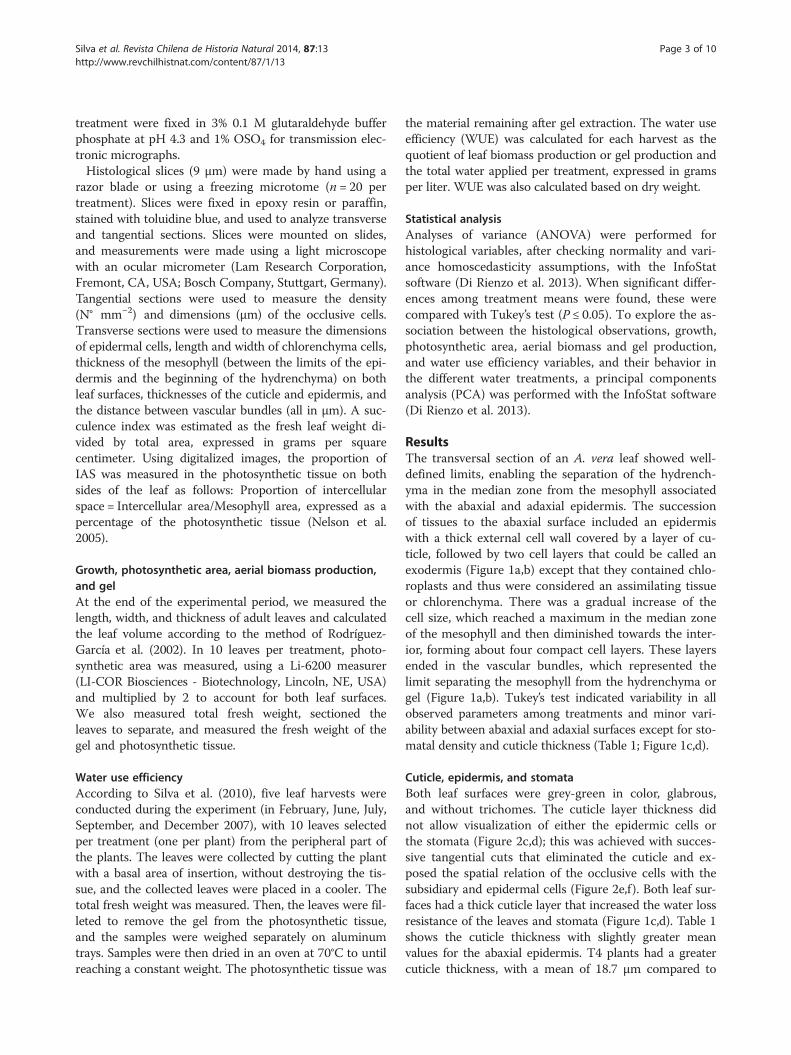
treatment were fixed in 3% 0.1 M glutaraldehyde bufferphosphate at pH 4.3 and 1% OSO4 for transmission elec-tronic micrographs.Histological slices (9 μm) were made by hand using a
razor blade or using a freezing microtome (n = 20 pertreatment). Slices were fixed in epoxy resin or paraffin,stained with toluidine blue, and used to analyze transverseand tangential sections. Slices were mounted on slides,and measurements were made using a light microscopewith an ocular micrometer (Lam Research Corporation,Fremont, CA, USA; Bosch Company, Stuttgart, Germany).Tangential sections were used to measure the density(N° mm−2) and dimensions (μm) of the occlusive cells.Transverse sections were used to measure the dimensionsof epidermal cells, length and width of chlorenchyma cells,thickness of the mesophyll (between the limits of the epi-dermis and the beginning of the hydrenchyma) on bothleaf surfaces, thicknesses of the cuticle and epidermis, andthe distance between vascular bundles (all in μm). A suc-culence index was estimated as the fresh leaf weight di-vided by total area, expressed in grams per squarecentimeter. Using digitalized images, the proportion ofIAS was measured in the photosynthetic tissue on bothsides of the leaf as follows: Proportion of intercellularspace = Intercellular area/Mesophyll area, expressed as apercentage of the photosynthetic tissue (Nelson et al.2005).
Growth, photosynthetic area, aerial biomass production,and gelAt the end of the experimental period, we measured thelength, width, and thickness of adult leaves and calculatedthe leaf volume according to the method of Rodríguez-García et al. (2002). In 10 leaves per treatment, photo-synthetic area was measured, using a Li-6200 measurer(LI-COR Biosciences - Biotechnology, Lincoln, NE, USA)and multiplied by 2 to account for both leaf surfaces.We also measured total fresh weight, sectioned theleaves to separate, and measured the fresh weight of thegel and photosynthetic tissue.
Water use efficiencyAccording to Silva et al. (2010), five leaf harvests wereconducted during the experiment (in February, June, July,September, and December 2007), with 10 leaves selectedper treatment (one per plant) from the peripheral part ofthe plants. The leaves were collected by cutting the plantwith a basal area of insertion, without destroying the tis-sue, and the collected leaves were placed in a cooler. Thetotal fresh weight was measured. Then, the leaves were fil-leted to remove the gel from the photosynthetic tissue,and the samples were weighed separately on aluminumtrays. Samples were then dried in an oven at 70°C to untilreaching a constant weight. The photosynthetic tissue was
the material remaining after gel extraction. The water useefficiency (WUE) was calculated for each harvest as thequotient of leaf biomass production or gel production andthe total water applied per treatment, expressed in gramsper liter. WUE was also calculated based on dry weight.
Statistical analysisAnalyses of variance (ANOVA) were performed forhistological variables, after checking normality and vari-ance homoscedasticity assumptions, with the InfoStatsoftware (Di Rienzo et al. 2013). When significant differ-ences among treatment means were found, these werecompared with Tukey’s test (P ≤ 0.05). To explore the as-sociation between the histological observations, growth,photosynthetic area, aerial biomass and gel production,and water use efficiency variables, and their behavior inthe different water treatments, a principal componentsanalysis (PCA) was performed with the InfoStat software(Di Rienzo et al. 2013).
ResultsThe transversal section of an A. vera leaf showed well-defined limits, enabling the separation of the hydrench-yma in the median zone from the mesophyll associatedwith the abaxial and adaxial epidermis. The successionof tissues to the abaxial surface included an epidermiswith a thick external cell wall covered by a layer of cu-ticle, followed by two cell layers that could be called anexodermis (Figure 1a,b) except that they contained chlo-roplasts and thus were considered an assimilating tissueor chlorenchyma. There was a gradual increase of thecell size, which reached a maximum in the median zoneof the mesophyll and then diminished towards the inter-ior, forming about four compact cell layers. These layersended in the vascular bundles, which represented thelimit separating the mesophyll from the hydrenchyma orgel (Figure 1a,b). Tukey’s test indicated variability in allobserved parameters among treatments and minor vari-ability between abaxial and adaxial surfaces except for sto-matal density and cuticle thickness (Table 1; Figure 1c,d).
Cuticle, epidermis, and stomataBoth leaf surfaces were grey-green in color, glabrous,and without trichomes. The cuticle layer thickness didnot allow visualization of either the epidermic cells orthe stomata (Figure 2c,d); this was achieved with succes-sive tangential cuts that eliminated the cuticle and ex-posed the spatial relation of the occlusive cells with thesubsidiary and epidermal cells (Figure 2e,f). Both leaf sur-faces had a thick cuticle layer that increased the water lossresistance of the leaves and stomata (Figure 1c,d). Table 1shows the cuticle thickness with slightly greater meanvalues for the abaxial epidermis. T4 plants had a greatercuticle thickness, with a mean of 18.7 μm compared to

Figure 1 Optical microscopy of a cross section of Aloe vera. Mesophyll cells, vascular bundles, and hydrenchyma in (a) T1 and (b) T2 plants (×280).(c) The epidermis, a stomatal complex, the substomatal chamber, and mesophyll cells (×1,120). (d) The cuticle and the stomatal complex (×1,500).
Silva et al. Revista Chilena de Historia Natural 2014, 87:13 Page 4 of 10http://www.revchilhistnat.com/content/87/1/13
13.24 μm in T1 (Table 1). This suggests that the plantsreacted to the greatest water stress (5% of the atmosphericevaporative demand) by forming a thicker cuticle layer,which contributed to their survival. The cuticle layer wasinterrupted only at the level of stomata, and cuticular ex-tension was observed even at the bottom of the guard cells
Table 1 Average values of cuticular thickness, stomatal densiin abaxial and adaxial leaf surfaces of A. vera (n = 20)
Treatments/surface
Cuticlethickness (μm)
Stomataldensity (Nº mm−2)
Abaxial
T1 13.34C 21.00B
T2 16.02B 21.10B
T3 16.92AB 22.85B
T4 18.70A 30.80A
Adaxial
T1 11.74C 20.60C
T2 11.76B 23.35C
T3 14.38AB 27.12B
T4 15.44A 30.80A
Average 14.79 25.05
Values with different letter designations in the same column and surface are signifi
(Figure 1c,d). The A. vera plants were amphistomatic(Table 1), having stomata in both the abaxial and adaxialepidermis, which is a characteristic of CAM plants.In both abaxial and adaxial epidermis, T4 plants had
the largest number of stomata per unit area: 30.8 ±1.04 mm−2, which was 42% greater than the 20.8 ± 0.44
ty, and sizes of occlusive cells and ostioles by treatment
Stomata
Occlusive cells Ostioles
Length Width Length Width
(μm) (μm) (μm) (μm)
52.18AB 52.05B 39.58A 6.26A
56.64AB 54.89A 39.55A 5.21A
52.77AB 51.28B 32.57B 5.38A
55.29A 49.59B 36.93A 3.02B
57.26A 5178A 40.73B 4.61B
57.62A 50.23B 42.02A 5.45A
55.89AB 48.20AB 42.06A 3.97B
54.48B 48.18B 40.91A 2.16C
55.05 50.99 38.90 4.49
cantly different (P ≤ 0.05).

Figure 2 Scanning electron micrographs of leaves. Cross and tangential sections of the abaxial surface of leaves from (a) T2 and (b) T4 plants,with arrows indicating a stoma on the leaf surface (×300). The tangential section also shows the mesophyll tissue (Me) and epidermis-cuticle (Ep).Images of the stomata of leaves of (c) T2 and (d) T4 plants, showing the difference in the amount of epidermal wax surrounding the stomata of thetwo plants; arrows indicate the ostioles (OS) of the stomata (×1,500). (e, f) Close-up images of stomata, showing guard cells (GC) and ostioles (Os).
Silva et al. Revista Chilena de Historia Natural 2014, 87:13 Page 5 of 10http://www.revchilhistnat.com/content/87/1/13
stomata mm−2 observed in T1 plants. There was astrong inverse correlation between density and wateravailability (r = −0.87). These findings may be explainedby the smaller size of the epidermal cells in T4 plants,which resulted in a greater number of stomata per unit
area. However, the occlusive cells increased in lengthand decreased in width; therefore, there was no correl-ation between the decrease of epidermal cell sizes andocclusive cell sizes. The mean distance between stomatawas 110 ± 11.7 μm in T4 plants (data not shown) and

Silva et al. Revista Chilena de Historia Natural 2014, 87:13 Page 6 of 10http://www.revchilhistnat.com/content/87/1/13
ranged from 130 to 154 μm in the other treatments.Therefore, the spatial distribution in T4 was 30% lowerthan the values for the other treatments.The dimensions of the occlusive cells of the abaxial
surface also differed among treatments; in T1 plants,these cells were 52.2 ± 1.3 by 52.1 ± 0.6 μm (an isodia-metric shape), while the dimensions in T4 plants were55.2 ± 0.72 by 49.6 ± 1.33 μm (rectangular). Similarvalues were found for the adaxial side (Table 1). Theostiole lengths were similar among the treatments, ex-cept for T3 abaxial side, whose mean 297 value was32.6 μm. However, the ostiole width was significantlysmaller in T4 compared to in other treatments. Ostiolewidth was 6.2 ± 0.25 μm in T1 and 3.2 ± 0.22 μm in T4,showing a 50% decrease and representing about 8% ofthe total stoma width, which seems to indicate that thestomata were nearly closed or closed in T4.
Mesophyll, cell dimensions, and intercellular spacesThe two leaf surfaces were analyzed separately for varia-tions in the mesophyll thickness. From T2 to T4, increas-ing water deficit decreased the mesophyll thickness inboth abaxial and adaxial surfaces, with the abaxial meso-phyll being 28% less in T3 than T2 and 33% less in T4than T2 (Tables 2 and 3). However, greater water availabil-ity did not assure larger mesophyll cell dimensions, as thisthickness increased from T1 to T2 (significantly for theadaxial surface; P ≤ 0.05) (Table 2). The maximum thick-ness was 1,827 μm observed in the adaxial surface of T2plants, compared to 1,327 μm in T4 plants; a similar effectwas found in the abaxial surface. The total mesophyllthickness at the leaf level was 3.4 in T2 and 2.9 mm in T4(Table 3). All of these results are in agreement with WUE,as recently reported by Silva et al. (2010).
Table 2 Epidermis and mesophyll thickness, photosynthetic cabaxial and adaxial leaf surfaces of A. vera (n = 20)
Treatment/surface
Thickness
Epidermis (μm) Mesophyll (μm)
Abaxial
T1 39.79B 1,685.00A
T2 42.98B 1,737.20A
T3 48.76A 1,347.10B
T4 39.93b 1,298.80c
Adaxial
T1 40.96B 1,707.70B
T2 43.36AB 1,827.20A
T3 41.87AB 1,372.50C
T4 46.25A 1,329.60C
Average 42.99 1,563.14
Values with different letter designations in the same column and surface are signifi
The IAS was significantly smaller for T4 plants, withthe abaxial surface reduced by 50% and the adaxial sur-face reduced by about 30% compared to in T1 and T2.Table 2 presents values based on measurements of themesophyll in the area with the largest cells, which areprobably the cells with the greatest photosynthetic activ-ity. These cell lengths varied from 111.2 to 163 μm andthe widths from 65 to 76 μm. There were significant dif-ferences among treatments (Table 2); T2 plant cells were34% and 43% larger than the cells of treatments T3 andT4, respectively. The adaxial surface mesophyll thicknesswas 100 μm greater in T2 plants compared to T1 due tothe larger size of the photosynthetic cells. The smallercell size in T4 plants was also responsible for the smallerintercellular spaces at the leaf level compared to in theother treatment groups (Table 2). The hydrenchymathickness was also variable; T2 plants had a mean thick-ness of 18.14 mm, 32% greater than in T4 plants(12.38 mm). These treatment-related differences in A.vera were statistically significant (P ≤ 0.05) (Table 3).The vascular bundles were observed to be similar to
those in C4 plants, showing a cluster of cells surround-ing the xylem and phloem, with excess mechanical tissue(probably collenchyma). The outer cells formed a bundleof sheath cells, similar to those that formed thehydrenchyma (Figure 1a,b). The greatest distance be-tween vascular bundles was observed in the most irri-gated plants, with a significantly higher number ofvascular bundles per unit area in the less irrigated plants.Figure 1a,b shows the effects of treatment on the num-ber of vascular bundles, with the number of cells separ-ating the beams ranging from 2 to 3 cells in T4 plants to8 to 9 cells in T2 plants. The vascular bundles and thecells between vascular bundles (similar to the exodermis)
ell size, and percent intercellular space by treatment in
Photosynthetic cells Intercellularspaces (%)Length (μm) Width (μm)
145.47A 76.31A 12.02A
152.52A 72.93A 12.40A
122.77B 74.62A 11.40AB
131.22B 65.20B 8.01C
154.45A 69.18AB 14.35AB
163.65A 68.54B 14.80A
121.20A 66.19B 13.50B
111.71B 75.91A 11.40C
140.37 71.11 12.23
cantly different (P ≤ 0.05).

Table 3 Average values of leaf thickness, mesophyll thickness, hydrenchyma width, and percent intercellular spaces bytreatment (n = 30)
Treatments Leaf thickness (mm) Mesophyll thickness (mm) Hydrenchyma width (mm) Intercellular spaces (%)
T1 17.1A 3.390B 13.71B 13.2A
T2 21.7B 3.560A 18.14A 13.6A
T3 18.8B 2.710C 16.09A 12.4A
T4 15.2C 2.820C 12.38B 9.70B
Values with different letter designations in the same column are significantly different (P ≤ 0.05).
Silva et al. Revista Chilena de Historia Natural 2014, 87:13 Page 7 of 10http://www.revchilhistnat.com/content/87/1/13
represent the boundary between the mesophyll andhydrenchyma (Figure 1a,b).
Water use efficiencyT2 plants had the greatest production of total green bio-mass, followed by the plants of T3, T1, and T4. Theslope of the biomass produced per quantity of water ap-plied corresponded to WUE; thus, the greatest WUEvalues were those of the T2 and T3 plants (24.5 and15.6 g L−1, respectively) while the lowest values werethose of the T4 and T1 plants (10.9 and 10.8 g L−1, re-spectively). Similar results were found regarding gel pro-duction. As expected, lower water availability negativelyinfluenced the WUE in T4 plants due to deficit. In con-trast, water supply equalling 20% of the evaporative at-mospheric demand negatively influenced the WUE valuedue to water excess. Watering to produce 15% of ETo
proved to be the minimum quantity of water required toobtain the maximum aerial biomass production. Similarto the above results, the linear relation between the gelproduced and the water utilized during the experimentalperiod varied as a function of water availability; theslopes represent the WUE for gel production per unitquantity of water applied by plant. The least efficienttreatments were the extremes, T1 and T4. The max-imum gel production was observed in the T2 plants,followed by T3 plants (17.7 and 13.1 g L−1, respectively);the differences were not significant. The amounts ofwater applied in these cases were close to the minimumto achieve maximum gel production in these edaphocli-matic conditions (Silva et al. 2010).Principal component analysis (Figure 3) showed the ef-
fect of water treatments on the photosynthetic tissueanatomy of the abaxial surface and its relationship withmorphological and physiological parameters, which ex-plained 86% of the total variation. Of the 25 responses,22 were positively and only 3 negatively associated withwater treatments. The analysis determined that eightanatomical parameters were associated with T2, twelvewith T1, one with T3, and two with T4. The most im-portant variables for T2 plants were mesophyll thickness(MT), length of photosynthetic cells (FCL), ostiolelength (OL), succulence index (Suc index), and total bio-mass (Tbiomass); all with values of r > 0.70 (vector
length Figure 3); the least important were basal leafthickness (BT leaf ) and epidermis thickness (EpT). Thevariables with greatest correlation for T1 and T3 wereleaf basal width (BWleaf ), stoma width (stmW), photo-synthetic cell width (FCW), and ostiole width (OW).The effect of the low water availability in T4 was posi-tively and significantly associated with stoma number(stmN°, r = 0.86), the stoma length, (StmL, r = 0.75), andcuticle thickness (CT, r = 0.82), and negatively associatedwith parameters of growth and productivity (Figure 3).
DiscussionOur results show that A. vera showed a great variabilityin the evaluated morphological and physiological traitsin response to different irrigation levels. By consideringthe entire system, our results enable the establishmentof relationships among drought tolerance, yield, andwater use efficiency. We found that morphological andanatomical changes observed in A. vera plants contrib-uted to increasing WUE. CAM plants generally exhibitimproved survival under low water conditions due to in-creased WUE and succulence, which delay dehydration;these structural characteristics make them more adaptiveto drought and, at the same time, able to produce a highyield in biomass, grains, or fruits of good quality.Drought tolerance appears to be an important character-istic of A. vera. The low-water treatments in this studytriggered the development of the cell wall cuticle layer,which grew thicker with less water availability. Plantstypically react to extreme water stress by favoring photo-synthetic tissue maintenance and producing less gel toaccumulate water (Silva et al. 2010). In our study, the T4plants (irrigated with 5% of the 395 ETo) only showedapical necrosis of the leaves.Biomass decreased significantly under water stress
(P ≤ 0.05), tending to coincide with increased WUE. Infive evaluations during the experimental period, Silvaet al. (2010) reported a seasonal relationship betweenleaf biomass and gel produced and the amount of waterused for production; their data indicated that total aerialbiomass production is a function of water availability,with more water producing more aerial biomass. In eachcase, there was a linear relationship between the vari-ables, but the slopes differed. In the present study,

Figure 3 Principal component analysis showing the relationships between anatomy, morphology, and WUE in A. vera. T1 to T4,treatments; CT, cuticle thickness; stmN°, stomata number; stmL, stomata length; stmD, distance between stomata; stmW, stomata width; OW,ostiole width; OL, ostiole length; EpT, epidermis thickness; MT, mesophyll thickness; VD, distance between vascular bundles; FCW, photosyntheticcells width; FCL, photosynthetic cells length; BWleaf, leaf basal width; BTleaf, leaf basal thickness; LeafVol, leaf volume; LA, leaf area; FW, leaf freshweight; Suc index, succulence index; DWleaf, leaf dry weight; Tbiomass, total biomass; WUE, water use efficiency.
Silva et al. Revista Chilena de Historia Natural 2014, 87:13 Page 8 of 10http://www.revchilhistnat.com/content/87/1/13
reduced growth was observed at both extremes of therange of water treatments at T1 due to excess water andat T4 due to a lack of water which is typical of CAMplants (Silva and Acevedo 1995, Silva et al. 2010). TheT2 plants had the maximum green biomass yield, corre-sponding with the observed larger cell size of the photo-synthetic tissue in these plants. This maximum greenbiomass yield is also in agreement with the IAS sincethe intercellular spaces were larger in T2 plants than inT3 and T4 plants. This finding indicates greater CO2 up-take in the T2 plants, favoring a higher WUE. A highWUE is often associated with a lower growth rate andyield; however, our results show that in A. vera, a highWUE can be associated with high green biomass prod-uctivity (Silva et al. 2010).The stomata of A. vera were parallelocytic and poly-
cyclic which is characteristic of monocot plants, such asbarley (Zeiger 1972) and onion (Zeiger and Cardemil1973). The ostiole was surrounded by two occlusive cellsthat were, in turn, surrounded by three layers of subsid-iary cells. The stomata were at the same level as the
epidermal cells. The main variation found to be associ-ated with water deficit was that the cuticular layer, whichcovered the cell walls homogeneously, reaching theborder of the ostiole opening. The occlusive cell lengthin the abaxial epidermis also changed with water treat-ment, increasing slightly but significantly from 52.77 μmin T1 to 55.29 μm in T4. These cells also exhibited awidth reduction, suggesting that the stomata were al-most closed or totally closed in T4 compared to T1.However, our group recently demonstrated that A. veraplants subjected to 3 months of severe water deficit stillopen the stomata at night because the sap of theseplants flows at a rate that is 10% of the flow rate ofplants under normal irrigation (Delatorre-Herrera et al.2010). The sap flow rate directly depends on the stoma-tal opening (Medrano et al. 2007). The comparison ofthe evaluated parameters showed few differences be-tween the two leaf surfaces, except for the occlusive celllengths and widths; these were slightly longer and nar-rower on the adaxial surface and shorter and wider onthe abaxial surface, indicating higher stomata resistance.
Silva et al. Revista Chilena de Historia Natural 2014, 87:13 Page 9 of 10http://www.revchilhistnat.com/content/87/1/13
This difference probably occurs because the plants re-ceive more solar radiation on the adaxial than the abax-ial surface.The number of stomata per unit area is a genetic charac-
teristic, with differences associated with different metabolicpathways. CAM plants generally have a lower stomatadensity compared to C3 and C4 plants (Hernández et al.2007; Silva and Acevedo 1984). In A. vera, several cellularmechanisms may account for changes in stomata density,including altered expansion of pavement cells, changes inthe number of entry and amplifying divisions in the sto-matal lineage, and the arrest or dedifferentiation of meris-temoids (Bergman and Sack 2007). The partial pressure ofCO2 also reportedly regulates stoma density at the genelevel (Heterington and Woodward 2003; Nadeau 2009).The present study showed that water availability was an-other environmental factor that regulated stoma density,which may be explained by the spatial relationships be-tween stomata, subsidiary, and epidermal cells when cellsize was reduced. Stomatal and epidermal cells are pro-duced by a series of asymmetric divisions and cell transi-tions within cell lineages, with specific genes regulatingthe initiation of new stomata by asymmetric divisions,controlling the spacing between the asymmetric divisions,and regulating the initiation of new lineages (Nadeau2009). In A. vera, water restriction probably activates thegenes that control the frequency of asymmetric divisions,producing more stomata per unit area in T4 plants.The anatomical pattern observed in A. vera showing
tight cell packing, cell size, mesophyll thickness, stomanumber, cuticle thickness, and reduced IAS to all be re-lated to low water availability may improve water accu-mulation and/or water conservation (Nelson et al. 2005).Many species maximize light interception by having ahigh IAS ratio. However, A. vera possesses a low IAS,presumably because of its requirements for water econ-omy. A low IAS ratio decreases transpirational waterloss and increases water storage capacity and water useefficiency. Additionally, CAM plants have very efficientCO2 uptake due to the C4 metabolism occurring in thesame mesophyll cell, with temporal separation betweenthe C4- and C3-CO2 assimilation, and underpinning theWUE because of the temporal difference in activitybetween PEP carboxylase (night) and Rubisco (day)(Borland et al. 2009; Evans and Loreto 2000). Our resultsindicate that under severe water stress (T4), A. veraplants decreased leaf production and total growth, dir-ectly affecting biomass production (Silva et al. 2010).The strategy that A. vera adopts under water stress ap-pears to involve channeling CO2 assimilates to osmolytesynthesis and partially replacing acemannan with otherpolysaccharides that hold water more efficiently andbetter protect the plant against water stress (Delatorreet al. 2010).
Leaf length, width, and thickness were negatively asso-ciated with increased numbers of stomata; thus, these di-mensions were greatest in plants that received morewater (T1 and T2) and had the least number of stomata.Similar stoma number decreases have also been reportedin other CAM plants, such as Opuntia sp. (Silva et al.2001) and in the C3 plant Phaseolus vulgaris (Silva et al.1999) probably due to decreased size of the pavementcells of the epidermis. Our allometric analysis showed acorrelation between greater 470 cell size in T1 and T2plants and greater water availability. Finally, it is import-ant to note that cuticle thickness which protected the T3and T4 plants against water loss that can induce plantdeath was negatively related to growth parameters.Overall, A. vera shows great plasticity to adapt to awater deficit, with close relationships between anatom-ical and growth parameters and physiological responsesfor survival under water restrictions.
ConclusionsThis study of water relationships in A. vera showed thatresponses in growth and physiological/productive char-acteristics are highly dependent on the species anatomy.The key factor at the cell level is the stomata, the struc-ture and physiology of which determine the crop viabil-ity. The strongest associations were found betweenstomatal characteristics and morpho-physiological re-sponses. For a density of 6,666 plants ha−1, the highestyield of biomass and gel was obtained by applying 15%of ETo, suggesting that the crop coefficient (KC) wouldbe 0.15. Water use efficiency is an indicator related toplant growth and is a function of the amount of waterused to produce biomass. Knowledge of the biology ofthe species, the water retention characteristics of thesoil, and the atmospheric evaporative demand of the ex-perimental (or cultivation) site enabled demonstration ofthe close relationship between water use efficiency, ana-tomical parameters, and tolerance to water deficit.
AcknowledgementsThis work was funded by the Vice-Rectoría de Investigación y Desarrollo(VID), Universidad de Chile (MULT 05/30-2).
Received: 12 July 2013 Accepted: 23 June 2014
ReferencesAburto F, Hernández C, Pfeiffer M, Casanova M, Luzio W (2008) Soil: a work of art
of nature. northern field guide between 30 S° and 33 S°. In: Casanova M,Luzio W (eds) The international conference and field workshop on soilclassification. Universidad de Chile, Santiago, Chile, Ovalle, Chile, p 94
Bergman DC, Sack FD (2007) Stomatal development. Annual Review PlantBiology 58:163–181
Borland A, Taybi T (2004) Synchronization of metabolic processes in plants withcrassulacean acid metabolism. J Exp Bot 55:1255–1265
Borland AM, Griffith H, Hartwell H, Smith AC (2009) Exploiting the potential plantswith crassulacean acid metabolism for bioenergy production on marginalland. J Exp Bot 10:2879–2896

Silva et al. Revista Chilena de Historia Natural 2014, 87:13 Page 10 of 10http://www.revchilhistnat.com/content/87/1/13
Caird MA, Richards JH, Donovan LA (2007) Nighttime stomatal conductance andtranspiration in C3 and C4 plants. Plant Physiol 143:4–10
Cowling (1982) Patterns of plant endemism in the south east Cape. TheNaturalist 27:17–36
Delatorre-Herrera J, Silva H, Delfino I, Cardemil L (2010) Irrigation restrictioneffects on water use efficiency and osmotic adjustment in Aloe Vera plants(Aloe barbadensis Miller). Agric Water Manag 97:1564–1570
Di Rienzo JA, Casanoves F, Balzarini MG, Gonzalez L, Tablada M, Robledo CW(2013) InfoStat versión 2013. Grupo InfoStat, FCA, Universidad Nacional deCórdoba, Argentina, URL http://www.infostat.com.ar
Evans JR, Loreto F (2000) Acquisition and diffusion of CO2 in higher plants leaves.In: Leegood RC, Sharkey TD, Von Caemmerer S (eds) Photosynthesis:physiology and metabolism. Kluwer Academic, Dordrecht, pp 321–351
Evans JR, Von Caemmerer S, Setchell BA, Hudson GS (1994) The relationshipsbetween CO2 transfer conductance and leaf anatomy in transgenic tobaccowith a reduced content of Rubisco. Aust J Plant Physiol 21:475–495
Genet WBM, Van Schooten CAM (1992) Water requirement of Aloe vera in a dryCaribbean climate. Irrig Sci 13:81–85
Hernández M, Terrazas T, Delgado-Alvarado A, Cavazos ML (2007) Los estomas deMyrtillocactusgeometrizans (Mart.ex.Pfeiff.) Console (Cactaceae): Variación ensu área de distribución. Rev Fitotec Mex 30:235–240
Herrera A (2009) Crassulacean acid metabolism and fitness under water deficitsstress: if not for carbon gain, what is facultative CAM good for? Ann Bot103:645–653
Herrera A, Fernández MD, Taisma MA (2000) Effects of drought on CAM waterrelations in plants of Peperomia carnevalii. Ann Bot 86:511–517
Heterington AM, Woodward FI (2003) The role of stomata in sensing and drivingenvironmental change. Nature 424:901–908
INFOSTAT (2009) InfoStat software version 2009. Grupo InfoStat, FCA, UniversidadNacional de Córdoba, Argentina
INIA (2010) Laboratorio de suelos. Interpretación de análisis químicos de suelos.Disponible en: http://www.inia.cl/link.cgi/suelo/resultados/7706
Medrano H, Galmes J, Ribas-Carbo M, Gulias J, Bota J, Pon A, Moreno M, Cifre J,Flexas J (2007) Photosynthesis and water use efficiency: improving plantproductivity in semi-arid environments. Photosynth Res 91:277–277
Nadeau JA (2009) Stomatal development: new signals and fate determinants.Curr Opin Plant Biol 12:29–35
Nelson EA, Sage TL, Sage RF (2005) Functional leaf anatomy of plants withcrassulacean acid metabolism. Funct Plant Biol 32:409–419
Nobel PS (1980) Leaf anatomy and water use efficiency. In: Turner NC, Kramer PJ(eds) Adaptation of plant to water and high temperature stress. Wiley,New York, pp 43–55
Nobel PS (1995) Environmental biology. In: Barbera G, Inglese P, Pimienta-BarriosE, Arias-Jiménez EJ (eds) Agroecology, cultivation and uses of cactus. Pear.Plant production and protection paper. FAO, Rome, Italy, pp 36–57
Nobel PS (1999) Physicochemical and environmental plant physiology. Academic,New York, p 608
Nobel PS, Zaragoza LJ, Smith WK (1975) Relation between mesophyll surfacearea, photosynthesis rate and illumination level during development forleaves of Plectanthrus parviflorus H. Plant Physiol 55:2067–2070
Pierce S, Winter K, Grifftihs H (2002) The role of CMA in high rainfall cloud forest:an in situ comparison of photosynthetic pathways in Bromeliaceae. Plant Celland Environment 25:1181–1189
Reynolds T, Dweek AC (1999) Aloe vera leaf gel: a review update. J Ethnopharmacol68:3–7
Rodríguez-García R, Jasso De R, Angulo-Sánchez JL (2002) Comparison betweenthe production of leaves, gel and juice in Aloe vera grown with plastic mulchor natural conditions. In: Annual meeting association for the advancement ofindustrial crops and new uses council, 15–17 October 2000. St. Louis, Missouri,p 35, Abstract
Silva H, Acevedo E (1984) Adaptaciones anátomo morfológicas al déficit hídricoen Atriplex repanda Phil. Rev Chil Hist Nat 57:69–78
Silva H, Acevedo E (1995) Eficiencia en el uso del agua en diez taxa de Opuntiaintroducidas en la región árida mediterránea de Chile. Rev Chil Hist Nat68:271–283
Silva H, Martínez JP, Baginsky C, Pinto M (1999) Efecto del déficit hídrico en laanatomía foliar de seis cultivares de poroto (Phaseolus vulgaris L.). Rev ChilHist Nat 72:219–235
Silva H, Acevedo E, Silva P (2001) Anatomía del tejido fotosintético de diez taxade Opuntia establecidos en el secano árido mediterráneo de Chile. Rev ChilHist Nat 74:341–351
Silva H, Sagardia S, Seguel O, Torres C, Franck N, Tapia C, Cardemil L (2010) Effectof water availability on growth and water use efficiency for biomass and gelproduction in aloe vera (Aloe barbadensis M.). Industrial Crop Production31:20–27
Warren CR (2008) Stand aside stomata, another actor deserves centre stage: theforgotten role of the internal conductance to CO2. J Exp Bot 59:1475–1487
Zeiger E (1972) Direct measurement of stomatal cell production in barley. Planta(Berl) 108:359–362
Zeiger E, Cardemil L (1973) Cell kinetics, stomatal differentiation and diurnalrhythm in Allium cepa. Dev Biol 32:179–188
doi:10.1186/s40693-014-0013-3Cite this article as: Silva et al.: Relationships between leaf anatomy,morphology, and water use efficiency in Aloe vera (L) Burm f. as afunction of water availability. Revista Chilena de Historia Natural2014 87:13.
Submit your manuscript to a journal and benefi t from:
7 Convenient online submission
7 Rigorous peer review
7 Immediate publication on acceptance
7 Open access: articles freely available online
7 High visibility within the fi eld
7 Retaining the copyright to your article
Submit your next manuscript at 7 springeropen.com