research article earthquake incidence angle influence …
TRANSCRIPT

609
Sigma J Eng & Nat Sci 35 (4), 2017, 609-631
Research Article EARTHQUAKE INCIDENCE ANGLE INFLUENCE ON SEISMIC PERFORMANCE OF REINFORCED CONCRETE BUILDINGS Ahmet Can ALTUNIŞIK*1, Ebru KALKAN2
1Department of Civil Eng., Karadeniz Technical University, TRABZON; ORCID:0000-0002-2638-2903 2Department of Civil Eng., Karadeniz Technical University, TRABZON; ORCID:0000-0002-2835-1705 Received: 11.05.2017 Revised: 13.07.2017 Accepted: 25.08.2017 ABSTRACT In this paper, it is aimed to evaluate the earthquake incidence angle influence on the seismic performance of buildings. For numerical example, 5-story reinforced concrete building with moment resisting frame and square plan has been analyzed using finite element methods. The building is subjected to 1992 Erzincan earthquake ground accelerations in nineteen directions whose values range between 0 to 90 degrees, with an increment of 5 degrees. The linear time history analyses have been carried out using SAP2000 software. The seismic weight is calculated using full dead load plus 30% of live load. The variation of the maximum story displacements, internal forces such as axial forces, shear forces and bending moments in columns and beams, and principal stresses are studied to determine the earthquake incidence angle influence on the seismic performance. The results show that angle of seismic input motion considerably influences the response of reinforced concrete buildings. It is seen that the maximum displacements are obtained at X and Y direction for 90o and 0o. The results are changed considerably with the different earthquake incidence angle. Maximum differences are calculated as 54.54% and 37.14% for x-y directions, respectively. The result shows that column forces exceeds by varying the angle of excitation of seismic force and the value of axial forces and bending moments may exceed the ordinary cases up to 44%. The structure gets its maximum value of column forces with a specific angle of excitation of seismic force which is different from column to column. The responses are changed significantly as 28.01% and 41.10%. Also, the principal stresses are changed as 12.34%. There is no unique specific angle of incidence for each structure which increases the value of internal forces of all structural members together; each member gets its maximum value of internal forces by a specific angle of incidence. Keywords: Earthquake incidence angle influence, finite element method, reinforced concrete building, seismic performance. 1. INTRODUCTION
Buildings occupy the major percentage of engineering stocks. Although it is known that in case of destruction there will emerge significant life and financial losses, the last dramatic and destructive events (2004 Sumatra earthquake in Indonesia. 2011 Van earthquakes in Turkey. 2011 Sendai earthquake in Japan) showed that there was not enough attention at the design and construction phases of buildings. After the October 23 and November 9, 2011 Van/Turkey
* Corresponding Author: e-mail: [email protected], tel: (462) 377 40 20
Sigma Journal of Engineering and Natural Sciences
Sigma Mühendislik ve Fen Bilimleri Dergisi

610
earthquakes, the site investigations demonstrated that (Bayraktar et al., 2013 and 2015) nearly all of the non-engineering reinforced concrete buildings completely collapsed or damaged heavily. Most of these were not designed and constructed in accordance with the related design codes.
From the past to the present day, is studied earthquake effect in engineering structures. Many studies show that the effect of earthquakes has changed with respect to incidence angle. When studies are investigated, analytical formulae develop for the determination of the critical angle of earthquake ground motion. In virtue of developed formulas, the maximum values that occur at the critical angle have been determined (Athanatopoulou 2005, Song et al. 2008). The earthquake motion at a specific point of the ground is recorded along two horizontal directions and one vertical. However, in view of some studies, vertical direction component of ground motion may be considered uncorrelated with horizontal directions components (Penzien and Watabe 1975). Nearly all design codes suggested the simultaneous implementation of two horizontal components for each earthquake excitation (FEMA 2000; Eurocode 2004; TERDC 2007). When the studies done from past to this day are examined, many different studies present on effect of earthquake angles (2-directions), in engineering constructions (Gonzalez 1992, Rigato and Medina 2007, Fujita and Takewaki 2010, Kostinakis and Athanatopoulou 2015). In study, the constructions are subjected to earthquake ground accelerations whose values range between 0 to 90 and 0 to 180 degrees, with an increment of 5, 6, 15, 20 etc. degrees (Lagaros 2010, Lucchini et al. 2011, Kostinakis et al. 2013, Kumar and Gajjar 2013, Fontara et al. 2015). In many papers, present that asymmetric-plan structures (Nguyen and Kim 2013, Van and Kim 2013), high-rise steel building (Hosseini and Salemi 2008, Tun and Htun 2014), highway tunnel (Sevim 2013), bridge (Armouti 2002, Liang and Lee 2003, Goa et al. 2004, Ateş et al. 2009, Torbol and Shinozuka 2012, Atak et al. 2014, Newton 2014, Ni et al. 2015) are analyzed and designed based on different seismic excitation angles. Quadri and Madhuri (2014) studied about critical angle of seismic incidence of RC frames. In study, four-story reinforced concrete building is subjected to earthquake ground accelerations whose values range between 0 to 90 with an increment of 10 degree. Kanya and Rao (2015) investigation effect of earthquake incidence angle on seismic performance of RC buildings. In this study, one regular and two plan irregular buildings are modelled and investigated. All the buildings are subjected to ground accelerations whose values range between 0 to 180 degrees. Magliulo et al. (2014) tried to influence of earthquake direction on the seismic response of irregular plan RC frame buildings. In the survey is carried out nonlinear static and dynamic analysis. The incidence angles taken from 0 to 330 degrees, with an increment of 30 degrees. Dynamic earthquake responses of structures are evaluated by diffent researchers (Lopez and Torres 1997, Gao et al. 2004, Fujita and Takewaki 2009, Polycarpou at al. 2015)
This paper presents the effect of earthquake incidence angle on the structural dynamic behavior of reinforced concrete building. The eighteen directions whose values range between 0 to 90 degrees, with an increment of 5 degrees are taken into account for comparison. The variation of the maximum story displacements and internal forces in columns and beams are considered to determine these influence on the seismic performance. 2. GROUND MOTION INCIDENCE ANGLE
To evaluate the ground motion rotation influence, the two orthogonal (x and y) components of acceleration üxg(t) and üyg(t) are rotated by considered degree and resolved to the structural degrees of freedom (Fig. 1a). It is accepted that üxg(t) and üyg(t) are initially directed along to the X and Y directions, respectively. The rotation (θ) of ground motion components at counter clockwise can be resolved to equivalent ground motion components along the axes (ü1 (t) and ü2
(t)) of the structural degrees of freedom.
A.C. Altunışık, E. Kalkan / Sigma J Eng & Nat Sci 35 (4), 609-631, 2017

611
(a) (b)
Figure 1. Rotation of ground motion acceleration (a) and structure (b)
üTü gs . (1)
tü
tü
tü
tü
tü
tü
zg
yg
xg
s
s
s
100
0cossin
0sincos
3
2
1
(2)
The transformation matrix (T) is used to perform this operation and is based solely on geometry (Cronin 2007). It should be note that the term of üzg(t) shown the vertical motion which is not affected by planar rotation.
A similar approach can be used in the literature (Mohraz and Mehran 1994, Safak and Bendimerad 1998, Liang and Lee 2003) to study ground motion incidence angle is to rotate the structure and transform the original ground motion components to the rotated structural degrees of freedom (Fig. 1b).
üTü gts . (3)
tü
tü
tü
tü
tü
tü
zg
yg
xg
s
s
s
100
0cossin
0sincos
3
2
1
(4)
The transformation matrix Tt is simply the inverse of T and could also be thought of as the clockwise rotation of ground motion with respect to a stationary structure (Cronin 2007).
3. DESCRIPTION OF THE REINFORCED CONCRETE BUILDING
The building is a five story reinforced concrete frame structure with shear walls. The height of each floor and total height of building are 3m and 15m, respectively. The floor area of building is about 325m2 and there is not a basement on the building. The foundation is designed and projected as a raft foundation. The fixed boundary condition is taken into account considering Z1 local site class is and A (rock) soil groups. There is a reinforced concrete shear-wall with 25cm thickness surrounding the side corners and elevator shaft. Each floor consists of 60 reinforced concrete slabs with 12cm thickness. The plan and vertical section of the building are shown in Fig. 2. Some structural and analyses properties of the selected building are given in Table 1.
Earthquake Incidence Angle Influence on Seismic … / Sigma J Eng & Nat Sci 35 (4), 609-631, 2017

612
a) Plan view
b) Slab section
c) Vertical section on 4-4 grids
Figure 2. Plan and sections views of the selected building
A.C. Altunışık, E. Kalkan / Sigma J Eng & Nat Sci 35 (4), 609-631, 2017

613
Table 1. Some structural and analyses properties of the selected building
Structural and Analyses Properties
Earthquake Zone A0=1st degree (0.4g) Beams Section B=25/60 (160)
Usage Purpose School building Column Section S=25/60 (65)
Importance Factor I=1.4 Shear Wall 25cm thickness (40)
Materials C25/30 S420 Slab 12cm thickness (60)
Modulus of Elasticity 31E6kN/m2 Density 25kN/m3
Poisson Ratio 0.2 Analysis Dynamic (Time History)
Local Site Class Z1 Foundation Type Raft
Soil Group A Boundaries Fixed
4. FINITE ELEMENT MODELLING AND MODAL ANALYSIS
Finite element model of the selected five story reinforced concrete building is constituted by SAP2000 (2015) program. This program can be used to determine the linear and nonlinear static and dynamic behavior of all engineering structures. The analytical model is created by in-situ investigation on existing structure and static project drawings (Fig. 3).
Earthquake Incidence Angle Influence on Seismic … / Sigma J Eng & Nat Sci 35 (4), 609-631, 2017

614
Figure 3. Some view of the finite element model of reinforced concrete school building
A.C. Altunışık, E. Kalkan / Sigma J Eng & Nat Sci 35 (4), 609-631, 2017

615
In the analytical model, the columns and beams are modelled as frame elements having six degrees of freedom in each node (translation in x. y and z directions; rotation around the x. y and z axes). The shear-wall and slab are modelled using shell elements having two degrees of freedom in each node (translation in x and z direction).
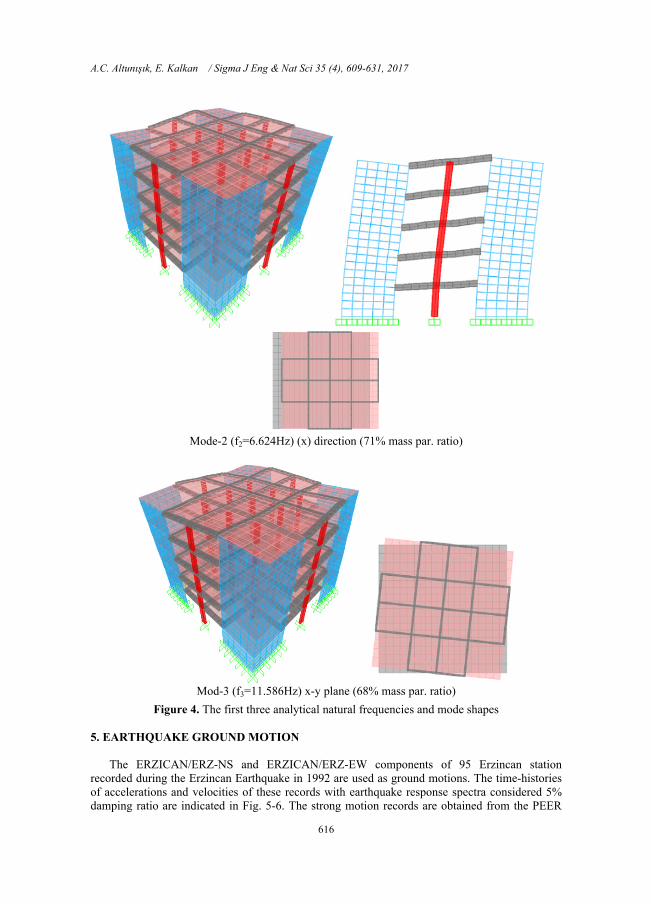
Modal analysis of the building is carried out to calculate likely natural frequencies and mode shapes. The first three natural frequencies are attained in the range of 6-12Hz. The first and second mode shapes are translation mode in y and x direction, the third corresponding mode shape is torsional mode in x-y plane (Fig. 4).
Mode-1 (f1=6.564Hz) (y) direction (71% mass par. ratio)
Earthquake Incidence Angle Influence on Seismic … / Sigma J Eng & Nat Sci 35 (4), 609-631, 2017
616
Mode-2 (f2=6.624Hz) (x) direction (71% mass par. ratio)
Mod-3 (f3=11.586Hz) x-y plane (68% mass par. ratio)
Figure 4. The first three analytical natural frequencies and mode shapes
5. EARTHQUAKE GROUND MOTION
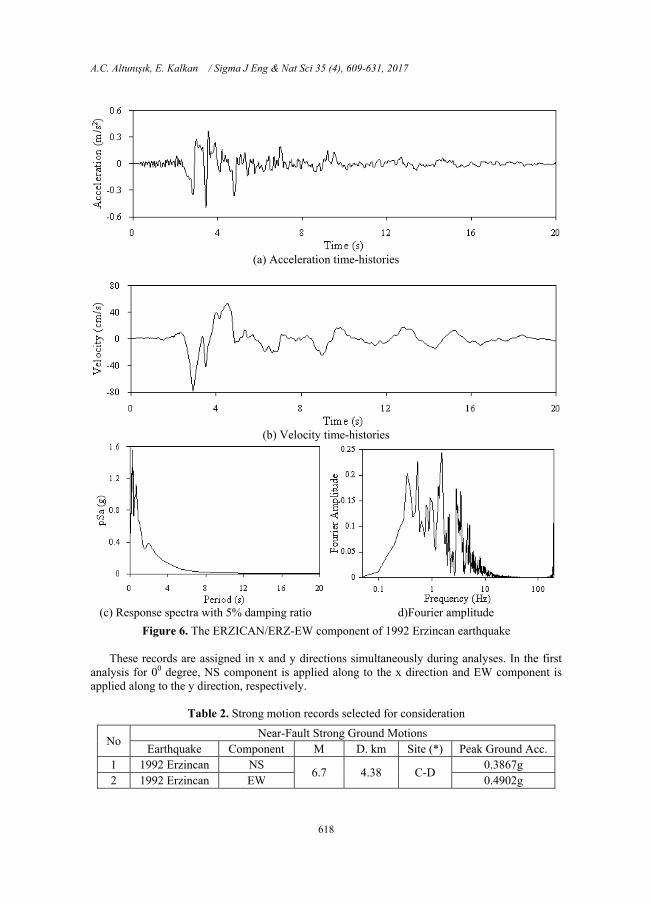
The ERZICAN/ERZ-NS and ERZICAN/ERZ-EW components of 95 Erzincan station recorded during the Erzincan Earthquake in 1992 are used as ground motions. The time-histories of accelerations and velocities of these records with earthquake response spectra considered 5% damping ratio are indicated in Fig. 5-6. The strong motion records are obtained from the PEER
A.C. Altunışık, E. Kalkan / Sigma J Eng & Nat Sci 35 (4), 609-631, 2017

617
Strong Motion Database (PEER 2016). The databases have information on the site conditions and the soil type for the instrument locations. Table 2 presents the list the parameters of the ground motion records.
(a) Acceleration time-histories
(b) Velocity time-histories
(c) Response spectra with 5% damping ratio d)Fourier amplitude
Figure 5. The ERZICAN/ERZ-NS component of 1992 Erzincan earthquake
Earthquake Incidence Angle Influence on Seismic … / Sigma J Eng & Nat Sci 35 (4), 609-631, 2017
618
(a) Acceleration time-histories
(b) Velocity time-histories
(c) Response spectra with 5% damping ratio d)Fourier amplitude
Figure 6. The ERZICAN/ERZ-EW component of 1992 Erzincan earthquake
These records are assigned in x and y directions simultaneously during analyses. In the first analysis for 00 degree, NS component is applied along to the x direction and EW component is applied along to the y direction, respectively.
Table 2. Strong motion records selected for consideration
No Near-Fault Strong Ground Motions
Earthquake Component M D. km Site (*) Peak Ground Acc. 1 1992 Erzincan NS
6.7 4.38 C-D 0.3867g
2 1992 Erzincan EW 0.4902g
A.C. Altunışık, E. Kalkan / Sigma J Eng & Nat Sci 35 (4), 609-631, 2017

619
5.1. Displacements
The changing of absolute values of the peak horizontal displacements of building for Erzincan 1992 earthquake considered nineteen directions whose values ranges between 0 to 90 degrees with an increment of 5 degrees to determine the earthquake incidence angle influence are denoted in Fig. 7.
It is clearly seen that displacements increase by height of the building for all analyses. The maximum and minimum top displacements are obtained in X direction as 6.8mm and 4.4mm for 90o and 0o, respectively (Fig. 7a). Also, the maximum and minimum top displacements are obtained in Y direction as 7.0mm and 3.9mm for 0o and 80o, respectively (Fig. 7b). It can be said that the displacements are changed considerably with the different earthquake incidence angle. The maximum differences are calculated as 54.54% and 37.14% for X and Y directions, respectively. Table 3 presents the maximum differences in each angle and total differences values to evaluate the earthquake incidence angle influence more accurately. The differences, calculated as a percentage increase of the next angle change relative to the previous angle change. The time histories of horizontal displacements in X and Y directions at the top of building obtained from the linear time-history analysis are presented Fig. 8(a-b).
(a) X direction (b) Y direction
Figure 7. The changing of maximum horizontal displacements by the height of building
Earthquake Incidence Angle Influence on Seismic … / Sigma J Eng & Nat Sci 35 (4), 609-631, 2017

620
(a) X direction (b) Y direction
Figure 8. The time histories of maximum horizontal displacements at the top of building
Table 3. The maximum differences in displacements for each earthquake incidence angle
Earthquake Incidence
Angle
X Direction Y Direction
Max. Disp. (mm) Diff. (%) Max. Disp. (mm) Diff. (%)
0o 4.40 ------ 7.00 ------ 5o 4.60 4.55 6.90 1.43
10o 4.80 4.35 6.90 ------ 15o 5.00 4.17 6.70 2.90 20o 5.20 4.00 6.60 1.49 25o 5.30 1.92 6.30 4.55 30o 5.40 1.89 6.10 3.17 35o 5.40 ------ 5.70 6.56 40o 5.40 ------ 5.40 5.26 45o 5.40 ------ 5.00 7.41 50o 5.30 1.85 4.70 6.00 55o 5.60 5.66 4.50 4.26 60o 5.90 5.36 4.30 4.44 65o 6.10 3.39 4.00 6.98 70o 6.40 4.92 3.90 2.50 75o 6.60 3.12 3.90 ------ 80o 6.70 1.52 3.90 ------ 85o 6.80 1.49 4.10 5.13 90o 6.80 ------ 4.40 7.32
Max. Diff. (%) 54.54 Max. Diff. (%) 37.14
The maximum relative drifts in X and Y directions for each floor are given in Fig. 9 (a-b). It is seen that the maximum drifts in X direction are obtained as 0.00053 at 70o.75o.80o.85o. 90o and the minimum drifts are obtained as 0.00037 at 0o and 5o. In addition, the maximum drifts in Y direction are obtained as 0.00057 at 0o.5o.10o.15o and the minimum drifts are obtained as 0.0003 at 70o. These values are well below the maximum allowable code limits as 0.02.
A.C. Altunışık, E. Kalkan / Sigma J Eng & Nat Sci 35 (4), 609-631, 2017

621
(a) X direction (b) Y direction
Figure 9. The maximum relative drifts in X and Y directions for each floor
5.2. Internal forces
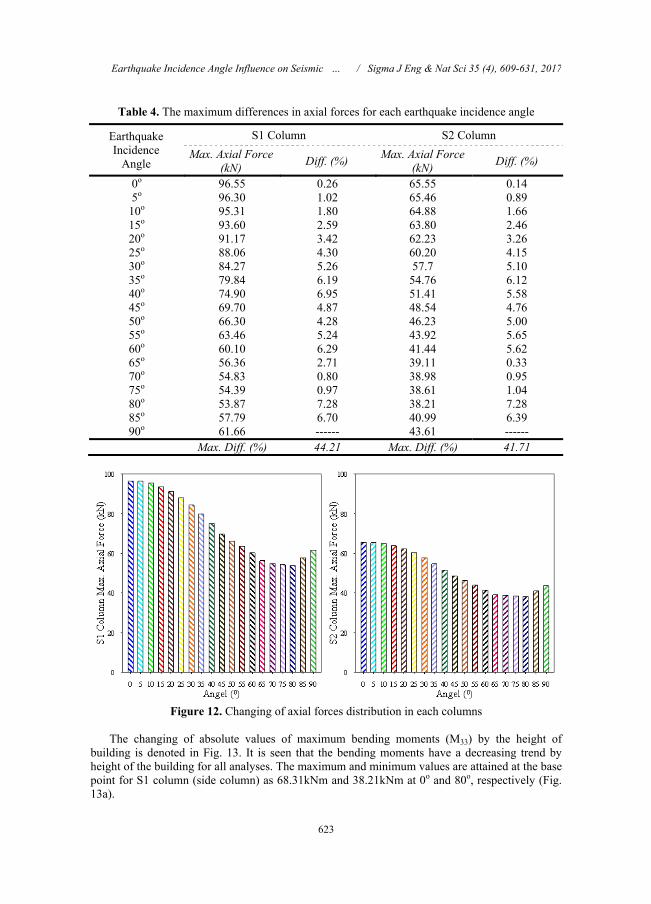
To determine the earthquake incidence angle effect on the internal forces of building structural elements, two columns and beams are selected at the side and interval. The changing of axial forces by the height of building for Erzincan 1992 earthquake considered nineteen directions whose values range between 0 to 90 degrees with an increment of 5 degrees to determine the earthquake incidence angle influence are denoted in Fig. 10. It is seen that the axial forces have a decreasing trend by height of the building for all analyses. The maximum and minimum values are attained at the base point for S1 column (side column) as 96.55kN and 53.87kN at 0o and 80o, respectively (Fig. 10a). In addition, these values are attained at the same point for S2 column (interval column) as 65.55kN and 38.21kN at 0o and 80o, respectively (Fig. 10b). These results show that the axial forces are changed significantly as 44.21% and 41.71% for S1 and S2 columns, respectively.
Table 4 presents the maximum differences in each angle and total differences values to evaluate the earthquake incidence angle influence more accurately. The differences, calculated as a percentage increase of the next angle change relative to the previous angle change. The time histories of axial forces for S1 and S2 columns are presented Fig. 11(a-b).
Earthquake Incidence Angle Influence on Seismic … / Sigma J Eng & Nat Sci 35 (4), 609-631, 2017

622
(a) S1 column (b) S2 column
Figure 10. The changing of maximum axial forces by the height of building
(a) S1 column (b) S2 column
Figure 11. The time histories of maximum axial forces at the base of building
S1 and S2 columns have 25x60cm section area and 1875kN load carrying capacity. It can be seen that these values (given in Table 4) are well below the maximum capacity. There is a decreasing trend up to 80oand after increasing trend at last two steps (Fig. 12).
A.C. Altunışık, E. Kalkan / Sigma J Eng & Nat Sci 35 (4), 609-631, 2017
623
Table 4. The maximum differences in axial forces for each earthquake incidence angle
Earthquake Incidence
Angle
S1 Column S2 Column
Max. Axial Force (kN)
Diff. (%) Max. Axial Force
(kN) Diff. (%)
0o 96.55 0.26 65.55 0.14 5o 96.30 1.02 65.46 0.89
10o 95.31 1.80 64.88 1.66 15o 93.60 2.59 63.80 2.46 20o 91.17 3.42 62.23 3.26 25o 88.06 4.30 60.20 4.15 30o 84.27 5.26 57.7 5.10 35o 79.84 6.19 54.76 6.12 40o 74.90 6.95 51.41 5.58 45o 69.70 4.87 48.54 4.76 50o 66.30 4.28 46.23 5.00 55o 63.46 5.24 43.92 5.65 60o 60.10 6.29 41.44 5.62 65o 56.36 2.71 39.11 0.33 70o 54.83 0.80 38.98 0.95 75o 54.39 0.97 38.61 1.04 80o 53.87 7.28 38.21 7.28 85o 57.79 6.70 40.99 6.39 90o 61.66 ------ 43.61 ------
Max. Diff. (%) 44.21 Max. Diff. (%) 41.71
Figure 12. Changing of axial forces distribution in each columns
The changing of absolute values of maximum bending moments (M33) by the height of building is denoted in Fig. 13. It is seen that the bending moments have a decreasing trend by height of the building for all analyses. The maximum and minimum values are attained at the base point for S1 column (side column) as 68.31kNm and 38.21kNm at 0o and 80o, respectively (Fig. 13a).
Earthquake Incidence Angle Influence on Seismic … / Sigma J Eng & Nat Sci 35 (4), 609-631, 2017

624
In addition, these values are attained at the same point for S2 column (interval column) as 99.57kNm and 55.87kNm at 0o and 80o, respectively (Fig. 13b). These results show that the bending moments are changed significantly as 44.06% and 43.89% for S1 and S2 columns, respectively.
Table 5 presents the maximum differences in each angle and total differences values to evaluate the earthquake incidence angle influence more accurately. The differences, calculated as a percentage increase of the next angle change relative to the previous angle change. The time histories bending moments for S1 and S2 columns are presented Fig. 14(a-b).
(a) S1 column (b) S2 column
Figure 13. The changing of maximum bending moments by the height of building
(a) S1 column (b) S2 column
Figure 14. The time histories of maximum bending moments at the base of building
A.C. Altunışık, E. Kalkan / Sigma J Eng & Nat Sci 35 (4), 609-631, 2017

625
Table 5. The maximum differences in bending moments for each earthquake incidence angle
Earthquake Incidence
Angle
S1 Column S2 Column
Max. Moments (kNm) Diff. (%) Max. Moments (kNm) Diff. (%)
0o 68.31 0.29 99.57 0.31 5o 68.11 1.05 99.26 1.09 10o 67.40 1.82 98.18 1.84 15o 66.17 2.62 96.37 2.39 20o 64.43 3.45 94.07 3.75 25o 62.21 4.34 90.54 4.37 30o 59.51 5.29 86.58 5.34 35o 56.37 6.16 81.96 6.11 40o 52.90 7.16 76.95 7.21 45o 49.11 5.20 71.40 5.20 50o 46.55 3.98 67.69 4.11 55o 44.70 5.10 64.91 5.07 60o 42.42 6.19 61.62 6.09 65o 39.80 3.33 57.87 2.87 70o 38.47 0.00 56.21 0.09 75o 38.47 0.67 56.26 0.69 80o 38.21 6.03 55.87 4.69 85o 40.52 6.85 58.49 6.94 90o 43.29 ------ 62.55 ------
Max. Diff. (%) 44.06 Max. Diff. (%) 43.89
To determine the beam response, B1 and B2 beams (Fig. 2a) are selected to represent the side and interval beams. The support and spans values are calculated for both beams in each earthquake directions. The changing of bending moments are given in Fig. 15. The maximum and minimum values are attained for B1 beam (side beam) as 34.31kNm and 24.70kNm at 30o and 75o, respectively. These values are attained for B2 beam (interval beam) as 40.96kNm and 29.03kNm at 80o and 0o, respectively. These results show that the beam response are changed significantly as 28.01% and 41.10% for B1 and B2 beams, respectively. Table 6 presents the maximum differences in each angle and total differences. The time histories of bending moments for B1 and B2 beams are presented Fig. 16 (a-b).
Figure 15. Changing of bending moments distribution in each beams
Earthquake Incidence Angle Influence on Seismic … / Sigma J Eng & Nat Sci 35 (4), 609-631, 2017

626
Figure 16. The time histories of maximum bending moments for B1 and B2 beams
Table 6. The maximum differences in bending moments for B1 and B2 beams
Earthquake Incidence
Angle
Side Beam Interval Beam
Support kNm
Diff. (%)
Span kNm
Diff. (%)
Support kNm
Diff. (%)
Span kNm
Diff. (%)
0o 30.03 4.40 6.67 2.68 29.03 4.03 4.11 5.49 5o 31.35 3.50 6.85 1.85 30.20 3.17 4.33 4.51 10o 32.45 2.62 6.97 15.02 31.15 2.31 4.53 3.72 15o 33.30 1.79 5.93 19.25 31.87 1.50 4.70 2.82 20o 33.89 1.00 7.07 0.34 32.35 0.71 4.83 1.98 25o 34.23 0.23 7.04 1.08 32.58 0.06 4.93 1.19 30o 34.31 0.54 6.97 1.86 32.60 0.56 4.99 0.41 35o 34.13 1.30 6.84 2.65 32.42 0.10 5.01 0.35 40o 33.68 2.08 6.66 3.49 32.45 3.31 4.99 1.11 45o 32.98 2.88 6.4 4.37 33.53 5.74 4.93 1.89 50o 32.03 3.73 6.14 5.33 35.45 4.67 4.84 2.68 55o 30.84 4.48 5.82 6.36 37.10 3.70 4.71 3.52 60o 29.45 5.30 5.45 5.25 38.48 2.80 4.54 4.41 65o 27.89 6.53 5.16 5.27 39.55 1.97 4.34 5.11 70o 26.07 5.24 4.89 1.57 40.33 1.17 4.12 6.11 75o 24.70 3.11 4.96 4.80 40.80 0.39 3.87 0.54 80o 25.47 2.25 5.20 3.82 40.96 0.37 3.85 1.38 85o 26.05 1.44 5.40 3.24 40.81 1.13 3.90 0.60 90o 26.42 ----- 5.58 ----- 40.35 ----- 3.93 -----
Max.
Diff. (%) 28.01
Max. Diff. (%)
30.83 Max.
Diff. (%) 41.10
Max. Diff. (%)
23.15
5.3. Principal stresses
The maximum compressive and tensile principal stresses contours attained from the shear walls for all earthquake incidence angles are given in Fig. 17. These stresses contours represent the distribution of the peak values reached by the maximum stresses at each point within the section. The maximum and minimum tensile stresses are attained at the corner of shear walls as 12.88MPa and 11.29MPa at 20o and 45o, respectively (Fig. 17a). In addition, these values are
A.C. Altunışık, E. Kalkan / Sigma J Eng & Nat Sci 35 (4), 609-631, 2017

627
attained at the same point for compressive stresses as 12.88MPa and 11.29MPa at 20o and 45o, respectively (Fig. 17b). These results show that the principal stresses are changed as 12.34%. Table 7 presents the maximum principal stresses (tension and compressive) in each angle and total differences values to evaluate the earthquake incidence angle influence more accurately.
Table 7. The maximum principal stresses in shear walls for each earthquake incidence angle
Earthquake Incidence
Angle
Shear Walls
Tensile Stress (MPa)
Diff. (%) Compressive Stress
(MPa) Diff. (%)
0o 12.71 0.52 12.71 0.52 5o 12.77 0.17 12.77 0.17 10o 12.75 0.62 12.75 0.62 15o 12.83 0.41 12.83 0.41 20o 12.88 1.44 12.88 1.44 25o 12.69 1.67 12.69 1.67 30o 12.48 2.46 12.48 2.46 35o 12.18 3.29 12.18 3.29 40o 11.78 4.16 11.78 4.16 45o 11.29 2.21 11.29 2.21 50o 11.54 3.46 11.54 3.46 55o 11.93 2.59 11.93 2.59 60o 12.24 1.76 12.24 1.76 65o 12.46 0.97 12.46 0.97 70o 12.58 0.20 12.58 0.20 75o 12.61 0.56 12.61 0.56 80o 12.53 0.02 12.53 0.02 85o 12.54 0.57 12.54 0.57 90o 12.47 ---- 12.47 ----
Max. Diff. (%) 12.34 Max. Diff. (%) 12.34
Earthquake Incidence Angle Influence on Seismic … / Sigma J Eng & Nat Sci 35 (4), 609-631, 2017

628
Figure 17. The maximum compressive and tensile principal stresses contours for shear walls
6. CONCLUSION
This paper presents an investigation about the earthquake incidence angle influence on the seismic performance of buildings. The five-story reinforced concrete building with moment resisting frame and square plan has been selected and analyzed using finite element methods. The building is subjected to 1992 Erzincan earthquake ground accelerations in nineteen directions whose values ranges between 0 to 90 degrees, with an increment of 5 degrees.
The first three natural frequencies are attained in the range of 6-12Hz. The first and second mode shapes are translation mode in x and y direction, the third corresponding mode shape is torsional mode in x-y plane.
The displacements increase by height of the building for all analyses. The maximum and minimum top displacements are obtained in X direction as 6.8mm and 4.4mm for 90o and 0o. Also, the maximum and minimum top displacements are obtained in Y direction as 7.0mm and 3.9mm for 0o and 80o.
It can be said that the displacements are changed considerably with the different earthquake incidence angle. The maximum differences are calculated as 54.54% and 37.14% for X and Y directions.
The maximum drifts in X direction are obtained as 0.00053 at 70o.75o.80o.85o. 90o and the minimum drifts are obtained as 0.00037 at 0o and 5o. In addition, the maximum drifts in Y direction are obtained as 0.00057 at 0o.5o.10o.15o and the minimum drifts are obtained as 0.0003 at 70o.
These values are well below the maximum allowable code limits as 0.02. The axial forces have a decreasing trend by height of the building for all analyses.
A.C. Altunışık, E. Kalkan / Sigma J Eng & Nat Sci 35 (4), 609-631, 2017

629
The maximum and minimum values are attained at the base point for S1 column (side column) as 96.55kN and 53.87kN at 0o and 80o. In addition, these values are attained at the same point for S2 column (interval column) as 65.55kN and 38.21kN at 0o and 80o.
These results show that the axial forces are changed significantly as 44.21% and 41.71% for S1 and S2 columns.
S1 and S2 columns have 25x60cm section area and 1875kN load carrying capacity. It can be seen that these values are well below the maximum capacity.
The bending moments have a decreasing trend by height of the building for all analyses. The maximum and minimum values are attained at the base point for S1 column (side
column) as 68.31kNm and 38.21kNm at 0o and 80o. In addition, these values are attained at the same point for S2 column (interval column) as 99.57kNm and 55.87kNm at 0o and 80o.
These results show that the bending moments are changed significantly as 44.06% and 43.89% for S1 and S2 columns.
The maximum and minimum values are attained for B1 beam (side beam) as 34.31kNm and 24.70kNm at 30o and 75o. These values are attained for B2 beam (interval beam) as 40.96kNm and 29.03kNm at 80o and 0o.
These results show that the beam response are changed significantly as 28.01% and 41.10% for B1 and B2 beams, respectively.
The maximum and minimum tensile stresses are attained at the corner of shear walls as 12.88MPa and 11.29MPa at 20o and 45o. In addition, these values are attained at the same point for compressive stresses as 12.88MPa and 11.29MPa at 20o and 45o.
These results show that the principal stresses are changed as 12.34%.
At the end of the study, it is concluded that reinforced concrete buildings have shown considerable increase in displacements and internal forces when the earthquake ground motion acceleration is subjected at various incidence angles.
There is no unique specific angle of incidence for each building which increases the value of internal forces of all structural members together; each member gets its maximum value of internal forces by a specific angle of incidence. REFERENCES [1] Atak, B., Avşar, Ö. and Yakut, A. (2014), “Directional effect of the strong ground motion
on the seismic behavior of skewed bridges”, Proceedings of the 9th International Conference on Structural Dynamics, Porto Portugal.
[2] Athanatopoulou A.M. (2005), “Critical orientation of tree correlated seismic”, Engineering Structures, 27, 301-312.
[3] Bayraktar, A., Altunişik, A.C., Türker, T., Karadeniz, H., Erdoğdu, Ş., Angın, Z. and Özşahin, T.Ş. (2015), Structural performance evaluation of 90 rc buildings collapsed during october 23 and november 9, 2011 Van, Turkey, earthquakes”, Journal of Performance of Constructed Facilities, 29(6), 1-19.
[4] Cronin, K.J. (2007), “Response sensitivity of highway bridges to random multi-component earthquake excitation”, Master Thesis, University of Central Florida, Orlando, USA.
[5] Eurocode, (2004), “EN 1998-1-Eurocode 8: Design of Structures for Earthquake Resistance-Part 1: General Rules, Seismic Actions and Rules for Buildings”, [Authority: The European Union Per Regulation 305/2011. Directive 98/34/EC. Directive 2004/18/EC]
[6] FEMA, Building Seismic Safety Council for the Federal Emergency Management Agency (2000), “FEMA368-NEHRP Recommended Provisions for Seismic Regulations for New Buildings and Other Structures”, Washington. D.C., Building Seismic Safety Council.
Earthquake Incidence Angle Influence on Seismic … / Sigma J Eng & Nat Sci 35 (4), 609-631, 2017

630
[7] Fontara, I.K.M., Kostinakis, K.G., Manoukas, G.E. and Athanatopoulou, A.M. (2015). “Parameters affecting the seismic response of buildings under bi-directional excitation”, Structural Engineering and Mechanics, 53(5), 957-979.
[8] Fujita, k. and Takewaki, I. (2009), ‘‘Property of critical excitation for moment-resisting frames subjected to horizontal and vertical simultaneous ground motion’’, Journal of Zhejiang University Science, 10(11), 1561-1572
[9] Fujita, k. and Takewaki, I. (2010), ‘‘Critical correlation of bi-directional horizontal ground motions’’, Engineering Structure, 32(1), 261-272
[10] Gao, X.A., Zhou, X.Y. and Wang, L. (2004), “Multi-component seismic analysis for irregular structures”, 13th World Conference on Earthquake Engineering Vancouver, B.C., Canada, 1156, 1-6
[11] Gonzalez, P. (1992), ‘‘Considering earthquake direction on seismic analysis’’, Earthquake Engineering, Tenth World Conference 1992 Balkema, Rotterdam. ISNB 9054100605
[12] Kanya, S. and Rao, C.M. (2015), “Effect of Earthquake Incidence Angle on Seismic Performance of RC Buildings”, International Journal of Research in Engineering and Technology, 4(13), 156-161.
[13] Kostinakis, K.G. Athanatopoulou, A.M. and Avramidis, I.E. (2013). “Evaluation of inelastic response of 3D single-story R/C frames under bi-directional excitation using different orientation schemes”, Bulletin of Eartquake Engineering, 11,637-661.
[14] Kostinakis, K.G. and Athanatopoulou, A.M. (2015), ‘‘Evaluation of scalar structure-specific ground motion intensity measures for seismic response prediction of earthquake resistant 3D buildings’’, Earthquakes and Structures, 9(5), 1091-1114.
[15] Kumar, N.K. and Gajjar, R.K. (2013). “Non-linear response of two-way asymmetric multistorey building under biaxial excitation”, International J. Eng. Tech., 5(2), 1162-1168.
[16] Lagaros, N.D. (2010), “The impact of the earthquake incident angle on the seismic loss estimation”, Engineering Structures, 32, 1577-1589.
[17] Liang, Z. and Lee, G.C. (2003), “Principal axes of m-dof structures part ii: dynamic loading”, Earthquake Engineering and Engineering Vibration, 2(1), 39-50.
[18] Lopez, O.A. and Torres, R. (1997), “The critical angle of seismic incidence and the maximum structural response”, Earthquake Engineering and Structural Dynamics, 26, 881-894.
[19] Lucchini, A., Monti, G. and Kunnath, S. (2011). “Nonlinear response of two-way asymmetric single-story building under biaxial excitation”, Journal of Structural Engineering, ASCE, 137(1), 34-40.
[20] Magliulo, G. and Maddaloni, G. (2014), “ Influence of earthquake direction on the seismic response of irregular plan RC frame buildings”, Earthquake Engineering and Engineering Vibration, 13, 243-256.
[21] Mohraz, B. and Tiv, M. (1994), “Orientation of earthquake ground motion in computing response of structures”, Seismic Engineering, Pressure Vessels and Piping Conference, Minneapolis, USA, 195-202.
[22] Newton, B. (2014), “Understanding directionality concepts in seismic analysis”, Memo to Designers, 20-17.
[23] Nguyen, V.T. and Kim, D. (2013). “Influence of incident angles of earthquakes on inelastic responses of asymmetric-plan structures”, Structural Engineering and Mechanics, 45(3), 373-389.
[24] Ni, Y., Chen, J., Teng, H. and Jiang, H. (2015), “Influence of earthquake input angle on seismic response of curved girder bridge”, Journal of Traffic and Transportation Engineering, 2(4), 233-241.
A.C. Altunışık, E. Kalkan / Sigma J Eng & Nat Sci 35 (4), 609-631, 2017

631
[25] PEER (2016), “Pacific Earthquake Engineering Research Centre,” http://peer.berkeley.edu/smcat/data.
[26] Polycarpou, P.C., Papaloizou, L., Komodromos, P. and Charmpis, D.C. (2015), “Effect of the seismic excitation angle on the dynamic response of adjacent buildings during pounding”, Earthquakes and Structures, 8(5), 1127-1146.
[27] Quadri, S.A. and Madhuri, M.N. (2014), “Investigation of the critical direction of seismic force for the analysis of rcc frames”, International Journal of Civil Engineering and Technology, 5(6), 10-15.
[28] Rigato, A.B. and Medina, R.A. (2007), “Influence of angle of incidence on seismic demands for inelastic single-storey structures subjected to bi-directional ground motions”, Engineering Structures, 29, 2593-2601.
[29] Safak, E. and Bendimerad, M.F. (1988), “Peak response of 2-DOF uncoupled oscillator under two-direction base motion”, Earthquake Engineering and Structural Dynamics, 16, 1061-72.
[30] SAP2000 (2015), “Integrated Finite Element Analysis and Design of Structures,” Computers and Structures Inc, Berkeley, California, USA.
[31] Sevim, B. (2013), “Assessment of 3D earthquake response of the Arhavi Highway Tunnel considering soil-structure interaction”, Computers and Concrete, 11(1) 51-61
[32] Song, B., Pan, J.S. and Liu, Q. (2008), “The study on crıtıcal angle to the seısmıc response of curved brıdges based on pushover method”, The 14th World Conference on Earthquake Engineering October, 12-17,China.
[33] TERDC, Turkish Earthquake Resistant Design Code (2007), “Specifications for Structures to be Built in Disaster Areas,” Ministry of Public Works and Settlement. General Directorate of Disaster Affairs. Earthquake Research Department. Ankara. Turkey. http://www.deprem.gov.tr
[34] Torbol, M. and Shinozuka, M. (2012), “Effect of the angle of seismic incidence on the fragility curves of bridges”, Earthquake Engineering and Structural Dynamics, 41, 2111-2124.
[35] Tun, M. and Htun, Z.M. (2014), “Comparison of the effect of irregular high-rise steel building based on different seismic excitation angles”, International Journal of Scientific Engineering and Technology Research, 3(10), 2252-2256.
[36] Van, T.N. and Kim, D. (2013), ‘‘Influence of incident angles of earthquakes on inelastic responses of asymmetric-plan structures”, Structural Engineering and Mechanics, 45(3), 373-389.
Earthquake Incidence Angle Influence on Seismic … / Sigma J Eng & Nat Sci 35 (4), 609-631, 2017