incidence angle influence on the quality of terrestrial laser
TRANSCRIPT
INCIDENCE ANGLE INFLUENCE ON THE QUALITY OF TERRESTRIAL LASERSCANNING POINTS
Sylvie Soudarissanane, Roderik Lindenbergh, Massimo Menenti and Peter Teunissen
Delft Institute of Earth Observation and Space Systems(DEOS)Delft University of Technology
Kluyverweg 1, 2629 HS Delft, The Netherlands(S.S.Soudarissanane,R.C.Lindenbergh,M.Menenti,P.J.G.Teunissen)@tudelft.nl
http://www.deos.tudelft.nl/
Commission WG V/3
KEY WORDS: laser scanning, incidence angle, individual point quality, measurement setup
ABSTRACT:
A terrestrial laser scanner measures the distance to an object with a precision in the order of millimeters. The quality of each singlepoint in a point cloud affects post-processing applications, such as deformation analysis or 3D modeling. The quality of a scan pointis influenced by four major factors: instrument calibration, atmospheric conditions, object properties and scan geometry. In this paper,the latter factor is investigated focusing on the influence of incidence angle, i.e. the angle between incoming laser beam and surfacenormal, on the precision of a scan point. It is shown that by considering the influence of incidence angle on the signal to noise ratio,the increase in measurement noise with increasing incidence angle can be successfully modeled. The implications of this model aredemonstrated on two practical experiments. In the first experiment, a reference plate is scanned at a fixed distance but under differentscan angles. The analysis shows that also in a practical setting the influence of incidence angle could be successfully isolated, allowingthe conclusion that above 60◦ the incidence angle dominates the scan point precision. In the second experiment it is demonstratedthat for a typical point cloud of a room, 20% of the measurement noise is due to incidence angle. The results of this research make itfeasible to optimize the scan locations in a measurement setup in the sense that noise due to incidence angle is minimized.
1 INTRODUCTION
1.1 Surveying principles of TLS
The Terrestrial Laser Scanner (TLS) provides a 3D visualizationof a scene by measuring distances to object surfaces in a spher-ical coordinate system. It records two angles (horizontal angleθ, vertical angle φ) of laser beams transmitted with regular ver-tical and horizontal increment, and a distance ρ of the measuredpoint on the object surface, regarding the TLS as the center of thecoordinate system.
1.2 Motivation
The TLS is a well known device already used by over two decadesin a wide range of engineering applications. It is lately being in-creasingly employed for its fast and easy 3D capture of the sur-roundings, with millimeters accuracy. Unlike the Total Stationmeasurements, consisting of few points, the TLS enables mil-lions of surface point measurements for a comparable amount oftime. However, the measurements obtained with the TLS are lessaccurate and more noisy than the Total Station ones.
The quality of the point cloud, as defined in this paper, expressesthe precision of the distance measurements to an object’s surface.When laser scanning, four major factors influence the quality ofa point cloud.
Instrument calibration. It includes the scanner mechanismprecision, mirror center offset, rotation mechanism aberrations(Zhuang and Roth, 1995), the beam width divergence and angularresolution (Lichti and Jamtsho, 2006) and the detection processof the reflected signal (Pesci and Teza, 2008).
Atmospheric conditions. This factor incorporates error be-havior related to atmospheric turbulence, such as humidity andscanning conditions, e.g. indoors, outdoors. (Borah and Voelz,
2007) and ambient light (Voisin et al., 2007).Object properties. This influencing factor includes the sur-
face property (Boehler et al., 2003), i.e. the material (Pfeifer etal., 2008, Hoefle and Pfeifer, 2007, Kaasalainen et al., 2005,Bucksch et al., 2007) and the shape (Leader, 1979, Kersten etal., 2005) dependent anisotropy.
Scanning geometry. The last factor is the scanning geometry(Bae et al., 2005, Schaer et al., 2007, Salo et al., 2008), i.e. theplacement of the TLS in a scene has an influence on the localincidence angle, the local range and the local point density ofthe scan points. (Lindenbergh et al., 2005, Kremen et al., 2006,Lichti, 2007, Mechelke et al., 2007, Soudarissanane et al., 2007).Additionally, automatic post-processing often realized during thecapture, e.g.removing points according to a criterion, may also affect the qual-ity of the overall point cloud.
This paper explores the effects of the scanning geometry on thepoint cloud quality, focusing on the incidence angle of the laserbeam with respect to a surface. The quality of the point cloud,as specified in this paper, is derived based on the individual pointprecision per scan. The incidence angle is defined as the anglebetween the laser beam vector and the normal vector of the sur-face. The incidence angle affects on the individual point signal tonoise ratio (SNR). Although already identified in previous TLSstudies (Kremen et al., 2006, Kaasalainen et al., 2005), this ef-fect has not yet been modeled for TLS. The received signal levelof the measurements decreases with increasing incidence angles.The received signal level influences the precision of the distancedetermination. In this paper, we quantify the incidence angle in-fluence on the individual point error of a point cloud obtained byTLSs.
This work presents an original approach to model the incidenceangle contribution to the total error budget of a TLS. The fore-
knowledge of the local surface geometry enables the assessmentof the influence of an incidence angle on the quality of the indi-vidual point measurements in a point cloud. The application ofthe developed model is presented on two practical experiments.
1.3 Paper Outline
This paper is structured in four sections. Theory on the geo-metrical components and error models are presented in the nextsection. In Sec.3 the incidence angle model is validated in anexperiment in which a plate is scanned at different angles. Theapplication of the new incidence angle model on quantifying theinfluence of incidence angle on the measurement noise of a typ-ical point cloud is shown in Sec.4. Conclusion and discussionsare made in Sec.5.
2 GEOMETRICAL COMPONENTS AND NOISEMODEL
The output of a scan is typically a point cloud of n observations[xi, yi, zi]i=1···n consisting of 3-D positions of each point in aCartesian coordinate system with the laser scanner for center, aswell as an uncalibrated intensity value of the reflected light.
2.1 Relation between Cartesian and spherical coordinatesystems
The scanner mechanism can be considered to operate in a spheri-cal coordinate system, with regular horizontal and vertical anglesincrements. The TLS detects the returned signals of reflectionson a surface and records the two directional angles (horizontalangle θ, vertical angle φ) and measures the range ρ to the objectsurface, regarding the TLS as the center of the coordinate system.The Cartesian coordinates of the point cloud are computed fromthe measured spherical coordinates as described in Eq.1.xiyi
zi
i=1···n
=
ρi cosφi cos θiρi cosφi sin θiρi sinφi
i=1···n
(1)
Reversely, the spherical coordinates of the point cloud are ob-tained from the Cartesian coordinates as described in Eq.2.
ρiθiφi
i=1···n
=
√x2i + y2
i + z2i
tan−1(yixi
)tan−1
(zi√x2i+y
2i
)i=1···n
(2)
2.2 Definition of incidence angle
The scanning geometry strongly influences the individual scanpoint precision. The position of the TLS determines the incidenceangle and the distance of a surface with respect to the TLS. Letthe vector P = [xi, yi, zi]i=1···n be defined as the laser beamvector from the laser scanner to the surface in the direction ofthe transmitted laser beam. The incidence angle α, as depicted inFig.1(a) is defined as the angle between the laser beam vector Pand the normal vector N of the considered surface, see Eq.3.
α = cos−1
(P ·N|PN|
)(3)
Note that the TLS measures reflected beams at backscatter, i.e. themeasured reflected laser light path L as depicted in Fig.1 retracesthe path of the transmitted laser beam P. The reflection of the
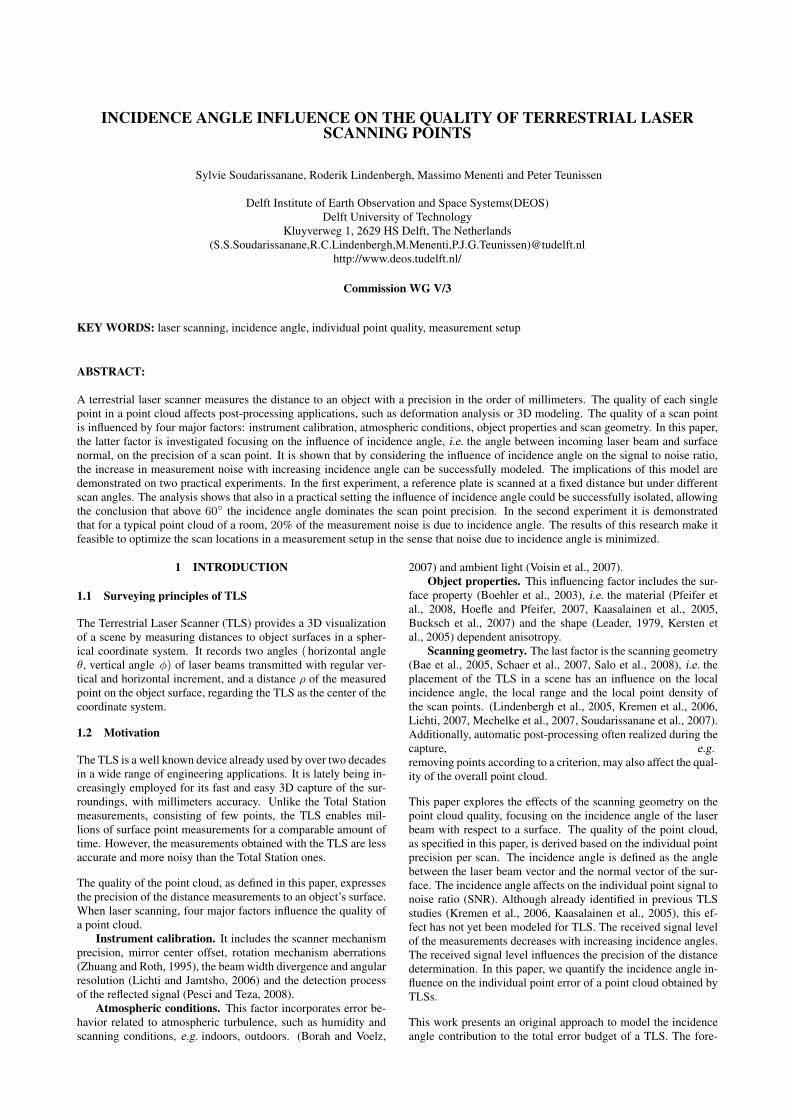
light on a surface depends on the object properties, i.e. the mate-rial and the shape dependent anisotropy, and the scanning geom-etry. The bidirectional reflectance distribution function (BRDF)describes the reflection of the light at a surface, depending on theradiance and irradiance properties, the incidence angle α and thenormal vector N of the surface (Rees, 2001, Nicodemus, 1965).
Figure 1: Schematic illustration of the reflection geometry. (a)Incidence angle of the transmitted laser beam with respect to asurface. (b) Perpendicular and incident laser beams with respectto a planar surface. The footprint shape and the reflected signalare plotted for the perpendicular and one slanted situation.
2.3 Incidence angle contribution and measurement noise
A model is developed to quantify the anticipated decrease of thesignal level with respect to the increase of the incidence angle α.The horizontal angle θ, the vertical angle φ and the range ρ arereconstructed from the Cartesian coordinates point cloud P usingEq.2 to reproduce the original TLS measurements of the reflectedlight, which are spherical.
Signal deterioration due to incidence angle. If it is assumedthat the surface hit by the laser pulse is behaving as a Lambertianscatterer, the radar range equation, (Jelalian, 1992, Rees, 2001)characterizes the power Pr received back by the scanner as Eq.4.
Pr = κPt cosα (4)
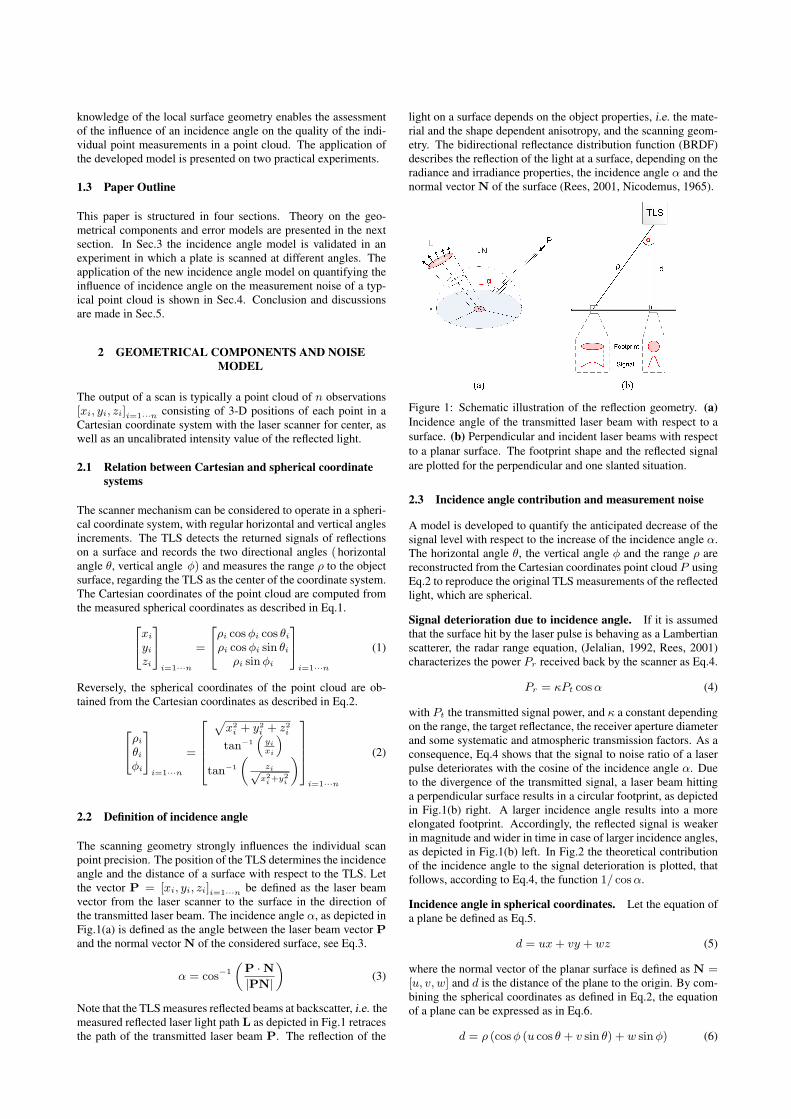
with Pt the transmitted signal power, and κ a constant dependingon the range, the target reflectance, the receiver aperture diameterand some systematic and atmospheric transmission factors. As aconsequence, Eq.4 shows that the signal to noise ratio of a laserpulse deteriorates with the cosine of the incidence angle α. Dueto the divergence of the transmitted signal, a laser beam hittinga perpendicular surface results in a circular footprint, as depictedin Fig.1(b) right. A larger incidence angle results into a moreelongated footprint. Accordingly, the reflected signal is weakerin magnitude and wider in time in case of larger incidence angles,as depicted in Fig.1(b) left. In Fig.2 the theoretical contributionof the incidence angle to the signal deterioration is plotted, thatfollows, according to Eq.4, the function 1/ cosα.
Incidence angle in spherical coordinates. Let the equation ofa plane be defined as Eq.5.
d = ux+ vy + wz (5)
where the normal vector of the planar surface is defined as N =[u, v, w] and d is the distance of the plane to the origin. By com-bining the spherical coordinates as defined in Eq.2, the equationof a plane can be expressed as in Eq.6.
d = ρ (cosφ (u cos θ + v sin θ) + w sinφ) (6)
Figure 2: Theoretical incidence angle contribution to the signaldeterioration.
Although each scan point belonging to a planar surface in generalhas different range measurement ρ, the distance d of the planarsurface to the origin remains constant for each measurement. Asdepicted in Fig.1(b), the distance d of the plane to the origin canalso be expressed as a function of the incidence angle α and therange measurement ρ following Eq.7.
d = ρ cosα (7)
The contribution of the incidence angle on the range measure-ment can be expressed as the coefficient cα of values rangingfrom 0 to 1, as defined in Eq.8.
cα = cosα
= cosφ (u cos θ + v sin θ) + w sinφ(8)
The model of the incidence angle contribution cα expresses theeffect of incidence angle on the range measurement based only onthe point cloud angular information (θ, φ) and a local surface nor-mal vector N. This new incidence angle factor approach enablesan easier incorporation of uncertainties using error propagationtechniques (Teunissen, 1988). Furthermore, the foreknowledgeof the normal vector allows the computation of an incidence an-gle per scan point. This model is applicable to surfaces of anyshape, on the condition that the normal vector per scan point isknown.
Practical noise assessment. Each TLS measurement is subjectto noise, which can be decomposed in a horizontal angle displace-ment δθ , a vertical angle displacement δφ and a range displace-ment eρ. Error propagation techniques are used to quantify toeach measurement an a priori increase of measurement noise dueto incidence angle. In this paper, the angular displacements δθand δφ are considered to be negligible. Moreover, the uncertaintyinvestigated in this paper deals only with the noise levels. Biasesare not studied.
Let PM = P −M be the zero empirical mean data of the pointcloud, centered around its center of gravity M = [mx,my,mz].Plane parameters are estimated using Least Squares on the entirepoint cloud consisting of n points in the considered scan. Theplane fitting algorithm used in this paper minimizes the squareddistances of the points to the estimated plane, such that the meanof the residuals is equal to zero. The residuals eρ of the plane es-timation are obtained by computing the distances from the mean-deviated points PM to the plane defined by the normal vector N,as explained in Eq.9.
eρ = PMNT (9)
This noise level eρ represents the deviation of the range mea-surement of each individual point from the estimated plane. Thedeviation magnitude depends on the influencing factors cited inSec.1. The influence of the incidence angle of a surface with re-spect to the laser beam on the noise level eρ is removed in Eq.10
using the incidence angle coefficient cα described in Eq.8. Theremaining noise level ed gives an insight in influences of otherfactors, e.g. the range placement, the object properties, etc.
ed = eρcα 0 < cα < 1 (10)
The noise level eρ and the remaining noise level ed of the rangemeasurement are computed for each individual point in the pointcloud. To appreciate the global influence of the incidence angleon the point cloud quality, a standard error value σ is computedfor each planar surface estimated with n scan points. The stan-dard error σ is defined in this paper as the standard deviation ofthe residuals. The standard error σρ of the noise level eρ andthe standard error σd of the remaining noise level ed are bothcomputed following Eq.11.
σ =
√eeT
n(11)
The standard error takes into account the number of points n perconsidered area. It estimates the standard deviation of the samplemean based on the population mean of n points. The standarderror is a good describer of the area quality, regardless of thepoint density.
3 REFERENCE PLATE MEASUREMENTS
Two different sets of experiments were conducted to validate thedeveloped model. A first set of experiments is performed to ex-amine the incidence angle contribution at a fixed distance to theTLS. In the second set of experiments, the influence of the dis-tance to an object is incorporated as well. The influence of inci-dence angle and distance on the scan quality is analyzed throughexperiments conducted under near laboratory conditions. Theperformed experiments enable to decompose the scanning geom-etry influence.
The influence of the incidence angle on the scan quality is in-vestigated using the TLS LS880-HE80 from FARO. The set ofexperiments are performed on a 1 × 1 m white coated plywoodboard. The board used in this experiment is not presenting a per-fect isotropic reflectance, but it is considered to be almost Lam-bertian. This board is mounted on a tripod via a screw clampmechanism provided with a goniometer that enables the mecha-nism to rotate horizontally with a precision of 2◦.
3.1 Experiment setup 1: Influence of incidence angle at afixed distance to the TLS.
The first experiment investigates the incidence angle contributionon the range measurement. The experimental board is placed ata distance of 20 m from the TLS. The board is rotated from 0◦
to 80◦ in steps of 10◦. At each step, the board is scanned, asdepicted in Fig.3. The following analysis is based on 9 scans,containing between 38500 and 4900 points per scan dependingon the incidence of the surface with respect to the laser beam.
First the planar parameters N are estimated for each scan usingthe Least Squares method mentioned in Sec.2. The estimationuses all the points n of the considered scan. A noise level eρ isderived for each scan, following Eq.9. The incidence angle perpoint is computed based on the estimated planar parameters Nand the laser beam vector P, as described in Eq.3. Fig.4 showsthe standard error σρ with respect to the incidence angle for eachscan, derived from the noise level eρ following Eq.11. The in-fluence of incidence angle is clearly visible and follows the the-oretical incidence angle contribution model described in Sec.2.

Figure 3: Top view of the measurement setup 1, with schematicdepiction of horizontal rotations of the plate using the goniome-ter. A representative laser beam is depicted in red.
Surface at 20 m
Figure 4: Measurement precision with respect to the incidenceangle of the surface, given a fixed scanner position. The standardtotal error σρ is plotted in blue. In green is plotted the theoreticalnoise induced by the incidence angle. The remaining standarderror σd, after removal of the incidence angle effect followingEq.10, is plotted in red.
A larger standard error is observed for larger incidence angle.Subsequently, the noise level induced by the incidence angle αis removed from the noise level eρ, shown as the remaining stan-dard error σd in Fig.4. It is clearly visible that the remaining erroris almost independent of incidence angles. The remaining errorshows a slight increase at 10◦, followed by a small continuous de-crease of errors until 70◦ and a consecutive increase towards themeasurements of the last scan. This characteristic trend could bepartially explained by the scattering behavior of the surface withrespect to incoming light, described by the BRDF of the surface,which is not perfectly Lambertian. (Lichti, 2007) also observessuch a characteristic trend and suggests to proceed to an a-priorithreshold of a maximum incidence angle of 65◦ for removing notreliable measurements.
At larger incidence angle, the increase of errors in the remainingstandard errors can be partially explained by the footprint elonga-tions that deteriorate the signal detection and the range determi-nation. By removing the influence of the incidence angle, otherinfluencing factors are put forward in the error budget of the TLS,like the surface properties and the environmental conditions.
3.2 Experiment setup 2: Influence of incidence angle on sev-eral distances to the TLS.
This experiment investigates the simultaneous influence of dis-tances and incidence angle on the point cloud quality. The exper-imental board is placed at distances ranging from 10 m to 50 min steps of 10 m and one additional low distance placement at 5m from the TLS. At each distance placement, the experiment de-scribed previously in Sec.3.1 is conducted. As depicted in Fig.5,
the board is scanned at each distance placement and for each rota-tion. This experiment consists of 54 scans captured successivelyat around the same time. However, only 45 scans are captured ina good enough quality. For higher ranges and higher incidenceangles, the standard error obtained was higher than 5 mm and aretherefore not presented in the following study. At low distances,the point cloud contains between 4500 and 150500 points de-pending on the incidence angle. At larger distance, based on theincidence angle, the point cloud can contain between 3100 and5500 points.
Figure 5: Top view of the measurement setup 2, with schematicdepiction of distance placement of the plate with respect to theTLS.
The measurement precision is derived for each scan in the mannerdescribed in Sec.3.1. The planar features are estimated using allthe points in a scan. Fig.6 shows the measurement precision withrespect to the range placement of the surface. As in Sec.3.1, it isclearly visible that for larger incidence angles, larger total noiselevels are obtained. Moreover, it is shown that with increasingrange, the measured total noise level increases.
70◦
60◦
50◦
40◦
30◦
20◦
10◦
0◦
Figure 6: Measurement precision with respect to the range place-ment of the surface. The standard total error σρ, i.e. the RMSE ofthe residual to a plane fitting, is plotted in blue for each incidenceangle experiment at each range placement. Each rotation exper-iment is labeled with the incidence angle. The remaining noise,after removal of the incidence angle effect per point, is plotted inred for each incidence angle experiment at each range placement.
The incidence angle effects are removed from the noise level us-ing the developed model described in Sec.2. The remaining noiseerrors are almost independent of incidence angle and follow thesame increasing trend for increasing distance of the board to thescanner. This effect can be due to the footprint size that increasesfor larger distances. The received signal is weaker and thereforethe Signal to Noise Ratio is worse. Note that the errors obtained

(a) (b)
Figure 7: Schematic representation of the experimental room: (a) 3D representation of the two walls and the floor. (b) 2D net-viewrepresentation of the room.
(a)
Incidenceangle
contribution%
(b)
Noise
levelpersegm
ent(m)
0.0046
0.0028
0.0030 0.0025
(c)
Rem
ainingnoise
levelpersegm
ent(m)
0.0032
0.0023
0.0028 0.0019
Figure 8: Net view of the point cloud of the room: (a) Incidence angle contribution, (b) Noise level eρ, i.e. the residual to a planefitting. Standard error value of the four main segments is plotted, (c) Remaining noise level ed, i.e. the residual to a plane fitting afterremoval of the incidence angle effect. Standard error value of the four main segments is plotted.
for an orientation of the plate at 0◦ seem to be shifted in compar-ison with the global trend observed for other incidence angle.
Low incidence angles result in very circular footprints on the sur-face. In this case, an optimum signal is returned. It is homoge-neous in time travel and it has a large magnitude. A possible ex-planation for the phenomenon observed for low incidence angleswould be that the detection system might adapt the recording sys-tem to this optimal measurements by rescaling the measurementsbecause it is more likely to saturate the detection system whenthe laser beam hits a surface in a nearly perpendicular way.
4 STANDARD ROOM MEASUREMENT
In this section, the influence of incidence angle is isolated andquantified for a typical point cloud representing a closed andempty room. As the captured point cloud contains more than20 million points, the determination of planar parameters and thecorrection of incidence angle contribution comprises additionalsteps described further in this section.
Two walls and the floor of the room are analyzed in this study.The floor of this room is covered with light colored linoleum and
the walls are painted in white and have very smooth surfaces.The TLS captured a scan from the middle of the room. To havea better and easier visualization of the experimental results, thepoint cloud is represented as a net view, allowing a real 2.5Dvisualization of the scene in such a way that the relative scale ismaintained, as depicted in Fig.7.
In this paper, to determine the incidence angle of a surface, thepoint cloud is first segmented according to coarse planar features(Gorte, 2007). The planar surfaces are extracted using gradientbased images, obtained from the point cloud expressed in spher-ical coordinates. The segmentation method combines the hori-zontal and vertical angle gradient image and the scan parame-ters to determine regions with similar planar parameters N =[u, v, w] and d, which are considered to be part of the same plane,i.e. segment. The segmentation results in four main segments:the floor and three wall pieces. One of the walls is divided intotwo different segments. The position of the TLS is recognizableon the floor segment because the TLS cannot scan underneath itsposition, see Fig.7.
Fig.8(a) depicts the incidence angle contribution per point to theprecision derived from the estimated planar parameters, as de-

scribed in Eq.8. The noise level is computed for each pointsbelonging to a segment using Eq.9. Fig.8(b) represents the netview of the room colored with the noise level per scan point. Theaverage standard error of the room is 0.003225 m. Fig.8(c) rep-resents the net view of the room colored with the remaining noiselevel per scan point, after removal of the incidence angle effects.The average remaining standard error of the room is 0.002550m. By averaging the incidence angle contribution per point, it isdetermined that for this point cloud, approximately 20% of themeasurement noise is caused by non-zero incidence angles. Theaverage of the incidence angle contribution per segment wouldalso take into account the point density information. Recall thatthe point density is also highly correlated to the incidence angle(Lindenbergh et al., 2005).
Due to imperfections in the planarity of the floor and the walls,some pattern still remains in the point cloud noise level isolatingthe incidence angle contribution to the noise level.
5 CONCLUSION AND DISCUSSION
We presented an original approach to model the influence of in-cidence angle on the point cloud quality that enables the incorpo-ration of measurement uncertainties. This method is based on thepoint cloud data. By reconstructing the original spherical pointcloud measurements, the model quantifies the incidence anglecontribution as a function of the point cloud angular informationand estimated planar parameters. This contribution reflects thebehavior of the received signal with respect to incidence angle.A worse Signal to Noise Ratio results in a less precise range de-termination.
The presented approach allows to isolate the contribution of noiseinduced by incidence angle, based only on point cloud data. Noadditional or external measurements are needed to reconstructand correct the influence of incidence angle. The model of theincidence angle effect allowed us to show that for a typical pointcloud, the contribution of incidence angle to the noise budgetequals to approximately 20% per point.
An optimization of the Terrestrial Laser Scanner position in ascene can be achieved using our approach. A first low resolutionscan enables the characterization of the incidence angle contribu-tion from the position of the Terrestrial Laser Scanner. Based onthe computed incidence angles, a better positioning of the Terres-trial Laser Scanner according to the scene can be determined.
Terrestrial Laser Scanner measurements are subject to noise in-duced from different factors. In this paper, we present an ap-proach to identify and correct the noise due to incidence angle.Adequate corrections of other influencing factors, such as the sur-face properties, the distance to the Terrestrial Laser Scanner, theatmospheric conditions and instrument calibration, will providemeasurements of better quality.
REFERENCES
Bae, K., Belton, D. and Lichti, D., 2005. A framework for positionuncertainty of unorganised three-dimensional point clouds from near-monostatic laser scanners using covariance analysis. In: IAPRS (ed.),Proc. in the ISPRS Workshop, Laser Scanning 2005, Vol. WG III/3, III/4,V/3, Enschede, the Netherlands, pp. 7–12.Boehler, W., Bordas, V. and Marbs, A., 2003. Investigating Laser Scanneraccuracy. In: IAPRS (ed.), Proc. in the CIPA 2003 XVIII InternationalSymposium, Vol. XXXIV(5/C15), Institute for Spatial Information andSurveying Technology, Antalya, Turkey, pp. 696–701.Borah, D. K. and Voelz, D. G., 2007. Estimation of Laser beam pointingparameters in the presence of atmospheric turbulence. Journal of AppliedOptics 46(23), pp. 6010–6018.
Bucksch, A., Lindenbergh, R. and van Ree, J., 2007. Error budget ofTerrestrial Laser Scanning: Influence of the intensity remission on thescan quality. In: Proc. in the GeoSiberia - 2007, Novosibirsk, Russia.
Gorte, B., 2007. Planar feature extraction in Terrestrial Laser Scans us-ing gradient based range image segmentation. In: IAPRS (ed.), Proc.in the ISPRS Workshop, Laser Scanning 2007 and SilviLaser 2007, Vol.XXXVI(3/W52), Espoo, Finland, pp. 173–177.
Hoefle, B. and Pfeifer, N., 2007. Correction of Laser Scanning intensitydata: Data and model-driven approaches. International Journal of Pho-togrammetry and Remote Sensing 62(6), pp. 415–433.
Jelalian, 1992. Laser Radar Systems. Artech House.
Kaasalainen, S., Ahokas, E., Hyypp, J. and Suomalainen, J., 2005. Studyof surface brightness from backscattered Laser intensity calibration ofLaser data. IEEE Geoscience and Remote Sensing Letters 2(3), pp. 255–259.
Kersten, T. P., Sternberg, H. and Mechelke, K., 2005. Investigations intothe accuracy behaviour of the Terrestrial Laser Scanning system MENSIGS100. In: Gruen/Kahmen (ed.), Proc. in the Optical 3D MeasurementTechniques, Vol. I, Vienna, Austria, pp. 122–131.
Kremen, T., Koska, B. and Pospsil, J., 2006. Verification of Laser Scan-ning systems quality. In: Proc. in the XXIII FIG Congress, Shaping theChange, Munich, Germany.
Leader, J. C., 1979. Analysis and prediction of Laser scattering fromrough-surface materials. Journal of the Optical Society of America (1917-1983) 69, pp. 610–628.
Lichti, D. D., 2007. Error modelling, calibration and analysis of anAM CW Terrestrial Laser Scanner system. International Journal of Pho-togrammetry and Remote Sensing 61, pp. 307–324.
Lichti, D. D. and Jamtsho, S., 2006. Angular resolution of TerrestrialLaser scanners. The Photogrammetric Record 21, pp. 141–160.
Lindenbergh, R., Pfeifer, N. and Rabbani, T., 2005. Accuracy analysis ofthe Leica HDS3000 and Feasibility of Tunnel Deformation monitoring.In: IAPRS (ed.), Proc. in the ISPRS Workshop, Laser Scanning 2005,Vol. XXXVI(3/W3), Enschede, The Netherlands, pp. 24–29.
Mechelke, K., Kersten, T. P. and Lindstaedt, M., 2007. Comparative in-vestigations into the accuracy behaviour of the new generation of Terres-trial Laser Scanning systems. In: Proc. in the Optical 3-D MeasurementTechniques VIII, Vol. 1, Zurich, Switzerland., pp. 319–327.
Nicodemus, F. E., 1965. Directional reflectance and emissivity of anopaque surface. Journal of Applied Optics 4(7), pp. 767–773.
Pesci, A. and Teza, G., 2008. Terrestrial Laser Scanner and retro-reflective targets: an experiment for anomalous effects investigation.International Journal of Photogrammetry and Remote Sensing 29(19),pp. 5749–5765.
Pfeifer, N., Hofle, B., Briese, C., Rutzinger, M. and Haring, A., 2008.Analysis of the backscattered energy in Terrestrial Laser Scanning data.In: IAPRS (ed.), Proc. in the XXIth ISPRS Congress, Silk Road for In-formation from Imagery, Vol. XXXVII - B5, Beijing, China., p. 1045.
Rees, W. G., 2001. Physical Principles of Remote Sensing. Scott PolarResearch Institute, Cambridge.
Salo, P., Jokinen, O. and Kukko, A., 2008. On the calibration of thedistance measuring component of a Terrestrial Laser Scanner. In: IAPRS(ed.), Proc. in the XXIth ISPRS Congress, Silk Road for Information fromImagery, Vol. XXXVII - B5, Beijing, China., p. 1067.
Schaer, P., Skaloud, J., Landtwing, S. and Legat, K., 2007. Accuracyestimation for Laser point cloud including Scanning geometry. In: Proc.in the Mobile Mapping Symposium, Padova (Italy).
Soudarissanane, S., Van Ree, J., Bucksch, A. and Lindenbergh, R., 2007.Error budget of Terrestrial Laser Scanning: influence of the incidenceangle on the scan quality. In: Proc. in the 3D-NordOst 2007, Berlin,Germany.
Teunissen, P. J. G., 1988. Towards a least-squares framework for adjust-ing and testing of both functional and stochastic model. Technical report,Delft University of Technology. A reprint of original 1988 report is alsoavailable in 2004, No. 26, http://www.lr.tudelft.nl/mgp. Internal researchmemo, Geodetic Computing Centre.
Voisin, S., Foufou, S., Truchetet, F., Page, D. and Abidi, M., 2007. Studyof ambient light influence for three-dimensional scanners based on struc-tured light. Optical Engineering 46(3), pp. 030502–1 030502–3.
Zhuang, H. and Roth, Z. S., 1995. Modeling gimbal axis misalignmentsand mirror center offset in a single-beam Laser tracking measurementsystem. The International Journal of Robotics Research 14(3), pp. 211–224.