reproductions supplied by edrs are the best that can be ... degree programs in utah county and...
TRANSCRIPT

DOCUMENT RESUME
ED 454 898 JC 010 482
AUTHOR Jacobs, Bart R.TITLE North Valley/South Valley Survey--Perceptions of Utah Valley
State College and the Need for a Branch Campus.PUB DATE 2001-06-00NOTE 47p.
PUB TYPE Numerical/Quantitative Data (110) Reports Research(143) Tests/Questionnaires (160)
EDRS PRICE MF01/PCO2 Plus Postage.DESCRIPTORS *Bachelors Degrees; Crowding; Developing Institutions;
*Enrollment Projections; *Enrollment Rate; Higher Education;*Multicampus Colleges; Population Growth; Population Trends;*Space Utilization; Undergraduate Study
IDENTIFIERS *Utah Valley State College
ABSTRACTUtah Valley Community College became Utah Valley State
College (UVSC) in 1993, due to the increasing need for a four-year,degree-granting institution in Utah County. UVSC now offers 21 four-yearprograms, and enrollment has been growing at an average rate of 8% per yearsince 1986. There were 20,946 students enrolled for fall term 2000, and30,000 students are projected for the year 2006. In order to further examinethe educational needs of Utah County and to identify where a satellite campuswould best be located, UVSC conducted a survey. There were 502 respondents,and findings include: (1) 25% of respondents reported that had not recentlyheard or read anything about the college; (2) 19% said that UVSC had goodprograms and classes, and 16% said it was a good school in general; (3) 11%
suggested the college offer more degrees, programs, and classes; (4) 80% of
Utah County residents were in favor of increased funding for UVSC; (5) Utah
County residents in high-income groups with high education levels stronglysupported building a new campus/facilities and were in favor of adding moredegree programs to the curriculum; (6) UVSC must address issues of traffic,parking, raising faculty salaries, and decreasing the numbers of adjunctfaculty in order to increase faculty standards. Appended are the NorthValley/South Valley Survey and 50 statistical tables of responses to eachquestion on the Survey. (Contains 13 references.) (NB)
Reproductions supplied by EDRS are the best that can be madefrom the original document.

North Valley/ South Valley Survey Perceptions of Utah Valley State College and theNeed for a Branch Campus
by Bart R. Jacobs
PERMISSION TO REPRODUCE ANDDISSEMINATE THIS MATERIAL HAS
BEEN GRANTED BY
TO THE EDUCATIONAL RESOURCESINFORMATION CENTER (ERIC)
1
U.S. DEPARTMENT OF EDUCATIONOffice of Educational Research and Improvement
EDUCATIONAL RESOURCES INFORMATIONCENTER (ERIC)
This document has been reproduced aseceived from the person or organization
originating it.
Minor changes have been made toimprove reproduction quality.
Points of view or opinions stated in thisdocument do not necessarily representofficial OERI position or policy.
cJ
., BEST COPY AVAILABLE

North Valley/South Valley Survey Perceptions of Utah ValleyState College and the Need for a Branch Campus
Bart R. Jacobs
Utah Valley State College was founded in 1941 as the Central Utah VocationSchool to serve the vocational training needs of Central Utah, but the actual "birth of theschool as a state institution was March 15,1945." (2000-2001 Fact Book, UVSC, p2).The name changed to Utah Trade Technical Institute in 1953 and was later renamed toUtah Technical College in 1967. In 1971 the College was approved for the Associate ofScience Degree and later became Utah Valley Community College in 1987.
College students in the 1970s and 80s, mostly from Utah County, would use theCollege as a stepping stone, earning general education classes, often transferring toBrigham Young University, located just a few miles away, to finish their undergraduatedegree. In the late 1980s, Brigham Young University (owned by the Church of JesusChrist of Latter Day Saints) began restricting applications of local students so they couldoffer their religion affiliated higher education experience to more out of state students.This action by BYU left baccalaureate degree seeking students living in Utah County, thesecond largest county in Utah, the option of either leaving the county to attend anotherfour-year institution or commuting over 40 miles to the University of Utah.
UVCC President Kerry D. Romesburg recognized the demand for alternate four-year degree programs in Utah County and initiated a program establishing a UniversityCenter to bring baccalaureate programs from Utah State University and Weber StateUniversity. The courses were taught at UVCC, but the degrees were awarded from theoffering institutions. The University Center was a cumbersome, stopgap solution andsoon after its inception President Romesburg obtained provisional accreditation to offer alimited number of high demand four-year degrees in 1993. The name of the college wasthen changed to Utah Valley State College, and the mission statement was expanded toinclude four-year programs.
Since then, full accreditation has been awarded, and UVSC now offers 21 four-year programs, most recently adding History, Secondary Education, Biology, EarthScience, English, and Nursing, in March and April of 2001. Even with this growing listof available degrees, the demand for new four-year programs is increasing. An immediatelist of proposed programs includes the following four-year degrees: Business andMarketing Education, Health Education, Chemistry/ Physics Education, MathematicsEducation, Multimedia Communication Technology, Chemistry, Mathematics, andPhysics.
Student body growth at UVSC has averaged over 8% per year since 1986, (2000-20011\-) Fact Book, UVSC, p53) becoming the fastest growing higher education institutionb in Utah. Even with constant building construction projects, renovations, and newfacilities, the student body growth has out-paced campus expectations, and more space is
0 needed to accommodate the increasing student headcount and meet the growing needs ofUtah County. Courses have been offered at off-campus sights (i.e. University Mall,Heber, Spanish Fork, and American Fork) in an effort to alleviate congestion on campus
CZ and better meet the evolving needs of the community, but demand is exceeding availablespace.

Because of the unexpected student growth always exceeding projections, and theincreasing number of programs and degrees offered at UVSC, space on campus hasremained an ongoing issue. Other college and university campuses experiencing asimilar paradigm, have built branch campuses to accommodate growth and special needsof the surrounding community.
Literature Review
This literature review relates growth patterns to reasons other institutions haveestablished branch campuses to meet their needs. It also gives examples of aspects to beconsidered when undertaking such a project.
Headcount at Utah Valley State College for Fall term 2000 was 20,946, with aprojected headcount of over 30,000 by 2006 (2000-2001 Fact Book, UVSC, pp50-54).Actual headcount has continually surpassed the conservative projections. When theOrem campus was built, it was intended to accommodate approximately 16,000[students] (Sorensen, W. W., 1985, p61). Four-year programs, unexpected student bodygrowth, and associated congestion and traffic problems have forced Utah Valley StateCollege to look for alternative solutions to accommodate the demand for technical,vocational, and higher education programs in Utah County.
Utah County population growth has exacerbated the enrollment growth at UVSC.It is one thing when a small county shows double or triple digit growth rates in a 10-yearperiod, but Utah County was the second largest county in Utah in 1990 experiencing39.8% percent growth (Utah State Data Center, 2001). Ocean County College (OC) inNew Jersey used a similar growth trend in a portion of their county as a main factor whenjustifying their need for a branch campus claiming, "[the] population of southern OC hadincreased by an estimated 19.2 percent between 1980 and 1985" (Parrish, Richard, M.and Harris, David W., 1986, p4).
Similar growth patterns were experienced by Arizona State University when theywere proposing a new branch campus. "Even though considerable variance is used, fromthe [stated] figures it is apparent that enrollment pressure on Arizona State Universitywill become intolerable unless additional facilities for higher education are established"(Arizona State University Branch Campus Study Committee, 1977, p7). Space is agenuine concern for colleges and universities, for many different reasons. "Guidelinesand standards to be useful must embody a flexible approach to determining space needsthat meet the different missions of individual institutions" (Fink, Ira, 1999, p12).
Branch campuses are not a new concept, but it is important to note that they filldifferent needs for different geographical locations, colleges, and universities. Whencomparing branch campuses to the parent institution their "mission, role, and scope...[served] to identify issues of greater differences than to identify commonalities."(Hermanson, Dean R., 1993, p25). Branch campuses must also blend in with, andcompliment, the area where they are established. They can be contributing facets of acommunity and in some cases have the requirement "to provide a wide variety ofcultural, social, and educational service to the community at large within their serviceareas" (Landini, Albert J., 1975, p4). Relevant factors such as student population,educational programs, and community relationships will relate specifically to thefunctions of the branch campus. "Since no two institutions are alike, the overall
2
A
requirements for a specific site will vary according to the specific need" (ColoradoCommission on Higher Education, Denver, 1974, pA-1).
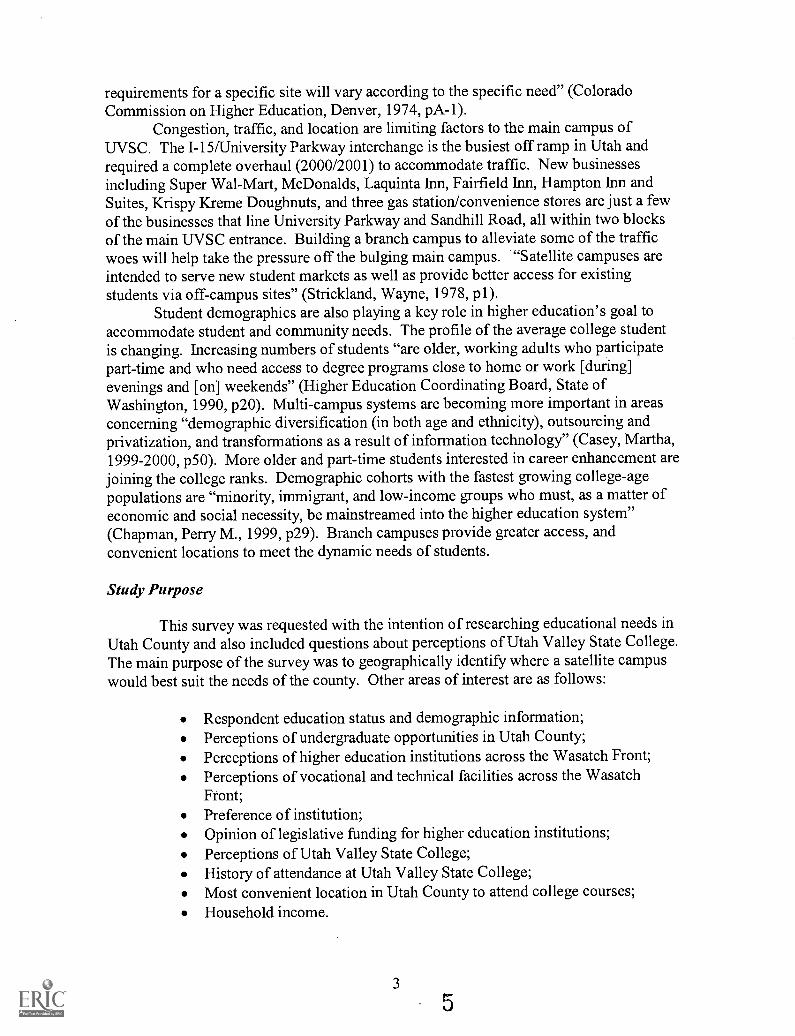
Congestion, traffic, and location are limiting factors to the main campus ofUVSC. The I-15/University Parkway interchange is the busiest off ramp in Utah andrequired a complete overhaul (2000/2001) to accommodate traffic. New businessesincluding Super Wal-Mart, McDonalds, Laquinta Inn, Fairfield Inn, Hampton Inn andSuites, Krispy Kreme Doughnuts, and three gas station/convenience stores are just a fewof the businesses that line University Parkway and Sandhill Road, all within two blocksof the main UVSC entrance. Building a branch campus to alleviate some of the trafficwoes will help take the pressure off the bulging main campus. "Satellite campuses areintended to serve new student markets as well as provide better access for existingstudents via off-campus sites" (Strickland, Wayne, 1978, pl).
Student demographics are also playing a key role in higher education's goal toaccommodate student and community needs. The profile of the average college studentis changing. Increasing numbers of students "are older, working adults who participatepart-time and who need access to degree programs close to home or work [during]evenings and [on] weekends" (Higher Education Coordinating Board, State ofWashington, 1990, p20). Multi-campus systems are becoming more important in areasconcerning "demographic diversification (in both age and ethnicity), outsourcing andprivatization, and transformations as a result of information technology" (Casey, Martha,1999-2000, p50). More older and part-time students interested in career enhancement arejoining the college ranks. Demographic cohorts with the fastest growing college-agepopulations are "minority, immigrant, and low-income groups who must, as a matter ofeconomic and social necessity, be mainstreamed into the higher education system"(Chapman, Perry M., 1999, p29). Branch campuses provide greater access, andconvenient locations to meet the dynamic needs of students.
Study Purpose
This survey was requested with the intention of researching educational needs inUtah County and also included questions about perceptions of Utah Valley State College.The main purpose of the survey was to geographically identify where a satellite campuswould best suit the needs of the county. Other areas of interest are as follows:
Respondent education status and demographic information;Perceptions of undergraduate opportunities in Utah County;Perceptions of higher education institutions across the Wasatch Front;Perceptions of vocational and technical facilities across the WasatchFront;Preference of institution;Opinion of legislative funding for higher education institutions;Perceptions of Utah Valley State College;History of attendance at Utah Valley State College;Most convenient location in Utah County to attend college courses;Household income.
3

METHODOLOGY
The survey was issued for bid and contracted to XCENTRIX SCI of Orem, Utah.XCENTRIX conducted the survey between January 23 and January 27, 2001. Thepopulation of the survey consisted of 502 random respondents representing thedemographic makeup of Utah County, 18 years and older. There was also an over-sample taken of an additional 150 respondents north of Orem and 150 respondents southof Provo.
The coverage area of this survey was limited to Utah County only and did notextend to adjacent cities bordering the county. The survey did not include programpreferences, local business and industry need, or economic, administrative or proceduraloverviews.
Worthlin Corporation designed the original survey instrument for Utah ValleyState College. It was then reviewed and slightly modified by the Institutional Researchdepartment before being submitted. XCENTRIX obtained a list of randomly selectedtelephone numbers for Utah County residents, then briefed and trained their staff for theproject.
A pilot study was conducted by monitoring calls to respondents. Minormodifications to questions 6, 6a, 6b, and 7 were made, and the survey was underway. Asthe project progressed, it was noticed that certain demographic groups, age and gender,were not coinciding with the county demographics, so screening questions that targetedthose groups were moved to the beginning of the survey. After the survey wasconducted, XCENTRIX completed the coding of open-ended questions. The Office ofInstitutional Research completed the analysis of the data.
Most questions from the survey were asked to all the respondents. There was,however, a qualifying question asking respondents if they had any knowledge of UtahValley State College. A negative response to the qualifying question resulted inbypassing the public perception questions about UVSC on the survey. Only 13 of the502 random sample respondents had not heard of UVSC and did not answer questions 9through 17. A complete copy of the survey instrument can be found in Appendix A. Toidentify patterns from specific demographic groups, respondents were identified by age,education, income and residential location in Utah County.
There were 502 respondents to this survey, and of those 55.6% (N=279) werefemale and 44.4% (N=223) were male. This indicated that there was a slightoverrepresentation by females, but should not have .a material affect on the survey results.Students attending Brigham Young University (BYU) were excluded from the survey forinstitutional loyalty reasons. Findings from the random sample revealed that 44.8%(N=225) of the respondents lived in the central (Orem/Provo) area of the valley. Of theremaining respondents 30.3% (N=152) lived in the north end of the valley, and 24.9%(N=125) of the respondents resided in the south valley. The demographic makeup of thesurvey cohort should be a fair representation of the Utah County population.
Survey results relating to age classes revealed that 22.8% (N=113) weretraditional college students (18 24) and 51.8% (N=257) were non-traditional collegeage (25 49). The remainder of the survey cohort was evenly split with 13.3% (N=66) inboth the established (50 64) and retired (65 and up) age groups. Breaking down age
4

further revealed that 51.3% of the traditional college age (18 24) respondents lived inthe Orem/Provo area, with 29.2% living in the north valley and 19.5% living in the southvalley. Of the non-traditional age (24 49) respondents, 32.3% lived in the north valleyand 25.7% lived in the south valley. More families in the high-income category appearedto favor the living in the north valley (40.9%) while 39.4% lived in Orem/Provo.
5 7
STUDY FINDINGS
Public Perceptions of Utah Valley State College
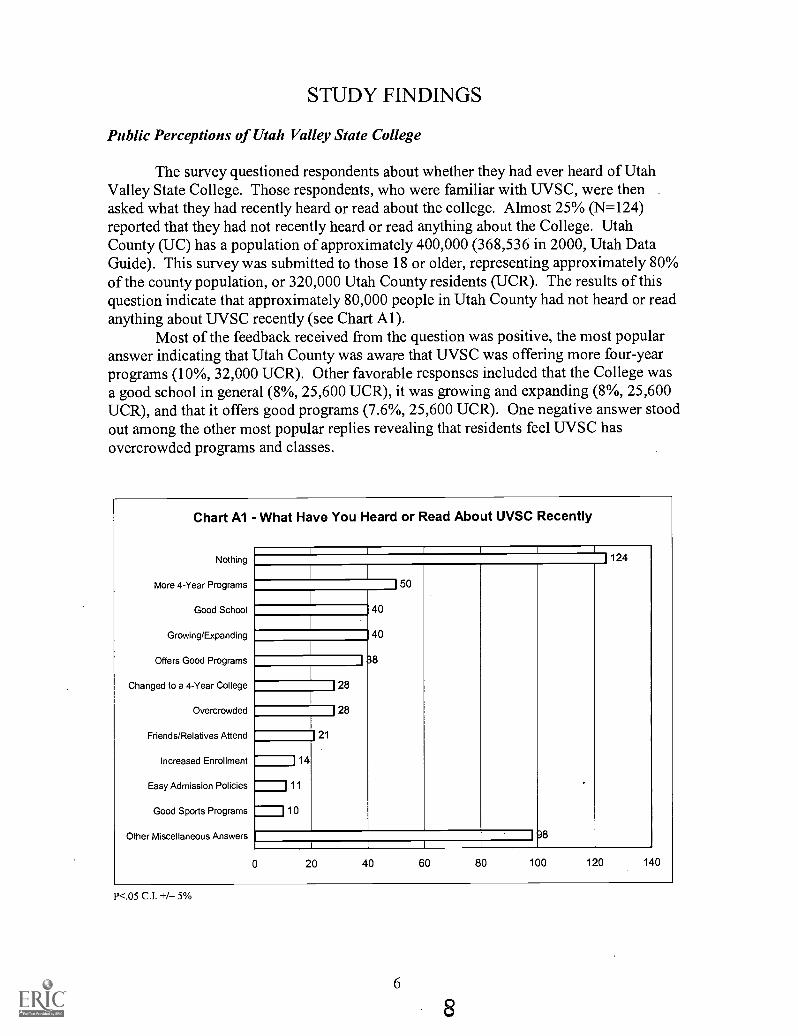
The survey questioned respondents about whether they had ever heard of UtahValley State College. Those respondents, who were familiar with UVSC, were thenasked what they had recently heard or read about the college. Almost 25% (N=124)reported that they had not recently heard or read anything about the College. UtahCounty (UC) has a population of approximately 400,000 (368,536 in 2000, Utah DataGuide). This survey was submitted to those 18 or older, representing approximately 80%of the county population, or 320,000 Utah County residents (UCR). The results of thisquestion indicate that approximately 80,000 people in Utah County had not heard or readanything about UVSC recently (see Chart Al).
Most of the feedback received from the question was positive, the most popularanswer indicating that Utah County was aware that UVSC was offering more four-yearprograms (10%, 32,000 UCR). Other favorable responses included that the College wasa good school in general (8%, 25,600 UCR), it was growing and expanding (8%, 25,600UCR), and that it offers good programs (7.6%, 25,600 UCR). One negative answer stoodout among the other most popular replies revealing that residents feel UVSC hasovercrowded programs and classes.
Chart Al - What Have You Heard or Read About UVSC Recently
Nothing
More 4-Year Programs
Good School
Growing/Expanding
Offers Good Programs
Changed to a 4-Year College
Overcrowded
Friends/Relatives Attend
Increased Enrollment
Easy Admission Policies
Good Sports Programs
Other Miscellaneous Answers
1 I
1124
150
40
40
138
128
128
121
114
111
110
198
0 20 40 60 80 100 120 140
P<.05 C.I. +/ 5%
6

Positive Opinions
The survey then queried respondents about positive opinions or perceptions theyhad about Utah Valley State College. The two most popular replies were supported byover one third of the sample, with 19% (N=95) representing 60,800 UCR, saying thatUVSC had good programs and classes, and 15.5% (N=76, 49,600 UCR), indicating that itwas a good school in general (see Chart A2). This was echoed in the results of questions6a and 6b concerning which Utah college or university would be the first or secondchoice for a child. Although BYU was the most preferred first choice institution for UtahCounty residents with 54.2% (N=272), UVSC was a strong second with 23% (N=113).UVSC was the preferred second choice of Utah institutions receiving 32% (N=159). SeeTables 6a and 6b in Appendix B.
There was also a prominent group (10.4%, (N=51, 33,280 UCR) saying thatUVSC had an easy admission policy. Another 6.3% (N=31) suggested there were goodopportunities available for graduates of UVSC, and 5.3% (N=26) indicated that theyconsidered tuition to be low and a good value. Other positive opinions included thatUVSC has a good location, a quality faculty, and a good student/teacher ratio.
Chart A2 - Positive Opinions About UVSC
Good Programs/Classes
Good School
Easy Admission Policy
Good Opportunities After Graduation
Low Tuition
Good Location
Quality Faculty
Good Student/Teacher Ratio
Nice Campus/Facilities
Growing/Expanding
Do Not Know
Nothing
Other Miscellaneous Answers
I i I i i
195I I I
176I
151
1 31
I2
125
123
123
1 22
116
125
30I
146
0 10 20 30 40 50 60 70 80 90 100
P<.05 C.I. +1 5%
Good programs and classes was a popular opinion among the middle-incomegroup ($25,000 to $75,000) and those respondents in the mid level education category(some college or vocational training), with a response rate of 19.6% and 19.2%respectively. Over 29% of the upper income ($75,000 or more) respondents showedsupport that UVSC was a good school in general with 21.2% of the retired population (65and older) also affirming that opinion.
7

Negative Opinions About UVSC
The following two categories reveal some of Utah County's concerns aboutcertain aspects of Utah Valley State College. One promising response to the questionaddressing negative opinions about UVSC was that 31.9% (N=156), representing102,080 UCR, had nothing negative to say about the college (see Chart A3). Two pointsthat topped the negative opinion list were that UVSC, was overcrowded and that therewas insufficient parking on campus (each supported by 7.2%, N=35, representing 23,040UCR). Other more frequent answers included concerns about traffic problems (N=28),not enough four-year degrees (N=23), and low quality faculty (N=21).
Nothing Negative
Insufficient Parking
Overcrowded
Traffic Problems
Not Enough 4-Year Degrees
Low Quality Faculty
High Tuition
Big High School
Low Quality Student Body
Low Quality Programs
Too Liberal
Insufficient Housing
No Post Graduate Programs
Do Not Know
Other Miscellaneous Answers
Chart A3 - Negative Opinions About UVSC
1 156
I
135
135
128
123
121
119
117
-] 13-1 13= 10=9=9
146
1 55I I
0 20 40 60 80 100 120 140 160 180
P<.05 C.I. +/- 5%
8
10
Recommendations to Improve UVSC
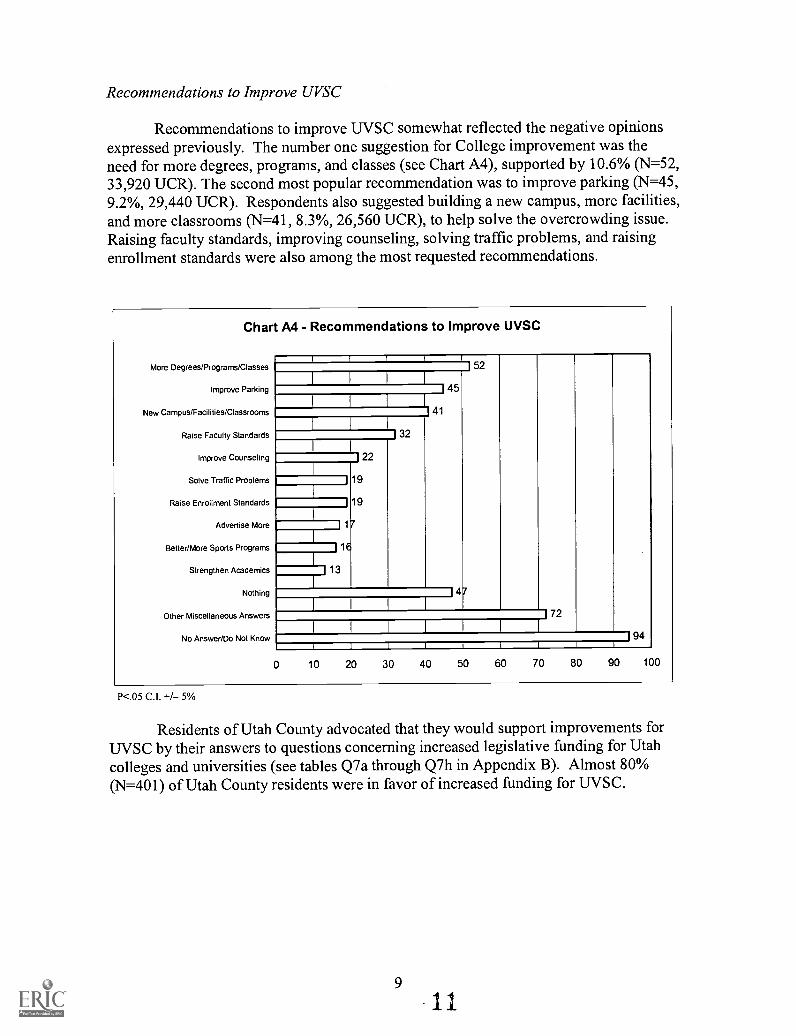
Recommendations to improve UVSC somewhat reflected the negative opinionsexpressed previously. The number one suggestion for College improvement was theneed for more degrees, programs, and classes (see Chart A4), supported by 10.6% (N=52,33,920 UCR). The second most popular recommendation was to improve parking (N=45,9.2%, 29,440 UCR). Respondents also suggested building a new campus, more facilities,and more classrooms (N=41, 8.3%, 26,560 UCR), to help solve the overcrowding issue.Raising faculty standards, improving counseling, solving traffic problems, and raisingenrollment standards were also among the most requested recommendations.
Chart A4 - Recommendations to Improve UVSC
More Degrees/Programs/Classes
Improve Parking
New Campus/Facilities/Classrooms
Raise Faculty Standards
Improve Counseling
Solve Traffic Problems
Raise Enrollment Standards
Advertise More
Better/More Sports Programs
Strengthen Academics
Nothing
Other Miscellaneous Answers
No Answer/Do Not Know
1 1
152
I I
145
1 I
141
I
132
122
_119
119
17
1e
113
J47
172
I I I
1941 r I ( I
0 10 20 30 40 50 60 70 80 90 100
P<.05 C.f. +1 5%
Residents of Utah County advocated that they would support improvements forUVSC by their answers to questions concerning increased legislative funding for Utahcolleges and universities (see tables Q7a through Q7h in Appendix B). Almost 80%(N=401) of Utah County residents were in favor of increased funding for UVSC.
9
11

Encourage or Discourage Attendance to UVSC
Respondents were asked whether they would encourage or discourage a familymember's attendance if they indicated an interest in UVSC. Only 2% (N=11) said theywould discourage their child from attending UVSC, most indicating a preference for auniversity and its associated benefits. Other reasons for discouraging enrollmentincluded high tuition, overcrowding, and being too liberal.
The majority of respondents, almost 81% (N=394, 256,000 UCR), reported theywould encourage their family members to attend UVSC for numerous reasons (see ChartA5), and 17% (N=81) indicated they would remain neutral. Respondents encouragedattendance primarily because they considered the College to be a good school (N=70,14.3%, 45,760 UCR) that offered good classes and programs (N=59, 12%, 38,400 UCR)at an affordable tuition rate (N=38, 7.7%, 24,640 UCR). They also believed that UVSCwas a good place to get an education, and that the college provides a good personalexperience.
Chart A5 - Reasons to Encourage Attending UVSC
Good School
Quality Academics/Programs
Affordable/Low Tuition
To Get An Education
Good Personal Experience
Good Class Size/One on One
Lenient Admission Policy
Easy Transition From High School
Good Student Community
Good Location
Wide Variety of Courses
Ideal for Transferable General Ed
Other Miscellaneous Answers
No Answer
Do Not Know
I
1
12 8
127
125
123
122
20
19
8
117
122
13 8
142
1 b9
b9
70
0 10 20 30 40 50 60 70 80
P<.05 C.I. +/- 5%

Attract More Students
When asked what UVSC could do to attract more students, 15.7% (N=77representing 50,240 UCR) indicated more four-year programs and a wider variety ofclasses as the main enhancements for the College (see Chart A6). Another 7.8% (N=38,24,960 UCR) wanted the school to keep doing what they are already doing, and 7.6%(N=37, 24,320 UCR) suggested more advertising. This was followed closely by 6.7%(N=33, 21,440) who suggested lower tuition. Other recommendations included morecompetent faculty, increased night and weekend class offerings, additional scholarships,and raising academic standards.
Chart A6 - What Could UVSC Do To Attract More Students
More Degrees/Programs/Classes
Keep Doing What They Are Doing
Advertise
Lower Tuition
More Competent Faculty
More Night/Weekend Classes
More Scholarships
More Buildings/Locations
Raise Academic Standards
Nothing
Other Miscellaneous Answers
No Answer/Do Not Know
I
131
177
8
7
153
161
1
133
115
112
111
110
110
1
i I I
0 20 40 60 80 100 120 140
P<.05 C.I. +1 5%
Families with high incomes ($75,000 and up) and high education levels (four-yeardegree or more) are more prone to encourage higher education for their children. UtahCounty residents in those groups strongly supported building a new campus/facilities andwanted more four-year programs and degrees. They also highly recommended raisingstandards for faculty as a way to attract more students.

Rating Specific Aspects of UVSC
Utah County residents were asked to rate certain aspects of Utah Valley StateCollege compared to other colleges and universities in the state. The category thatreceived the highest rating of excellence was the quality of religious programs andsupport, which received 34.2% representing 109,440 UCR. Another 33.1% (105,920UCR) gave the category an above average rating (see Table 1). Quality of vocational andtechnical programs garnered over 70% of respondents giving it above average or highrating, and the reputation of UVSC received a 66% response of above average or more.
Table 1 - Comparative Utah County Ratings for UVSC (N=489)
High Above Avg Average Below Avg Low No Response
Quality of Religious Programs and Support 34.2% 33.1% 23.7% 2.2% 2.0% 4.7%
Quality of Vocational/Technical Programs 28.4% 41.9% 21.9% 2.9% 0.4% 4.5%
Reputation of the Institution 25.2% 40.7% 26.0% 4.5% 1.2% 2.5%
Quality of General Education Programs 22.1% 45.2% 25.2% 2.2% 1.2% 4.1%
Competent Faculty 21.5% 39.5% 30.5% 3.5% 0.6% 4.5%
Preparing Students for the Future 21.3% 44.8% 26.2% 3.3% 0.8% 3.7%
Quality of Student Body 20.0% 38.9% 31.7% 3.9% 1.6% 3.9%
Student to Teacher Ratio 18.0% 31.9% 36.0% 4.9% 2.0% 7.2%
Quality of Academics 17.2% 42.3% 33.5% 4.3% 0.4% 2.2%
Academic Advising for Students 16.6% 33.7% 33.5% 7.6% 2.5% 6.1%
Extent of Course Offerings 13.3% 34.4% 42.5% 5.3% 1.2% 3.3%
Athletic Programs 10.0% 23.7% 41.9% 15.7% 2.7% 5.9%
P<.05 C.I. +1- 5%
The athletic programs received the lowest ranking of the available categories,despite national junior college (NJCAA) rankings in men and women's basketball,women's volleyball, and women's softball. One possible explanation could be that theyare being compared to NCAA, Division 1 teams at Brigham Young University and theUniversity of Utah.
The other lower ranking categories, i.e. academic quality, academic advising andextent of course offerings, substantiate the sentiments expressed in Chart A4 onrecommendations to improve the College.
12 14

Educational Opportunities and Need for Branch Campuses
Building a branch campus would be a partial solution for additional classrooms,traffic congestion, and parking problems. When asked what location would be mostconvenient to attend, 64%, N=324 (of 502 total respondents in the random sample) saidthe main campus was their preference. A new campus built in the south valley was thesecond choice (N=83, 17%) and a new campus built in the north valley was close behind(N=81, 16%). See Chart Bl.
Chart B1 - Random Sample
New South Campus17%
New North Campus16%
No Opinion3%
Main Campus64%
Over-sample respondents were included to obtain a good understanding of whatcity in the county would be a convenient location to build a branch campus. SpanishFork was most favored with 42%, N=67 (see Chart B2) of the 157 south valley residents.Payson received 19% (N=30), and Springville 17% (N=26). The 1990 and 2000Decennial Census revealed that Springville and Spanish Fork had almost identicalpopulations with 20,424 and 20,246 respectively but also illustrated that growth duringthat 10-year period in Spanish Fork was 79.6% compared to 46.4% in Springville (UtahData Guide, p9). If this growth rate continues, Spanish Fork should have the largerpopulation by this publication date.
13
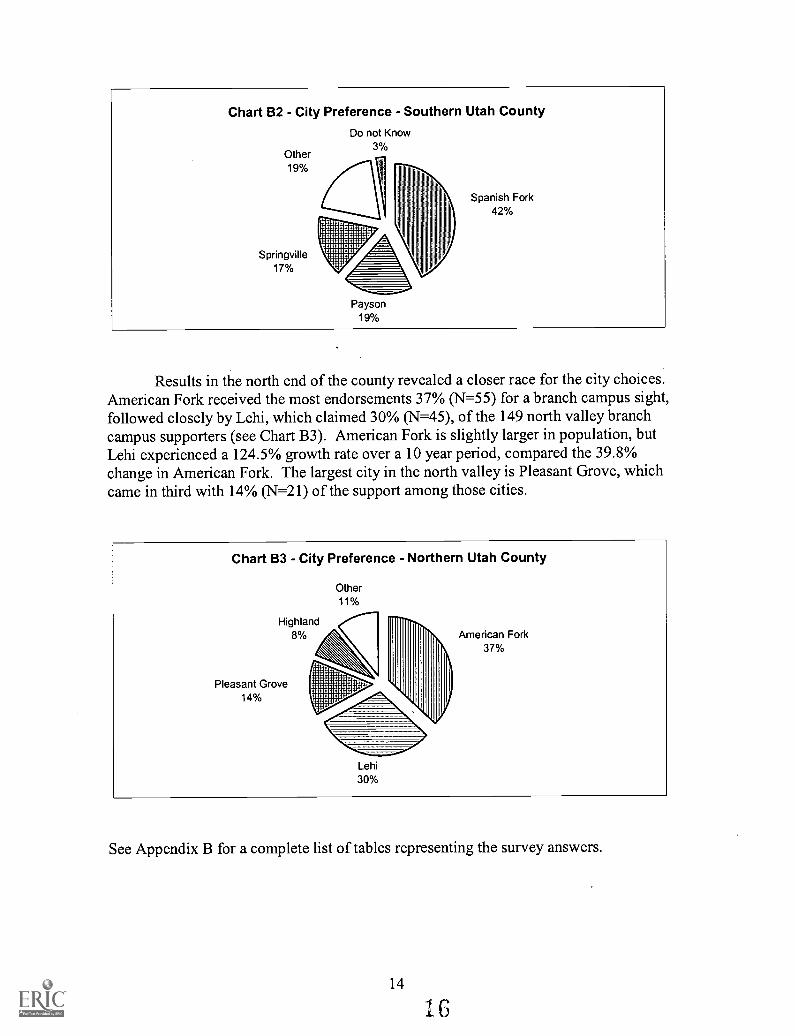
Chart B2 - City Preference - Southern Utah CountyDo not Know
3%Other19%
Springville17%
:
MI "111 :
Payson19%
Spanish Fork42%
Results in the north end of the county revealed a closer race for the city choices.American Fork received the most endorsements 37% (N=55) for a branch campus sight,followed closely by Lehi, which claimed 30% (N=45), of the 149 north valley branchcampus supporters (see Chart B3). American Fork is slightly larger in population, butLehi experienced a 124.5% growth rate over a 10 year period, compared the 39.8%change in American Fork. The largest city in the north valley is Pleasant Grove, whichcame in third with 14% (N=21) of the support among those cities.
Chart B3 - City Preference - Northern Utah County
Other11%
Pleasant Grove14%
Lehi30%
American Fork37%
See Appendix B for a complete list of tables representing the survey answers.
14

SUMMARY AND RECOMMENDATIONS
Utah Valley State College is continuing to grow and has already surpassed theoriginal estimated capacity for the Orem campus sight. Survey results show that moreclasses and four-year programs are the two top recommendations for UVSC to betterserve the needs of the dynamic and evolving Utah County student market. Off-campussights have helped meet the need by providing additional classes in more convenientlocations.
Student demographics and needs are changing. More minorities, working adults,single parents, and older people are pursuing college classes and credits. Special needssuch as a wider variety of classes and programs, more evening and weekend classes, andservices provided closer to home, will have to be addressed with the changingdemographics.
Public opinion concerning UVSC is mostly positive although a surprising numberof county residents had not heard or seen anything about the school recently. Recognitionand acceptance of UVSC as a four-year institution is gaining popularity in the county,and demand is increasing. To meet that demand, the College now offers 21 four-yeardegrees and more are being planned and proposed. UVSC will need to continue itsexpansion to meet the growing demands of Utah County. Problems with traffic, parking,counseling, and faculty standards will need to be addressed and incorporated into theimmediate and long range plans. A competitive salary structure for new faculty, salaryincreases for current faculty, mentoring, and decreasing the number of adjunct facultycould help with complaints about faculty and academic standards.
A branch campus, strategically located in Utah Valley, is a possible solution thatcould help better serve students and the community. It would also help relieve theovercrowded main campus, and assist with the traffic and parking problems. If a branchcampus is considered, several factors need to be taken into account. It should be built inan area with easy access and close to major population center. Spanish Fork was pickedas a popular location in the south valley. American Fork was slightly favored over Lehi inthe north, although both had substantial support.
15

References
Sorenson, Wilson, W. (1985). A Miracle in Utah Valley, The Story of Utah Technical College,1941-1982. Utah Technical College at Provo.
Utah State Data Center (2001, Spring) Utah Data Guide.
Office of Institutional Research, Utah Valley State College (2000). 2000 2001 Fact Book, UtahValley State College.
Landini, Albert, J. (1975, March). Population Characteristics of Potential Satellite CampusStudents. (ERIC Document Reproduction Service No. 103047).
Strickland, Wayne. (1978, October). Is There a Role for Institutional Research in InnovativePlanning in Higher Education? Paper presented to the Southern Association forInstitutional Research, Nashville, Tennessee, October 26-27, 1978. (ERIC DocumentReproduction Service No. 165542).
Parrish, Richard M., Harris, David W. (1986, September). The Need for a Branch Campus ofOcean County College in Southern Ocean County. (ERIC Document ReproductionService No. 277418).
Fink, Ira. (1999, Spring). Benchmarking: A new Approach to Space Saving. Planning forHigher Education. 27: 9-18.
Casey, Martha. (1999-2000, Winter). The Multicampus System in the 21st Century. Planningfor Higher Education. 28: 48-50.
Chapman, Perry, M. (1999, Summer). The Campus at the Millennium: A Plea for Communityand Place. Planning for Higher Education. 27: 25-31.
Hermanson, Dean R. (1993, Spring). A Revalidation of Dunlap's Survey to Determine theProfile and Critical Issues of Lower Division Branch Campuses of Four-YearInstitutions. Independent research paper, University of North Dakota. (ERIC DocumentReproduction Service No. 358897).
Higher Education Coordinating Board, State of Washington. (1990, July) Design for the 21stCentury: Expanding Higher Education Opportunity in Washington. (ERIC DocumentReproduction Service No. 358768).
Arizona State University Branch Campus Study Committee. (1977, February). A Report to theThirty-Third Legislature, State of Arizona, on the Feasibility of Establishing a Branch ofArizona State University in Western Maricopa County. Prepared for the Arizona StateUniversity Branch Campus Study Committee. (ERIC Document Reproduction ServiceNo. 221125).
16

Colorado Commission on Higher Education, Denver. (1974). Guidelines for Sight Selection,Long-Range Facilities master Planning, and Facilities Program Planning. (ERICDocument Reproduction Service No. 094630).

Appendix A

North Valley/South Valley Survey
Hello, I'm of , a national research firm. We'retalking with people in Utah Valley today and would like to ask you a few questions on aconfidential basis. I am not selling anything, nor will I ask you for a donation. Forquality control purposes my supervisor may monitor this call.(DO NOT PAUSE)
A. Are you 18 years old or older?
1 YES (SKIP TO Q1)2 NO (ASK B)3 REFUSED (ASK B)
B. May I speak with someone else in your household who is at least 18 years of age?
1 YES IF "YES" REPEAT INTRO WITH NEW PERSONIF UNAVAILABLE ARRANGE FOR CALLBACK
2 NO NOT AVAILABLE ARRANGE FOR CALLBACK3 NO REFUSED EXIT AND REPORT AS REFUSED4 NO ONE 18 OR OLDER THANK AND TERMINATE
C. Gender (BY OBSERVATION)
Q1
1 Male2 Female
Are you a student at Brigham Young University?
1 YES THANK AND TERMINATE2 NO CONTINUE
Q2 How would you rate the POST-HIGH SCHOOL education opportunities in the UtahCounty area compared with other counties along the Wasatch Front?
1 Much better2 Somewhat better3 About the same4 Somewhat worse5 Much worse6 [DO NOT READ] Don't know/refused

Q3 In your opinion, are the 4-year under graduate opportunities in Utah Countyadequate or inadequate?
1 Adequate2 Inadequate3 [DO NOT READ] Don't know/refused
Q4 When you think of institutions that offer 4 year under graduate degree education,which institutions along the Wasatch Front are first to come to your mind?[PROBE] What others? [MULTIPLE MENTIONS ACCEPTED]
1 University of Utah2 Brigham Young University3 Utah Valley State College4 Weber State University5 Salt Lake Community College6 Westminster7 University of Phoenix8 Don't know/no answer
Q5 In your opinion, are vocational and technical education facilities in Utah Countyadequate or inadequate?
1 Adequate2 Inadequate3 [DO NOT READ] Don't know/no answer
Q6 When you think of vocational and technical education along the Wasatch Front,what institutions first come to your mind? [PROBE] What others? [MULTIPLEMENTIONS ACCEPTED]
1 University of Utah2 Brigham Young University3 Utah Valley State College4 Weber State University5 Salt Lake Community College6 Utah College of Massage Therapy7 Stevens-Henager College8 Provo College9 Don't know/no answer

Q6a If you had a child that was just going to be starting college in a year, which Utahcollege or University would be your first choice for them to attend?Open answer
1 University of Utah2 Brigham Young University3 Utah Valley State College4 Weber State University5 Salt Lake Community College6 Utah State University7 Snow College8 Southern Utah University9 Other In State Vocation/Technical10 Other Out Of State College11 Other12 Don't know/no answer
Q6b If that child could not get into your first choice school for some reason, which Utahcollege or university would be your second choice for them to attend?Open answer
1 University of Utah2 Brigham Young University3 Utah Valley State College4 Weber State University5 Salt Lake Community College6 Utah College of Massage Therapy7 Utah State University8 Dixie College9 Snow College10 Southern Utah University11 University of Phoenix12 Ricks College13 Other In State Vocation/Technical14 Other Out Of State College15 Other16 Don't know/no answer
Q7a Would you favor or oppose the Utah State Legislature increasing funding for theUniversity of Utah?
1 Favor2 Oppose3 Neutral4 No Opinion

Q7b Would you favor or oppose the Utah State Legislature increasing funding forUtah State University?
1 Favor2 Oppose3 Neutral4 No Opinion
Q7c Would you favor or oppose the Utah State Legislature increasing funding forWeber State University?
1 Favor2 Oppose3 Neutral4 No Opinion
Q7d Would you favor or oppose the Utah State Legislature increasing funding forUtah Valley State College?
1 Favor2 Oppose3 Neutral4 No Opinion
Q7e Would you favor or oppose the Utah State Legislature increasing funding forDixie College?
1 Favor2 Oppose3 Neutral4 No Opinion
Q7f Would you favor or oppose the Utah State Legislature increasing funding forSnow College?
1 Favor2 Oppose3 Neutral4 No Opinion
Q7g Would you favor or oppose the Utah State Legislature increasing funding forSouthern Utah University?
1 Favor2 Oppose

3 Neutral4 No Opinion
Q7h Would you favor or oppose the Utah State Legislature increasing funding for theCollege of Eastern Utah?
1 Favor2 Oppose3 Neutral4 No Opinion
Q8 Have you heard of Utah Valley State College?1 Yes [ASK Q9]2 No [SKIP TO Q18]3 [DO NOT READ] I think so, but not sure [ASK Q9]4 [DO NOT READ] Don't know/no answer [SKIP TO Q18]
Q9 In thinking about UVSC, what specifically have you heard or read about UVSCrecently?
Open answer
Q10 What are some the positive things you can say about UVSC?
Open answer
Q11 What are some of the negative things you can say about UVSC?
Open answer
Q12 Are you or any member of your immediate family employed by UVSC?
1 Yes2 No3 Don't know/no answer
Q13 Have you or any member of your family ever attended UVSC?
1 Yes2 No3 Don't know/no answer
Q14 If someone in your family indicated an interest in attending UVSC in Orem, wouldyou encourage or discourage them to attend, or would you remain neutral?
1 Encourage [ASK 14b]
5
2 Discourage [ASK 14a]3 Remain neutral [SKIP TO Q15]4 [DO NOT READ] Don't know/no answer [SKIP TO Q15]
Q14a (if discourage) why? Open answer
Q14b (if encourage) why? Open answer
Q15 From what you know of have heard, how would you rate UVSC in Orem comparedto other colleges and universities in the state, on the following items, using a 1 to 5 scalewhere 1 is low or not very good and 5 is high or excellent?
A. Academic qualityB. Extent of course offeringsC. Competent facultyD. Academic advising for studentsE. Athletic programF. Quality of the students attending the collegeG. Has a good ratio of teachers to studentsH. Preparing students for the futureI. Reputation of the institutionJ. Quality of vocational/technical programsK. Quality of general education programsL. Quality of religious programs and support
Q16 What could UVSC do to attract you or member of your family as students?[PROBE ONCE] What else?
Open answer
Q17 Which location would be most convenient to attend?
1 The main campus in Orem [SKIP TO Q18]2 A new campus somewhere in Southern Utah County [ASK Q17a]3 A new campus somewhere in Northern Utah County [ASK Q17b]5 Don't know /no answer
Q17a Near which city or location in Southern Utah County would you like to see a newUVSC campus built?
[SPECIFY NAME OF CITY]
Q17b Near which city or location in Northern Utah County would you like to see a newUVSC campus built?
[SPECIFY NAME OF CITY]

Q18 Which specific newspapers do you read?
Open answer
Q19 Which radio stations do you generally listen to?
Open answer
Q20 If you could make one suggestion or recommendation for UVSC to improve, whatwould it be?
Open answer
Statistical questions
D1 What is your age (group)?1 18-202 21-243 25-294 30-345 35-396 40-447 45-498 50-549 55-5910 60-6411 65-6912 70-7413 75-older14 No answer
D2 What is the last grade of formal education you completed?
1 Less than high school2 High school graduate3 Technical/vocational4 Some college5 College graduate6 Post graduate7 Don't know/no answer
D3 Are you currently enrolled in or have children enrolled in the following:
A. UVSC

B. Weber State UniversityC. Brigham Young UniversityD. University of UtahE. Utah State UniversityF. Salt Lake Community CollegeG. Some other 4-year college (open answer)H. Some other 2-year college (open answer)I. Some other vocation/technical college
D4 What is your total annual family income? Please stop me when I reach your income.[READ CATAGORIES]
01 Under $15,00002 $15,000 - $25,00006 $25,000 - $35,00008 $35,000 $50,00010 $50,000 $75,00012 $75,000 - $100,00013 $100,000 or more15 [DO NOT READ] REFUSED
D5 What is your zip code?
Open answer
D6 What is your name please? (IF REFUSED ASK:) May I have your first name in casemy supervisor needs to verify that this interview actually took place?
Open answer
28

Appendix B

Tables From North Valley/South Valley Survey
GenderFrequency Percent Valid Cumulative
Percent PercentValid Male 223 44.4 44.4 44.4
Female 279 55.6 55.6 100.0Total 502 100.0 100.0
Utah Valley LocationFrequency Percent Valid Cumulative
Percent PercentValid Provo-Orem 225 44.8 44.8 44.8
North Valley 152 30.3 30.3 75.1
South Valley 125 24.9 24.9 100.0Total 502 100.0 100.0
Q2 Higher Ed Opportunities in Utah County Compared to Rest of UtahFrequency Percent Valid Cumulative
Percent PercentValid Much Better 112 22.3 22.3 22.3
Somewhat Better 146 29.1 29.1 51.4About the Same 171 34.1 34.1 85.5Somewhat Worse 7 1.4 1.4 86.9Much Worse 3 .6 .6 87.5Do Not Know 63 12.5 12.5 100.0Total 502 100.0 100.0
Q3 - Opinion on 4-Year Under Graduate Opportunities in Utah CountyFrequency Percent Valid Cumulative
Percent PercentValid Adequate 378 75.3 75.3 75.3
Inadequate 95 18.9 18.9 94.2No opinion 29 5.8 5.8 100.0Total 502 100.0 100.0
Q4 - First to Mind 4-Year Under Graduate InstitutionFrequency Percent Valid Cumulative
Percent PercentValid University of Utah 4 .8 .8 .8
Brigham Young University 129 25.7 25.7 26.5Utah Valley State College 251 50.0 50.0 76.5Weber State University 46 9.2 9.2 85.7Salt Lake Community College 22 4.4 4.4 90.0Westminister 18 3.6 3.6 93.6University of Phoenix 8 1.6 1.6 95.2Not Sure 24 4.8 4.8 100.0Total 502 100.0 100.0
30

Q5 - Opinion on Vocational and Technical Facilities in Utah CountyFrequency Percent Valid Cumulative
Percent PercentValid Adequate 339 67.5 67.5 67.5
Inadequate 82 16.3 16.3 83.9No opinion 81 16.1 16.1 100.0Total 502 100.0 100.0
Q6 Vocation and Technical EducationFrequency Percent Valid Cumulative
Percent PercentValid University of Utah 1 .2 .2 .2
Brigham Young University 34 6.8 6.8 7.0Utah Valley State College 186 37.1 37.1 44.0Weber State University 3 .6 .6 44.6Salt Lake Community College 28 5.6 5.6 50.2Utah College of Massage Therapy 7 1.4 1.4 51.6Stevens-Henager 69 13.7 13.7 65.3Provo College 55 11.0 11.0 76.3Do Not Know-Not Sure 119 23.7 23.7 100.0Total 502 100.0 100.0
Q6a - First Choice for ChildFrequency Percent Valid Cumulative
Percent PercentValid University of Utah 49 9.8 9.8 9.8
Brigham Young University 272 54.2 54.2 63.9Utah Valley State College 113 22.5 22.5 86.5Weber State University 3 .6 .6 87.1Salt Lake Community College 1 .2 .2 87.3Utah State University 17 3.4 3.4 90.6Snow College 10 2.0 2.0 92.6Southern Utah University 3 .6 .6 93.2Other In State Vocation Technical 1 .2 .2 93.4Other Out Of State College 4 .8 .8 94.2Other 8 1.6 1.6 95.8Do Not Know 21 4.2 4.2 100.0Total 502 100.0 100.0
31

Q6b - Second Choice for ChildFrequency Percent Valid Cumulative
Percent PercentValid University of Utah 80 15.9 15.9 15.9
Brigham Young University 63 12.5 12.5 28.5Utah Valley State College 159 31.7 31.7 60.2Weber State University 15 3.0 3.0 63.1Salt Lake Community College 7 1.4 1.4 64.5Utah College of Massage Therapy 1 .2 .2 64.7Utah State University 64 12.7 12.7 77.5Dixie College 13 2.6 2.6 80.1Snow College 12 2.4 2.4 82.5Southern Utah University 8 1.6 1.6 84.1
University of Phoenix 1 .2 .2 84.3Ricks College 8 1.6 1.6 85.9Other In State Vocation Technical 3 .6 .6 86.5Other Out Of State College 9 1.8 1.8 88.2Other 12 2.4 2.4 90.6Do Not Know 47 9.4 9.4 100.0Total 502 100.0 100.0
Q7a Opinion on Legislature Increasing Funding for University of UtahFrequency Percent Valid Cumulative
Percent PercentValid Favor 326 64.9 64.9 64.9
Oppose 122 24.3 24.3 89.2Neutral 34 6.8 6.8 96.0No Opinion 20 4.0 4.0 100.0Total 502 100.0 100.0
Q7b Opinion on Legislature Increasing Funding for Utah State UniversityFrequency Percent Valid Cumulative
Percent PercentValid Favor 352 70.1 70.1 70.1
Oppose 98 19.5 19.5 89.6Neutral 33 6.6 6.6 96.2No Opinion 19 3.8 3.8 100.0Total 502 100.0 100.0
Q7c Opinion on Legislature Increasing Funding for Weber Sate UniversityFrequency Percent Valid Cumulative
Percent PercentValid Favor 333 66.3 66.3 66.3
Oppose 102 20.3 20.3 86.7Neutral 38 7.6 7.6 94.2No Opinion 29 5.8 5.8 100.0Total 502 100.0 100.0
32
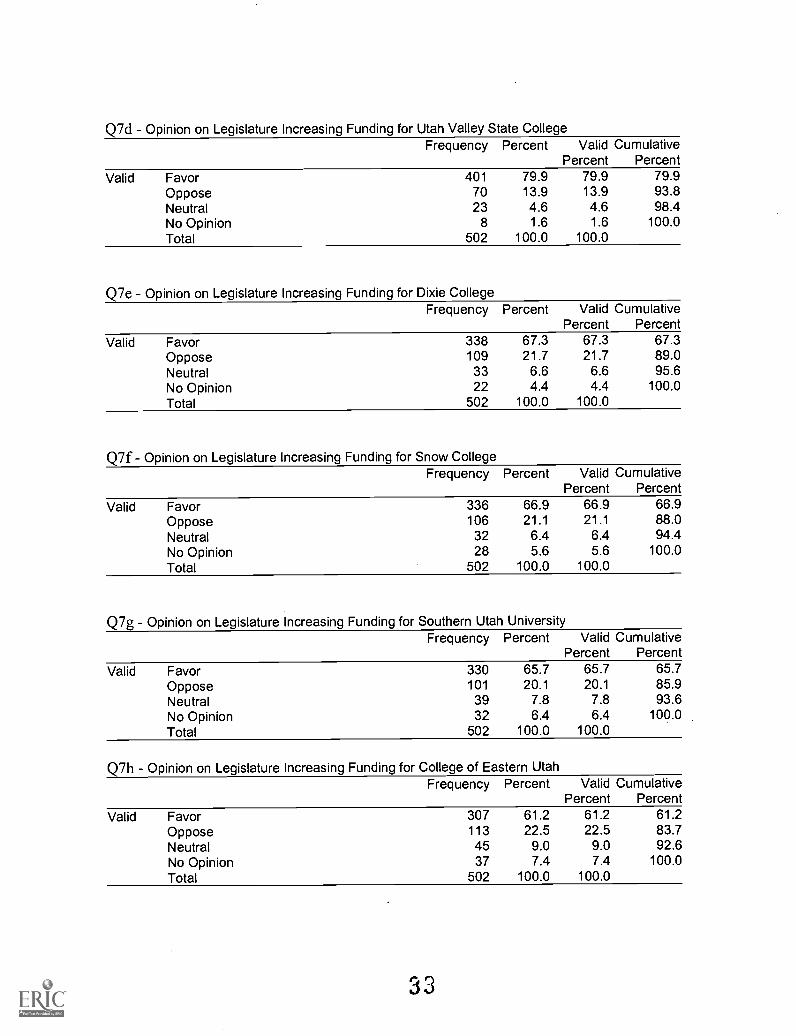
Q7d Opinion on Legislature Increasing Funding for Utah Valley State CollegeFrequency Percent Valid Cumulative
Percent PercentValid Favor 401 79.9 79.9 79.9
Oppose 70 13.9 13.9 93.8Neutral 23 4.6 4.6 98.4No Opinion 8 1.6 1.6 100.0Total 502 100.0 100.0
Q7e Opinion on Legislature Increasing Funding for Dixie CollegeFrequency Percent Valid Cumulative
Percent PercentValid Favor 338 67.3 67.3 67.3
Oppose 109 21.7 21.7 89.0Neutral 33 6.6 6.6 95.6No Opinion 22 4.4 4.4 100.0Total 502 100.0 100.0
Q7f Opinion on Legislature Increasing Funding for Snow CollegeFrequency Percent Valid Cumulative
Percent PercentValid Favor 336 66.9 66.9 66.9
Oppose 106 21.1 21.1 88.0Neutral 32 6.4 6.4 94.4No Opinion 28 5.6 5.6 100.0Total 502 100.0 100.0
Q7g Opinion on Legislature Increasing Funding for Southern Utah UniversityFrequency Percent Valid Cumulative
Percent PercentValid Favor 330 65.7 65.7 65.7
Oppose 101 20.1 20.1 85.9Neutral 39 7.8 7.8 93.6No Opinion 32 6.4 6.4 100.0Total 502 100.0 100.0
Q7h - Opinion on Legislature Increasing Funding for College of Eastern UtahFrequency Percent Valid Cumulative
Percent PercentValid Favor 307 61.2 61.2 61.2
Oppose 113 22.5 22.5 83.7Neutral 45 9.0 9.0 92.6No Opinion 37 7.4 7.4 100.0Total 502 100.0 100.0
33

Q8 - Have You Heard of Utah Valley State CollegeFrequency Percent Valid Cumulative
Percent PercentValid Yes 489 97.4 97.4 97.4
No 13 2.6 2.6 100.0Total 502 100.0 100.0
Q9 - Heard or Read About UVSC RecentlyFrequency Percent Valid Cumulative
Percent PercentValid.00 7 1.4 1.4 1.4
Growing/Expanding 40 8.0 8.0 9.4Good School in General 40 8.0 8.0 17.3Friends/Relatives Attend 21 4.2 4.2 21.5Offering More Four Year Degrees/Programs 50 10.0 10.0 31.5Over Crowded 28 5.6 5.6 37.1Working to Become a University 6 1.2 1.2 38.2Enrollment Has Increased 14 2.8 2.8 41.0Offers Good Programs 38 7.6 7.6 48.6Quality Instructors 7 1.4 1.4 50.0Increasing Tuition 7 1.4 1.4 51.4Recently Changed to a Four Year College 28 5.6 5.6 57.0Currently Attending 5 1.0 1.0 58.0Is Close/Good Location 1 .2 .2 58.2Good Sports Programs 10 2.0 2.0 60.2Lenient Admission Policies 11 2.2 2.2 62.4Understaffed/Not Enough Faculty 4 .8 .8 63.1Good Class Size/Personal Attention 5 1.0 1.0 64.1Needs More Four Year Programs 7 1.4 1.4 65.5Big High School 6 1.2 1.2 66.7Offers Classes for High School Students 3 .6 .6 67.3Offers Scholarships 6 1.2 1.2 68.5Offers Community Classes 4 .8 .8 69.3Better Education per Dollar Compared to BYU 5 1.0 1.0 70.3Our Tax Dollars Multiplied Four Fold 1 .2 .2 70.5Increased/New Scholarship/Funding 1 .2 .2 70.7Good Institute Program 1 .2 .2 70.9Parking Problems 2 .4 .4 71.3Students Like It 9 1.8 1.8 73.1Nothing 124 24.7 24.7 97.8Do Not Know 11 2.2 2.2 100.0Total 502 100.0 100.0
34

Q10 Positive Opinions About UVSCFrequency Percent Valid Cumulative
Percent PercentValid .00 5 1.0 1.0 1.0
Good Location/Close to Home 25 5.0 5.0 6.0Affordable/Low Tuition 26 5.2 5.2 11.2Smaller Class Size/Attention From Teachers 23 4.6 4.6 15.7Growing/Expanding 16 3.2 3.2 18.9Good Teachers/High Quality Faculty 23 4.6 4.6 23.5Nice Facilities/Campus 22 4.4 4.4 27.9Good Programs/Classes 87 17.3 17.3 45.2Good Opportunities After Graduation 31 6.2 6.2 51.4Good School 76 15.1 15.1 66.5High Acceptance/Easy Admission 51 10.2 10.2 76.7Upholds High Standards 1 .2 .2 76.9Good Off Campus Housing 1 .2 .2 77.1
Good Cultural Events 3 .6 .6 77.7Friends/Family Attend 6 1.2 1.2 78.9A Credible College 3 .6 .6 79.5Offers Night/Weekend Classes 1 .2 .2 79.7Good General Ed Programs 8 1.6 1.6 81.3Good Alternative to BYU and UofU 6 1.2 1.2 82.5Offers 4 Year Degrees 1 .2 .2 82.7Good Scholarships 3 .6 .6 83.3Help All Students Succeed 6 1.2 1.2 84.5Good Relationships With Other Schools 2 .4 .4 84.9Not Affiliated With LDS Church 2 .4 .4 85.3Has a Strong LDS Institute Program 1 .2 .2 85.5Difficult Admission/Hard to get Into 1 .2 .2 85.7Offers a Lot to Community/Good Community Programs 5 1.0 1.0 86.7Nothing 30 6.0 6.0 92.6Do Not Know 25 5.0 5.0 97.6Not Used 12 2.4 2.4 100.0Total 502 100.0 100.0
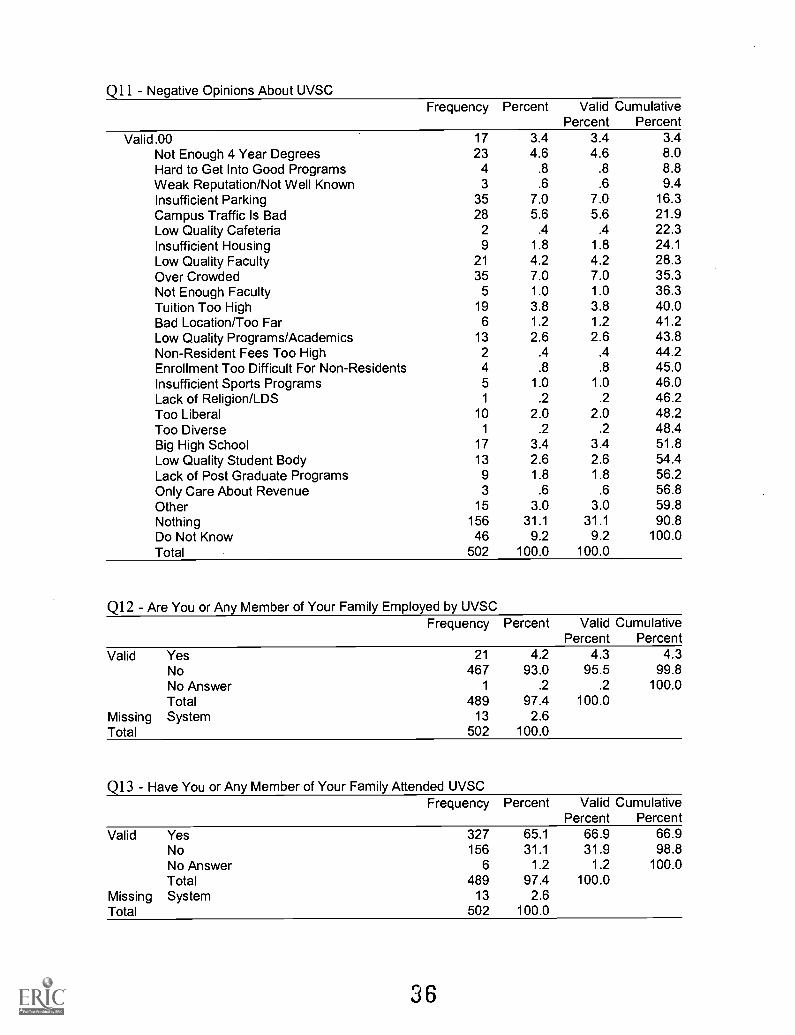
Q11 Negative Opinions About UVSCFrequency Percent Valid Cumulative
Percent PercentValid .00 17 3.4 3.4 3.4
Not Enough 4 Year Degrees 23 4.6 4.6 8.0Hard to Get Into Good Programs 4 .8 .8 8.8Weak Reputation/Not Well Known 3 .6 .6 9.4Insufficient Parking 35 7.0 7.0 16.3Campus Traffic Is Bad 28 5.6 5.6 21.9Low Quality Cafeteria 2 .4 .4 22.3Insufficient Housing 9 1.8 1.8 24.1Low Quality Faculty 21 4.2 4.2 28.3Over Crowded 35 7.0 7.0 35.3Not Enough Faculty 5 1.0 1.0 36.3Tuition Too High 19 3.8 3.8 40.0Bad Location/Too Far 6 1.2 1.2 41.2Low Quality Programs/Academics 13 2.6 2.6 43.8Non-Resident Fees Too High 2 .4 .4 44.2Enrollment Too Difficult For Non-Residents 4 .8 .8 45.0Insufficient Sports Programs 5 1.0 1.0 46.0Lack of Religion/LDS 1 .2 .2 46.2Too Liberal 10 2.0 2.0 48.2Too Diverse 1 .2 .2 48.4Big High School 17 3.4 3.4 51.8Low Quality Student Body 13 2.6 2.6 54.4Lack of Post Graduate Programs 9 1.8 1.8 56.2Only Care About Revenue 3 .6 .6 56.8Other 15 3.0 3.0 59.8Nothing 156 31.1 31.1 90.8Do Not Know 46 9.2 9.2 100.0Total 502 100.0 100.0
Q12 Are You or Any Member of Your Family Employed by UVSCFrequency Percent Valid Cumulative
Percent PercentValid Yes 21 4.2 4.3 4.3
No 467 93.0 95.5 99.8No Answer 1 .2 .2 100.0Total 489 97.4 100.0
Missing System 13 2.6Total 502 100.0
Q13 - Have You or Any Member of Your Family Attended UVSCFrequency Percent Valid Cumulative
Percent PercentValid Yes 327 65.1 66.9 66.9
No 156 31.1 31.9 98.8No Answer 6 1.2 1.2 100.0Total 489 97.4 100.0
Missing System 13 2.6Total 502 100.0
36

Q14 - Reaction if Someone in Your Family Expressed Interest in Attending UVSCFrequency Percent Valid Cumulative
Percent Percent
Valid Encourage 394 78.5 80.6 80.6
Discourage 11 2.2 2.2 82.8
Remain Neutral 81 16.1 16.6 99.4Do Not Know 3 .6 .6 100.0
Total 489 97.4 100.0
Missing System 13 2.6Total 502 100.0
Q14a - Reason to Discourage Attending UVSCFrequency Percent Valid Cumulative
Percent Percent
Valid .00 491 97.8 97.8 97.8
Prefer a University 1 .2 .2 98.0
It is a Junior College 2 .4 .4 98.4
BYU Is Better 1 .2 .2 98.6
Not Enough Programs Offered 1 .2 .2 98.8
Not as Competitive as Other Schools 2 .4 .4 99.2
Tuition Too High 1 .2 .2 99.4
Poor Job Opportunities After Graduation 1 .2 .2 99.6Overcrowded/Not Enough Personal Attention For Students 2 .4 .4 100.0
Total 502 100.0 100.0
Q14b - Reason to Encourage Attending UVSCFrequency Percent Valid Cumulative
Percent Percent
Valid .00 55 11.0 11.0 11.0
Good Location/Close to Home 19 3.8 3.8 14.7
Good Teachers/High Quality Faculty 8 1.6 1.6 16.3
Good School in General 70 13.9 13.9 30.3
Affordable/Low Tuition 38 7.6 7.6 37.8
Good Class Size/More Personal Attention 13 2.6 2.6 40.4
Quality Academics/Programs 59 11.8 11.8 52.2Lenient Admission/Easy to Get Into 23 4.6 4.6 56.8
Good Student Community 20 4.0 4.0 60.8
Diverse Student Body 7 1.4 1.4 62.2
Wide Variety of Courses 18 3.6 3.6 65.7
Credits Transferable to BYU 3 .6 .6 66.3
Ideal for General Ed/Transferable to University 17 3.4 3.4 69.7
Easy Transition From High School 22 4.4 4.4 74.1
To Get an Education 28 5.6 5.6 79.7
Expanding/Improving Programs 1 .2 .2 79.9
Good Experience Personally 27 5.4 5.4 85.3
Upholds High Standards 3 .6 .6 85.9
One on One Attention 12 2.4 2.4 88.2
Do Not Know 59 11.8 11.8 100.0
Total 502 100.0 100.0
37

Q15a - Rate Academic Quality at UVSCFrequency Percent Valid Cumulative
Percent PercentValid Low 2 .4 .4 .4
Below Average 21 4.2 4.3 4.7Average 164 32.7 33.5 38.2Above Average 207 41.2 42.3 80.6High 84 16.7 17.2 97.8No Response 11 2.2 2.2 100.0Total 489 97.4 100.0
Missing System 13 2.6Total 502 100.0
Q15b - Rate Extent of Course Offerings at UVSCFrequency Percent Valid Cumulative
Percent PercentValid Low 6 1.2 1.2 1.2
Below Average 26 5.2 5.3 6.5Average 208 41.4 42.5 49.1
Above Average 168 33.5 34.4 83.4High 65 12.9 13.3 96.7No Response 16 3.2 3.3 100.0Total 489 97.4 100.0
Missing System 13 2.6Total 502 100.0
Q15c - Rate Competency of Faculty at UVSCFrequency Percent Valid Cumulative
Percent PercentValid Low 3 .6 .6 .6
Below Average 17 3.4 3.5 4.1
Average 149 29.7 30.5 34.6Above Average 193 38.4 39.5 74.0High 105 20.9 21.5 95.5No Response 22 4.4 4.5 100.0Total 489 97.4 100.0
Missing System 13 2.6Total 502 100.0
Q15d Rate Academic Advising For Students at UVSCFrequency Percent Valid Cumulative
Percent PercentValid Low 12 2.4 2.5 2.5
Below Average 37 7.4 7.6 10.0Average 164 32.7 33.5 43.6Above Average 165 32.9 33.7 77.3High 81 16.1 16.6 93.9No Response 30 6.0 6.1 100.0Total 489 97.4 100.0
Missing System 13 2.6Total 502 100.0
38

Q15e Rate Athletic Programs at UVSCFrequency Percent Valid Cumulative
Percent PercentValid Low 13 2.6 2.7 2.7
Below Average 77 15.3 15.7 18.4Average 205 40.8 41.9 60.3Above Average 116 23.1 23.7 84.0High 49 9.8 10.0 94.1
No Response 29 5.8 5.9 100.0Total 489 97.4 100.0
Missing System 13 2.6Total 502 100.0
Q15f - Rate Quality of Student Body at UVSCFrequency Percent Valid Cumulative
Percent PercentValid Low 8 1.6 1.6 1.6
Below Average 19 3.8 3.9 5.5Average 155 30.9 31.7 37.2Above Average 190 37.8 38.9 76.1
High 98 19.5 20.0 96.1
No Response 19 3.8 3.9 100.0Total 489 97.4 100.0
Missing System 13 2.6Total 502 100.0
Q15g - Rate the Ratio of Teachers to Students at UVSCFrequency Percent Valid Cumulative
Percent PercentValid Low 10 2.0 2.0 2.0
Below Average 24 4.8 4.9 7.0.
Average 176 35.1 36.0 42.9Above Average 156 31.1 31.9 74.8High 88 17.5 18.0 92.8No Response 35 7.0 7.2 100.0Total 489 97.4 100.0
Missing System 13 2.6Total 502 100.0
Q15h Rate UVSC in Preparing Students for the FutureFrequency Percent Valid Cumulative
Percent PercentValid Low 4 .8 .8 .8
Below Average 16 3.2 3.3 4.1
Average 128 25.5 26.2 30.3Above Average 219 43.6 44.8 75.1
High 104 20.7 21.3 96.3No Response 18 3.6 3.7 100.0Total 489 97.4 100.0
Missing System 13 2.6Total 502 100.0
39

Q15i Rate the Reputation of the Institution at UVSCFrequency Percent Valid Cumulative
Percent Percent
Valid Low 6 1.2 1.2 1.2
Below Average 22 4.4 4.5 5.7
Average 127 25.3 26.0 31.7Above Average 199 39.6 40.7 72.4High 123 24.5 25.2 97.5No Response 12 2.4 2.5 100.0Total 489 97.4 100.0
Missing System 13 2.6Total 502 100.0
Q15j Rate Quality of Vocational-Technical Programs at UVSCFrequency Percent Valid Cumulative
Percent Percent
Valid Low 2 .4 .4 .4
Below Average 14 2.8 2.9 3.3Average 107 21.3 21.9 25.2Above Average 205 40.8 41.9 67.1
High 139 27.7 28.4 95.5No Response 22 4.4 4.5 100.0Total 489 97.4 100.0
Missing System 13 2.6Total 502 100.0
Q15k Rate Quality of General Education Programs at UVSCFrequency Percent Valid Cumulative
Percent Percent
Valid Low 6 1.2 1.2 1.2
Below Average 11 2.2 2.2 3.5Average 123 24.5 25.2 28.6Above Average 221 44.0 45.2 73.8High 108 21.5 22.1 95.9No Response 20 4.0 4.1 100.0Total 489 97.4 100.0
Missing System 13 2.6Total 502 100.0
Q151 Rate Quality of Religious Programs and Support at UVSCFrequency Percent Valid Cumulative
Percent Percent
Valid Low 10 2.0 2.0 2.0Below Average 11 2.2 2.2 4.3Average 116 23.1 23.7 28.0Above Average 162 32.3 33.1 61.1
High 167 33.3 34.2 95.3No Response 23 4.6 4.7 100.0Total 489 97.4 100.0
Missing System 13 2.6Total 502 100.0
40

Q16 - What Could UVSC do to Attract More StudentsFrequency Percent Valid Cumulative
Percent PercentValid .00 73 14.5 14.5 14.5
More 4 Year Degrees/Programs 61 12.2 12.2 26.7More Scholarships 11 2.2 2.2 28.9Better Location 5 1.0 1.0 29.9Lower Tuition 33 6.6 6.6 36.5Improve Parking/Traffic 16 3.2 3.2 39.6Advertise 37 7.4 7.4 47.0Expand Sports Programs 4 .8 .8 47.8More Night/Weekend Classes 12 2.4 2.4 50.2Keep Classes Small 3 .6 .6 50.8Keep Doing What They Are Doing 38 7.6 7.6 58.4Raise Academic Standards 10 2.0 2.0 60.4Improve/Expand Student Housing 3 .6 .6 61.0Wider Variety of Classes/Programs 16 3.2 3.2 64.1
Community Classes/Programs 1 .2 .2 64.3More Challenging Courses/Programs 3 .6 .6 64.9More Competent Faculty 16 3.2 3.2 68.1More Buildings/Needs More Room 4 .8 .8 68.9Currently Attending 5 1.0 1.0 69.9Family/Friends Attending 6 1.2 1.2 71.1Become a University 5 1.0 1.0 72.1
More Financial Aid/Scholarships 3 .6 .6 72.7Build New Locations 6 1.2 1.2 73.9More Transfer Credit Programs 5 1.0 1.0 74.9Be More Diversified 2 .4 .4 75.3Nothing 53 10.6 10.6 85.9Do Not Know 71 14.1 14.1 100.0
Total 502 100.0 100.0
Q17 Utah County Response Without Over Sample (N=502)Frequency Percent Valid Cumulative
Percent PercentValid Provo/Orem 324 64.5 66.3 66.3
Southern Utah County 83 16.5 17.0 83.2Northern Utah County 81 16.1 16.6 99.8Undecided 1 .2 .2 100.0Total 489 97.4 100.0
Missing System 13 2.6Total 502 100.0
Q17 Utah County Response With Over Sample (N=802)Frequency Percent Valid Cumulative
Percent PercentValid Provo/Orem 462 57.6 59.9 59.9
Southern Utah County 157 19.6 20.4 80.3Northern Utah County 149 18.6 19.3 99.6Undecided 3 .4 .4 100.0Total 771 96.1 100.0
Missing System 31 3.9Total 802 100.0
41

Q17a South Valley Response With Over Sample (N=802)Frequency Percent Valid Cumulative
Percent PercentValid Not Applicable 645 80.4 80.4 80.4
Spanish Fork 67 8.4 8.4 88.8Payson 30 3.7 3.7 92.5Santaquin 7 .9 .9 93.4Springville 26 3.2 3.2 96.6Provo 8 1.0 1.0 97.6Beaver 1 .1 .1 97.8St George 1 .1 .1 97.9Nephi 5 .6 .6 98.5Mapleton 1 .1 .1 98.6Cedar City 3 .4 .4 99.0Mona 1 .1 .1 99.1
Salem 2 .2 .2 99.4Richfield 1 .1 .1 99.5Do not Know 4 .5 .5 100.0Total 802 100.0 100.0
Q17b - North Valley Response With Over Sample (N=802)Frequency Percent Valid Cumulative
Percent PercentValid Not Applicable 653 81.4 81.4 81.4
American Fork 55 6.9 6.9 88.3Lehi 45 5.6 5.6 93.9Alpine 4 .5 .5 94.4Highland 12 1.5 1.5 95.9Pleasant Grove 21 2.6 2.6 98.5North Orem 3 .4 .4 98.9Sandy 1 .1 .1 99.0Eagle Mountain 1 .1 .1 99.1Draper 2 .2 .2 99.4Salt Lake City 1 .1 .1 99.5Cedar Fort 1 .1 .1 99.6Lindon 1 .1 .1 99.8Heber 1 .1 .1 99.9Do not Know 1 .1 .1 100.0Total 802 100.0 100.0
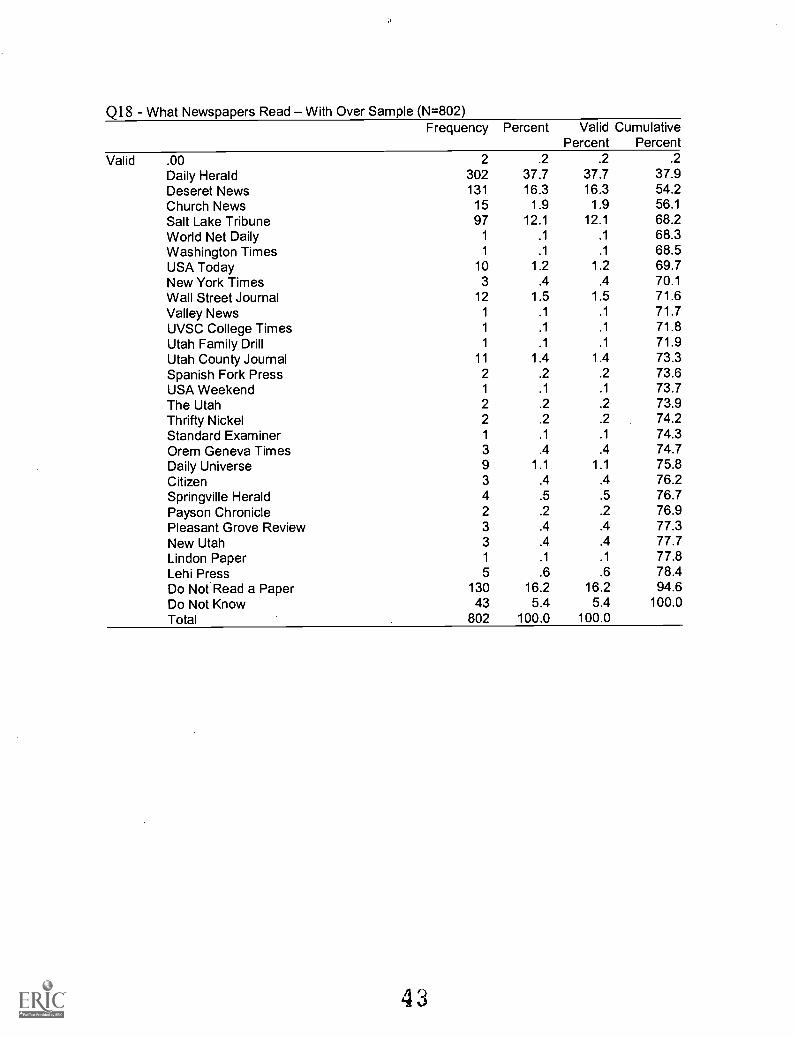
Q18 What Newspapers Read With Over Sample (N=802)Frequency Percent Valid Cumulative
Percent PercentValid .00 2 .2 .2 .2
Daily Herald 302 37.7 37.7 37.9Deseret News 131 16.3 16.3 54.2Church News 15 1.9 1.9 56.1
Salt Lake Tribune 97 12.1 12.1 68.2World Net Daily 1 .1 .1 68.3Washington Times 1 .1 .1 68.5USA Today 10 1.2 1.2 69.7New York Times 3 .4 .4 70.1
Wall Street Journal 12 1.5 1.5 71.6Valley News 1 .1 .1 71.7UVSC College Times 1 .1 .1 71.8Utah Family Drill 1 .1 .1 71.9Utah County Journal 11 1.4 1.4 73.3Spanish Fork Press 2 .2 .2 73.6USA Weekend 1 .1 .1 73.7The Utah 2 .2 .2 73.9Thrifty Nickel 2 .2 .2 74.2Standard Examiner 1 .1 .1 74.3Orem Geneva Times 3 .4 .4 74.7Daily Universe 9 1.1 1.1 75.8Citizen 3 .4 .4 76.2Springville Herald 4 .5 .5 76.7Payson Chronicle 2 .2 .2 76.9Pleasant Grove Review 3 .4 .4 77.3New Utah 3 .4 .4 77.7Lindon Paper 1 .1 .1 77.8Lehi Press 5 .6 .6 78.4Do Not Read a Paper 130 16.2 16.2 94.6Do Not Know 43 5.4 5.4 100.0Total 802 100.0 100.0
43
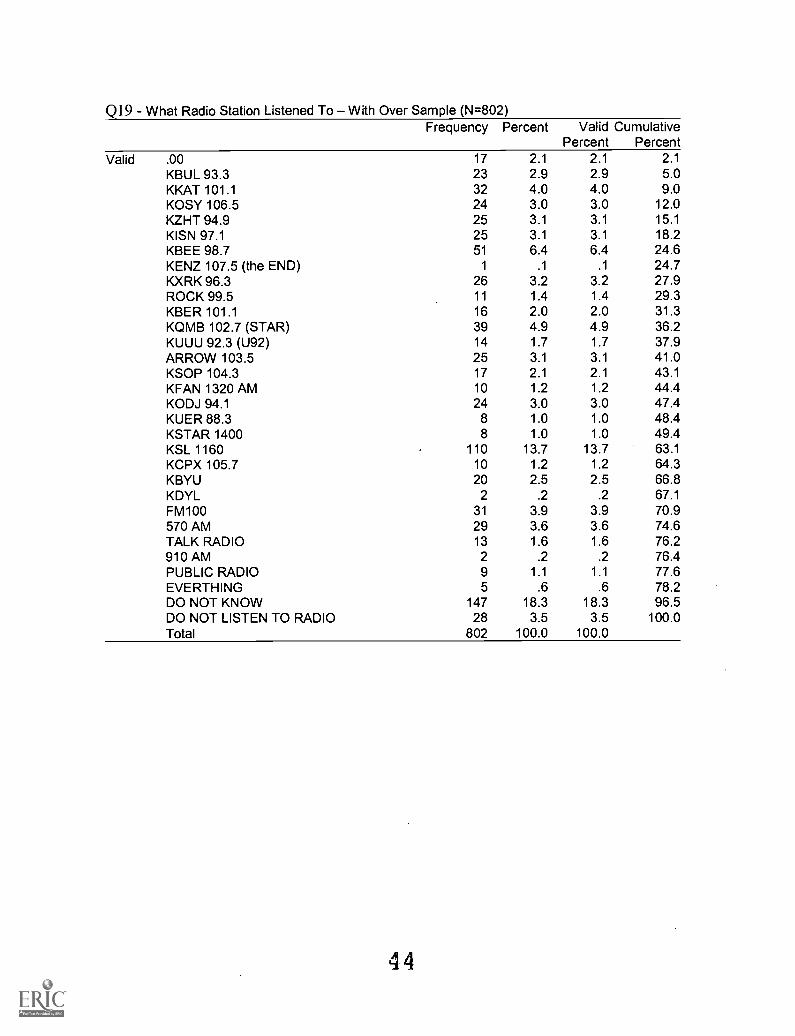
Q19 - What Radio Station Listened To With Over Sample (N=802)Frequency Percent Valid Cumulative
Percent PercentValid .00 17 2.1 2.1 2.1
KBUL 93.3 23 2.9 2.9 5.0KKAT 101.1 32 4.0 4.0 9.0KOSY 106.5 24 3.0 3.0 12.0KZHT 94.9 25 3.1 3.1 15.1KISN 97.1 25 3.1 3.1 18.2KBEE 98.7 51 6.4 6.4 24.6KENZ 107.5 (the END) 1 .1 .1 24.7KXRK 96.3 26 3.2 3.2 27.9ROCK 99.5 11 1.4 1.4 29.3KBER 101.1 16 2.0 2.0 31.3KQMB 102.7 (STAR) 39 4.9 4.9 36.2KUUU 92.3 (U92) 14 1.7 1.7 37.9ARROW 103.5 25 3.1 3.1 41.0KSOP 104.3 17 2.1 2.1 43.1KFAN 1320 AM 10 1.2 1.2 44.4KODJ 94.1 24 3.0 3.0 47.4KUER 88.3 8 1.0 1.0 48.4KSTAR 1400 8 1.0 1.0 49.4KSL 1160 110 13.7 13.7 63.1KCPX 105.7 10 1.2 1.2 64.3KBYU 20 2.5 2.5 66.8KDYL 2 .2 .2 67.1FM100 31 3.9 3.9 70.9570 AM 29 3.6 3.6 74.6TALK RADIO 13 1.6 1.6 76.2910 AM 2 .2 .2 76.4PUBLIC RADIO 9 1.1 1.1 77.6EVERTHING 5 .6 .6 78.2DO NOT KNOW 147 18.3 18.3 96.5DO NOT LISTEN TO RADIO 28 3.5 3.5 100.0Total 802 100.0 100.0
44
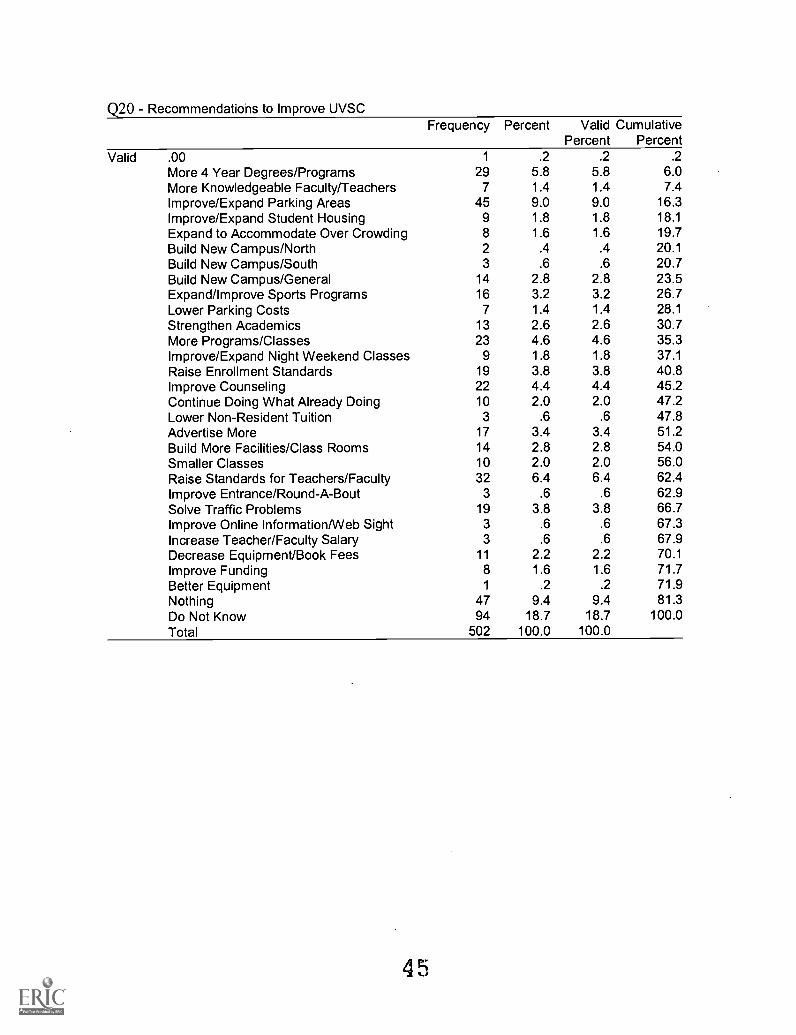
Q20 - Recommendations to Improve UVSCFrequency Percent Valid Cumulative
Percent PercentValid .00 1 .2 .2 .2
More 4 Year Degrees/Programs 29 5.8 5.8 6.0More Knowledgeable Faculty/Teachers 7 1.4 1.4 7.4Improve/Expand Parking Areas 45 9.0 9.0 16.3Improve/Expand Student Housing 9 1.8 1.8 18.1
Expand to Accommodate Over Crowding 8 1.6 1.6 19.7Build New Campus/North 2 .4 .4 20.1Build New Campus/South 3 .6 .6 20.7Build New Campus/General 14 2.8 2.8 23.5Expand/Improve Sports Programs 16 3.2 3.2 26.7Lower Parking Costs 7 1.4 1.4 28.1Strengthen Academics 13 2.6 2.6 30.7More Programs/Classes 23 4.6 4.6 35.3Improve/Expand Night Weekend Classes 9 1.8 1.8 37.1Raise Enrollment Standards 19 3.8 3.8 40.8Improve Counseling 22 4.4 4.4 45.2Continue Doing What Already Doing 10 2.0 2.0 47.2Lower Non-Resident Tuition 3 .6 .6 47.8Advertise More 17 3.4 3.4 51.2Build More Facilities/Class Rooms 14 2.8 2.8 54.0Smaller Classes 10 2.0 2.0 56.0Raise Standards for Teachers/Faculty 32 6.4 6.4 62.4Improve Entrance/Round-A-Bout 3 .6 .6 62.9Solve Traffic Problems 19 3.8 3.8 66.7Improve Online Information/Web Sight 3 .6 .6 67.3Increase Teacher/Faculty Salary 3 .6 .6 67.9Decrease Equipment/Book Fees 11 2.2 2.2 70.1Improve Funding 8 1.6 1.6 71.7Better Equipment 1 .2 .2 71.9Nothing 47 9.4 9.4 81.3Do Not Know 94 18.7 18.7 100.0Total 502 100.0 100.0
45

- Respondent Age GroupsFrequency Percent Valid Cumulative
Percent PercentValid 18 20 32 6.4 6.4 6.4
21 24 81 16.1 16.1 22.525 29 79 15.7 15.7 38.230 34 50 10.0 10.0 48.235 39 56 11.2 11.2 59.440 44 33 6.6 6.6 65.945 49 39 7.8 7.8 73.750 54 33 6.6 6.6 80.355 59 19 3.8 3.8 84.160 64 14 2.8 2.8 86.965 69 14 2.8 2.8 89.670 74 20 4.0 4.0 93.675 and Older 26 5.2 5.2 98.8No Response 6 1.2 1.2 100.0Total 502 100.0 100.0
D2 - Formal Education LevelFrequency Percent Valid Cumulative
Percent PercentValid Less Than High School 9 1.8 1.8 1.8
High School Graduate 76 15.1 15.2 17.0Technical - Vocational 28 5.6 5.6 22.6Some College 201 40.0 40.2 62.8College Graduate 124 24.7 24.8 87.6Post Graduate 61 12.2 12.2 99.8No Response 1 .2 .2 100.0Total 500 99.6 100.0
Missing System 2 .4Total 502 100.0
D4 - Total Annual Family IncomeFrequency Percent Valid Cumulative
Percent PercentValid Under $15,000 37 7.4 7.4 7.4
Between $15,000 and $25,000 59 11.8 11.8 19.1Between $25,000 and $35,000 77 15.3 15.3 34.5Between $35,000 and $50,000 113 22.5 22.5 57.0Between $50,000 and $75,000 96 19.1 19.1 76.1Between $75,000 and 100,000 34 6.8 6.8 82.9$100,000 Or More 32 6.4 6.4 89.2Did Not Answer 54 10.8 10.8 100.0Total 502 100.0 100.0
46

D5 - Respondents Zip CodesFrequency Percent Valid Cumulative
Percent PercentValid 84003 43 8.6 8.6 8.6
84004 7 1.4 1.4 10.084013 3 .6 .6 10.684015 1 .2 .2 10.884042 9 1.8 1.8 12.584043 34 6.8 6.8 19.384046 1 .2 .2 19.584049 1 .2 .2 19.7
84051 1 .2 .2 19.984057 57 11.4 11.4 31.384058 37 7.4 7.4 38.684062 40 8.0 8.0 46.684097 23 4.6 4.6 51.284098 1 .2 .2 51.484402 1 .2 .2 51.684601 51 10.2 10.2 61.884604 46 9.2 9.2 70.984606 27 5.4 5.4 76.384651 28 5.6 5.6 81.984653 7 1.4 1.4 83.384655 6 1.2 1.2 84.584660 26 5.2 5.2 89.684663 30 6.0 6.0 95.684664 11 2.2 2.2 97.884666 1 .2 .2 98.085641 1 .2 .2 98.299206 1 .2 .2 98.499999 8 1.6 1.6 100.0Total 502 100.0 100.0

3612E/ 2001 Ei9: 37 121020680;35 ERIC CLEARINGHOUSE
U.S. Department of EducationOffice of Educational Research and Improvement (OERI)
National Library of Education (NLE)Educational Resources information Center (ERIC)
REPRODUCTION RELEASE(Specific Document)
L DOCUMENT IDENTIFICATION:
/./oirrei. ollICCY /$2)cirrt 1/111.-CY Si/lit/SY Peaceppevas DF c/7"4/1
WILLY SrAra eowE4e 4Ar0 7?f A4EaD FDA 4 Ze.swe C47,0(15
PAGE 01
i_.Author(s): ele-r R s-
I Corporate Source:Publication Date:
ZDO
II. REPRODUCTION RELEASE:In order to disseminate as widely as possible timely end significant materials of interest to the educational community,documents announced in the
monthly abstract iourital Of the ERIC system, Resouroue In Education (RIE), are usually made available to users in microfiche, reproduced paper copy,
and electronic media. and sold through the ERIC Document Reproduction Service (EDRS). Credit is given to the source of each document, and if
reproduction release Is granted, one of the following notices is affixed to the document,
If permission Is granted to reproduce and disseminate the Identified document,please CHECK ONE of the following three optione end oign ot the bottom
of the page.The sample sticker Shrhkr1 below vriiI be
afltsed to all Level 1 doCUrnentc
PERMISSION TO REPRODUCE ANDDISSEMINATE THIS MATERIAL HAS
BEEN GRANTED BY
TO THE EnCATIONAL RESOURCESiNFORMATiON CENTER(ERIC)
Level 1
Creek here for Level I release, pornetlingreproduction and dissernhaflOrl in microome.or atner
ERiC archival media electrunlc) and papercopy.
Signhere,--)please
Tne =mote cocker ehown below MI beaffixed to all Level 2A document!
PERMISSION TC REPRODUCE ANDDISSEMINATE THIS MATERIAL IN
MICROFICHE. AND IN ELECTRONIC MEDIAFOR ERIC COLLECTION SUBSCRIBERS ONLY,
HAS BEEN GRANTED BY
TO THE EDUCATIONAL RESOURCESINFORMATION CENTER (ERIC)
2A
Level IA
Check here for Level gA miasma, permittingreproduction and cilseentInatlon In rnicmticher and In
electronic media for ERIC archival collectionsubscribers only
The sample sticker shown beibui Will beaffixed to all Levet 2B documents
PERMISSION To REPRODUCE ANCDISSEMINATE THIS MATERIAL IN
MICROFICHE ONLY HAS BEEN GRANTED BY
TO THE EDUCATIONAL RESOURCESINFORMATION CENTER (ERIC)
2B
Level 28
Cheek here for Level 2R release. permittingreproduction end diteisminstion in microfiche only
Documents wilt oe processed as Indlcated provided repradtmtlen quality pennItaIf permission in reproduce is grantee, but no boa to °necked, documents will be Pro,:esaad at Leval 1.
1 hereby grant to the Educational Resources .inftumation Center (ERIC) nonexclusive permission to reproduce and disseminate thit, documentas indicated above. Reproduction from the ERIC microfiche or electronic media by persons other than ERIC employees and its systemcontractorsmquiresperntissfon from the copyright holder. Exception Is made for non-profft coproduction by !trades and other setvice awnoiesto satisfy information needs ducetors in response to disonste Inquiries.
Syr.stur
TRAVVAL /1-?YE CoLtELE-jatA3 U IfiarS(TY ?AegiAJAY
brzrtm (iT" Vq0s?
Piro f4teelllositicrigik
.441.C.49S°
E. Adchoms,Jacobs ioe-
"1'101 74q-7f2VDet.4 I
(over)