report to the nation - college board · high school, by subject area, compared to the nation 1.1...
TRANSCRIPT

South Dakota Supplement February 10, 2010
The 6th Annual
Report to the Nation

Part I: Graduating Class of 2009
South Dakota Public Schools: High School Class of 2009
Access to AP® by Race/Ethnicity ................................................................................. 2
AP Participation by Subject Area ................................................................................. 3
AP Equity and Excellence ............................................................................................. 4
Most Popular AP Exams ............................................................................................... 5
Part II: AP Participation and Performance 5-Year Trends
South Dakota Public Schools: High School Classes of 2009, 2008 and 2004
All Students ................................................................................................................. 6
Black or African American Students ............................................................................ 7
Hispanic or Latino Students ......................................................................................... 8
American Indian or Alaska Native Students ............................................................... 9
Asian, Asian American or Pacific Islander Students ................................................. 10
White Students ......................................................................................................... 11
Low-Income Students ................................................................................................ 12
Note: Throughout this report, public high school graduates represent projections supplied in “Knocking on the College Door” (2008), Western Interstate Commission for Higher Education.
© 2010 The College Board. College Board, AP and the acorn logo are registered trademarks of the College Board. inspiring minds is a trademark owned by the College Board. All other products and services may be trademarks of their respective owners. Visit the College Board on the Web: www.collegeboard.com.
1
South DakotaThe 6th Annual | AP® Report to the Nation
Supplement

South Dakota Public Schools: High School Class of 2009
Access to AP® by Race/Ethnicity
Race/Ethnicity of AP® Examinees vs. High School Seniors in South Dakota
Black or African American
Asian, Asian American
or Pacific Islander
Hispanicor Latino
American Indianor Alaska Native
White
0.8 2.31.5 1.3 1.7 1.8 1.05.3
91.989.7
0
10
20
30
40
50
60
70
80
90
100
AP Examinee Population Overall Student Population
Perc
ent
Note: Please note that stated race/ethnicity options for AP do not add up to 100; the additional AP race/ethnicity options not shown are “Other” and “Not Stated.”
2
South DakotaThe 6th Annual | AP® Report to the Nation
Supplement

South Dakota Public Schools: High School Class of 2009
AP Participation by Subject Area
•15.9percentofthegraduatingclassof2009tookatleastoneAPExamduringhighschool.Thiscomparesto26.5percentforthenation.
•8.9percentofthegraduatingclassof2009tookatleastoneEnglishAPExam—morethaninanyothersubjectarea.
Percent of South Dakota Students Who Took an AP Exam During High School, by Subject Area, Compared to the Nation
Note: Throughout this report where “subject areas” appear, these include data from multiple AP Exams. • Science is composed of Biology, Chemistry, Environmental Science, Physics B, Physics C: Electricity & Magnetism and Physics C: Mechanics. • Math is composed of Calculus AB, Calculus BC, Computer Science A, Computer Science AB and Statistics. • English is composed of English Language and English Literature. • Social Science is composed of Macroeconomics, Microeconomics, European History, Government & Politics: Comparative, Government & Politics: U.S.,
Human Geography, Psychology, U.S. History and World History. • Art is composed of Art History, Music Theory, Studio Art: 2-D Design, Studio Art: 3-D Design and Studio Art: Drawing.• Language is composed of Chinese Language and Culture, French Language, French Literature, German Language, Italian Language and Culture, Japanese
Language and Culture, Latin Literature, Latin: Vergil, Spanish Language and Spanish Literature.
1.7
8.9
0.5
3.8
7.3
9.7
6.2
8.87.1
16.6 15.9
26.5
13.0
0.40
10
20
30
40
50
South Dakota Nation
Perc
ent
Art English Language Math Science Social Science All
3
South DakotaThe 6th Annual | AP® Report to the Nation
Supplement
South Dakota Public Schools: High School Class of 2009
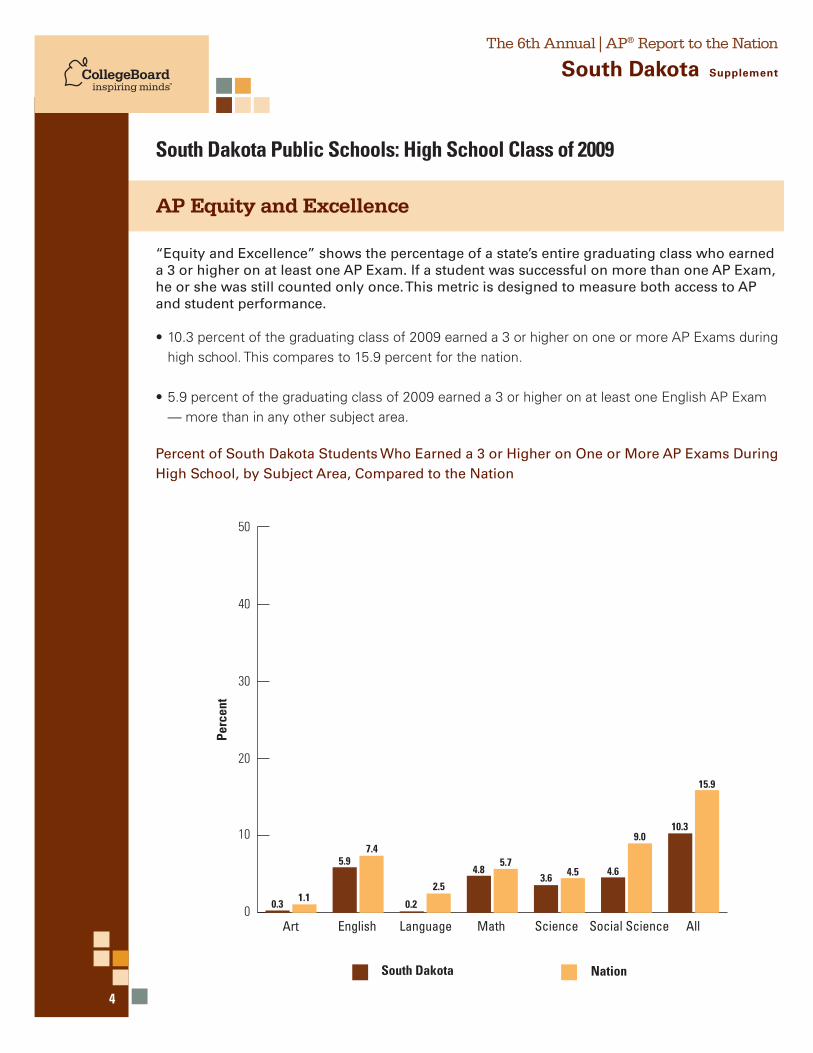
AP Equity and Excellence
“Equity and Excellence” shows the percentage of a state’s entire graduating class who earned a 3 or higher on at least one AP Exam. If a student was successful on more than one AP Exam, he or she was still counted only once. This metric is designed to measure both access to AP and student performance.
•10.3percentofthegraduatingclassof2009earneda3orhigherononeormoreAPExamsduringhighschool.Thiscomparesto15.9percentforthenation.
•5.9percentofthegraduatingclassof2009earneda3orhigheronatleastoneEnglishAPExam—morethaninanyothersubjectarea.
Percent of South Dakota Students Who Earned a 3 or Higher on One or More AP Exams During High School, by Subject Area, Compared to the Nation
1.1
5.9
0.2
2.5
4.85.7
3.6 4.5 4.6
9.010.3
15.9
7.4
0.30
10
20
30
40
50
South Dakota Nation
Perc
ent
Art English Language Math Science Social Science All
4
South DakotaThe 6th Annual | AP® Report to the Nation
Supplement

South Dakota Public Schools: High School Class of 2009
Most Popular Exams
10 Most Popular Exams in South Dakota
0 100 200 300 400 500
Physics B
Statistics
Psychology
Chemistry
Government & Politics: U.S.
Biology
U.S. History
English Language
English Literature
Calculus AB475
311465
312454
315353
198307
148188
125183
129165
114146
10297
69
All AP Exams All AP Exams earning a 3 or higher
Note: “Most popular” is measured by the number of AP Exams taken. The number of exams receiving a 3 or higher is not considered when ranking the 10 most popular AP Exams.
Rank Exam Number of Exams Number of Exams with Scores of 3 or Higher
1 Calculus AB 475 311
2 English Literature 465 312
3 English Language 454 315
4 U.S. History 353 198
5 Biology 307 148
6 Government & Politics: U.S. 188 125
7 Chemistry 183 129
8 Psychology 165 114
9 Statistics 146 102
10 Physics B 97 69
5
South DakotaThe 6th Annual | AP® Report to the Nation
Supplement

South Dakota Public Schools: High School Classes of 2009, 2008 and 2004
AP Participation and Performance
All Students
•1,326studentsfromthegraduatingclassof2009tookatleastoneAPExamduringhighschoolcomparedto1,349intheclassof2008and1,194intheclassof2004.
•859studentsfromthegraduatingclassof2009earneda3orhigheronatleastoneAPExamduringhighschoolcomparedto817intheclassof2008and737intheclassof2004.
AP Participation and Performance in South Dakota 2004–2009
5 Years Ago (2004) 1 Year Ago (2008) Current Year (2009)0
10
20
30
40
50
60
70
80
90
100
Percent of graduating class participating in AP during high school
Percent of graduating class earning a 3 or higher on at least one AP Exam during high school
Perc
ent
8.2
13.316.0
9.7
15.9
10.3
6
South DakotaThe 6th Annual | AP® Report to the Nation
Supplement

South Dakota Public Schools: High School Classes of 2009, 2008 and 2004
AP Participation and Performance
Black or African American Students
•10blackorAfricanAmericanstudentsfromthegraduatingclassof2009tookatleastoneAPExamduringhighschoolcomparedtofourintheclassof2008andfiveintheclassof2004.
•SixblackorAfricanAmericanstudentsfromthegraduatingclassof2009earneda3orhigheronatleastoneAPExamduringhighschoolcomparedtooneintheclassof2008andtwointheclassof2004.
Black or African American Students’ AP Participation and Performance in South Dakota 2004–2009
5 Years Ago (2004) 1 Year Ago (2008) Current Year (2009)
0.30.4 1.20
10
20
30
40
50
60
70
80
90
100
Percent of AP examinee population who are black or African American
Percent of AP examinee population with at least one AP Exam score of 3 or higher who are black or African American
Percent of graduating class who are black or African American
0.10.3 1.1 0.70.8 1.5
Perc
ent
7
South DakotaThe 6th Annual | AP® Report to the Nation
Supplement

South Dakota Public Schools: High School Classes of 2009, 2008 and 2004
AP Participation and Performance
Hispanic or Latino Students
•23HispanicorLatinostudentsfromthegraduatingclassof2009tookatleastoneAPExamduringhighschoolcomparedto12intheclassof2008and12intheclassof2004.
•12HispanicorLatinostudentsfromthegraduatingclassof2009earneda3orhigheronatleastoneAPExamduringhighschoolcomparedtosevenintheclassof2008andeightintheclassof2004.
Hispanic or Latino Students’ AP Participation and Performance in South Dakota 2004–2009
5 Years Ago (2004) 1 Year Ago (2008) Current Year (2009)
1.11.0 1.10
10
20
30
40
50
60
70
80
90
100
Percent of AP examinee population who are Hispanic or Latino
Percent of AP examinee population with at least one AP Exam score of 3 or higher who are Hispanic or Latino
Percent of graduating class who are Hispanic or Latino
0.90.9 1.4 1.41.7 1.8
Perc
ent
8
South DakotaThe 6th Annual | AP® Report to the Nation
Supplement

South Dakota Public Schools: High School Classes of 2009, 2008 and 2004
AP Participation and Performance
American Indian or Alaska Native Students
•13AmericanIndianorAlaskaNativestudentsfromthegraduatingclassof2009tookatleastoneAPExamduringhighschoolcomparedto14intheclassof2008andsixintheclassof2004.
•FiveAmericanIndianorAlaskaNativestudentsfromthegraduatingclassof2009earneda3orhigheronatleastoneAPExamduringhighschoolcomparedtoeightintheclassof2008andthreeintheclassof2004.
American Indian or Alaska Native Students’ AP Participation and Performance in South Dakota 2004–2009
5 Years Ago (2004) 1 Year Ago (2008) Current Year (2009)
0.40.54.6
0
10
20
30
40
50
60
70
80
90
100
Percent of AP examinee population who are American Indian or Alaska Native
Percent of AP examinee population with at least one AP Exam score of 3 or higher who are American Indian or Alaska Native
Percent of graduating class who are American Indian or Alaska Native
1.01.05.2
0.61.05.3
Perc
ent
9
South DakotaThe 6th Annual | AP® Report to the Nation
Supplement

South Dakota Public Schools: High School Classes of 2009, 2008 and 2004
AP Participation and Performance
Asian, Asian American or Pacific Islander Students
•31Asian,AsianAmericanorPacificIslanderstudentsfromthegraduatingclassof2009tookatleastoneAPExamduringhighschoolcomparedto30intheclassof2008and30intheclassof2004.
•27Asian,AsianAmericanorPacificIslanderstudentsfromthegraduatingclassof2009earneda3orhigheronatleastoneAPExamduringhighschoolcomparedto15intheclassof2008and19intheclassof2004.
Asian, Asian American or Pacific Islander Students’ AP Participation and Performance in South Dakota 2004–2009
5 Years Ago (2004) 1 Year Ago (2008) Current Year (2009)
2.62.5 1.30
10
20
30
40
50
60
70
80
90
100
Percent of AP examinee population who are Asian, Asian American or Pacific Islander
Percent of AP examinee population with at least one AP Exam score of 3 or higher who are Asian, Asian American or Pacific Islander
Percent of graduating class who are Asian, Asian American or Pacific Islander
1.82.2 1.43.12.3 1.3
Perc
ent
10
South DakotaThe 6th Annual | AP® Report to the Nation
Supplement

South Dakota Public Schools: High School Classes of 2009, 2008 and 2004
AP Participation and Performance
White Students
•1,218whitestudentsfromthegraduatingclassof2009tookatleastoneAPExamduringhighschoolcomparedto1,264intheclassof2008and1,102intheclassof2004.
•791whitestudentsfromthegraduatingclassof2009earneda3orhigheronatleastoneAPExamduringhighschoolcomparedto769intheclassof2008and682intheclassof2004.
White Students’ AP Participation and Performance in South Dakota 2004–2009
5 Years Ago (2004) 1 Year Ago (2008) Current Year (2009)
92.592.3 91.8
0
10
20
30
40
50
60
70
80
90
100
Percent of AP examinee population who are white
Percent of AP examinee population with at least one AP Exam score of 3 or higher who are white
Percent of graduating class who are white
94.193.790.9 92.191.9 89.7
Perc
ent
11
South DakotaThe 6th Annual | AP® Report to the Nation
Supplement

South Dakota Public Schools: High School Classes of 2009, 2008 and 2004
AP Participation and Performance
Low-Income Students
•80low-incomestudentsfromthegraduatingclassof2009tookatleastoneAPExamduringhighschoolcomparedto75intheclassof2008and47intheclassof2004.
•45low-incomestudentsfromthegraduatingclassof2009earneda3orhigheronatleastoneAPExamduringhighschoolcomparedto37intheclassof2008and27intheclassof2004.
Low-Income Students’ AP Participation and Performance in South Dakota 2004–2009
5 Years Ago (2004) 1 Year Ago (2008) Current Year (2009)0
10
20
30
40
50
60
70
80
90
100
Percent of AP examinee population who are low-income
Percent of AP examinee population with at least one AP Exam score of 3 or higher who are low-income
Perc
ent
3.73.9 5.6 4.5 6.0 5.2
12
South DakotaThe 6th Annual | AP® Report to the Nation
Supplement