report on key comparison apmp.auv.a-k3 · apmp.auv.a–k3 1 december, 2008 dr hyu-sang kwon ......
TRANSCRIPT

1
REPORT ON KEY COMPARISON
APMP.AUV.A–K3
1 December, 2008
Dr Hyu-sang Kwon
Korea Research Institute of Standards and Science
(KRISS)

2
Abstract A regional key-comparison APMP.AUV.A–K3 has been carried out for the
pressure sensitivity of laboratory standard microphones. The Korea Research Institute of Standards and Science (KRISS) was the pilot laboratory for this project. Two LS2P microphones were circulated through ten national metrology institutes and calibrated in the frequency range from 31.5 Hz to 25 kHz (31.5 kHz was optional). Deviations from the mean value for all participants are within their declared expanded uncertainties for all frequencies except the optional 31.5 kHz. The results will be linked to the CIPM key comparison CCAUV.A–K3 in a separate report. 1. Introduction
This is the final report for the regional key-comparison APMP.AUV.A–K3. It has taken into account the comments from the participants and has been approved by them. It has also been approved by the CCAUV.
This report includes calibration results from the participants and an outline of proposed linking to the CIPM key-comparison CCAUV.A–K3 [1]. The Korea Research Institute of Standards and Science (KRISS) prepared this report as the pilot laboratory. 2. Protocol
The basis of this key-comparison was pressure calibration of laboratory standard microphones. Two LS2P microphones, a Bruel & Kjaer type 4180 with serial number 1763688 and a Bruel & Kjaer type 4180 with serial number 2341431 were supplied by KRISS.
A technical protocol instructed participants to submit their uncertainty budget prior to the key comparison and then to report the pressure sensitivity in the frequency range from 31.5 Hz to 25 kHz (31.5 kHz was optional) and at the reference environmental conditions in their usual certificate forms. Additional information was requested on any deviation from the requirements of IEC 61094-2, together with the estimated uncertainty.
Ten national metrology institutes took part in the project, as listed in Table 1.

3
Table 1. Participants in the key-comparison APMP.AUV.A–K3. Participant Acronym Economy National Institute of Metrology (Thailand) NIMT Thailand Center for Measurement Standards Industrial Technology Research Institute
CMS/ITRI Taiwan
National Measurement Institute (Australia) NMIA Australia National Physical Laboratory of India NPLI India Standards and Calibration Laboratory SCL Hong Kong National Metrology Laboratory SIRIM Berhad
NML/SIRIM Malaysia
National Metrology Institute of Japan NMIJ Japan National Institute of Metrology NIM China National Metrology Centre Agency for Science, Technology and Research, Singapore
NMC Singapore
Korea Research Institute of Science and Standards KRISS Korea
2.1. Circulation of the microphones
This key comparison permitted international delivery services for the transportation of the microphones. Therefore KRISS paid close attention to their travelling container. The container was supplied by NMIJ and previously used in key comparison APMP.AUV.A–K1. The microphones were packaged in an aluminum box padded with cushioning material and containing small holes in the outside casing to avoid sudden shocks and to minimize extreme changes in temperature or pressure, which could cause an irreversible change in the sensitivity or degrade the stability of the microphones. The KRISS also recommended a reliable shipping agency that had handled other kinds of travelling standards previously.
Microphones were circulated from July 2006 to June 2007 and returned to the KRISS for a check calibration each time two participants completed their calibrations. The circulation proceeded exactly as planned due to the participants’ cooperation. 2.2. Measurement frequencies
The protocol specified the calibration of the microphones at the nominal frequencies as in the CCAUV.A–K3; the nominal preferred octave frequencies from 31.5 Hz to 4 kHz (i.e. 31.5, 63.0, 125.0, 250.0, 500.0, 1000.0, 2000.0 and

4
4000.0 Hz) and the nominal preferred 1/3 octave frequencies from 6.3 kHz to 25 kHz (i.e. 6.3, 8.0, 10.0, 12.5, 16.0, 20.0 and 25.0 kHz). The 31.5 kHz frequency was optional. Experience in the CIPM key comparison CCAUV.A–K3 showed that the set of frequencies to be used should be specified clearly [1] and this improvement proved to be largely effective in this key comparison. 3. Travelling standards
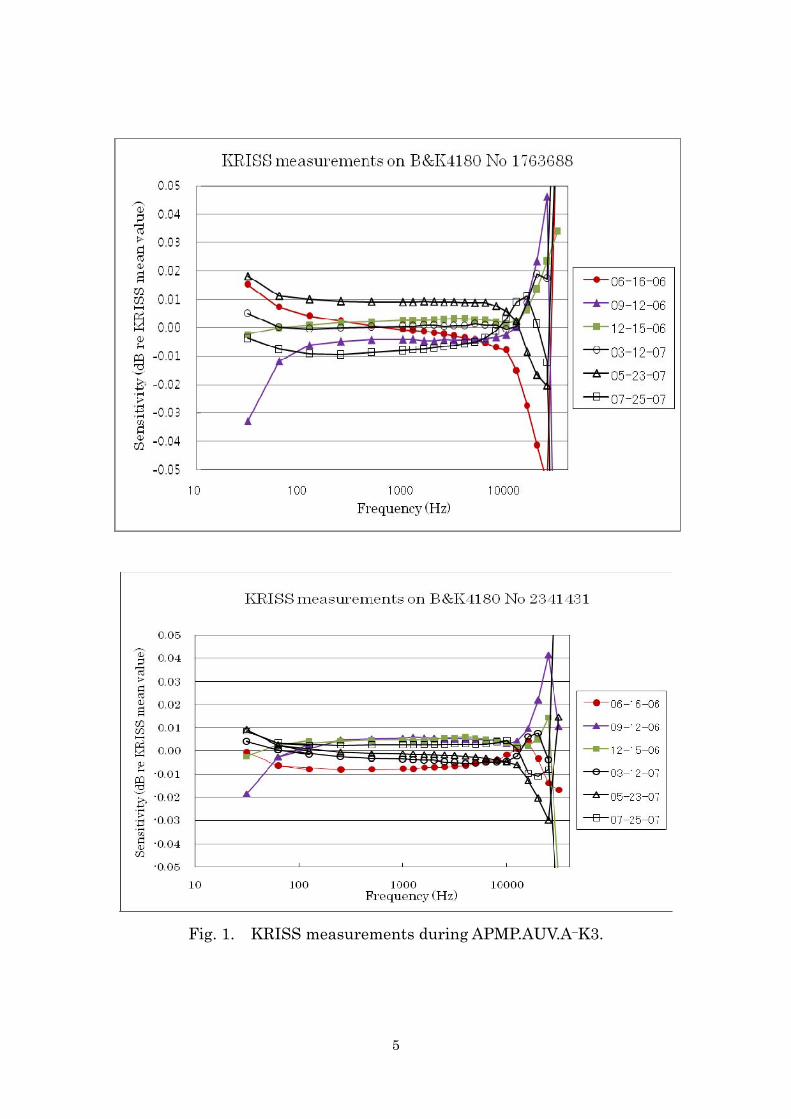
The KRISS regularly monitored the stability of the microphones on their return to the pilot laboratory. Fig. 1 shows the deviation of each calibration from the average value at the KRISS. Observed changes over the period are well below the uncertainty quoted by the KRISS, thus confirming that the microphones had an acceptable level of stability during the circulation.
Therefore the very first measurement from the KRISS was used as the reported KRISS result for this key comparison. This practice follows previous CCAUV key comparisons.
Fig. 2 gives the temporal variation of the sensitivities at 250 Hz. For reference, results declared by the participants are included. There appears to be little significant correlation between the stability of the microphones and the results from participants.
5
Fig. 1. KRISS measurements during APMP.AUV.A–K3.

6
Fig. 2. Sensitivity variation during APMP.AUV.A–K3 at 250 Hz.

7
4. Methodologies The protocol required that the calibration method should be based on IEC
61094-2, but this Standard does not mention any specific equipment to be used. The following descriptions give the methodologies and facilities used in this key comparison by each participant. Any variation from the requirements of IEC 61094-2 was also included, if declared. NIMT – The NIMT used the reciprocity calibration system. In this system, the voltage transfer function was measured using the insert voltage technique. The transmitter current was determined by measuring the voltage across a calibrated capacitance connected in series with the transmitter.
Two plain wave couplers (cavity volume 3.098 cm3 and 5.135 cm3 respectively) were used, filled with air at all measurement frequencies. The microphones were set into the coupler without using grease on the assumption that leakage of air and sound was negligible. Capillary tube correction was not applied because a needle bung was fitted with each coupler instead of the capillary tube. The needle bung was attached to the coupler to equalize the static pressure and to act as an acoustic seal. No corrections were applied. CMS/ITRI – The CMS/ITRI used two reference microphones and one microphone to be calibrated by selecting two microphones a group to carry out the calibration, one being as the transmitting microphone and the other as the receiving microphone during calibration. They placed the microphones separately into the cavity coupler and measured the ratio of voltage attenuation, thus obtaining three individual sets of sensitivity equations to solve the sound pressure sensitivity of microphone under calibration by the reciprocity method. NMIA - Pressure sensitivity by the reciprocity technique was determined using 3 type LS2P laboratory standard microphones according to IEC 61094-2. The measurement data was analysed using the computer software MP.EXE microphone pressure sensitivity calibration program. The radial wave motion corrections were applied. Three different plane wave couplers of nominal lengths of 3 mm, 4 mm and 6 mm with maximum frequency limits of
8
31.5 kHz, 25 kHz and 16 kHz respectively were utilized and the results averaged in their overlapping frequency range.
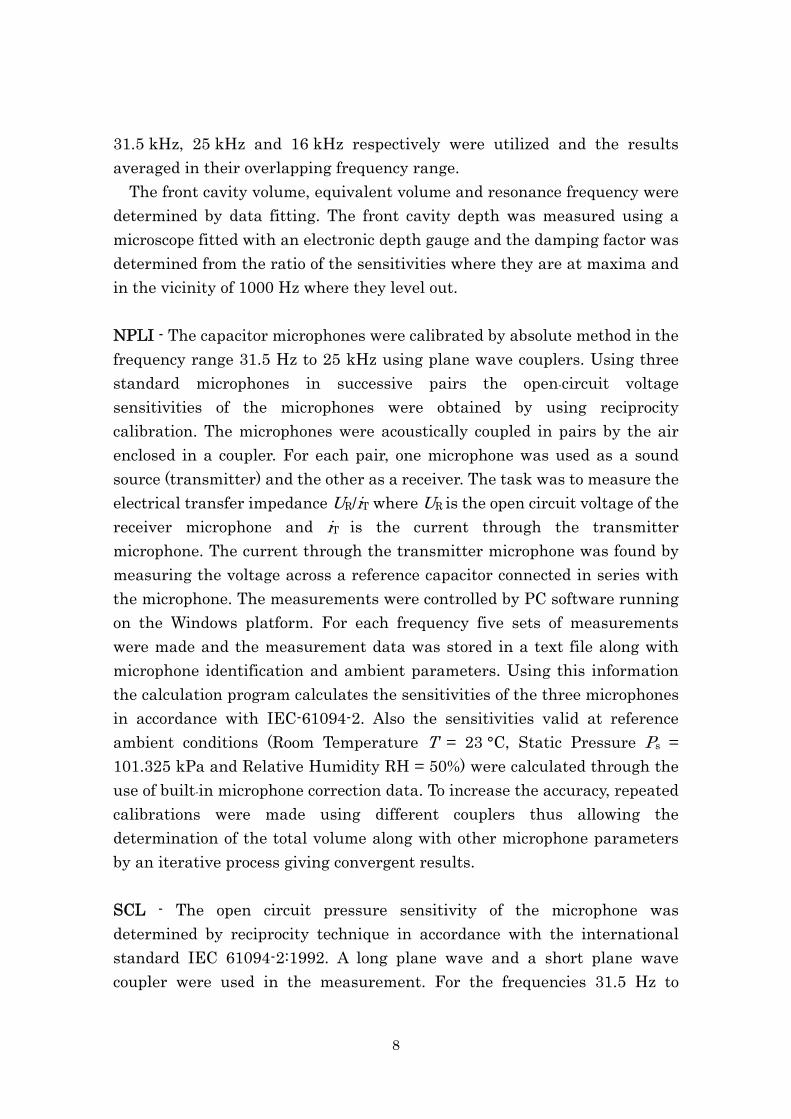
The front cavity volume, equivalent volume and resonance frequency were determined by data fitting. The front cavity depth was measured using a microscope fitted with an electronic depth gauge and the damping factor was determined from the ratio of the sensitivities where they are at maxima and in the vicinity of 1000 Hz where they level out. NPLI - The capacitor microphones were calibrated by absolute method in the frequency range 31.5 Hz to 25 kHz using plane wave couplers. Using three standard microphones in successive pairs the open-circuit voltage sensitivities of the microphones were obtained by using reciprocity calibration. The microphones were acoustically coupled in pairs by the air enclosed in a coupler. For each pair, one microphone was used as a sound source (transmitter) and the other as a receiver. The task was to measure the electrical transfer impedance UR/iT where UR is the open circuit voltage of the receiver microphone and iT is the current through the transmitter
microphone. The current through the transmitter microphone was found by measuring the voltage across a reference capacitor connected in series with the microphone. The measurements were controlled by PC software running on the Windows platform. For each frequency five sets of measurements were made and the measurement data was stored in a text file along with microphone identification and ambient parameters. Using this information the calculation program calculates the sensitivities of the three microphones in accordance with IEC-61094-2. Also the sensitivities valid at reference ambient conditions (Room Temperature T = 23 °C, Static Pressure Ps = 101.325 kPa and Relative Humidity RH = 50%) were calculated through the use of built-in microphone correction data. To increase the accuracy, repeated calibrations were made using different couplers thus allowing the determination of the total volume along with other microphone parameters by an iterative process giving convergent results. SCL - The open circuit pressure sensitivity of the microphone was determined by reciprocity technique in accordance with the international standard IEC 61094-2:1992. A long plane wave and a short plane wave coupler were used in the measurement. For the frequencies 31.5 Hz to

9
2000 Hz, both the long and short couplers were used. The measurement results reported in the certificate for the frequency range from 31.5 Hz to 2000 Hz were the average of the two results. For frequencies above 2000 Hz, only the short plane wave coupler was used. NML/SIRIM - Absolute calibration method using Reciprocity Calibration System according to IEC 61094-2:1992 was used. The open circuit sensitivities of the microphones are obtained by using a combination of reciprocity calibration and insert voltage techniques. The microphones are acoustically coupled in pairs by the air enclosed in a coupler. There are two couplers (short and long) used in this measurement with precisely determined dimensions. For each pair of microphones, one microphone is used as a sound source (transmitter), and the other as a receiver. Included with the system are two PC programs, one to control measurements and the other to handle the sensitivity calculations according to the IEC Standard. NMIJ - The pressure sensitivity was determined in compliance with IEC 61094-2, using a reciprocity calibration system developed by NMIJ. In the system, both the signal generation and the signal processing were executed by a dual-channel FFT analyzer, model CF-5220 of ONO SOKKI Co. Signal to noise ratio was improved by the synchronous waveform averaging method. The insert voltage technique was used to cancel the effect of the gain and impedance of an electrical circuit. The calibration was performed by using software of our own making.
A Brüel & Kjær UA1430 plane-wave (short) coupler was used for the reciprocity calibration and a long coupler type UA1414 was also used for determining the equivalent volume of the microphones under test. Both couplers were filled with air and no grease was used to the contacting surfaces between the microphones and the coupler. Capillary tube correction was considered to be unnecessary because a capillary tube was blocked by a needle bung DA5563 so that both equalization of static pressure and an acoustic seal could be ensured. Correction for radial wave-motion was not applied either.
All the measurements were conducted within a room whose temperature and relative humidity were controlled (23.0 ± 0.5 ℃ and 50 ± 5 %RH, respectively). The sensitivity was corrected to the reference environmental

10
conditions by using K. Rasmussen’s method [2]. At 31.5 kHz, only pressure dependency has been corrected because of the lack of a reliable temperature coefficient.
Microphone parameters were determined as follows: The resonance frequency, loss factor and the cavity volume of the couplers were taken from Brüel & Kjær’s nominal values. Front depth was measured using a microscope calibrated by a block gauge. Equivalent volume was calculated as an averaged value from 250 Hz to 4 kHz. NIM - Conforming to the Reference Standard IEC 61094-2 Primary method for pressure calibration of laboratory standard microphones by the reciprocity technique, NIM carried out six complete measurements. The Reciprocity calibration system and the computer software MP.EXE determined the open-circuit pressure sensitivity of the microphones. The front cavity depth of the microphones was determined by using an optical method, and then the front volume calculated. The loss factor, pressure coefficient and temperature coefficient that we used were the typical values of the microphone. Equivalent volume was determined by analysis of the measurement curve using the software MP.EXE. Two plane wave couplers were used during measurements and coupler parameters that we used were also the typical values. NMC - Before the measurements, the microphones were conditioned in the laboratory for 24 hours. The 200 volt polarisation voltage was measured and adjusted to within ± 0.01 V during test set-up, and was verified again after all the measurements were completed. A precision pressure sensor was used to monitor static pressure inside the measurement chamber during measurement.
The measurements were made according to IEC 61094-2 using Brüel & Kjær Reciprocity Calibration System Type 9699. Two reference microphones were paired with the two microphones under comparison. A short coupler (4.7 mm) was used for measuring the pressure sensitivities in the frequency range of 31 Hz to 25 kHz, and a long coupler (9.4 mm) was used for the frequency range of 31 Hz to 2 kHz. The measurement result for each frequency point was obtained by averaging the pressure sensitivities measured using the short and long couplers at the same frequency.
In the calculation of pressure sensitivities for the standard with serial

11
number 1763688, nominal values for microphone parameters were used. For the standard with serial number 2341431, measured values provided by Brüel & Kjær (B&K) were used in the calculation. KRISS - The calibration is performed by reciprocity calibration according to IEC 61094-2 using three reciprocal microphones. The microphones are coupled in pairs with two plane-wave couplers of different length (nominal length: 4.7 mm and 9.4 mm).
The receiver microphone is connected to a preamplifier B&K type 2673/WH 3291 with insert voltage facilities and the transmitter microphone is connected to a similar housing but with grounded shield.
The electrical current through the transmitter is measured as the voltage across the 4.7 nF capacitor connected in series with the transmitter. The measuring instruments are: Sine Generator B&K 1051, Digital Multimeter Wavetek 1281 and 1/3 Octave band Pass Filter B&K 1617. The measurements are made at discrete frequencies controlled via computer.
During the calibrations the coupler and the microphones are located under a cylindrical bulb of volume of about 20 litre and the cylindrical bulb is again enclosed by the acryl box with dimensions of 650 mm(W) × 859 mm(H) × 700 mm(D). The static pressure is measured using a Multifunction Pressure Indicator, Druck DPI 145, the temperature and the relative humidity are measured using a Testo 650.
The front cavity depths of the microphones are measured using the Video Measuring Scope, Nikon, VMH-300N. The equivalent volume is determined by fitting the final results for the two couplers in the frequency range up to about 2 kHz. Nominal values are assumed for the resonance frequency and the loss factor of the microphone diaphragm. 5. Results
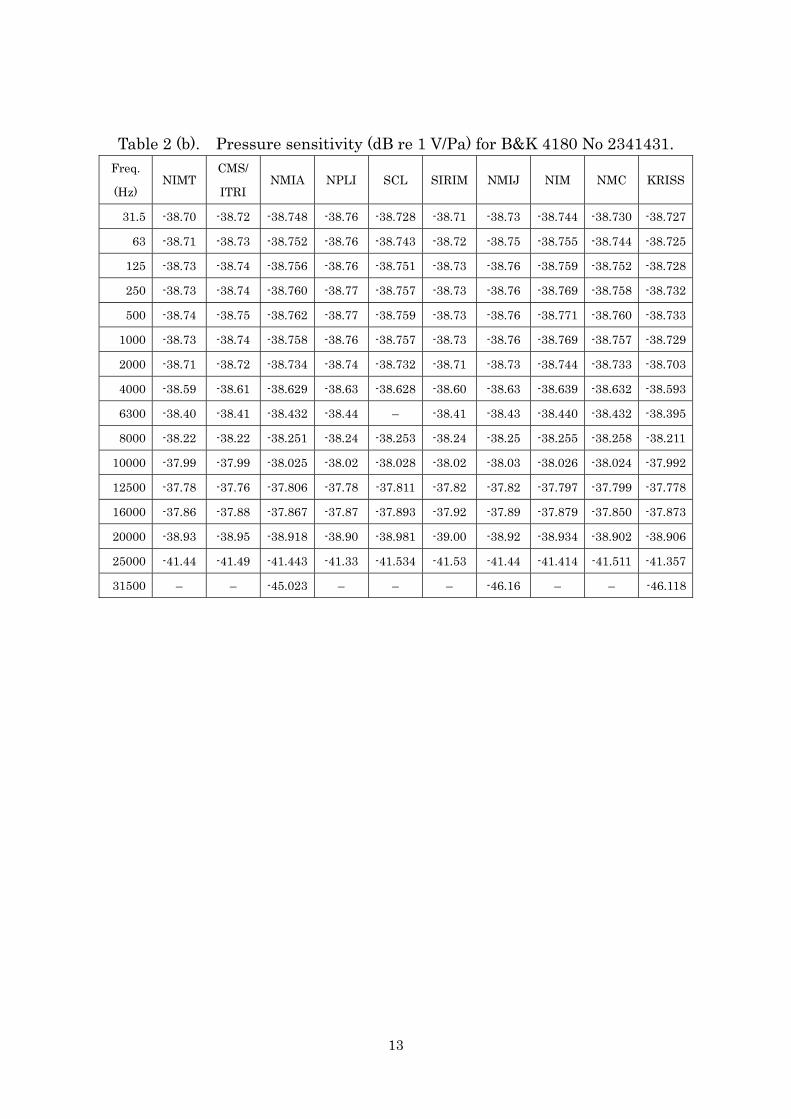
The pressure sensitivities of the two microphones determined by each participant are shown in Table 2. They are presented with two or three decimals, depending on the way they were reported. Table 3 gives the associated measurement uncertainties. For the optional 31.5 kHz frequency, only three participants reported their results. The SCL did not measure the pressure sensitivity at 6300 Hz.

12
Table 2 (a). Pressure sensitivity (dB re 1 V/Pa) for B&K 4180 No 1763688. Freq.
(Hz) NIMT
CMS/
ITRI NMIA NPLI SCL SIRIM NMIJ NIM NMC KRISS
31.5 -39.53 -39.55 -39.571 -39.58 -39.559 -39.52 -39.58 -39.558 -39.520 -39.558
63 -39.54 -39.56 -39.583 -39.58 -39.573 -39.54 -39.58 -39.568 -39.534 -39.553
125 -39.55 -39.57 -39.589 -39.59 -39.583 -39.54 -39.59 -39.574 -39.543 -39.559
250 -39.56 -39.58 -39.596 -39.60 -39.590 -39.55 -39.59 -39.584 -39.551 -39.564
500 -39.56 -39.58 -39.601 -39.60 -39.594 -39.55 -39.60 -39.588 -39.556 -39.567
1000 -39.56 -39.58 -39.600 -39.60 -39.594 -39.55 -39.59 -39.588 -39.555 -39.566
2000 -39.55 -39.56 -39.582 -39.58 -39.575 -39.53 -39.58 -39.569 -39.539 -39.547
4000 -39.46 -39.48 -39.501 -39.50 -39.495 -39.46 -39.50 -39.488 -39.450 -39.461
6300 -39.31 -39.33 -39.352 -39.34 – -39.32 -39.35 -39.337 -39.305 -39.310
8000 -39.18 -39.18 -39.216 -39.19 -39.214 -39.19 -39.22 -39.201 -39.179 -39.172
10000 -39.02 -39.01 -39.049 -39.04 -39.049 -39.04 -39.06 -39.032 -39.019 -39.010
12500 -38.88 -38.83 -38.886 -38.85 -38.891 -38.89 -38.91 -38.866 -38.874 -38.858
16000 -38.94 -38.92 -38.907 -38.93 -38.946 -38.97 -38.95 -38.933 -38.918 -38.932
20000 -39.68 -39.67 -39.658 -39.67 -39.703 -39.75 -39.64 -39.675 -39.660 -39.695
25000 -41.52 -41.63 -41.620 -41.66 -41.684 -41.69 -41.51 -41.540 -41.681 -41.770
31500 – – -44.793 – – – -46.46 – – -45.835
13
Table 2 (b). Pressure sensitivity (dB re 1 V/Pa) for B&K 4180 No 2341431. Freq.
(Hz) NIMT
CMS/
ITRI NMIA NPLI SCL SIRIM NMIJ NIM NMC KRISS
31.5 -38.70 -38.72 -38.748 -38.76 -38.728 -38.71 -38.73 -38.744 -38.730 -38.727
63 -38.71 -38.73 -38.752 -38.76 -38.743 -38.72 -38.75 -38.755 -38.744 -38.725
125 -38.73 -38.74 -38.756 -38.76 -38.751 -38.73 -38.76 -38.759 -38.752 -38.728
250 -38.73 -38.74 -38.760 -38.77 -38.757 -38.73 -38.76 -38.769 -38.758 -38.732
500 -38.74 -38.75 -38.762 -38.77 -38.759 -38.73 -38.76 -38.771 -38.760 -38.733
1000 -38.73 -38.74 -38.758 -38.76 -38.757 -38.73 -38.76 -38.769 -38.757 -38.729
2000 -38.71 -38.72 -38.734 -38.74 -38.732 -38.71 -38.73 -38.744 -38.733 -38.703
4000 -38.59 -38.61 -38.629 -38.63 -38.628 -38.60 -38.63 -38.639 -38.632 -38.593
6300 -38.40 -38.41 -38.432 -38.44 – -38.41 -38.43 -38.440 -38.432 -38.395
8000 -38.22 -38.22 -38.251 -38.24 -38.253 -38.24 -38.25 -38.255 -38.258 -38.211
10000 -37.99 -37.99 -38.025 -38.02 -38.028 -38.02 -38.03 -38.026 -38.024 -37.992
12500 -37.78 -37.76 -37.806 -37.78 -37.811 -37.82 -37.82 -37.797 -37.799 -37.778
16000 -37.86 -37.88 -37.867 -37.87 -37.893 -37.92 -37.89 -37.879 -37.850 -37.873
20000 -38.93 -38.95 -38.918 -38.90 -38.981 -39.00 -38.92 -38.934 -38.902 -38.906
25000 -41.44 -41.49 -41.443 -41.33 -41.534 -41.53 -41.44 -41.414 -41.511 -41.357
31500 – – -45.023 – – – -46.16 – – -46.118

14
Table 3. Declared expanded uncertainties at k = 2 (dB). Freq.
(Hz) NIMT
CMS/
ITRI NMIA NPLI SCL SIRIM NMIJ NIM NMC KRISS
31.5 0.06 0.04 0.08 0.12 0.08 0.04 0.06 0.08 0.06 0.08
63 0.04 0.04 0.06 0.11 0.04 0.04 0.06 0.05 0.04 0.05
125 0.04 0.04 0.05 0.08 0.04 0.04 0.06 0.05 0.04 0.05
250 0.04 0.04 0.05 0.05 0.04 0.04 0.05 0.05 0.04 0.04
500 0.04 0.04 0.04 0.05 0.04 0.04 0.05 0.05 0.04 0.04
1000 0.04 0.04 0.04 0.05 0.04 0.04 0.05 0.05 0.04 0.04
2000 0.04 0.04 0.04 0.08 0.04 0.04 0.05 0.05 0.04 0.04
4000 0.04 0.04 0.04 0.08 0.04 0.04 0.05 0.05 0.04 0.04
6300 0.04 0.04 0.04 0.10 – 0.04 0.05 0.05 0.04 0.04
8000 0.04 0.04 0.04 0.10 0.04 0.04 0.05 0.05 0.04 0.04
10000 0.04 0.06 0.05 0.11 0.04 0.05 0.05 0.05 0.04 0.05
12500 0.04 0.08 0.06 0.11 0.04 0.06 0.06 0.10 0.05 0.06
16000 0.05 0.08 0.08 0.12 0.05 0.07 0.07 0.10 0.06 0.07
20000 0.08 0.08 0.10 0.13 0.08 0.10 0.13 0.10 0.09 0.10
25000 0.14 0.12 0.15 0.17 0.14 0.17 0.18 0.12 0.15 0.20
31500 – – 0.25 – – – 0.66 – – 1.00
Every participant declared the same uncertainties for each microphone.
Detailed uncertainty budgets for the participants are reproduced in Appendix A.
Microphone parameters are listed in Table 4, and temperature and pressure coefficients of the sensitivity in Table 5. Every participant submitted the same coefficients for each microphone. These coefficients are frequency dependent, but most of the participants reported just a single value. In this case, the pilot laboratory regarded the reported coefficients as the values at 250 Hz, if not specified. Furthermore, information on the couplers used in the key comparison is described in Table 6.

15
Table 4 (a). Microphone parameters for B&K4180 No 1763688.
NIMT CMS/
ITRI NMIA NPLI SCL SIRIM NMIJ NIM NMC KRISS
Front cavity
volume /mm3 32.759 33.1 32.0 34 33.3 34 32.6 32.7 34 35
Front cavity
depth /mm 0.488 0.48 0.482 0.463 0.5 0.5 0.48 0.479 0.5 0.505
Equivalent
volume /mm3 9.2 6.6 8.1 7.56 7.1 9.2 8.1 7.9 9.2 6.7
Resonance
freq. /kHz 22 22 23.0 22.4 23 22 22 22 22 22
Loss factor 1.05 1.05 1.05 1.05 1.05 1.05 1.05 1.05 1.05 1.05
Table 4 (b). Microphone parameters for B&K4180 No 2341431.
NIMT
CMS/
ITRI NMIA NPLI SCL SIRIM NMIJ NIM NMC KRISS
Front cavity
volume /mm3 33.818 33.4 33.0 32.8 33.6 34 33.2 32.9 33.3 33.1
Front cavity
depth /mm 0.507 0.48 0.498 0.504 0.5 0.5 0.49 0.479 0.496 0.478
Equivalent
volume /mm3 9.2 7.5 8.5 9.64 8 9.2 9.1 8.2 8.1 10.1
Resonance
freq. /kHz 22 22 22.0 22.4 23 22 22 22 22 22
Loss factor 1.05 1.05 1.05 1.07 1.05 1.05 1.05 1.05 1.05 1.05

16
Table 5 (a). Temperature coefficients for pressure sensitivity (dB/K). Freq.
/Hz NIMT
CMS/
ITRI NMIA NPLI SCL SIRIM NMIJ NIM NMC KRISS
31.5 -0.001 – – – – – -0.002 – – -0.001
63 -0.001 – – – – – -0.002 – – -0.001
125 -0.001 – – – – – -0.002 – – -0.001
250 -0.001 -0.002 -0.002 -0.0012 -0.002 -0.002 -0.002 -0.002 -0.0012 -0.001
500 -0.001 – – – – – -0.002 – – -0.001
1000 -0.001 – – – – – -0.002 – – -0.001
2000 -0.002 – – – – – -0.003 – – -0.002
4000 -0.003 – – – – – -0.003 – – -0.003
6300 -0.005 – – – – – -0.006 – – -0.005
8000 -0.007 – – – – – -0.008 – – -0.007
10000 -0.010 – – – – – -0.011 – – -0.011
12500 -0.014 – – – – – -0.014 – – -0.015
16000 -0.015 – – – – – -0.017 – – -0.016
20000 -0.009 – – – – – -0.008 – – -0.008
25000 0.006 – – – – – 0.009 – – 0.006
31500 – – – – – – – – – 0.012

17
Table 5 (b). Pressure coefficients for pressure sensitivity (dB/kPa). Freq.
/Hz NIMT
CMS/
ITRI NMIA NPLI SCL SIRIM NMIJ NIM NMC KRISS
31.5 -0.005 – – – – – -0.006 – – -0.005
63 -0.005 – – – – – -0.006 – – -0.005
125 -0.005 – – – – – -0.006 – – -0.005
250 -0.005 -0.0055 -0.0055 -0.0055 -0.007 -0.007 -0.006 -0.0055 -0.0064 -0.006
500 -0.005 – – – – – -0.006 – – -0.006
1000 -0.005 – – – – – -0.006 – – -0.006
2000 -0.005 – – – – – -0.005 – – -0.005
4000 -0.003 – – – – – -0.004 – – -0.004
6300 -0.001 – – – – – -0.001 – – -0.001
8000 0.002 – – – – – 0.001 – – 0.002
10000 0.006 – – – – – 0.005 – – 0.005
12500 0.008 – – – – – 0.008 – – 0.008
16000 -0.001 – – – – – 0.004 – – 0.001
20000 -0.019 – – – – – -0.017 – – -0.021
25000 -0.046 – – – – – -0.043 – – -0.046
31500 – – – – – – -0.048 – – -0.049

18
Table 6. Information on the couplers. (a) short plane-wave coupler
NIMT
CMS/
ITRI NMIA NPLI SCL SIRIM NMIJ NIM NMC KRISS
Diameter
/mm 9.3 9.3 9.3 – 9.3 9.3057 9.3 – 9.30729 9.3
Length
/mm 4.7 4.7
3.0,
4.0 – 4.7 4.7019 4.7 – 4.69958 4.7
Freq.
Range
/Hz
20 to
25k
20 to
25k
20 to
-31.5k,
-25k
– 31.5 to
25k
20 to
25k
31.5 to
31.5k –
31 to
25k
20 to
25k
(b) long plane-wave coupler
NIMT
CMS/
ITRI NMIA NPLI SCL SIRIM NMIJ NIM NMC KRISS
Diameter
/mm 9.3 9.3 9.3 – 9.3 9.3 9.3 – 9.30488 9.3
Length
/mm 9.4 9.4 6.0 – 9.4 9.4 9.4 – 9.40285 9.4
Freq.
Range
/Hz
20 to
13k
20 to
13k
20 to
16k –
31.5 to
2k
20 to
13k
250 to
4k –
31 to
2k
20 to
13k
(c) capillary tube
NIMT CMS/
ITRI NMIA NPLI SCL SIRIM NMIJ NIM NMC KRISS
Number – 0 none – none none none – – –
Inner
diameter
/mm
– 0.335 – – – – – – – –
Length
/mm – 50 – – – – – – – –

19
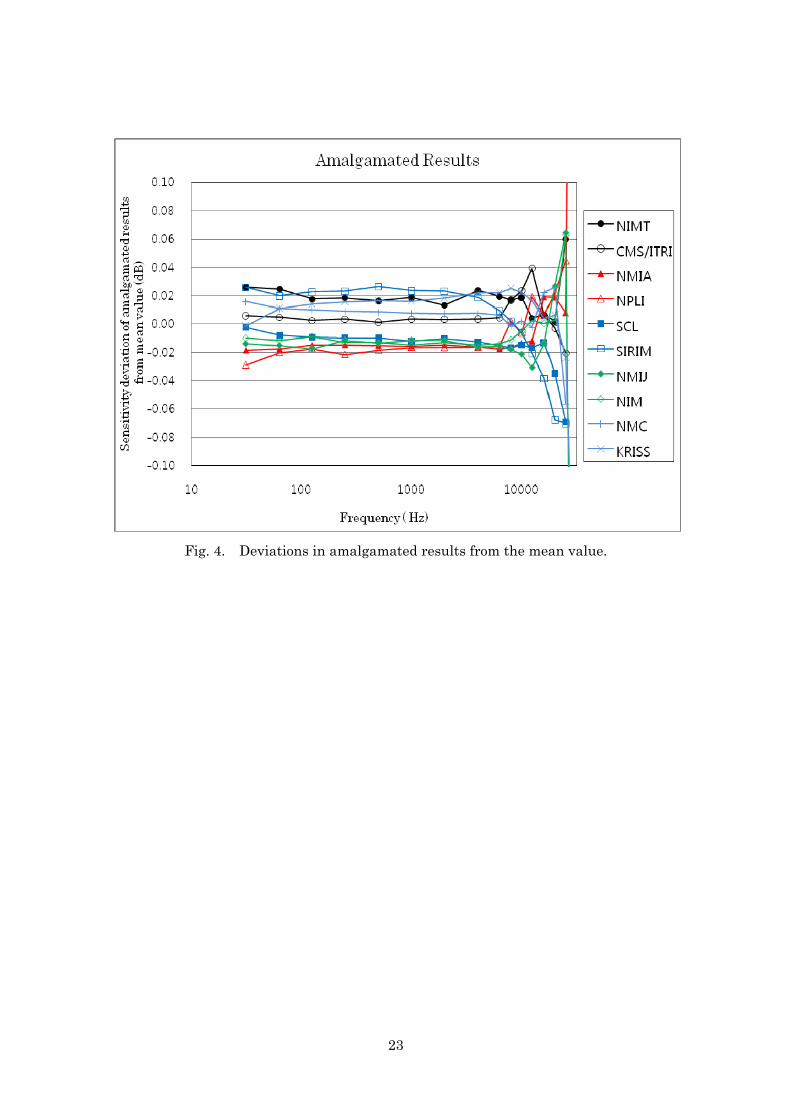
For each of the two microphones and at each of the frequencies, the mean value of the pressure sensitivity level was determined from all the submitted data. Fig. 3 shows the results of individual participants expressed as the difference from this mean value.
Fig. 3 indicates that the trend for each participant is mostly common to both microphones, as observed in the CCAUV.A–K3. Therefore the average difference for the two microphones was taken to specify the performance of each participant and presented in Fig. 4.

20
Fig. 3 (a). Sensitivity deviations from the mean value for B&K4180 No 1763688.
Fig. 3 (b). Sensitivity deviations from the mean value for B&K4180 No 2341431.

21
Table 7 (a). Sensitivity deviations from the mean value for B&K4180 No 1763688 (dB). Freq.
/Hz NIMT
CMS/
ITRI NMIA NPLI SCL SIRIM NMIJ NIM NMC KRISS
31.5 0.02 0.00 -0.02 -0.03 -0.01 0.03 -0.03 -0.01 0.03 -0.01
63 0.02 0.00 -0.02 -0.02 -0.01 0.02 -0.02 -0.01 0.03 0.01
125 0.02 0.00 -0.02 -0.02 -0.01 0.03 -0.02 -0.01 0.03 0.01
250 0.02 0.00 -0.02 -0.02 -0.01 0.03 -0.01 -0.01 0.03 0.01
500 0.02 0.00 -0.02 -0.02 -0.01 0.03 -0.02 -0.01 0.02 0.01
1000 0.02 0.00 -0.02 -0.02 -0.02 0.03 -0.01 -0.01 0.02 0.01
2000 0.01 0.00 -0.02 -0.02 -0.01 0.03 -0.02 -0.01 0.02 0.01
4000 0.02 0.00 -0.02 -0.02 -0.02 0.02 -0.02 -0.01 0.03 0.02
6300 0.02 0.00 -0.02 -0.01 – 0.01 -0.02 -0.01 0.02 0.02
8000 0.01 0.01 -0.02 0.00 -0.02 0.00 -0.03 -0.01 0.02 0.02
10000 0.01 0.02 -0.02 -0.01 -0.02 -0.01 -0.03 0.00 0.01 0.02
12500 -0.01 0.04 -0.01 0.02 -0.02 -0.02 -0.04 0.01 0.00 0.02
16000 -0.01 0.01 0.03 0.00 -0.01 -0.04 -0.02 0.00 0.02 0.00
20000 0.00 0.01 0.02 0.01 -0.02 -0.07 0.04 0.01 0.02 -0.01
25000 0.11 0.00 0.01 -0.03 -0.05 -0.06 0.12 0.09 -0.05 -0.14
31500 – – 0.90 – – – -0.76 – – -0.14

22
Table 7 (b). Sensitivity deviations from the mean value for B&K4180 No 2341431 (dB). Freq.
/Hz NIMT
CMS/
ITRI NMIA NPLI SCL SIRIM NMIJ NIM NMC KRISS
31.5 0.03 0.01 -0.02 -0.03 0.00 0.02 0.00 -0.01 0.00 0.00
63 0.03 0.01 -0.01 -0.02 0.00 0.02 -0.01 -0.02 -0.01 0.01
125 0.02 0.01 -0.01 -0.01 0.00 0.02 -0.01 -0.01 -0.01 0.02
250 0.02 0.01 -0.01 -0.02 -0.01 0.02 -0.01 -0.02 -0.01 0.02
500 0.01 0.00 -0.01 -0.02 -0.01 0.02 -0.01 -0.02 -0.01 0.02
1000 0.02 0.01 -0.01 -0.01 -0.01 0.02 -0.01 -0.02 -0.01 0.02
2000 0.02 0.01 -0.01 -0.01 -0.01 0.02 0.00 -0.02 -0.01 0.02
4000 0.03 0.01 -0.01 -0.01 -0.01 0.02 -0.01 -0.02 -0.01 0.03
6300 0.02 0.01 -0.01 -0.02 – 0.01 -0.01 -0.02 -0.01 0.03
8000 0.02 0.02 -0.01 0.00 -0.01 0.00 -0.01 -0.02 -0.02 0.03
10000 0.02 0.02 -0.01 -0.01 -0.01 -0.01 -0.02 -0.01 -0.01 0.02
12500 0.02 0.04 -0.01 0.02 -0.02 -0.02 -0.02 0.00 0.00 0.02
16000 0.02 0.00 0.01 0.01 -0.01 -0.04 -0.01 0.00 0.03 0.01
20000 0.00 -0.02 0.02 0.03 -0.05 -0.07 0.01 0.00 0.03 0.03
25000 0.01 -0.04 0.01 0.12 -0.09 -0.08 0.01 0.03 -0.06 0.09
31500 – – 0.74 – – – -0.39 – – -0.35
23
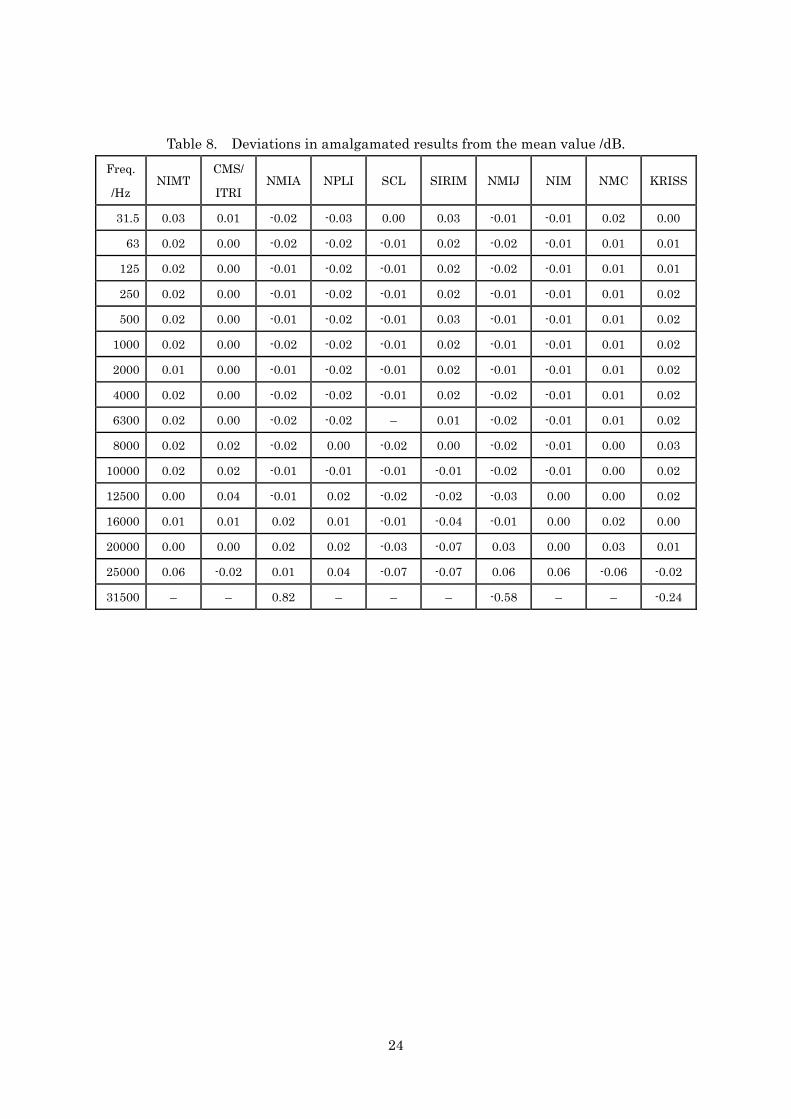
Fig. 4. Deviations in amalgamated results from the mean value.
24
Table 8. Deviations in amalgamated results from the mean value /dB. Freq.
/Hz NIMT
CMS/
ITRI NMIA NPLI SCL SIRIM NMIJ NIM NMC KRISS
31.5 0.03 0.01 -0.02 -0.03 0.00 0.03 -0.01 -0.01 0.02 0.00
63 0.02 0.00 -0.02 -0.02 -0.01 0.02 -0.02 -0.01 0.01 0.01
125 0.02 0.00 -0.01 -0.02 -0.01 0.02 -0.02 -0.01 0.01 0.01
250 0.02 0.00 -0.01 -0.02 -0.01 0.02 -0.01 -0.01 0.01 0.02
500 0.02 0.00 -0.01 -0.02 -0.01 0.03 -0.01 -0.01 0.01 0.02
1000 0.02 0.00 -0.02 -0.02 -0.01 0.02 -0.01 -0.01 0.01 0.02
2000 0.01 0.00 -0.01 -0.02 -0.01 0.02 -0.01 -0.01 0.01 0.02
4000 0.02 0.00 -0.02 -0.02 -0.01 0.02 -0.02 -0.01 0.01 0.02
6300 0.02 0.00 -0.02 -0.02 – 0.01 -0.02 -0.01 0.01 0.02
8000 0.02 0.02 -0.02 0.00 -0.02 0.00 -0.02 -0.01 0.00 0.03
10000 0.02 0.02 -0.01 -0.01 -0.01 -0.01 -0.02 -0.01 0.00 0.02
12500 0.00 0.04 -0.01 0.02 -0.02 -0.02 -0.03 0.00 0.00 0.02
16000 0.01 0.01 0.02 0.01 -0.01 -0.04 -0.01 0.00 0.02 0.00
20000 0.00 0.00 0.02 0.02 -0.03 -0.07 0.03 0.00 0.03 0.01
25000 0.06 -0.02 0.01 0.04 -0.07 -0.07 0.06 0.06 -0.06 -0.02
31500 – – 0.82 – – – -0.58 – – -0.24

25
6. Linking model for the CCAUV.A–K3 The goal is to establish a linkage between the results of the
APMP.AUV.A–K3 and those of the CCAUV.A–K3. Four laboratories (NMIJ, KRISS, NIM and NMIA) listed in table 9 participated in both key-comparisons and play the important role as the linking laboratories.
In December 2002, the protocol for the CCAUV.A–K3 was issued containing the procedures to circulate the standards and a general framework for the measurements. The comparison consisted of two circulations (A and B) with two different standards per circulation.
Participant Acronym Country Circulation
National Metrology Institute of Japan
NMIJ Japan A
Korea Research Institute of Science and Standards
KRISS Korea A
National Institute of Metrology NIM China B National Measurement Institute (Australia)
NMIA Australia B
Table 9. Participants in both key comparisons for linkage.
It is planned to link the APMP.AUV.A–K3 results with the CCAUV.A–K3 results using the results from the four laboratories that also participated in the CCAUV.A–K3 comparison. The methodology described in the CCAUV.A–K3 comparison will be used for the linkage and to determine the degrees of equivalence. The results of the linking will be included in a further report. 7. Conclusion
The KRISS has piloted the regional key comparison APMP.AUV.A–K3 and reported the results. Deviations from the mean value for all participants are within their declared expanded uncertainties for all frequencies except the optional 31.5 kHz. The results from the participants will be linked to the key comparison reference values of the CIPM key comparison CCAUV.A–K3.

26
Acknowledgement The authors gratefully acknowledge all the participating institutes for
their thorough cooperation and fruitful discussion.
References [1] Cutanda Henríquez V., Rasmussen K., Final report on the key comparison CCAUV.A-K3, Metrologia 43 (2006) Tech. Suppl. 09001. [2] Rasmussen K., The static pressure and temperature coefficients of laboratory standard microphones, Metrologia 36 (1999) 265–273.

27
Appendix A. Uncertainty budgets
The uncertainty budgets submitted by the participants are reproduced here. NIMT National Institute of Metrology (Thailand) Uncertainty Components of the Pressure Sensitivity Level for LS2P Microphone (unit quote in dB)
Frequency /Hz 31.5 63 125 250 500 1 k 2k 4k 6.3k 8k 10k 12.5k 16k 20k 25k
UPol.V 0.0004 0.0004 0.0004 0.0004 0.0004 0.0004 0.0004 0.0004 0.0004 0.0004 0.0004 0.0004 0.0004 0.0004 0.0004
UPCorr. 0.0045 0.0045 0.0045 0.0045 0.0045 0.0045 0.0045 0.0045 0.0045 0.0045 0.0045 0.0046 0.0073 0.0187 0.0200
UTcorr. 0.0006 0.0006 0.0006 0.0006 0.0006 0.0006 0.0006 0.0006 0.0006 0.0006 0.0006 0.0006 0.0013 0.0032 0.0100
URH.Corr. 0.0010 0.0010 0.0010 0.0010 0.0010 0.0010 0.0010 0.0010 0.0010 0.0010 0.0010 0.0010 0.0010 0.0010 0.0010
UHWcf. 0.0100 0.0100 0.0100 0.0100 0.0100 0.0100 0.0100 0.0100 0.0100 0.0100 0.0100 0.0100 0.0100 0.0100 0.0100
UP 0.0008 0.0008 0.0008 0.0008 0.0008 0.0008 0.0008 0.0008 0.0008 0.0008 0.0008 0.0008 0.0008 0.0008 0.0008
USpec.H 0.0020 0.0020 0.0020 0.0020 0.0020 0.0020 0.0020 0.0020 0.0020 0.0020 0.0020 0.0020 0.0020 0.0020 0.0020
UCap. 0.0060 0.0060 0.0060 0.0060 0.0060 0.0060 0.0060 0.0060 0.0060 0.0060 0.0060 0.0060 0.0060 0.0060 0.0060
UElect.Para. 0.0073 0.0073 0.0073 0.0073 0.0073 0.0073 0.0073 0.0073 0.0073 0.0073 0.0073 0.0073 0.0073 0.0073 0.0073
UCoupler 0.0176 0.0053 0.0032 0.0031 0.0031 0.0030 0.0030 0.0030 0.0030 0.0030 0.0030 0.0030 0.0030 0.0030 0.0030
Umic. 0.0070 0.0070 0.0070 0.0070 0.0070 0.0070 0.0070 0.0070 0.0070 0.0070 0.0070 0.0070 0.0100 0.0300 0.0500
UA Repeat 0.0120 0.0040 0.0030 0.0030 0.0030 0.0040 0.0030 0.0020 0.0020 0.0030 0.0040 0.0060 0.0100 0.0110 0.0400
Combined
Standard
Uncertainty
0.0268 0.0176 0.0169 0.0169 0.0169 0.0170 0.0168 0.0167 0.0167 0.0168 0.0170 0.0176 0.0214 0.0398 0.0693
Expanded
Uncertainty (k = 2) 0.0536 0.0352 0.0337 0.0337 0.0337 0.0341 0.0337 0.0334 0.0334 0.0337 0.0341 0.0353 0.0429 0.0796 0.1386
Reported
uncertainty /dB 0.06 0.04 0.04 0.04 0.04 0.04 0.04 0.04 0.04 0.04 0.04 0.04 0.05 0.08 0.14

28
CMS/ITRI
Uncertainty Budget For LS2P Microphone (dB)
Freq. 31.5 63 125 250 500 1000 2000 4000 6300 8000 10000 12500 16000 20000 25000 Symbol
Source of uncertainty, xi
CorR,,n
umeas,deviation Voltage ratio correction 0.009 0.009 0.009 0.009 0.009 0.009 0.009 0.009 0.009 0.009 0.009 0.009 0.009 0.009 0.009
umeas,specification Voltage Ratio, accuracy 0.003 0.003 0.003 0.003 0.003 0.003 0.003 0.003 0.003 0.003 0.003 0.003 0.003 0.003 0.003
CorCV
Vcoup,specification Coupler volume correction 0.011 0.011 0.011 0.011 0.011 0.011 0.011 0.011 0.011 0.011 0.011 0.011 0.011 0.011 0.011
CorPs
Ps,deviation Static pressure correction 0.002 0.002 0.002 0.002 0.002 0.002 0.002 0.002 0.002 0.002 0.002 0.002 0.002 0.002 0.002
CorC
Ctraceability Capacitance correction 0.002 0.002 0.002 0.002 0.002 0.002 0.002 0.002 0.002 0.002 0.002 0.002 0.002 0.002 0.002
Sref.
CorHW Heat conduction correction 0.006 0.006 0.006 0.006 0.006 0.006 0.006 0.006 0.006 0.006 0.006 0.006 0.006 0.006 0.006
k Ratio of specific heats 0.004 0.004 0.004 0.004 0.004 0.004 0.004 0.004 0.004 0.004 0.004 0.004 0.004 0.004 0.004
Ps,error Static pressure 0.000 0.000 0.000 0.000 0.000 0.000 0.000 0.000 0.000 0.000 0.000 0.000 0.000 0.000 0.000
Terror Ambient temperature 0.000 0.000 0.000 0.000 0.000 0.000 0.000 0.001 0.002 0.004 0.006 0.014 0.004 0.008 0.018
Herrot Ambient humidity 0.000 0.000 0.000 0.000 0.000 0.000 0.000 0.000 0.000 0.001 0.001 0.002 0.001 0.001 0.003
LF,error Microphone Cavity depth 0.000 0.000 0.000 0.000 0.000 0.000 0.000 0.001 0.003 0.005 0.008 0.018 0.011 0.019 0.043
MP,repeat Repeatability 0.003 0.005 0.005 0.005 0.006 0.006 0.006 0.005 0.005 0.005 0.008 0.013 0.019 0.016 0.026
uc Combined standard uncertainty 0.02 0.02 0.02 0.02 0.02 0.02 0.02 0.02 0.02 0.02 0.03 0.04 0.03 0.04 0.06
U Expanded uncertainty (k = 2) 0.04 0.04 0.04 0.04 0.04 0.04 0.04 0.04 0.04 0.04 0.06 0.08 0.06 0.08 0.12
Stated Uncertainty 0.04 0.04 0.04 0.04 0.04 0.04 0.04 0.04 0.04 0.04 0.06 0.08 0.08 0.08 0.12

29
NMIA

30
NPLI
Uncertainty of 4180 Microphones
S.No. Sources of Uncertainity Probability DistributionSensitivity Uncertainity Type - A or B Coefficient Contribution
20 Hz 31.5 Hz 63 Hz 125 Hz 250 Hz 1KHz 4 KHz 8 KHz 10 KHz 12.5 kHz 16 kHz 20 kHz 25 kHz1 Static Pressure Type-B, Rectangular 1 0.0016 0.0016 0.0016 0.0016 0.0016 0.0016 0.0016 0.0016 0.0016 0.0017 0.0017 0.0017 0.00172 Temperature Type-B, Rectangular 1 0.0004 0.0002 0.0001 0.0001 0.0001 0.0001 0.0002 0.0013 0.0022 0.004 0.0072 0.0112 0.0243 Relative Humidity Type-B, Rectangular 1 0.0003 0.0003 0.0003 0.0003 0.0003 0.0003 0.0003 0.0004 0.0006 0.0008 0.0012 0.002 0.0044 Coupler Volume Type-B, Normal 1 0.02 0.02 0.02 0.02 0.02 0.02 0.02 0.02 0.02 0.02 0.02 0.02 0.025 Equivalent & Front Volume Type-B, Normal 1 0.0067 0.0068 0.0069 0.007 0.007 0.007 0.0068 0.0058 0.0049 0.0035 0.0014 0.0013 0.00756 Microphone Front Length Type-B, Normal 1 0.0002 0.0002 0.0001 0.0001 0.0001 0.0001 0.0004 0.0016 0.0026 0.0045 0.0075 0.012 0.0287 Series capacitance Type-B, Rectangular 1 0.0065 0.0048 0.0028 0.0024 0.0018 0.0018 0.0024 0.0027 0.0028 0.0032 0.0035 0.0038 0.0058 Voltage Ratio (DVM) Type-B, Rectangular 1 0.015 0.015 0.01 0.01 0.01 0.01 0.01 0.01 0.01 0.01 0.015 0.015 0.0159 Voltage Ratio(Cr.talk) Type-B, Rectangular 1 0.0025 0.0025 0.0025 0.0025 0.0025 0.0025 0.0025 0.0025 0.0025 0.0025 0.0025 0.0025 0.002510 Voltage Ratio (Noise) Type-B, Rectangular 1 0.0001 0.0001 0.0001 0.0001 0.0001 0.0001 0.0001 0.0001 0.0001 0.0001 0.0001 0.0001 0.000111 Voltage Ratio(Distortion) Type-B, Rectangular 1 0.0001 0.0001 0.0001 0.0001 0.0001 0.0001 0.0001 0.0001 0.0001 0.0001 0.0001 0.0001 0.000112 Polarization Voltage Type-B, Normal 1 0.0036 0.0036 0.0036 0.0036 0.0036 0.0036 0.0036 0.0036 0.0036 0.0036 0.0036 0.0036 0.003613 Electrical Parameters
incl. Transfer impedance,acc.of voltmeter Type-B, Rectangular 1 0.05 0.05 0.05 0.02 0.02 0.02 0.03 0.04 0.05 0.05 0.05 0.05 0.0514 Specific Heat Ratio Type-B, Normal 1 0.002 0.002 0.002 0.002 0.002 0.002 0.002 0.002 0.002 0.002 0.002 0.002 0.00215 Wave motion correction Type-B, Rectangular 1 0.001 0.001 0.001 0.001 0.001 0.001 0.001 0.001 0.001 0.001 0.001 0.001 0.00116 Heat Conduction correction Type-B, Rectangular 1 0.01 0.01 0.01 0.01 0.01 0.01 0.01 0.01 0.01 0.01 0.01 0.01 0.0117 Reproducibility Type-A, Normal 0.005 0.005 0.01 0.01 0.01 0.01 0.01 0.01 0.005 0.005 0.005 0.015 0.045
Uncertainity of Sensitivity at Meas. conditions Sensitivity Correction for Static pressure Type-B, Rectangular 1 0.0005 0.0005 0.0005 0.0005 0.0005 0.0005 0.0008 0.0022 0.0024 0.0014 0.008 0.0175 0.014Sensitivity Correction for Temperature Type-B, Rectangular 1 0.0027 0.0027 0.0027 0.0027 0.0027 0.0027 0.0027 0.003 0.0033 0.0032 0.0031 0.0065 0.0068
Uncertainity of Sensitivity at ref. Cond. 0.058067 0.057912 0.054 0.04 0.025 0.025 0.039 0.05 0.054 0.053 0.058945 0.06415 0.083526Expanded Uncertainity dB 0.12 0.12 0.11 0.08 0.05 0.05 0.08 0.1 0.11 0.11 0.12 0.13 0.17 dB

31
SCL
Uncertainty Budget for LS2P Microphones
31.5 Hz 63.0 Hz 125.0 Hz 250.0 Hz 500.0 Hz 1.0 kHz 2.0 kHz 4.0 kHz 8.0 kHz 10.0 kHz 12.5 kHz 16.0 kHz 20.0 kHz 25.0 kHzElectrical Measurements1. Voltage ratios 4 4 4 4 4 4 4 4 4 4 4 4 4 42. Polarizing voltage 2 2 2 2 2 2 2 2 2 2 2 2 2 23. Frequency 1 1 1 1 1 1 1 1 1 1 1 1 1 14. Capacitance 2 2 2 2 2 2 2 2 2 2 2 2 2 2
Coupler Dimensions5. Coupler length 5 5 5 5 5 5 5 5 5 5 5 10 15 506. Coupler diameter 2 2 2 2 2 2 2 2 2 2 2 5 10 207. Coupler surface area 1 1 1 1 1 1 1 1 1 1 1 2 10 20
Microphone Parameters8. Font cavity depth 2 2 2 2 2 2 2 2 2 2 2 2 2 59. Front cavity volume 5 5 5 5 5 5 5 5 5 5 5 5 5 1010. Equivalent volume 5 5 5 5 5 5 5 5 5 5 5 5 5 1011. Resonant frequency 3 3 3 3 3 3 3 3 3 3 3 10 10 1512. Loss factor 3 3 3 3 3 3 3 3 3 3 3 10 10 15
Ambient Conditions13. Static pressure 3 3 3 3 3 3 3 3 3 3 3 3 3 314. Temperature 4 4 4 4 4 4 4 4 4 4 4 4 4 415. Pressure coeff. 10 2 2 2 2 2 2 2 2 2 2 5 10 1016. Temperature coeff. 10 2 2 2 2 2 2 2 2 2 2 5 10 10
Others 17. Theory imperfection 25 5 2 2 2 2 2 2 2 2 2 5 10 1018. Repeatability 20 10 10 10 10 10 10 10 10 10 10 10 20 20
Combined standard uncert. 37.1 16.9 16.2 16.2 16.2 16.2 16.2 16.2 16.2 16.2 16.2 24.7 37.8 68.7Coverage factor 2 2 2 2 2 2 2 2 2 2 2 2 2 2Expanded combined uncert. 74.2 33.8 32.5 32.5 32.5 32.5 32.5 32.5 32.5 32.5 32.5 49.3 75.6 137.5Stated Uncertainty 80 40 40 40 40 40 40 40 40 40 40 50 80 140
Standard uncertainty in 0.001 dBUncertainty Components

32
NML/SIRIM

33
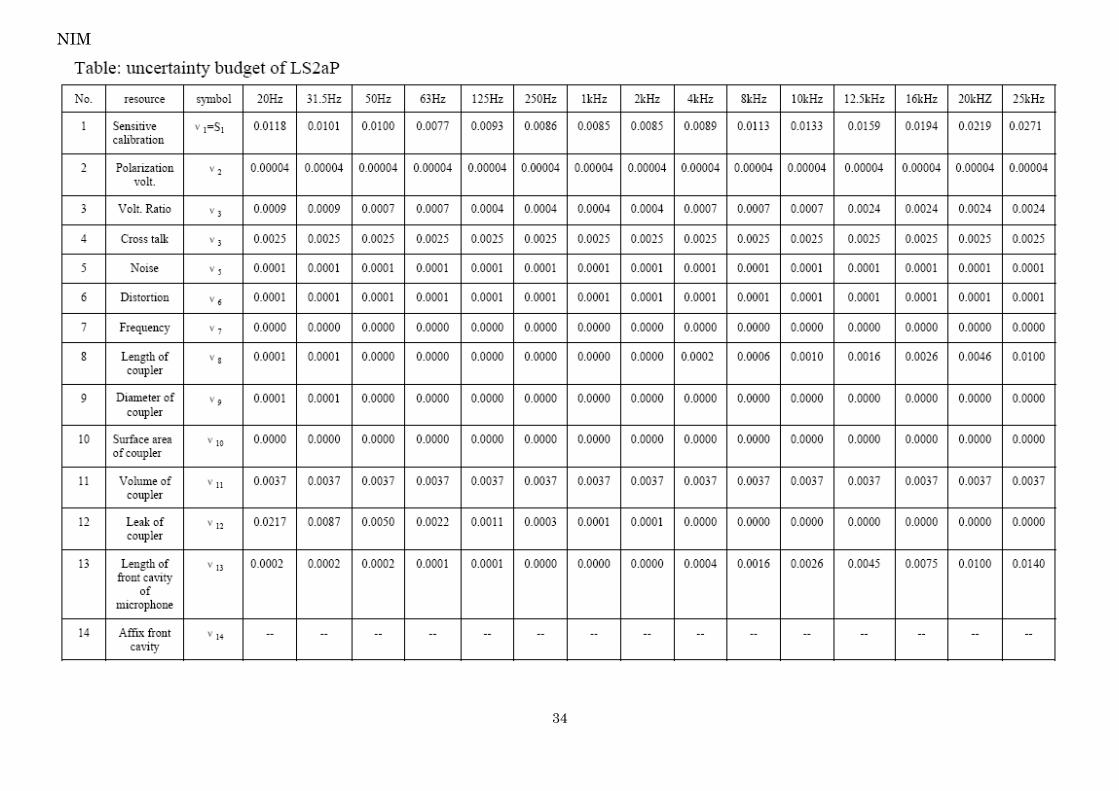
NMIJ
34
NIM

35
NMC

36
KRISS