report on energy sistem and waste management … · report on energy sistem and waste management on...
TRANSCRIPT
REPORT ON ENERGY SISTEM AND WASTE MANAGEMENT ON
CROATIAN ISLANDS
Alenka Kinderman Lončarević Hrvoje Požar Energy institute
Zagreb, Croatia
1. Basic information on Croatian islands
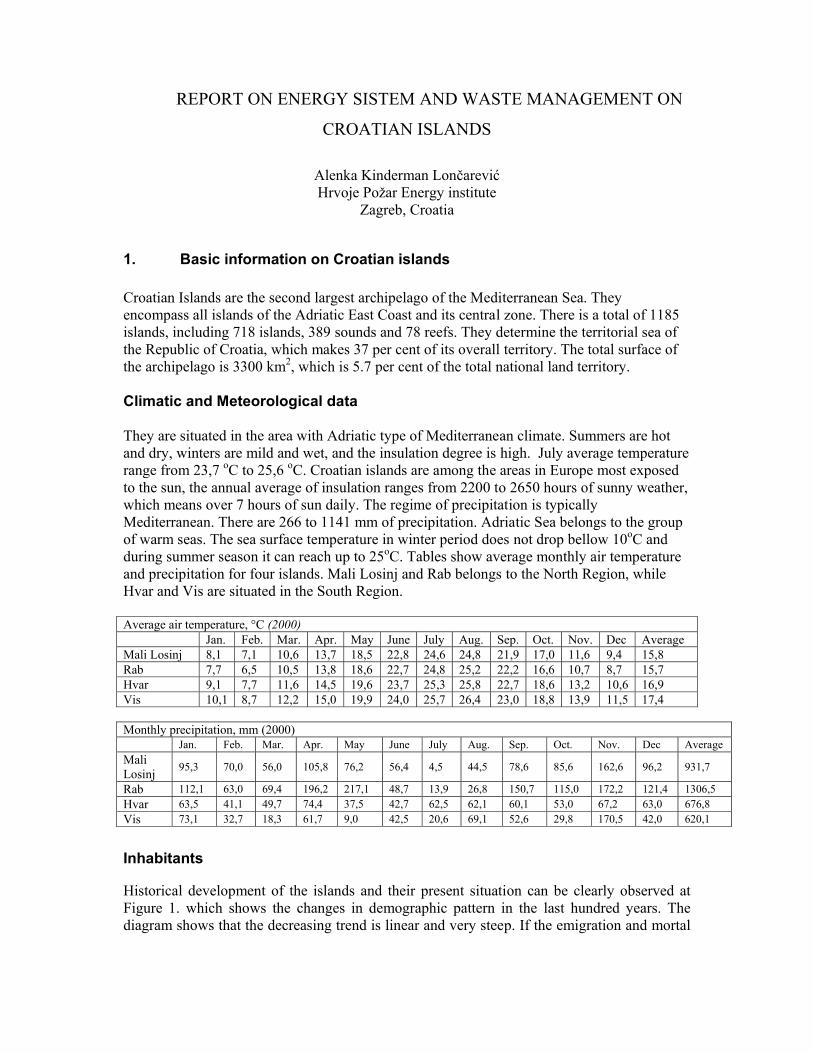
Croatian Islands are the second largest archipelago of the Mediterranean Sea. They encompass all islands of the Adriatic East Coast and its central zone. There is a total of 1185 islands, including 718 islands, 389 sounds and 78 reefs. They determine the territorial sea of the Republic of Croatia, which makes 37 per cent of its overall territory. The total surface of the archipelago is 3300 km2, which is 5.7 per cent of the total national land territory. Climatic and Meteorological data They are situated in the area with Adriatic type of Mediterranean climate. Summers are hot and dry, winters are mild and wet, and the insulation degree is high. July average temperature range from 23,7 oC to 25,6 oC. Croatian islands are among the areas in Europe most exposed to the sun, the annual average of insulation ranges from 2200 to 2650 hours of sunny weather, which means over 7 hours of sun daily. The regime of precipitation is typically Mediterranean. There are 266 to 1141 mm of precipitation. Adriatic Sea belongs to the group of warm seas. The sea surface temperature in winter period does not drop bellow 10oC and during summer season it can reach up to 25oC. Tables show average monthly air temperature and precipitation for four islands. Mali Losinj and Rab belongs to the North Region, while Hvar and Vis are situated in the South Region. Average air temperature, °C (2000) Jan. Feb. Mar. Apr. May June July Aug. Sep. Oct. Nov. Dec Average Mali Losinj 8,1 7,1 10,6 13,7 18,5 22,8 24,6 24,8 21,9 17,0 11,6 9,4 15,8 Rab 7,7 6,5 10,5 13,8 18,6 22,7 24,8 25,2 22,2 16,6 10,7 8,7 15,7 Hvar 9,1 7,7 11,6 14,5 19,6 23,7 25,3 25,8 22,7 18,6 13,2 10,6 16,9 Vis 10,1 8,7 12,2 15,0 19,9 24,0 25,7 26,4 23,0 18,8 13,9 11,5 17,4 Monthly precipitation, mm (2000) Jan. Feb. Mar. Apr. May June July Aug. Sep. Oct. Nov. Dec Average Mali Losinj 95,3 70,0 56,0 105,8 76,2 56,4 4,5 44,5 78,6 85,6 162,6 96,2 931,7
Rab 112,1 63,0 69,4 196,2 217,1 48,7 13,9 26,8 150,7 115,0 172,2 121,4 1306,5 Hvar 63,5 41,1 49,7 74,4 37,5 42,7 62,5 62,1 60,1 53,0 67,2 63,0 676,8 Vis 73,1 32,7 18,3 61,7 9,0 42,5 20,6 69,1 52,6 29,8 170,5 42,0 620,1
Inhabitants
Historical development of the islands and their present situation can be clearly observed at Figure 1. which shows the changes in demographic pattern in the last hundred years. The diagram shows that the decreasing trend is linear and very steep. If the emigration and mortal
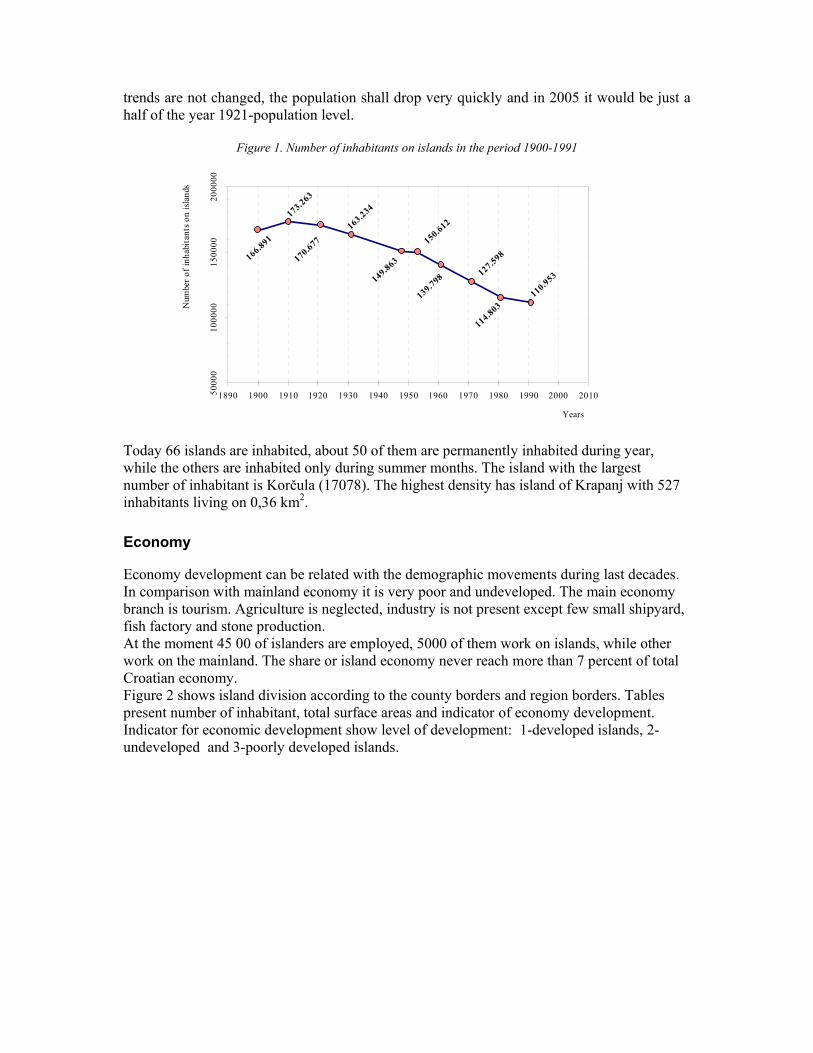
trends are not changed, the population shall drop very quickly and in 2005 it would be just a half of the year 1921-population level.
Figure 1. Number of inhabitants on islands in the period 1900-1991
Today 66 islands are inhabited, about 50 of them are permanently inhabited during year, while the others are inhabited only during summer months. The island with the largest number of inhabitant is Korčula (17078). The highest density has island of Krapanj with 527 inhabitants living on 0,36 km2.
Economy
Economy development can be related with the demographic movements during last decades. In comparison with mainland economy it is very poor and undeveloped. The main economy branch is tourism. Agriculture is neglected, industry is not present except few small shipyard, fish factory and stone production. At the moment 45 00 of islanders are employed, 5000 of them work on islands, while other work on the mainland. The share or island economy never reach more than 7 percent of total Croatian economy. Figure 2 shows island division according to the county borders and region borders. Tables present number of inhabitant, total surface areas and indicator of economy development. Indicator for economic development show level of development: 1-developed islands, 2-undeveloped and 3-poorly developed islands.
170.677163.234
150.612
166.891
173.263
149.863
139.798 127.598
114.803110.953
5000
010
0000
1500
0020
0000
1890 1900 1910 1920 1930 1940 1950 1960 1970 1980 1990 2000 2010
Years
Num
ber o
f inh
abita
nts o
n isl
ands

NORTH-DALMATIAN ISLANDSNo.inhabitants Total economic
1991 area,km2 developmentLičko-senjska countyPag 7969 285 1Zadarsko-Kninska CountyUgljan 7583 50,21 1Pašman 3349 63,34 1Dugi Otok 2873 114,44 2Vir 860 22,38 1Olib 714 25,63 3Iž 657 17,59 3Ist 237 9,65 3Vrgada 236 3,7 3Molat 222 22,74 3Sestrunj 221 15,41 3Silba 123 14,98 3Rava 120 3,6 3Premuda 73 6,25 3Zverinac 59 4,5 3Rivanj 20 4,4 3Škarda 4,2 3Šibenik countyMurter 5092 18,6 1Krapanj 2513 0,36 2Prvić 544 2,37 3Zlarin 359 8,19 3Žirje 160 15,4 3Kaprije 130 6,97 3Kornat 3 32,62 3
SOUTH-DALMATIAN ISLANDSNo.inhabitants Total economic
1991 area,km2 developmentDubrovačko-neretvanska countyKorčula 17038 276,03 1Mljet 1237 100,4 3Lastovo 1205 46,87 3Šipan 500 16,5 3Lopud 348 4,63 3Koločep 148 2,35 3Glavat 9 3Palagruža 7 20 3Sušac 7 4,6 3
KVARNER ISLANDSNo.inhabitants Total economic
1991 area,km2 developmentPrimorsko-goranska countyKrk 16402 405,78 1Rab 9205 90,84 1Lošinj 8346 74,68 1Cres 3238 405,78 1Susak 188 3,75 3Ilovik 145 5,88 3Unije 81 16,92 3
CENTRAL-DALMATIAN ISLANDSNo.inhabitants Total economic
1991 area,km2 developmentSplit-dalmatian countyBrač 13824 394,57 1Hvar 11450 295,71 1Vis 4338 88,29 3Čiovo 2529 28,8 1Šolta 1448 58,2 2Drvenik Veli 145 12,07 3Drvenik Mali 56 3,3 3Biševo 14 5,31 3
ISLANDS 718INHABITED ISLANDS 66INHABITANTS(1991) 125702HOUSEHOLDS 41869TOTAL AREA 3300 km2
AV. SUMMER TEMPERATURE 24,7 0C
NORTH-DALMATIAN ISLANDS
SOUTH-DALMATIAN ISLANDS
KVARNER ISLANDS
CENTRAL-DALMATIAN ISLANDS
ISLANDS 718INHABITED ISLANDS 66INHABITANTS 125702HOUSEHOLDS 41869TOTAL AREA 3300 km
24,7 C
Figgure 2: Regional division and basic data on inhabited islands

2. ENERGY SYSTEM ON CROATIAN ISLANDS The upgrading and improvement of living conditions on the islands, economic growth and preservation of environmental values, were the motives to introduce the National Program of Development of Islands. The Program is coordinated by Ministry of Reconstruction and Development of the Republic of Croatia and it systematically takes care of all segments of the problems related to the islands. With aim to improve energy economy of the islands, use of renewable energy sources, preservation of the environment, and to mobilize experts in accomplishing the tasks within the Croatian energy supply sector, special program CROTOK has been started. Within the CROTOK Program some preliminary researches have been conducted aimed at establishing the energy demand in household, services and industry sectors. Agriculture on the islands is very poorly developed, so its consumption in relation to other consumer groups is irrelevant. In addition to energy consumption in base year 1996, the Program includes a demand forecast until 2020. At present the problem is a structure of used energy products because the results show that the households mostly use fuel wood, around 60 per cent, while services and industry sectors cover their energy requirements with fuel oil and oil. Given the fundamental objectives of energy development of the Republic of Croatia, safety and reliability of the future energy supply can not depend on the above mentioned energy products.
2.1. ENERGY INFRASTRUCTURE All inhabited islands are connected to the national electric power system with undersea cables from mainland. During last few years very important project for two side islands connection was performed, so it can be said that islands are very well supply with electric energy. All other energy sources are imported with the ships. Energy prices on islands are the same as in the mainland. Table show prices for electricity and oil products in 2000.
Electric energy prices Oil product prices*
Consumers kn/kWh Type kn/lit** 110 kV 0,2462 MB-98 6,7 35 kV 0,3286 BMB-91 5,85 10 kV 0,4788 BMB-95 6,05 Households 0,4184 BMB-98 6,45 Services 0,6499 D-1 Public lighting 0,5007 D-2 Average 0,4519 DG 5,07 DG_blue 3,0 EL 3,1 Source: Energy in Croatia, 1996-2000 LS
*MB-98 – Leaded Motor Gasoline, BMB-91, MBM-95, BMB-98 – Unleaded Motor Gasoline, D-1, D-2, D-3 – Diesel, DG-Eurodiesel, DG-blue – Eurodiesel blue, EL – Light fuel for households, LS – Light fuel for industry **1 EURO – 7,4 kunas
2.2. PRESENT (1996) AND FUTURE ENERGY DEMAND The preliminary results of investigation on the program CROTOK show present energy consumption and predictions of future energy demands until 2020. The year 1996 has been taken as a reference year for which detailed energy consumption data by energy form and energy use are available. Projections of future energy demands have been made according to the general development projections, infrastructure development, the protection of the human environment, the development of the economic activities as well as the development of social activities. Energy system on islands is analyzed through three consumer categories : households, services and industry. Agriculture is not developed, so its consumption, compared to others sectors, is not significant.
2.2.1. PRESENT ENERGY CONSUMPTION
Energy consumption in households
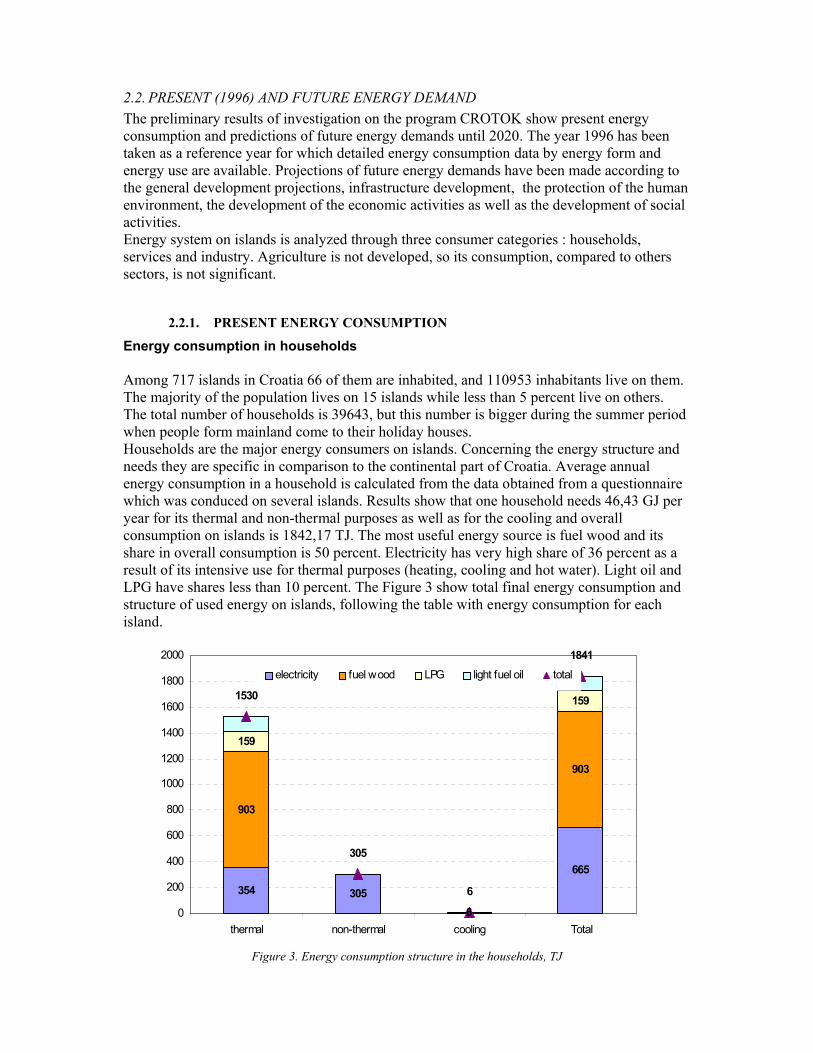
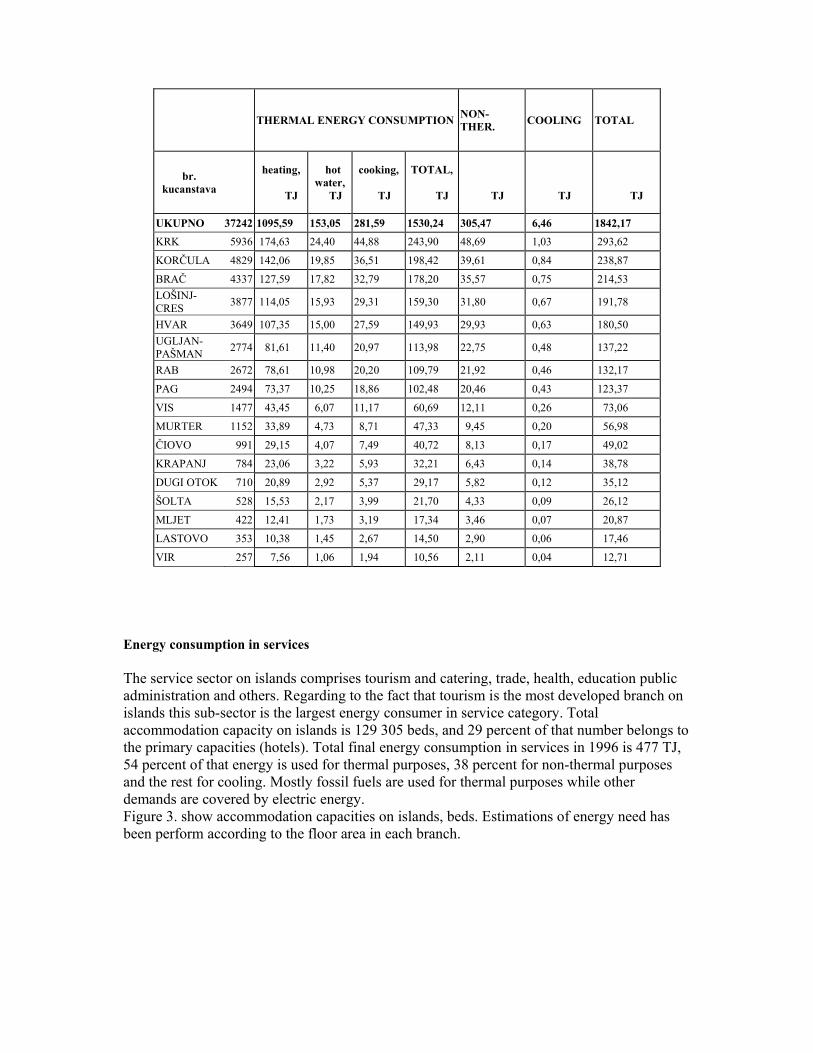
Among 717 islands in Croatia 66 of them are inhabited, and 110953 inhabitants live on them. The majority of the population lives on 15 islands while less than 5 percent live on others. The total number of households is 39643, but this number is bigger during the summer period when people form mainland come to their holiday houses. Households are the major energy consumers on islands. Concerning the energy structure and needs they are specific in comparison to the continental part of Croatia. Average annual energy consumption in a household is calculated from the data obtained from a questionnaire which was conduced on several islands. Results show that one household needs 46,43 GJ per year for its thermal and non-thermal purposes as well as for the cooling and overall consumption on islands is 1842,17 TJ. The most useful energy source is fuel wood and its share in overall consumption is 50 percent. Electricity has very high share of 36 percent as a result of its intensive use for thermal purposes (heating, cooling and hot water). Light oil and LPG have shares less than 10 percent. The Figure 3 show total final energy consumption and structure of used energy on islands, following the table with energy consumption for each island.
354 3056
665
903
903
159
1591530
305
6
1841
0
200
400
600
800
1000
1200
1400
1600
1800
2000
thermal non-thermal cooling Total
electricity fuel wood LPG light fuel oil total
Figure 3. Energy consumption structure in the households, TJ
THERMAL ENERGY CONSUMPTION NON-THER. COOLING TOTAL
br. kucanstava
heating,
TJ
hot water,
TJ
cooking,
TJ
TOTAL,
TJ
TJ
TJ
TJ
UKUPNO 37242 1095,59 153,05 281,59 1530,24 305,47 6,46 1842,17 KRK 5936 174,63 24,40 44,88 243,90 48,69 1,03 293,62
KORČULA 4829 142,06 19,85 36,51 198,42 39,61 0,84 238,87
BRAČ 4337 127,59 17,82 32,79 178,20 35,57 0,75 214,53 LOŠINJ-CRES 3877 114,05 15,93 29,31 159,30 31,80 0,67 191,78
HVAR 3649 107,35 15,00 27,59 149,93 29,93 0,63 180,50 UGLJAN-PAŠMAN 2774 81,61 11,40 20,97 113,98 22,75 0,48 137,22
RAB 2672 78,61 10,98 20,20 109,79 21,92 0,46 132,17
PAG 2494 73,37 10,25 18,86 102,48 20,46 0,43 123,37
VIS 1477 43,45 6,07 11,17 60,69 12,11 0,26 73,06
MURTER 1152 33,89 4,73 8,71 47,33 9,45 0,20 56,98
ČIOVO 991 29,15 4,07 7,49 40,72 8,13 0,17 49,02
KRAPANJ 784 23,06 3,22 5,93 32,21 6,43 0,14 38,78
DUGI OTOK 710 20,89 2,92 5,37 29,17 5,82 0,12 35,12
ŠOLTA 528 15,53 2,17 3,99 21,70 4,33 0,09 26,12
MLJET 422 12,41 1,73 3,19 17,34 3,46 0,07 20,87
LASTOVO 353 10,38 1,45 2,67 14,50 2,90 0,06 17,46
VIR 257 7,56 1,06 1,94 10,56 2,11 0,04 12,71
Energy consumption in services The service sector on islands comprises tourism and catering, trade, health, education public administration and others. Regarding to the fact that tourism is the most developed branch on islands this sub-sector is the largest energy consumer in service category. Total accommodation capacity on islands is 129 305 beds, and 29 percent of that number belongs to the primary capacities (hotels). Total final energy consumption in services in 1996 is 477 TJ, 54 percent of that energy is used for thermal purposes, 38 percent for non-thermal purposes and the rest for cooling. Mostly fossil fuels are used for thermal purposes while other demands are covered by electric energy. Figure 3. show accommodation capacities on islands, beds. Estimations of energy need has been perform according to the floor area in each branch.

Figure 4. Accommodation capacities on islands, beds
Table show final energy consumption for thermal purposes.
Electric energy Fossil fuels TOTAL
TJ GWh TJ TJ
Catering and tourism 44,1 12,3 154,5 210,9
Commerce 8,2 2,3 5,8 16,4 Health 0,0 0,0 0,0 0,0 Education 1,7 0,5 11,0 13,1 Administration 4,3 1,2 16,9 22,4 Total 58,3 16,2 188,3 262,8
Kvarner islands
16611
37945
23336
1238 4570
10000
20000
30000
40000
Hotels Campus Priv. rooms Resorts Others
North dalm atian islands
2888
11240
1712 0 00
10000
20000
30000
40000
Hotels Campus Priv. rooms Resorts Others
Central dalmatian islands
13352 11218
3138192 345
0
10000
20000
30000
40000
Hotels Campus Priv.rooms
Resorts Others
No.
of b
eds
South dalm atian islands
5083550 0 0 0
0
10000
20000
30000
40000
Hotels Campus Priv.rooms
Resorts Others
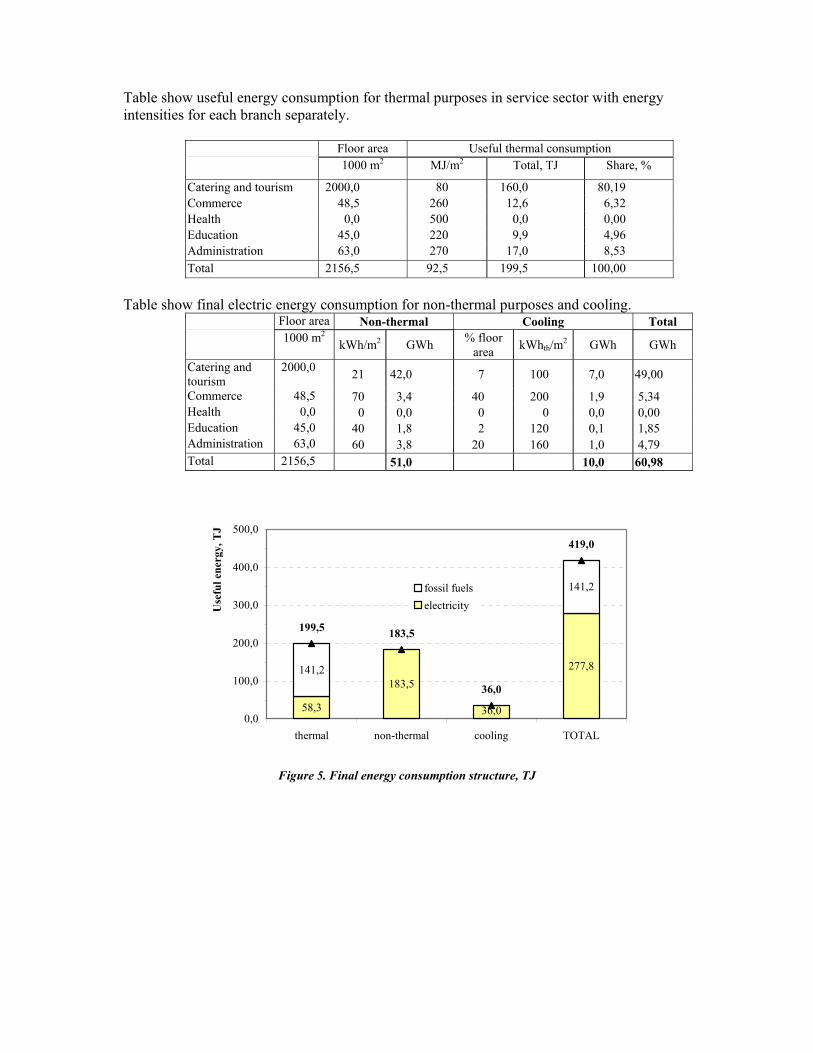
Table show useful energy consumption for thermal purposes in service sector with energy intensities for each branch separately.
Floor area Useful thermal consumption 1000 m2 MJ/m2 Total, TJ Share, %
Catering and tourism 2000,0 80 160,0 80,19 Commerce 48,5 260 12,6 6,32 Health 0,0 500 0,0 0,00 Education 45,0 220 9,9 4,96 Administration 63,0 270 17,0 8,53 Total 2156,5 92,5 199,5 100,00
Table show final electric energy consumption for non-thermal purposes and cooling.
Floor area Non-thermal Cooling Total
1000 m2 kWh/m2 GWh % floor
area kWhth/m2 GWh GWh
Catering and tourism
2000,0 21 42,0 7 100 7,0 49,00
Commerce 48,5 70 3,4 40 200 1,9 5,34 Health 0,0 0 0,0 0 0 0,0 0,00 Education 45,0 40 1,8 2 120 0,1 1,85 Administration 63,0 60 3,8 20 160 1,0 4,79 Total 2156,5 51,0 10,0 60,98
Figure 5. Final energy consumption structure, TJ
58,3
183,5277,8141,2
141,2
36,0
199,5 183,5
36,0
419,0
0,0
100,0
200,0
300,0
400,0
500,0
thermal non-thermal cooling TOTAL
Use
ful e
nerg
y, T
J
fossil fuelselectricity

Energy consumption in industry Energy consumption in industry on islands is analyzed through consumption in food industry, shipbuilding, textile industry and industry for architectonic stone and salt production. The table show total final energy consumption on islands in industry.
1995 1996
nat. units TJ % nat. units TJ % Hard coal tons 1 0,029 0,01 233 6,829 2,71 Coke tons 8 0,234 0,10 0 0,000 0,00 SOLID FUELS 0,264 0,11 6,829 2,71 LPG tons 2 0,094 0,04 24 1,125 0,45 Fuel oil tons 958 40,916 16,86 1156 49,373 19,61 Oil tons 3618 145,407 59,91 3280 131,823 52,37 LIQUID FUELS 186,417 76,82 182,321 72,43 ELECTRICITY MWh 15549 55,976 23,07 16946 61,006 24,86 TOTAL,TJ 242,658 100,0 250,156 100,0
Figure 6. Energy structure in industry consumption, TJ Table show final energy consumption in islands related to the industry branches, TJ
VIS BRAČ PAG KORČULA CRES-LOŠINJ HVAR KRK RAB UKUPNO
TJ textile 0,17 0,04 0,00 1,29 0,46 0,00 20,49 0,00 22,45 wood production 0,00 0,00 0,00 21,11 7,47 0,00 1,43 0,00 30,02 food production. 12,02 26,90 0,54 20,13 0,00 3,78 0,66 1,72 65,74 chemical 0,00 0,35 2,16 0,00 0,00 1,25 0,39 0,00 4,14 construction (stone, etc), 0,00 24,88 0,00 0,00 0,00 0,00 0,00 0,00 24,88
minerals (salt) 0,00 0,00 97,98 3,32 0,00 0,00 0,00 0,00 101,29 others 0,04 0,04 0,00 0,61 0,40 0,04 0,45 0,58 2,17 Total 12,23 52,17 100,68 46,46 7,93 5,03 22,97 2,73 250,19
SOLID FUELS
3%ELECTRICITY
24%
LIQUID FUELS
73%

Total thermal energy consumption on islands in 1996 Figure 7 shows total thermal energy consumption on islands according to their geographical position and consumer category in 1996. Total amount of used energy was 1206 TJ, 74 percent belonging to households, 16 percent to services and 10 percent to industry.
Figure 7. Thermal energy consumption on islands in 1996.
KVARNER ISLANDS
300,80
87,36
16,77
050
100150
200250
300350
HOUSEHOLDS SERVICES INDSUTRY
TJ
NO RTHDALMATAN ISLANDS
264,59
15,1951,66
0
50
100
150
200
250
300
350
HOUSEHOLDS SERVICES INDSUT RY
TJ
CENTRALDALMATIAN ISLANDS
135,02
70,2235,55
0
50
100
150
200
250
300
350
HOUSEHOLDS SERVICES INDSUTRY
TJ
SO UTHDALMATIAN ISLAND
196,85
26,73 23,80
0
50
100
150
200
250
300
350
HOUSEHOLDS SERVICES INDSUT RY
TJ

2.2.2. PREDICTION OF FUTURE ENERGY DEMAND ON ISLANDS UNTIL 2020
Base year energy consumption is the main prerequisite for the elaboration of energy balances. The figure and table show t end-use energy consumption prediction on islands until 2020, TJ for all three categories of consumption : households, industry and services.
1791
2218
3193
3710
4269
2656
010
0020
0030
0040
0050
00
1996 2000 2005 2010 2015 2020
YEARS
ENER
GY
, TJ
HOUSEHOLDS SERVICE
INDUSTRY TOTAL
Figure 8. Energy consumption prediction until 2020, TJ
1996 TJ
2000 TJ
2005 TJ
2010 TJ
2015 TJ
2020 TJ
HOUSEHOLDS 1204,68 1435,00 1673,00 1890,00 2060,00 2228,39 SERVICES 419,04 640,00 900,00 1150,00 1420,00 1707,38 INDUSTRY 166,81 220,00 285,00 320,00 330,00 333,62 TOTAL 1790,53 2295,00 2858,00 3360,00 3810,00 4269,39
Total end-use energy demand on islands in 2020 will be 2,38 times bigger than in 1996. The highest increase will have the service sector because of the planned intensive development of tourism as a leading economy branch on islands. With that the share of service sector will increase in total consumption. Energy consumption in households will also rise. Until 2020 their demand will increase about twice. It is predicted that the number of inhabitants on islands will rise. Also, a better living standard is predicted, so the average yearly consumption per households will grow up as well. Also, energy consumption in industry and agriculture will rise, however their share in total energy consumption will stay the same.
2.3.
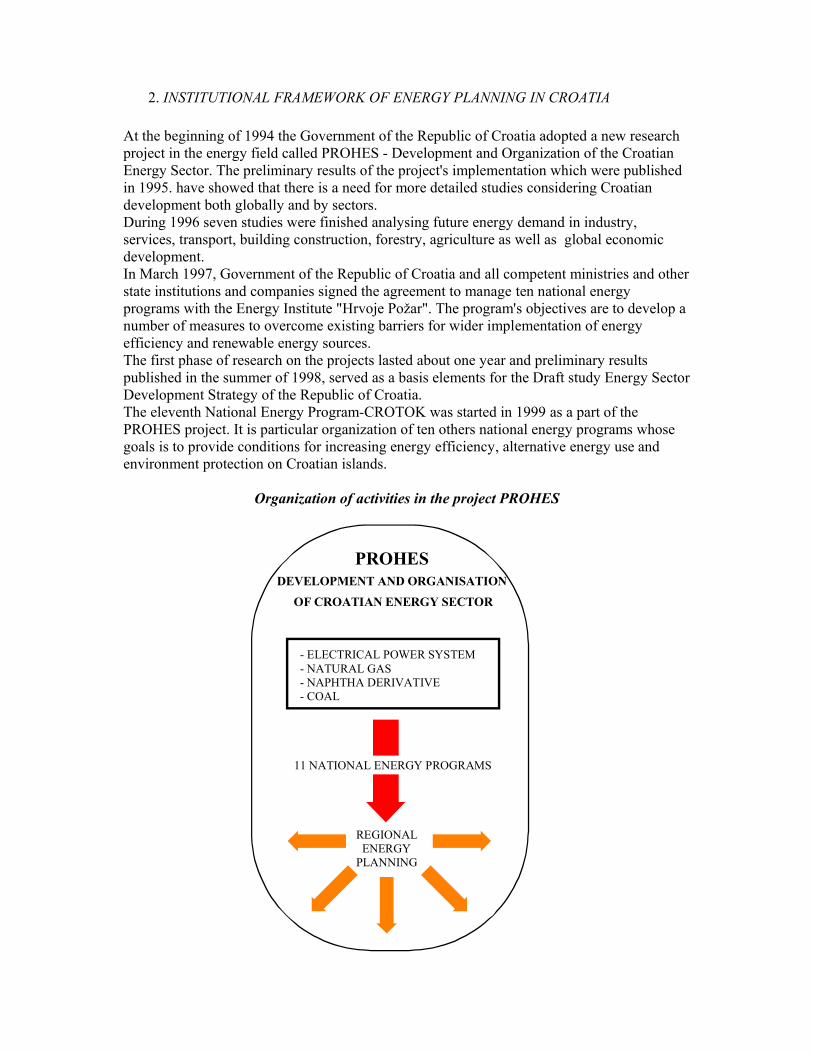
2. INSTITUTIONAL FRAMEWORK OF ENERGY PLANNING IN CROATIA At the beginning of 1994 the Government of the Republic of Croatia adopted a new research project in the energy field called PROHES - Development and Organization of the Croatian Energy Sector. The preliminary results of the project's implementation which were published in 1995. have showed that there is a need for more detailed studies considering Croatian development both globally and by sectors. During 1996 seven studies were finished analysing future energy demand in industry, services, transport, building construction, forestry, agriculture as well as global economic development. In March 1997, Government of the Republic of Croatia and all competent ministries and other state institutions and companies signed the agreement to manage ten national energy programs with the Energy Institute "Hrvoje Požar". The program's objectives are to develop a number of measures to overcome existing barriers for wider implementation of energy efficiency and renewable energy sources. The first phase of research on the projects lasted about one year and preliminary results published in the summer of 1998, served as a basis elements for the Draft study Energy Sector Development Strategy of the Republic of Croatia. The eleventh National Energy Program-CROTOK was started in 1999 as a part of the PROHES project. It is particular organization of ten others national energy programs whose goals is to provide conditions for increasing energy efficiency, alternative energy use and environment protection on Croatian islands.
Organization of activities in the project PROHES
- ELECTRICAL POWER SYSTEM - NATURAL GAS - NAPHTHA DERIVATIVE - COAL
11 NATIONAL ENERGY PROGRAMS
REGIONAL ENERGY PLANNING
PROHESDEVELOPMENT AND ORGANISATION
OF CROATIAN ENERGY SECTOR

2.4. NATIONAL ENERGY PROGRAMS IN CROATIA PLINCRO - Gasification program in Croatia Program objective is to increase use of gas n energy consumption structure as whole as a prerequisite for gas network expanding to all until now non-gasified regions. Currently, about 15% of Croatian households are connected to gas pipeline system and until 2025 the expected increase is about 40 %. KOGEN-Cogeneration Program Currently, cogeneration plants contribute to almost 10 % of the Croatian electric consumption. Program objective is to obtain all preconditions and take off the obstacles for increasing cogeneration plants construction, everywhere where heat and electricity are used in technological processes. MIEE Network of Industrial Efficient Use of Energy The network installing program objective is to ensure all institutional , organizational and expert prerequisites for increasing energy efficiency in industry, service and public sector, based in experiences of developed countries. MAHE-Small Hydro Power Plants Construction Program This program aims to provide all conditions for a great number of small plants construction. total amount of the installed power in small hydro power plants is 24 MW and technical potential is estimated at around 150 MW SUNEN - Solar Energy Use Program This program objective is to give all legal, incentive, promotional and other prerequisites for significant solar energy use. At the present level, total potential of solar energy is estimated at 1,4 PJ in 2000, about 5 PJ in 2010 and about 15 PJ in 2020. The potential of passive solar architecture is estimated at about 350 TJ in 2000 and 6430 TJ in 2020. BIOEN- Biomass and Waste Use Program The program plans to use waste-wood, straw, biogas , and other waste, and conversion from biomass to liquid fuel (ethanol, methanol). The total energy resources of biomass in Croatia are at about 50 PJ whereby 39 PJ makes technical energy resource that can be used today. ENWIND-Wind Energy use program the program has shown that the yearly electric energy production from wind energy could be between 380 and 790 GWh on 29 locations analysed. apart from production of electric energy the wind generators can be used in water supply systems (desalination) what is also interested for the Adriatic islands. GEOEN - Geothermal Energy Use Program In Croatia there is e hundreds years old tradition of using geothermal energy from natural resources for medical and bathing purposes. It is also possible to use thermal potential in agriculture, hospitals, hotels, residential buildings, etc. The amount of geothermal energy resources of the known deposits in Croatia is 812 MWt and 45,8 MWe. KUENzgrada- Building Energy Efficiency Program The program of energy efficiency in building construction includes the changes of regulation in order to favor increase of thermal insulation and reconstruction of existing residence buildings. KUENcts-Energy Efficiency in Centralised Thermal Systems Program The aim of the program is to define all conditions for energy efficiency increase, ranging from thermal consumption measuring to the overall situation in the energy sector in therms of ownership and economy. CROTOK-Energy development on islandsThe goal of the program of energy development on islands is to ensure institutional, organizational and expert prerequisites for increasing energy efficiency and alternative energy use on islands.

2.5. ENERGY PLANNING ON CROATIAN ISLANDS Regarding to the specific climate, economy and energy supply system in particular areas in the Republic of Croatia it is necessary to organize regional energy planning. The basic administrative unit of the regional planning of energy sector in Croatia is a county. In addition to that, the area of planning may include more counties at the regional level or certain specific parts of some counties, as for example, the Croatian islands. However, regional development of energy sector must be in co-ordination with development on national level, especially with electric power and gas system as well as with system for oil derivatives production and distribution. Energy offices will undertake the responsibility for the duration of the process of energy planning in the counties and for the implementation of the plans. Those offices will be given expert and scientific support for their activities by the Energy institute "Hrvoje Požar" and regional centres in Split, Rijeka and Osijek. Basically, a necessary level of uniformity in the methodological part of the co-operation between certain centres and offices would be in charge of Energy institute. Croatian islands are a specific natural resource of the Republic of Croatia and their geographic and economic characteristics demand a special approach in management of energy generation and consumption. Therefore, they are organized as separate regional entity and corresponding Counties and their energy offices will take responsibility of energy development on islands.
Relations between the country energy offices and regional energy centres
2.6. GovernmentMinistry of Economy
Energy Institute "Hrvoje Požar"
Energy centers
Rijeka Split Osijek
Counties energy offices
. . . . . . . .

METHODOLOGICAL CONCEPT OF ENERGY PLANNING ON ISLANDS The methodological concept of the island's energy system development is based on the regional energy system planning in the countries of the European Union using the Least-Cost Planning and Demand Side Management methods. In Croatia, such experiences were achieved through the project Regional energy planning in Istria (Sinergy, Exergija, EIHP). The development plan evolves in two phases. The first phase is the elaboration of the starting points followed by the definition of the development plan for the improvement of energy efficiency and renewable resource utilization. Both phases, including the individual steps, are shown in figure:
BASE PLATFORM
FUTURE CONSUMPTION ASSESSMENT OF USEFULHEAT, ELECTRIC ENERGY AND MOTOR FUELS
SUPPLY FROM RENEWABLE RESOURCES ANDDEMAND SIDE MANAGEMENT
EMISSIONS FROMISLAND'S NON-ENERGY
SOURCES
ENVIRONMENTALPROTECTION
ENVIRONMENTALCRITERIA FOR AIR,WATER AND SOIL
QUALITY
ENERGYDATABASE
ECONOMIC DEVELOPMENT - demography - employment - housing potential - transport policy
CURRENTSTATE'SENERGYBALANCE
EXISTING STATEOF POLLUTANT
EMISSIONS
RENEWABLERESOURCESPOTENTIAL
PRESENT AND FUTURETECHNOLOGIES FOR
ENERGY CONSUMPTION,TRANSMISSION AND
GENERATION
POLLUTANT EMISSIONSFROM ISLAND'S
ENERGY SYSTEM
TRANSBOUNDARY NOXIOUSSUBSTANCES' EMISSIONS
- Economic development of the island determines its energy system development, therefore it is necessary to conduct an analysis of all available resources. - Energy data base shows the current state of affairs of the energy consumption and at the same time creates the basis for further planning of the island's energy system development. It consists of individual consumer categories and energy consumption according to structure and purpose (heating, non-heating, cooling). Most of the data necessary for the elaboration of the data base can be gathered through public opinion polls with the authozised institutions furnishing some general data. - Renewable energy potential is elaborated based on the location records of all possible renewable energy resources. - Housing potential data review the existing buildings according to their purpose, type, age, heating conditions etc., and are also gathered through opinion polls. - Pollutant emissions with the existing energy consumption result from the present records and measurements. - Analysis of current consumption and future needs of useful energy in all consumption sectors is performed by means of several scenarios. It is based on the main economic development guidelines and some other elements such as demography, climate, technological progress, etc. - Possible renewable resource utilisation and energy efficiency enhancement in order to meet future needs: The competitiveness of the renewable energy potential is compared to the classical supply systems in time sequence. Improved energy efficiency in hotel business, industry and building construction also affects future supply and profitability of investments.

- According to the foreseen scenarios of energy consumption and supply, pollutant emissions create a limiting factor which will bear influence on the structure of the energy consumed.
3. WASTE MANAGEMENT ON ISLANDS All settlements on islands have own, but uncontrolled waste disposals, containing often dangerous substances. Usually, disposals are situated very close to the towns and villages. Larger islands have own companies which collect, transport and dispose communal waste. Other kinds of waste, as industrial and special waste, are not included in organised waste collection. Data about solid waste are collected only for the islands of Cres, Mali Lošinj, Krk i Rab in 1996.
3.1.
mm
una
l In
dust
rial
w
aste
Hos
pita
l w
aste
Oils
Balla
sts f
rom
sh
ips
Anim
al w
aste
Spec
ial w
aste
Solid
s fro
m
was
tew
ater
Ove
r siz
e w
aste
Con
stru
ctio
n w
aste
TOTA
L
Cres-Lošinj 4248 3693 45 42 900 47 480 420 241 3615 13731
Krk 6091 2178 182 280 900 410 818 730 350 5240 17179
Rab 3201 73 29 45 46 231 320 189 2840 6974
At all locations surface waters are polluted in contact with waste and go into the ground. Form hydrogeology point of view they are dangerous for environment. Despite there is not such a data for all islands, we can suppose that situation is very similar on them. Technologies for energy waste treatment: Island of Zlarin Island of Zlarin is small island with about 350 inhabitants. At the and of month June morden waste burning plan will start to work. The plant was constructed in USA in Maglite company. Owner of this company, Mr. Maglica, originate from Island of Zlarin, so this technology is his gift to island to improve energy supply, as well to solve waste disposal problem. It capacity is 8760 tons/year and it is ecologically tested. Additional data is possible to obtain at the end of Jule directly from Mr. Maglica. Island of Lopud Waste burning plant is constructed in the Hotel Lafodia with aim to ensure additional thermal energy for laundry purposes. This plant is not working yet.