report itu-r m.2031 - compatibility between wcdma · pdf filerep. itu-r m.2031 1 report itu-r...
TRANSCRIPT

Rep. ITU-R M.2031 1
REPORT ITU-R M.2031
Compatibility between WCDMA 1800 downlink and GSM 1900 uplink
(Question ITU-R 229/8)
(2003)
1 Introduction
1.1 Introduction and outline of the Report
This Report discusses the compatibility analysis of radio coexistence between wideband CDMA deployed in the 1 800 MHz bands (WCDMA 1800) and GSM deployed in the PCS 1900 bands (GSM 1900) in adjacent bands and opposite duplex direction. The objective is to determine by means of deterministic calculations and Monte Carlo simulations the amount of guardband necessary to protect the two adjacent services against mutual interference. The deterministic calculations have been applied to the base station to base station (BS-BS) scenarios. Monte Carlo simulations have been used to investigate both the mobile station to mobile station (MS-MS) and BS-BS scenarios.
This Report is arranged as follows: in § 2, the assumptions pertaining to the BS-BS interference scenario are recalled. § 3 examines the impact of WCDMA 1800 BS interference on GSM 1900 uplinks by means of deterministic calculations, whereas § 4 presents the Monte Carlo simulation results of the BS-BS and MS-MS scenarios. The Appendix summarizes the methodology and assumptions specific to the Monte Carlo simulations.
1.2 Background
The analysed phase 1 of personal communication system (PCS) evolution is characterised by the introduction of IMT-2000 technologies in the 1 710-1 755/1 800-1 845 MHz bands. The proposed allocation is considering a 5 MHz guardband between the WCDMA 1800 downlink band and the PCS 1900 uplink band, as highlighted in Fig. 1.
Rap 2031-01
1 700 1 750 1 800 1 850 1 900 MHz
PCS-Bphase 1
MS Tx BSTx
PCSMS Tx
FIGURE 1Analysed phase 1 of PCS evolution

2 Rep. ITU-R M.2031
This Report considers interference from the WCDMA 1800 system (specifications not yet finalized) to an existing GSM 1900 system when considering various spectrum arrangements in the bands 1 710-1 990 MHz, e.g. on the spectrum border at 1 850 MHz, denoted guardband (GB) as depicted in Fig. 2.
Rap 2031-02
1 850 MHz
FIGURE 2WCDMA 1800 dowlink and GSM 1900 uplink
GSMGBWCDMA
As an example, we are addressing here the GSM 1900 system but there are also other technologies in the PCS bands, such as IS-95 and TDMA (IS-136) where similar potential interference exists. This sharing situation will occur if portions of both the WCDMA 1800 and the PCS 1900 bands are allocated in the same geographical area. This causes potential mobile MS-MS as well as BS-BS interference.
The deterministic calculations (worst case analysis) and the Monte Carlo simulations are two methodologies that complement each other. While deterministic calculations consider worst-case values for the systems parameters, statistical approaches like Monte Carlo simulations give access to an estimate of the probability with which this worst case will occur.
The Monte Carlo methodology applied to the analysis of radio systems coexistence is now widely approved and recommended by the Electronic Communication Committee (ECC)1, Report ITU-R SM.2028 and third generation partnership project (3GPP)2. The 3GPP-based Monte Carlo methodology has been used to analyse the guardband needed between the WCDMA 1800 and PCS 1900 bands. Simulation results pertaining to the macro-cellular environment are reported and discussed in this document. The simulation methodology and assumptions are described in details in Appendix 1.
2 Assumptions for the BS-BS scenario
Table 1 aims at summarizing the assumptions adopted for the study. An objective of this section is also to clarify the relationship that exists between the carrier-to-carrier spacing and the guardband parameters.
1 CEPT ECC Report 68, downloadable from ERO website http://www.ero.dk/.
2 RF System Scenarios – 3GPP TR 25.942 v2.3.1.

Rep. ITU-R M.2031 3
TABLE 1
Assumptions for the deterministic calculations and the Monte Carlo simulations
Figure 3 presents the WCDMA carrier-to-GSM carrier spacing when no guardband is introduced between the WCDMA and the GSM allocations. As a consequence there is the following linear relationship between carrier-to-carrier spacing and guardband:
Guardband = Carrier-to-carrier spacing (MHz) – 2.8 MHz
Rap 2031-03
FIGURE 3For 5 MHz allocated bandwidth - carrier-to-carrier spacing is 2.8 MHz*
5 MHz channel
3.84 MHz WCDMA
200 kHz rasterClosest blocker
2.8 MHz2.4 MHz
2.6 MHz
400 kHz
GSM
Band edge * Carrier to carrier spacing for UMTS-1800 – Motorola – 3GPP TSG RAN WG4 R4-1800AH 0112 – 1800/1900
ad hoc meeting, Seattle, United States of America, 2-3 May 2001.
3 UTRA (BS) FDD; Radio Transmission and Reception – 3GPP TS 25.104 v3.4.0. 4 Results of UMTS1800/GSM Co-existence Simulations (Uplink) – 3GPP TSG RAN WG4 – Ericsson –
TSG R4 No. 15 (01) 0344 [February 2001]. This contains the UMTS 1800 simulation assumptions agreed within 3GPP RAN WG4.
Deterministic calculations
Monte Carlo simulations
WCDMA 1800 BS transmitter power (dBm) 43 43 60 dB (carrier-to-carrier
spacing = 5 MHz)3 63,7 dB
(guardband = 5 MHz)3 WCDMA 1800 BS adjacent channel leakage ratio (ACLR) 72 dB (carrier-to-carrier
spacing =10 MHz)3 81 dB
(guardband = 10 MHz)3 WCDMA 1800 BS transmitter antenna gain (dBi)
14 114
GSM 1900 BS receiver antenna gain (dBi) 12 114 GSM 1900 base transceiver station (BTS) sensitivity (dBm)
–104 –1074
GSM receiver power (dBm) –101 Not deterministic → simulated C/I target (GSM 1900 uplink) (dB) 9 64 BS-BS propagation model Dual-slope
line-of-sight LoS (see § 3)
Free space (see Appendix 1)

4 Rep. ITU-R M.2031
3 Deterministic calculations
The following study highlights the potential interference from the WCDMA downlink transmission to the GSM uplink reception in a base-to-base constellation when considering a rooftop installation scenario. In this section, only the WCDMA out-of-band transmission is considered, i.e. the WCDMA BS transmitter is suggested to be the limiting factor to the performance. It is noted that similar studies are also required in the opposite direction involving the terminals.
BSs are supposed to be located within LoS, and consequently, the dual-slope LoS propagation model is used. Assuming a carrier frequency of about 2 GHz, the path loss is calculated as:
≥+−≤≤+
=breakbreak
breakLoSddddddd
Lfor)(log40)(log205.38
1for)(log205.38
1010
10
With an effective BS height over the reflecting surface of 6 m (BS height = 30 m, average building height = 24 m), the breakpoint, dbreak, is 960 m (dbreak = 4 · ht x · hr x/λ).
3.1 Adjacent channel interference
The adjacent channel interference (ACI) is calculated as:
convBWLGGACLRPACI xrAxtAxt _,, −−++−= dBm
where: Pt x : WCDMA BS output power ACLR : adjacent channel leakage power ratio GA,t x and GA,r x : transmitter and receiver antenna gain respectively L : path loss BW_conv : bandwidth conversion factor.
3.2 Minimum coupling loss
Given a maximum value of the adjacent channel interference, ACImax, we can calculate the minimum required path loss, Lmin, denoted as the minimum coupling loss (MCL).
maxxrAxtAxtmin ACIconvBWGGACLRPL −−++−= _,, dB
3.3 Minimum separation distance
The minimum required path loss is then transferred to a minimum separation distance (MSD) by means of the propagation model. Assuming that the ACI must not exceed the noise floor at the sensitivity level, ACImax can be set to:
GSM
xrmax ICSACI −= dBm
where: Sr x : GSM sensitivity level
:GSMI
C required GSM C/I.

Rep. ITU-R M.2031 5
Given the parameter values below, the minimum required path loss and separation distance could be found in Table 2.
Pt x = 43 dBm
ACLR = 46/58 dB for 5/10 MHz carrier separation (∆ f )
GA,t x = 14 dB
GA,r x = 12 dB
Sr x = −104 dBm
C/IGSM = 9 dB
BW_conv = 5 MHz/200 kHz = 14 dB.
TABLE 2
Minimum required path loss and separation distance between WCDMA 1800 and GSM 1900 BSs
4 Monte Carlo simulations
4.1 BS-BS scenario
4.1.1 BSs co-siting
Monte Carlo simulations have been run using the 3GPP assumed BS-BS MCL value of 30 dB (including antenna gains2) and a level of unwanted emission from the WCDMA BS compliant with current 3GPP specifications3. Fig. 4 shows that WCDMA BS interference is causing more than 90% outage on the GSM uplink for a 5 MHz guardband.
This degradation can be limited by taking into account more realistic values for the following parameters:
– The BS-BS minimum coupling loss.
– The WCDMA BS unwanted emissions level.
– The guardband value between the WCDMA 1800 and PCS 1900 bands.
The geographical shift of interfering BSs is also investigated (§ 4.1.2).
∆ f / guardband (MHz) 5/2.2 10/7.2
Minimum path loss, Lmin (dB) 122 110
MSD (m) 3 790 1 900

6 Rep. ITU-R M.2031
4.1.1.1 BS-BS minimum coupling loss impact on GSM outage
The influence of the minimum coupling loss between the WCDMA and GSM BSs antennas on the GSM capacity loss has been investigated. Since the MCL value of 30 dB specified in 3GPP TS 25.104 is a worst-case value, higher MCL values have been considered in this study5. Results for MCL of 40, 50 and 60 dB are presented in Fig. 4. It is found that when considering a guardband of 5 MHz, GSM capacity loss can be reduced down to around 6% by applying a MCL value of 60 dB.
Rap 2031-04
100908070605040302010
0
FIGURE 4GSM outage for 3GPP unwanted emission level*
MCL = 30 dB
MCL = 40 dB
MCL = 50 dB
MCL = 60 dB
2.5 7.55 10 15
GSM
BS
outa
ge le
vel (
%)
Guardband (MHz)
* See footnote3.
4.1.1.2 WCDMA BS unwanted emissions impact on GSM outage
The same set of Monte Carlo simulations have been run under the assumption of a lower WCDMA BS unwanted emission level (margins of 10 dB and 20 dB have been added to the 3GPP unwanted emission level to take into account additional filtering at the WCDMA BS transmitter for frequency offset greater than 7.8 MHz).
Outage figures for MCL values of 30 dB (3GPP specifications), 40 dB and 50 dB are presented in Fig. 5 (10 dB margin) and in Fig. 6 (20 dB margin). The results show that for a guardband of 5 MHz between the GSM and WCDMA bands in opposite duplex direction, GSM outage level is less than 5% for the 10 dB margin and for MCL higher or equal to 50 dB. When considering the 20 dB margin case, an MCL value of 40 dB is sufficient to reduce GSM system outage below 5%.
5 Antenna-to-antenna Isolation Measurements – 3GPP TSG RAN WG4 – Allgon – TSG R4 No. 8 (99)631 [October 1999].

Rep. ITU-R M.2031 7
Rap 2031-05
100908070605040302010
0
FIGURE 5GSM outage for WCDMA BS unwanted emission level 10 dB lower
than 3GPP specifications for frequency offsetsgreater than 7.8 MHz*
MCL = 30 dB
MCL = 40 dB
MCL = 50 dB
2.5 7.55 10
GSM
BS
outa
ge (%
)
Guardband (MHz)
* See footnote3.
Figures 5 and 6 when compared to Fig. 4 show that MCL and additional filtering at the WCDMA BS have an equivalent quantitative impact on the GSM system outage in uplink, so that a trade-off between these two mitigating factors is possible.
Rap 2031-06
80
70
60
50
40
30
20
10
0
FIGURE 6GSM outage for WCDMA BS unwanted emission level 20 dB lower
than 3GPP specifications for frequency offsetsgreater than 7.8 MHz*
MCL = 30 dB
MCL = 40 dB
MCL = 50 dB
2.5 7.55 10
GSM
BS
outa
ge (%
)
Guardband (MHz)
* See footnote3.

8 Rep. ITU-R M.2031
4.1.1.3 Power levels statistics
This section proposes to further investigate the BS-BS scenario in co-siting by analysing the GSM BTS received power statistics.
The victim GSM uplink signal and the interfering WCDMA BS signal levels have been computed from the simulations by considering various scenarios (varying the MCL, the additional filtering and the cell size). Their statistics are presented in this section. The objective was to further investigate the influence of the antenna isolation (modelled by the MCL parameter) and the WCDMA BTS additional filtering.
An understanding of these distributions will also help the comprehension of the role played by the GSM power control mechanism in the mitigation of the WCDMA interference.
GSM only (no WCDMA interference; cell radius = 577 m)
Figures 7 and 8 respectively show the distribution of GSM wanted power level and intra-system interference power received at the GSM BTS. The narrow distribution obtained for the intra-system interference power in Fig. 8 shows that the GSM system achieves an intra-system interference level between –114 dBm and –110 dBm for more than 85% of the uplinks.
Rap 2031-07
20
15
10
5
0
25
–120 –112 –104 –96 –88 –80 –72 –64 –56 –48 –40
FIGURE 7GSM received signal strength when GSM network is isolated
Wanted signal's received power (dBm)
GSM
link
s (%
)
Figure 7 shows that when the GSM power control loop has terminated, all the GSM uplinks are experiencing received power higher than –102 dBm, which is 5 dB above sensitivity. Even when isolated from the WCDMA interference, the GSM system is interference-limited (intra-system interference).

Rep. ITU-R M.2031 9
Rap 2031-08
70605040302010
0–120 –112 –104 –96 –88 –80 –72 –64 –56 –48 –40
FIGURE 8GSM intra-system interference when GSM network is isolated
WCDMA interference's received power (dBm)
GSM
link
s (%
)
WCDMA interference (MCL = 30 dB including antenna gains; ACLR7.8 MHz = 63.7 dB; cell radius = 577 m)
When applying the WCDMA interference, inter-system interference caused by the emission of the WCDMA BSs is added to the GSM intra-system interference (see Fig. 10). When considering MCL and ACLR values as per current 3GPP specifications, Monte Carlo simulations show that for more than 99% of the GSM uplinks, wanted GSM signal is received at higher power than –80 dBm (i.e. 27 dB above sensitivity), as can be seen in Fig. 9. Given these results, the worst case for that scenario would be to consider a wanted received power of –80 dBm since less than 1% of the GSM links have a wanted received power lower or equal to –80 dBm. This case occurs for the GSM users that are the furthest from their BS.
In that case, all the GSM MS transmission powers are equal or almost equal to the maximum transmit power (i.e. 30 dBm), meaning that the GSM power control loop is saturated due to the high interference levels coming from the WCDMA BSs. In this particular case, GSM outage reaches an unacceptable level of 90%.
Rap 2031-09
141210
86420–120 –110 –100 –90 –80 –70 –60 –50 –40 –30 –20
FIGURE 9GSM received signal strength for GSM protection as per current requirements
Wanted signal's received power (dBm)
GSM
link
s (%
)
10 Rep. ITU-R M.2031
Rap 2031-10
40353025201510
50–120 –112 –104 –96 –88 –80 –72 –64 –56 –48 –40
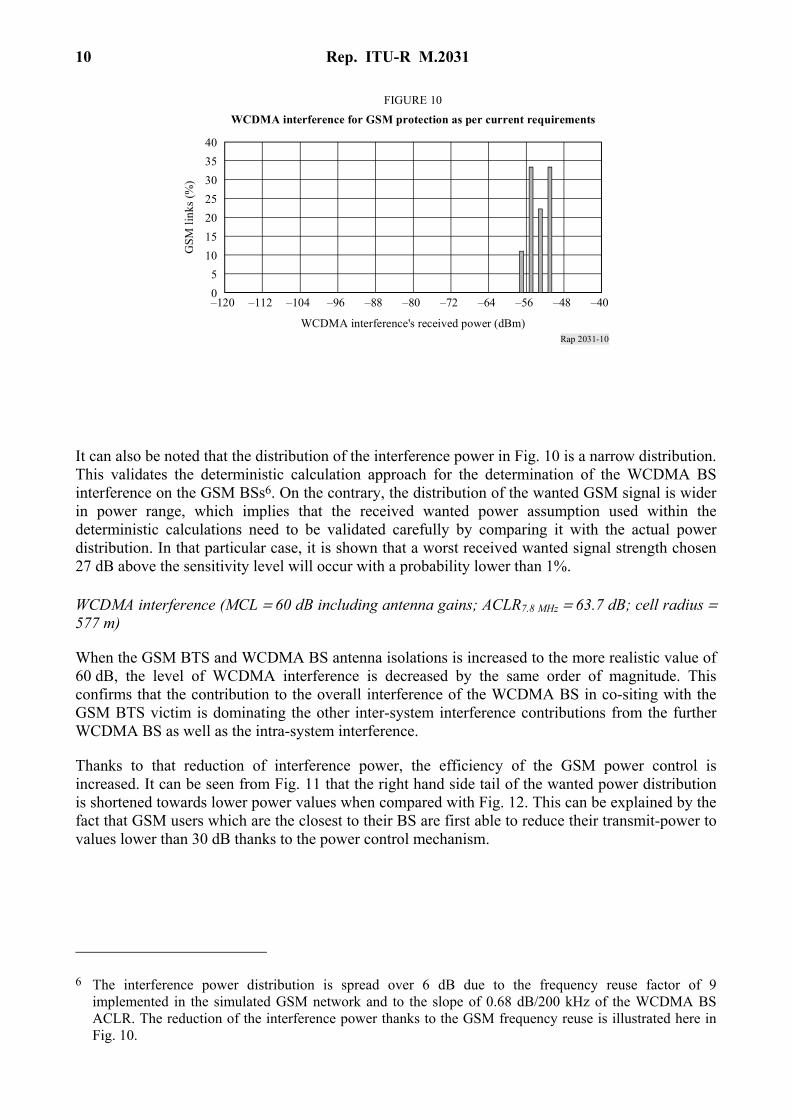
FIGURE 10WCDMA interference for GSM protection as per current requirements
WCDMA interference's received power (dBm)
GSM
link
s (%
)
It can also be noted that the distribution of the interference power in Fig. 10 is a narrow distribution. This validates the deterministic calculation approach for the determination of the WCDMA BS interference on the GSM BSs6. On the contrary, the distribution of the wanted GSM signal is wider in power range, which implies that the received wanted power assumption used within the deterministic calculations need to be validated carefully by comparing it with the actual power distribution. In that particular case, it is shown that a worst received wanted signal strength chosen 27 dB above the sensitivity level will occur with a probability lower than 1%.
WCDMA interference (MCL = 60 dB including antenna gains; ACLR7.8 MHz = 63.7 dB; cell radius = 577 m)
When the GSM BTS and WCDMA BS antenna isolations is increased to the more realistic value of 60 dB, the level of WCDMA interference is decreased by the same order of magnitude. This confirms that the contribution to the overall interference of the WCDMA BS in co-siting with the GSM BTS victim is dominating the other inter-system interference contributions from the further WCDMA BS as well as the intra-system interference.
Thanks to that reduction of interference power, the efficiency of the GSM power control is increased. It can be seen from Fig. 11 that the right hand side tail of the wanted power distribution is shortened towards lower power values when compared with Fig. 12. This can be explained by the fact that GSM users which are the closest to their BS are first able to reduce their transmit-power to values lower than 30 dB thanks to the power control mechanism.
6 The interference power distribution is spread over 6 dB due to the frequency reuse factor of 9 implemented in the simulated GSM network and to the slope of 0.68 dB/200 kHz of the WCDMA BS ACLR. The reduction of the interference power thanks to the GSM frequency reuse is illustrated here in Fig. 10.

Rep. ITU-R M.2031 11
Rap 2031-11
40353025201510
50–120 –110 –100 –90 –80 –70 –60 –50 –40 –30 –20
FIGURE 11GSM received signal strength for improved BSs
antenna-to-antenna isolation
Wanted signal's received power (dBm)
GSM
link
s (%
)
Figure 11 also shows that the GSM system is still operated under interference-limited conditions. Less than 1% of the GSM uplinks will experience received power values lower than –80 dBm.
Rap 2031-12
353025201510
50–120 –112 –104 –96 –88 –80 –72 –64 –56 –48 –40
FIGURE 12WCDMA interference for improved BSs antenna-to-antenna isolation
WCDMA interference's received power (dBm)
GSM
link
s (%
)
WCDMA interference (MCL = 60 dB including antenna gains; ACLR7.8 MHz = 83.7 dB; cell radius = 577 m)
When considering an additional filtering of the WCDMA BS unwanted emissions of 20 dB for frequency offsets greater than 7.8 MHz, the GSM outage can be reduced to levels comparable to the ones encountered when the GSM system is totally isolated from WCDMA interference. It can be seen from Figs. 13 and 14, when compared with Figs. 7 and 8, that the power distributions have converged further towards the power distributions observed when no WCDMA interference is applied.
These observations confirm the fact that when considering realistic MCL values and WCDMA emission filter’s characteristics, the GSM system’s isolation from the WCDMA interference is achieved.

12 Rep. ITU-R M.2031
Rap 2031-13
353025201510
50–120 –110 –100 –90 –80 –70 –60 –50 –40 –30 –20
FIGURE 13GSM received signal strength for improved BSs antenna-to-antenna
isolation aWCDMA unwanted emission filtering
Wanted signal's received power (dBm)
GSM
link
s (%
)
Rap 2031-14
40353025201510
50–120 –112 –104 –96 –88 –80 –72 –64 –56 –48 –40
FIGURE 14WCDMA interference for improved antenna isolation at the co-sited
BSs and additional WCDMA unwanted emission filtering
WCDMA interference's received power (dBm)
GSM
link
s (%
)
WCDMA interference (MCL = 65 dB including antenna gains; ACLR7.8 MHz = 83.7 dB; cell radius = 2 400 m)
It is proposed here to analyse the impact of higher cell sizes on the power distributions. A cell radius of 2 400 m has been investigated, and results are presented in Figs. 15 and 16. When applying 65 dB of isolation between the two interfering antennas, and decreasing by 20 dB the currently specified WCDMA BS unwanted emissions requirements for frequency offsets higher than 7.8 MHz, around 4% outage is reached for GSM uplink. This shows again that when using site engineering methods to improve antenna-to-antenna isolation and when considering realistic WCDMA BS unwanted emission levels for frequency offset greater than 7.8 MHz, outage level is reduced to a reasonable level even for bigger cells.

Rep. ITU-R M.2031 13
Rap 2031-15
605040302010
0–120 –110 –100 –90 –80 –70 –60 –50 –40 –30 –20
FIGURE 15GSM received signal strength for bigger cells, for improved base stations
antenna-to-antenna isolation and additional WCDMAunwanted emission filtering
WCDMA signal's received power (dBm)
GSM
link
s (%
)
Rap 2031-16
4540353025201510
50–120 –112 –104 –96 –88 –80 –72 –64 –56 –48 –40
FIGURE 16WCDMA interference for higher cell size, for improved BSs
antenna-to-antenna isolation and additional WCDMAunwanted emission filtering
WCDMA interference's received power (dBm)
GSM
link
s (%
)
The power distributions approached by the simulations also show that GSM signals are received above sensitivity (more than 20 dB above for some scenarios) due to the adaptation of the power-controlled GSM system to the interference environment. This leads to the conclusion that the GSM received signal strength to be used in the deterministic calculations needs to be chosen in accordance with the considered deployment scenario, and by taking into account typical GSM adaptation mechanisms like power control. Monte Carlo simulations proved to be a precious tool in the process of discussing the assumptions made for the deterministic calculations.
The power distributions extracted from the Monte Carlo simulations confirmed that when considering realistic MCL values and WCDMA emission filter’s characteristics, a total isolation of the GSM system from the WCDMA interference can be achieved, even for cell radius greater than 577 m. For instance, an MCL value of 60 dB and an ACLR7.8 MHz of 83.7 dB would provide an isolation of the GSM system from the WCDMA interference for cell radius equal to 577 m, as illustrated in the above Figures.

14 Rep. ITU-R M.2031
4.1.2 Minimum separation distance of 58 m, 115 m, 289 m and 577 m between the two closest interfering BSs
The geographical offset between the two interfering BS networks (see § 2.1 of the simulation methodology detailed in Appendix 1) has been increased from 0 m (co-siting) to the cell radius (maximum offset). The impact of the geographical offset on the GSM BS outage level has been investigated.
Figure 17 shows the GSM outage level for offsets value of 58 m, 115 m, 289 m and 577 m (value of the cell radius in the simulations) for unwanted WCDMA BS emissions at the currently specified level.
The simulation results show that a GSM outage level below 2% is reached for the offsets of 289 m and 577 m, when considering WCDMA BS unwanted emissions as per 3GPP specifications.
If WCDMA BS unwanted emission levels are to be reduced by a factor of 10 dB, simulations have shown that the GSM BS outage will not be higher than 0.2% for a guardband width of 5 MHz, whatever the geographical offset is amongst the above-mentioned set of values.
Rap 2031-17
70605040302010
0
FIGURE 17Impact of geographical offset variation on GSM outage for
3 GPP unwanted emission level*
2.5 7.55 10
GSM
BS
outa
ge (%
)
Guardband (MHz)
Offset58 m
Offset115 m
Offset289 mOffset577 m
* See footnote3.
4.1.3 Summary of the Monte Carlo analysis of the BS-BS scenario
The Monte Carlo analysis showed that the outage level of the GSM BSs co-sited with the WCDMA BSs can be reduced on practical systems when necessary using the following techniques: – Improvement of the BS to BS minimum antenna coupling loss by site engineering. – Additional filtering for the WCDMA BS emission mask. – Geographical separation between the interfering BSs.
Based on the previous Monte Carlo analysis, Table 3 shows possible sets of MCL and antenna filtering values to achieve a GSM BS outage level in co-siting below 5% with a 5 MHz guardband protecting the two adjacent bands and cell radius of 577 m.

Rep. ITU-R M.2031 15
TABLE 3
Derived set of MCL values and additional filtering leading to less than 5% GSM outage in co-siting
Coordination between co-sited operators might also be used to reduce interference to acceptable levels.
4.2 MS-MS scenario
Monte Carlo simulations for a guardband of 5 MHz between WCDMA downlink band and GSM uplink band according to the parameters detailed in Appendix 1 have shown that WCDMA in downlink does not suffer from significant capacity loss when considering the interference from GSM MSs.
Co-siting of the interfering BSs was assumed. A single GSM carrier per BS was implemented. The influence of 3 other carriers has been taken into account analytically by reducing the GSM mobile station to the WCDMA user equipment (ACIR) by 3.2 dB following the method detailed in4.
5 Conclusion
Considering the technical aspects of an adjacent channel arrangement between GSM and WCDMA systems in the 1 800 MHz bands, both the Monte Carlo and the deterministic analysis conclude that co-siting GSM and WCDMA BSs with a 5 MHz guardband would result in unacceptable interference at the GSM BS with the current 3GPP specifications.
The deterministic calculations show that to facilitate uncoordinated coexistence, the guardband would be in excess of 5 MHz.
However the Monte Carlo simulations establish that a moderate geographical offset between the GSM and the WCDMA BSs would allow WCDMA and GSM systems coexistence with a 5 MHz guardband.
Monte Carlo simulations further show that co-siting could also be made feasible with a 5 MHz guardband if BSs antenna-to-antenna coupling loss and/or spurious emission limits for protection of adjacent band services are improved. Monte Carlo simulations have shown that for a cell radius equal to 577 m, a total of 30 dB improvement beyond current 3GPP specifications would allow the co-siting of GSM and WCDMA BSs with a 5 MHz guardband.
MCL (dB)
Additional filtering (dB)
60 0
50 10
40 20

16 Rep. ITU-R M.2031
Appendix 1
Monte Carlo simulations
1 Methodology
The simulation methodology is based upon a Monte Carlo technique, i.e. a statistical technique that functions by considering many independent instants in time. For each instant, or simulation trial, a scenario is built up using a number of different random variables (e.g. the positions of the users in the system). If a sufficient number of trials are considered then the probability of a certain event occurring (such as, for example, the probability that a user is interfered) can be estimated with a high level of accuracy.
In the methodology used, the two uncoordinated operators (WCDMA 1800 and GSM 1900) are deployed in the same geographical area, each with their own hexagonal cell structure. Users are then distributed across the cellular system generally using a uniform distribution. They are initially assigned to either a single BS (GSM) or multiple BSs (for WCDMA technologies the terminal is able to enter soft handover if the link budget from two or more BSs appears attractive). For the WCDMA system, a soft handover window is used to determine whether or not the MS is able to communicate with multiple BSs. The window size defines the difference between the strongest received signal and the weakest allowed. On the uplink, switching selection diversity is assumed. On the downlink, maximal ratio combining is assumed – C/I ratios are summed to indicate the MSs resultant C/I ratio.
Once each MS has had its BS(s) assigned then the received signal strength at each BS (uplink case) or at each mobile station (downlink case) is calculated. BS and MSS belonging to both operators are considered.
The received signal consists of the desired and interfering signal strengths. The interfering signal is a combination of intra-system and inter-system interference, where intra-system interference consists of:
– Interference generated by other communication links in the same cell. In this case an orthogonality factor is taken into account (WCDMA downlink only).
– Interference generated by communication links in all of the surrounding cells.
– Interference generated by broadcast channels (downlink only).
And where inter-system interference consists of:
– Interference generated by all communication links of the second operator.

Rep. ITU-R M.2031 17
The inter-system interference mechanisms considered include those of unwanted emissions and receiver blocking. In this study, it is assumed that the operators use adjacent channels and that these mechanisms correspond to ACLR and adjacent channel selectivity (ACS). The combination of these effects is termed ACIR and can be expressed as:
ACSACLR
ACIR 111
+=
Once interference levels have been computed, a power control loop is run. The WCDMA and GSM C/I-based power control algorithm is an iterative process that converges positively when each communication link achieves its target C/I ratio. The algorithm assumed for both the forward and reverse links uses an adaptive step size. For each iteration, the power supplied to each link is updated with a value dependant upon the difference between the actual C/I and C/Itarget.
Once power control has converged the system is assumed to be in a realistic steady state and various records are made. The capacity of the system can be defined in a number of ways, by using the system outage criterion or the noise rise criterion.
System outage is said to occur when a communication link is unable to attain the required C/(N + I ). A mobile user is experiencing outage if it is:
– not available, i.e. the signal strength is not sufficient for the sensitivity of the receiver. This happens when the mobile user is too far away from the BS;
– interfered, i.e. sensitivity requirement is met but C/I is below the required C/I.
System outage is difficult to derive theoretically by it can be estimated by simulation:
usersofnumberTotalavailablenonusersofNumbererferedintusersofNumberoutageSystem −+=
2 Monte Carlo simulation assumptions
Table 4 recalls some of the characteristics of WCDMA 18002, 4 and GSM 19007 used as input parameters for the simulations.
7 Radio transmission and reception – 3GPP TS 05.05. v7.5.0.

18 Rep. ITU-R M.2031
TABLE 4
WCDMA 1800 and GSM 1900 characteristics
2.1 Cell layout for simulations – Omni cells will be used for the simulations. – A frequency reuse factor of 9 for GSM is implemented. – A 36 cell network is used as illustrated in Fig. 18.
Rap 2031-18
FIGURE 18The fundamental 36-cell structure assumed for each operator
and the 9-cell cluster for GSM operator
– A wrap around technique is used to provide the effect of a continuous cellular structure. – The systems will be deployed according to the macro-macro model. – Cell radius is 577 m.
WCDMA 1800 GSM 1900
Services 8 kbit/s speech (100% activity factor) Protection ratio (dB) −18,9(1) 6 Chip rate (Mchip/s) 3.84 –
Radio link Noise floor (dBm) −96 (MS) −113 (BS) Sensitivity (dBm) −114.9 (MS) −107 (BS) Tx power minimum (dBm) 15 (BS) 0 (MS)
Tx power maximum (dBm) 43 total 30 per user (BS)
30 (MS)
MS antenna gain (dBi) 0 BS antenna gain (dBi) 11
(1) Eb /N0 = 7.9 dB; processing gain 26.8 dB.

Rep. ITU-R M.2031 19
– Geographical offset between operators is a parameter of the simulation (see illustration in Figs. 19 and 20).
Rap 2031-19
FIGURE 19Simulation set-up with minimum inter-base station separation
Rap 2031-20
FIGURE 20Simulation set-up with maximum inter-base station separation
Geographical offsetbetween base station
2.2 Propagation
2.2.1 Minimum coupling loss
MCL values taken into account in this study follow the 3GPP assumptions2:
– MS-BS scenario: 70 dB (including antenna gains). – BS-BS scenario: 30 dB (including antenna gains). – MS-MS scenario: 40 dB (including antenna gains).

20 Rep. ITU-R M.2031
2.2.2 MS-BS propagation model2
The received power in the downlink or uplink can be expressed for the macro environment as:
Rx_PWR = Tx_PWR − Max (pathloss − G_Tx − G_Rx, MCL)
where:
Rx_PWR : received signal power
Tx_PWR : transmitted signal power
G_Tx : Tx antenna gain
G_Rx : ganancia del receptor (Rx) de la antena
MCL : minimum coupling loss.
An 11 dB antenna gain (including cable losses) for BS and 0 dB for UE are assumed.
Macro cell propagation models only are considered for the study:
Pathloss = 40(1 − 4 x 10 − 3Dhb) log10(R) − 18 log10(Dhb) + 21 log10( f ) + 80 dB + log F
where:
R : BS-MS separation distance (km)
f : carrier frequency (MHz)
Dhb : BS antenna height (m) measured from the average rooftop level
log F : log-normally distributed shadowing with standard deviation of 10 dB.
The BS antenna height is fixed at 15 m above the average rooftop (Dhb = 15 m). Considering a carrier frequency of 1 800 MHz and a BS antenna height of 15 m, the pathloss expression can be simplified to:
Pathloss = 127.2 + 37.6 log10(R) + log F
2.2.3 MS-MS propagation model
The MS to MS propagation model has to be valid for transmitter and receiver antennas having the same height. For that purpose, the model based on path loss formula enounced by H. Xia8, 9 is considered, more especially the model related to BS antenna below the average rooftop level. The difference with initial formula is that the BS antenna height is there replaced by the MS height i.e. 1.5 m. This is seen as a reasonable approximation for the considered scenario.
8 Xia, H. H. [November 1997] A simplified analytical model for predicting path loss in urban and suburban environments. IEEE Trans. on Vehicular Technology. Vol. 46, 4, p. 1040-1046.
9 ETSI STC SMG2 UMTS L1 No. 9 Tdoc 679/98.

Rep. ITU-R M.2031 21
Rap 2031-21
θ ∆ hm
Wd
R
X
rϕ
hhm
FIGURE 21Propagation loss calculation - Xia model adapted to the MS-MS case
( )
ϕ+π
−ϕ+∆
λ
π−
θ+π−
θπλ−
πλ−=
2
22
2
10
2
210
2
10 211
2log10
211
2log10
22log10
dhRd
rRPathloss
m
∆=ϕ
∆=θ
=
+∆=
dmh
xmh
wx
xmhr
arctan
arctan
2
22)(
where:
h : average height of buildings (12 m)
r : distance between last point of diffraction and MS height
hm : height of MS (1.5 m)
x : horizontal distance between last point of diffraction and MS height (15 m)
R : distance between two MSs
d : average building separation (80 m)
w : street width (30 m).
∆hm = h – hm
To take into account the likelihood of two MSs separated by less than 100 m being in LoS, the free space model is applied with a probability depending on the distance of separation between the two MS. The free space model applied is:
)(log205.38 10 RPathloss +=

22 Rep. ITU-R M.2031
2.2.4 BS-BS propagation model
As both BSs networks are supposed to be deployed in a macro-cellular environment, the free space propagation model with a slope of 2.0 is used to characterize the propagation between two interfering BSs:
)(log205.38 10 dPathloss +=
where d is the distance between the two BSs.
2.3 Cell selection criteria
For the WCDMA system the handover model is a non-ideal soft handover. Active set for the UE is selected from a pool of BSs that are candidates for handover. The candidate set is composed from BSs whose pathloss is within handover margin, i.e., BSs whose received pilot is stronger than the received pilot of the strongest BS subtracted by the handover margin. A soft hand-over margin of 3 dB is assumed. The active set of BSs is selected randomly from the candidate BSs; a single user equipment (UE) may be connected to maximum of two BSs simultaneously.
In the GSM case the BS with the largest link gain to the user is selected.
2.4 ACIR modeling
GSM ACS and ACLR contributions to the ACIR parameters for the MS-MS and BS-BS scenarios can be neglected compared to WCDMA 1800 ACS and ACLR contribution. Therefore the ACIR expression in § 1 is simplified to:
BS1800WCDMABSGSMBS1800WCDMA ACLRACIR =→
MS1800WCDMAMS1800WCDMAMSGSM ACSACIR =→
2.4.1 WCDMA BS emission mask
The 3GPP TS 25.1043 specification contain well-specified masks for the out-of-band emissions from a WCDMA BS or UE, that were established in the context of operation in the WCDMA band. These masks can be translated to ACIR values when the victim is a narrow-band GSM system.
ACIR values calculated from current 3GPP specifications for WCDMA BS interfering with GSM BS are shown in Table 5.

Rep. ITU-R M.2031 23
TABLE 5
WCDMA BS emission mask
When considering filter designs for BS, it is reasonable to assume for those frequency offsets ACIR values 20 dB higher than the above specifications.
2.4.2 WCDMA UE reception mask
The 3GPP TS 25.101 specification10 contains well-specified ACS values and blocking characteristics for the WCDMA UE receiver, that were established in the context of operation in the WCDMA core bands. These masks can be translated to ACIR values when the narrow-band GSM interferer is aggressing the WCDMA victim.
TABLE 6
WCDMA UE reception mask
10 UE Radio Transmission and Reception (FDD) – 3GPP TS 25.101 v3.5.0.
Carrier-to-carrier spacing (MHz)
Emission mask (dB)
7.8 63.7 8.0 64.4 8.2 65 8.4 65.7 8.6 66.4 8.8 67.1 9.0 67.8 9.2 68.4 9.4 69.1
Carrier spacing (MHz)
Downlink (dB)
7.8 37 8.0 37.3 8.2 37.6 8.4 37.8 8.6 38.1 8.8 38.4 9.0 38.7 9.2 39.0 9.4 39.2

24 Rep. ITU-R M.2031
2.5 Interference levels calculation
These formulas are valid for non frequency-hopping network deployment.
2.5.1 WCDMA victim
The interference contribution (IGSM MS → WCDMA MS) of a GSM MS to an WCDMA MS is the following:
( )TSNb
PfUEMSACIRI MSMSWCDMAGSMMSWCDMAMSGSM _
, ×→=→
where:
fMS : frequency used by the GSM MS
PMS,i : power received from the GSM MS
Nb_TS : number of timeslots per frame for the TDMA technology (i.e. 8 in GSM).
The TSNb_
1 factor stems from the fact that a GSM mobile transmits only TSNb_
1 th of the time.
Intrasystem interference is according to 3GPP assumptions2: an orthogonality factor of 0.4 in the case of a WCDMA network in the downlink is used.
2.5.2 PCS victim
The interference contribution (IWCDMA BS → GSM BS) of a WCDMA BS to a GSM BS is the following:
( ) BSSBGSMWCDMABSGSMBSWCDMA PfBSBSACIRI ×→=→ ,
where:
fBS : frequency used by the WCDMA BS
PBS : power received from the IMT-2000 BS.
When adding intrasystem interference, we make the assumption that the GSM cells are synchronized. The interference contribution from a co-channel MS is calculated as its average received power at the victim BS during its time slot of operation. Adjacent-channel MS contribution to the interference level is neglected.
The 4 carriers on a same GSM BTS are assumed to be spaced 1 800 kHz from each other (deployment with a frequency reuse factor of 9).
2.6 C/I computation
C/I or S/I ratio is the ratio of the desired signal to the total interference encountered by the user considered. For WCDMA system (in the case where soft handover is used) maximal ratio combining on the downlink is assumed – C/I ratios are summed to indicate the mobile station’s resultant C/I.
Rep. ITU-R M.2031 25
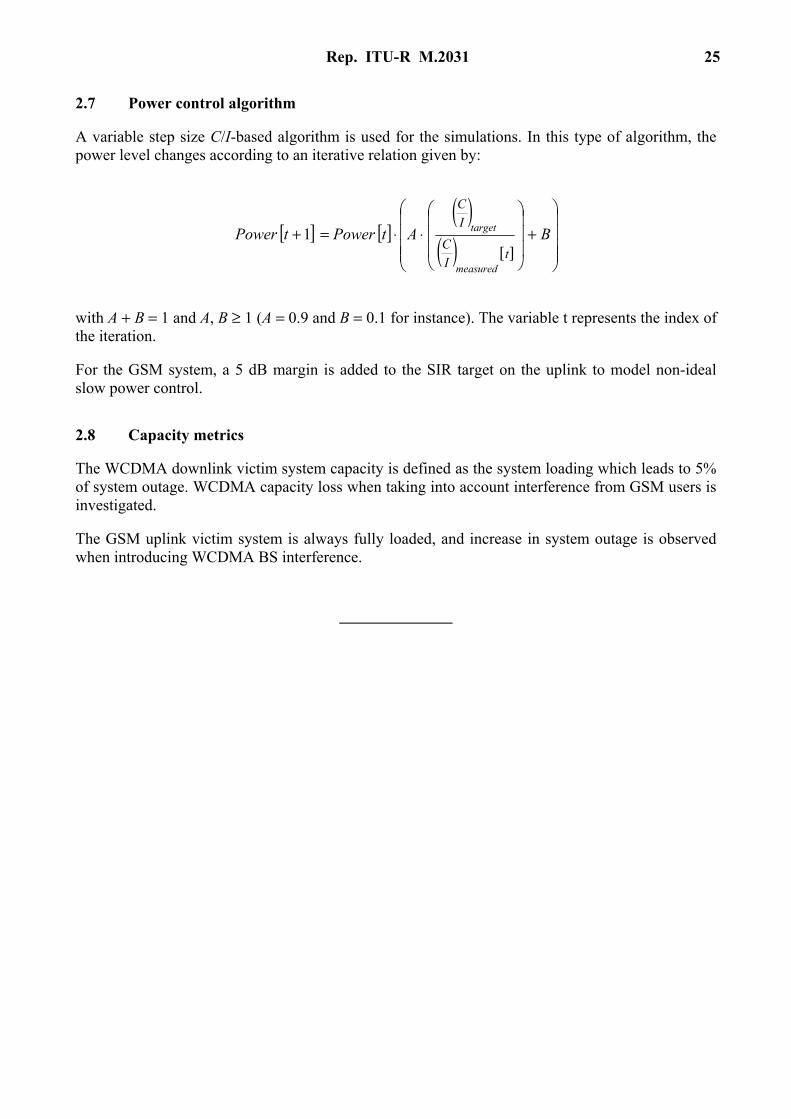
2.7 Power control algorithm
A variable step size C/I-based algorithm is used for the simulations. In this type of algorithm, the power level changes according to an iterative relation given by:
[ ] [ ]( )
( ) [ ]
+
⋅⋅=+ BAtPowertPowertI
CIC
measured
target1
with A + B = 1 and A, B ≥ 1 (A = 0.9 and B = 0.1 for instance). The variable t represents the index of the iteration.
For the GSM system, a 5 dB margin is added to the SIR target on the uplink to model non-ideal slow power control.
2.8 Capacity metrics
The WCDMA downlink victim system capacity is defined as the system loading which leads to 5% of system outage. WCDMA capacity loss when taking into account interference from GSM users is investigated.
The GSM uplink victim system is always fully loaded, and increase in system outage is observed when introducing WCDMA BS interference.