report eleven - bc
TRANSCRIPT

report elevenTechnical Report
Use, Support,
and Effect
of Instructional Technology
Study
Report Eleven
Technical Report for the USEIT Study
Michael Russell, Laura O’Dwyer, Damian Bebell, & Helena Miranda
Graphic Design: Thomas Hoffmann
Published by inTASC – May 2004
Preferred Citing: Russell, M., O’Dwyer, L., Bebell, D., & Miranda, H. (2004) Technical report for the USEIT study.
Boston, MA: Boston College, Technology and Assessment Study Collaborative.
Available for download at http://www.intasc.org/PDF/useit_r11.pdf
Michael K. Russell, Project Director/Boston College
Copyright © 2004 Technology and Assessment Study Collaborative, Boston College
Supported under the Field Initiated Study Grant Program, PR/Award Number R305T010065, as ad-ministered by the Office of Educational Research and Improvement, U.S. Department of Education.
The finding and opinions expressed in this report do not reflect the positions or policies of the Office of Educational Research and Improvement, or the U.S. Department of Education.
Use, Support, and Effect of Instructional Technology Study
Rep
ort 1
1 ·
May
200
4Technical Report 3
Table of Contents
Chapter 1 Use, Support, and Effect of Instructional Technology Study Overview
1.1 Introduction 1.2 Study Design1.3 Study Timeline
Chapter 2 Instrument Development
2.1 Survey Development2.2 Site Visit Interview Protocol Development
Chapter 3 Study Participants
3.1 Selection and Recruitment of Participating Districts3.2 Sample Demographics3.3 Survey Response Rates3.4 Classifying Teachers3.5 Comparing USEIT Participants to National Data Sources
Chapter 4 Measurement Scales
4.1 Construction of Measurement Scales4.2 Creating Measurement Scales4.3 Measurement Scales Produced From the USEIT Data
Chapter 5 Site Visit Interview Analysis Design
5.1 Developing Dimensions for Analysis5.2 Defining Dimension Criteria5.3 Factor Analysis of Dimension Ratings5.4 Component Interpretation5.5 Correlation of Site Visit Results to Survey Data

Rep
ort 1
1 ·
May
200
4
Chapter 1: Use, Support, and Effect of Instructional Technology Study Overview
1.1 IntroductionOver the past decade, expenditures on, access to, and use of computer-based tech-
nologies by school-aged children have increased sharply. Between 1995 and 2001, federal expenditures on educational technology increased from $21 to $729 million while the student to computer ratio has decreased from 9:1 to 4:1 nationally (Glennan & Melmed, 1996; Market Data Retrieval, 1999, 2001). In 2001, the U.S. Census Bureau’s Current Population Survey reported that American children between ages 9-17 use computers more than any other reported subgroup of the American population (92.6%) (A Nation Online, 2002).
Despite these large expenditures, this increased access, and nearly universal use by school-aged children, several observers have questioned the extent to which technol-ogy is impacting teaching and learning. In 1997, Oppenheimer argued that there is no solid evidence that computers have improved student performance, as measured by test scores. Others, like Stoll (1999) and Healy (1998), have criticized investments in educational technologies arguing that there is little evidence that they impact teaching and learning in a positive way and, in fact, asserted that computer use may be harm-ing children and their learning. More recently, Cuban (2001) argued that computers have been oversold as a vehicle for reforming educational practices and are generally underused as an instructional tool by teachers at all levels of education.
While it is certainly appropriate to question the effects computer-based technolo-gies are having on teaching and learning, the data collected to date provide incom-plete and sometimes misleading images of the ways teachers and students use technol-ogy, the effects of these uses, and the factors that influence these uses. To deepen our understanding of these issues, the Technology and Assessment Study Collaborative (inTASC) at Boston College undertook a three-year study of technology use, support, and impact across school districts.
Working with 22 school districts across Massachusetts, inTASC is examining the impacts of district level education technology programs on teaching and learning. Unlike previous studies that have either focused on the impacts of individual software applications on student learning or have examined the extent to which educational agencies have established the conditions believed to be essential for supporting educa-tion technologies, the Use, Support, and Effect of Instructional Technology (USEIT) study focuses on the relationships among different types of district level supports, changes in classroom practices, and impacts on student outcomes.
Use, Support, and Effect of Instructional Technology (USEIT) Report 11Technical Report
Rep
ort 1
1 ·
May
200
4Technical Report 5
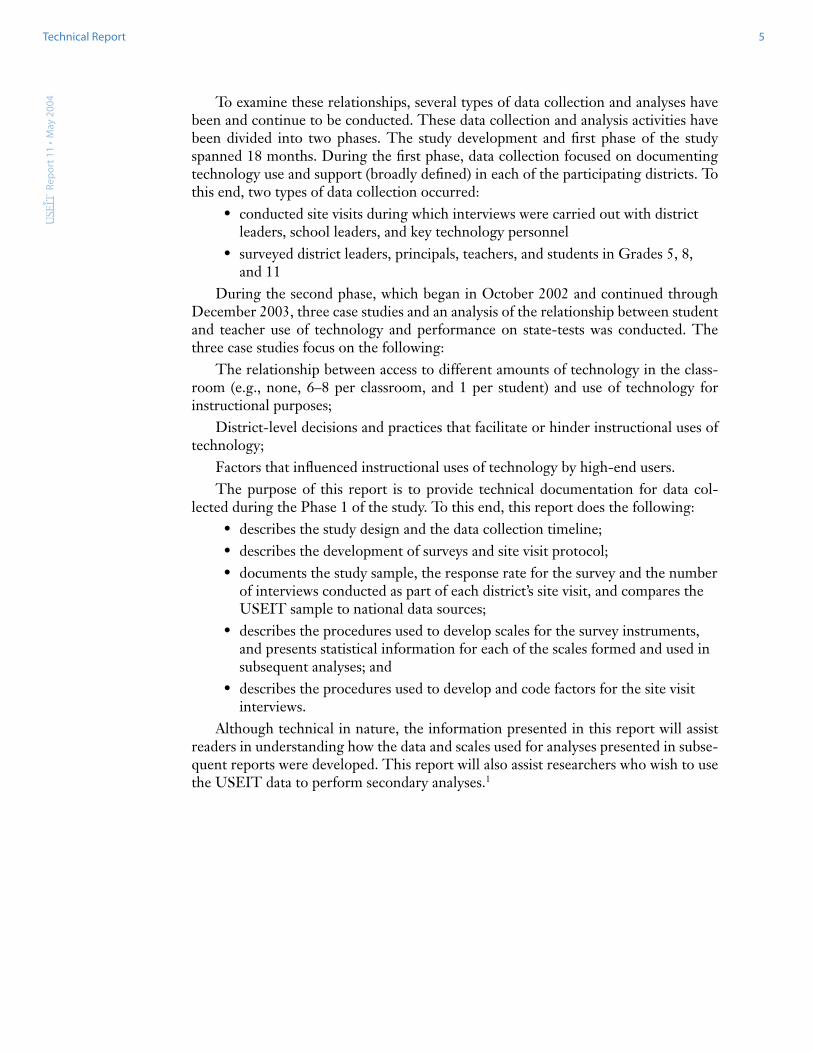
To examine these relationships, several types of data collection and analyses have been and continue to be conducted. These data collection and analysis activities have been divided into two phases. The study development and first phase of the study spanned 18 months. During the first phase, data collection focused on documenting technology use and support (broadly defined) in each of the participating districts. To this end, two types of data collection occurred:
• conducted site visits during which interviews were carried out with district leaders, school leaders, and key technology personnel
• surveyed district leaders, principals, teachers, and students in Grades 5, 8, and 11
During the second phase, which began in October 2002 and continued through December 2003, three case studies and an analysis of the relationship between student and teacher use of technology and performance on state-tests was conducted. The three case studies focus on the following:
The relationship between access to different amounts of technology in the class-room (e.g., none, 6–8 per classroom, and 1 per student) and use of technology for instructional purposes;
District-level decisions and practices that facilitate or hinder instructional uses of technology;
Factors that influenced instructional uses of technology by high-end users.The purpose of this report is to provide technical documentation for data col-
lected during the Phase 1 of the study. To this end, this report does the following:• describes the study design and the data collection timeline;• describes the development of surveys and site visit protocol;• documents the study sample, the response rate for the survey and the number
of interviews conducted as part of each district’s site visit, and compares the USEIT sample to national data sources;
• describes the procedures used to develop scales for the survey instruments, and presents statistical information for each of the scales formed and used in subsequent analyses; and
• describes the procedures used to develop and code factors for the site visit interviews.
Although technical in nature, the information presented in this report will assist readers in understanding how the data and scales used for analyses presented in subse-quent reports were developed. This report will also assist researchers who wish to use the USEIT data to perform secondary analyses.1

Rep
ort 1
1 ·
May
200
4Technical Report 6
1.2 Study DesignThe Use, Support, and Effect of Instructional Technology (USEIT) study is a
three-year study that was initiated in the spring of 2001 and was divided into two phases. The first phase of the study was designed to examine two overarching ques-tions:
a) How and to what extent are instructional technologies being used by teachers and students in the classroom and at home?
b) What factors influence these uses?To examine these two questions, a multi-method research design was developed.
The study was developed to collect the same set of data across several districts in order to estimate the effect specific district-level, school-level, and classroom-level variables have on instructional use of technology by teachers and students. To provide a deeper understanding of district- and school-level practices that promote or obstruct technol-ogy use, the study design included quantitative and qualitative data collection. In addi-tion, to probe key issues that arose over the course of the study, the design called for an iterative approach to data collection and analysis. As an example, it was anticipated that the survey data would allow the research team to identify classrooms within the same grade level in which technology is used frequently, classrooms in which technol-ogy is used less frequently, and classrooms in which it is rarely or never used. Based on these categorizations, a sub-set of classrooms within each level of use would be selected for further study to examine:
a) the relationship between technology use and achievement, and b) the factors that contribute to or hinder use within these classrooms. Similarly, quantitative and qualitative data were used to classify district technology
programs into three levels based on their maturity and success in supporting technol-ogy use. Based on these categorizations, a subset of districts were selected for further study to identify key decisions, policies, and/or actions that occurred over the past 10 years that contributed to the success or shortcomings of each districts technology program.
To this end, two types of data were collected during the first phase of the study: interview data and survey data.
• District, school, and other personnel who play a key role in supporting tech-nology use in each district were interviewed.
• District leaders, principals, teachers, and students in Grades 5, 8, and 11 were surveyed.
Rep
ort 1
1 ·
May
200
4Technical Report 7
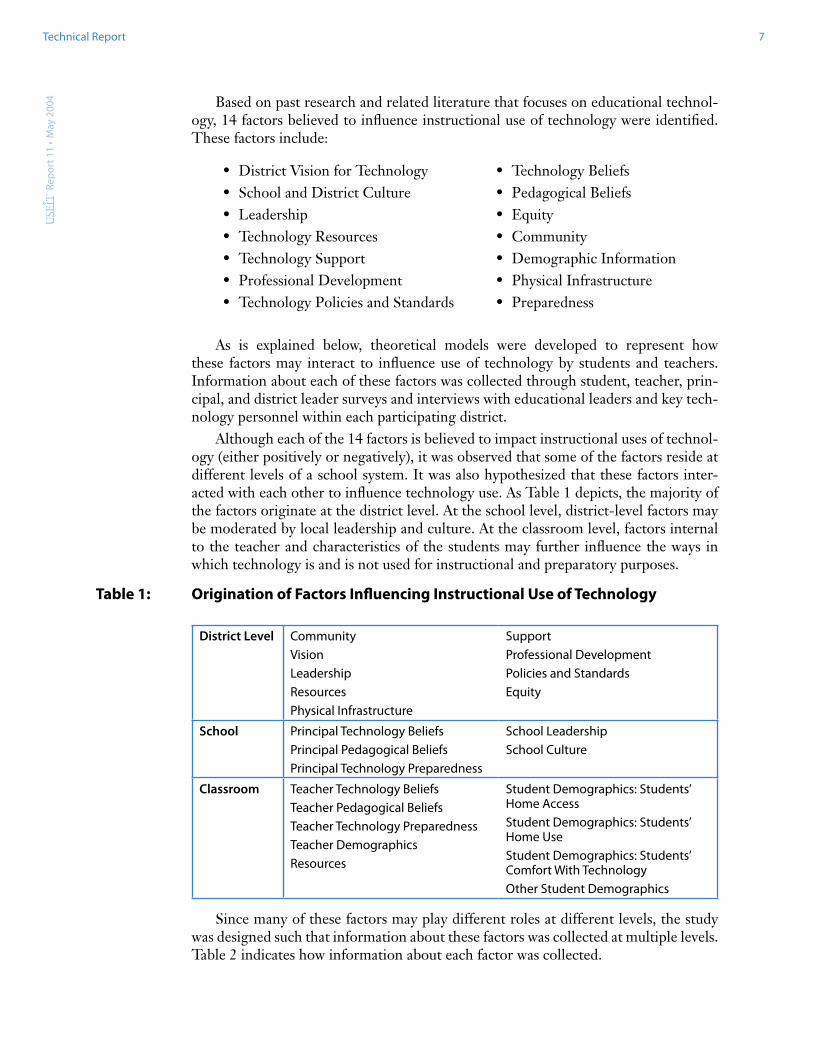
Based on past research and related literature that focuses on educational technol-ogy, 14 factors believed to influence instructional use of technology were identified. These factors include:
• District Vision for Technology• School and District Culture• Leadership• Technology Resources• Technology Support• Professional Development• Technology Policies and Standards
• Technology Beliefs• Pedagogical Beliefs• Equity• Community• Demographic Information• Physical Infrastructure• Preparedness
As is explained below, theoretical models were developed to represent how these factors may interact to influence use of technology by students and teachers. Information about each of these factors was collected through student, teacher, prin-cipal, and district leader surveys and interviews with educational leaders and key tech-nology personnel within each participating district.
Although each of the 14 factors is believed to impact instructional uses of technol-ogy (either positively or negatively), it was observed that some of the factors reside at different levels of a school system. It was also hypothesized that these factors inter-acted with each other to influence technology use. As Table 1 depicts, the majority of the factors originate at the district level. At the school level, district-level factors may be moderated by local leadership and culture. At the classroom level, factors internal to the teacher and characteristics of the students may further influence the ways in which technology is and is not used for instructional and preparatory purposes.
Table 1: Origination of Factors Influencing Instructional Use of Technology
District Level CommunityVisionLeadership Resources Physical Infrastructure
Support Professional Development Policies and Standards Equity
School Principal Technology BeliefsPrincipal Pedagogical BeliefsPrincipal Technology Preparedness
School LeadershipSchool Culture
Classroom Teacher Technology BeliefsTeacher Pedagogical BeliefsTeacher Technology PreparednessTeacher Demographics Resources
Student Demographics: Students’ Home AccessStudent Demographics: Students’ Home UseStudent Demographics: Students’ Comfort With TechnologyOther Student Demographics
Since many of these factors may play different roles at different levels, the study was designed such that information about these factors was collected at multiple levels. Table 2 indicates how information about each factor was collected.

Rep
ort 1
1 ·
May
200
4Technical Report 8
Table 2: Information Collected From Specific Individuals
Surveys Site Visits
Teacher Principal District Leader
Students
District Vision for Technology
School and District Culture
Leadership
Technology Resources
Technology Support
Professional Development
Technology Policies and Standards
Technology Beliefs
Pedagogical Beliefs
Equity
Community
Demographic Information
Physical Infrastructure
Preparedness
In addition, to collecting information about these factors, in some cases from sev-eral different members of a school system, the survey and site visits were designed to allow us to link students to their teachers, teachers to their principals, and principals to their district leaders. In turn, this linking allowed us to examine validity by comparing responses for a given factor across levels (e.g., amount of student use of computers in the classroom as reported by students compared to what their teacher reported). In addition, this linking will allow us to conduct multi-level analyses in which the influ-ence of factors that reside at different levels of the school system on use of technology can be estimated.
Rep
ort 1
1 ·
May
200
4Technical Report 9
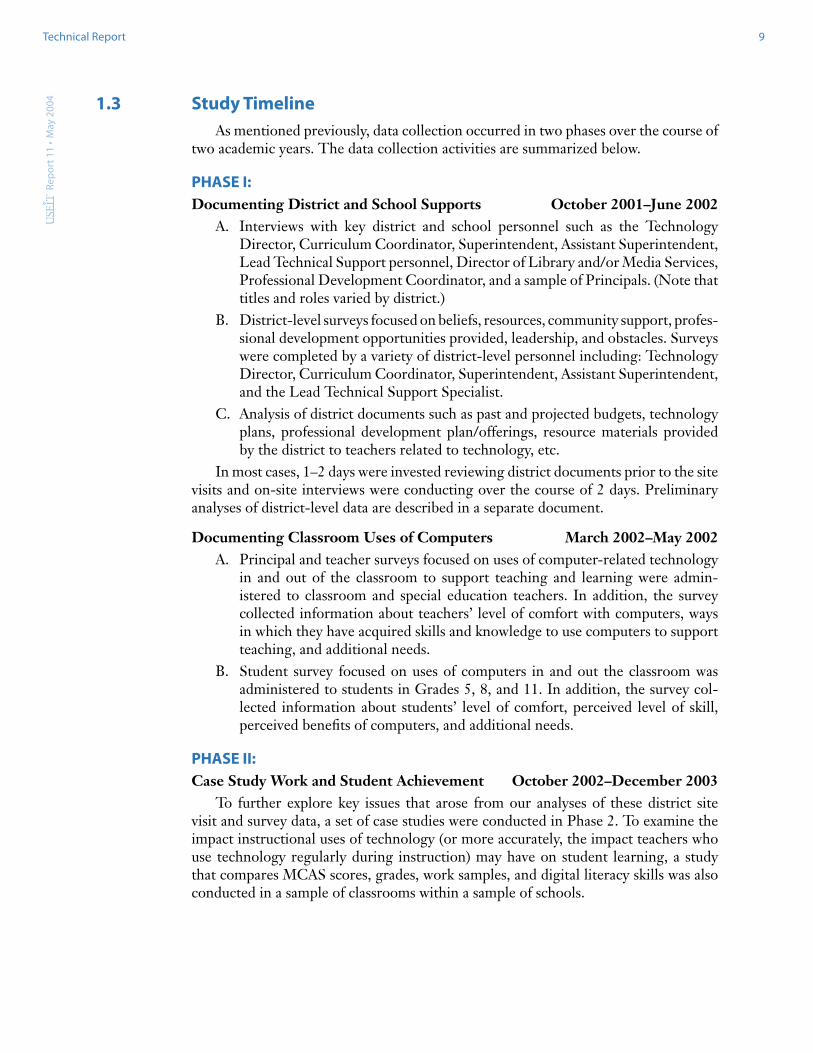
1.3 Study TimelineAs mentioned previously, data collection occurred in two phases over the course of
two academic years. The data collection activities are summarized below.
PHASE I:Documenting District and School Supports October 2001–June 2002
A. Interviews with key district and school personnel such as the Technology Director, Curriculum Coordinator, Superintendent, Assistant Superintendent, Lead Technical Support personnel, Director of Library and/or Media Services, Professional Development Coordinator, and a sample of Principals. (Note that titles and roles varied by district.)
B. District-level surveys focused on beliefs, resources, community support, profes-sional development opportunities provided, leadership, and obstacles. Surveys were completed by a variety of district-level personnel including: Technology Director, Curriculum Coordinator, Superintendent, Assistant Superintendent, and the Lead Technical Support Specialist.
C. Analysis of district documents such as past and projected budgets, technology plans, professional development plan/offerings, resource materials provided by the district to teachers related to technology, etc.
In most cases, 1–2 days were invested reviewing district documents prior to the site visits and on-site interviews were conducting over the course of 2 days. Preliminary analyses of district-level data are described in a separate document.
Documenting Classroom Uses of Computers March 2002–May 2002A. Principal and teacher surveys focused on uses of computer-related technology
in and out of the classroom to support teaching and learning were admin-istered to classroom and special education teachers. In addition, the survey collected information about teachers’ level of comfort with computers, ways in which they have acquired skills and knowledge to use computers to support teaching, and additional needs.
B. Student survey focused on uses of computers in and out the classroom was administered to students in Grades 5, 8, and 11. In addition, the survey col-lected information about students’ level of comfort, perceived level of skill, perceived benefits of computers, and additional needs.
PHASE II:Case Study Work and Student Achievement October 2002–December 2003
To further explore key issues that arose from our analyses of these district site visit and survey data, a set of case studies were conducted in Phase 2. To examine the impact instructional uses of technology (or more accurately, the impact teachers who use technology regularly during instruction) may have on student learning, a study that compares MCAS scores, grades, work samples, and digital literacy skills was also conducted in a sample of classrooms within a sample of schools.

Rep
ort 1
1 ·
May
200
4Technical Report 10
Chapter 2: Instrument Development
2.1 Survey DevelopmentThe teacher and student surveys were developed through a six-step process. Then,
the teacher surveys were adapted for the principal and district surveys. In this section, we describe in detail each of the six steps taken to develop the teacher and student surveys. We then describe how the principal and district surveys were adapted from the teacher survey.
Step 1: Literature and Existing Survey ReviewDuring the first step, a review of the literature on educational technology was per-
formed, with a specific focus on factors that influence instructional use. In addition, surveys used in previous studies and/or surveys developed to assist schools in examin-ing their use and support of technology were collected. The surveys collected include the following:
The Milken PCC Assessment ToolNCREL Miami-Dade SurveysNational School Network SurveyNCREL SurveysTeaching, Learning and Computing CRITO Surveys (Becker et al.)Wellesley, MA District Surveys (M. Russell)Franklin Schools District Survey (T. Plati)LoTi Questionnaire (Learning Quest)DoDEA SurveysConnect Teacher Proficiency ScalesCalifornia School Technology Survey
Specifically, the USEIT surveys adopted several scales developed by Becker and his colleagues (1998-2001) from the CRITO teacher surveys (with minor additions) so that the relationships among pedagogical beliefs, instructional practices, school cli-mate, and teachers’ uses of technology can be examined.
Based on a review of the literature and existing surveys, the 14 factors believed to be related to technology use were identified (see Table 1 for a list of these factors). In addition, approximately 50 ways in which technology is used by teachers and students were recorded. A list of types of instructional technology that teachers may have access to in their classrooms or schools and a list of obstacles that may influence the extent to which instructional technology is used also were generated.

Rep
ort 1
1 ·
May
200
4Technical Report 11
Step 2: Theoretical Models and HypothesesBased on the lists generated through the literature and survey reviews, a set of
theoretical models that depicted the inter-relationships between the 14 factors and technology use were generated. In addition, a large number of hypotheses as to how factors influence technology use by teachers and students were developed. Four exam-ples of hypotheses developed follow:
a) District-level leadership and advocacy for technology influences principal leadership and advocacy for technology which in turn influences the extent to which teachers use technology;
b) Students’ access to technology at home and comfort using technology influ-ences the extent to which teachers use technology for instructional purposes;
c) Professional development that focuses primarily on integration of technology coupled with the availability of a technology specialist at the school level is associated with higher levels of technology use in the classroom, while profes-sional development that focuses primarily on the mechanics of how to use a computer or specific software is associated with lower levels of technology use in the classroom;
d) Schools that have a culture of collaboration, value experimentation, and/or allow teachers to participate in decision-making have higher levels of technol-ogy use.
Step 3: Item DevelopmentA set of items were developed to collect information about each of the 14 factors,
as well as the extent to which teachers use technology for a variety of purposes in and out of the classroom, the types of technology teachers have access to, and obstacles to their use of technology. For the student survey, items focused primarily on their access to technology in school and at home, their comfort with technology, obstacles to their use of technology, and the extent to which they use technology at home and in school for a variety of purposes. Initially, 16 pages of items were developed for the teacher survey and 7 pages of items were developed for the student survey.
Step 4: Item ReviewWorking with representatives from several of the participating districts, item sets
and individual items within each set were examined. In some cases, items were elimi-nated because they were not deemed to be of significant value or quality. In other cases, items were modified to more accurately reflect the type of technology available at the time of survey development (e.g., PalmPilots, probes, and portable computers were added). Finally, items that district representatives indicated would provide valu-able information to assist them in planning future technology acquisitions were also added (e.g., value of a telephone line in the classroom, qualities of a technology spe-cialists that teachers felt were most desirable).2
Step 5: Survey Review, Piloting, and ModificationBased on the item review process, draft versions of the teacher and student surveys
were developed. These draft surveys included approximately half the total number of items initially developed. Decisions to eliminate items and/or item sets were based primarily on the importance of the hypothesis for which they were initially developed, the expected strength of their influence on use, and/or the perceived quality of the

Rep
ort 1
1 ·
May
200
4Technical Report 12
item (e.g., clarity, unidimensionality, and anticipated ease of interpretation). The draft surveys were then administered to approximately 30 teachers and 20 students in each grade level (i.e., Grades 5, 8, and 11). In most cases, a member of the survey develop-ment team was present when the survey was completed; upon completion of the survey they asked participants to describe their interpretation of questions and their reasons for selecting a given response. In other cases, participants were asked to highlight ambiguous or confusing questions as they completed the survey. Based on this feed-back, several items were modified and the piloting process was repeated with a smaller sample of teachers and students.
Step 6: FinalizationOnce the survey items were finalized, NCS Pearson Survey Development Software
was used to layout the final versions of the surveys. The surveys were then reviewed by several readers to examine proper layout and to identify typographical errors. The final versions of the surveys were then printed on scan sheet forms by NCS Pearson.
Although some of these steps occurred in a purely linear fashion, it is important to note that this was not always the case. For example, Steps 1, 2, and 3 occurred in an iterative manner. While the development process began with a review of the litera-ture, the literature was revisited frequently as models and hypotheses were developed. Similarly, new hypotheses were developed as items were developed, reviewed, and piloted. In total, the survey development process occurred over a period of 8 months and involved approximately 25 people in the item development process, 50 people in the piloting process, and the input of 4 members of the Advisory Board.3
As noted above, the principal surveys were based on the teacher surveys. For this reason, piloting was not performed with the principal survey. The district surveys were similar to the principal surveys but included additional item sets that focused specifi-cally on district-level issues (e.g., decision-making process, funding, school committee and community involvement). The district-level survey was reviewed by a local tech-nology director and by a former superintendent. Since much of the information col-lected at the district level was person-specific, separate district surveys were developed for different categories of district-level leaders.
Surveys are available on-line at: http://www.bc.edu/research/intasc/studies/USEIT/description.shtml
Rep
ort 1
1 ·
May
200
4Technical Report 13
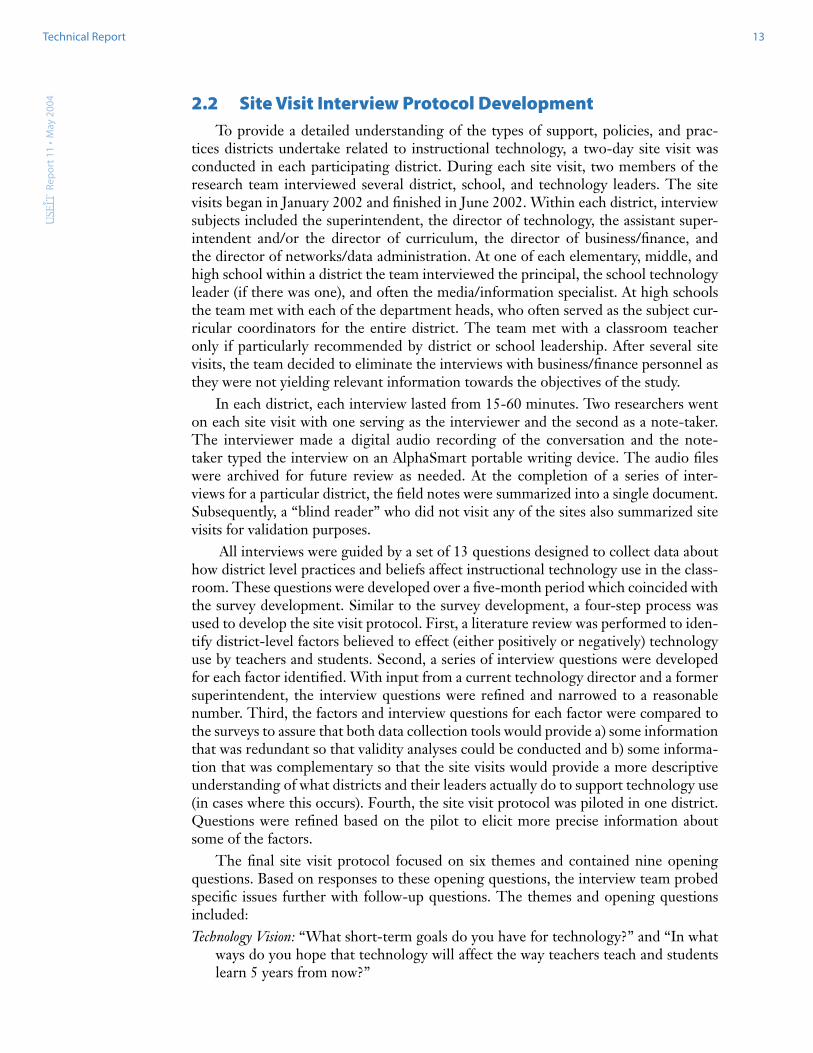
2.2 Site Visit Interview Protocol DevelopmentTo provide a detailed understanding of the types of support, policies, and prac-
tices districts undertake related to instructional technology, a two-day site visit was conducted in each participating district. During each site visit, two members of the research team interviewed several district, school, and technology leaders. The site visits began in January 2002 and finished in June 2002. Within each district, interview subjects included the superintendent, the director of technology, the assistant super-intendent and/or the director of curriculum, the director of business/finance, and the director of networks/data administration. At one of each elementary, middle, and high school within a district the team interviewed the principal, the school technology leader (if there was one), and often the media/information specialist. At high schools the team met with each of the department heads, who often served as the subject cur-ricular coordinators for the entire district. The team met with a classroom teacher only if particularly recommended by district or school leadership. After several site visits, the team decided to eliminate the interviews with business/finance personnel as they were not yielding relevant information towards the objectives of the study.
In each district, each interview lasted from 15-60 minutes. Two researchers went on each site visit with one serving as the interviewer and the second as a note-taker. The interviewer made a digital audio recording of the conversation and the note-taker typed the interview on an AlphaSmart portable writing device. The audio files were archived for future review as needed. At the completion of a series of inter-views for a particular district, the field notes were summarized into a single document. Subsequently, a “blind reader” who did not visit any of the sites also summarized site visits for validation purposes.
All interviews were guided by a set of 13 questions designed to collect data about how district level practices and beliefs affect instructional technology use in the class-room. These questions were developed over a five-month period which coincided with the survey development. Similar to the survey development, a four-step process was used to develop the site visit protocol. First, a literature review was performed to iden-tify district-level factors believed to effect (either positively or negatively) technology use by teachers and students. Second, a series of interview questions were developed for each factor identified. With input from a current technology director and a former superintendent, the interview questions were refined and narrowed to a reasonable number. Third, the factors and interview questions for each factor were compared to the surveys to assure that both data collection tools would provide a) some information that was redundant so that validity analyses could be conducted and b) some informa-tion that was complementary so that the site visits would provide a more descriptive understanding of what districts and their leaders actually do to support technology use (in cases where this occurs). Fourth, the site visit protocol was piloted in one district. Questions were refined based on the pilot to elicit more precise information about some of the factors.
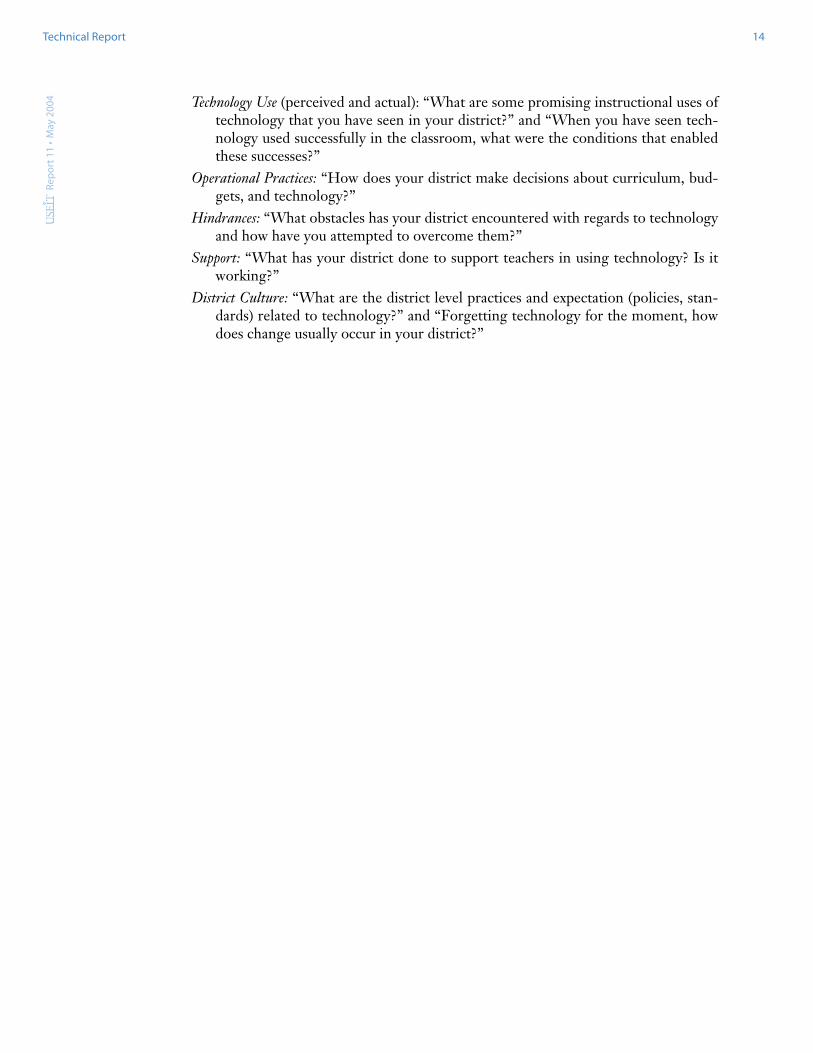
The final site visit protocol focused on six themes and contained nine opening questions. Based on responses to these opening questions, the interview team probed specific issues further with follow-up questions. The themes and opening questions included:Technology Vision: “What short-term goals do you have for technology?” and “In what
ways do you hope that technology will affect the way teachers teach and students learn 5 years from now?”
Rep
ort 1
1 ·
May
200
4Technical Report 14
Technology Use (perceived and actual): “What are some promising instructional uses of technology that you have seen in your district?” and “When you have seen tech-nology used successfully in the classroom, what were the conditions that enabled these successes?”
Operational Practices: “How does your district make decisions about curriculum, bud-gets, and technology?”
Hindrances: “What obstacles has your district encountered with regards to technology and how have you attempted to overcome them?”
Support: “What has your district done to support teachers in using technology? Is it working?”
District Culture: “What are the district level practices and expectation (policies, stan-dards) related to technology?” and “Forgetting technology for the moment, how does change usually occur in your district?”

Rep
ort 1
1 ·
May
200
4Technical Report 15
Chapter 3: Study Participants
3.1 Selection and Recruitment of Participating DistrictsThe USEIT Study was spawned by an inquiry from a group of 16 districts located
in the greater-metropolitan area surrounding Boston, Massachusetts. Upon receipt of funding to conduct this study, the number of participating districts was expanded to increase the diversity of participating districts. To this end, 5 of the original districts were dropped from the study and 12 districts located across the state of Massachusetts were invited to participate. Of these 12 districts, 11 opted to join the study for a total of 22 districts.
To identify the 5 districts dropped from the study, two criteria were applied. First, districts that had similar demographics were grouped into one of three categories – small urban, high SES suburban, and middle SES suburban. Given the limited number of small urban districts, it was determined that all of the small urban districts would be retained. Within high and middle SES suburban categories, districts were probed as to the probability that they could complete all the data collection requirements. Through this process, 3 districts determined that recent changes in their administration would make data collection difficult, 1 district determined that their participation in another large study would hinder data collection, and 1 district that was experiencing difficulty negotiating a union contract believed that teacher and student surveying would be unsuccessful. Therefore, these districts were dropped from the study.
To identify districts to be added to the study, two criteria were applied. First, we sought to increase the number of small and rural districts while also including some sub-urban districts located outside of the greater-Boston metropolitan area. Specifically, we sought to include 5 rural districts, 2 additional small urban districts, and 3-4 additional suburban districts. Second, we sought to include districts that had made some effort to establish technology programs. To this end, the research team asked several technol-ogy leaders to suggest districts that had a solid technology program in place. Based on these suggestions, the research team conducted telephone interviews with the technol-ogy director and superintendent in each district during which background information about their technology program was collected. The purpose of these interviews was to provide some assurance that the district had invested sufficient efforts in establishing a technology program for us to study the effects of the program on teacher and student use of technology. This process resulted in 12 potential districts, all of which were invited to participate. Although it was anticipated that approximately half would opt to participate, 11 of the districts indicated that they would join the study.

Rep
ort 1
1 ·
May
200
4Technical Report 16
When data collection began, the study included 22 districts located throughout Massachusetts. Of these, 3 are considered small urban districts, 5 are rural districts, and the remaining 14 are suburban districts. Figure 1, below, shows the geographic location of the participating school districts.
Figure 1 Geographic Locations of the USEIT Participating School Districts
Acton/Boxborough
Arlington
Ashburham/ Westminster
Bedford
Belmont
Brookline
Concord/Carlisle
Everett
Hampden/ Wilbraham
Ipswich
Mohawk Trail
Mount Greylock
Newton
Northbridge
Norwood
Shrewsbury
Sutton
Swampscott
Waltham
Watertown
Weston
Winchester
Rep
ort 1
1 ·
May
200
4Technical Report 17
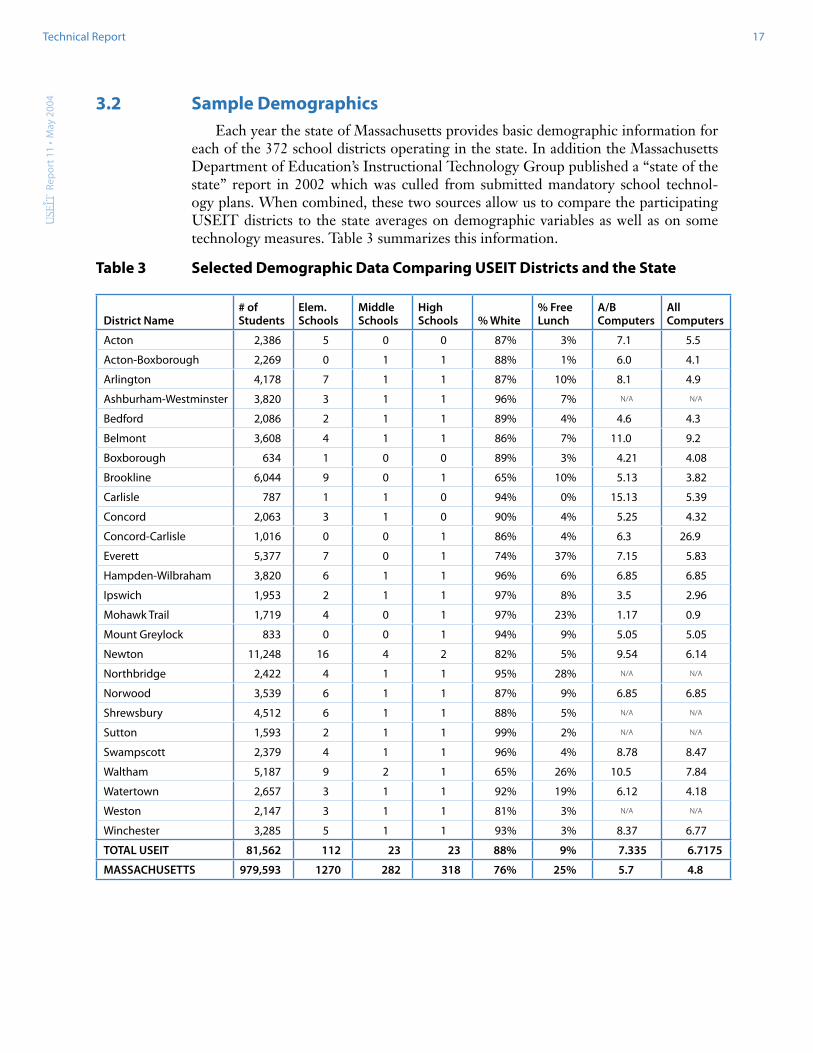
3.2 Sample DemographicsEach year the state of Massachusetts provides basic demographic information for
each of the 372 school districts operating in the state. In addition the Massachusetts Department of Education’s Instructional Technology Group published a “state of the state” report in 2002 which was culled from submitted mandatory school technol-ogy plans. When combined, these two sources allow us to compare the participating USEIT districts to the state averages on demographic variables as well as on some technology measures. Table 3 summarizes this information.
Table 3 Selected Demographic Data Comparing USEIT Districts and the State
District Name# of Students
Elem. Schools
Middle Schools
High Schools % White
% Free Lunch
A/B Computers
All Computers
Acton 2,386 5 0 0 87% 3% 7.1 5.5
Acton-Boxborough 2,269 0 1 1 88% 1% 6.0 4.1
Arlington 4,178 7 1 1 87% 10% 8.1 4.9
Ashburham-Westminster 3,820 3 1 1 96% 7% N/A N/A
Bedford 2,086 2 1 1 89% 4% 4.6 4.3
Belmont 3,608 4 1 1 86% 7% 11.0 9.2
Boxborough 634 1 0 0 89% 3% 4.21 4.08
Brookline 6,044 9 0 1 65% 10% 5.13 3.82
Carlisle 787 1 1 0 94% 0% 15.13 5.39
Concord 2,063 3 1 0 90% 4% 5.25 4.32
Concord-Carlisle 1,016 0 0 1 86% 4% 6.3 26.9
Everett 5,377 7 0 1 74% 37% 7.15 5.83
Hampden-Wilbraham 3,820 6 1 1 96% 6% 6.85 6.85
Ipswich 1,953 2 1 1 97% 8% 3.5 2.96
Mohawk Trail 1,719 4 0 1 97% 23% 1.17 0.9
Mount Greylock 833 0 0 1 94% 9% 5.05 5.05
Newton 11,248 16 4 2 82% 5% 9.54 6.14
Northbridge 2,422 4 1 1 95% 28% N/A N/A
Norwood 3,539 6 1 1 87% 9% 6.85 6.85
Shrewsbury 4,512 6 1 1 88% 5% N/A N/A
Sutton 1,593 2 1 1 99% 2% N/A N/A
Swampscott 2,379 4 1 1 96% 4% 8.78 8.47
Waltham 5,187 9 2 1 65% 26% 10.5 7.84
Watertown 2,657 3 1 1 92% 19% 6.12 4.18
Weston 2,147 3 1 1 81% 3% N/A N/A
Winchester 3,285 5 1 1 93% 3% 8.37 6.77
TOTAL USEIT 81,562 112 23 23 88% 9% 7.335 6.7175
MASSACHUSETTS 979,593 1270 282 318 76% 25% 5.7 4.8

Rep
ort 1
1 ·
May
200
4Technical Report 18
Table 3 shows the basic topography of the participating school districts. In most cases, a school district had at least one middle school and one high school and about five elementary schools. In some cases, a regional high school was shared across two school districts (for example Concord-Carlisle and Acton-Boxborough). The partici-pating USEIT districts differ from the state average on free/reduced lunch participa-tion and ethnic composition. Specifically, the USEIT sample districts are comprised of 88% white students compared to the state average of 76%. Nine percent of the USEIT district students participate in a free/reduced lunch program compared to the state average of 25%. Looking specifically at access to technology in schools, the state reports more computers per students than the USEIT districts report. When examin-ing only A/B type computers, the USEIT districts and the Massachusetts averages are 7.3 and 5.7 students per computer, respectively. Across all types of computers this rela-tionship changes little with 6.7 and 4.8 students per computer reported for the USEIT and total state averages, respectively. Thus, the USEIT districts contain less minority and financially burdened students than the state. However, the districts participating in the USEIT study have fewer computers than the state’s average.

Rep
ort 1
1 ·
May
200
4Technical Report 19
3.3 Survey Response Rates
District SurveyData were collected from the “district-level” administration office in each dis-
trict in fall 2001 via a district-level administration survey. Those surveyed included the Superintendent, Curriculum Director, Professional Development Director, Technology Director, and Head Technician for each participating district. Table 4 shows the response rate of the district-level administration survey as of September 2002.
Table 4 District-Level Administration Survey Responses
Technology Director
Superintendent
Curriculum
Director
Professional D
evelopm
ent Director
Technician
Total:
Acton-Boxborough 1 1 1 1 1 5
Arlington 1 1 2
Ashburham-Westminster 0
Bedford 1 1 1 1 4
Belmont 1 1 8 1 11
Brookline 1 8 1 10
Concord/Carlisle 1 1 1 1 1 5
Everett 1 1 1 1 1 5
Hampden-Wilbraham 1 1 1 1 1 5
Ipswich 1 1 1 1 4
Mohawk Trail 1 1 1 3
Mt. Greylock 1 1 2
Newton 1 1 1 1 4
Northbridge 1 1 1 1 1 5
Norwood 1 1 1 1 1 5
Shrewsbury 1 1 1 1 1 5
Sutton 1 1 1 1 1 5
Swampscott 1 1 1 1 4
Waltham 1 1* 8 1 1 12
Watertown 1 1 1 1 1 5
Weston 1 1 1 1 4
Winchester 1 1 1 1 1 5
Total: 20 20 39 17 14 110
*Assistant Superintendent

Rep
ort 1
1 ·
May
200
4Technical Report 20
From Table 4 it is evident that only one district (Ashburham-Westminster) failed to return any district-level administration surveys. Although some districts did not return surveys for each administrator in their district (most notably the “Technician” and “Professional Development Director” surveys) this is often attributable to the fact that some districts do not have these administrative positions.
Teacher SurveyThe research design for the USEIT study involved surveying every mathematics,
science, social studies, and English/language arts teacher in each of the participat-ing schools. Each district was responsible for distributing and collecting their teacher surveys during a staff meeting. This was a requirement for participation in the study. However, it was impractical to survey only the teachers of the four subjects, so in nearly all schools all teaching faculty were surveyed. Using a state supplied database we calculated the total number of teachers in each school within each district. To ensure accuracy, a sample of schools was telephoned to confirm and update our esti-mates. Fifteen percent was added to each of our estimates to err on the side of sending too many surveys, rather than too few.
In January and February 2002, 8,361 teacher surveys were sent to the 22 districts to cover our estimation of 7,270 teachers (with an additional 15%). By June 2002, 4,308 teacher surveys were returned. Thus, the teacher surveys had an overall response rate of 59.3%. However, the 41% of missing responses was by no means random. Since the purpose of the survey was not to be statistically representative of each district, districts were not required to survey students and teachers in each school within a dis-trict. However, it was required that each participating district survey had at least one high school, one middle school, and four elementary schools. For instance, if a dis-trict had three middle schools, we asked that districts survey teachers in two of those middle schools and not to survey teachers from the third school. Across a number of participating districts, 20 schools were not surveyed because the district was able to meet the participating requirements with their other schools. When these 20 schools are dropped from the initial teacher count, the sample response rate climbs to 68.6%. Thus, across all of the 143 schools that participated in the teacher data collection pro-cedures, our sample constitutes 69% of the faculty population (4,308 surveys). Table 5 outlines the teacher survey response rate.
Table 5 Teacher Survey Response Rates
# of Districts # of Schools PopulationReturned Surveys Rate
All Districts/Schools 22 163 7270 4308 59.2%
No zero response schools 22 143 6272 4308 68.7%
Principal SurveyOne principal survey was sent to each of the 165 schools within the 22 participat-
ing districts. The surveys were to be completed by each school’s senior principal. As of June 2002, 121 completed surveys were returned resulting in a 73% response rate. When the two districts that did not survey their teachers or principals are removed from the analysis the response rate climbs to 80.5% with 116 out of 144 principals responding. For the purposes of our study, this sample is adequate.

Rep
ort 1
1 ·
May
200
4Technical Report 21
Student SurveyIt was central to various aspects of the USEIT study to acquire the “voice” of the
student in our data collection. However, it was both impractical and unnecessary to survey every student across the 22 participating districts. Grades 5, 8, and 11 were selected to collect information from the upper ranges of elementary, middle and high schools, respectively. State databases were consulted to determine the number of sur-veys needed in each district. Again, a sample of schools was telephoned to confirm and update the accuracy of our student estimates. Additionally, 15% extra surveys were sent to the schools to ensure that there would be enough surveys for every student at each of the three grade levels. Our estimated population of Grade 5, 8, and 11 across the 22 districts was 19,624 students. As of June 2002, we received 13,388 responses for an overall student response rate of 68%.
As with the teacher survey responses, the “missing” 32% of the student surveys are not random. When looking across the three sampled grades (5th, 8th, and 11th) the response rate declines as students get older. Specifically, the response rates for fifth, eighth and eleventh grade students are 76%, 70%, and 57%, respectively. Additionally, one district did not participate in the student data collection. When this district is dropped from the analysis, the overall student response rate rises 5% to 73%. Table 6 outlines the response rates for the 21 districts participating in the collection of stu-dent data. As was seen with the teacher surveys, 13 schools within participating dis-tricts also chose not to distribute the surveys to their students. When these 13 schools are removed from the analyses, the response rate climbs to 83% across all grades. Specifically, the individual Grade 5, 8, and 11 student response rates increase to 88%, 84%, and 75%, respectively. Thus, across all schools that participated in student sur-vey data collection, we have 83% of the Grade 5, 8, and 11 student population in our sample (13,388 surveys).
Table 6: Student Survey Response Rates
Districts Schools PopulationReturned Surveys Rate
All Districts/Schools* 21 153 18,271 13,388 73.3%
No zero response schools 21 144 16,125 13,388 83.0%
* One USEIT district did not participate in the collection of student data.
Linking Students, Teachers, and SchoolsTo facilitate future analyses, data collection was structured so that students could
be linked to teachers, teachers to principals or schools, and principals to districts. Each survey that was collected was coded with a number that identified the school and district from which they came. Additionally, teachers were asked to put the first four letters of their last names on each survey and students were asked to write the first four letters of their teacher’s last name on their survey. Grade 5 students used their classroom teachers name while Grade 8 and 11 students put the first four letters of their science, mathematics, social studies, and English/language arts teachers’ last names. This type of linking allows for an analysis of the relationship between teacher and student responses to the same questions.

Rep
ort 1
1 ·
May
200
4Technical Report 22
Of the 5,184 fifth grade student surveys collected, 71% (n = 3,699) have been suc-cessfully linked to their fifth grade teachers. This means that for 71% of the student surveys, we can examine the relationship between the teachers and their specific stu-dents. Since the eighth and eleventh grade students typically reported having more than a single teacher, it is necessary to look at the matching data by subject area. Table 7 shows the numbers of successfully linked students for the eighth and eleventh grade samples.
Table 7: Successfully Matched Eighth and Eleventh Grade Students by Subject
Total Number at 8th Grade: 4762 Total Number at 11th Grade: 3293
Linked at the 8th grade
% Linked at the 8th grade
Linked at the 11th grade
% Linked at the 11th grade
English 3377 70.9% 2596 78.8%
Mathematics 2818 59.2% 2482 75.4%
Science 2883 60.5% 2204 66.9%
Social Studies 2400 50.4% 2371 72.0%
3.4 Classifying TeachersThe teacher survey contained two items designed to collect information about the
subject area(s) and grade level(s) taught during the year the survey was administered. Since many of our planned analyses focused on teachers who teach specific subject areas, it was necessary to classify teachers as subject area teachers, classroom teach-ers who teach multiple subjects, special education teachers, or teachers of “special” subjects (e.g., music, art, physical education). Similarly, since some of our planned analyses focused on school levels, it was necessary to classify teachers into one of three levels, namely elementary, middle, or high school. Below, we describe the logic applied when classifying teachers by school level and by subject area.
By School LevelTo classify teachers by school level, the following logic was applied:
• Teachers who reported teaching grades K, 1, 2, 3, 4, and/or 5 only were clas-sified as Lower Grade Level teachers.
• Teachers who reported teaching in grades 6, 7, and/or 8 only were classified as Middle Grade Level teachers.
• Teachers who reported teaching in grades 9, 10, 11, and/or 12 only were clas-sified as Upper Grade Level teachers.
• If a teacher who indicated s/he teaches Grade 6 works in a school whose grade levels range from K–6 or from 2–6, then the teacher was classified as a Lower Grade Level teacher.
• If a teacher who indicated s/he teaches Grade 6 works in a school whose grade levels range from 4–8 or from K–8, then the teacher was classified as a Middle Grade Level teacher.
• If a teacher who indicated s/he teaches Grade 7 and/or 8 works in a school whose grade levels range from 7–12, then the teacher is classified as a Middle Grade Level teacher.
Rep
ort 1
1 ·
May
200
4Technical Report 23
Subject Area Classification RulesTo classify teachers by subject area, the following logic was applied:
• Teachers who submitted surveys containing a district code from a district that decided not to participate in the study after surveys were sent to the district office were removed.
• Teachers who did not report teaching any grade level were removed.• Only those teachers who indicated they taught mathematics, science,
English/Language Arts, social studies, and/or all subject areas in a self-con-tained classroom setting were selected.
• Retain teachers who indicated they taught special education but indicated that less than 50% of their students are special needs or perform below aver-age. (It was reasoned that these teachers indicated they teach special educa-tion because there are some special education students in their classrooms, but they are not in fact full-time special education teachers.)
• Teachers who reported teaching in a grade level that was outside of their School Level Classification were removed.
• All teachers who indicated they were Librarians were removed.The SPSS syntax used to classify teachers by school level and by subject area is
contained in Appendix E.
3.5 Comparing USEIT to National Data SourcesThe USEIT Study was designed to enable intense and sustained investigation of a
series of issues across multiple school districts. Many of the issues examined are gener-ally encountered by schools across the nation. The 22 districts that participated in this study were selected to allow us easy and extensive access to their schools. When select-ing participating districts, we made a concerted effort to include districts in rural, sub-urban, and small urban settings. In addition, we included districts that were believed to have educational technology programs that were in different stages of development – from very advanced and well established to those that are still being established.
We recognize that districts from across the nation will be interested in using the information provided by this study to inform their own educational technology pro-grams. We also understand that districts across the nation will ask how similar the study districts are to themselves. For this reason, we provide several comparisons of the characteristics of the study participants with schools, students, and teachers across the nation. In doing so, we emphasize that we are not attempting to argue that the set of districts that participated in the study are representative of districts across the nation. Rather, we present these comparisons to help readers better understand the characteristics of the study participants and how these characteristics compare with other groups of schools, students, and teachers.

Rep
ort 1
1 ·
May
200
4Technical Report 24
Student Access to and Use of ComputersIn early 2001, a nationally representative survey was conducted of 7 th –12 th grad-
ers by Harris Interactive, Inc. Table 8 outlines the differences between the two data sources.
Table 8: Comparison of USEIT and Harris Data Sources
USEIT Harris
Methodology Questionnaire Telephone survey
Date of data collection Spring 2002 January 15–28, 2001
Sample (n) 8,371 500
Sample (Grades) 8th and 11th 7th–12th
Sample (Geography) Massachusetts Across USA
Data collected in: Classroom (School) Student’s home
The two surveys have some overlap in their survey content. In some cases, the questions are nearly identical. In other cases, the questions differ in scale, wording, and tone, yet, the general content is similar enough to allow comparison.
Both surveys addressed students’ access to technology at home and the responses were similar. The Harris Poll reported that 94% of the surveyed students had com-puter access in their home. Similarly, in the USEIT survey 95% of all Grade 8 and 11 students report having a computer at home. Both surveys asked students about their access to the Internet in their home. Again, the responses from the two surveys are similar with 88% of Harris Poll students reporting Internet access at home and 91.4% in the USEIT sample reporting home access.
Both surveys also addressed students’ access to technology in their schools. Although most of the items in the two surveys address different topics or were worded differently and do not allow direct comparison, some of the items are similar enough to provide a meaningful comparison. One item asks students about the availability of computers at their schools. Table 9 shows the differences in the questions as well as the responses from both survey instruments.
Table 9: Comparison of Ease of Students’ Computer Access in School
USEIT–Student* Harris*
When you want to use a computer in school is it…
Which of the follow-ing best describes the availability of computers at your school?
Always easy to find a computer 29% 47%
Usually easy to find a computer 44% 43%
Sometimes difficult to find a computer 18% 8%
Always hard to find a computer 7% 2%
* USEIT Study (grades 8 and 11), Harris Poll (grades 7 through 12)

Rep
ort 1
1 ·
May
200
4Technical Report 25
Generally, the USEIT results indicate that students have more difficulty access-ing technology in schools as compared to the Harris results. Specifically, 18% more students in the Harris Poll than the USEIT survey reported that it is “always easy to find a computer”.
Since both surveys ask students about their use of technology in different subjects it is possible to compare results for English, mathematics, science, and social studies classes. Table 10 shows the percentage of students who use computers across the four main subject areas.
Table 10 Comparison of Student Computer Use in English, Math, Science and Social Studies
USEIT–Student* Harris*
How often do you use a computer in [subject] class?‡
In which of the fol-lowing classes do you use computers?
English 49% 61%
Math 29% 26%
Science 53% 50%
Social Studies 64% 55%
* USEIT Study (grades 8 and 11), Harris Poll (grades 7 through 12)‡ The percentage represents students who report using computers a couple of times a year or more.
Table 10 shows that across the two surveys, student use is very similar in mathe-matics and science, but differs in English and social studies. It is important to note that these results do not address the relative frequency of students’ technology use in these classes; only whether they have used technology in the class or not. Unfortunately, a more detailed comparison is not possible since the two instruments employ different scales.
Another question that was similar enough to allow meaningful comparison addressed where students use technology the most in their schools. Table 11 displays the frequencies of responses across both samples of students.
Table 11 Comparison of Where Students Use Technology the Most in School
USEIT–Student* Harris*
Where do you use technology (com-puters, AlphaSmarts, etc.) most in school?
Where do you use computers most of-ten in school?
In the classroom 10% 24%
In a computer lab 68% 39%
In the library/media center 20% 35%
* USEIT Study (grades 8 and 11), Harris Poll (grades 7 through 12)Note: Table percentages do not equal 100% because of missing data.
Again, there are differences in the school use of technology between the two groups. Specifically, the USEIT eighth and eleventh grade students predominately

Rep
ort 1
1 ·
May
200
4Technical Report 26
access technology in computer labs (68%). While the highest percentage of Harris Grade 7–12 students use computers in the computer lab, they use computers more regularly in classrooms and in the library/media center than do USEIT students.
These comparisons suggest that the USEIT and Harris samples are quite simi-lar in home access, but differ regarding use of technology in school. Specifically, the Harris study reported greater access to technology in school as compared to the stu-dents participating in the USEIT study. Moreover, the USEIT sample appears to lack technology access in the classroom and library as compared to the Harris respondents. With respect to where students learn new things about technology and computers, Table 12 indicates that a higher percentage of USEIT students reported learning new things at home as compared to the Harris sample.
Table 12 Comparison of Where Students Learn New Things With Technology
USEIT–Student* Harris*
Where do you usually learn how to do new things with computers?
Where have you learned the most about using computers?
At home 70% 56%
At school 25% 39%
* USEIT Study (grades 8 and 11), Harris Poll (grades 7 through 12)
Teacher Access to Technology It is also useful to examine how closely the participating USEIT teacher responses
resemble teachers’ access to technology across the nation. Unfortunately, a direct comparison is not possible since no national surveys of teachers’ technology access have been conducted recently. However, in Becker’s fall 1998 Teaching, Learning and Computing Survey, 80% of teachers reported that they had a computer at home. Similarly, the 2002 U.S. Census Current Population Survey “A Nation Online” reports that between 1998 and 2002 home access to computers for adults who have earned a college degree has grown at a rate of 5.3% per year. Since teachers have col-lege degrees, it is reasonable that their growth rate is similar to 5.3% a year. Applying a growth rate of 5.3% a year to Becker’s findings, one would expect a 15.9% increase in the number of teachers who own a computer at home which results in an estimated 95.9% of teachers who have a computer in their home. The percentage of USEIT teachers who own a home computer is remarkably similar, 95%. Although there are no other data that can be compared directly or indirectly to national data sources related to teachers’ use of computers in or out of school, it appears that home access to com-puters for the teachers participating in the USEIT study is similar to the projected access of teachers nationwide

Rep
ort 1
1 ·
May
200
4Technical Report 27
Chapter 4: Measurement Scales
4.1 Construction of Measurement ScalesWhen survey data is analyzed, responses to several questions or items are often
combined into one single measure, commonly referred to as a scale. A scale is a group of items that measure a single attribute. Typically at the design stage of the survey, items are written with the intent that they will hang together in one scale measuring a single attribute or construct. The use of a scale to measure an attribute has a couple of advantages over the use of a single item. First, measurement relying on a single item will likely contain more error than measurement made with a scale containing multiple items. Second, the use of more than one item to measure an attribute has important consequences for the validity of the measure.
A scale, through its individual items, can often represent the multiple aspects of a concept in a single measure. For example, a measure of student use of technology may be made up of items about students’ use of technology at home, in the classroom, for leisure, or for school work. Measurement of the attribute using just a single item could result in the loss of information about other aspects of the attribute. By measur-ing many facets of an attribute and combining them into a single scale, the validity of the measure is increased. A statistical procedure referred to as principal components analysis, is used to help create scales. This technique provides evidence that a theoreti-cal scale is measuring a single attribute.
Principal components analysis is a statistical procedure that tells us about impor-tant properties of a scale. It provides validity evidence for the creation of scales to mea-sure a single attribute and indicates whether the theoretical scales that were created at the design stage of the survey hang together as we had theorized. If the principal com-ponents analysis finds precisely the item groupings that we intended when creating the items, we have a strong confirmation of our initial hypothesis about how the items should relate to one another. Principal components analysis is an interdependence technique in which all variables are simultaneously considered and their relationship to each other is examined. This technique helps explain the variation among many original items using relatively few derived scales. Simply put, this technique analyzes the correlations among items and is a form of data reduction.
4.2 Creating Measurement Scales A measurement scale is created by examining the strength of the correlation
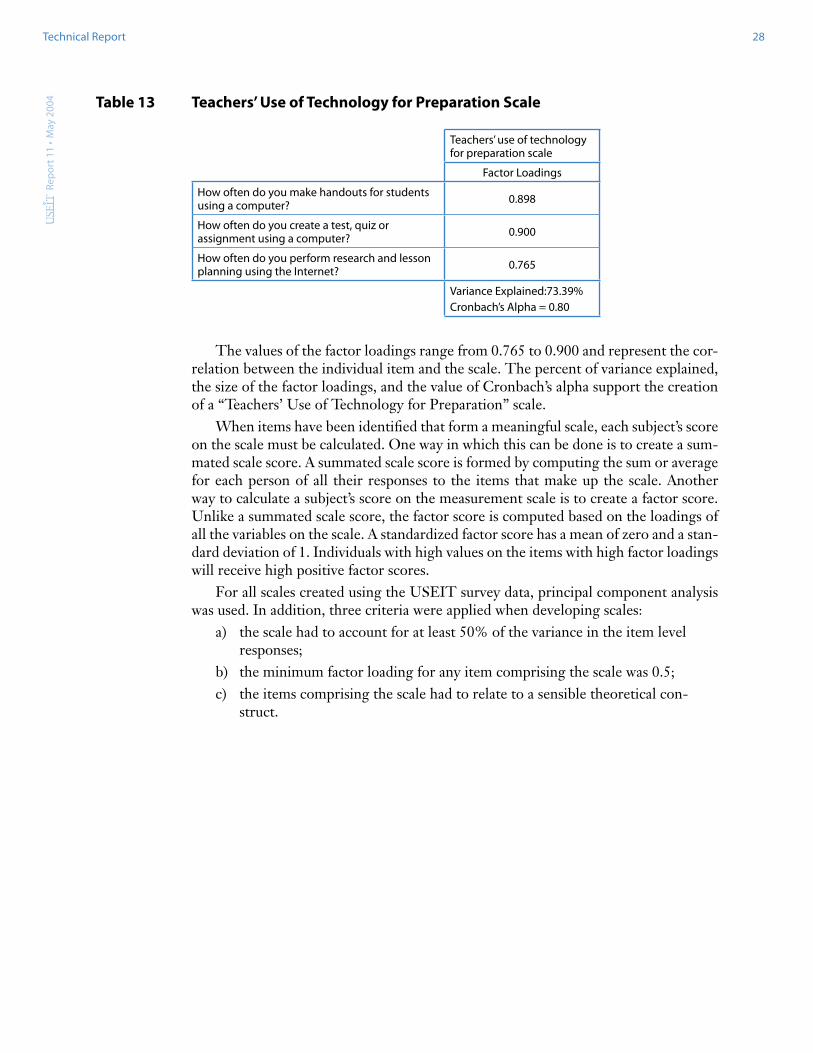
between the responses to individual items or questions. The magnitude of the rela-tionship between the items is evaluated by examining how high each item loads on a single scale and how much variability among the original number of items is explained by the created scales. For example, consider a scale created from the three items in Table 13. Each item represents some measure of how teachers use technology for preparation. When analyzed using principal components analysis, we find evidence that the three items, which were designed and written to form a scale, hang together and account for 73.39% of the variance in the item responses. The larger the percent of variance explained the more confident we can be that the scale is capturing the information in the individual items.
Rep
ort 1
1 ·
May
200
4Technical Report 28
Table 13 Teachers’ Use of Technology for Preparation Scale
Teachers’ use of technology for preparation scale
Factor Loadings
How often do you make handouts for students using a computer? 0.898
How often do you create a test, quiz or assignment using a computer? 0.900
How often do you perform research and lesson planning using the Internet? 0.765
Variance Explained:73.39%Cronbach’s Alpha = 0.80
The values of the factor loadings range from 0.765 to 0.900 and represent the cor-relation between the individual item and the scale. The percent of variance explained, the size of the factor loadings, and the value of Cronbach’s alpha support the creation of a “Teachers’ Use of Technology for Preparation” scale.
When items have been identified that form a meaningful scale, each subject’s score on the scale must be calculated. One way in which this can be done is to create a sum-mated scale score. A summated scale score is formed by computing the sum or average for each person of all their responses to the items that make up the scale. Another way to calculate a subject’s score on the measurement scale is to create a factor score. Unlike a summated scale score, the factor score is computed based on the loadings of all the variables on the scale. A standardized factor score has a mean of zero and a stan-dard deviation of 1. Individuals with high values on the items with high factor loadings will receive high positive factor scores.
For all scales created using the USEIT survey data, principal component analysis was used. In addition, three criteria were applied when developing scales:
a) the scale had to account for at least 50% of the variance in the item level responses;
b) the minimum factor loading for any item comprising the scale was 0.5;c) the items comprising the scale had to relate to a sensible theoretical con-
struct.
Rep
ort 1
1 ·
May
200
4Technical Report 29
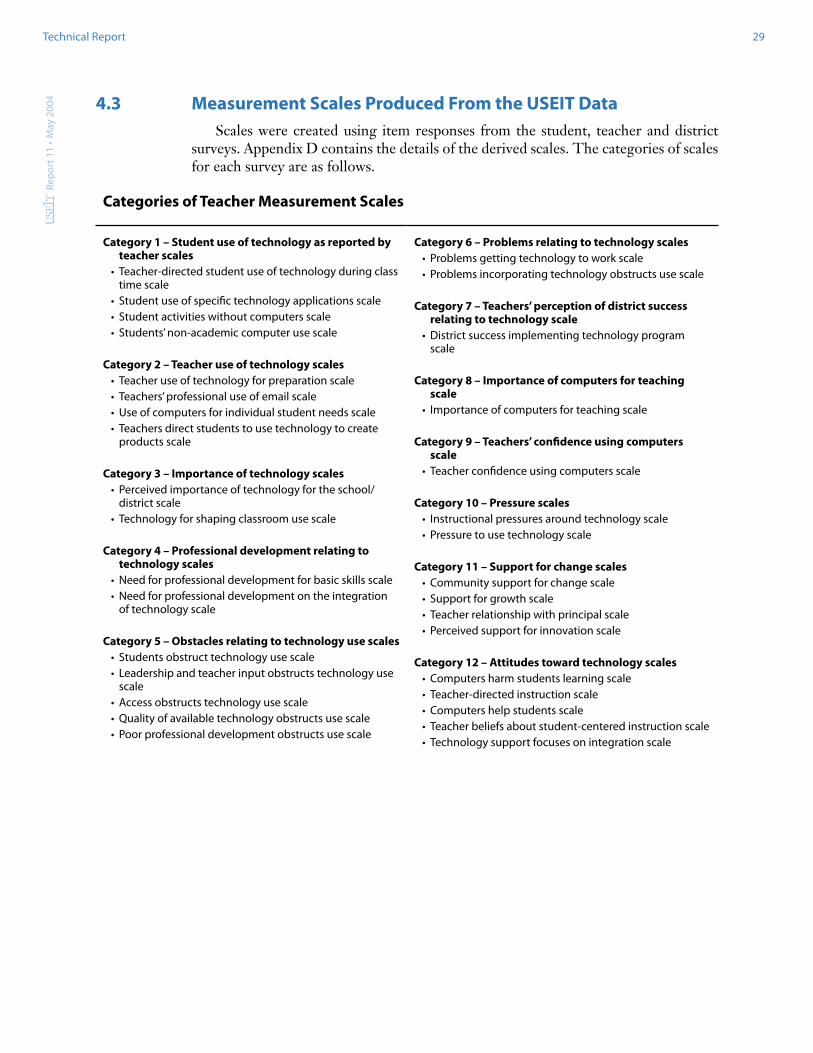
4.3 Measurement Scales Produced From the USEIT DataScales were created using item responses from the student, teacher and district
surveys. Appendix D contains the details of the derived scales. The categories of scales for each survey are as follows.
Categories of Teacher Measurement Scales
Category 1 – Student use of technology as reported by teacher scales
• Teacher-directed student use of technology during class time scale
• Student use of specific technology applications scale• Student activities without computers scale• Students’ non-academic computer use scale
Category 2 – Teacher use of technology scales• Teacher use of technology for preparation scale• Teachers’ professional use of email scale• Use of computers for individual student needs scale• Teachers direct students to use technology to create
products scale
Category 3 – Importance of technology scales• Perceived importance of technology for the school/
district scale• Technology for shaping classroom use scale
Category 4 – Professional development relating to technology scales
• Need for professional development for basic skills scale• Need for professional development on the integration
of technology scale
Category 5 – Obstacles relating to technology use scales • Students obstruct technology use scale• Leadership and teacher input obstructs technology use
scale• Access obstructs technology use scale• Quality of available technology obstructs use scale• Poor professional development obstructs use scale
Category 6 – Problems relating to technology scales• Problems getting technology to work scale• Problems incorporating technology obstructs use scale
Category 7 – Teachers’ perception of district success relating to technology scale
• District success implementing technology program scale
Category 8 – Importance of computers for teaching scale
• Importance of computers for teaching scale
Category 9 – Teachers’ confidence using computers scale
• Teacher confidence using computers scale
Category 10 – Pressure scales• Instructional pressures around technology scale• Pressure to use technology scale
Category 11 – Support for change scales• Community support for change scale• Support for growth scale• Teacher relationship with principal scale• Perceived support for innovation scale
Category 12 – Attitudes toward technology scales• Computers harm students learning scale• Teacher-directed instruction scale• Computers help students scale• Teacher beliefs about student-centered instruction scale• Technology support focuses on integration scale

Rep
ort 1
1 ·
May
200
4Technical Report 30
Categories of Student Measurement Scales
Category 1 – Student use of technology scales• Student reported use of computers for writing and
research scale• Student reported high-end home use of technology
scale• Student reported recreational home use scale
Category 2 – Student belief scale • Students report that computers help their work scale
Category 3 – Student self-reported skills scales• Student reports of how well they use for research and
writing scale• Student reports of how well they use for high-end use
scale
Category 4 – Students general comfort level with technology scale
• Student reported general comfort level with technology scale
Category 5 – Technology in the home scales• Student reported amount of technology in the home
scale• Student reported ease of access at home scale
Categories of District Measurement Scales
Category 1 – Policy scales• Number of restrictive policies relating to technology
use scale.
Category 2 – Personal use scales• Personal use scale• Communicating beyond school scale• Internet use scale
Category 3 – Belief scales• Technology helps students• Variety of external funding for technology scale• Line item funding for technology scale
Category 4 – Funding scales• General funding for technology scale• Variety of external funding for technology scale• Line item funding for technology scale
Category 5 – Equity scales• Equity of use and access for elementary school scale• Equity of use and access for special populations scale• Equity of use and access for middle and high school
students scale
Category 6 – Leadership scales• Leaders discuss technology scale• Evaluations consider technology scale
Category 7 – Decision-making scales• Principals’ technology discretion scale
Category 8 – Maturity of technology program scales• Strength of upgrading procedures scale
Category 9 – Professional development scales• Professional development focuses on integration scale• Variety of technology professional development scale

Rep
ort 1
1 ·
May
200
4Technical Report 31
Chapter 5: Site Visit Interview Analysis Design
5.1 Developing Dimensions for AnalysisAs described previously, site visits were conducted in each of the participating
districts. These site visits included interviews with district and school leaders as well as personnel who work specifically on technology-related issues. Two researchers par-ticipated in each site visit, with one serving as the primary interviewer and the second as a note-taker. In most cases, interviews were tape recorded. Following each site visit, the research team would review all notes and tape recordings (as needed) and would then write a 15–20 page summary report.
After the interviewers and the “blind reader” summarized all the field notes, a team of two researchers proceeded with the data analysis. This process started with both researchers analyzing the data independently to search for recurring themes in the data. The goal of this analysis was to extract from the data dimensions that appeared to contribute or hinder technology use in schools. In addition to independent analysis by the two researchers, this process also involved discussions between the two researchers as well as lengthy discussions with other team members. Twenty-one dimensions of technology use emerged from this process:Professional Development: The level of professional development programs offered,
attended, and their apparent usefulness to the teachers.Leadership: Strength of district leadership regarding technology. Resources: Amount of computers, recent software, and other related equipment avail-
able in the district, electrical power and data capabilities, and network access of computers and peripherals.
Technology Plan: District has a well-written technology plan and the extent to which the plan is followed.
Integration Specialist: Do schools have separate FTE positions for classroom or school integration specialists?
Teacher Support: Level of technology support for teachers separate from professional development (e.g. just-in-time support, building level support).
Testing: Degree to which the state test (MCAS) plays a role in the educational mission of the district.
Tech Director Background: Does the District Technology Director come from the class-room or from the IT/computer industry?
External Programs: The extent to which the district participates in technology edu-cation programs and projects outside the district, including grants, collaborative projects, e.g. Project MEET, Gen WHY, PT3.
Funding Level: The districts’ operational budget funding level for technology.Bottom-up: The extent to which teachers feel empowered to initiate changes and par-
ticipate in the decision-making process.Curriculum Council: The district maintains a curriculum council staffed with members
from every school.Community: The extent to which the community supports technology.

Rep
ort 1
1 ·
May
200
4Technical Report 32
Tech Director Decision-Making Powers: The extent to which the District Technology Director has the power to make purchase decisions.
Collaboration: The extent to which teachers collaborate on any educational objective.Building Projects: The role new building construction or renovation projects play in
equipment acquisition.Technology Supports Goals: The extent to which technology supports non-technology
short-term district goals.Technology Standards: Whether or not school districts have technology standards or
competencies and the extent to which teachers and students are accountable for those standards.
Vision: The extent to which the district has a clear technology vision.Obstacles: The extent to which obstacles mentioned by interviewees reflected a range of
complicated issues besides “time and money.”Equity: Whether or not equipment and resources were equitably distributed between
schools and within schools. One goal of the USEIT project is to provide districts with models for technology
implementation and improvement. With that end in mind, the research team decided early on to use the site visit data as a springboard to identify exemplary technology programs within the participating districts. Consequently, after identifying and agree-ing on the 21 dimensions of technology use, the team adopted a rating system to rate districts across the 21 dimensions. This process achieved two objectives: identifying exemplary technology programs and identifying particular areas of strength and weak-nesses within each participating district.
The rating process involved rating each of the 22 participating districts across the 21 dimensions. The two researchers responsible for the site visit data analysis indepen-dently rated each district on each dimension. The researchers rated districts on each dimension on a scale from 1 to 3. For most dimensions, a score of 3 corresponded to a high score and, conversely, a score of 1 corresponded to a low score. However, the testing and building projects dimensions were scored inversely; that is, a score of 1 indicated that testing was the district’s focus or that technology upgrades were mostly achieved through building projects (e.g., the building or renovation of schools). In addition to a score on each dimension, each district was also given an overall rating which represented the average score on all the dimension scores. The overall rating enabled the research team to rank districts from high to low scoring districts based on their overall rating.
After carefully examining the field notes and summaries for each district and then rating each district across the 21 dimensions, the two researchers met on a number of occasions to discuss their independent ratings. The purpose for the multiple meetings and discussions was to reach a consensus in terms of each district’s overall rating and relative standing on the district ranking scale. In the event that the two researchers were unable to reach a consensus, then the project director was enlisted as a facilitator to help reach a consensus. Finally, after all the districts had been rated and ranked, one of the site visit interviewers who did not participate in the rating process was consulted for validation purposes.
At the end of this process, a list of high scoring, middle scoring, and low scor-ing districts emerged. Additionally, the lengthy discussions about the dimensions and characteristics that defined each dimension resulted in an objective and concrete con-
Rep
ort 1
1 ·
May
200
4Technical Report 33
ceptualization of each of the dimensions. From a quantitative research epistemology, the process of establishing and refining rating criteria after the rating process, appears to be backwards. However, the research team felt that this endeavor would be more representative of the true characteristics of technology dimensions if approached from a qualitative epistemological perspective. Hence, dimension characteristics emerged from the data rather than being imposed by the researchers a priori.
5.2 Defining Dimension Criteria Researchers involved in the qualitative study developed rating criteria collabora-
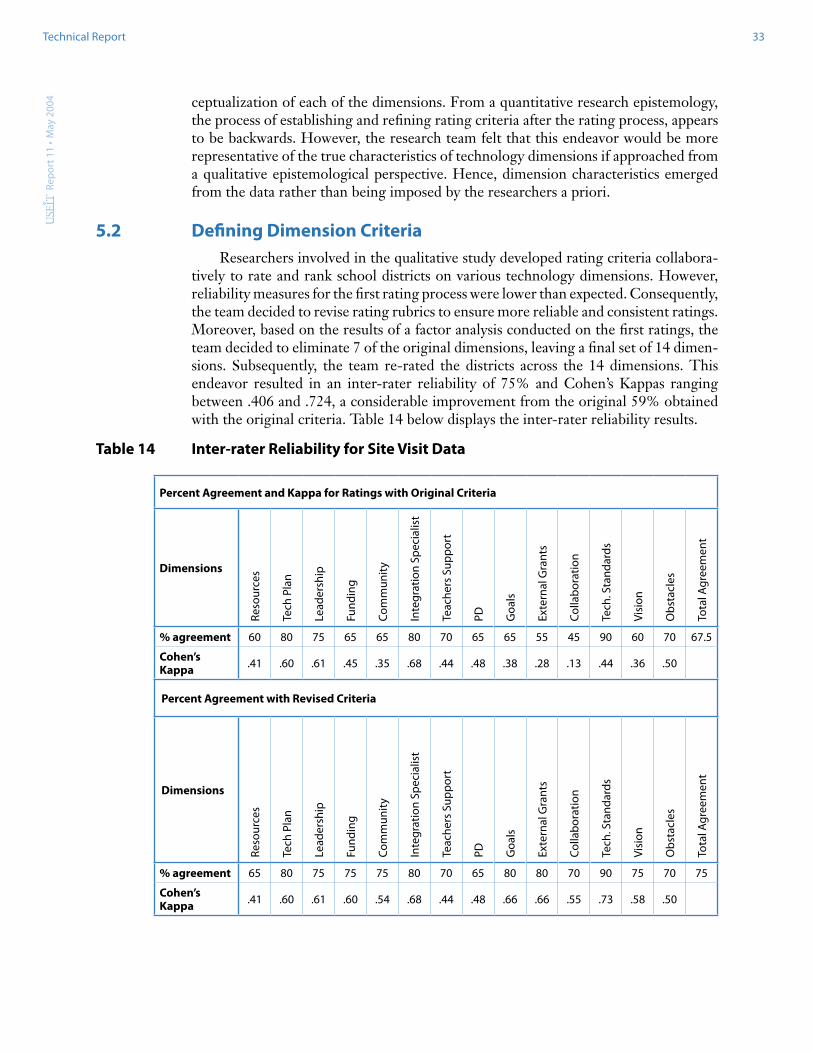
tively to rate and rank school districts on various technology dimensions. However, reliability measures for the first rating process were lower than expected. Consequently, the team decided to revise rating rubrics to ensure more reliable and consistent ratings. Moreover, based on the results of a factor analysis conducted on the first ratings, the team decided to eliminate 7 of the original dimensions, leaving a final set of 14 dimen-sions. Subsequently, the team re-rated the districts across the 14 dimensions. This endeavor resulted in an inter-rater reliability of 75% and Cohen’s Kappas ranging between .406 and .724, a considerable improvement from the original 59% obtained with the original criteria. Table 14 below displays the inter-rater reliability results.
Table 14 Inter-rater Reliability for Site Visit Data
Percent Agreement and Kappa for Ratings with Original Criteria
Dimensions
Reso
urce
s
Tech
Pla
n
Lead
ersh
ip
Fund
ing
Com
mun
ity
Inte
grat
ion
Spec
ialis
t
Teac
hers
Sup
por
t
PD Goa
ls
Exte
rnal
Gra
nts
Col
lab
orat
ion
Tech
. Sta
ndar
ds
Visi
on
Ob
stac
les
Tota
l Agr
eem
ent
% agreement 60 80 75 65 65 80 70 65 65 55 45 90 60 70 67.5
Cohen’s Kappa .41 .60 .61 .45 .35 .68 .44 .48 .38 .28 .13 .44 .36 .50
Percent Agreement with Revised Criteria
Dimensions
Reso
urce
s
Tech
Pla
n
Lead
ersh
ip
Fund
ing
Com
mun
ity
Inte
grat
ion
Spec
ialis
t
Teac
hers
Sup
por
t
PD Goa
ls
Exte
rnal
Gra
nts
Col
lab
orat
ion
Tech
. Sta
ndar
ds
Visi
on
Ob
stac
les
Tota
l Agr
eem
ent
% agreement 65 80 75 75 75 80 70 65 80 80 70 90 75 70 75
Cohen’s Kappa .41 .60 .61 .60 .54 .68 .44 .48 .66 .66 .55 .73 .58 .50
Rep
ort 1
1 ·
May
200
4Technical Report 34
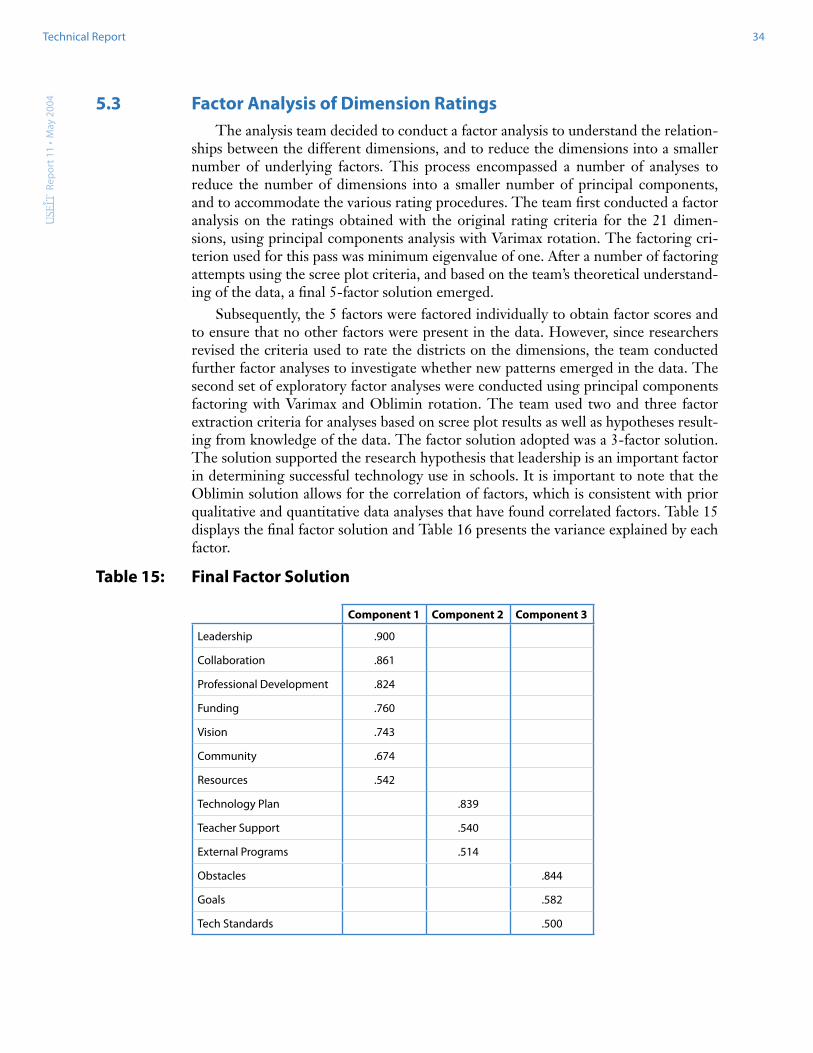
5.3 Factor Analysis of Dimension RatingsThe analysis team decided to conduct a factor analysis to understand the relation-
ships between the different dimensions, and to reduce the dimensions into a smaller number of underlying factors. This process encompassed a number of analyses to reduce the number of dimensions into a smaller number of principal components, and to accommodate the various rating procedures. The team first conducted a factor analysis on the ratings obtained with the original rating criteria for the 21 dimen-sions, using principal components analysis with Varimax rotation. The factoring cri-terion used for this pass was minimum eigenvalue of one. After a number of factoring attempts using the scree plot criteria, and based on the team’s theoretical understand-ing of the data, a final 5-factor solution emerged.
Subsequently, the 5 factors were factored individually to obtain factor scores and to ensure that no other factors were present in the data. However, since researchers revised the criteria used to rate the districts on the dimensions, the team conducted further factor analyses to investigate whether new patterns emerged in the data. The second set of exploratory factor analyses were conducted using principal components factoring with Varimax and Oblimin rotation. The team used two and three factor extraction criteria for analyses based on scree plot results as well as hypotheses result-ing from knowledge of the data. The factor solution adopted was a 3-factor solution. The solution supported the research hypothesis that leadership is an important factor in determining successful technology use in schools. It is important to note that the Oblimin solution allows for the correlation of factors, which is consistent with prior qualitative and quantitative data analyses that have found correlated factors. Table 15 displays the final factor solution and Table 16 presents the variance explained by each factor.
Table 15: Final Factor Solution
Component 1 Component 2 Component 3
Leadership .900
Collaboration .861
Professional Development .824
Funding .760
Vision .743
Community .674
Resources .542
Technology Plan .839
Teacher Support .540
External Programs .514
Obstacles .844
Goals .582
Tech Standards .500
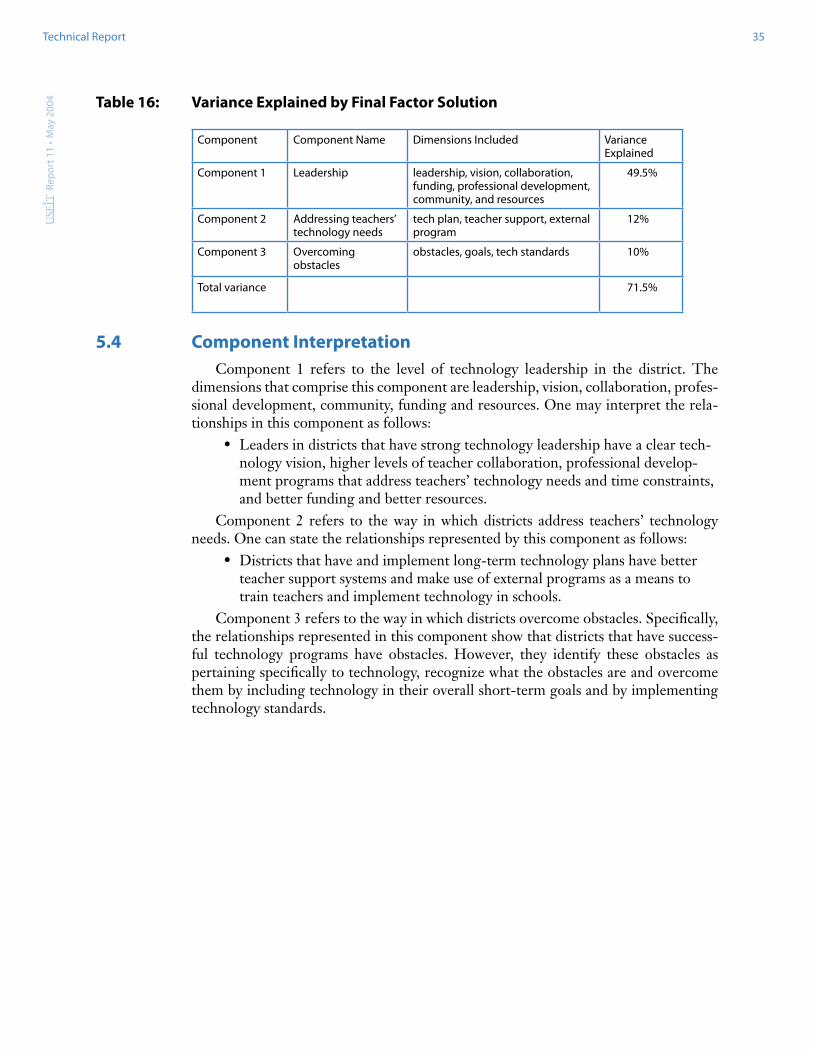
Rep
ort 1
1 ·
May
200
4Technical Report 35
Table 16: Variance Explained by Final Factor Solution
Component Component Name Dimensions Included Variance Explained
Component 1 Leadership leadership, vision, collaboration, funding, professional development, community, and resources
49.5%
Component 2 Addressing teachers’ technology needs
tech plan, teacher support, external program
12%
Component 3 Overcoming obstacles
obstacles, goals, tech standards 10%
Total variance 71.5%
5.4 Component InterpretationComponent 1 refers to the level of technology leadership in the district. The
dimensions that comprise this component are leadership, vision, collaboration, profes-sional development, community, funding and resources. One may interpret the rela-tionships in this component as follows:
• Leaders in districts that have strong technology leadership have a clear tech-nology vision, higher levels of teacher collaboration, professional develop-ment programs that address teachers’ technology needs and time constraints, and better funding and better resources.
Component 2 refers to the way in which districts address teachers’ technology needs. One can state the relationships represented by this component as follows:
• Districts that have and implement long-term technology plans have better teacher support systems and make use of external programs as a means to train teachers and implement technology in schools.
Component 3 refers to the way in which districts overcome obstacles. Specifically, the relationships represented in this component show that districts that have success-ful technology programs have obstacles. However, they identify these obstacles as pertaining specifically to technology, recognize what the obstacles are and overcome them by including technology in their overall short-term goals and by implementing technology standards.
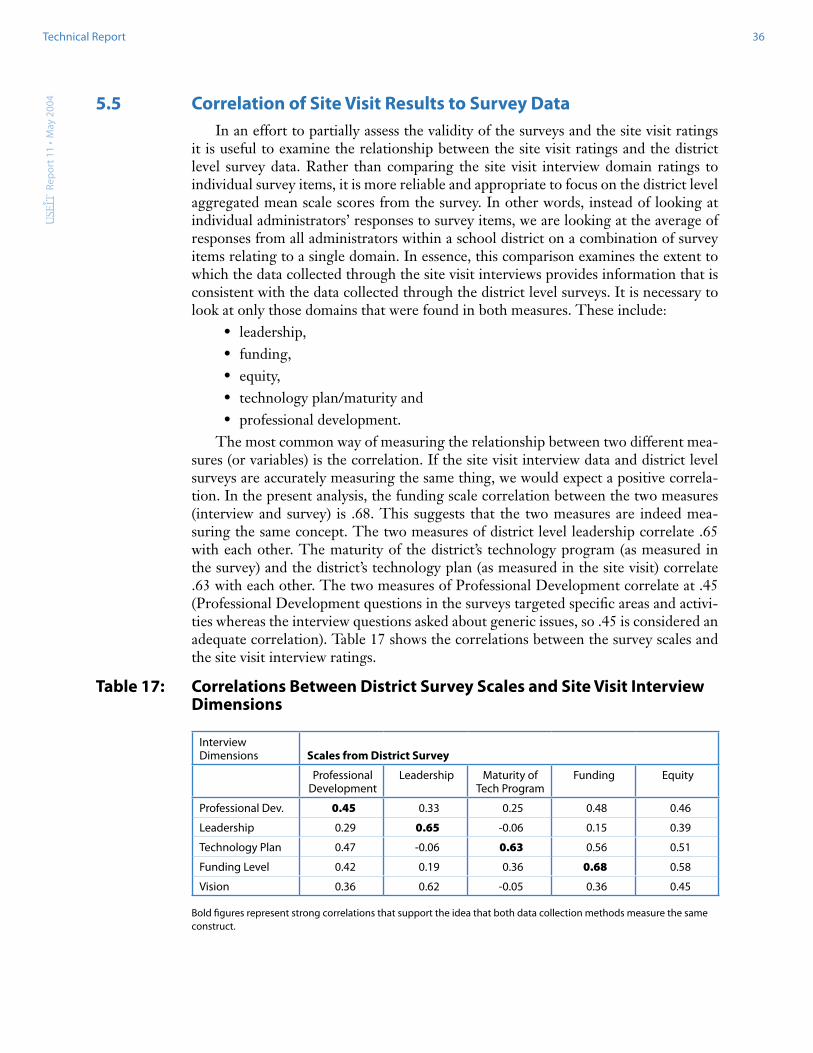
Rep
ort 1
1 ·
May
200
4Technical Report 36
5.5 Correlation of Site Visit Results to Survey DataIn an effort to partially assess the validity of the surveys and the site visit ratings
it is useful to examine the relationship between the site visit ratings and the district level survey data. Rather than comparing the site visit interview domain ratings to individual survey items, it is more reliable and appropriate to focus on the district level aggregated mean scale scores from the survey. In other words, instead of looking at individual administrators’ responses to survey items, we are looking at the average of responses from all administrators within a school district on a combination of survey items relating to a single domain. In essence, this comparison examines the extent to which the data collected through the site visit interviews provides information that is consistent with the data collected through the district level surveys. It is necessary to look at only those domains that were found in both measures. These include:
• leadership, • funding, • equity, • technology plan/maturity and • professional development.
The most common way of measuring the relationship between two different mea-sures (or variables) is the correlation. If the site visit interview data and district level surveys are accurately measuring the same thing, we would expect a positive correla-tion. In the present analysis, the funding scale correlation between the two measures (interview and survey) is .68. This suggests that the two measures are indeed mea-suring the same concept. The two measures of district level leadership correlate .65 with each other. The maturity of the district’s technology program (as measured in the survey) and the district’s technology plan (as measured in the site visit) correlate .63 with each other. The two measures of Professional Development correlate at .45 (Professional Development questions in the surveys targeted specific areas and activi-ties whereas the interview questions asked about generic issues, so .45 is considered an adequate correlation). Table 17 shows the correlations between the survey scales and the site visit interview ratings.
Table 17: Correlations Between District Survey Scales and Site Visit Interview Dimensions
Interview Dimensions Scales from District Survey
Professional Development
Leadership Maturity of Tech Program
Funding Equity
Professional Dev. 0.45 0.33 0.25 0.48 0.46
Leadership 0.29 0.65 -0.06 0.15 0.39
Technology Plan 0.47 -0.06 0.63 0.56 0.51
Funding Level 0.42 0.19 0.36 0.68 0.58
Vision 0.36 0.62 -0.05 0.36 0.45
Bold figures represent strong correlations that support the idea that both data collection methods measure the same construct.

Rep
ort 1
1 ·
May
200
4Technical Report 37
All of the correlations between the two measures of the same domain are positive and reasonably high. These results are logical and support the notion that within these domains both pieces of data are measuring similar constructs. Thus, there is reason-able evidence for validity between the two data collection procedures.
Endnotes 1 The USEIT data file will be released for public use by June 2004.
2 Although these items may prove useful during analyses, they were added primarily to increase the value of the survey for participants.
3 The Advisory Board includes Hank Becker, Chris Dede, David Dwyer, Cheryl Lemke, and Linda Roberts.

Rep
ort 1
1 ·
May
200
4Technical Report 38
APPENDIX A
Variable Names and Labels for Survey Items
Teacher Questionnaire Guide
Questionnaire Location Variable Name Description
TEAQ1 v1name What are the first four letters of your last name?
TEAQ2 v2yeart How many years have you taught at your current school?
TEAQ3 v3yearc How many years have you taught throughout your career?
TEAQ4 v4gender What is your gender?
TEAQ5 v5age Please mark the appropriate range for your age.
TEAQ6 v6school How do your school’s results on the state-mandated test compare to those of other schools in your state?
TEAQ7 v7usete With your class(es), are you currently using technology during instruction as much as you would like?
TEAQ8a v8adep.h Are you a department head?
TEAQ8b v8ball Do you teach at the elementary level?
TEAQ8c v8cengl Do you teach English/language arts?
TEAQ8d v8dmath Do you teach Math?
TEAQ8e v8essge Do you teach Social Studies/Geography/History?
TEAQ8f v8fspe Do you teach Special Education?
TEAQ8g v8gscien Do you teach Science?
TEAQ8h v8hlibra Are you a librarian?
TEAQ8i v8ifor Do you teach foreign languages?
TEAQ8j v8jtech. Do you teach Technology Education?
TEAQ8k v8kmusi Do you teach Music/arts?
TEAQ8l v8lother Do you teach something other than above?
TEAQ9a v9ak Do you teach Kindergarten?
TEAQ9b v9b1 Do you teach first grade?
TEAQ9c v9c2 Do you teach second grade?
TEAQ9d v9d3 Do you teach third grade?
TEAQ9e v9e4 Do you teach fourth grade?
TEAQ9f v9f5 Do you teach fifth grade?
TEAQ9g v9g6 Do you teach sixth grade?
TEAQ9h v9h7 Do you teach seventh grade?
TEAQ9i v9i8 Do you teach eighth grade?
TEAQ9j v9j9 Do you teach ninth grade?
TEAQ9k v9k10 Do you teach tenth grade?
TEAQ9l v9l11 Do you teach eleventh grade?
TEAQ9m v9m12 Do you teach twelfth grade?
TEAQ10a v10aproj How often do you use an LCD projector/Computer Projection System in your classroom?
TEAQ10b v10btvv How often do you use a TV monitor/VCR in your classroom?
TEAQ10c v10cscan How often do you use a scanner in your classroom?
TEAQ10d v10ddigi How often do you use a digital camera in your classroom?
TEAQ10e v10eover How often do you use an overhead projector in your classroom?
TEAQ11a v11awo During class time, how often did students work individually on school work without using computers this year?
TEAQ11b v11bwco During class time, how often did students work individually on school work using computers this year?
TEAQ11c v11cgr During class time, how often did students work in groups on school work without using computers this year?
TEAQ11d v11dgr During class time, how often did students work in groups on school work using computers this year?
TEAQ11e v11eres. During class time, how often did students perform research or find information without using a computer this year?
TEAQ11f v11fres. During class time, how often did students perform research or find information using the internet or CD-ROM this year?
TEAQ11g v11gdev. During class time, how often did students use a computer or portable writing device for writing this year?
TEAQ11h v11hsolv During class time, how often did students use a computer to solve problems this year?
TEAQ11i v11ikeyb During class time, how often did students learn keyboarding skills this year?
TEAQ11j v11jedg During class time, how often did students use a computer to play educational games this year?
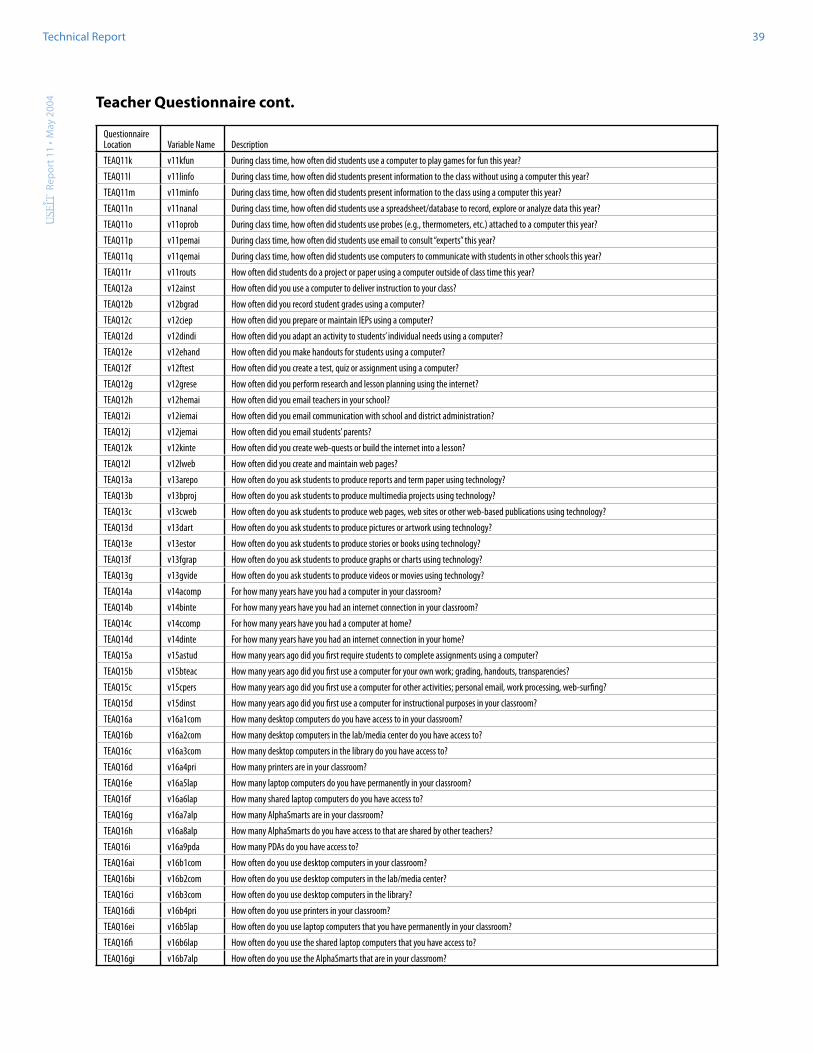
Rep
ort 1
1 ·
May
200
4Technical Report 39
Teacher Questionnaire cont.
Questionnaire Location Variable Name Description
TEAQ11k v11kfun During class time, how often did students use a computer to play games for fun this year?
TEAQ11l v11linfo During class time, how often did students present information to the class without using a computer this year?
TEAQ11m v11minfo During class time, how often did students present information to the class using a computer this year?
TEAQ11n v11nanal During class time, how often did students use a spreadsheet/database to record, explore or analyze data this year?
TEAQ11o v11oprob During class time, how often did students use probes (e.g., thermometers, etc.) attached to a computer this year?
TEAQ11p v11pemai During class time, how often did students use email to consult “experts” this year?
TEAQ11q v11qemai During class time, how often did students use computers to communicate with students in other schools this year?
TEAQ11r v11routs How often did students do a project or paper using a computer outside of class time this year?
TEAQ12a v12ainst How often did you use a computer to deliver instruction to your class?
TEAQ12b v12bgrad How often did you record student grades using a computer?
TEAQ12c v12ciep How often did you prepare or maintain IEPs using a computer?
TEAQ12d v12dindi How often did you adapt an activity to students’ individual needs using a computer?
TEAQ12e v12ehand How often did you make handouts for students using a computer?
TEAQ12f v12ftest How often did you create a test, quiz or assignment using a computer?
TEAQ12g v12grese How often did you perform research and lesson planning using the internet?
TEAQ12h v12hemai How often did you email teachers in your school?
TEAQ12i v12iemai How often did you email communication with school and district administration?
TEAQ12j v12jemai How often did you email students’ parents?
TEAQ12k v12kinte How often did you create web-quests or build the internet into a lesson?
TEAQ12l v12lweb How often did you create and maintain web pages?
TEAQ13a v13arepo How often do you ask students to produce reports and term paper using technology?
TEAQ13b v13bproj How often do you ask students to produce multimedia projects using technology?
TEAQ13c v13cweb How often do you ask students to produce web pages, web sites or other web-based publications using technology?
TEAQ13d v13dart How often do you ask students to produce pictures or artwork using technology?
TEAQ13e v13estor How often do you ask students to produce stories or books using technology?
TEAQ13f v13fgrap How often do you ask students to produce graphs or charts using technology?
TEAQ13g v13gvide How often do you ask students to produce videos or movies using technology?
TEAQ14a v14acomp For how many years have you had a computer in your classroom?
TEAQ14b v14binte For how many years have you had an internet connection in your classroom?
TEAQ14c v14ccomp For how many years have you had a computer at home?
TEAQ14d v14dinte For how many years have you had an internet connection in your home?
TEAQ15a v15astud How many years ago did you first require students to complete assignments using a computer?
TEAQ15b v15bteac How many years ago did you first use a computer for your own work; grading, handouts, transparencies?
TEAQ15c v15cpers How many years ago did you first use a computer for other activities; personal email, work processing, web-surfing?
TEAQ15d v15dinst How many years ago did you first use a computer for instructional purposes in your classroom?
TEAQ16a v16a1com How many desktop computers do you have access to in your classroom?
TEAQ16b v16a2com How many desktop computers in the lab/media center do you have access to?
TEAQ16c v16a3com How many desktop computers in the library do you have access to?
TEAQ16d v16a4pri How many printers are in your classroom?
TEAQ16e v16a5lap How many laptop computers do you have permanently in your classroom?
TEAQ16f v16a6lap How many shared laptop computers do you have access to?
TEAQ16g v16a7alp How many AlphaSmarts are in your classroom?
TEAQ16h v16a8alp How many AlphaSmarts do you have access to that are shared by other teachers?
TEAQ16i v16a9pda How many PDAs do you have access to?
TEAQ16ai v16b1com How often do you use desktop computers in your classroom?
TEAQ16bi v16b2com How often do you use desktop computers in the lab/media center?
TEAQ16ci v16b3com How often do you use desktop computers in the library?
TEAQ16di v16b4pri How often do you use printers in your classroom?
TEAQ16ei v16b5lap How often do you use laptop computers that you have permanently in your classroom?
TEAQ16fi v16b6lap How often do you use the shared laptop computers that you have access to?
TEAQ16gi v16b7alp How often do you use the AlphaSmarts that are in your classroom?

Rep
ort 1
1 ·
May
200
4Technical Report 40
Teacher Questionnaire cont.
Questionnaire Location Variable Name Description
TEAQ16hi v16b8alp How often do you use the AlphaSmarts that you have access to that are shared by other teachers?
TEAQ16ii v16b9pda How often do you use the PDAs that you have access to?
TEAQ17a v17aphon Do you have a telephone with an outside line in your classroom?
TEAQ17b v17binte Do you have Internet access in your classroom?
TEAQ17c v17c4co Do you have 4 desktop computers in your classroom?
TEAQ17d v17d4la Do you have 4 wireless laptops in your classroom?
TEAQ17e v17e1fo Do you have one desktop computer for each student in a lab?
TEAQ17f v17f1la Do you have one wireless laptop for each student in your classroom?
TEAQ17g v17gdigi Do you have a digital camera in your classroom?
TEAQ17h v17hprin Do you have one classroom printer?
TEAQ17i v17impr Do you have multiple classroom printers?
TEAQ17j v17jtvv Do you have a TV monitor with a VCR?
TEAQ17k v17klcd Do you have an LCD projector/computer projection system in your classroom?
TEAQ17l v17lpalm Do you have a Palm Pilot for each student?
TEAQ17m v17mwrit Do you have a portable writing device (e.g., AlphaSmart) for each student?
TEAQ17n v17ncomp Do you have a desktop computer the teachers can access in their classroom available to you?
TEAQ17o v17olapt Do you have a laptop for teacher use available to you?
TEAQ17p v17ppalm Do you have a Palm Pilot for teacher use available to you?
TEAQ17q v17qover Do you have an overhead projector available to you?
TEAQ18a v18aphon How valuable to you would a telephone with an outside line be in your classroom?
TEAQ18b v18binte How valuable to you would Internet access in your classroom be?
TEAQ18c v18c4co How valuable to you would 4 desktop computers in your classroom be?
TEAQ18d v18d4la How valuable to you would 4 wireless laptops in your classroom be?
TEAQ18e v18e1co How valuable to you would one desktop computer for each student in a lab be?
TEAQ18f v18f1la How valuable to you would one wireless laptop for each student in your classroom be?
TEAQ18g v18gdigi How valuable to you would a digital camera in your classroom be?
TEAQ18h v18h1pr How valuable to you would one classroom printer be?
TEAQ18i v18impr How valuable to you would multiple classroom printers be?
TEAQ18j v18jtvv How valuable to you would a TV monitor with a VCR be?
TEAQ18k v18klcd How valuable to you would an LCD projector/computer projection system in your classroom be?
TEAQ18l v18lpalm How valuable to you would a Palm Pilot for each student be?
TEAQ18m v18mwrit How valuable to you would a portable writing device (e.g., AlphaSmart) for each student be?
TEAQ18n v18ncomp How valuable to you would a desktop computer the teachers can access in their classroom be?
TEAQ18o v18olapt How valuable to you would a laptop for your use be?
TEAQ18p v18pplam How valuable to you would a Palm Pilot for your use be?
TEAQ18q v18qover How valuable to you would an overhead projector be?
TEAQ19 v19tech Which would be more valuable; 4 desktop computers in your classroom, one desktop computer for each student in a lab, a mobile cart with one wireless laptop for each student available for sign-out?
TEAQ20 v20email Which of the following describes the e-mail system in your school?
TEAQ21a v21aaimp How important is using technology to improve classroom instruction in your school/districts technology vision?
TEAQ21b v21abimp How important is using technology to improve student performance in your school/districts technology vision?
TEAQ21c v21actea How important is student proficiency in teaming and collaboration in your school/districts technology vision?
TEAQ21d v21addat How important is student proficiency in data analysis in your school/districts technology vision?
TEAQ21e v21aetea How important is increasing teacher proficiency in the use of technology in your school/districts technology vision?
TEAQ21f v21affut How important is preparing students for future jobs in your school/districts technology vision?
TEAQ21g v21agtes How important is improving student test scores in your school/districts technology vision?
TEAQ21h v21ahlea How important is promoting active learning strategies in your school/districts technology vision?
TEAQ21i v21airef How important is supporting instructional reform in your school/districts technology vision?
TEAQ21j v21ajpar How important is satisfying parents’ and community interests in your school/districts technology vision?
TEAQ21k v21akski How important is improving student computer skills and abilities in your school/districts technology vision?
TEAQ21l v21alres How important is improving student proficiency in research in your school/districts technology vision?
TEAQ21m v21amtea How important is improving productivity and efficiency in your school/districts technology vision?

Rep
ort 1
1 ·
May
200
4Technical Report 41
Teacher Questionnaire cont.
Questionnaire Location Variable Name Description
TEAQ21n v21anlev How important is target level of technology (i.e., student/computer ratio) in your school/districts technology vision?
TEAQ21ai v21baimp How important is using technology to improve classroom instruction in shaping computer use in your classroom?
TEAQ21bi v21bbimp How important is using technology to improve student performance in shaping computer use in your own classroom?
TEAQ21ci v21bctea How important is student proficiency in teaming and collaboration in shaping computer use in your own classroom?
TEAQ21di v21bddat How important is student proficiency in data analysis in shaping computer use in your own classroom?
TEAQ21ei v21betea How important is increasing teacher proficiency in the use of technology in shaping computer use in your own classroom?
TEAQ21fi v21bffut How important is preparing students for future jobs in shaping computer use in your own classroom?
TEAQ21gi v21bgtes How important is improving student test scores in shaping computer use in your own classroom?
TEAQ21hi v21bhlea How important is promoting active learning strategies in shaping computer use in your own classroom?
TEAQ21ii v21biref How important is supporting instructional reform in shaping computer use in your own classroom?
TEAQ21ji v21bjpar How important is satisfying parents’ and community interests in shaping computer use in your own classroom?
TEAQ21ki v21bkski How important is improving student computer skills and abilities in shaping computer use in your own classroom?
TEAQ21li v21blres How important is improving student proficiency in research in shaping computer use in your own classroom?
TEAQ21mi v21bmtea How important is improving productivity and efficiency in shaping computer use in your own classroom?
TEAQ21ni v21bnlev How important is target level of technology (i.e., student/computer ratio) in shaping computer use in your own classroom?
TEAQ22 v22scld How aware are you of your school/districts vision for the use of technology in your classes?
TEAQ23a v23afit Where is your school today in terms of teacher flexibility versus district control?
TEAQ23b v23b5ye Where was your school 5 years ago in terms of teacher flexibility versus district control?
TEAQ24 v24skill Where does the greatest focus of your district’s technology standards lie?
TEAQ25a v25abyo Are technology related workshops and seminars; run by an outside source available to educators at your school?
TEAQ25b v25bbyd Are technology related workshops and seminars; run by district personnel available to educators at your school?
TEAQ25c v25cinw Are technology related University or college coursework supported by the district in whole or in part available to educators at your school?
TEAQ25d v25dment Are technology related mentor/colleagues available to educators at your school?
TEAQ25e v25econf Is attendance at technology related conferences available to educators at your school?
TEAQ25f v25fdist Are technology related district or school sponsored courses (over several weeks) available to educators at your school?
TEAQ25g v25gonli Are technology related online or web based professional development available to educators at your school?
TEAQ25h v25htrai Are technology related one-on-one or group training with technology staff available to educators at your school?
TEAQ25i v25idept Is release time available for department or grade level planning related to technology?
TEAQ25j v25jindi Is release time available for individual professional development related to technology?
TEAQ26a v26abyo Did you participate in a technology related workshop or seminars; run by an outside source?
TEAQ26b v26bbyd Did you participate in a technology related workshop or seminars; run by district personnel?
TEAQ26c v26cinw Did you participate in a technology related University or college coursework supported by the district in whole or in part?
TEAQ26d v26dment Did you have a technology related mentor/colleague available?
TEAQ26e v26econf Did you attend a technology related conferences?
TEAQ26f v26fdist Did you participate in a technology related district or school sponsored courses (over several weeks)?
TEAQ26g v26gonli Did you participate in technology related online or web based professional development?
TEAQ26h v26htrai Did you participate in a technology related one-on-one or group training with technology staff?
TEAQ26ii v26idept Did you receive technology related release time for department or grade level planning related to technology?
TEAQ26j v26jindi Did you receive technology related release time available for individual professional development?
TEAQ27a v27asupe How much emphasis does your superintendent or assistant superintendent place on technology?
TEAQ27b v27bprin How much emphasis does your principal place on technology?
TEAQ27c v27cdept How much emphasis does your department head place on technology?
TEAQ27d v27dyour How much emphasis do you place on technology?
TEAQ28 v28prof. What best describes your school’s focus on professional development related to technology?
TEAQ29a v29amana Beneficial professional development: managing my computer desktop (opening programs, printing etc.)?
TEAQ29b v29butil Beneficial professional development: learning to utilize network services efficiently (e-mail, saving to the server)?
TEAQ29c v29csour Beneficial professional development: learning about research sources on the Internet?
TEAQ29d v29ddata Beneficial professional development: learning how to manipulate data and constructing graphs?
TEAQ29e v29etech Beneficial professional development: integrating technology with student writing?
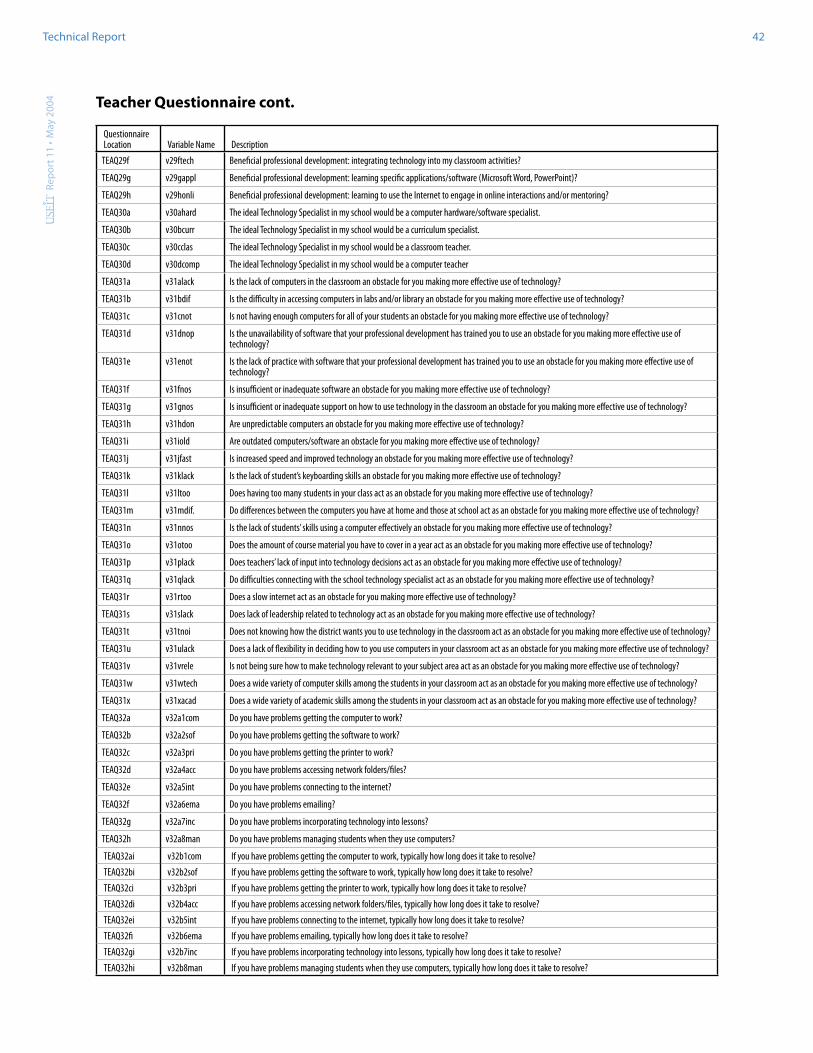
Rep
ort 1
1 ·
May
200
4Technical Report 42
Teacher Questionnaire cont.
Questionnaire Location Variable Name Description
TEAQ29f v29ftech Beneficial professional development: integrating technology into my classroom activities?
TEAQ29g v29gappl Beneficial professional development: learning specific applications/software (Microsoft Word, PowerPoint)?
TEAQ29h v29honli Beneficial professional development: learning to use the Internet to engage in online interactions and/or mentoring?
TEAQ30a v30ahard The ideal Technology Specialist in my school would be a computer hardware/software specialist.
TEAQ30b v30bcurr The ideal Technology Specialist in my school would be a curriculum specialist.
TEAQ30c v30cclas The ideal Technology Specialist in my school would be a classroom teacher.
TEAQ30d v30dcomp The ideal Technology Specialist in my school would be a computer teacher
TEAQ31a v31alack Is the lack of computers in the classroom an obstacle for you making more effective use of technology?
TEAQ31b v31bdif Is the difficulty in accessing computers in labs and/or library an obstacle for you making more effective use of technology?
TEAQ31c v31cnot Is not having enough computers for all of your students an obstacle for you making more effective use of technology?
TEAQ31d v31dnop Is the unavailability of software that your professional development has trained you to use an obstacle for you making more effective use of technology?
TEAQ31e v31enot Is the lack of practice with software that your professional development has trained you to use an obstacle for you making more effective use of technology?
TEAQ31f v31fnos Is insufficient or inadequate software an obstacle for you making more effective use of technology?
TEAQ31g v31gnos Is insufficient or inadequate support on how to use technology in the classroom an obstacle for you making more effective use of technology?
TEAQ31h v31hdon Are unpredictable computers an obstacle for you making more effective use of technology?
TEAQ31i v31iold Are outdated computers/software an obstacle for you making more effective use of technology?
TEAQ31j v31jfast Is increased speed and improved technology an obstacle for you making more effective use of technology?
TEAQ31k v31klack Is the lack of student’s keyboarding skills an obstacle for you making more effective use of technology?
TEAQ31l v31ltoo Does having too many students in your class act as an obstacle for you making more effective use of technology?
TEAQ31m v31mdif. Do differences between the computers you have at home and those at school act as an obstacle for you making more effective use of technology?
TEAQ31n v31nnos Is the lack of students’ skills using a computer effectively an obstacle for you making more effective use of technology?
TEAQ31o v31otoo Does the amount of course material you have to cover in a year act as an obstacle for you making more effective use of technology?
TEAQ31p v31plack Does teachers’ lack of input into technology decisions act as an obstacle for you making more effective use of technology?
TEAQ31q v31qlack Do difficulties connecting with the school technology specialist act as an obstacle for you making more effective use of technology?
TEAQ31r v31rtoo Does a slow internet act as an obstacle for you making more effective use of technology?
TEAQ31s v31slack Does lack of leadership related to technology act as an obstacle for you making more effective use of technology?
TEAQ31t v31tnoi Does not knowing how the district wants you to use technology in the classroom act as an obstacle for you making more effective use of technology?
TEAQ31u v31ulack Does a lack of flexibility in deciding how to you use computers in your classroom act as an obstacle for you making more effective use of technology?
TEAQ31v v31vrele Is not being sure how to make technology relevant to your subject area act as an obstacle for you making more effective use of technology?
TEAQ31w v31wtech Does a wide variety of computer skills among the students in your classroom act as an obstacle for you making more effective use of technology?
TEAQ31x v31xacad Does a wide variety of academic skills among the students in your classroom act as an obstacle for you making more effective use of technology?
TEAQ32a v32a1com Do you have problems getting the computer to work?
TEAQ32b v32a2sof Do you have problems getting the software to work?
TEAQ32c v32a3pri Do you have problems getting the printer to work?
TEAQ32d v32a4acc Do you have problems accessing network folders/files?
TEAQ32e v32a5int Do you have problems connecting to the internet?
TEAQ32f v32a6ema Do you have problems emailing?
TEAQ32g v32a7inc Do you have problems incorporating technology into lessons?
TEAQ32h v32a8man Do you have problems managing students when they use computers?
TEAQ32ai v32b1com If you have problems getting the computer to work, typically how long does it take to resolve?
TEAQ32bi v32b2sof If you have problems getting the software to work, typically how long does it take to resolve?
TEAQ32ci v32b3pri If you have problems getting the printer to work, typically how long does it take to resolve?
TEAQ32di v32b4acc If you have problems accessing network folders/files, typically how long does it take to resolve?
TEAQ32ei v32b5int If you have problems connecting to the internet, typically how long does it take to resolve?
TEAQ32fi v32b6ema If you have problems emailing, typically how long does it take to resolve?
TEAQ32gi v32b7inc If you have problems incorporating technology into lessons, typically how long does it take to resolve?
TEAQ32hi v32b8man If you have problems managing students when they use computers, typically how long does it take to resolve?
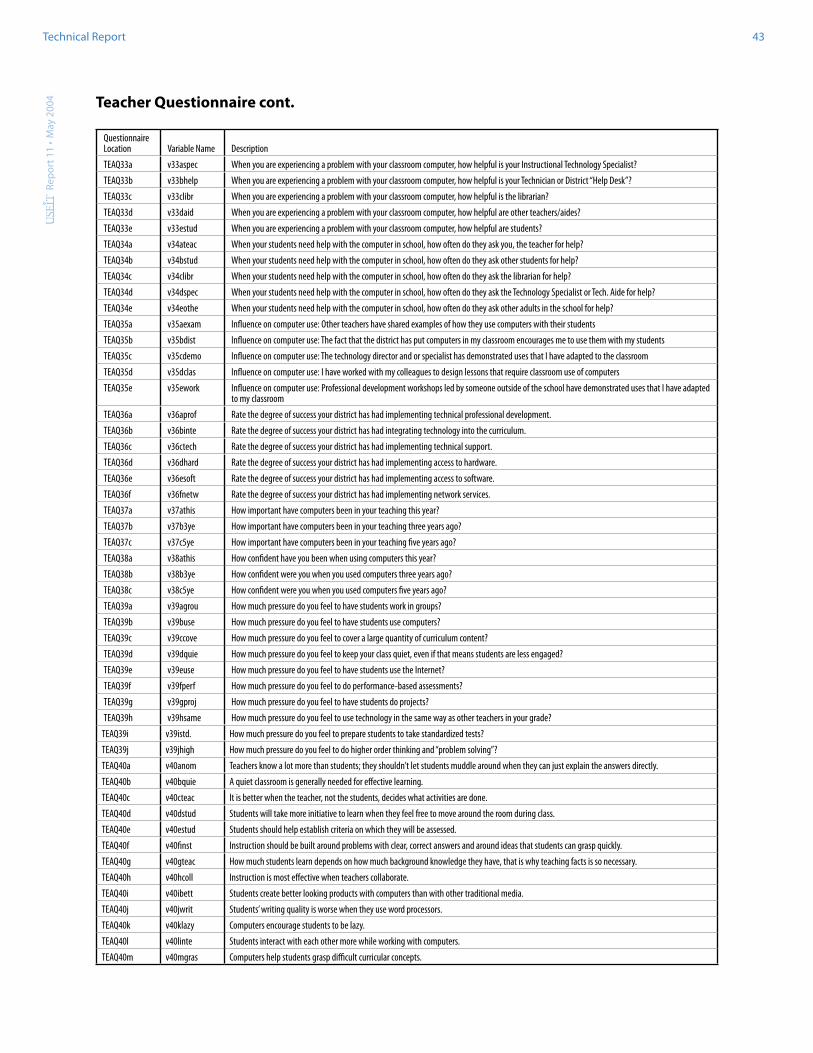
Rep
ort 1
1 ·
May
200
4Technical Report 43
Teacher Questionnaire cont.
Questionnaire Location Variable Name Description
TEAQ33a v33aspec When you are experiencing a problem with your classroom computer, how helpful is your Instructional Technology Specialist?
TEAQ33b v33bhelp When you are experiencing a problem with your classroom computer, how helpful is your Technician or District “Help Desk”?
TEAQ33c v33clibr When you are experiencing a problem with your classroom computer, how helpful is the librarian?
TEAQ33d v33daid When you are experiencing a problem with your classroom computer, how helpful are other teachers/aides?
TEAQ33e v33estud When you are experiencing a problem with your classroom computer, how helpful are students?
TEAQ34a v34ateac When your students need help with the computer in school, how often do they ask you, the teacher for help?
TEAQ34b v34bstud When your students need help with the computer in school, how often do they ask other students for help?
TEAQ34c v34clibr When your students need help with the computer in school, how often do they ask the librarian for help?
TEAQ34d v34dspec When your students need help with the computer in school, how often do they ask the Technology Specialist or Tech. Aide for help?
TEAQ34e v34eothe When your students need help with the computer in school, how often do they ask other adults in the school for help?
TEAQ35a v35aexam Influence on computer use: Other teachers have shared examples of how they use computers with their students
TEAQ35b v35bdist Influence on computer use: The fact that the district has put computers in my classroom encourages me to use them with my students
TEAQ35c v35cdemo Influence on computer use: The technology director and or specialist has demonstrated uses that I have adapted to the classroom
TEAQ35d v35dclas Influence on computer use: I have worked with my colleagues to design lessons that require classroom use of computers
TEAQ35e v35ework Influence on computer use: Professional development workshops led by someone outside of the school have demonstrated uses that I have adapted to my classroom
TEAQ36a v36aprof Rate the degree of success your district has had implementing technical professional development.
TEAQ36b v36binte Rate the degree of success your district has had integrating technology into the curriculum.
TEAQ36c v36ctech Rate the degree of success your district has had implementing technical support.
TEAQ36d v36dhard Rate the degree of success your district has had implementing access to hardware.
TEAQ36e v36esoft Rate the degree of success your district has had implementing access to software.
TEAQ36f v36fnetw Rate the degree of success your district has had implementing network services.
TEAQ37a v37athis How important have computers been in your teaching this year?
TEAQ37b v37b3ye How important have computers been in your teaching three years ago?
TEAQ37c v37c5ye How important have computers been in your teaching five years ago?
TEAQ38a v38athis How confident have you been when using computers this year?
TEAQ38b v38b3ye How confident were you when you used computers three years ago?
TEAQ38c v38c5ye How confident were you when you used computers five years ago?
TEAQ39a v39agrou How much pressure do you feel to have students work in groups?
TEAQ39b v39buse How much pressure do you feel to have students use computers?
TEAQ39c v39ccove How much pressure do you feel to cover a large quantity of curriculum content?
TEAQ39d v39dquie How much pressure do you feel to keep your class quiet, even if that means students are less engaged?
TEAQ39e v39euse How much pressure do you feel to have students use the Internet?
TEAQ39f v39fperf How much pressure do you feel to do performance-based assessments?
TEAQ39g v39gproj How much pressure do you feel to have students do projects?
TEAQ39h v39hsame How much pressure do you feel to use technology in the same way as other teachers in your grade?
TEAQ39i v39istd. How much pressure do you feel to prepare students to take standardized tests?
TEAQ39j v39jhigh How much pressure do you feel to do higher order thinking and “problem solving”?
TEAQ40a v40anom Teachers know a lot more than students; they shouldn’t let students muddle around when they can just explain the answers directly.
TEAQ40b v40bquie A quiet classroom is generally needed for effective learning.
TEAQ40c v40cteac It is better when the teacher, not the students, decides what activities are done.
TEAQ40d v40dstud Students will take more initiative to learn when they feel free to move around the room during class.
TEAQ40e v40estud Students should help establish criteria on which they will be assessed.
TEAQ40f v40finst Instruction should be built around problems with clear, correct answers and around ideas that students can grasp quickly.
TEAQ40g v40gteac How much students learn depends on how much background knowledge they have, that is why teaching facts is so necessary.
TEAQ40h v40hcoll Instruction is most effective when teachers collaborate.
TEAQ40i v40ibett Students create better looking products with computers than with other traditional media.
TEAQ40j v40jwrit Students’ writing quality is worse when they use word processors.
TEAQ40k v40klazy Computers encourage students to be lazy.
TEAQ40l v40linte Students interact with each other more while working with computers.
TEAQ40m v40mgras Computers help students grasp difficult curricular concepts.

Rep
ort 1
1 ·
May
200
4Technical Report 44
Teacher Questionnaire cont.
Questionnaire Location Variable Name Description
TEAQ40n v40nweak Computers have weakened students’ research skills.
TEAQ40o v40oavoi Many students use computers to avoid doing more important schoolwork.
TEAQ40p v40phard Students work harder at their assignments when they use computers.
TEAQ40q v40qmore Students are more willing to do second drafts when using computer.
TEAQ40r v40rkeep Technology support in my school exists primarily to keep the computers running.
TEAQ40s v40sinte Technology support exists primarily to help teachers integrate computers with teaching.
TEAQ41a v41howm In the class in which you use technology the most how many students are in that class?
TEAQ41b v41bleas In the class in which you use technology the least how many students are in that class?
TEAQ42a v42avg In the class in which you use technology the most, what is the average ability level of the students?
TEAQ42b v42bleas In the class in which you use technology the least, what is the average ability level of the students?
TEAQ43ai v43a1gif In the class in which you use technology the most, what percentage of the students participated in a gifted and talented program?
TEAQ43aii v43a2esl In the class in which you use technology the most, what percentage of the students participated in an ESL program?
TEAQ43aiii v43a3spe In the class in which you use technology the most, what percentage of the students participated in a special education program?
TEAQ43aiv v43a4hom In the class in which you use technology the most, what percentage of the students have a computer at home?
TEAQ43av v43a5hom In the class in which you use technology the most, what percentage of the students have a computer at home with Internet access?
TEAQ43bi v43b1lea In the class in which you use technology the least, what percentage of the students participated in a gifted and talented program?
TEAQ43bii v43b2lea In the class in which you use technology the least, what percentage of the students participated in an ESL program?
TEAQ43biii v43b3lea In the class in which you use technology the least, what percentage of the students participated in a special education program?
TEAQ43biv v43b4lea In the class in which you use technology the least, what percentage of the students have a computer at home?
TEAQ43bv v43b5lea In the class in which you use technology the least, what percentage of the students have a computer at home with Internet access?
TEAQ44a v44adisc Discussion of school goals and how to achieve them is a regular part of our faculty meetings.
TEAQ44b v44bvalu My principal’s values and philosophy of education are similar to my own.
TEAQ44c v44crese Research and best practices are shared and discussed in my school/district.
TEAQ44d v44dnew New ideas presented at in-services are discussed afterwards by teachers in this school.
TEAQ44e v44eshar Most teachers here share my beliefs about what the central goals of the schools should be.
TEAQ44f v44fcont Teachers in the school are continually learning and seeking new ideas.
TEAQ44g v44gshar It is common for us to share samples of students’ work.
TEAQ44h v44hpres If the teacher is not doing a good job, they are pressed by school leaders or colleagues to improve.
TEAQ44i v44istaf Staff development activities are followed by support to help teachers implement new practices.
TEAQ44j v44jhind There are hindrances to implementing new ideas at my school.
TEAQ44k v44kwith I have a good working relationship with my principal.
TEAQ44l v44lwith I have a good working relationship with the school technology specialist.
TEAQ44m v44minpu Teachers have a lot of input regarding innovations, projects, and changing practices.
TEAQ44n v44ntech In my district, technology is an integral part of the overall education program.
TEAQ44o v44oexpe My school encourages experimentation.
TEAQ44p v44pment Formal teacher mentoring actively occurs in my school.
TEAQ45 v45envir How would you best describe the learning environment in your school?
TEAQ46a v46a *
TEAQ46b v46b *
TEAQ46c v46c *
TEAQ46d v46d *
TEAQ46e v46e *

Rep
ort 1
1 ·
May
200
4Technical Report 45
Student Questionnaire Guide
Student Questionnaire: Grades 3 through 8
Questionnaire Location Variable Name Description
STUDQ1 q1name First four letters of teacher’s last name
STUDQ2 q2gender Gender
STUDQ3 q3ethnic Race
STUDQ4 q4books Number of books of your own at home
STUDQ5 q5wherel Where do you learn new things with computers
STUDQ6 q6grade Grade
STUDQ7a q7teache When you need help with a computer at school, how often do you ask a teacher for help?
STUDQ7b q7friend When you need help with a computer at school, how often do you ask a friend or another student for help?
STUDQ7c q7librar When you need help with a computer at school, how often do you ask a Librarian for help?
STUDQ7d q7techsp When you need help with a computer at school, how often do you ask a Technology Specialist or Technology Aide for help?
STUDQ7e q7adult When you need help with a computer at school, how often do you ask other adults in the school for help?
STUDQ8 q8whereu Where do you use technology the most in school?
STUDQ9 q9hard How hard is it to complete homework done using a computer?
STUDQ10a q10email How often use a computer to send and receive email?
STUDQ10b q10draft How often use a computer to write first drafts?
STUDQ10c q10edit How often use a computer to edit your papers?
STUDQ10d q10serve How often use a computer to open files server/network?
STUDQ10e q10inter How often use a computer to find info on the net?
STUDQ10f q10ppt How often use a computer to create a Hyperstudio or PowerPoint presentation?
STUDQ10g q10games How often use a computer to play computer games?
STUDQ10h q10dbt How often use a computer to work with spreadsheet or database?
STUDQ11a q11email How well able to use a computer to send and receive email?
STUDQ11b q11draft How well able to use a computer to write first drafts?
STUDQ11c q11edit How well able to use a computer to edit your papers?
STUDQ11d q11serve How well able to use a computer to open files on a server/network?
STUDQ11e q11inter How well able to use a computer to find info on the net?
STUDQ11f q11ppt How well able to use a computer to create a Hyperstudio or PowerPoint presentation?
STUDQ11g q11game How well able to use a computer to play computer games?
STUDQ11h q11dbt How well able to use a computer to work with spreadsheet or database?
STUDQ12 q12teach How often does your teacher use a computer when teaching?
STUDQ13 q13class How often use a computer in class?
STUDQ14 q14find Finding a computer at school to use?
STUDQ15 q15perso Statement about personal use of computer?
STUDQ16a q16schoo How much time do you spend using a computer at school?
STUDQ16b q16home How much time do you spend using a computer at home?
STUDQ17a q17finis When you are using a computer do you create a better product?
STUDQ17b q17write When you are using a computer do you write better?
STUDQ17c q17lazy When you are using a computer do you take short cuts and get lazy?
STUDQ17d q17more When you are using a computer, do you spend more time with others?
STUDQ17e q17bette When you are using a computer, do you better understand?
STUDQ17f q17harde When you are using a computer, do you work harder?
STUDQ17g q17copy When you are using a computer, do you find it easy to just copy?
STUDQ17h q17confu When you are using a computer, do you get more confused?
STUDQ17I q17frust When you are using a computer, do you get frustrated more easily?
STUDQ18 q18comp How many computers do you have at home?
STUDQ19 q19conne What type of internet connection do you have at home?
STUDQ20 q20shar How many people share your home computer?
STUDQ21 q21usem Who uses your home computer the most?
STUDQ22 q22diifi At home, how difficult to get on your computer?
STUDQ23 q23howlo How long have you had a computer at home?

Rep
ort 1
1 ·
May
200
4Technical Report 46
Student Questionnaire: Grades 3 through 8 cont.
Questionnaire Location Variable Name Description
STUDQ24a q24game How often use your home PC to play games ?
STUDQ24b q24chat How often use your home PC to chat or instant message?
STUDQ24c q24email How often use your home PC to email?
STUDQ24d q24schoo How often use your home PC to search the net for school?
STUDQ24e q24fun How often use your home PC to search the net for fun?
STUDQ24f q24music How often use your home PC to mp3 or music?
STUDQ24g q24write How often use your home PC to write papers?
STUDQ24h q24prog How often use your home PC for programming?
STUDQ24I q24web How often use your home PC to create web sites?
STUDQ24j q24photo How often use your home PC for digital photos or movies?
Student Questionnaire Guide: Grades 6 through 9
Questionnaire Location Variable Name Description
STUDQ1a v1ascie Four letters of science teacher’s last name
STUDQ1b v1bmath Four letters of math teacher’s last name
STUDQ1c v1cso Four letters of social studies teacher’s last name
STUDQ1d v1deng Four letters of English teacher’s last name
STUDQ2 v2boyg Gender
STUDQ3 v3ethni Race
STUDQ4 v4book Number of books of your own at home
STUDQ5 v5where Where do you learn new things with computers?
STUDQ6 v6grade Grade
STUDQ7 v7uset Where do you use technology most in school?
STUDQ8a v8ateac When you need help with a computer at school, how often do you ask a teacher for help?
STUDQ8b v8bfrie When you need help with a computer at school, how often do you ask a friend or another student for help?
STUDQ8c v8clibr When you need help with a computer at school, how often do you ask a Librarian for help?
STUDQ8d v8dtech When you need help with a computer at school, how often do you ask a Technology Specialist or Technology Aide for help?
STUDQ8e v8eothe When you need help with a computer at school, how often do you ask other adults in the school for help?
STUDQ9 v9sci How often does science teacher use computers to teach?
STUDQ10 v10sci How often do you use computers in science class?
STUDQ11 v11math How often does math teacher use computers to teach?
STUDQ12 v12math How often do you use computers in math class?
STUDQ13 v13eng How often does English teacher use computers to teach?
STUDQ14 v14eng How often do you use computers in English class?
STUDQ15 v15soci How often does social studies teacher use computers to teach?
STUDQ16 v16soci How often do you use computers in social studies class?
STUDQ17a v17aema How often do you use a computer to send and receive email?
STUDQ17b v17bdra How often do you use a computer to write first drafts?
STUDQ17c v17cedi How often do you use a computer to edit your papers?
STUDQ17d v17dser How often do you use a computer to open files server-network?
STUDQ17e v17efin How often do you use a computer to find info on the net?
STUDQ17f v17fppt How often do you use a computer to create a Hyperstudio or PowerPoint presentation?
STUDQ17g v17ggam How often do you use a computer to play computer games?
STUDQ17h v17hspre How often do you use a computer to work with spreadsheets or databases?
STUDQ18a v18aema How well able to use a computer to send and receive email?
STUDQ18b v18bdra How well able to use a computer to write first drafts?
STUDQ18c v18cedi How well able to use a computer to edit your papers?
STUDQ18d v18dnet How well able to use a computer to open files on a server-network?
STUDQ18e v18efin How well able to use a computer to find info on the net?

Rep
ort 1
1 ·
May
200
4Technical Report 47
Student Questionnaire Guide: Grades 6 through 9 cont.
Questionnaire Location Variable Name Description
STUDQ18f v18fppt How well able to use a computer to create a Hyperstudio or PowerPoint presentation?
STUDQ18g v18ggam How well able to use a computer to play computer games?
STUDQ18h v18hspr How well able to use a computer to work with spreadsheet or database?
STUDQ19 v19pers Statement about personal use of computer.
STUDQ20 v20ins Finding a computer at school to use.
STUDQ21 v21hard How hard is it to complete homework done using a computer?
STUDQ22a v22afin When you are using a computer do you create a better product?
STUDQ22b v22bwri When you are using a computer do you write better?
STUDQ22c v22csho When you are using a computer do you get lazy?
STUDQ22d v22dmor When you are using a computer, do you spend more time with others?
STUDQ22e v22eund When you are using a computer, do you better understand?
STUDQ22f v22fwor When you are using a computer, do you work harder?
STUDQ22g v22gcop When you are using a computer, do you find it easy to just copy?
STUDQ22h v22hcon When you are using a computer, do you get more confused?
STUDQ22i v22ifru When you are using a computer, do you get frustrated more easily?
STUDQ23a v23asch How much time do you spend using a computer at school?
STUDQ23b v23bhom How much time do you spend using a computer at home?
STUDQ24 v24num How many computers do you have at home?
STUDQ25 v25how How long have you had a computer at home?
STUDQ26 v26inte What type of internet connection do you have at home?
STUDQ27 v27sha How many people share your home computer?
STUDQ28 v28use Who uses your home computer the most?
STUDQ29 v29diff At home, how difficult is it to get on your computer?
STUDQ30a v30agam How often use your home PC to play games?
STUDQ30b v30bcha How often use your home PC to chat or instant message?
STUDQ30c v30cema How often use your home PC to email?
STUDQ30d v30dsea How often use your home PC to search the net for school?
STUDQ30e v30efun How often use your home PC to search the net for fun?
STUDQ30f v30fmus How often use your home PC to mp3 or music?
STUDQ30g v30gwri How often use your home PC to write papers?
STUDQ30h v30hpro How often use your home PC for programming?
STUDQ30I v30iweb How often use your home PC to create web sites?
STUDQ30j v30jpho How often use your home PC for digital photos or movies?

Rep
ort 1
1 ·
May
200
4Technical Report 48
Lower and Upper Grade Student File Combined
Variable Name in Grade 5
Variable Name in Grade 8
Combined File Variable Name
Description
Q1 v1 First four letters of teacher’s last name
v1ascie v2 Four letters of science teacher’s last name
v1bmath v3 Four letters of math teacher’s last name
v1cso v4 Four letters of social studies teacher’s last name
v1deng v5 Four letters of English teacher’s last name
Q2 v2boyg v6 Gender
Q3 v3ethni v7 Race
Q4 v4book v8 Number of books of your own at home
q5wherel v5where v9 Where do you learn new things with computers?
q6grade v6grade v10 Grade
grade grade v10a Grade
q7teache v8ateach v11 Ask a teacher for help?
q7friend v8bfrie v12 Ask a friend or another student for help?
q7librar v8clibr v13 Ask a Librarian for help?
q7techsp v8dtech v14 Ask a Technology Specialist or Technology Aide for help?
q7adult v8eothe v15 Ask other adults in the school for help?
q8whereu v7uset v16 Where do you use tech most in school?
v9sci v17 How often does science teacher use computers to teach?
v10sci v18 How often do you use computers in science class?
v11math v19 How often does math teacher use computers to teach?
v12math v20 How often do you use computers in math class?
v13eng v21 How often does English teacher use computers to teach?
v14eng v22 How often do you use computers in English class?
v15soc v23 How often does social studies teacher use computers to teach?
v16soc v24 How often do you use computers in social studies class?
q9hard v21hard v25 How hard is it to complete homework done using a computer?
q10email v17aema v26 How often do you use a computer to send and receive email?
q10draft v17bdra v27 How often do you use a computer to write first drafts?
q10edit v17cedi v28 How often do you use a computer to edit your papers?
q10serve v17dser v29 How often do you use a computer to open files server-network?
q10inter v17efin v30 How often do you use a computer to find info on the net?
q10ppt v17fppt v31 How often do you use a computer to create a Hyperstudio or PowerPoint presentation?
q10games v17ggam v32 How often do you use a computer to play computer games?
q10dbt v17hspre v33 How often do you use a computer to work with spreadsheets or database?
q11email v18aema v34 How well able to use a computer to send and receive email?
q11draft v18bdra v35 How well able to use a computer to write first drafts?
q11edit v18cedi v36 How well able to use a computer to edit your papers?
q11serve v18dser v37 How well able to use a computer to open files on a server-network?
q11inter v18efin v38 How well able to use a computer to find info on the net?
q11ppt v18fppt v39 How well able to use a computer to create a Hyperstudio or PowerPoint presentation?
q11game v18ggam v40 How well able to use a computer to play computer games?
q11dbt v18hspre v41 How well able to use a computer to work with spreadsheet or database?
q12teach v42 How often does your teacher use a computer when teaching?
q13class v43 How often do you use a computer in class?
q14find v20ins v44 Finding a computer at school to use
q15perso v19pers v45 Statement about personal use of computer
q16schoo v23asch v46 How much time do you spend using a computer at school?
q16home v23bhom v47 How much time do you spend using a computer at home?
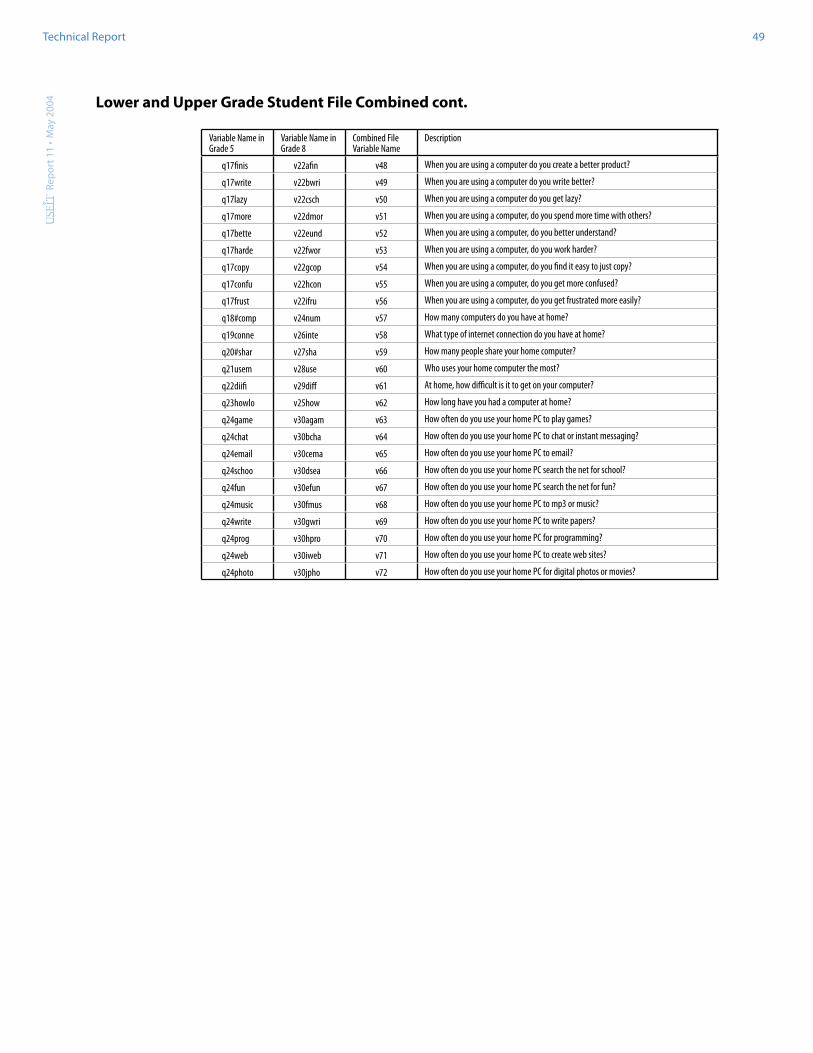
Rep
ort 1
1 ·
May
200
4Technical Report 49
Lower and Upper Grade Student File Combined cont.
Variable Name in Grade 5
Variable Name in Grade 8
Combined File Variable Name
Description
q17finis v22afin v48 When you are using a computer do you create a better product?
q17write v22bwri v49 When you are using a computer do you write better?
q17lazy v22csch v50 When you are using a computer do you get lazy?
q17more v22dmor v51 When you are using a computer, do you spend more time with others?
q17bette v22eund v52 When you are using a computer, do you better understand?
q17harde v22fwor v53 When you are using a computer, do you work harder?
q17copy v22gcop v54 When you are using a computer, do you find it easy to just copy?
q17confu v22hcon v55 When you are using a computer, do you get more confused?
q17frust v22ifru v56 When you are using a computer, do you get frustrated more easily?
q18#comp v24num v57 How many computers do you have at home?
q19conne v26inte v58 What type of internet connection do you have at home?
q20#shar v27sha v59 How many people share your home computer?
q21usem v28use v60 Who uses your home computer the most?
q22diifi v29diff v61 At home, how difficult is it to get on your computer?
q23howlo v25how v62 How long have you had a computer at home?
q24game v30agam v63 How often do you use your home PC to play games?
q24chat v30bcha v64 How often do you use your home PC to chat or instant messaging?
q24email v30cema v65 How often do you use your home PC to email?
q24schoo v30dsea v66 How often do you use your home PC search the net for school?
q24fun v30efun v67 How often do you use your home PC search the net for fun?
q24music v30fmus v68 How often do you use your home PC to mp3 or music?
q24write v30gwri v69 How often do you use your home PC to write papers?
q24prog v30hpro v70 How often do you use your home PC for programming?
q24web v30iweb v71 How often do you use your home PC to create web sites?
q24photo v30jpho v72 How often do you use your home PC for digital photos or movies?

Rep
ort 1
1 ·
May
200
4Technical Report 50
Principal Questionnaire Items
Questionnaire Location Variable Name Description
PRIQ1 p1years How many years have you been at your current school?
PRIQ2a p2thisd Have you taught in an elementary, middle, or high school setting in this school district?
PRIQ2b p2otherd Have you taught in an elementary, middle, or high school setting in another school district?
PRIQ2c p2last5 Have you taught in an elementary, middle, or high school setting within the last five years?
PRIQ2d p2nevert No, I have never taught in an elementary, middle, or high school setting?
PRIQ3 p3age Range for your age
PRIQ4 p4mcas How do your school’s results on the MCAS compare to those of other schools in your state?
PRIQ5a p5phone Whether or not your school has it, how valuable is a telephone with an outside line in each classroom?
PRIQ5b p5intern Whether or not your school has it, how valuable would Internet access in each classroom be?
PRIQ5c p5deskt4 Whether or not your school has it, how valuable would 4 desktop computers be in each classroom?
PRIQ5d p5wirele Whether or not your school has it, how valuable would 4 wireless laptops be in each classroom?
PRIQ5e p5deskt1 Whether or not your school has it, how valuable would one desktop computer for each student in a lab be?
PRIQ5f p5wirela Whether or not your school has it, how valuable would one wireless laptop for each student in the classroom be?
PRIQ5g p5digica Whether or not your school has it, how valuable would a digital camera for the classroom be?
PRIQ5h p5printe Whether or not your school has it, how valuable would one classroom printer be?
PRIQ5I p5mprint Whether or not your school has it, how valuable would multiple classroom printers be?
PRIQ5j p5tvvcr Whether or not your school has it, how valuable would a TV monitor with VCR be?
PRIQ5k p5lcd Whether or not your school has it, how valuable would an LCD projector/computer projection system be?
PRIQ5l p5palmpi Whether or not your school has it, how valuable would a Palm Pilot for each student be?
PRIQ5m p5portw Whether or not your school has it, how valuable would a portable writing device for each student be?
PRIQ5o p5deskac Whether or not your school has it, how valuable would a desktop computer teachers can access in their classroom be?
PRIQ5p p5lapt Whether or not your school has it, how valuable would a laptop for teacher use be?
PRIQ5q p5palmpa Whether or not your school has it, how valuable would a Palm Pilot for teacher use be?
PRIQ5r p5projec Whether or not your school has it, how valuable would an overhead projector be?
PRIQ6a p6thisye How important have computers been in your school related work this year?
PRIQ6b p6year3 How important have computers been in your school related work three years ago?
PRIQ6c p6year5 How important have computers been in your school related work five years ago?
PRIQ7 p7emphas Relative to all your goals for your school, how much emphasis do you place on the integration of classroom technology?
PRIQ8a p8compu For how many years have you had a computer in your office?
PRIQ8b p8intern For how many years have you had an Internet connection in your office?
PRIQ8c p8homeco For how many years have you had a computer at home?
PRIQ8d p8homein For how many years have you had an Internet connection at home?
PRIQ9a p9email How many years ago did you first use computers for communication with school staff via email?
PRIQ9b p9work How many years ago did you first use computers for your own work?
PRIQ9c p9person How many years ago did you first use computers for your own personal activities?
PRIQ9d p9presen How many years ago did you first use computers for presentations?
PRIQ10a p10eteac How often do you, as principal, regularly email teachers?
PRIQ10b p10estaf How often do you, as principal, regularly email Administrative Staff?
PRIQ10c p10estud How often do you, as principal, regularly email students?
PRIQ10d p10epare How often do you, as principal, regularly email parents?
PRIQ10e p10eothe How often do you, as principal, regularly email principals in other schools?
PRIQ11a p11today Where is your school today in terms of teacher flexibility versus district control?
PRIQ11b p11year5 Where was your school 5 years ago in terms of teacher flexibility versus district control?
PRIQ12 p12instr With my school, we are currently integrating technology into instructional activities as much as we need to.
PRIQ13 p13commu How strongly does your community advocate for the presence and use of technology in your schools?
PRIQ14 p14model How often do you model uses of technology?
PRIQ15 p15fexib How much flexibility do you and your school-level leaders have in determining which types and how much technology is purchased for your school?
PRIQ16a p16hardw Does your school have a budget for hardware?
PRIQ16b p16softw Does your school have a budget for software?
PRIQ16c p16suppl Does your school have a budget for computer supplies?
PRIQ16d p16profd Does your school have a budget for technology related professional development?
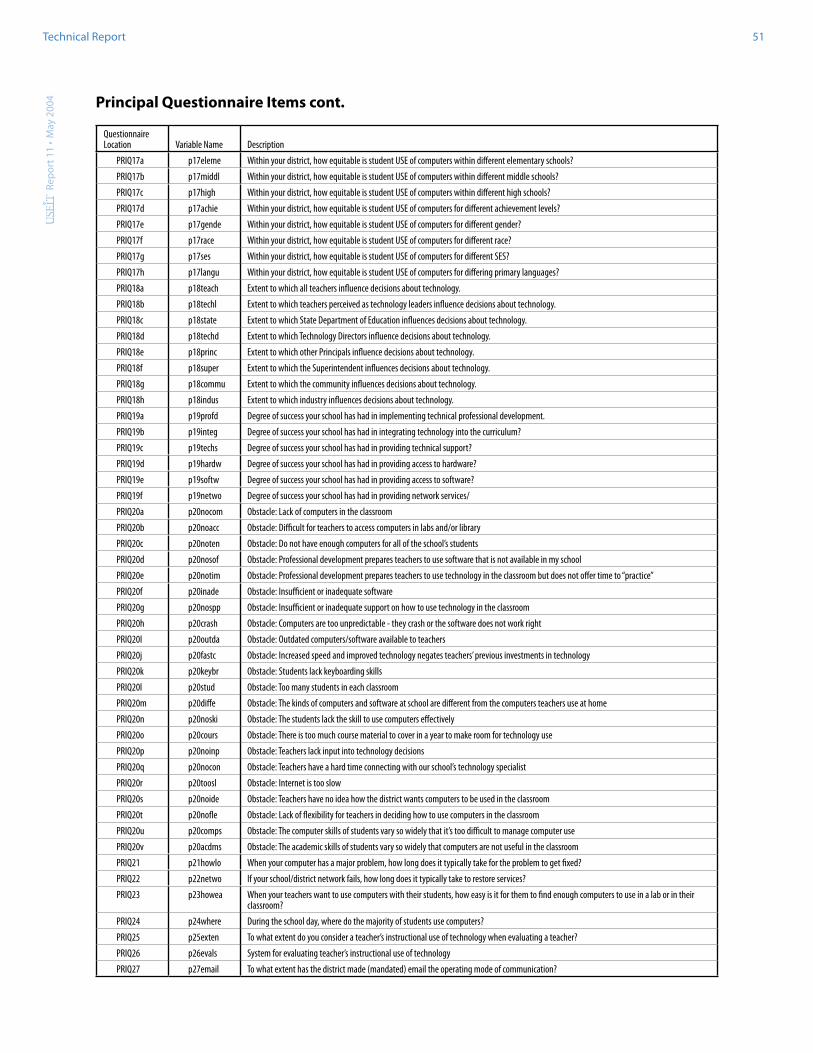
Rep
ort 1
1 ·
May
200
4Technical Report 51
Principal Questionnaire Items cont.
Questionnaire Location Variable Name Description
PRIQ17a p17eleme Within your district, how equitable is student USE of computers within different elementary schools?
PRIQ17b p17middl Within your district, how equitable is student USE of computers within different middle schools?
PRIQ17c p17high Within your district, how equitable is student USE of computers within different high schools?
PRIQ17d p17achie Within your district, how equitable is student USE of computers for different achievement levels?
PRIQ17e p17gende Within your district, how equitable is student USE of computers for different gender?
PRIQ17f p17race Within your district, how equitable is student USE of computers for different race?
PRIQ17g p17ses Within your district, how equitable is student USE of computers for different SES?
PRIQ17h p17langu Within your district, how equitable is student USE of computers for differing primary languages?
PRIQ18a p18teach Extent to which all teachers influence decisions about technology.
PRIQ18b p18techl Extent to which teachers perceived as technology leaders influence decisions about technology.
PRIQ18c p18state Extent to which State Department of Education influences decisions about technology.
PRIQ18d p18techd Extent to which Technology Directors influence decisions about technology.
PRIQ18e p18princ Extent to which other Principals influence decisions about technology.
PRIQ18f p18super Extent to which the Superintendent influences decisions about technology.
PRIQ18g p18commu Extent to which the community influences decisions about technology.
PRIQ18h p18indus Extent to which industry influences decisions about technology.
PRIQ19a p19profd Degree of success your school has had in implementing technical professional development.
PRIQ19b p19integ Degree of success your school has had in integrating technology into the curriculum?
PRIQ19c p19techs Degree of success your school has had in providing technical support?
PRIQ19d p19hardw Degree of success your school has had in providing access to hardware?
PRIQ19e p19softw Degree of success your school has had in providing access to software?
PRIQ19f p19netwo Degree of success your school has had in providing network services/
PRIQ20a p20nocom Obstacle: Lack of computers in the classroom
PRIQ20b p20noacc Obstacle: Difficult for teachers to access computers in labs and/or library
PRIQ20c p20noten Obstacle: Do not have enough computers for all of the school’s students
PRIQ20d p20nosof Obstacle: Professional development prepares teachers to use software that is not available in my school
PRIQ20e p20notim Obstacle: Professional development prepares teachers to use technology in the classroom but does not offer time to “practice”
PRIQ20f p20inade Obstacle: Insufficient or inadequate software
PRIQ20g p20nospp Obstacle: Insufficient or inadequate support on how to use technology in the classroom
PRIQ20h p20crash Obstacle: Computers are too unpredictable - they crash or the software does not work right
PRIQ20I p20outda Obstacle: Outdated computers/software available to teachers
PRIQ20j p20fastc Obstacle: Increased speed and improved technology negates teachers’ previous investments in technology
PRIQ20k p20keybr Obstacle: Students lack keyboarding skills
PRIQ20l p20stud Obstacle: Too many students in each classroom
PRIQ20m p20diffe Obstacle: The kinds of computers and software at school are different from the computers teachers use at home
PRIQ20n p20noski Obstacle: The students lack the skill to use computers effectively
PRIQ20o p20cours Obstacle: There is too much course material to cover in a year to make room for technology use
PRIQ20p p20noinp Obstacle: Teachers lack input into technology decisions
PRIQ20q p20nocon Obstacle: Teachers have a hard time connecting with our school’s technology specialist
PRIQ20r p20toosl Obstacle: Internet is too slow
PRIQ20s p20noide Obstacle: Teachers have no idea how the district wants computers to be used in the classroom
PRIQ20t p20nofle Obstacle: Lack of flexibility for teachers in deciding how to use computers in the classroom
PRIQ20u p20comps Obstacle: The computer skills of students vary so widely that it’s too difficult to manage computer use
PRIQ20v p20acdms Obstacle: The academic skills of students vary so widely that computers are not useful in the classroom
PRIQ21 p21howlo When your computer has a major problem, how long does it typically take for the problem to get fixed?
PRIQ22 p22netwo If your school/district network fails, how long does it typically take to restore services?
PRIQ23 p23howea When your teachers want to use computers with their students, how easy is it for them to find enough computers to use in a lab or in their classroom?
PRIQ24 p24where During the school day, where do the majority of students use computers?
PRIQ25 p25exten To what extent do you consider a teacher’s instructional use of technology when evaluating a teacher?
PRIQ26 p26evals System for evaluating teacher’s instructional use of technology
PRIQ27 p27email To what extent has the district made (mandated) email the operating mode of communication?
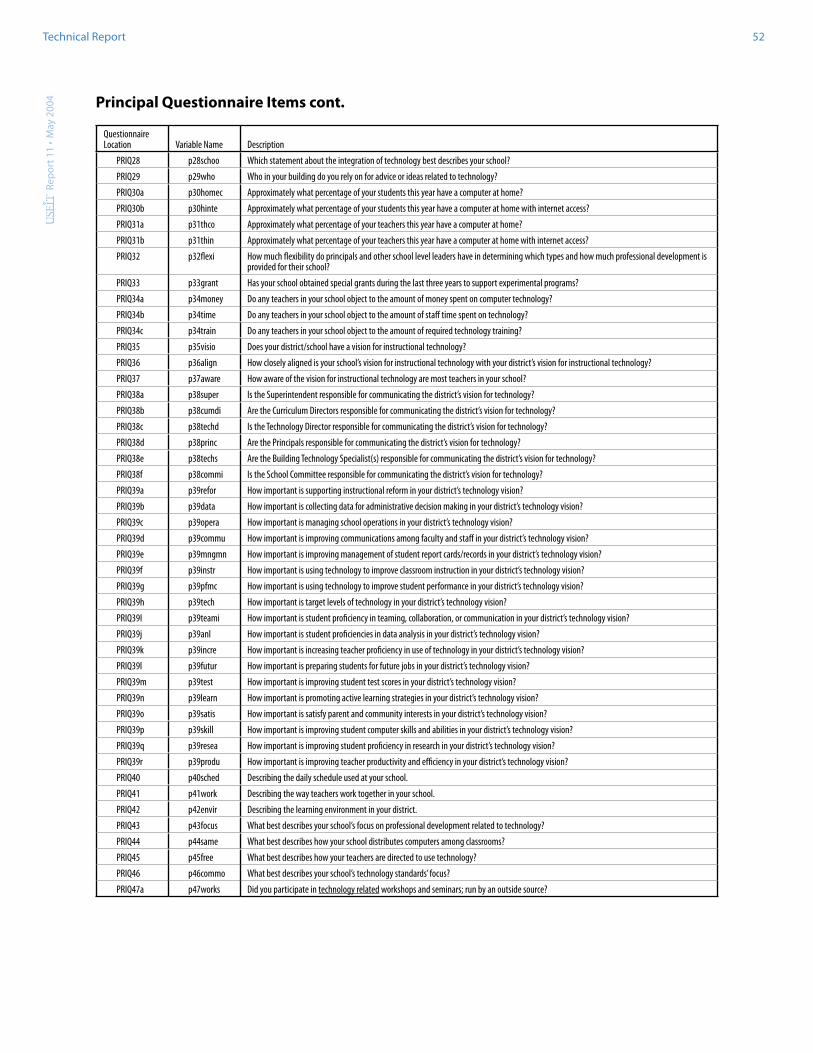
Rep
ort 1
1 ·
May
200
4Technical Report 52
Principal Questionnaire Items cont.
Questionnaire Location Variable Name Description
PRIQ28 p28schoo Which statement about the integration of technology best describes your school?
PRIQ29 p29who Who in your building do you rely on for advice or ideas related to technology?
PRIQ30a p30homec Approximately what percentage of your students this year have a computer at home?
PRIQ30b p30hinte Approximately what percentage of your students this year have a computer at home with internet access?
PRIQ31a p31thco Approximately what percentage of your teachers this year have a computer at home?
PRIQ31b p31thin Approximately what percentage of your teachers this year have a computer at home with internet access?
PRIQ32 p32flexi How much flexibility do principals and other school level leaders have in determining which types and how much professional development is provided for their school?
PRIQ33 p33grant Has your school obtained special grants during the last three years to support experimental programs?
PRIQ34a p34money Do any teachers in your school object to the amount of money spent on computer technology?
PRIQ34b p34time Do any teachers in your school object to the amount of staff time spent on technology?
PRIQ34c p34train Do any teachers in your school object to the amount of required technology training?
PRIQ35 p35visio Does your district/school have a vision for instructional technology?
PRIQ36 p36align How closely aligned is your school’s vision for instructional technology with your district’s vision for instructional technology?
PRIQ37 p37aware How aware of the vision for instructional technology are most teachers in your school?
PRIQ38a p38super Is the Superintendent responsible for communicating the district’s vision for technology?
PRIQ38b p38cumdi Are the Curriculum Directors responsible for communicating the district’s vision for technology?
PRIQ38c p38techd Is the Technology Director responsible for communicating the district’s vision for technology?
PRIQ38d p38princ Are the Principals responsible for communicating the district’s vision for technology?
PRIQ38e p38techs Are the Building Technology Specialist(s) responsible for communicating the district’s vision for technology?
PRIQ38f p38commi Is the School Committee responsible for communicating the district’s vision for technology?
PRIQ39a p39refor How important is supporting instructional reform in your district’s technology vision?
PRIQ39b p39data How important is collecting data for administrative decision making in your district’s technology vision?
PRIQ39c p39opera How important is managing school operations in your district’s technology vision?
PRIQ39d p39commu How important is improving communications among faculty and staff in your district’s technology vision?
PRIQ39e p39mngmn How important is improving management of student report cards/records in your district’s technology vision?
PRIQ39f p39instr How important is using technology to improve classroom instruction in your district’s technology vision?
PRIQ39g p39pfmc How important is using technology to improve student performance in your district’s technology vision?
PRIQ39h p39tech How important is target levels of technology in your district’s technology vision?
PRIQ39I p39teami How important is student proficiency in teaming, collaboration, or communication in your district’s technology vision?
PRIQ39j p39anl How important is student proficiencies in data analysis in your district’s technology vision?
PRIQ39k p39incre How important is increasing teacher proficiency in use of technology in your district’s technology vision?
PRIQ39l p39futur How important is preparing students for future jobs in your district’s technology vision?
PRIQ39m p39test How important is improving student test scores in your district’s technology vision?
PRIQ39n p39learn How important is promoting active learning strategies in your district’s technology vision?
PRIQ39o p39satis How important is satisfy parent and community interests in your district’s technology vision?
PRIQ39p p39skill How important is improving student computer skills and abilities in your district’s technology vision?
PRIQ39q p39resea How important is improving student proficiency in research in your district’s technology vision?
PRIQ39r p39produ How important is improving teacher productivity and efficiency in your district’s technology vision?
PRIQ40 p40sched Describing the daily schedule used at your school.
PRIQ41 p41work Describing the way teachers work together in your school.
PRIQ42 p42envir Describing the learning environment in your district.
PRIQ43 p43focus What best describes your school’s focus on professional development related to technology?
PRIQ44 p44same What best describes how your school distributes computers among classrooms?
PRIQ45 p45free What best describes how your teachers are directed to use technology?
PRIQ46 p46commo What best describes your school’s technology standards’ focus?
PRIQ47a p47works Did you participate in technology related workshops and seminars; run by an outside source?
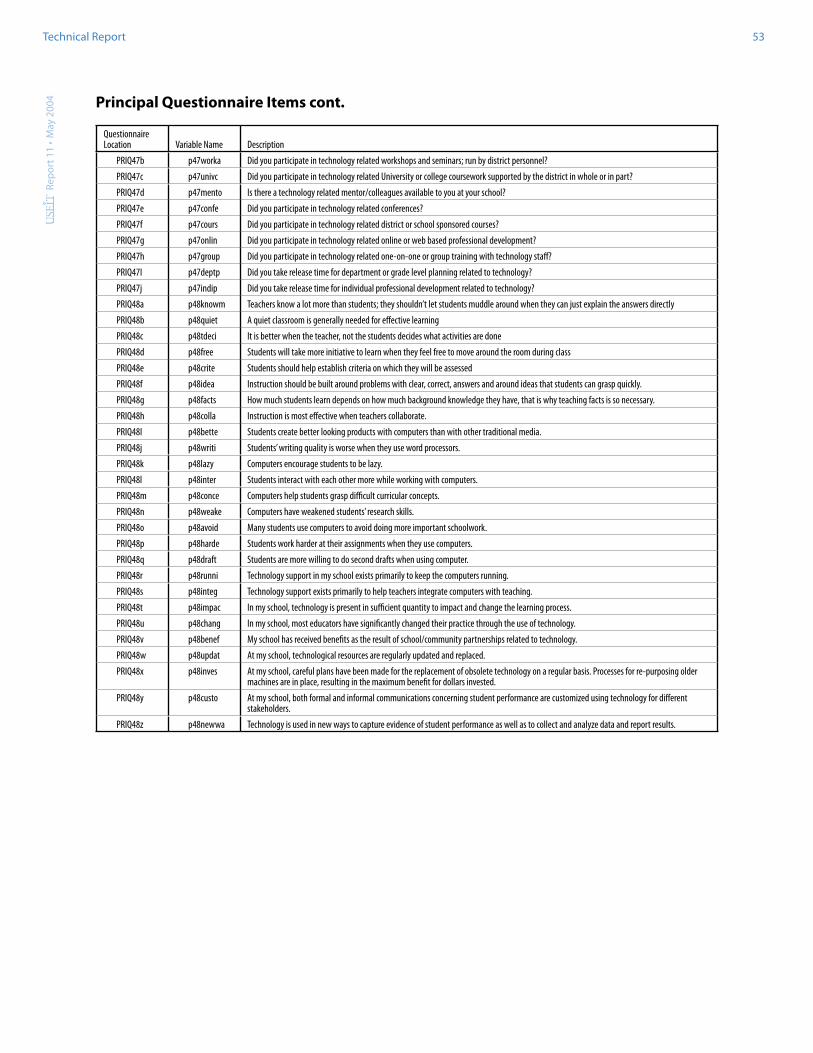
Rep
ort 1
1 ·
May
200
4Technical Report 53
Principal Questionnaire Items cont.
Questionnaire Location Variable Name Description
PRIQ47b p47worka Did you participate in technology related workshops and seminars; run by district personnel?
PRIQ47c p47univc Did you participate in technology related University or college coursework supported by the district in whole or in part?
PRIQ47d p47mento Is there a technology related mentor/colleagues available to you at your school?
PRIQ47e p47confe Did you participate in technology related conferences?
PRIQ47f p47cours Did you participate in technology related district or school sponsored courses?
PRIQ47g p47onlin Did you participate in technology related online or web based professional development?
PRIQ47h p47group Did you participate in technology related one-on-one or group training with technology staff?
PRIQ47I p47deptp Did you take release time for department or grade level planning related to technology?
PRIQ47j p47indip Did you take release time for individual professional development related to technology?
PRIQ48a p48knowm Teachers know a lot more than students; they shouldn’t let students muddle around when they can just explain the answers directly
PRIQ48b p48quiet A quiet classroom is generally needed for effective learning
PRIQ48c p48tdeci It is better when the teacher, not the students decides what activities are done
PRIQ48d p48free Students will take more initiative to learn when they feel free to move around the room during class
PRIQ48e p48crite Students should help establish criteria on which they will be assessed
PRIQ48f p48idea Instruction should be built around problems with clear, correct, answers and around ideas that students can grasp quickly.
PRIQ48g p48facts How much students learn depends on how much background knowledge they have, that is why teaching facts is so necessary.
PRIQ48h p48colla Instruction is most effective when teachers collaborate.
PRIQ48I p48bette Students create better looking products with computers than with other traditional media.
PRIQ48j p48writi Students’ writing quality is worse when they use word processors.
PRIQ48k p48lazy Computers encourage students to be lazy.
PRIQ48l p48inter Students interact with each other more while working with computers.
PRIQ48m p48conce Computers help students grasp difficult curricular concepts.
PRIQ48n p48weake Computers have weakened students’ research skills.
PRIQ48o p48avoid Many students use computers to avoid doing more important schoolwork.
PRIQ48p p48harde Students work harder at their assignments when they use computers.
PRIQ48q p48draft Students are more willing to do second drafts when using computer.
PRIQ48r p48runni Technology support in my school exists primarily to keep the computers running.
PRIQ48s p48integ Technology support exists primarily to help teachers integrate computers with teaching.
PRIQ48t p48impac In my school, technology is present in sufficient quantity to impact and change the learning process.
PRIQ48u p48chang In my school, most educators have significantly changed their practice through the use of technology.
PRIQ48v p48benef My school has received benefits as the result of school/community partnerships related to technology.
PRIQ48w p48updat At my school, technological resources are regularly updated and replaced.
PRIQ48x p48inves At my school, careful plans have been made for the replacement of obsolete technology on a regular basis. Processes for re-purposing older machines are in place, resulting in the maximum benefit for dollars invested.
PRIQ48y p48custo At my school, both formal and informal communications concerning student performance are customized using technology for different stakeholders.
PRIQ48z p48newwa Technology is used in new ways to capture evidence of student performance as well as to collect and analyze data and report results.

Rep
ort 1
1 ·
May
200
4Technical Report 54
District Questionnaire Items
Item Name Question
v1 What is your current role?
v2 Students interact with each other more while working with computers
v3 Computers help students grasp difficult curricular concepts
v4 Computers have weakened students’ research skills
v5 Many students use computers to avoid doing more important work
v6 Students work harder at their assignments when they use computers
v7 Students are more willing to do second drafts when using a computer
v8 Students are too careless to use technology without close supervision
v9 Students access to the internet/instant messaging distracts students
v10 Students access to web encourages plagiarism
v11 Across my district, we are currently integrating technology as much as we need to into instructional activities.
v12 Relative to all of your goals for your district, how much emphasis do you place on the integration of classroom technology?
v13 How valuable are each of the following instructional uses of computers? Developing basic mathematics skills
v14 How valuable are each of the following instructional uses of computers? Developing basic reading skills
v15 How valuable are each of the following instructional uses of computers? Preparing students for standardized tests
v16 How valuable are each of the following instructional uses of computers? Drafting text
v17 How valuable are each of the following instructional uses of computers? Editing and revising text
v18 How valuable are each of the following instructional uses of computers? Communicating with people outside of school
v19 How valuable are each of the following instructional uses of computers? Teacher presentation of lessons
v20 How valuable are each of the following instructional uses of computers? Student presentations
v21 How valuable are each of the following instructional uses of computers? Accessing resources via the internet/CD ROM
v22 How valuable are each of the following instructional uses of computers? Exploring mathematical relationships
v23 How valuable are each of the following instructional uses of computers? Graphing and manipulating data
v24 How valuable are each of the following instructional uses of computers? Producing projects
v25 How valuable are each of the following instructional uses of computers? Creating web sites
v26 How much discretion do individual principals in your district have about: Purchasing software
v27 How much discretion do individual principals in your district have about: Purchasing hardware
v28 How much discretion do individual principals in your district have about: Allocation of technology in the schools
v29 How much discretion do individual principals in your district have about: Professional development activities
v30 In my district, technology is present in sufficient quantity
v31 In my district, technology is present in sufficient quantity to impact and change the learning process
v32 In my district, most educators have significantly changed their professional practice through the use of technology
v33 My district has received benefits as the result of school/community partnerships related to technology
v34 In my district, technological resources are regularly updated and replaced
v35 Technology is used in new ways to capture evidence of student performance as well as to collect and analyze data and report results
v36 In my district, careful plans have been made for the replacement of obsolete technology on a regular basis
v37 Processes for re-purposing older machines are in place, resulting in the maximum benefit for dollars invested
v38 In my district, both formal and informal communications concerning student performance are customized using technology for different stakeholders.
v39 When your computer has a major problem (one that requires some assistance), how long does it typically take for the problem to get fixed?
v40 Rate how each of the following statements describes your personal use of computers
v41 Has your district obtained special grants during the last three years to support experimental programs at the school either directly or through your district?
v42 If you answered yes to #9, please describe the grants (how much, how long, in what areas and in which schools)
v43 Over the last three years, what percentage of technology related expenditures came from: Bond/Debt issuance?
v44 Over the last three years, what percentage of technology related expenditures came from: Annual School Budget?
v45 Over the last three years, what percentage of technology related expenditures came from: Parent/Community Fundraising?
v46 Over the last three years, what percentage of technology related expenditures came from: External Grants?
v47 Over the last three years, what percentage of technology related expenditures came from: Federal Grants including e-Rate?
v48 Compared to other districts in the state, does your district support the costs of technology?
v49 Does your district budget have a line item for: Hardware?
v50 Does your district budget have a line item for: Software?
v51 Does your district budget have a line item for: Technology Support Staff?
v52 Does your district budget have a line item for: Technology Curriculum Integration Staff?

Rep
ort 1
1 ·
May
200
4Technical Report 55
District Questionnaire Items cont.
Item Name Question
v53 Does your district budget have a line item for: Technology-related Professional Development?
v54 Does your district budget have a line item for: Upgrades and replacement?
v55 As of today, rate the stage of implementation and the degree of success your district has had in implementing each of the following: Professional Development
v56 As of today, rate the stage of implementation and the degree of success your district has had in implementing each of the following: Technical Support
v57 As of today, rate the stage of implementation and the degree of success your district has had in implementing each of the following: Access to Hardware
v58 As of today, rate the stage of implementation and the degree of success your district has had in implementing each of the following: Access to Software
v59 As of today, rate the stage of implementation and the degree of success your district has had in implementing each of the following: Network Services
v60 As of today, rate the stage of implementation and the degree of success your district has had in implementing each of the following: Curriculum Integration
v61 Professional Development
v62 Technical Support
v63 Access to Hardware
v64 Access to Software
v65 Network Services
v66 Curriculum Integration
v67 In school A, teachers are free to use technology as they see fit. As a result, teachers in some classrooms use technology extensively with their students while other teachers make minimal use of technology. In school B, all teachers within a grade level or course attempt to provide students with common learning experiences with technology. Mark where the schools in your district fall on the continuum below.
v68 Within your district, how equitable is student ACCESS to computers: Within elementary school classrooms
v69 Within your district, how equitable is student ACCESS to computers: Within middle school classrooms
v70 Within your district, how equitable is student ACCESS to computers: Within high school classrooms
v71 Within your district, how equitable is student ACCESS to computers: Of different achievement levels
v72 Within your district, how equitable is student ACCESS to computers: Of different gender
v73 Within your district, how equitable is student ACCESS to computers: Of different race
v74 Within your district, how equitable is student ACCESS to computers: Of different SES
v75 Within your district, how equitable is student ACCESS to computers: Of differing primary languages
v76 Within your district, how equitable is student USE of computers: Within elementary school classrooms
v77 Within your district, how equitable is student USE of computers: Within middle school classrooms
v78 Within your district, how equitable is student USE of computers: Within high school classrooms
v79 Within your district, how equitable is student USE of computers: Of different achievement levels
v80 Within your district, how equitable is student USE of computers: Of different gender
v81 Within your district, how equitable is student USE of computers: Of different race
v82 Within your district, how equitable is student USE of computers: Of different SES
v83 Within your district, how equitable is student USE of computers: Of differing primary languages
v84 District A attempts to assure that every classroom within grade levels in every school has the same number and kind of computers. District B distributes computers based on the usage needs such that some classrooms have minimal technology and others have abundant technology. Mark where your district lies.
v85 Does your district provide those students without access to computers at home with opportunities to use computers outside of the normal school day?
v86
v87 Other than this study, has your district participated in evaluations of any aspects of its technology program?
v88
v89 To what extent is technology considered when evaluating the principals and curriculum leaders in your district?
v90 To what extent is technology considered when evaluating the teachers in your district?
v91 For how many years, if at all, have you had: A computer in your office or work space?
v92 For how many years, if at all, have you had: An Internet connection in your office or workspace?
v93 For how many years, if at all, have you had: A computer at home?
v94 For how many years, if at all, have you had: An Internet connection in your home?
v95 Which of the following policies are implemented in your district: Students are not allowed to play games on the school computers
v96 Which of the following policies are implemented in your district: Student access to the internet is screened by a firewall
v97 Which of the following policies are implemented in your district: Students are not allowed to send email from school computers
v98 Which of the following policies are implemented in your district: Students are not allowed to receive email from school computers
v99 Which of the following policies are implemented in your district: Schools have an acceptable use policy
v100 Which of the following policies are implemented in your district: Policy regarding academic integrity with specific reference to technology
v101 Which of the following policies are implemented in your district: Students are not allowed to use spell-checker and/or grammar-checker
v102 Which of the following policies are implemented in your district: Students are not allowed to use calculators in mathematics classes
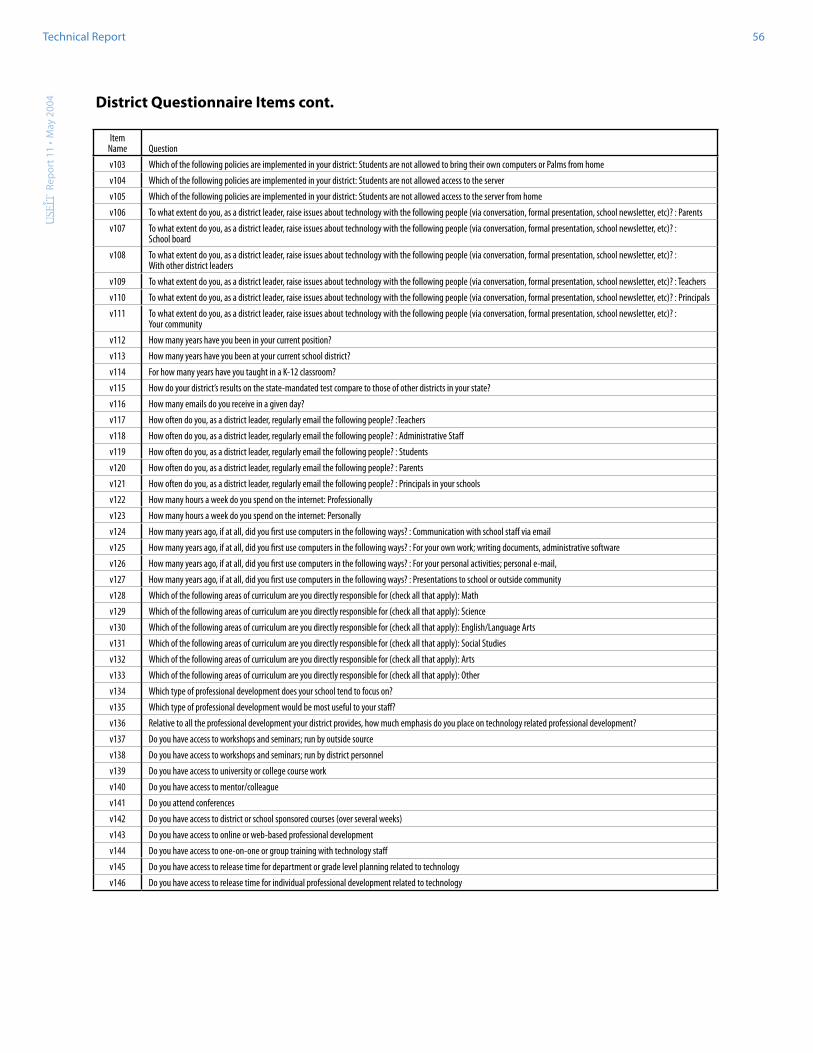
Rep
ort 1
1 ·
May
200
4Technical Report 56
District Questionnaire Items cont.
Item Name Question
v103 Which of the following policies are implemented in your district: Students are not allowed to bring their own computers or Palms from home
v104 Which of the following policies are implemented in your district: Students are not allowed access to the server
v105 Which of the following policies are implemented in your district: Students are not allowed access to the server from home
v106 To what extent do you, as a district leader, raise issues about technology with the following people (via conversation, formal presentation, school newsletter, etc)? : Parents
v107 To what extent do you, as a district leader, raise issues about technology with the following people (via conversation, formal presentation, school newsletter, etc)? : School board
v108 To what extent do you, as a district leader, raise issues about technology with the following people (via conversation, formal presentation, school newsletter, etc)? : With other district leaders
v109 To what extent do you, as a district leader, raise issues about technology with the following people (via conversation, formal presentation, school newsletter, etc)? : Teachers
v110 To what extent do you, as a district leader, raise issues about technology with the following people (via conversation, formal presentation, school newsletter, etc)? : Principals
v111 To what extent do you, as a district leader, raise issues about technology with the following people (via conversation, formal presentation, school newsletter, etc)? : Your community
v112 How many years have you been in your current position?
v113 How many years have you been at your current school district?
v114 For how many years have you taught in a K-12 classroom?
v115 How do your district’s results on the state-mandated test compare to those of other districts in your state?
v116 How many emails do you receive in a given day?
v117 How often do you, as a district leader, regularly email the following people? :Teachers
v118 How often do you, as a district leader, regularly email the following people? : Administrative Staff
v119 How often do you, as a district leader, regularly email the following people? : Students
v120 How often do you, as a district leader, regularly email the following people? : Parents
v121 How often do you, as a district leader, regularly email the following people? : Principals in your schools
v122 How many hours a week do you spend on the internet: Professionally
v123 How many hours a week do you spend on the internet: Personally
v124 How many years ago, if at all, did you first use computers in the following ways? : Communication with school staff via email
v125 How many years ago, if at all, did you first use computers in the following ways? : For your own work; writing documents, administrative software
v126 How many years ago, if at all, did you first use computers in the following ways? : For your personal activities; personal e-mail,
v127 How many years ago, if at all, did you first use computers in the following ways? : Presentations to school or outside community
v128 Which of the following areas of curriculum are you directly responsible for (check all that apply): Math
v129 Which of the following areas of curriculum are you directly responsible for (check all that apply): Science
v130 Which of the following areas of curriculum are you directly responsible for (check all that apply): English/Language Arts
v131 Which of the following areas of curriculum are you directly responsible for (check all that apply): Social Studies
v132 Which of the following areas of curriculum are you directly responsible for (check all that apply): Arts
v133 Which of the following areas of curriculum are you directly responsible for (check all that apply): Other
v134 Which type of professional development does your school tend to focus on?
v135 Which type of professional development would be most useful to your staff?
v136 Relative to all the professional development your district provides, how much emphasis do you place on technology related professional development?
v137 Do you have access to workshops and seminars; run by outside source
v138 Do you have access to workshops and seminars; run by district personnel
v139 Do you have access to university or college course work
v140 Do you have access to mentor/colleague
v141 Do you attend conferences
v142 Do you have access to district or school sponsored courses (over several weeks)
v143 Do you have access to online or web-based professional development
v144 Do you have access to one-on-one or group training with technology staff
v145 Do you have access to release time for department or grade level planning related to technology
v146 Do you have access to release time for individual professional development related to technology

Rep
ort 1
1 ·
May
200
4Technical Report 57
APPENDIX B
District Site-Visit Questions1. What are some promising instructional uses of technology that you have seen
in your district?2. When you have seen technology used successfully in the classroom, what
were the conditions that enabled these successes?3. What short-term goals do you have for technology? 4. What short-term goals do you have that are not specific to technology?5. In what ways do you hope that technology will affect the way teachers teach
and students learn five years from now?6. What has your district done to promote or sell technology to teachers? to the
community? 7. What has your district done to support teachers in using technology? Is it
working?8. What are the district level practices and expectation (policies, standards)
related to technology? 9. How does your district make decisions about curriculum, budgets,
technology? 10. Is use of technology a part of the evaluation process? 11. If you were to evaluate teachers based on their use of technology, what would
your criteria be?12. What obstacles has your district encountered with regards to technology and
how have you attempted to overcome them?13. Forgetting technology for the moment, how does change usually occur
in your district? Who initiates the change process and what strategies are employed to help change occur?
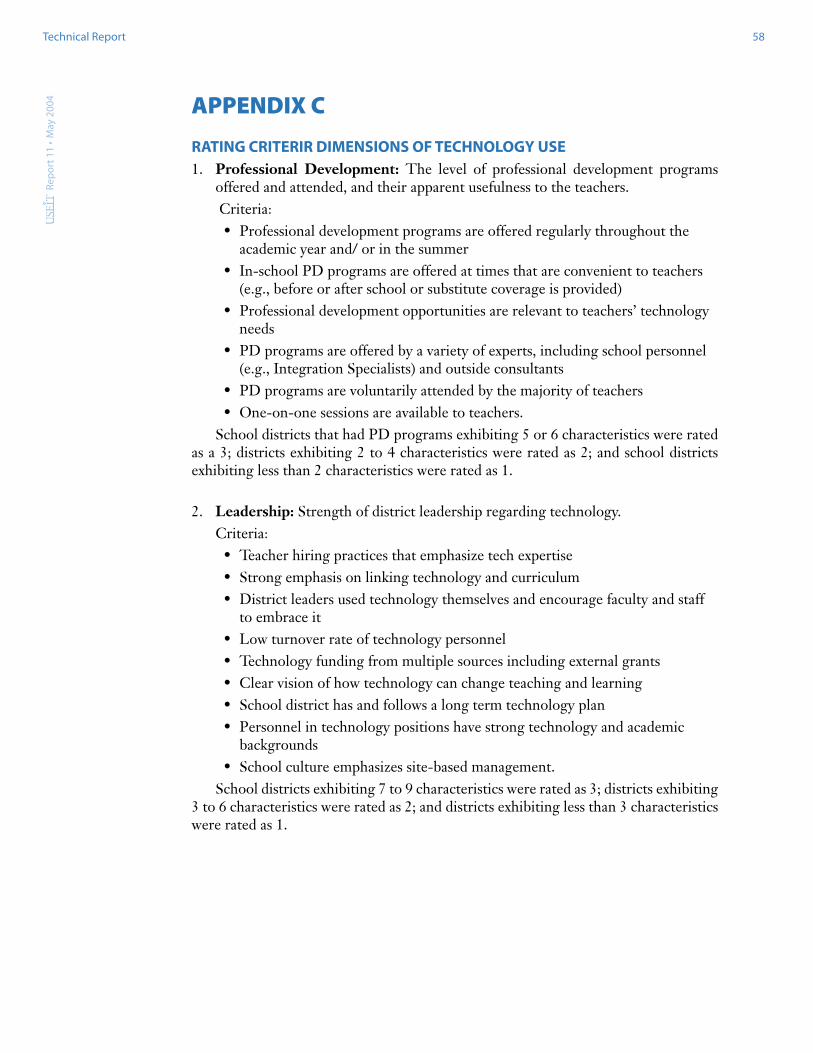
Rep
ort 1
1 ·
May
200
4Technical Report 58
APPENDIX C
RATING CRITERIR DIMENSIONS OF TECHNOLOGY USE1. Professional Development: The level of professional development programs
offered and attended, and their apparent usefulness to the teachers. Criteria:
• Professional development programs are offered regularly throughout the academic year and/ or in the summer
• In-school PD programs are offered at times that are convenient to teachers (e.g., before or after school or substitute coverage is provided)
• Professional development opportunities are relevant to teachers’ technology needs
• PD programs are offered by a variety of experts, including school personnel (e.g., Integration Specialists) and outside consultants
• PD programs are voluntarily attended by the majority of teachers• One-on-one sessions are available to teachers.
School districts that had PD programs exhibiting 5 or 6 characteristics were rated as a 3; districts exhibiting 2 to 4 characteristics were rated as 2; and school districts exhibiting less than 2 characteristics were rated as 1.
2. Leadership: Strength of district leadership regarding technology. Criteria:
• Teacher hiring practices that emphasize tech expertise• Strong emphasis on linking technology and curriculum• District leaders used technology themselves and encourage faculty and staff
to embrace it• Low turnover rate of technology personnel• Technology funding from multiple sources including external grants• Clear vision of how technology can change teaching and learning• School district has and follows a long term technology plan• Personnel in technology positions have strong technology and academic
backgrounds• School culture emphasizes site-based management.
School districts exhibiting 7 to 9 characteristics were rated as 3; districts exhibiting 3 to 6 characteristics were rated as 2; and districts exhibiting less than 3 characteristics were rated as 1.

Rep
ort 1
1 ·
May
200
4Technical Report 59
3. Resources: Amount of computers, recent software, and other related equipment available in the district, power and data capabilities, and network access of com-puters and peripherals.
Criteria:• Evidence of easily accessible and readily available equipment• Evidence of reliable newer equipment and network • Evidence of recent software being used• Computers in every classroom (4-6)• Laptops on carts• Well equipped media center• Wireless Internet access• Availability of digital cameras and LCD projectors.
Districts exhibiting 6 to 8 characteristics were rated as 3; districts exhibiting 3 to 5 characteristics were rated as 3; and districts exhibiting less than 3 characteristics were rated as 1.
4. Technology Plan: District has a well-written technology plan and extent to which the plan is followed.
Criteria:• Evidence that there is a long term plan (most districts use a 5-year plan) that
addresses equipment purchases, maintenance and upgrades, curriculum inte-gration, and personnel training
• Evidence that school personnel at all levels are aware of the plan’s existence• Evidence that the plan is followed and enforced.
Districts that met more than 2 criteria were rated as 3; districts that met 1 of the criteria were rated as 2; and districts that met no criteria were rated as 1.
5. Integration Specialist: Do schools have separate FTE positions for classrooms or school technology integration specialists.
Criteria:• Evidence that each school has an Integration Specialist who is responsible for
the integration of curriculum and technology• Evidence that Integration Specialists work with teachers to develop curricu-
lum units • Evidence that Integration Specialists assist teachers in the implementation of
integrated curriculum units• Evidence that Integration Specialists participate in the formal and informal
training of teachers• Evidence that Integration Specialists act as liaisons between teachers and
other technology support personnel.Districts who met 4 or 5 criteria were rated as 3; districts that met 2 or 3 criteria
were rated as 2, and districts that met less than 2 criteria were rated as 1.

Rep
ort 1
1 ·
May
200
4Technical Report 60
6. Teacher Support: Level of technology support for teachers separate from profes-sional development, e.g., just-in-time support, building level support.
Criteria: • One Integration Specialist in each of the district’s schools• Adequate number of computer technicians to support district’s needs, includ-
ing both desktop computer and network problems • Evidence of a help desk (or similar support system) to assist teachers with
equipment and software issues• Evidence of prompt response to teachers’ queries.
Districts that met 3 or 4 criteria were rated as 3; districts that met 1 or 2 criteria were rated as 2, and districts that met none were rated as 1.
7. External Programs: The extent to which the district participates in technology education programs and projects outside the district, including grant funded proj-ects and university funded projects such as Project MEET, Gen WHY, PT3, etc.
Criterion: • Evidence that the district participates in external technology programs dur-
ing the school year.Districts that had 2 or more externally funded projects were rated as 3; districts
that had 1 externally funded projected were rated as 2, and districts that had no exter-nally funded projects were rated as 1.
8. Funding Level: District operational budget funding level for technology. Criteria:
a) Evidence that there is a budget line item for instructional technologyb) Evidence that the budget reflects total cost of ownership (i.e., allowances for
maintenance and upgrade)c) Evidence that technology funds are not “borrowed” from other line items
(e.g., materials and supplies, equipment)d) Evidence that the district encourages grant writing for additional tech
funding.Districts that met criteria a and b OR any 3 criteria were rated as 3. Districts that
met criteria c and d OR criterion a OR criterion b were rated as 2. Otherwise, districts were rated as 1.

Rep
ort 1
1 ·
May
200
4Technical Report 61
9. Community: The extent to which the community supports technology. Criteria:
• Evidence that the School Committee supports funding for hardware (i.e., equipment and infrastructure)
• Evidence that the School Committee supports funding for support personnel• Evidence that the School Committee prioritizes technology in times of fiscal
constraint• Evidence that community members support technology through donations of
equipment or money• Evidence that community members serve as technology volunteers in
schools.Districts that met 4 or 5 criteria were rated as 3; districts that met 2 or 3 criteria
were rated as 2; districts that met less than 2 criteria were rated as 1.
10. Collaboration: The extent to which teachers collaborate on any educational objective.Criteria:
• Evidence that teachers support each other in educational projects (e.g., peers helping peers)
• Evidence that teachers collaborate to develop and share materials• Evidence that teachers collaborate to develop technology integrated curricu-
lum units• Evidence of team teaching.
Districts that met 3 or more criteria were rated as 3; districts that met 1 or 2 crite-ria were rated as 2, and districts that met none were rated as 1.
11. Tech Supports Goals: The extent to which technology supports non-technology short-term district goals.
Criterion: • District lists short-term educational goals that relate to or are supported by
technology. Districts that listed 3 or more goals were rated as 3; districts that listed 1 or 2 goals
were rated as 2, and districts that listed none were rated as 1.
12. Technology Standards: Whether or not the district has technology standards or competencies, and the extent to which teachers and students are accountable for those standards.Criteria:
• Evidence that district has written standards or competencies for students• Evidence that administrators and teachers know of the standards’ existence• Evidence that teachers and students are held accountable for the standards.
Districts that met 2 or 3 criteria were rated as 3; districts that met 1 criteria were rated as 2; districts that met none were rated as 1.
Rep
ort 1
1 ·
May
200
4Technical Report 62
13. Vision: The extent to which the district has a clear technology vision. Criteria:
a) Evidence that district leaders look for alternative or creative solutions to sup-port and forward technology (e.g., adopt wireless technologies to circumvent high wiring costs; purchase laptops on carts rather than building expensive labs, etc.)
b) Evidence that district leaders are aware of leading trends and research in edu-cational technology
c) Evidence that district leaders are actively attempting to implement technol-ogy programs in their schools that are supported by research
d) Emphasis on curriculum integration e) Evidence that tech is used to enable communication on a local (i.e., school/
community) and global scale.Districts that met any 2 criteria from a to c AND criterion d were rated as 3.
Districts that met 1 criterion from criteria a to c AND any other criterion were rated as 2. Otherwise, districts were rated as 1.
14. Obstacles: The extent to which obstacles mentioned by interviewees reflected a range of complicated issues besides “time and money”.
Criterion: • Evidence that district personnel refer to 3 or more technology related
obstacles that covered broader issues besides time and money (e.g., culture, equity).
Districts that met the criterion were rated as 3 while districts that did not meet the criterion were rated as 1.

Rep
ort 1
1 ·
May
200
4Technical Report 63
Appendix D: Measurement ScalesThe following scales for the teacher, student, and district data have been cre-
ated through the use of principal components analysis. This technique provides evi-dence that the scales are indeed measuring a single attribute. The percent of variance explained refers to amount of variance that the scale accounts for in the responses of all the items that make up the scale. The factor loadings represent the correlation between the original item and the scale. Higher factor loadings represent a stronger relationship between the item and the scale. These scales were created using data pro-vided by teachers who met our selection criteria (see Appendix E) .
Teacher Scales
Scale 1 – Student Use of Technology as Reported by Teacher Scales
TEAQ11b v11bwco During classtime, how often did students work individually on school work using computers this year? Teacher-directed student use of technology during classtime scale
TEAQ11d v11dgr During classtime, how often did students work in groups on school work using computers this year?
TEAQ11f v11fres. During classtime, how often did students perform research or find information using the internet or CD-ROM this year?
TEAQ11g v11gdev. During classtime, how often did students use a computer or portable writing device for writing this year?
TEAQ11h v11hsolv During classtime, how often did students use a computer to solve problems this year?
TEAQ11m v11minfo During classtime, how often did students present information to the class using a computer this year? Variance Explained: 56%Smallest component: 0.664Reliability = 0.84
TEAQ11p v11pemai During classtime, how often did students use email to consult “experts” this year? Student use of specific technology applications scale
TEAQ11q v11qemai During classtime, how often did students use computers to communicate with students in other schools this year?
TEAQ11n v11nanal During classtime, how often did students use a spreadsheet/database to record, explore or analyze data this year?
TEAQ11o v11oprob During classtime, how often did students use probes (e.g. thermometers, etc.) attached to a computer this year?
Variance Explained: 47%Smallest component: 0.588Reliability = 0.60
TEAQ11a v11awo During classtime, how often did students work individually on school work without using computers this year?
Student activities without computers scale
TEAQ11c v11cgr During classtime, how often did students work in groups on school work without using computers this year?
TEAQ11e v11eres. During classtime, how often did students perform research or find information without using a computer this year?
TEAQ11l v11linfo During classtime, how often did students present information to the class without using a computer this year?
Variance Explained: 48%Smallest component: 0.595Reliability = 0.60
TEAQ11j v11jedg During classtime, how often did students use a computer to play educational games this year? Students’ non-academic computer use scale
TEAQ11k v11kfun During classtime, how often did students use a computer to play games for fun this year? Variance Explained: 87%Smallest component: 0.931Reliability = 0.85
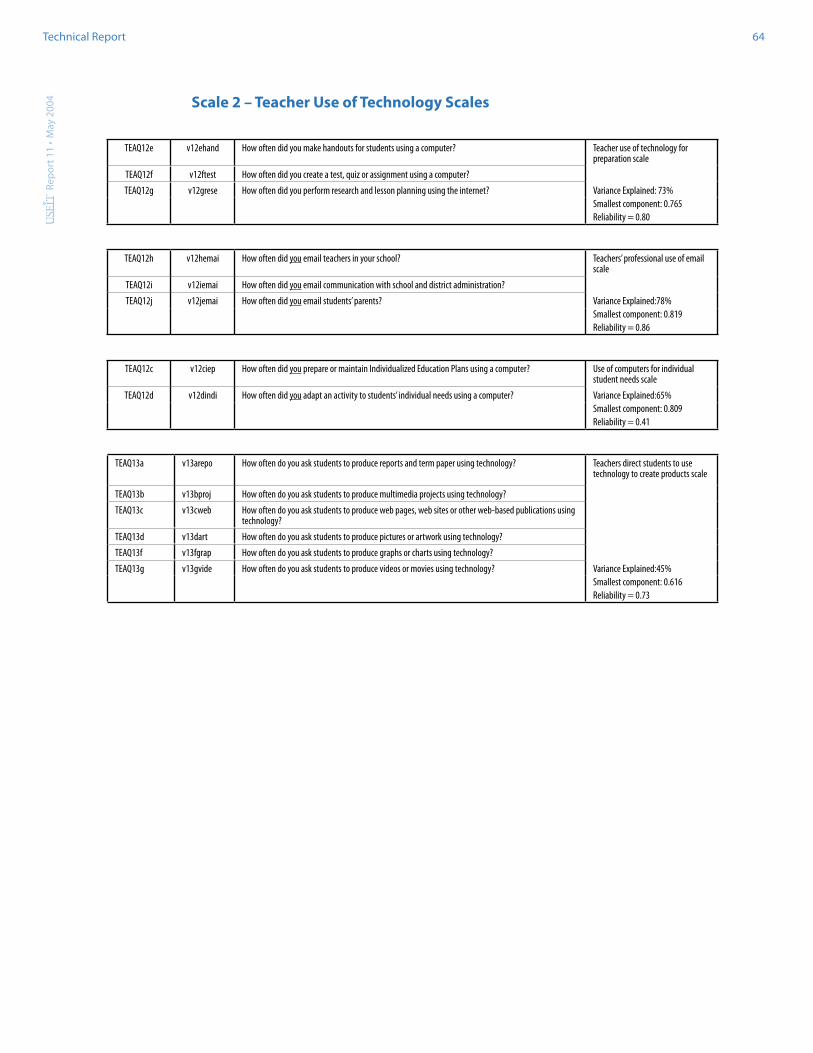
Rep
ort 1
1 ·
May
200
4Technical Report 64
Scale 2 – Teacher Use of Technology Scales
TEAQ12e v12ehand How often did you make handouts for students using a computer? Teacher use of technology for preparation scale
TEAQ12f v12ftest How often did you create a test, quiz or assignment using a computer?
TEAQ12g v12grese How often did you perform research and lesson planning using the internet? Variance Explained: 73%Smallest component: 0.765Reliability = 0.80
TEAQ12h v12hemai How often did you email teachers in your school? Teachers’ professional use of email scale
TEAQ12i v12iemai How often did you email communication with school and district administration?
TEAQ12j v12jemai How often did you email students’ parents? Variance Explained:78%Smallest component: 0.819Reliability = 0.86
TEAQ12c v12ciep How often did you prepare or maintain Individualized Education Plans using a computer? Use of computers for individual student needs scale
TEAQ12d v12dindi How often did you adapt an activity to students’ individual needs using a computer? Variance Explained:65%Smallest component: 0.809Reliability = 0.41
TEAQ13a v13arepo How often do you ask students to produce reports and term paper using technology? Teachers direct students to use technology to create products scale
TEAQ13b v13bproj How often do you ask students to produce multimedia projects using technology?
TEAQ13c v13cweb How often do you ask students to produce web pages, web sites or other web-based publications using technology?
TEAQ13d v13dart How often do you ask students to produce pictures or artwork using technology?
TEAQ13f v13fgrap How often do you ask students to produce graphs or charts using technology?
TEAQ13g v13gvide How often do you ask students to produce videos or movies using technology? Variance Explained:45%Smallest component: 0.616Reliability = 0.73
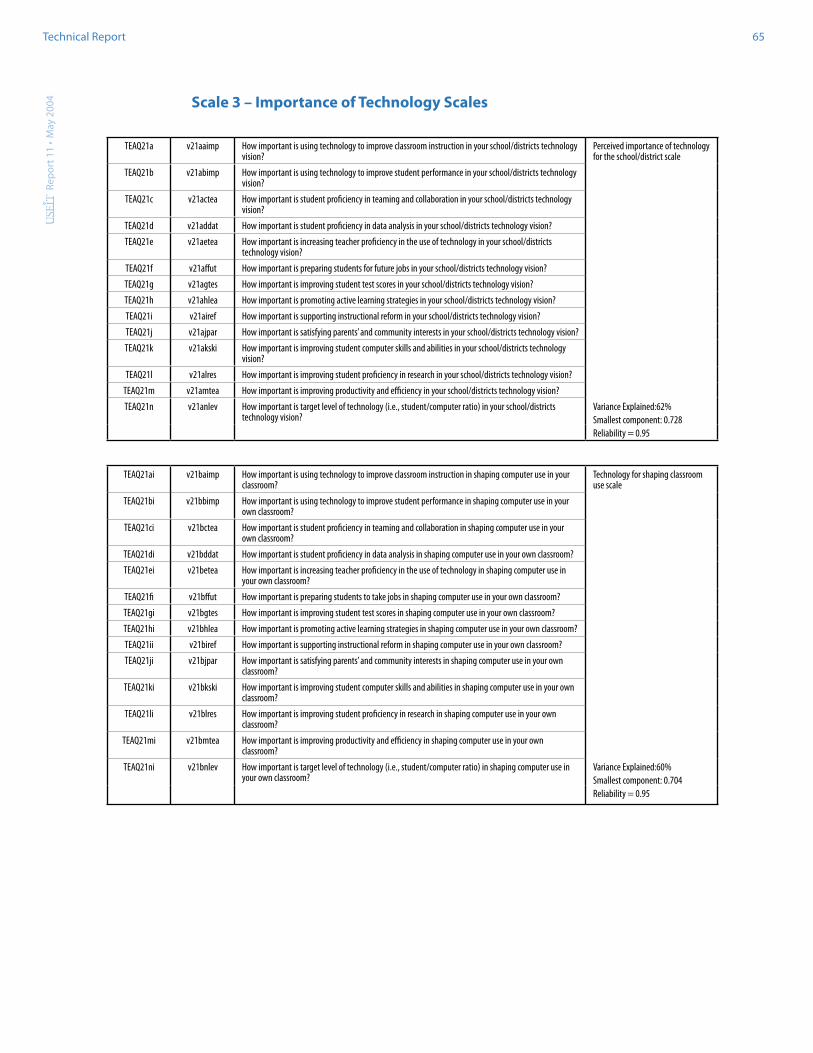
Rep
ort 1
1 ·
May
200
4Technical Report 65
Scale 3 – Importance of Technology Scales
TEAQ21a v21aaimp How important is using technology to improve classroom instruction in your school/districts technology vision?
Perceived importance of technology for the school/district scale
TEAQ21b v21abimp How important is using technology to improve student performance in your school/districts technology vision?
TEAQ21c v21actea How important is student proficiency in teaming and collaboration in your school/districts technology vision?
TEAQ21d v21addat How important is student proficiency in data analysis in your school/districts technology vision?
TEAQ21e v21aetea How important is increasing teacher proficiency in the use of technology in your school/districts technology vision?
TEAQ21f v21affut How important is preparing students for future jobs in your school/districts technology vision?
TEAQ21g v21agtes How important is improving student test scores in your school/districts technology vision?
TEAQ21h v21ahlea How important is promoting active learning strategies in your school/districts technology vision?
TEAQ21i v21airef How important is supporting instructional reform in your school/districts technology vision?
TEAQ21j v21ajpar How important is satisfying parents’ and community interests in your school/districts technology vision?
TEAQ21k v21akski How important is improving student computer skills and abilities in your school/districts technology vision?
TEAQ21l v21alres How important is improving student proficiency in research in your school/districts technology vision?
TEAQ21m v21amtea How important is improving productivity and efficiency in your school/districts technology vision?
TEAQ21n v21anlev How important is target level of technology (i.e., student/computer ratio) in your school/districts technology vision?
Variance Explained:62%Smallest component: 0.728Reliability = 0.95
TEAQ21ai v21baimp How important is using technology to improve classroom instruction in shaping computer use in your classroom?
Technology for shaping classroom use scale
TEAQ21bi v21bbimp How important is using technology to improve student performance in shaping computer use in your own classroom?
TEAQ21ci v21bctea How important is student proficiency in teaming and collaboration in shaping computer use in your own classroom?
TEAQ21di v21bddat How important is student proficiency in data analysis in shaping computer use in your own classroom?
TEAQ21ei v21betea How important is increasing teacher proficiency in the use of technology in shaping computer use in your own classroom?
TEAQ21fi v21bffut How important is preparing students to take jobs in shaping computer use in your own classroom?
TEAQ21gi v21bgtes How important is improving student test scores in shaping computer use in your own classroom?
TEAQ21hi v21bhlea How important is promoting active learning strategies in shaping computer use in your own classroom?
TEAQ21ii v21biref How important is supporting instructional reform in shaping computer use in your own classroom?
TEAQ21ji v21bjpar How important is satisfying parents’ and community interests in shaping computer use in your own classroom?
TEAQ21ki v21bkski How important is improving student computer skills and abilities in shaping computer use in your own classroom?
TEAQ21li v21blres How important is improving student proficiency in research in shaping computer use in your own classroom?
TEAQ21mi v21bmtea How important is improving productivity and efficiency in shaping computer use in your own classroom?
TEAQ21ni v21bnlev How important is target level of technology (i.e., student/computer ratio) in shaping computer use in your own classroom?
Variance Explained:60%Smallest component: 0.704Reliability = 0.95

Rep
ort 1
1 ·
May
200
4Technical Report 66
Scale 4 – Professional Development Relating to Technology Scales
TEAQ29a v29amana Beneficial professional development: managing my computer desktop (opening programs, printing etc.)?
Need for professional development for basic skills scale
TEAQ29b v29butil Beneficial professional development: learning to utilize network services efficiently (e-mailed, saving to the server)?
TEAQ29c v29csour Beneficial professional development: learning about research sources on the Internet?
TEAQ29d v29ddata Beneficial professional development: learning how to manipulate data and constructing graphs?
TEAQ29g v29gappl Beneficial professional development: learning specific applications/software (Microsoft Word, PowerPoint)?
Variance Explained:60%Smallest component: 0.682Reliability = 0.81TEAQ29h v29honli Beneficial professional development: learning to use the Internet
TEAQ29e v29etech Beneficial professional development: integrating technology with student writing? Need for professional development on the integration of technology scale
TEAQ29f v29ftech Beneficial professional development: integrating technology into my classroom activities? Variance Explained:79%Smallest component: 0.887Reliability = 0.73

Rep
ort 1
1 ·
May
200
4Technical Report 67
Scale 5 – Obstacles Relating to Technology Use Scales
TEAQ31k v31klack Are the lack of student’s keyboarding skills an obstacle for you in making more effective use of technology?
Students obstruct technology use scale
TEAQ31l v31ltoo Does having too many students in your class act as an obstacle for you in making more effective use of technology?
TEAQ31n v31nnos Are the lack of students’ skills using a computer effectively an obstacle for you in making more effective use of technology?
TEAQ31w v31wtech Does a wide variety of computer skills among the students in your classroom act as an obstacle for you in making more effective use of technology?
TEAQ328a v32a8man Problems managing students when they use computers
TEAQ31x v31xacad Does a wide variety of academic skills among the students in your classroom act as an obstacle for you in making more effective use of technology?
Variance Explained:48%Smallest component: 0.501Reliability = 0.76
TEAQ31p v31plack Does teachers’ lack of input into technology decisions act as an obstacle for you in making more effective use of technology?
Leadership and teacher input obstructs technology use scale
TEAQ31q v31qlack Do difficulties connecting with the school technology specialist act as an obstacle for you in making more effective use of technology?
TEAQ31s v31slack Does lack of leadership related to technology act as an obstacle for you in making more effective use of technology?
TEAQ31t v31tnoi Does not knowing how the district wants you to use technology in the classroom act as an obstacle for you in making more effective use of technology?
TEAQ31u v31ulack Does a lack of flexibility in deciding how to you use computers in your classroom act as an obstacle for you in making more effective use of technology?
Variance Explained:56%Smallest component: 0.681Reliability = 0.79
TEAQ31a v31alack Is the lack of computers in the classroom an obstacle for you in making more effective use of technology?
Access obstructs technology use scale
TEAQ31b v31bdif Is the difficulty in accessing computers in labs and/or library an obstacle for you in making more effective use of technology?
TEAQ31c v31cnot Is not having enough computers for all of your students an obstacle for you in making more effective use of technology?
Variance Explained:69%Smallest component: 0.855Reliability = 0.78
TEAQ31h v31hdon Are unpredictable computers an obstacle for you in making more effective use of technology? Quality of available technology obstructs use scale
TEAQ31I v31iold Are outdated computers/software an obstacle for you in making more effective use of technology?
TEAQ31j v31jfast Is increased speed and improved technology an obstacle for you in making more effective use of technology?
TEAQ31r v31rtoo Does a slow internet act as an obstacle for you in making more effective use of technology? Variance Explained:54%Smallest component: 0.710Reliability = 0.72
TEAQ31d v31dnop Is the unavailability of software that your professional development has trained you to use an obstacle for you in making more effective use of technology?
Poor professional development obstructs use scale
TEAQ31e v31enot Is the lack of practice with software that your professional development has trained you to use an obstacle for you in making more effective use of technology?
TEAQ31g v31gnos Is insufficient or inadequate support on how to use technology in the classroom an obstacle for you in making more effective use of technology?
Variance Explained:57%Smallest component: 0.775Reliability = 0.62

Rep
ort 1
1 ·
May
200
4Technical Report 68
Scale 6 – Problems Relating to Technology Scales
TEAQ32a v32a1com Do you have problems getting the computer to work? Problems getting technology to work scale
TEAQ32b v32a2sof Do you have problems getting the software to work?
TEAQ32c v32a3pri Do you have problems getting the printer to work?
TEAQ32d v32a4acc Do you have problems accessing network folders/files?
TEAQ32e v32a5int Do you have problems connecting to the internet?
TEAQ32f v32a6ema Do you have problems emailing? Variance Explained:61%Smallest component: 0.774Reliability = 0.87
TEAQ32g v32a7inc Do you have problems incorporating technology into lessons? Problems incorporating technology obstructs use scale
TEAQ31v v31vrele Not sure that technology is relevant Variance Explained:64%Smallest component: 0.799Reliability = 0.41
Scale 7 – Teachers’ Perception of District Success Relating to Technology Scale
TEAQ36a v36aprof Rate the degree of success your district has had implementing technical professional development. District success implementing technology program scale
TEAQ36b v36binte Rate the degree of success your district has had integrating technology into the curriculum.
TEAQ36c v36ctech Rate the degree of success your district has had implementing technical support.
TEAQ36d v36dhard Rate the degree of success your district has had implementing access to hardware.
TEAQ36e v36esoft Rate the degree of success your district has had implementing access to software.
TEAQ36f v36fnetw Rate the degree of success your district has had implementing network services. Variance Explained:59%Smallest component: 0.780Reliability = 0.86
Scale 8 – Importance of Computers for Teaching Scale
TEAQ37a v37athis How important have computers been in your teaching this year? Importance of computers for teaching scale
TEAQ37b v37b3ye How important have computers been in your teaching three years ago?
TEAQ37c v37c5ye How important have computers been in your teaching five years ago? Variance Explained:73%Smallest component: 0.843Reliability = 0.81
Scale 9 – Teacher Confidence Using Computers Scale
TEAQ38a v38athis How confident have you been when using computers this year? Teacher confidence using computers scale
TEAQ38b v38b3ye How confident were you when you used computers three years ago?
TEAQ38c v38c5ye How confident were you when you used computers five years ago? Variance Explained:77%Smallest component: 0.868Reliability = 0.85

Rep
ort 1
1 ·
May
200
4Technical Report 69
Scale 10 – Pressure Scales
TEAQ39a v39agrou How much pressure do you feel to have students work in groups? Instructional pressures around technology scale
TEAQ39c v39ccove How much pressure do you feel to cover a large quantity of curriculum content?
TEAQ39g v39gproj How much pressure do you feel to have students to projects?
TEAQ39f v39fperf How much pressure do you feel to do performance-based assessments?
TEAQ39i v39istd. How much pressure do you feel to prepare students to take standardized tests?
TEAQ39j v39jhigh How much pressure do you feel to do higher order thinking and “problem solving”? Variance Explained: 53%Smallest component: 0.669Reliability = 0.82
TEAQ39b v39buse How much pressure do you feel to have students use computers? Pressure to use technology scale
TEAQ39e v39euse How much pressure do you feel to have students use the Internet?
TEAQ39h v39hsame How much pressure do you feel to use technology in the same way as other teachers in your grade? Variance Explained:70%Smallest component: 0.811Reliability = 0.78
Scale 11 – Support for Change Scales
TEAQ44c v44crese Research and best practices are shared and discussed in my school/district. Community support for change scale
TEAQ44d v44dnew New ideas presented at in-services are discussed afterwards by teachers in this school.
TEAQ44e v44eshar Most teachers here share my beliefs about what the central goals of the schools should be.
TEAQ44f v44fcont Teachers in the school are continually learning and seeking new ideas.
TEAQ44g v44gshar It is common for us to share samples of students’ work. Variance Explained:56%Smallest component: 0.727Reliability = 0.80
TEAQ44h v44hpres If the teacher is not doing a good job, they are pressed by school leaders or colleagues to improve. Support for growth scale
TEAQ44i v44istaf Staff development activities are followed by support to help teachers implement new practices.
TEAQ44p v44pment Formal teacher mentoring actively occurs in my school Variance Explained: 54%Smallest component: 0.692Reliability = 0.57
TEAQ44b v44bvalu My principal’s values and philosophy of education are similar to my own. Teacher relationship with principal scale
TEAQ44k v44kwith I have a good working relationship with my principal. Variance Explained: 78%Smallest component: 0.886Reliability = 0.73
TEAQ44m v44minpu Teachers have a lot of input regarding innovations, projects, and changing practices. Perceived support for innovation scale
TEAQ44j v44jhind There are hindrances to implementing new ideas at my school
TEAQ44o v44oexpe My school encourages experimentation. Variance Explained:57%Smallest component: 0.571Reliability = 0.59

Rep
ort 1
1 ·
May
200
4Technical Report 70
Scale 12 – AttitudesToward Technology Scale
TEAQ40n v40nweak Computers have weakened students’ research skills. Computers harm students learning scale
TEAQ40o v40oavoi Many students use computers to avoid doing more important schoolwork.
TEAQ40j v40jwrit Students’ writing quality is worse when they use word processors.
TEAQ40k v40klazy Computers encourage students to be lazy. Variance Explained: 55%Smallest component: 0.620Reliability = 0.72
TEAQ40a v40anom Teachers know a lot more than students; they shouldn’t let students muddle around when they can just explain the answers directly.
Teacher-directed instruction scale
TEAQ40b v40bquie A quiet classroom is generally needed for effective learning.
TEAQ40c v40cteac It is better when the teacher, not the students, decides what activities are done. Variance Explained: 60%Smallest component: 0.746Reliability = 0.67
TEAQ40i v40ibett Students create better looking products with computers than with other traditional media. Computers help students scale
TEAQ40l v40linte Students interact with each other more while working with computers.
TEAQ40m v40mgras Computers help students grasp difficult curricular concepts.
TEAQ40p v40phard Students work harder at their assignments when they use computers.
TEAQ40q v40qmore Students are more willing to do second drafts when using a computer. Variance Explained:40%Smallest component: 0.546Reliability = 0.61
TEAQ46a V46a The role of the teacher is to be facilitator vs. the instructor. Teacher beliefs about student-centered instruction scale
TEAQ46d V46d Students’ interests/effort in academic work is more important than learning information.
TEAQ46e V46e It is good to have different activities going on in the classroom vs. a whole class assignment.
TEAQ40d v40dstud Students will take more initiative to learn when they feel free to move around the classroom during class.
TEAQ40e v40estud Students should help establish criteria on which they will be assessed. Variance Explained: 42%Smallest component: 0.580Reliability = 0.63
TEAQ40r v40rkeep Technology support in my school exists primarily to keep the computers running. Technology support focuses on integration scale
TEAQ40s v40sinte Technology support exists primarily to help teachers integrate computers with teaching. Variance Explained: 73%Smallest component: 0.855Reliability = 0.64

Rep
ort 1
1 ·
May
200
4Technical Report 71
STUDENT SCALESThese scales are created using the combined files from the lower and upper grade
students.
Scale 1 – Student Use of Technology Scales
Grade 5 Variable Name
Grade 8 Variable Name
Combined File Variable Name Description
q10draft v17bdra v27 How often use a computer to write first drafts? Student reported use of computers for writing and research scale
q10edit v17cedi v28 How often use a computer to edit your papers?
q10inter v17efin v30 How often use a computer to find info on the net?
q24schoo v30dsea v66 How often use your home PC to search the net for school?
q24write v30gwri v69 How often use your home PC to write papers? Variance Explained: 58%Smallest component: 0.670Reliability = 0.82
Grade 5 Variable Name
Grade 8 Variable Name
Combined File Variable Name Description
q24prog v30hpro v70 How often use your home PC for programming? Student reported high-end home use of technology scaleq24web v30iweb v71 How often use your home PC to create web sites?
q24photo v30jpho v72 How often use your home PC for digital photos or movies? Variance Explained: 69%Smallest component: 0.814Reliability = 0.78
Grade 5 Variable Name
Grade 8 Variable Name
Combined File Variable Name Description
q24game v30agam v63 How often use your home PC to play games? Student reported recreational home use scaleq24chat v30bcha v64 How often use your home PC to chat or instant messaging?
q24email v30cema v65 How often use your home PC to email?
q24fun v30efun v67 How often use your home PC search the net for fun?
q24music v30fmus v68 How often use your home PC to mp3 or music? Variance Explained: 56%Smallest component: 0.440Reliability = 0.80
Scale 2 – Student Belief Scale
Grade 5 Variable Name
Grade 8 Variable Name
Combined File Variable Name Description
q17finis v22afin v48 When you are using a computer do you create a better product?
Students report that computers help their work scale
q17write v22bwri v49 When you are using a computer do you write better?
q17bette v22eund v52 When you are using a computer, do you better understand?
q17harde v22fwor v53 When you are using a computer, do you work harder? Variance Explained: 54%Smallest component: 0.593Reliability = 0.71

Rep
ort 1
1 ·
May
200
4Technical Report 72
Scale 3 – Student Self-Reported Skills Scales
Grade 5 Variable Name
Grade 8 Variable Name
Combined File Variable Name Description
q11email v18aema v34 How well able to use a computer to send and receive email? Student report of how well they use for research and writing scale
q11draft v18bdra v35 How well able to use a computer to write first drafts?
q11edit v18cedi v36 How well able to use a computer to edit your papers?
q11inter v18efin v38 How well able to use a computer to find info on the net? Variance Explained: 54%Smallest component: 0.669Reliability = 0.72
Grade 5 Variable Name
Grade 8 Variable Name
Combined File Variable Name Description
q11serve v18dser v37 How well able to use a computer to open files on a server-network?
Student report of how well they use for high end use scale
q11ppt v18fppt v39 How well able to use a computer to create a Hyperstudio or PowerPoint presentation?
q11dbt v18hspre v41 How well able to use a computer to work with spreadsheet or database?
Variance Explained: 61%Smallest component: 0.724Reliability = 0.68
Scale 4 – Students General Comfort Level With Technology
Grade 5 Variable Name
Grade 8 Variable Name
Combined File Variable Name
Description
q15perso v19pers v45 Statement about personal use of computer Student reported general comfort level with technology scale
q17confu v22hcon v55 When you are using a computer, do you get more confused?
q17frust v22ifru v56 When you are using a computer, do you get frustrated more easily?
Variance Explained: 61%Smallest component: 0.623Reliability = 0.67
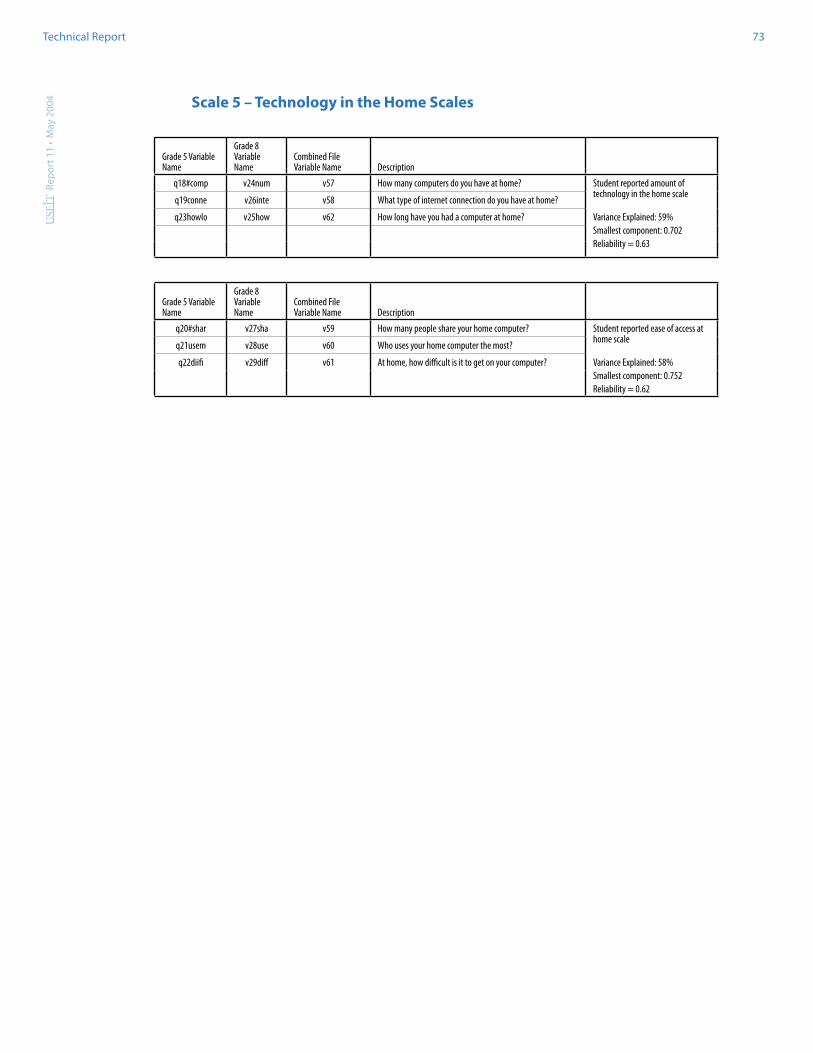
Rep
ort 1
1 ·
May
200
4Technical Report 73
Scale 5 – Technology in the Home Scales
Grade 5 Variable Name
Grade 8 Variable Name
Combined File Variable Name Description
q18#comp v24num v57 How many computers do you have at home? Student reported amount of technology in the home scale
q19conne v26inte v58 What type of internet connection do you have at home?
q23howlo v25how v62 How long have you had a computer at home? Variance Explained: 59%Smallest component: 0.702Reliability = 0.63
Grade 5 Variable Name
Grade 8 Variable Name
Combined File Variable Name Description
q20#shar v27sha v59 How many people share your home computer? Student reported ease of access at home scale
q21usem v28use v60 Who uses your home computer the most?
q22diifi v29diff v61 At home, how difficult is it to get on your computer? Variance Explained: 58%Smallest component: 0.752Reliability = 0.62

Rep
ort 1
1 ·
May
200
4Technical Report 74
DISTRICT SCALES
Scale 1 – Policy Scales
v95 Which of the following policies are implemented in your district: Students are not allowed to play games on the school computers
Number of restrictive policies relating to technology use scale
v97 Which of the following policies are implemented in your district: Students are not allowed to send email from school computers
v98 Which of the following policies are implemented in your district: Students are not allowed to receive email from school computers
v103 Which of the following policies are implemented in your district: Students are not allowed to bring their own computers or Palms from home
v104 Which of the following policies are implemented in your district: Students are not allowed access to the server
v105 Which of the following policies are implemented in your district: Students are not allowed access to the server from home
Scale created through summing itemsReliability = 0.49
Scale 2 – Personal Use
v116 How many emails do you receive in a given day? Personal use scale
v117R How often do you, as a district leader, regularly email the following people? :Teachers
v118R How often do you, as a district leader, regularly email the following people? : Administrative Staff
v121R How often do you, as a district leader, regularly email the following people? : Principals in your schools
v124 How many years ago, if at all, did you first use computers in the following ways? : Communication with school staff via email
v125 How many years ago, if at all, did you first use computers in the following ways? : For your own work; writing documents, administrative software
v126 How many years ago, if at all, did you first use computers in the following ways? : For your personal activities; personal e-mail,
Variance Explained: 51%Smallest component: 0.548Reliability = 0.81
v119R How often do you, as a district leader, regularly email the following people? : Students Communicating beyond school scale
v120R How often do you, as a district leader, regularly email the following people? : Parents
v127 How many years ago, if at all, did you first use computers in the following ways? : Presentations to school or outside community
Variance Explained: 59%Smallest component: 0.646Reliability = 0.63
v122 How many hours a week do you spend on the internet: Professionally Internet use scale
v123 How many hours a week do you spend on the internet: Personally Variance Explained: 73%Smallest component: 0.855Reliability = 0.62

Rep
ort 1
1 ·
May
200
4Technical Report 75
Scale 3 – Belief Scales
v2 Students interact with each other more while working with computers Technology helps students
v3 Computers help students grasp difficult curricular concepts
v6 Students work harder at their assignments when they use computers Variance Explained: 58%Smallest component: 0.707Reliability = 0.64
v5 Many students use computers to avoid doing more important work Technology harms students
v8 Students are too careless to use technology without close supervision
v4 Computers have weakened students’ research skills
V10 Students access to web encourages plagiarism Variance Explained: 47%Smallest component: 0.579Reliability = 0.74
V13 How valuable are each of the following instructional uses of computers? Developing basic mathematics skills Value of technology for developing basic skills scale
V14 How valuable are each of the following instructional uses of computers? Developing basic reading skills
V15 How valuable are each of the following instructional uses of computers? Preparing students for standardized tests
V16 How valuable are each of the following instructional uses of computers? Drafting text
V21 How valuable for accessing resources via the internet or CD ROM Variance Explained: 57%Smallest component: 0.718Reliability = 0.68
V20 How valuable are each of the following instructional uses of computers? Student presentations Value for developing advanced more advanced skills scale
V22 How valuable are each of the following instructional uses of computers? Exploring mathematical relationships
V23 How valuable are each of the following instructional uses of computers? Graphing and manipulating data
V24 How valuable are each of the following instructional uses of computers? Producing projects
V25 How valuable are each of the following instructional uses of computers? Creating web sites Variance Explained: 53%Smallest component: 0.571Reliability = 0.75
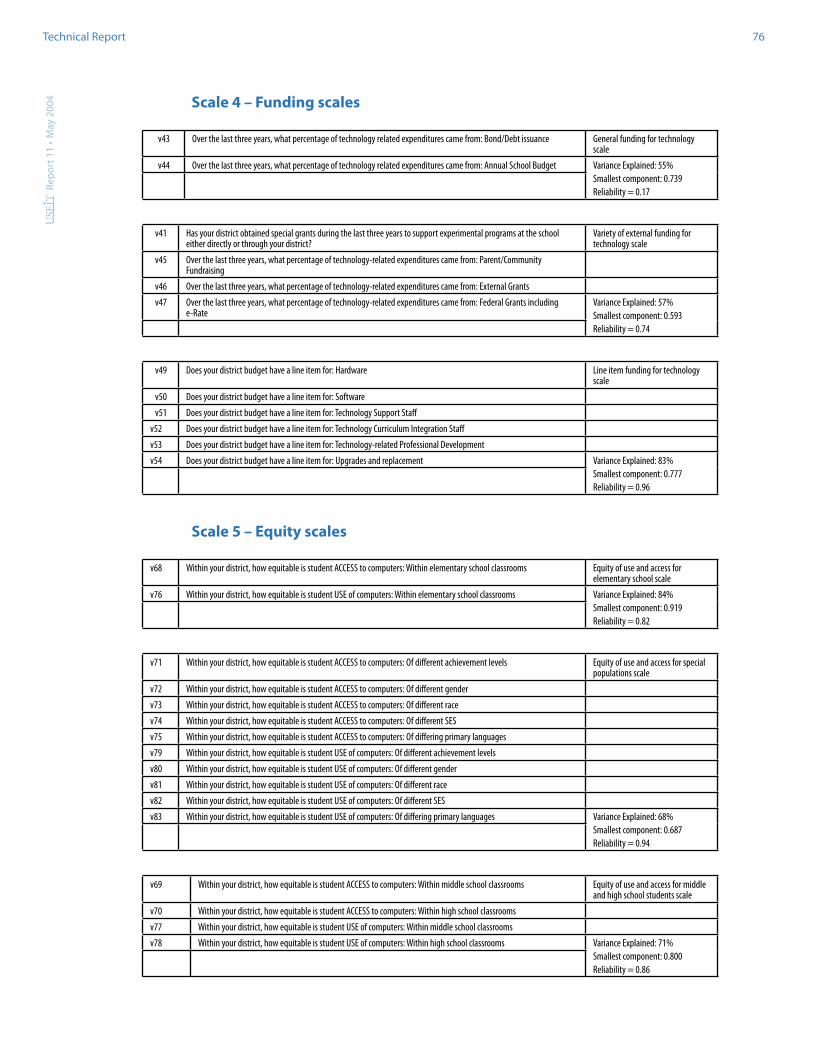
Rep
ort 1
1 ·
May
200
4Technical Report 76
Scale 4 – Funding scales
v43 Over the last three years, what percentage of technology related expenditures came from: Bond/Debt issuance General funding for technology scale
v44 Over the last three years, what percentage of technology related expenditures came from: Annual School Budget Variance Explained: 55%Smallest component: 0.739Reliability = 0.17
v41 Has your district obtained special grants during the last three years to support experimental programs at the school either directly or through your district?
Variety of external funding for technology scale
v45 Over the last three years, what percentage of technology-related expenditures came from: Parent/Community Fundraising
v46 Over the last three years, what percentage of technology-related expenditures came from: External Grants
v47 Over the last three years, what percentage of technology-related expenditures came from: Federal Grants including e-Rate
Variance Explained: 57%Smallest component: 0.593Reliability = 0.74
v49 Does your district budget have a line item for: Hardware Line item funding for technology scale
v50 Does your district budget have a line item for: Software
v51 Does your district budget have a line item for: Technology Support Staff
v52 Does your district budget have a line item for: Technology Curriculum Integration Staff
v53 Does your district budget have a line item for: Technology-related Professional Development
v54 Does your district budget have a line item for: Upgrades and replacement Variance Explained: 83%Smallest component: 0.777Reliability = 0.96
Scale 5 – Equity scales
v68 Within your district, how equitable is student ACCESS to computers: Within elementary school classrooms Equity of use and access for elementary school scale
v76 Within your district, how equitable is student USE of computers: Within elementary school classrooms Variance Explained: 84%Smallest component: 0.919Reliability = 0.82
v71 Within your district, how equitable is student ACCESS to computers: Of different achievement levels Equity of use and access for special populations scale
v72 Within your district, how equitable is student ACCESS to computers: Of different gender
v73 Within your district, how equitable is student ACCESS to computers: Of different race
v74 Within your district, how equitable is student ACCESS to computers: Of different SES
v75 Within your district, how equitable is student ACCESS to computers: Of differing primary languages
v79 Within your district, how equitable is student USE of computers: Of different achievement levels
v80 Within your district, how equitable is student USE of computers: Of different gender
v81 Within your district, how equitable is student USE of computers: Of different race
v82 Within your district, how equitable is student USE of computers: Of different SES
v83 Within your district, how equitable is student USE of computers: Of differing primary languages Variance Explained: 68%Smallest component: 0.687Reliability = 0.94
v69 Within your district, how equitable is student ACCESS to computers: Within middle school classrooms Equity of use and access for middle and high school students scale
v70 Within your district, how equitable is student ACCESS to computers: Within high school classrooms
v77 Within your district, how equitable is student USE of computers: Within middle school classrooms
v78 Within your district, how equitable is student USE of computers: Within high school classrooms Variance Explained: 71%Smallest component: 0.800Reliability = 0.86

Rep
ort 1
1 ·
May
200
4Technical Report 77
Scale 6 – Leadership Scales
v106 To what extent do you, as a district leader, raise issues about technology with the following people (via conversation, formal presentation, school newsletter, etc)? : Parents
Leaders discuss technology scale
v107 To what extent do you, as a district leader, raise issues about technology with the following people (via conversation, formal presentation, school newsletter, etc)? : School board
v108 To what extent do you, as a district leader, raise issues about technology with the following people (via conversation, formal presentation, school newsletter, etc)? : With other district leaders
v109 To what extent do you, as a district leader, raise issues about technology with the following people (via conversation, formal presentation, school newsletter, etc)? : Teachers
v110 To what extent do you, as a district leader, raise issues about technology with the following people (via conversation, formal presentation, school newsletter, etc)? : Principals
v111 To what extent do you, as a district leader, raise issues about technology with the following people (via conversation, formal presentation, school newsletter, etc)? : Your community
Variance Explained: 59%Smallest component: 0.728Reliability = 0.86
v89 To what extent is technology considered when evaluating the principals and curriculum leaders in your district? Evaluations consider technology scale
v90 To what extent is technology considered when evaluating the teachers in your district? Variance Explained: 85%Smallest component: 0.920Reliability = 0.82
Scale 7 – Decision-Making Scales
v26 How much discretion do individual principals in your district have about: Purchasing software Principal’s technology discretion scalev27 How much discretion do individual principals in your district have about: Purchasing hardware
v28 How much discretion do individual principals in your district have about: Allocation of technology in the schools
v29 How much discretion do individual principals in your district have about: Professional development activities Variance Explained: 59%Smallest component: 0.633Reliability = 0.77
Scale 8 – Maturity of Technology Program Scales
v34 In my district, technological resources are regularly updated and replaced Strength of upgrading procedures scalev36 In my district, careful plans have been made for the replacement of obsolete technology on a regular basis
v37 Processes for re-purposing older machines are in place, resulting in the maximum benefit for dollars invested Variance Explained: 67%Smallest component: 0.731Reliability = 0.75
Scale 9 – Professional Development Scales
v134 Which type of professional development does your school tend to focus on? Professional development focuses on integration scale
v135 Which type of professional development would be most useful to your staff? Variance Explained: 58%Smallest component: 0.552Reliability = 0.73
v137 Do you have access to workshops and seminars; run by outside source Variety of technology professional development scaleV138 Do you have access to workshops and seminars; run by district personnel
V139 Do you have access to university or college course work
V140 Do you have access to mentor/colleague
V141 Do you attend conferences
V142 Do you have access to district or school sponsored courses (over several weeks)
V144 Do you have access to online or web-based professional development
V145 Do you have access to one-on-one or group training with technology staff
V146 Do you have access to release time for department or grade level planning related to technology Items summed to create scale
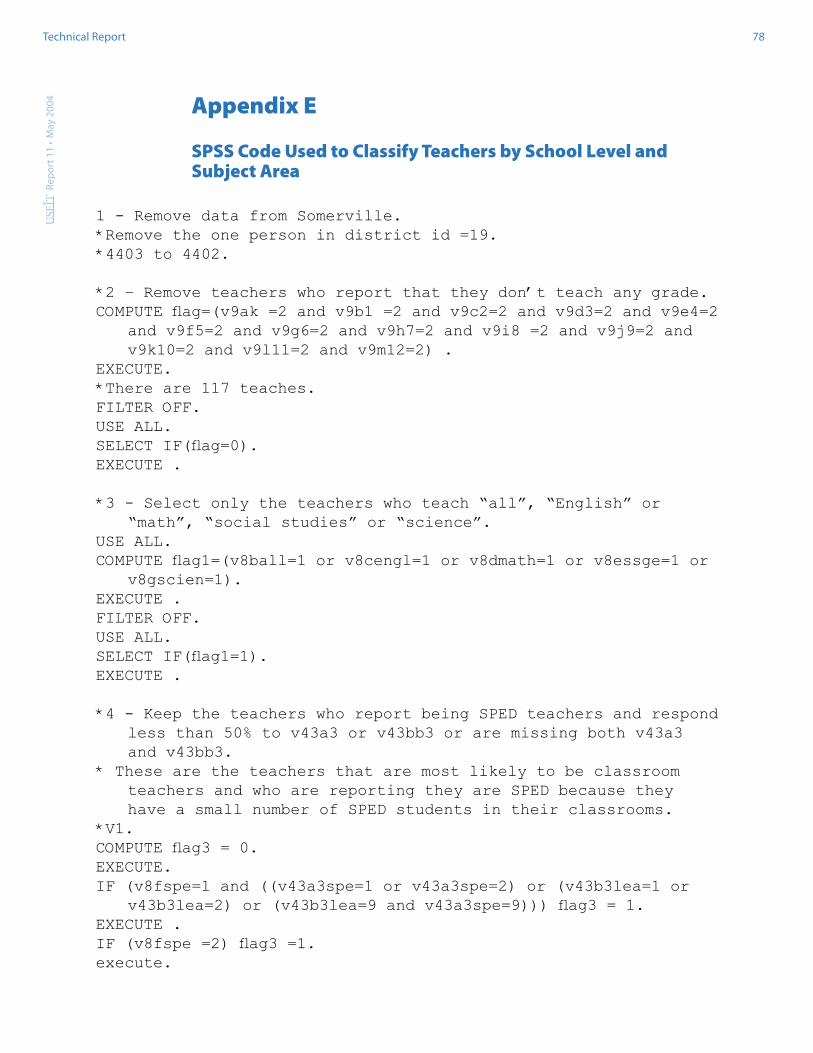
Rep
ort 1
1 ·
May
200
4Technical Report 78
Appendix E
SPSS Code Used to Classify Teachers by School Level and Subject Area
1 - Remove data from Somerville.*Remove the one person in district id =19.*4403 to 4402.
*2 – Remove teachers who report that they don’t teach any grade.COMPUTE flag=(v9ak =2 and v9b1 =2 and v9c2=2 and v9d3=2 and v9e4=2
and v9f5=2 and v9g6=2 and v9h7=2 and v9i8 =2 and v9j9=2 and v9k10=2 and v9l11=2 and v9m12=2) .
EXECUTE.*There are 117 teaches.FILTER OFF.USE ALL.SELECT IF(flag=0).EXECUTE .
*3 - Select only the teachers who teach “all”, “English” or “math”, “social studies” or “science”.
USE ALL.COMPUTE flag1=(v8ball=1 or v8cengl=1 or v8dmath=1 or v8essge=1 or
v8gscien=1).EXECUTE .FILTER OFF.USE ALL.SELECT IF(flag1=1).EXECUTE .
*4 - Keep the teachers who report being SPED teachers and respond less than 50% to v43a3 or v43bb3 or are missing both v43a3 and v43bb3.
* These are the teachers that are most likely to be classroom teachers and who are reporting they are SPED because they have a small number of SPED students in their classrooms.
*V1.COMPUTE flag3 = 0.EXECUTE.IF (v8fspe=1 and ((v43a3spe=1 or v43a3spe=2) or (v43b3lea=1 or
v43b3lea=2) or (v43b3lea=9 and v43a3spe=9))) flag3 = 1.EXECUTE .IF (v8fspe =2) flag3 =1.execute.

Rep
ort 1
1 ·
May
200
4Technical Report 79
FILTER OFF.USE ALL.SELECT IF(flag3=1).EXECUTE .
*5 – Remove teachers who report they teach out of their school classification.
*Step 1.*Create school classification.*Always lower level up to grade 5.IF ((v9ak=1 or v9b1=1 or v9c2=1 or v9d3=1 or v9e4=1 or v9f5=1)
and (notesfla=’pk-k’ or notesfla=’1-5’ or notesfla=’6-8’ or notesfla=’2-4’ or notesfla=’2-5’ or notesfla=’2-6’ or notesfla=’3-5’ or notesfla=’4-8’ or notesfla=’k-2’ or notesfla=’k-4’ or notesfla=’k-5’ or notesfla=’k-6’ or notesfla=’k-8’ or notesfla=’pk-1’ or notesfla=’pk-2’ or notesfla=’pk-3’ or notesfla=’pk-5’)) tlevel = 1 .
VARIABLE LABELS tlevel ‘Level based on teacher’.EXECUTE .*Always middle level.IF ((v9g6=1 or v9h7=1 or v9i8=1) and (notesfla=’5-8’ or
notesfla=’7-8’ or notesfla=’4-8’ or notesfla=’k-8’ or notesfla=’6-8’)) tlevel = 2 .
VARIABLE LABELS tlevel ‘Level based on teacher’.EXECUTE .*Always upper level.IF ((v9j9=1 or v9k10=1 or v9l11=1 or v9m12=1) and (notesfla=’7-12’
or notesfla=’9-11’ or notesfla=’9-12’)) tlevel = 3 .VARIABLE LABELS tlevel ‘Level based on teacher’.EXECUTE .*Grade 6 exception 1.IF ((v9g6=1) and (notesfla=’2-6’ or notesfla=’k-6’)) tlevel = 1 .VARIABLE LABELS tlevel ‘Level based on teacher’ .EXECUTE .*Grade 6 exception 2.IF ((v9g6=1) and (notesfla=’4-8’or notesfla=’k-8’)) tlevel = 2 .VARIABLE LABELS tlevel ‘Level based on teacher’.EXECUTE .*Grade 7 and 8 exeception.IF ((v9h7=1 or v9i8=1) and (notesfla=’7-12’)) tlevel = 2 .VARIABLE LABELS tlevel ‘Level based on teacher’ .EXECUTE .*Step 2.COMPUTE new1=0.EXECUTE.IF (tlevel=1 and (notesfla=’9-12’ or notesfla=’7-12’ or notesfla=’9-
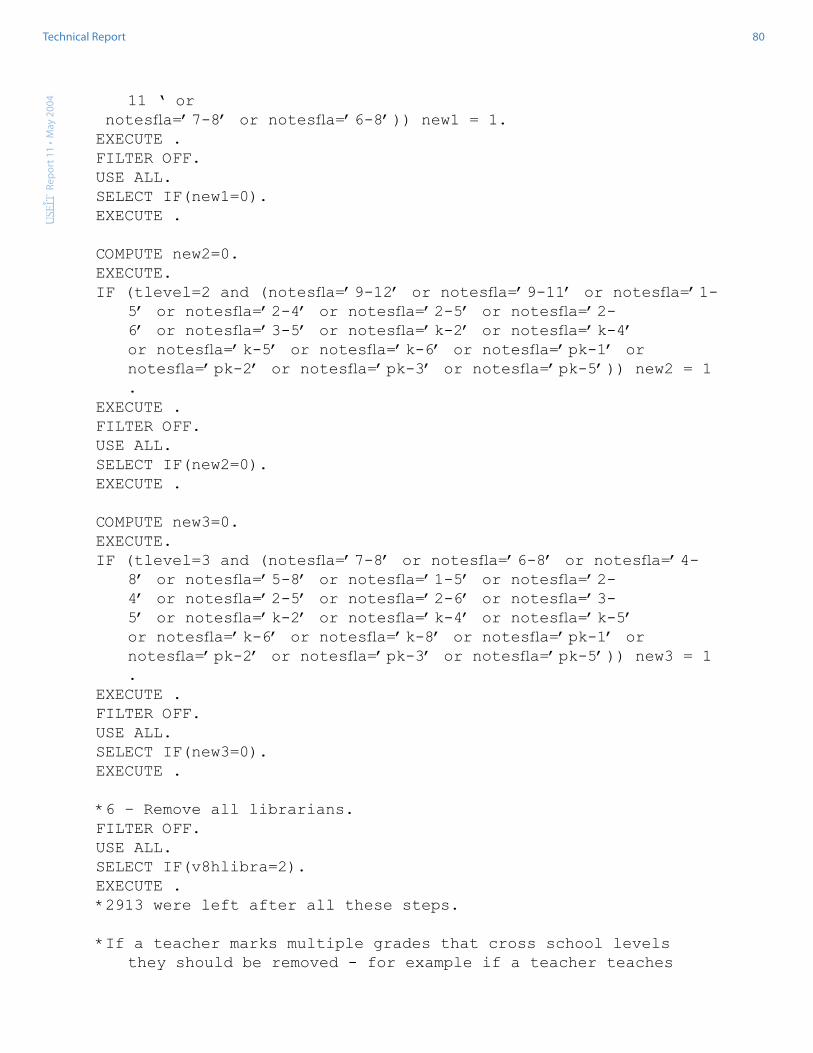
Rep
ort 1
1 ·
May
200
4Technical Report 80
11 ‘ or notesfla=’7-8’ or notesfla=’6-8’)) new1 = 1.EXECUTE .FILTER OFF.USE ALL.SELECT IF(new1=0).EXECUTE .
COMPUTE new2=0.EXECUTE.IF (tlevel=2 and (notesfla=’9-12’ or notesfla=’9-11’ or notesfla=’1-
5’ or notesfla=’2-4’ or notesfla=’2-5’ or notesfla=’2-6’ or notesfla=’3-5’ or notesfla=’k-2’ or notesfla=’k-4’ or notesfla=’k-5’ or notesfla=’k-6’ or notesfla=’pk-1’ or notesfla=’pk-2’ or notesfla=’pk-3’ or notesfla=’pk-5’)) new2 = 1 .
EXECUTE .FILTER OFF.USE ALL.SELECT IF(new2=0).EXECUTE .
COMPUTE new3=0.EXECUTE.IF (tlevel=3 and (notesfla=’7-8’ or notesfla=’6-8’ or notesfla=’4-
8’ or notesfla=’5-8’ or notesfla=’1-5’ or notesfla=’2-4’ or notesfla=’2-5’ or notesfla=’2-6’ or notesfla=’3-5’ or notesfla=’k-2’ or notesfla=’k-4’ or notesfla=’k-5’ or notesfla=’k-6’ or notesfla=’k-8’ or notesfla=’pk-1’ or notesfla=’pk-2’ or notesfla=’pk-3’ or notesfla=’pk-5’)) new3 = 1 .
EXECUTE .FILTER OFF.USE ALL.SELECT IF(new3=0).EXECUTE .
*6 – Remove all librarians.FILTER OFF.USE ALL.SELECT IF(v8hlibra=2).EXECUTE .*2913 were left after all these steps.
*If a teacher marks multiple grades that cross school levels they should be removed - for example if a teacher teaches
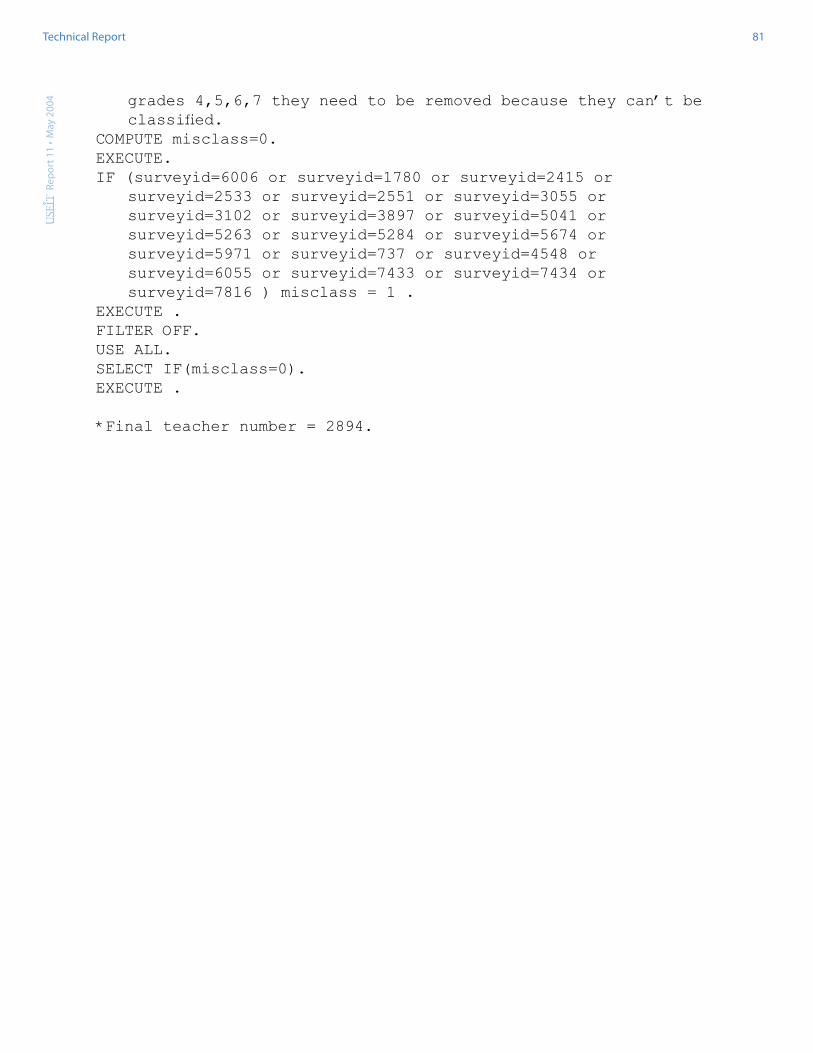
Rep
ort 1
1 ·
May
200
4Technical Report 81
grades 4,5,6,7 they need to be removed because they can’t be classified.
COMPUTE misclass=0.EXECUTE.IF (surveyid=6006 or surveyid=1780 or surveyid=2415 or
surveyid=2533 or surveyid=2551 or surveyid=3055 or surveyid=3102 or surveyid=3897 or surveyid=5041 or surveyid=5263 or surveyid=5284 or surveyid=5674 or surveyid=5971 or surveyid=737 or surveyid=4548 or surveyid=6055 or surveyid=7433 or surveyid=7434 or surveyid=7816 ) misclass = 1 .
EXECUTE .FILTER OFF.USE ALL.SELECT IF(misclass=0).EXECUTE .
*Final teacher number = 2894.

inTASC is a not-for-profit research group that works col-laboratively with schools, educational agencies, and businesses to conduct research and development on a variety of issues related to technology and assessment. inTASC brings together researchers who have examined several aspects of technology and assessment in schools over the past decade to focus on new questions and issues that arise from the field. inTASC is unique in that it does not develop research studies and then seek schools to participate in research activities. Instead, schools, education-al agencies, and businesses approach inTASC with their own ideas and/or questions that require systematic research to ad-dress. Research conducted by inTASC is developed, conducted, and often disseminated in collaboration with our educational and business partners.
inTASC believes that advances in educational technology and continuously emerging applications of those technologies coupled with growing demands to document impacts on teach-ing and learning requires a dual focus on instructional uses of technology and applications of technology to new forms of assessment. For this reason, inTASC collaborates on research that focuses on instructional uses of technology and on appli-cations of computer-based technologies to the technology of testing and assessment. It is our hope that this dual focus will enable us to provide research-based information to schools and educational leaders about the impacts of educational technol-ogy, and to produce new forms of assessment that capitalize on the powers of computer-based technologies and that are more sensitive to the types of learning enabled by educational technologies.
Use, Support, and Effect of Instructional Technology Study
www.intasc.org