report documentation page - dtic.mil · ruedi abersold & matthias mann wrote an excellent...
TRANSCRIPT

AFRL-RH-BR-TR-2007-0067
RADIATION BIOMARKER RESEARCH USING MASS SPECTROMETRY
Stephan Bach University of Texas at San Antonio
Dr. Walter Hubert
Air Force Research Laboratory
HUMAN EFFECTIVENSS DIRECTORATE DIRECTED ENERGY BIOEFFECTS DIVISION
JULY 2007
Air Force Research Laboratory
Human Effectiveness Directorate Radio Frequency Radiation Branch Brooks-City-Base, TX 78235
Approved for public release 07-332, 15 Oct 07, distribution is unlimited.
NOTICE AND SIGNATURE PAGE
Using Government drawings, specifications, or other data included in this document for any purpose other than Government procurement does not in any way obligate the U.S. Government. The fact that the Government formulated or supplied the drawings, specifications, or other data does not license the holder or any other person or corporation; or convey any rights or permission to manufacture, use, or sell any patented invention that may relate to them. This report was cleared for public release by the Air Force Research Laboratory, Brooks City-Base, Public Affairs Office and is available to the general public, including foreign nationals. Copies may be obtained from the Defense Technical Information Center (DTIC) (http://www.dtic.mil). AFRL-RH-BR-2007-0067 HAS BEEN REVIEWED AND IS APPROVED FOR PUBLICATION IN ACCORDANCE WITH ASSIGNED DISTRIBUTION STATEMENT. //SIGNED// WALTER G. HUBERT, DR‐II, DAF Technical Monitor //SIGNED// GARRETT D. POLHAMUS, DR‐IV, DAF Chief, Directed Energy Bioeffects Division This report is published in the interest of scientific and technical information exchange, and its publication does not constitute the Government’s approval or disapproval of its ideas or findings.

Form Approved
REPORT DOCUMENTATION PAGE OMB No. 0704-0188 Public reporting burden for this collection of information is estimated to average 1 hour per response, including the time for reviewing instructions, searching existing data sources, gathering and maintaining the data needed, and completing and reviewing this collection of information. Send comments regarding this burden estimate or any other aspect of this collection of information, including suggestions for reducing this burden to Department of Defense, Washington Headquarters Services, Directorate for Information Operations and Reports (0704-0188), 1215 Jefferson Davis Highway, Suite 1204, Arlington, VA 22202-4302. Respondents should be aware that notwithstanding any other provision of law, no person shall be subject to any penalty for failing to comply with a collection of information if it does not display a currently valid OMB control number. PLEASE DO NOT RETURN YOUR FORM TO THE ABOVE ADDRESS.
3. DATES COVERED 1. REPORT DATE (DD-MM-YYYY) 2. REPORT TYPE25-07-2007 Final Technical Report 07-07-2005- 12-29-20064. TITLE AND SUBTITLE
5a. CONTRACT NUMBER FA8650-05-1-6642
Radiation Biomarker Research Using Mass Spectrometry 5b. GRANT NUMBER BAA05-06-HE
5c. PROGRAM ELEMENT NUMBER F41624
6. AUTHOR(S) Bach, Stephan B.H.
5d. PROJECT NUMBER F1JBAN5139B002
5e. TASK NUMBER N/A
5f. WORK UNIT NUMBER 7757B349
7. PERFORMING ORGANIZATION NAME(S) AND ADDRESS(ES) 8. PERFORMING ORGANIZATION REPORT NUMBER
University of Texas at San Antonio Department of Chemistry One UTSA Circle San Antonio, TX 78249-1644
UTSA0001Z
9. SPONSORING / MONITORING AGENCY NAME(S) AND ADDRESS(ES) 10. SPONSOR/MONITOR’S ACRONYM(S)Air Force Materiel Command AFRL/RHDR Air Force Research Laboratory Human Effectiveness Directorate Information
Radiofrequency Radiation Branch 11. SPONSOR/MONITOR’S REPORT 8262 Hawks Road NUMBER(S)Brooks City-Base, TX 78235-5147 AFRL-RH-BR-TR-2007-0067 12. DISTRIBUTION / AVAILABILITY STATEMENT Approved for public release: distribution unlimited. PA #07-332, 15 Oct 2007
13. SUPPLEMENTARY NOTES Distribution Unlimited (A)
14. ABSTRACT Using mass spectrometry to investigate biomarkers from radiation exposure is fairly new. The implementation of mass spectrometric techniques to systems of biological interest has only recently taken off. Therefore, there have only been a limited number of applications of mass spectrometry in radiation dosimetry research. This review is intended to give an overview of mass spectrometry and its application to biological systems and biomarker discovery and how that might relate to relevant radiation dosimetry studies and how these two areas might be combined to benefit both areas of research. Efficient proteomics analyses have necessitated the use of various methods of mass spectrometry in recent years; especially concerning biomarker detection and characterization. A brief summary of the research thus far conducted follows.
15. SUBJECT TERMSProteomics, Mass Spectrometry, Saliva, Radiation
16. SECURITY CLASSIFICATION OF: 17. LIMITATION 18. NUMBER OF PAGES
19a. NAME OF RESPONSIBLE PERSONWalter G. Hubert OF ABSTRACT
a. REPORT b. ABSTRACT c. THIS PAGE 19b. TELEPHONE NUMBER (include area code)
Unclassified Unclassified Unclassified SAR 27
Standard Form 298 (Rev. 8-98)Prescribed by ANSI Std. Z39.18

This page intentionally left blank
iDistribution A – Approved for Public Release

Table of contents Abstract .......................................................................................................................................... iii List of Figures .................................................................................................................................ivIntroduction ......................................................................................................................................1Implementation.................................................................................................................................2Dosimetry studies.............................................................................................................................3Mass Spectrometry of Radiation Biomarkers ..................................................................................4Radiation Biomarkers at UTSA .......................................................................................................4Saliva Proteome Research................................................................................................................5
Introduction ..................................................................................................................................5Experimental Procedures..............................................................................................................7Results ..........................................................................................................................................8Discussion ..................................................................................................................................18
References ......................................................................................................................................19
ii Distribution A – Approved for Public Release

Abstract Over 250 references are listed on SciFinder Scholar when searched for radiation biomarkers.1 Less than 5% of those articles deal with mass spectrometry. This indicates an important area of research that still needs to be explored Using mass spectrometry to investigate biomarkers from radiation exposure is fairly new. The implementation of mass spectrometric techniques to systems of biological interest has only recently taken off. Therefore, there have only been a limited number of applications of mass spectrometry in radiation dosimetry research. This review is intended to give an overview of mass spectrometry and its application to biological systems and biomarker discovery and how that might relate to relevant radiation dosimetry studies and how these two areas might be combined to benefit both areas of research. Efficient proteomics analyses have necessitated the use of various methods of mass spectrometry in recent years; especially concerning biomarker detection and characterization. A brief summary of the research thus far conducted follows.
iii Distribution A – Approved for Public Release

Figures Figure 1. Saliva sample 1. Low mass range MALDI-TOF m/z 1000 to 3000 ................. 9
Figure 2. Saliva sample 2. Low mass range MALDI-TOF m/z 1000 to 3000 ................. 9
Figure 3. Saliva sample 3. Low mass range MALDI-TOF m/z 1000 to 3000 ............... 10
Figure 4. Saliva sample 4. Low mass range MALDI-TOF m/z 1000 to 3000 ............... 10
Figure 5. Saliva sample 5. Low mass range MALDI-TOF m/z 1000 to 3000 ............... 11
Figure 6. Saliva sample 1. Mid mass range MALDI-TOF m/z 2000 to 10,000............. 11
Figure 7. Saliva sample 2. Mid mass range MALDI-TOF m/z 2000 to 10,000............. 12
Figure 8. Saliva sample 3. Mid mass range MALDI-TOF m/z 2000 to 10,000............. 13
Figure 9. Saliva sample 4. Mid mass range MALDI-TOF m/z 2000 to 10,000............. 13
Figure 10. Saliva sample 5. Mid mass range MALDI-TOF m/z 2000 to 10,000........... 13
Figure 11. Saliva sample 1. High mass range MALDI TOF m/z 5000 to 50,000........... 14
Figure 12. Saliva sample 2. High mass range MALDI TOF m/z 5000 to 50,000........... 14
Figure 13. Saliva sample 3. High mass range MALDI TOF m/z 5000 to 50,000........... 15
Figure 14. Saliva sample 4. High mass range MALDI TOF m/z 5000 to 50,000........... 15
Figure 15. Saliva sample 5. High mass range MALDI TOF m/z 5000 to 50,000........... 16
iv Distribution A – Approved for Public Release

Introduction Over 250 references are listed on SciFinder Scholar when searched for radiation biomarkers.2 Less than 5% of those articles deal with mass spectrometry. This indicates an important area of research that still needs to be explored Ruedi Abersold & Matthias Mann wrote an excellent primer3 on the subject of proteomics in general. This paper covered each major method’s advantages, basic instrumentation theory, and also a guide to selection of the proper method for the beginner. Careri and Mangia4 identified the need for proper methods for maintaining precision. They proposed a standardization of practices to include consideration of all possible errors, since so many analytical methods are possible, each with their own strengths and weaknesses. Devoting their efforts to instrumentation, Fortier et al5 designed a new microfluidic device to greatly enhance proteomic analyses. This apparatus significantly reduces postcolumn peak broadening and eliminates unnecessary deadspace volumes when performing liquid chromatography. Following the experiment, the data must be analyzed. Frewen et al6 proposed the use of spectral databases to characterize the results of MS/MS peptide spectra with excellent identification and sequencing accuracy. Their technique involved using a dot product similarity analysis to known compounds in existing databases. Since the field of proteomics is large indeed, Barbara Marte7 contemplated the many aspects in a short overview of the subject. This essay informs the reader of difficulties in the field, and also some new advances. Reyzer and Caprioli8 reviewed the present trends of MALDI analysis of tissue sections and wrote a general guide for sample preparation and analysis. Imaging of protein content is also covered in this work. Further refining analytical resources, Rudnick et al9 thoroughly analyzed the behavior of the MASCOT search algorithm in an effort to boost characterization accuracy. Their efforts greatly reduced false positive and false negative identifications. Bernd Simoneit10 wrote a thorough review of current MS applications for biomarker detection in the environmental / geological field. Microbial, plant, and other biomarkers are discussed within, along with the most effective techniques for analyses. Combining methods can be most effective, as Taylor11 discovered using LC/ESI/MS allowing them to identify very complex peptides and also biomarkers. This approach also affords the ability to quantize simultaneously while identifying peptides. Tu et al12 used immobilized pH gradient / isoelectric focus (IPG-IEF) technique followed by electrospray-linear ion trap MS/MS. This approach, upon trypsin digest of the proteins contained on the gel sections, gave them the ability to detect more than 700 human proteins on a gel with only 300 µg of sample. Mike Tyers & Matthias Mann13 (also of the Abersold paper1) wrote an in-depth analysis of the progress of proteomics’ various facets, and proposed necessary
Distribution A – Approved for Public Release
1

advances for the field to mature. The existence of large data resources, free distribution of results, and cooperation of international efforts are all necessary events to achieve this. Vitzthum et al14 investigated the development of in-vitro diagnostics, and established guidelines for efficient design and implementation. These guidelines maintain that the IVD (in-vitro diagnostic) should be reliable, accurate, and highly selective to achieve optimum results. Vlahou and Fountoulakis15 wrote a review of many different approaches in the search for disease biomarkers using electrophoresis and MS techniques. Wang et al16 discovered that the comparison of proteomic datasets afforded discovery of metastatic cancer marking proteins using their novel algorithms.
Implementation Alaiya et al17 investigated novel methods of detecting tumor-derived proteins. This comprehensive paper also warns of common pitfalls of biomarker analyses. Gerd Assmann18 chose HDL (high density lipoprotein) detection. Known as the “good cholesterol,” its known anticoronary episodic properties can provide an excellent diagnostic tool to assess coronary health. Dalle-Donne et al19 investigated in-depth the phenomenon of oxidative/nitrosative stress and its effect on proteins. They found that such altered proteins serve as efficient biomarkers for Alzheimer’s, Lou Gehrig’s, asthma, and others. Dong et al20 created a GCMS method for analyzing acetone in blood; an indicator of diabetes. Their novel method consists of reaction of the acetone with a derivatization agent followed by GC/MS detection. This method allows for rapid determination of acetone levels without a complicated extraction process from the blood sample. Ferdinandy and Schulz21 reviewed the significance of nitric oxide, superoxide and peroxynitrite concentrations in the body. Excess peroxynitrite can cause myocardial ischaemia (restriction of blood flow to areas of the heart causing tissue death). This may serve as an excellent biomarker in the future to predict this deadly but common disorder. Hewavitharana et al22 encountered target compound loss subsequent to sample protein removal. A new, similarly structured internal standard was used, but loss still occurred. This was deemed to be caused most likely by the standards themselves binding to the proteins before removal. Hoos et al23 created a new method for quantitative analysis of bioproteins in solution using immunoaffinity chromatography, protein digestion, and finally LC/MS. This approach is best suited for determinations of proteins in their biological contexts; in this work, the authors give diluted human plasma as an example of a typical context. Hoos et al were successful in automating this process as well. Im et al24 analyzed formaldehyde exposure effects in rats using MALDI/TOF, and also verified 7 proteins that could be definitive human biomarkers for excessive
Distribution A – Approved for Public Release
2

formaldehyde exposure. This project’s successful results can be applied to monitoring formaldehyde exposure in humans, leading to “sick building syndrome [22]”. Ma et al25 investigated a new technique for breath analysis of VOC content using MESI (membrane extraction with sorbent interface) that could be used to monitor acetone levels in diabetic patients via a non-invasive approach. MESI was chosen for its inherent selectivity and stability over current methods. Neyraud26 analyzed both whole and parotid saliva composition following stimulation of the subjects with different tastes (sweet, bland, sour, acid) using trypsin digests and MALDI analyses. They discovered that two known proteins, calgranulin A and Annexin A1 were nearly absent in parotid saliva, indicating that they most likely originate from other oral tissues. Suriano et al27 used SELDI/TOF analyses of thyroid biopsies to identify potential biomarkers for thyroid cancer. Since malignant as well as benign tumors respond similarly subsequent to staining, this project aims to detect more efficient biomarkers to afford accurate diagnoses. Wagner et al28 used constant-neutral loss on a linear ion trap to discover biomarkers in human urine. This approach was tested using acetaminophen administered to test subjects, and the resulting marker (mercapturic acid) was identified with high precision, allowing quantitative analysis of the marker. Yan et al29 studied the detection of N-terminally acetylated thymosin β4, a suspected cancer biomarker, using ion trap tandem MS. This method yielded the ability to detect thymosin β4 at the whole protein stage rather than at post-peptide digest.
Dosimetry studies Brooks City-Base (formerly Air Force Base) has been the site of many dosimetry studies of varying subjects. Patrick Mason’s team conducted many projects in this area; the first of which investigated the effects of 94 GHz radiation exposure on human volunteers.30 This study discovered a significant relationship between cutaneous blood flow and skin heating rates upon irradiation. They31 also determined that 94 GHz radiation did not have any appreciable effect on animal papilloma development. A later paper30 investigated this subject further by using high and low power emissions: the findings were similar in that skin blood flow changes may greatly alter rates of heating upon exposure. In the next project32, high-power pulsed microwave radiation was used on microbes, and the effects were noted similar to short-duration high temperature events. Mason and coworkers33 examined millimeter wavelength radiation (30 to 300 GHz) and its potential for accidental overexposure; including short and long term effects. A review paper34 was also published on such radiofrequency fields and their possible carcinogenic, mutagenic, and genotoxic effects. This project found, however, that according to the majority of papers published RF field exposure is not necessarily carcinogenetic, as is commonly alleged by popular myth.
Distribution A – Approved for Public Release
3

William Hurt’s group35 also focused on RF exposure at 220 MHz. The main thrust of this experiment was to provide a complete mapping of the exposure set-up and to provide accurate dosimetry of the volunteers. The next project36 involved 100 MHz RF with similar determination of accurate dosimetry. J. M. Muderwha et al37 researched development of a multiparametric radiation biodosimetry system for applications ranging from medical personnel to spaceflight. Muderwha’s colleague on that project, P. G. Prasanna, also worked on developing a computer application to determine total dose following radiation accidents.38 This software package would allow management of the massive amounts of casualty data, including dosimetry and location at the time of incident to trace radiation patterns.
Mass Spectrometry of Radiation Biomarkers Ménard and coworkers39 have recently investigated the applicability of discovering clinical biomarkers of ionizing radiation using serum proteomic analysis. They used surface enhanced laser desorption ionization (SELDI) coupled with a high resolution time-of-flight (TOF) mass spectrometer to analyze 68 patient samples. The patients had a wide variety of diagnosis. This resulted in a wide variety of radiation exposures. Their results demonstrated the ability of the technique to distinguish between high and low dose radiation exposure. Computer modeling of the data enabled them to distinguish exposed from unexposed patient samples with 91% to 100% sensitivity. Their comment underscores our view that “Proteomic analysis for the discovery of clinical biomarkers of radiation exposure warrants further study”.39 Ravant’s group at DFRMC/SCIB in Grenoble, France have used mass spectrometry to investigate a variety of radiation induced biomarkers.40-43 They used HPLC coupled with tandem mass spectrometry to investigate the radiation-induced base damage to isolated and cellular DNA.40 A variety of bases were identified as resulting from radiation damage. The simultaneous determination of several base degradation products enables patterns to be discerned from the lesions. This can provide valuable mechanistic information regarding the formation of these radiation produced products. Cadet et al found that using HPLC and MS/MS in the multiple reaction monitoring mode was a sensitive method for singling our individual oxidized nucleosides.41 They did a follow-on study examining aerated aqueous solutions of DNA that were exposed to ionizing radiation. The DNA was subsequently digested to nucleosides with a combination of endo- and exo nucleases. Four new lesions were found to be significantly generated.
Radiation Biomarkers at UTSA The mass spectrometry group at the University of Texas at San Antonio analyzed a number of samples. The quality of some of the samples was suspect because of the poor quality of the data. All were mouse plasma. Seven of the samples
Distribution A – Approved for Public Release
4

were microwave exposed mice, the other seven were sham. The samples were prepared by acid precipitation of abundant proteins (0.1% acetic acid). They were then spun through a 10KDa cutoff filter in order to isolate the peptides. The samples were then desalted by washing them over a C18 spin column using 0.05% TFA as an ion-pairing reagent. The samples were then spotted onto a 200µ Anchorchip with 1:1 saturated HCCA matrix in ethanol. The samples were then analyzed by MALDI-TOF (750-9000 m/z, 300 shots per spot avg.) The spectra were extremely noisy and complex. The data was of insufficient quality to obtain definitive biomarkers. Trips were also made to AFRL/HEDR at Brooks City Base to assist with their sample analysis using the Finnigan LTQ located there. Mr. Mullens and Ms. Nagore assisted with training personnel at AFRL/HEDR and when necessary with the operation of the LTQ. Five saliva samples from AFRL/HEDR were also analyzed at UTSA. The results are presented below. No background was given for these samples so just the raw results are presented for further interpretation.
Saliva Proteome Research
Introduction The salivary proteome, the collection of proteins found in saliva, is a rich source of information that can be used to clinically assay health and physiological status. Specifically, samples of blood, saliva, hair or other readily sampled tissues, obtained from different human populations can be compared to identify chemical components associated with a particular disease or change in physiological state. Components identified through comparative analysis of composition are termed biomarkers. A major impediment to the identification of biomarkers is their low abundance compared to other components of similar chemical composition, i.e. proteins and peptides. For example, in plasma, 2 proteins (albumin and IgG) make up approximately 70% of the total weight of all proteins present.44 In saliva, and other tissues, a small number of proteins tend to dominate as well. These common, non-biomarker proteins, complicate analysis by causing reduction of sensitivity (peak suppression) in direct mass spectrometry based methods including MALDI/MS and distortion of migration and low abundance spot suppression during 2-dimensional gel electrophoresis. There are several remedies that can reduce or eliminate the impact of common proteins and peptides on biomarker discoveries. First, a sample can be passed through a column to which specific antibodies directed against the most common proteins have been attached to the stationary phase.44 For plasma, these columns have proven effective at improving the detection sensitivity for proteins and peptides present in low abundance and thus increasing the number of biomarkers found during discovery. For saliva, these columns do not yet exist.
Distribution A – Approved for Public Release
5

Another remedy is to bind chemically distinct subsets of the biological sample to a stationary phase. For example, relatively lipophilic proteins and peptides may be bound to a stationary C-18 or C-8 phase whereas other proteins, including highly abundant hydrophilic proteins and peptides, remain in mobile phase. In practice this can be accomplished by using magnetic beads coated with a defined chemical matrix to capture specific chemical classes, eluting with the captured components with a buffer. Because the complexity of the sample is relatively low, the eluted peptides and proteins are ideally suited for MALDI/MS based biomarker discovery. MALDI/MS methods have several advantages over other methods and include high-throughput capability and ease of automation. There is a growing interest in using a saliva matrix for clinical diagnostic testing. This is due to the non-invasive sample collection and lower cost of collection and storage compared to serum. Saliva represents an important source of diagnostic biomarkers. Its composition correlates with many proteins found in serum that have been shown to be informative in determining disease susceptibility and progression. For instance gamma-glutamyl-transferase (GGT) and β2-microglobulin (β2m) were both quantified in a study of Sjögren syndrome by Jimenez-Alonso et al.45 Using an enzyme immunoassay both GGT and β2m could be detected in saliva and serum. Another marker that has been studied in saliva and serum is estradiol. Tivis et al46 collected samples from postmenopausal women to decide if saliva could be used instead of serum in quantitative analysis using estradiol radioimmunoassay kits. Estradiol has been found to correlate with endocrine function, coronary artery disease, and breast cancer. It was concluded that estradiol could only be accurately detected in women that underwent estrogen therapy otherwise estradiol levels were too low. There are however biomarkers that do not have these restrictions such as cortisol. Cortisol is known to increase in concentration during exercise. In past years cortisol has been measured in serum and saliva using radioimmunoassay. Gozansky et al47 showed that by using an enzyme immunoassay, serum and saliva had cortisol at detectable limits and gave complementary results. Saliva is secreted in the mouth from three major glands (parotid, submandibular, and subliqual) and is composed of water, electrolytes, proteins, enzymes, and mucins.48 A major fraction of the salivary proteome is proline rich proteins (PRP). Basic PRPs are known to be secreted mainly from the parotid gland whereas acidic PRP along with lysozymes, histatins, and statherin are secreted from the submandibular and parotid glands.49 Cystatins are only secreted from the submandibular gland. Mucins, along with other salivary proteins, aggregate into high molecular weight glycoproteins making saliva difficult to analyze directly using mass spectrometry.50 Currently, the saliva proteome is predominately studied using two-dimensional gel electrophoresis as a separation technique and mass spectrometry to identify proteins. However, there are many limitations to this method including the inability to identify large or small molecular weight proteins, as well as, highly
Distribution A – Approved for Public Release
6

acidic, highly basic, or hydrophobic proteins from the same sample.51 There are also limits in detection due to staining methods that only have a dynamic range of about three to four order of magnitude in mass and concentration. Owing to these shortfalls in current two-dimensional gel technology, we began to investigate other methods for salivary biomarker identification. Using magnetic bead sample preparation techniques with saliva samples and matrix-assisted laser desorption ionization time-of-flight mass spectrometry (MALDI-TOF-MS), we have been able to reproducibly generate mass spectrometric protein profiles that can be used for biomarker discovery.52, 53 Not only are the magnetic beads used to reduce the sample complexity, they also remove many of the salts, buffers, and detergents that hinder mass spectrometric analysis. The magnetic beads also aide in concentrating the peptide/proteins of interest.
Experimental Procedures Equipment
Mass spectrometric data was obtained by using a Reflex III MALDI-TOF (Bruker Daltonics, Billerica, MA). MALDI-TOF spectra were acquired in linear mode with a pulsed nitrogen laser (337nm) with a pulse rate of 10 Hz. Ion source 1 was set to 20 kV, Ion source 2 was set to 18.5 kV and the lens was set to 7 kV. 1000 scans were averaged for each sample to improve spectral quality. Peptide/protein peaks were measured in three different sets, 1000-3000 Da, 3000-10,000 Da, and 5000-20,000 Da. A fixed laser power of 65% was used with all mass ranges. Instrument control was carried out by using FlexControl software (version 1.0, Bruker Daltonics, Billerica, MA) and data processing was carried out using FlexAnalysis (version 2.2, Bruker Daltonics, Billerica, MA). Clinical saliva samples - Basic collection method Saliva is collected using a Saliva Sampler (Saliva Diagnostic Systems, Inc., Medford, NY) which consists of an absorbent pad and a preservative transport buffer solution. The absorbent pad was placed under the tongue until the pad was saturated and the white indicator turned blue. The pad is placed in the collection tube with buffer and the sample is extracted through a porous plastic filter. Saliva was immediately mixed with protease inhibitor that was supplied with the absorbent pad to preserve the sample protein composition. This is necessary in order to have a protein solution compatible with available data analysis software and also have accurate comparisons between samples. The samples are aliquoted into tubes and stored at -80 ºC. Clinical saliva samples - Alternative collection method Alternatively, unstimulated saliva is collected directly into 50 mL conical centrifuge tubes on ice and vortexed briefly. 1 mL of the sample is combined with
Distribution A – Approved for Public Release
7

0.5 μL of 10X protease inhibitor cocktail (Sigma, cat. # P2714), vortexed for 1 minute, and stored at -80 ºC. After thawing, 500 μL of treated sample is transferred to a fresh microcentrifuge tube containing 500 μL of 0.23% TFA (Aldrich, 99% purity, cat. # 10,623-2) and vortexed again for 1 minute. Following centrifugation at 13.5 KRPM for 10 minutes, 800 μL of supernate is transferred to a fresh tube, used for further analysis, or stored at -80 ºC. Saliva sample preparation - Magnetic bead method To enrich for proteins and peptides and to remove buffers and salts, a C-18 (MB-C18, 223325) magnetic bead profiling kit from Bruker Daltonics, Billerica, MA is used. 15 µL of precleared saliva is mixed with 10 µL magnetic beads and 10 µL binding solution in a standard thin wall PCR tube and incubated for five minutes at room temperature. Tubes are placed in a magnetic bead separator (Bruker, 65602) and supernates are pipetted out. Tubes are removed from the magnetic bead separator and 100 µL of the Bruker washing solution is added to the magnetic beads, mixed thoroughly, and placed back into the magnetic bead separator. Again, supernates are pipetted out and disposed of to ensure that all salts, buffers, and detergents are removed from the sample. The washing procedure is repeated twice. Finally, 5µL of the Bruker elution solution is added to the beads and mixed. The PCR tube is placed back into the magnetic bead separator for two minutes. Eluates are pipetted out into a clean tube and mixed with 5 µL stabilizing solution. The solution is then mixed with cinnamic acid (Sigma, C-2020) and spotted on an Anchor Chip© (Bruker Daltonics). A control spot is also added that contains a 1 µM solution of cytochrome C as an internal standard for MALDI-TOF analysis. Saliva sample preparation - Direct analysis method Fresh matrix solution is prepared with 50 mg cinnamic acid (Sigma, cat. # C-2020), 1 mL solvent containing 1 part absolute ethanol and 2 parts acetone. 1 μL of precleared saliva is mixed with 1 μL matrix solution in a 100 μL PCR tube and spotted onto an Anchor Chip. After adding a cytochrome C control spot, the chip is dried for a minimum of 1 minute under vacuum prior to MALDI-TOF analysis.
Results Five saliva samples were collected at AFRL/HEDR from anonymous donors without retaining any donor information (Patrick Mason, PI, "Exempt" protocol #F-BR-2006-0006-E, approved by Col. Calcote, IRB Chair, Brooks City-Base, 06 Oct 2005), following the alternative method. These samples were prepared for direct MALDI-TOF analysis without C18 fractionation. Three mass spectra were obtained for each sample, which are presented in Figures 1 to 15. One spectrum is of the low mass range between 1,000 and 3000 Daltons, Figures 1 to 5. The second one is of the mid range between 2,000 and 10,000 Daltons, Figures 6 to
Distribution A – Approved for Public Release
8

10. The third is of the high mass range between 5,000 and 20,000 Daltons, Figures 11 to 15. Table 1 list observed peaks in these spectra for which assignments were possible using literature sources.50, 54
1472.249
1336.424
1732.525 1867.477
1224.814
2521.570
1563.886
2916.986
2040.717
990.709
2241.698
1153.694
1106.825
2180.096
1933.770
1247.598
2120.0923150.774
1806.111
2375.282
0
500
1000
1500
2000
2500
Inte
ns. [a.
u.]
1000 1250 1500 1750 2000 2250 2500 2750 3000m/z
Figure 1. Saliva sample 1. Low mass range MALDI-TOF m/z 1000 to 3000
1334.682
1471.298
1008.996
1561.463
1718.815
1222.901
1106.028
1804.661
2065.526
1605.028
1081.458
2519.585
2374.777
1969.516
2912.267
2449.9842755.054
0
500
1000
1500
2000
2500
Inte
ns. [a.
u.]
1000 1250 1500 1750 2000 2250 2500 2750 3000m/z
Figure 2. Saliva sample 2. Low mass range MALDI-TOF m/z 1000 to 3000
Distribution A – Approved for Public Release
9

1334.822
1718.015
1470.7021223.863 1561.659
1433.642
1105.9771865.158
0
1000
2000
3000
Inte
ns. [a.
u.]
1000 1250 1500 1750 2000 2250 2500 2750 3000m/z
Figure 3. Saliva sample 3. Low mass range MALDI-TOF m/z 1000 to 3000
2916.304
1681.871
1472.8951336.646
2522.416
1819.162
1223.204 1563.8681107.536
2040.272
2794.412
2182.964 2719.637
1009.917
993.770
2448.519
0
1000
2000
3000
4000
Inte
ns. [a.
u.]
1000 1250 1500 1750 2000 2250 2500 2750 3000m/z
Figure 4. Saliva sample 4. Low mass range MALDI-TOF m/z 1000 to 3000
Distribution A – Approved for Public Release
10

1290.486
1475.139
1378.549
1127.610
1048.129 1870.3611624.772
1211.753
1788.4492525.190
2920.866
1544.601
2082.947 2708.5172415.422
0
1000
2000
3000
4000
5000
Intens
. [a.u.]
1000 1250 1500 1750 2000 2250 2500 2750 3000m/z
Figure 5. Saliva sample 5. Low mass range MALDI-TOF m/z 1000 to 3000
4348.722
2898.632
3473.697
2503.859
0
1000
2000
3000
4000
Intens
. [a.u.]
000 3000 4000 5000 6000 7000 8000 9000 10000m/z
Figure 6. Saliva sample 1. Mid mass range MALDI-TOF m/z 2000 to 10,000
Distribution A – Approved for Public Release
11

4348.363
3470.705
2899.394
2503.432
6916.428
0
1000
2000
3000
Intens
. [a.u.]
000 3000 4000 5000 6000 7000 8000 9000 10000m/z
Figure 7. Saliva sample 2. Mid mass range MALDI-TOF m/z 2000 to 10,000
6925.5207581.713
4354.002
5356.645
5769.918
4908.137
0
1000
2000
3000
Intens
. [a.u.]
000 3000 4000 5000 6000 7000 8000 9000 10000m/z
Figure 8. Saliva sample 3. Mid mass range MALDI-TOF m/z 2000 to 10,000
Distribution A – Approved for Public Release
12

5581.499
5935.605
7599.422
2906.345
4363.052
2509.934
3485.301
9584.092
3795.233
4890.435
0.0
0.2
0.4
0.6
0.8
1.0
1.2
4x10
Intens
. [a.u.]
000 3000 4000 5000 6000 7000 8000 9000 10000m/z
Figure 9. Saliva sample 4. Mid mass range MALDI-TOF m/z 2000 to 10,000
3427.447
2691.251
4357.746
0
200
400
600
800
1000
1200
Intens
. [a.u.]
000 3000 4000 5000 6000 7000 8000 9000 10000m/z
Figure 10. Saliva sample 5. Mid mass range MALDI-TOF m/z 2000 to 10,000
Distribution A – Approved for Public Release
13

6964.681
5403.629
7757.64514242.968
10979.367 15475.041
0
200
400
600
800
Intens
. [a.u.]
6000 8000 10000 12000 14000 16000 18000m/z
Figure 11. Saliva sample 1. High mass range MALDI TOF m/z 5000 to 50,000
5968.095
7620.124
10418.419
6969.763
0
250
500
750
1000
1250
Intens
. [a.u.]
6000 8000 10000 12000 14000 16000 18000m/z
Figure 12. Saliva sample 2. High mass range MALDI TOF m/z 5000 to 50,000
Distribution A – Approved for Public Release
14

5819.221
11497.378
15452.603
10424.866
9591.782
6968.931
0
250
500
750
1000
1250
1500
Intens
. [a.u.]
6000 8000 10000 12000 14000 16000 18000m/z
Figure 13. Saliva sample 3. High mass range MALDI TOF m/z 5000 to 50,000
5423.579
7643.784
9619.096 11518.180
0
1000
2000
3000
4000
Intens
. [a.u.]
6000 8000 10000 12000 14000 16000 18000m/z
Figure 14. Saliva sample 4. High mass range MALDI TOF m/z 5000 to 50,000
Distribution A – Approved for Public Release
15

5835.159
6961.205
0
200
400
600
800
Intens
. [a.u.]
6000 8000 10000 12000 14000 16000 18000m/z
Figure 15. Saliva sample 5. High mass range MALDI TOF m/z 5000 to 50,000
Distribution A – Approved for Public Release
16
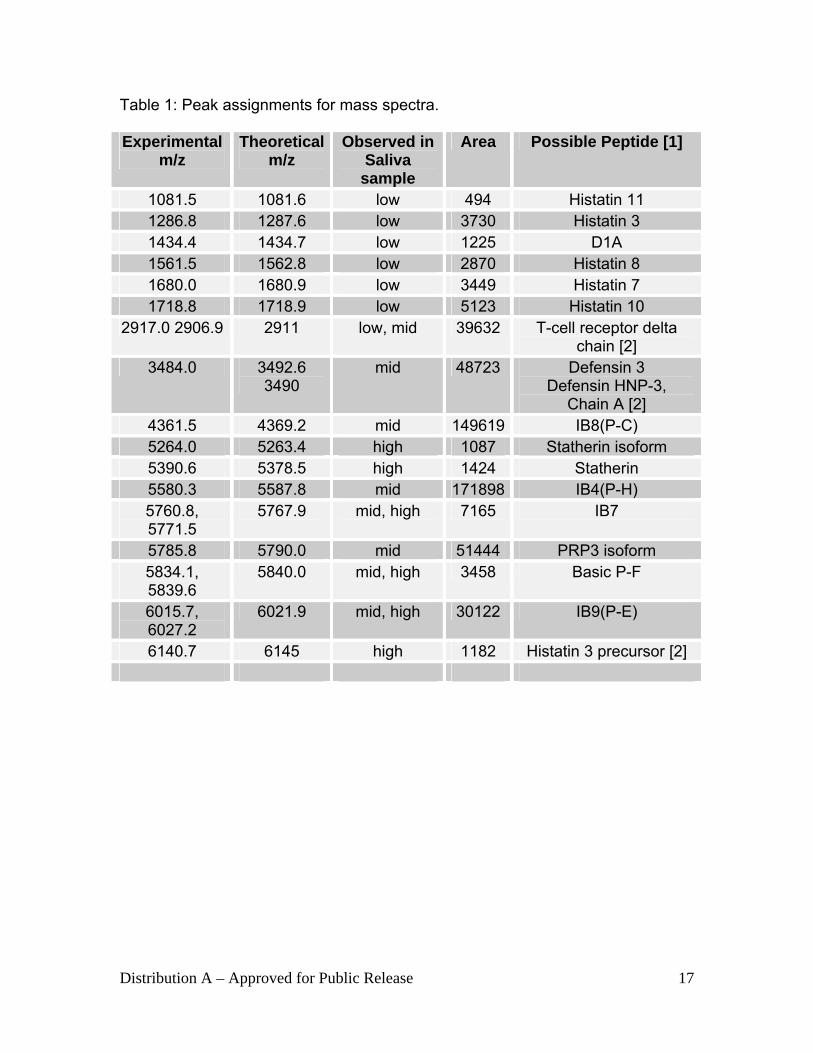
Table 1: Peak assignments for mass spectra. Experimental
m/z Theoretical
m/z Observed in
Saliva sample
Area Possible Peptide [1]
1081.5 1081.6 low 494 Histatin 11 1286.8 1287.6 low 3730 Histatin 3 1434.4 1434.7 low 1225 D1A 1561.5 1562.8 low 2870 Histatin 8 1680.0 1680.9 low 3449 Histatin 7 1718.8 1718.9 low 5123 Histatin 10
2917.0 2906.9 2911 low, mid 39632 T-cell receptor delta chain [2]
3484.0 3492.6 3490
mid 48723 Defensin 3 Defensin HNP-3,
Chain A [2] 4361.5 4369.2 mid 149619 IB8(P-C) 5264.0 5263.4 high 1087 Statherin isoform
5390.6 5378.5 high 1424 Statherin 5580.3 5587.8 mid 171898 IB4(P-H) 5760.8, 5771.5
5767.9 mid, high 7165 IB7
5785.8 5790.0 mid 51444 PRP3 isoform 5834.1, 5839.6
5840.0 mid, high 3458 Basic P-F
6015.7, 6027.2
6021.9 mid, high 30122 IB9(P-E)
6140.7 6145 high 1182 Histatin 3 precursor [2]
Distribution A – Approved for Public Release
17

Discussion The spectra demonstrate the good points and the bad points when it comes to the analysis of saliva samples. Although there is variability in the observed species there is also some overlap. Many of the observed species have not been identified. Those for which literature references could be found are listed in Table 1. The variability in the spectra are due to a variety of sample collection factors which range from time of day, what had been eaten, and the general health of the individual. For these samples we had no control over how, when, and from whom the samples where collected. The data presented is intended to be a survey of the peptides and proteins present in the samples which is useful for a finger print comparison between samples. The analysis of saliva as a diagnostic tool may one day be useful when the saliva proteome is better understood. At present are the issues of sample reproducibility between individuals and across populations. The analytical tools for the analysis of such complicated samples are just now reaching the point where they can grapple such a complicated task. Future work should focus on obtaining sufficiently large sample sets so that the impact of individual sample variability will be minimized. It still needs to be determined what is in a ‘normal’ saliva sample before extrapolations can be made as to what is a useful and informative biomarker. Analysis of these datasets would be accomplished using software tool like the ClinPro software from Bruker. Once sufficient resources have been invested to resolve these issues through the generation of the necessary databases, the application of mass spectrometry to identify and characterize salivary biomarkers will become the method of choice.
Distribution A – Approved for Public Release
18

References 1. Search done in Feburary 2007 2. Search done in Feburary 2007 3. Aebersold, R.; Mann, M., Mass spectrometry-based proteomics. Nature 2003, 422, 198-207. 4. Careri, M.; Mangia, A., Validation and Qualification: the Fitness for Purpose of Mass Spectrometry-Based Analytical Methods and Analytical Systems. Anal. Bioanal. Chem. 2006, 386, 38-45. 5. Fortier, M.-H.; Bonneil, E.; Goodley, P.; Thibault, P., Integrated Microfluidic Device for Mass Spectrometry-Based Proteomics and its Application to Biomarker Discovery Programs. Analytical Chemistry 2005, 77, 1631-1640. 6. Frewen, B. E.; Merrihew, G. E.; Wu, C. C.; Noble, W. S.; MacCoss, M. J., Analysis of Peptide MS/MS Spectra from Large-Scale Proteomics Experiments Using Spectrum Libraries. Analytical Chemistry 2006, 78, 5678-5684. 7. Marte, B., Nature Insight: Proteomics. Nature 2003, 422, 191. 8. Reyzer, M.; Caprioli, R. M., MALDI Mass Spetrometry for Direct Tissue Analysis: A New Tool for Biomarker Discovery. Journal of Proteome Research 2005, 4, 1138-1142. 9. Rudnick, P. A.; Wang, Y.; Evans, E.; Lee, C. S.; Balgley, B. M., Large Scale Analysis of MASCOT Results Using a Mass Accuracy-Based Threshold (MATH) Effectively Improves Data Interpretation. Journal of Proteome Research 2005, 4, 1353-1360. 10. Simoneit, B. R. T., A Review of Current Applications of Mass Spectrometry for Biomarker/Molecular Tracer Elucidations. Mass Spectrometry Reviews 2005, 24, 719-765. 11. Taylor, S. W.; Andon, N. L.; Bilakovics, J. M.; Lowe, C.; Hanley, M. R.; Pittner, R.; Ghosh, S. S., Efficient High-Throughput Discovery of Large Peptidic Hormones and Biomarkers. Journal of Proteome Research 2006, 5, 1776-1784. 12. Tu, C.-J.; Dai, J.; Li, S.-J.; Sheng, Q.-H.; Deng, W.-J.; Xia, Q.-C.; Zeng, R., High-Sensitivity Analysis of Human Plasma Proteome by Immobilized Isoelectric Focusing Fractionation Coupled to Mass Spectrometry Identification. Journal of Proteome Research 2005, 4, 1265-1273. 13. Tyers, M.; Mann, M., From Genomics to Proteomics. Nature 2003, 422, 193-197. 14. Vitzthum, F.; Behrens, F.; Anderson, N. L.; Shaw, J. H., Proteomics: From Basic Research to Diagnostic Application. A Review of Requirements and Needs. Journal of Proteome Research 2005, 4, 1086-1097. 15. Vlahou, A.; Fountoulakis, M., Proteomic Approches in the Search for Disease Biomarkers. Journal of Chromatography B 2005, 814, 11-19. 16. Wang, Y.; Hanley, R.; Klemke, R. L., Computational Methods for Comparison of Large Genomic and Proteomic Datasets Reveal Protein Markers of Metastatic Cancer. Journal of Proteome Research 2006, 5, 907-915. 17. Alaiya, A.; Al-Mohanna, M.; Linder, S., Clinical Cancer Proteomics: Promises and Pitfalls. Journal of Proteome Research 2005, 4, 1213-1222.
Distribution A – Approved for Public Release
19

18. Assmann, G.; Nofer, J.-R., Atheroprotective Effects of High-Density Lipoproteins. Annual Review of Medicine 2003, 54, 321-341. 19. Dalle-Donne, I.; Scaloni, A.; Glustarini, D.; Cavarra, E.; Tell, G.; Lungarella, G.; Colombo, R.; Rossi, R.; Milzani, A., Proteins as Biomarkers of Oxidative/Nitrosative Stress in Diseases: The Contribution of Redox Proteomics. Mass Spectrometry Reviews 2005, 24, 55-99. 20. Dong, L.; Shen, X.; Deng, C., Development of Gas Chromatogrphy-Mass Spectrometry Following Headspace Single-Drop Microextraction and Simulaneous Derivatization for Fast Determination of the Diabetes Biomarker, Acetone in Human Blood Samples. Analytica Chimica Acta 2006, 569, 91-96. 21. Ferdinandy, P., Myocardial Ischemia/Reperfusion Injury and Preconditioning: Effects of Hypercholesterolemia/Hyperlipidaemia. British Journal of Pharmacology 2003, 138, 283-285. 22. Hewavitharana, A. K.; Hyde, C.; Thomas, R.; Shaw, P. N., Shortcomings of Protein Removal Prior to High Performance Liquid Chromatographic Analysis--A Case Study Using Method Development for BAY 11-7082. Journal of Chromatography B 2006, 834, 93-97. 23. Hoos, J. S.; Sudergat, H.; Hoelck, J.-P.; Stahl, M.; de Vlieger, J. S. B.; Niessen, W.; Lingerman, H.; Irth, H., Selective Quantitative Bioanalysis of Proteins in Biological Fluids by On-Line Immunoaffinity Chromatography-Mass Spectrometry. Journal of Chromatography B 2006, 830, 262-269. 24. Lee, W.-J.; Majumder, Z. R.; Jeoung, D.-I.; Lee, H.-J.; Kim, S.-H.; Bae, S.; Lee, Y.-S., Organ-specific gene expressions in C57BL/6 mice after exposure to low-dose radiation. Radiation Research 2006, 165, (5), 562-569. 25. Sarkaria, J. N.; Carlson, B. L.; Schroeder, M. A.; Grogan, P.; Brown, P. D.; Giannini, C.; Ballman, K. V.; Kitange, G. J.; Guha, A.; Pandita, A.; James, C. D., Use of an Orthotopic Xenograft Model for Assessing the Effect of Epidermal Growth Factor Receptor Amplification on Glioblastoma Radiation Response. Clinical Cancer Research 2006, 12, (7, Pt. 1), 2264-2271. 26. Neyraud, E.; Sayd, T.; Morzel, M.; Dransfield, E., Proteomic Analysis of Human Whole and Parotid Salivas Following Stimulation by Different Tastes. Journal of Proteome Research 2006, 5, 2474-2480. 27. Suriano, R.; Lin, Y.; Ashok, B. T.; Schaefer, S. D.; Schantz, S. P.; Geliebter, J.; Tiwari, R. K., Pilot Study Using SELDI-TOF-MS Based Proteomic Profile for the Identification of Diagnostic Biomarkers of Thyroid Proliferative Diseases. Journal of Proteome Research 2006, 5, 856-861. 28. Wagner, S.; Scholz, K.; Donegan, M.; Burton, L.; Wingate, J.; Volkel, W., Metabonomics and Biomarker Discovery: LC-MS Metabolic Profiling and Constant Neutral Loss Scanning Combined with Multivariate Data Analysis for Mercapturic Acid Analysis. Analytical Chemistry 2006, 78, 1296-1305. 29. Yan, F.; He, M.; Hogan, J. M.; Rossie, S. S.; McLuckey, S. A., Targeted Biomarker Detection Via Whole Protein Ion Trap Tandem Mass Spectrometry: Thymosin b4 in a Human Lung Cancer Cell Line. Journal of Mass Spectrometry 2005, 40, 444-451. 30. Walters, T. J.; Ryan, K. L.; Nelson, D. A.; Blick, D. W.; Mason, P. A., Effects of blood flow on skin heating induced by millimeter wave irradiation in humans. Health Physics 2004, 86, (2), 115-120.
Distribution A – Approved for Public Release
20

31. Mason, P. A.; Walters, T. J.; DiGiovanni, J.; Beason, C. W.; Jauchem, J. R.; Dick, E. J., Jr.; Mahajan, K.; Dusch, S. J.; Shields, B. A.; Merritt, J. H.; Murphy, M. R.; Ryan, K. L., Lack of effect of 94 GHz radio frequency radiation exposure in an animal model of skin carcinogenesis. Carcinogenesis 2001, 22, (10), 1701-1708. 32. Kiel, J. L.; Sutter, R. E.; Mason, P. A.; Parker, J. E.; Morales, P. J.; Stribling, L. J. V.; Alls, J. L.; Holwitt, E. A.; Seaman, R. L.; Mathur, S. P., Directed killing of anthrax spores by microwave-induced cavitation. IEEE Transactions on Plasma Science 2002, 30, (4, Pt. 1), 1482-1488. 33. Ryan, K. L.; D'Andrea, J. A.; Jauchem, J. R.; Mason, P. A., Radio frequency radiation of millimeter wave length: potential occupational safety issues relating to surface heating. Health Physics 2000, 78, (2), 170-181. 34. Heynick Louis, N.; Johnston Sheila, A.; Mason Patrick, A., Radio frequency electromagnetic fields: cancer, mutagenesis, and genotoxicity. Bioelectromagnetics FIELD Full Journal Title:Bioelectromagnetics 2003, Suppl 6, S74-100. 35. Allen Stewart, J.; Adair Eleanor, R.; Mylacraine Kevin, S.; Hurt, W.; Ziriax, J., Empirical and theoretical dosimetry in support of whole body radio frequency (RF) exposure in seated human volunteers at 220 MHz. Bioelectromagnetics FIELD Full Journal Title:Bioelectromagnetics 2005, 26, (6), 440-7. 36. Allen Stewart, J.; Adair Eleanor, R.; Mylacraine Kevin, S.; Hurt, W.; Ziriax, J., Empirical and theoretical dosimetry in support of whole body resonant RF exposure (100 MHz) in human volunteers. Bioelectromagnetics FIELD Full Journal Title:Bioelectromagnetics 2003, 24, (7), 502-9. 37. Blakely, W. F.; Miller, A. C.; Grace, M. B.; McLeland, C. B.; Luo, L.; Muderhwa, J. M.; Miner, V. L.; Prasanna, P. G. S., Radiation biodosimetry: Applications for spaceflight. Advances in Space Research 2003, 31, (6), 1487-1493. 38. Blakely William, F.; Brooks Antone, L.; Lofts Richard, S.; van der Schans Govert, P.; Voisin, P., Overview of low-level radiation exposure assessment: biodosimetry. Mil Med FIELD Full Journal Title:Military medicine 2002, 167, (2 Suppl), 20-4. 39. Menard, C.; Johann, D.; Lowenthal, M.; Muanza, T.; Sproull, M.; Ross, S.; Gulley, J.; Petricoin, E.; Coleman, C. N.; Whiteley, G.; Liotta, L.; Camphausen, K., Discovering Clinical Biomarkers of Ionizing Radiation Exposure with Serum Proteomic Analysis. Cancer Research 2006, 66, (3), 1844-1850. 40. Frelon, S.; Douki, T.; Ravanat, J.-L.; Pouget, J.-P.; Tornabene, C.; Cadet, J., High-Performance Liquid Chromatography-Tandem Mass Spectrometry Measurement of Radiation-Induced Base Damage to Isolated and Cellular DNA. Chemical Research in Toxicology 2000, 13, (10), 1002-1010. 41. Cadet, J.; Douki, T.; Frelon, S.; Sauvaigo, S.; Pouget, J.-P.; Ravanat, J.-L., Assessment of oxidative base damage to isolated and cellular DNA by HPLC-MS/MS measurement. Free Radical Biology & Medicine 2002, 33, (4), 441-449. 42. Regulus, P.; Spessotto, S.; Gateau, M.; Cadet, J.; Favier, A.; Ravanat, J.-L., Detection of new radiation-induced DNA lesions by liquid chromatography coupled to tandem mass spectrometry. Rapid Communications in Mass Spectrometry 2004, 18, (19), 2223-2228. 43. Cadet, J.; Douki, T.; Gasparutto, D.; Ravanat, J.-L., Radiation-induced damage to cellular DNA: measurement and biological role. Radiation Physics and Chemistry 2004, 72, (2-3), 293-299.
Distribution A – Approved for Public Release
21

44. Travis, J., Scientists seek to identify all the proteins in plasma. Science News 2003, 163, (11), 171. 45. Jimenez-Alonso, J.; Sabio, J. M.; Rivera-Civico, F.; Martin-Armada, M.; Rodriguez, M. A.; Jaimez, L.; Castillo, M. J.; Sanchez-Roman, J.; Castro, J., Salivary and serum b2-microglobulin and gamma-glutamyl-transferase in patients with primary Sjogren syndrome and Sjogren syndrome secondary to systemic lupus erythematosus. Clinica Chimica Acta 2003, 334, (1-2), 225-231. 46. Tivis, L. J.; Richardson, M. D.; Peddi, E.; Arjmandi, B., Saliva versus serum estradiol: Implications for research studies using postmenopausal women. Progress in Neuro-Psychopharmacology & Biological Psychiatry 2005, 29, (5), 727-732. 47. Gozansky, W. S.; Lynn, J. S.; Laudenslager, M. L.; Kohrt, W. M., Salivary cortisol determined by enzyme immunoassay is preferable to serum total cortisol for assessment of dynamic hypothalamic-pituitary-adrenal axis activity. Clinical Endocrinology (Oxford, United Kingdom) 2005, 63, (3), 336-341. 48. Messana, I.; Cabras, T.; Inzitari, R.; Lupi, A.; Zuppi, C.; Olmi, C.; Fadda, M. B.; Cordaro, M.; Giardina, B.; Castagnola, M., Characterization of the human salivary basic proline-rich protein complex by a proteomic approach. Journal of Proteome Research 2004, 3, (4), 792-800. 49. Messana, I.; Loffredo, F.; Inzitari, R.; Cabras, T.; Giardina, B.; Onnis, G.; Piludu, M.; Castagnola, M., The coupling of RP-HPLC and ESI-MS in the study of small peptides and proteins secreted in vitro by human salivary glands that are soluble in acidic solution. Eur J Morphol FIELD Full Journal Title:European journal of morphology 2003, 41, (2), 103-6. 50. Vitorino, R.; Lobo, M. J. C.; Duarte, J. A. R.; Ferrer-Correia, A. J.; Domingues, P. M.; Amado, F. M. L., Analysis of salivary peptides using HPLC-electrospray mass spectrometry. Biomedical Chromatography 2004, 18, (8), 570-575. 51. Wilmarth, P. A.; Riviere, M. A.; Rustvold, D. L.; Lauten, J. D.; Madden, T. E.; David, L. L., Two-dimensional liquid chromatography study of the human whole saliva proteome. Journal of Proteome Research 2004, 3, (5), 1017-1023. 52. Nagore, L. I.; Mullens, C. P.; Kim, W. I.; Kahns, J. E.; Christy, R. J.; Zimmerman, C. M.; Bach, S. B. H., Biomarker Discovery using Magnetic Beads and MALDI-TOF. Proceedings of the 53rd American Society for Mass Spectrometry Conference on Mass Spectrometry and Allied Topics 2005. 53. Nagore, L. I.; Mullens, C. P.; Mitchell, L.; Christy, R. J.; Kahns, J. E.; Bach, S. B. H., Comparative Study of Separation Methods for Human Whole Saliva by MALDI-TOF-MS. Proceedings of the 53rd American Society for Mass Spectrometry Conference on Mass Spectrometry and Allied Topics 2006. 54. Hu, S.; Xie, Y.; Ramachandran, P.; Loo, R. R. O.; Li, Y.; Loo, J. A.; Wong, D. T., Large-Scale Identification of Proteins in Human Salivary Proteome by Liquid Chromatography/Mass Spectrometry and Two-Dimensional Gel Electrophoresis-Mass Spectrometry. Proteomics 2005, 5, 1714-1728.
Distribution A – Approved for Public Release
22
