rental report - mid year 2010
TRANSCRIPT

8/8/2019 Rental Report - Mid Year 2010
http://slidepdf.com/reader/full/rental-report-mid-year-2010 1/25
Coldwell Ban
Premier Rea
Developer
& Investme
Services
Market IQ
•
Sales• Consulting
• Marketing
• Analytics
Developer Serv
&Investment Ser Market IQ
8290 W. Sahara Ave, S
Las Vegas, NV 89117
P: 702.938.137
F: 702.877.620
Las Vegas Valley
Residential Rental ReportFeb 2010 - July
www.lasvegashome

8/8/2019 Rental Report - Mid Year 2010
http://slidepdf.com/reader/full/rental-report-mid-year-2010 2/25
Average Single Family Lease Price – Las Vegas Valley Zip Codes – February 2010 through July 2010
Zip
Less than 1000
sq.ft 1000 to 1500 sq.ft 1500 to 2000 sq.ft 2000 to 2500 sq.ft 2500 to 3000 sq.ft
Greater than
3000 sq.ft
Average All
Sizes
89002 $1,069 $1,262 $1,506 $1,750 $2,055 $1,366
89005 $838 $1,157 $1,480 $1,925 $2,200 $2,417 $1,379
89009 $882 $1,041 $1,211 $1,654 $2,550 $2,410 $1,408
89011 $1,142 $1,371 $1,670 $1,862 $3,007 $1,61889012 $950 $1,151 $1,314 $1,574 $1,922 $2,243 $1,413
89014 $760 $1,049 $1,228 $1,388 $1,709 $2,115 $1,199
89015 $683 $853 $976 $1,250 $1,150 $851
89030 $850 $981 $1,114 $1,348 $1,553 $1,819 $1,132
89031 $760 $983 $1,113 $1,323 $1,385 $1,682 $1,082
89032 $990 $1,253 $1,424 $1,650 $2,144 $1,388
89044 $1,100 $1,409 $1,702 $2,068 $3,061 $1,735
89046 $875 $875
89048 $1,050 $1,146 $1,314 $1,562 $1,873 $2,420 $1,470
89052 $982 $1,102 $1,288 $1,467 $1,630 $1,182
89060 $981 $1,157 $1,405 $1,595 $1,919 $1,262
89061 $1,259 $1,418 $1,660 $1,830 $1,521
89074 $898 $1,081 $1,366 $1,478 $1,237
89081 $613 $806 $795 $1,500 $800
89084 $800 $990 $1,039 $1,536 $1,700 $2,733 $1,163
89085 $650 $1,011 $1,263 $1,459 $1,280 $1,254
89086 $740 $950 $1,058 $1,209 $1,800 $1,007
89101 $785 $887 $1,019 $2,200 $928
89102 $845 $934 $1,062 $1,000 $1,650 $2,438 $1,016
89103 $847 $954 $1,116 $1,323 $1,848 $1,800 $1,028
89104 $1,415 $1,675 $1,900 $4,200 $1,949
89106 $805 $956 $1,056 $1,248 $1,482 $1,849 $1,065
89107 $1,053 $1,204 $1,469 $1,860 $3,144 $1,494
89108 $757 $902 $1,054 $1,171 $1,461 $1,995 $994
89109 $1,076 $1,234 $1,477 $1,797 $3,150 $1,537
89110 965 1 020 1 184 1 523 2 500 1 115, , , , ,
89113 $925 $1,059 $1,181 $1,249 $1,350 $1,143
89115 $675 $935 $1,179 $1,383 $1,708 $2,517 $1,290
89117 $763 $991 $1,159 $1,379 $1,503 $2,600 $1,212
89118 $813 $958 $1,092 $1,344 $1,446 $1,735 $1,053
89119 $973 $1,093 $1,288 $1,507 $1,753 $2,373 $1,319
89120 $1,900 $1,900
89121 $1,195 $1,19589122 $875 $1,013 $1,234 $1,391 $2,004 $2,118 $1,254
89123 $1,023 $1,179 $1,389 $1,701 $2,065 $1,233
89125 $895 $1,061 $1,231 $1,471 $1,667 $2,318 $1,447
89128 $1,099 $1,296 $1,638 $1,979 $2,612 $1,380
89129 $1,048 $1,191 $1,427 $1,824 $2,038 $3,432 $1,845
89130 $1,207 $1,417 $1,773 $2,022 $2,616 $1,674
89131 $1,050 $1,030 $1,166 $1,360 $1,833 $2,389 $1,223
89134 $1,094 $1,220 $1,529 $1,632 $3,050 $1,567
89135 $750 $967 $1,121 $1,308 $1,738 $1,054
89138 $1,000 $1,026 $1,187 $1,434 $1,716 $1,815 $1,284
89139 $995 $1,155 $1,314 $1,613 $1,925 $2,807 $1,501
89141 $990 $1,001 $1,147 $1,474 $1,868 $4,223 $1,535
89142 $974 $1,175 $1,405 $1,613 $2,050 $1,312
89143 $823 $1,051 $1,210 $1,426 $1,763 $2,361 $1,293
89144 $995 $1,071 $1,205 $1,390 $1,751 $2,292 $1,342
89145 $994 $1,169 $1,410 $1,877 $2,602 $1,34589146 $713 $892 $1,042 $1,346 $966
89147 $965 $1,181 $1,561 $1,667 $2,600 $1,243
89148 $800 $1,140 $1,423 $2,132 $1,430
89149 $1,068 $1,244 $1,443 $1,657 $2,219 $1,447
89156 $1,095 $1,210 $1,520 $2,215 $1,407
89166 $800 $1,047 $1,258 $1,450 $1,684 $2,754 $1,317
89169 $913 $913
Average All Zip Codes $811 $1,025 $1,213 $1,475 $1,785 $2,588 $1,332
Source: GLVAR, Coldwell Banker Premier Realty.
Note 1: These figures are averages based on a sample of homes. Individual properties may vary greatly from the sample average.
Note 2: Although all facts, figures and projections have been obtained from sources deemed reliable and are believed to be correct, no guarantee
or liability is assumed by its author. This report is meant to assist in the analysis of real estate and is not intended to comprehensively analyze the
ramifications for an individual or company. With any real estate transaction, your personal tax and legal counsel should be contacted.

8/8/2019 Rental Report - Mid Year 2010
http://slidepdf.com/reader/full/rental-report-mid-year-2010 3/25
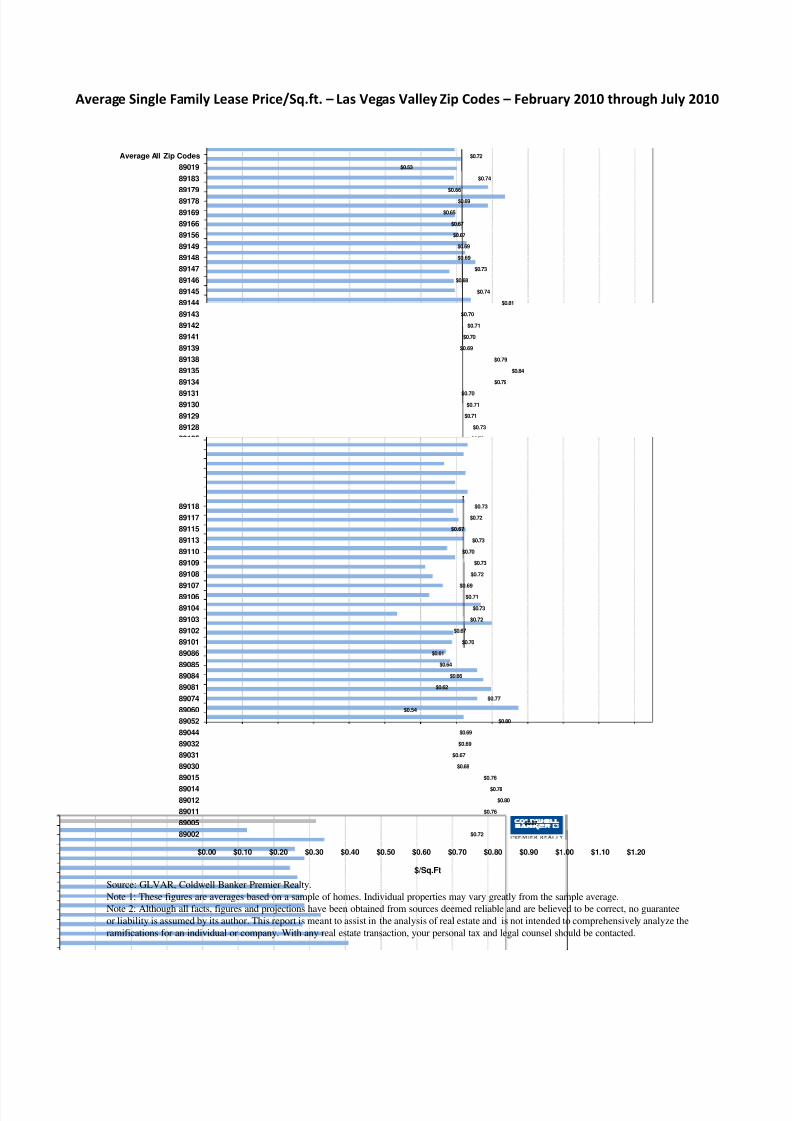
Average Single Family Lease Price/Sq.ft. – Las Vegas Valley Zip Codes – February 2010 through July 2010
Zip
Less than 1000
sq.ft 1000 to 1500 sq.ft 1500 to 2000 sq.ft 2000 to 2500 sq.ft 2500 to 3000 sq.ft
Greater than
3000 sq.ft
Average All
Sizes
89002 $0.83 $0.73 $0.67 $0.67 $0.58 $0.72
89005 $0.98 $0.89 $0.87 $0.84 $0.82 $0.66 $0.87
89011 $0.99 $0.81 $0.70 $0.75 $0.90 $0.69 $0.76
89012 $0.88 $0.81 $0.76 $0.70 $0.72 $0.8089014 $1.02 $0.88 $0.76 $0.71 $0.68 $0.67 $0.78
89015 $0.95 $0.83 $0.72 $0.63 $0.61 $0.56 $0.76
89030 $0.79 $0.69 $0.57 $0.57 $0.42 $0.68
89031 $0.89 $0.74 $0.65 $0.61 $0.57 $0.51 $0.67
89032 $0.83 $0.75 $0.65 $0.62 $0.52 $0.52 $0.69
89044 $0.77 $0.72 $0.66 $0.61 $0.62 $0.69
89052 $0.85 $0.81 $0.77 $0.76 $0.81 $0.80
89060 $0.54 $0.54
89074 $1.05 $0.88 $0.76 $0.71 $0.68 $0.70 $0.77
89081 $0.72 $0.64 $0.58 $0.53 $0.51 $0.62
89084 $0.76 $0.67 $0.63 $0.58 $0.51 $0.66
89085 $0.73 $0.64 $0.57 $0.56 $0.64
89086 $0.60 $0.63 $0.62 $0.53 $0.61
89101 $0.83 $0.66 $0.50 $0.68 $0.70
89102 $0.89 $0.79 $0.60 $0.69 $0.64 $0.68 $0.67
89103 $0.66 $0.82 $0.73 $0.66 $0.49 $0.72
89104 $1.05 $0.75 $0.65 $0.56 $0.64 $0.73
89106 $0.89 $0.70 $0.64 $0.55 $0.71
89107 $0.86 $0.73 $0.62 $0.46 $0.58 $0.65 $0.69
89108 $0.89 $0.75 $0.66 $0.61 $0.69 $0.60 $0.72
89109 $0.85 $0.69 $0.68 $0.57 $0.73
89110 $0.86 $0.77 $0.64 $0.58 $0.55 $0.47 $0.70
89113 $0.78 $0.73 $0.68 $0.70 $0.68 $0.73
89115 $0.82 $0.72 $0.62 $0.56 $0.50 $0.61 $0.67
89117 $0.82 $0.71 $0.68 $0.66 $0.76 $0.72
89118 $1.01 $0.74 $0.69 $0.67 $0.67 $0.73
Source: GLVAR, Coldwell Banker Premier Realty.
Note 1: These figures are averages based on a sample of homes. Individual properties may vary greatly from the sample average.
Note 2: Although all facts, figures and projections have been obtained from sources deemed reliable and are believed to be correct, no guarantee
or liability is assumed by its author. This report is meant to assist in the analysis of real estate and is not intended to comprehensively analyze the
ramifications for an individual or company. With any real estate transaction, your personal tax and legal counsel should be contacted.
89119 $0.95 $0.87 $0.70 $0.54 $0.50 $0.74
89120 $1.53 $0.72 $0.68 $0.63 $0.63 $0.62 $0.70
89121 $0.93 $0.77 $0.67 $0.60 $0.57 $0.72 $0.69
89122 $0.91 $0.72 $0.65 $0.62 $0.56 $0.46 $0.68
89123 $0.99 $0.82 $0.74 $0.69 $0.66 $0.66 $0.75
89125 $0.72 $0.72
89128 $0.91 $0.80 $0.73 $0.63 $0.74 $0.64 $0.7389129 $0.76 $0.70 $0.65 $0.62 $0.58 $0.71
89130 $0.79 $0.69 $0.65 $0.67 $0.59 $0.71
89131 $0.90 $0.81 $0.70 $0.66 $0.62 $0.64 $0.70
89134 $0.85 $0.76 $0.73 $0.75 $0.73 $0.79
89135 $1.07 $0.92 $0.82 $0.84 $0.74 $0.89 $0.84
89138 $0.90 $0.79 $0.79 $0.77 $0.80 $0.79
89139 $1.07 $0.76 $0.68 $0.62 $0.67 $0.60 $0.69
89141 $0.80 $0.70 $0.68 $0.60 $0.71 $0.70
89142 $1.00 $0.75 $0.67 $0.59 $0.69 $0.71
89143 $1.03 $0.76 $0.68 $0.64 $0.63 $0.58 $0.70
89144 $1.02 $0.92 $0.77 $0.73 $0.70 $0.81 $0.81
89145 $1.05 $0.80 $0.66 $0.69 $0.69 $0.87 $0.74
89146 $0.78 $0.71 $0.63 $0.58 $0.66 $0.68
89147 $0.95 $0.83 $0.71 $0.64 $0.66 $0.65 $0.73
89148 $1.02 $0.78 $0.70 $0.63 $0.64 $0.64 $0.69
89149 $0.75 $0.68 $0.64 $0.68 $0.68 $0.6989156 $0.80 $0.69 $0.63 $0.62 $0.67
89166 $0.69 $0.66 $0.70 $0.61 $0.76 $0.67
89169 $0.69 $0.68 $0.62 $0.61 $0.65
89178 $0.79 $0.71 $0.66 $0.61 $0.63 $0.69
89179 $0.85 $0.69 $0.55 $0.59 $0.66
89183 $0.90 $0.79 $0.74 $0.65 $0.59 $0.69 $0.74
89019 $0.53 $0.53
Average All Zip Codes $0.92 $0.78 $0.71 $0.67 $0.66 $0.68 $0.72

8/8/2019 Rental Report - Mid Year 2010
http://slidepdf.com/reader/full/rental-report-mid-year-2010 4/25
$1,143
$1,290
$1,212
$1,053
$1,319
$1,900
$1,195
$1,254
$1,233
$1,447
$1,380
$1,845
$1,674
$1,223
$1,567
$1,054
$1,284
$1,501
$1,535
$1,312
$1,293
$1,342
$1,345
$966
$1,243
$1,430
$1,447
$1,407
$1,317
$913
$1,332
89113
89115
89117
89118
89119
89120
89121
89122
8912389125
89128
89129
89130
89131
89134
89135
89138
89139
89141
89142
89143
89144
89145
89146
89147
89148
89149
89156
89166
89169
Average All Zip Codes
Average Single Family Lease Price – Las Vegas Valley Zip Codes – February 2010 through July 2010
$1,366
$1,379
$1,408
$1,618
$1,413
$1,199
$851
$1,132
$1,082
$1,388
$1,735
$875
$1,470
$1,182
$1,262
$1,521
$1,237
$800
$1,163
$1,254
$1,007
$928
$1,016
$1,028
$1,949
$1,065
$1,494
$994
$1,537
$1,115
$- $250 $500 $750 $1,000 $1,250 $1,500 $1,750 $2,000 $2,250 $2,500
89002
89005
89009
89011
89012
8901489015
89030
89031
89032
89044
89046
89048
89052
89060
89061
89074
89081
89084
89085
89086
89101
89102
89103
89104
89106
89107
89108
89109
Lease Price
Source: GLVAR, Coldwell Banker Premier Realty.
Note 1: These figures are averages based on a sample of homes. Individual properties may vary greatly from the sample average.
Note 2: Although all facts, figures and projections have been obtained from sources deemed reliable and are believed to be correct, no guarantee
or liability is assumed by its author. This report is meant to assist in the analysis of real estate and is not intended to comprehensively analyze the
ramifications for an individual or company. With any real estate transaction, your personal tax and legal counsel should be contacted.
8/8/2019 Rental Report - Mid Year 2010
http://slidepdf.com/reader/full/rental-report-mid-year-2010 5/25
$0.74
$0.70
$0.69
$0.68
$0.75
$0.72
$0.73
$0.71
$0.71
$0.70
$0.79
$0.84
$0.79
$0.69
$0.70
$0.71
$0.70
$0.81
$0.74
$0.68
$0.73
$0.69
$0.69
$0.67
$0.67
$0.65
$0.69
$0.66
$0.74
$0.53
$0.72
89119
89120
89121
89122
89123
89125
89128
89129
89130
8913189134
89135
89138
89139
89141
89142
89143
89144
89145
89146
89147
89148
89149
89156
89166
89169
8917889179
89183
89019
Average All Zip Codes
Average Single Family Lease Price/Sq.ft. – Las Vegas Valley Zip Codes – February 2010 through July 2010
$0.72
$0.87
$0.76
$0.80
$0.78
$0.76
$0.68
$0.67
$0.69
$0.69
$0.80
$0.54
$0.77
$0.62
$0.66
$0.64
$0.61
$0.70
$0.67
$0.72
$0.73
$0.71
$0.69
$0.72
$0.73
$0.70
$0.73
$0.67
$0.72
$0.73
$0.00 $0.10 $0.20 $0.30 $0.40 $0.50 $0.60 $0.70 $0.80 $0.90 $1.00 $1.10 $1.20
89002
89005
89011
89012
89014
8901589030
89031
89032
89044
89052
89060
89074
89081
89084
89085
89086
89101
89102
89103
89104
89106
8910789108
89109
89110
89113
89115
89117
89118
$/Sq.Ft
Source: GLVAR, Coldwell Banker Premier Realty.
Note 1: These figures are averages based on a sample of homes. Individual properties may vary greatly from the sample average.
Note 2: Although all facts, figures and projections have been obtained from sources deemed reliable and are believed to be correct, no guarantee
or liability is assumed by its author. This report is meant to assist in the analysis of real estate and is not intended to comprehensively analyze the
ramifications for an individual or company. With any real estate transaction, your personal tax and legal counsel should be contacted.
8/8/2019 Rental Report - Mid Year 2010
http://slidepdf.com/reader/full/rental-report-mid-year-2010 6/25
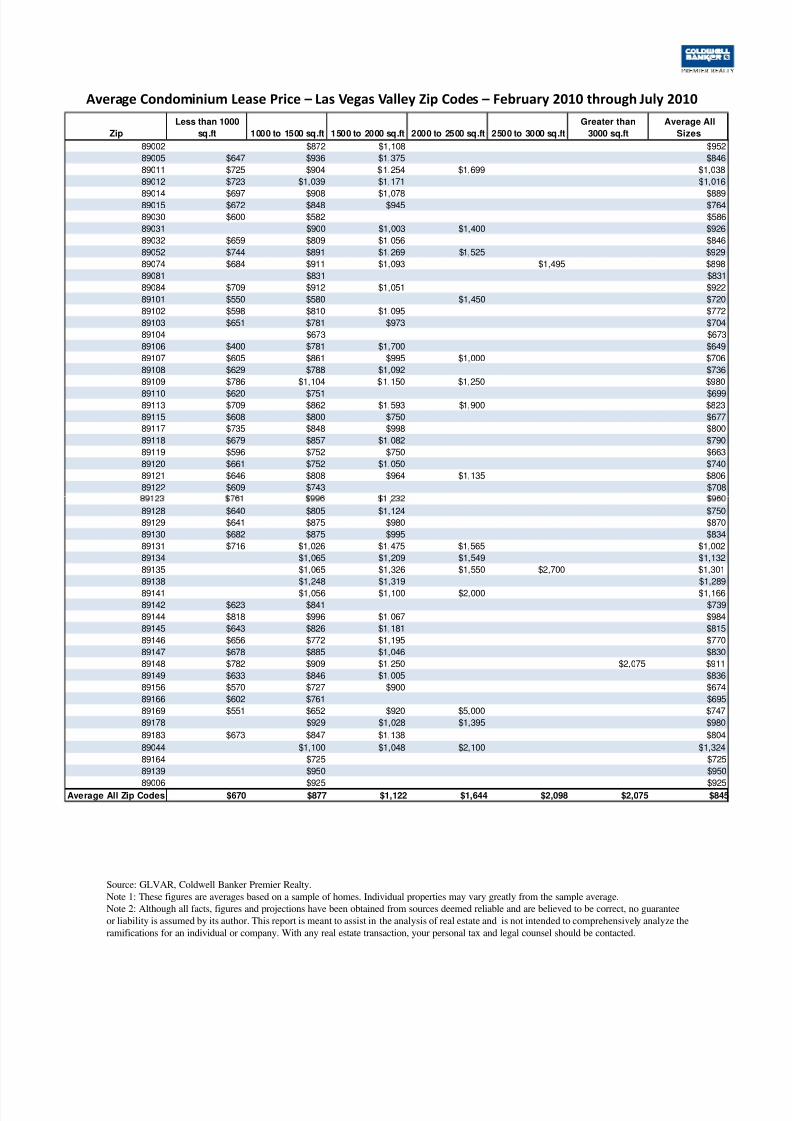
Average Condominium Lease Price – Las Vegas Valley Zip Codes – February 2010 through July 2010
Zip
Less than 1000
sq.ft 1000 to 1500 sq.ft 1500 to 2000 sq.ft 2000 to 2500 sq.ft 2500 to 3000 sq.ft
Greater than
3000 sq.ft
Average All
Sizes
89002 $872 $1,108 $952
89005 $647 $936 $1,375 $846
89011 $725 $904 $1,254 $1,699 $1,038
89012 $723 $1,039 $1,171 $1,016
89014 $697 $908 $1,078 $88989015 $672 $848 $945 $764
89030 $600 $582 $586
89031 $900 $1,003 $1,400 $926
89032 $659 $809 $1,056 $846
89052 $744 $891 $1,269 $1,525 $929
89074 $684 $911 $1,093 $1,495 $898
89081 $831 $831
89084 $709 $912 $1,051 $922
89101 $550 $580 $1,450 $720
89102 $598 $810 $1,095 $772
89103 $651 $781 $973 $704
89104 $673 $673
89106 $400 $781 $1,700 $649
89107 $605 $861 $995 $1,000 $706
89108 $629 $788 $1,092 $736
89109 $786 $1,104 $1,150 $1,250 $98089110 $620 $751 $699
89113 $709 $862 $1,593 $1,900 $823
89115 $608 $800 $750 $677
89117 $735 $848 $998 $800
89118 $679 $857 $1,082 $790
89119 $596 $752 $750 $663
89120 $661 $752 $1,050 $740
89121 $646 $808 $964 $1,135 $806
89122 $609 $743 $708
Source: GLVAR, Coldwell Banker Premier Realty.
Note 1: These figures are averages based on a sample of homes. Individual properties may vary greatly from the sample average.
Note 2: Although all facts, figures and projections have been obtained from sources deemed reliable and are believed to be correct, no guarantee
or liability is assumed by its author. This report is meant to assist in the analysis of real estate and is not intended to comprehensively analyze the
ramifications for an individual or company. With any real estate transaction, your personal tax and legal counsel should be contacted.
,
89128 $640 $805 $1,124 $750
89129 $641 $875 $980 $870
89130 $682 $875 $995 $834
89131 $716 $1,026 $1,475 $1,565 $1,002
89134 $1,065 $1,209 $1,549 $1,132
89135 $1,065 $1,326 $1,550 $2,700 $1,301
89138 $1,248 $1,319 $1,289
89141 $1,056 $1,100 $2,000 $1,166
89142 $623 $841 $739
89144 $818 $996 $1,067 $984
89145 $643 $826 $1,181 $815
89146 $656 $772 $1,195 $770
89147 $678 $885 $1,046 $830
89148 $782 $909 $1,250 $2,075 $911
89149 $633 $846 $1,005 $836
89156 $570 $727 $900 $674
89166 $602 $761 $695
89169 $551 $652 $920 $5,000 $747
89178 $929 $1,028 $1,395 $980
89183 $673 $847 $1,138 $804
89044 $1,100 $1,048 $2,100 $1,324
89164 $725 $725
89139 $950 $950
89006 $925 $925
Average All Zip Codes $670 $877 $1,122 $1,644 $2,098 $2,075 $845
8/8/2019 Rental Report - Mid Year 2010
http://slidepdf.com/reader/full/rental-report-mid-year-2010 7/25
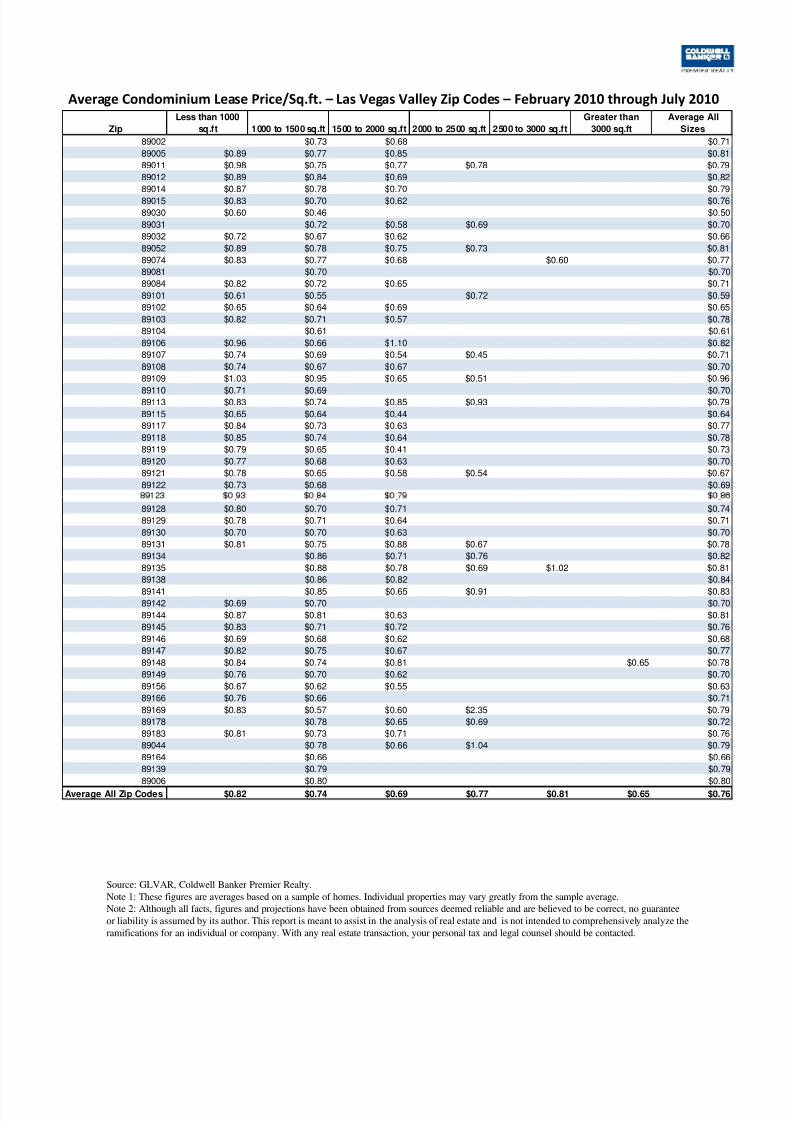
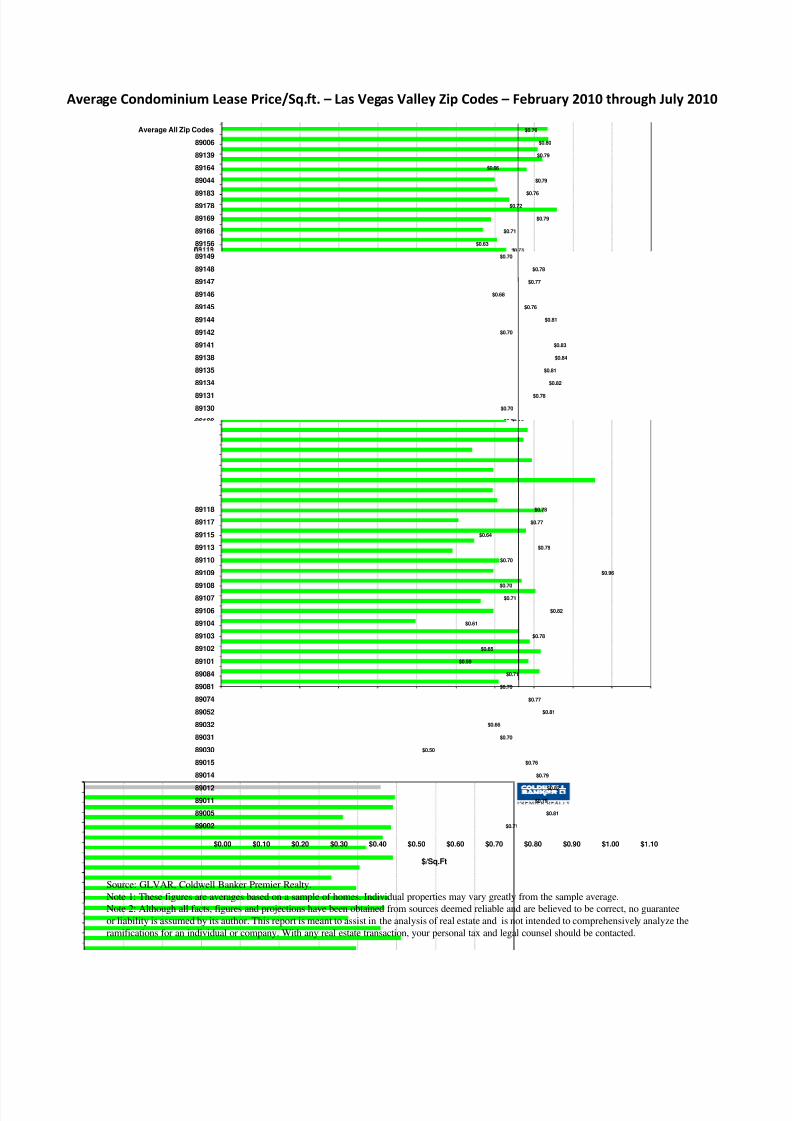
Average Condominium Lease Price/Sq.ft. – Las Vegas Valley Zip Codes – February 2010 through July 2010
Zip
Less than 1000
sq.ft 1000 to 1500 sq.ft 1500 to 2000 sq.ft 2000 to 2500 sq.ft 2500 to 3000 sq.ft
Greater than
3000 sq.ft
Average All
Sizes
89002 $0.73 $0.68 $0.71
89005 $0.89 $0.77 $0.85 $0.81
89011 $0.98 $0.75 $0.77 $0.78 $0.79
89012 $0.89 $0.84 $0.69 $0.82
89014 $0.87 $0.78 $0.70 $0.7989015 $0.83 $0.70 $0.62 $0.76
89030 $0.60 $0.46 $0.50
89031 $0.72 $0.58 $0.69 $0.70
89032 $0.72 $0.67 $0.62 $0.66
89052 $0.89 $0.78 $0.75 $0.73 $0.81
89074 $0.83 $0.77 $0.68 $0.60 $0.77
89081 $0.70 $0.70
89084 $0.82 $0.72 $0.65 $0.71
89101 $0.61 $0.55 $0.72 $0.59
89102 $0.65 $0.64 $0.69 $0.65
89103 $0.82 $0.71 $0.57 $0.78
89104 $0.61 $0.61
89106 $0.96 $0.66 $1.10 $0.82
89107 $0.74 $0.69 $0.54 $0.45 $0.71
89108 $0.74 $0.67 $0.67 $0.70
89109 $1.03 $0.95 $0.65 $0.51 $0.96
89110 $0.71 $0.69 $0.70
89113 $0.83 $0.74 $0.85 $0.93 $0.79
89115 $0.65 $0.64 $0.44 $0.64
89117 $0.84 $0.73 $0.63 $0.77
89118 $0.85 $0.74 $0.64 $0.78
89119 $0.79 $0.65 $0.41 $0.73
89120 $0.77 $0.68 $0.63 $0.70
89121 $0.78 $0.65 $0.58 $0.54 $0.67
89122 $0.73 $0.68 $0.69
Source: GLVAR, Coldwell Banker Premier Realty.
Note 1: These figures are averages based on a sample of homes. Individual properties may vary greatly from the sample average.
Note 2: Although all facts, figures and projections have been obtained from sources deemed reliable and are believed to be correct, no guarantee
or liability is assumed by its author. This report is meant to assist in the analysis of real estate and is not intended to comprehensively analyze the
ramifications for an individual or company. With any real estate transaction, your personal tax and legal counsel should be contacted.
. . . .
89128 $0.80 $0.70 $0.71 $0.74
89129 $0.78 $0.71 $0.64 $0.71
89130 $0.70 $0.70 $0.63 $0.70
89131 $0.81 $0.75 $0.88 $0.67 $0.78
89134 $0.86 $0.71 $0.76 $0.82
89135 $0.88 $0.78 $0.69 $1.02 $0.81
89138 $0.86 $0.82 $0.84
89141 $0.85 $0.65 $0.91 $0.83
89142 $0.69 $0.70 $0.70
89144 $0.87 $0.81 $0.63 $0.81
89145 $0.83 $0.71 $0.72 $0.76
89146 $0.69 $0.68 $0.62 $0.68
89147 $0.82 $0.75 $0.67 $0.77
89148 $0.84 $0.74 $0.81 $0.65 $0.78
89149 $0.76 $0.70 $0.62 $0.70
89156 $0.67 $0.62 $0.55 $0.63
89166 $0.76 $0.66 $0.71
89169 $0.83 $0.57 $0.60 $2.35 $0.79
89178 $0.78 $0.65 $0.69 $0.72
89183 $0.81 $0.73 $0.71 $0.76
89044 $0.78 $0.66 $1.04 $0.79
89164 $0.66 $0.66
89139 $0.79 $0.7989006 $0.80 $0.80
Average All Zip Codes $0.82 $0.74 $0.69 $0.77 $0.81 $0.65 $0.76

8/8/2019 Rental Report - Mid Year 2010
http://slidepdf.com/reader/full/rental-report-mid-year-2010 8/25
$740
$806
$708
$960
$750
$870
$834
$1,002
$1,132
$1,301
$1,289
$1,166
$739
$984
$815
$770
$830
$911
$836
$674
$695
$747
$980
$804
$1,324
$725
$950
$925
$845
89120
89121
89122
89123
89128
89129
89130
89131
89134
89135
89138
89141
89142
89144
89145
89146
89147
89148
89149
89156
89166
89169
89178
89183
89044
89164
89139
89006
Average All Z ip Codes
Average Condominium Lease Price – Las Vegas Valley Zip Codes – February 2010 through July 2010
$952
$846
$1,038
$1,016
$889
$764
$586
$926
$846
$929
$898
$831
$922
$720
$772
$704
$673
$649
$706
$736
$980
$699
$823
$677
$800
$790
$663
$0 $250 $500 $750 $1,000 $1,250 $1,500 $1,750 $2,000
89002
89005
89011
89012
89014
89015
89030
89031
89032
89052
89074
89081
89084
89101
89102
89103
89104
89106
89107
89108
89109
89110
89113
89115
89117
89118
89119
$/Sq.Ft
Source: GLVAR, Coldwell Banker Premier Realty.
Note 1: These figures are averages based on a sample of homes. Individual properties may vary greatly from the sample average.
Note 2: Although all facts, figures and projections have been obtained from sources deemed reliable and are believed to be correct, no guarantee
or liability is assumed by its author. This report is meant to assist in the analysis of real estate and is not intended to comprehensively analyze the
ramifications for an individual or company. With any real estate transaction, your personal tax and legal counsel should be contacted.
8/8/2019 Rental Report - Mid Year 2010
http://slidepdf.com/reader/full/rental-report-mid-year-2010 9/25
$0.70
$0.67
$0.69
$0.86
$0.74
$0.71
$0.70
$0.78
$0.82
$0.81
$0.84
$0.83
$0.70
$0.81
$0.76
$0.68
$0.77
$0.78
$0.70
$0.63
$0.71
$0.79
$0.72
$0.76
$0.79
$0.66
$0.79
$0.80
$0.76
89120
89121
89122
89123
89128
89129
89130
8913189134
89135
89138
89141
89142
89144
89145
89146
89147
89148
89149
89156
89166
89169
89178
89183
89044
89164
89139
89006
Average All Zip Codes
Average Condominium Lease Price/Sq.ft. – Las Vegas Valley Zip Codes – February 2010 through July 2010
$0.71
$0.81
$0.79
$0.82
$0.79
$0.76
$0.50
$0.70
$0.66
$0.81
$0.77
$0.70
$0.71
$0.59
$0.65
$0.78
$0.61
$0.82
$0.71
$0.70
$0.96
$0.70
$0.79
$0.64
$0.77
$0.78
.
$0.00 $0.10 $0.20 $0.30 $0.40 $0.50 $0.60 $0.70 $0.80 $0.90 $1.00 $1.10
89002
89005
89011
89012
89014
89015
89030
89031
89032
89052
89074
89081
89084
89101
89102
89103
89104
89106
89107
8910889109
89110
89113
89115
89117
89118
$/Sq.Ft
Source: GLVAR, Coldwell Banker Premier Realty.
Note 1: These figures are averages based on a sample of homes. Individual properties may vary greatly from the sample average.
Note 2: Although all facts, figures and projections have been obtained from sources deemed reliable and are believed to be correct, no guarantee
or liability is assumed by its author. This report is meant to assist in the analysis of real estate and is not intended to comprehensively analyze the
ramifications for an individual or company. With any real estate transaction, your personal tax and legal counsel should be contacted.

8/8/2019 Rental Report - Mid Year 2010
http://slidepdf.com/reader/full/rental-report-mid-year-2010 10/25
Subdivision Name
Less than
1000 1000 to 1500 1500 to 2000 2000 to 2500 2500 to 3000
Greater
than 3000
Average All
Sizes
ALLURE CONDO $1,211 $1,516 $2,300 $1,441
BOCA RATON $958 $1,267 $1,847 $1,149
JUHL $1,016 $1,500 $1,085
MANDARIN ORIENTAL $3,400 $5,000 $3,800METROPOLIS $1,625 $2,500 $2,750 $2,292
NEWPORT LOFTS $992 $1,449 $1,600 $1,286
ONE LAS VEGAS $1,043 $1,450 $1,825 $1,441
ONE QUEENSRIDGE PLACE PHASE 1 $3,900 $4,750 $6,133 $5,100
PALMS PLACE A RESORT CONDO & S $1,600 $2,300 $1,950
PANORAMA TOWER PHASE III $2,113 $3,275 $2,500
PANORAMA TOWERS 1 $1,824 $1,962 $2,731 $3,000 $6,250 $2,457
PANORAMA TOWERS 2 $1,508 $2,040 $2,530 $3,000 $4,000 $8,000 $2,579
REGENCY TOWERS AMD $1,613 $1,613
SKY LAS VEGAS $1,510 $1,990 $2,560 $4,300 $1,985
SOHO LOFTS $1,650 $1,630 $1,636
STREAMLINE TOWER $1,280 $1,750 $1,358
TURNBERRY M G M GRAND TOWERS L $1,800 $1,800
TURNBERRY PLACE AMD $2,000 $2,200 $3,146 $2,337
TURNBERRY PLACE PHASE 2 $2,783 $3,292 $3,122
TURNBERRY PLACE PHASE 3 AMD $1,950 $2,300 $3,700 $3,070
TURNBERRY PLACE PHASE 4 $1,650 $1,897 $2,800 $3,375 $2,399
TURNBERRY TOWERS AT PARADISE R $1,377 $2,275 $2,649 $1,853
VEER TOWERS $1,450 $1,450
Average All Projects $1,312 $1,840 $2,292 $2,902 $3,576 $6,530 $2,046
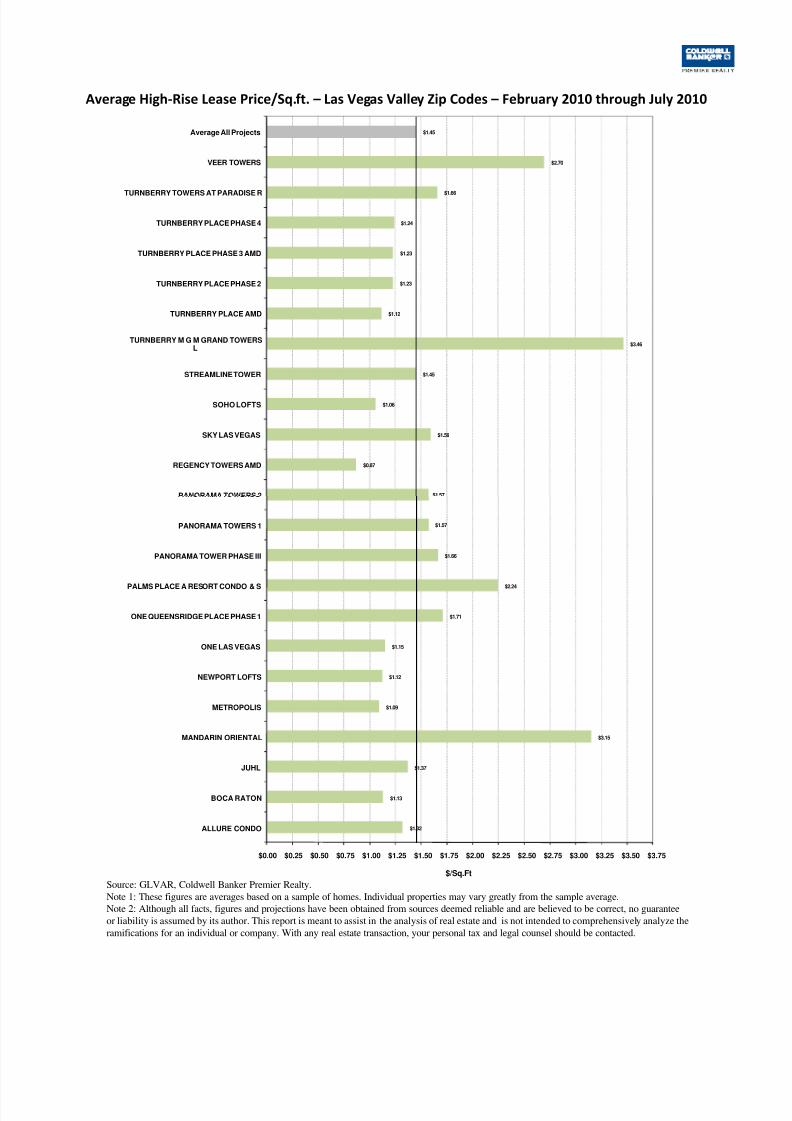
Average High-Rise Lease Price – Las Vegas Valley Zip Codes – February 2010 through July 2010
Subdivision Name
Less than
1000 1000 to 1500 1500 to 2000 2000 to 2500 2500 to 3000
Greater
than 3000
Average All
Sizes
ALLURE CONDO $1.35 $1.29 $1.34 $1.32
BOCA RATON $1.20 $1.03 $1.22 $1.13
JUHL $1.41 $1.13 $1.37MANDARIN ORIENTAL $3.18 $3.06 $3.15
METROPOLIS $1.10 $1.13 $1.04 $1.09
NEWPORT LOFTS $1.09 $1.19 $0.97 $1.12
ONE LAS VEGAS $1.23 $1.08 $1.17 $1.15
ONE QUEENSRIDGE PLACE PHASE 1 $1.77 $1.80 $1.60 $1.71
PALMS PLACE A RESORT CONDO & S $2.60 $1.89 $2.24
PANORAMA TOWER PHASE III $1.66 $1.67 $1.66
PANORAMA TOWERS 1 $1.70 $1.56 $1.65 $1.34 $1.20 $1.57
PANORAMA TOWERS 2 $1.74 $1.62 $1.46 $1.36 $1.35 $2.40 $1.57
REGENCY TOWERS AMD $0.87 $0.87
SKY LAS VEGAS $1.71 $1.56 $1.47 $1.44 $1.59
SOHO LOFTS $1.25 $0.98 $1.06
STREAMLINE TOWER $1.47 $1.31 $1.45
TURNBERRY M G M GRAND TOWERS L $3.46 $3.46TURNBERRY PLACE AMD $1.17 $1.00 $1.12 $1.12
TURNBERRY PLACE PHASE 2 $1.33 $1.17 $1.23
TURNBERRY PLACE PHASE 3 AMD $1.14 $1.05 $1.32 $1.23
TURNBERRY PLACE PHASE 4 $1.40 $1.17 $1.32 $1.20 $1.24
TURNBERRY TOWERS AT PARADISE R $1.69 $1.62 $1.60 $1.66
VEER TOWERS $2.70 $2.70
Average All Projects $1.55 $1.47 $1.36 $1.33 $1.28 $1.68 $1.45
Source: GLVAR, Coldwell Banker Premier Realty.
Note 1: These figures are averages based on a sample of homes. Individual properties may vary greatly from the sample average.
Note 2: Although all facts, figures and projections have been obtained from sources deemed reliable and are believed to be correct, no guarantee
or liability is assumed by its author. This report is meant to assist in the analysis of real estate and is not intended to comprehensively analyze the
ramifications for an individual or company. With any real estate transaction, your personal tax and legal counsel should be contacted.
Average High-Rise Lease Price/Sq.ft. – Las Vegas Valley Zip Codes – February 2010 through July 2010

8/8/2019 Rental Report - Mid Year 2010
http://slidepdf.com/reader/full/rental-report-mid-year-2010 11/25
$1,613
$1,985
$1,636
$1,358
$1,800
$2,337
$3,122
$3,070
$2,399
$1,853
$1,450
$2,046
REGENCY TOWERS AMD
SKY LAS VEGAS
SOHO LOFTS
STREAMLINE TOWER
TURNBERRY M G M GRAND TOWERS L
TURNBERRY PLACE AMD
TURNBERRY PLACE PHASE 2
TURNBERRY PLACE PHASE 3 AMD
TURNBERRY PLACE PHASE 4
TURNBERRY TOWERS AT PARADISE R
VEER TOWERS
Average All Projects
Average High-Rise Lease Price – Las Vegas Valley Zip Codes – February 2010 through July 2010
$1,441
$1,149
$1,085
$3,800
$2,292
$1,286
$1,441
$5,100
$1,950
$2,500
$2,457
,
$0 $500 $1,000 $1,500 $2,000 $2,500 $3,000 $3,500 $4,000 $4,500 $5,000 $5,500 $6,000
ALLURE CONDO
BOCA RATON
JUHL
MANDARIN ORIENTAL
METROPOLIS
NEWPORT LOFTS
ONE LAS VEGAS
ONE QUEENSRIDGE PLACE PHASE 1
PALMS PLACE A RESORT CONDO & S
PANORAMA TOWER PHASE III
PANORAMA TOWERS 1
$/Sq.Ft
Source: GLVAR, Coldwell Banker Premier Realty.
Note 1: These figures are averages based on a sample of homes. Individual properties may vary greatly from the sample average.
Note 2: Although all facts, figures and projections have been obtained from sources deemed reliable and are believed to be correct, no guarantee
or liability is assumed by its author. This report is meant to assist in the analysis of real estate and is not intended to comprehensively analyze the
ramifications for an individual or company. With any real estate transaction, your personal tax and legal counsel should be contacted.
8/8/2019 Rental Report - Mid Year 2010
http://slidepdf.com/reader/full/rental-report-mid-year-2010 12/25
Average High-Rise Lease Price/Sq.ft. – Las Vegas Valley Zip Codes – February 2010 through July 2010
$1.57
$0.87
$1.59
$1.06
$1.45
$3.46
$1.12
$1.23
$1.23
$1.24
$1.66
$2.70
$1.45
PANORAMA TOWERS 2
REGENCY TOWERS AMD
SKY LAS VEGAS
SOHO LOFTS
STREAMLINE TOWER
TURNBERRY M G M GRAND TOWERSL
TURNBERRY PLACE AMD
TURNBERRY PLACE PHASE 2
TURNBERRY PLACE PHASE 3 AMD
TURNBERRY PLACE PHASE 4
TURNBERRY TOWERS AT PARADISE R
VEER TOWERS
Average All Projects
Source: GLVAR, Coldwell Banker Premier Realty.
Note 1: These figures are averages based on a sample of homes. Individual properties may vary greatly from the sample average.
Note 2: Although all facts, figures and projections have been obtained from sources deemed reliable and are believed to be correct, no guarantee
or liability is assumed by its author. This report is meant to assist in the analysis of real estate and is not intended to comprehensively analyze the
ramifications for an individual or company. With any real estate transaction, your personal tax and legal counsel should be contacted.
$1.32
$1.13
$1.37
$3.15
$1.09
$1.12
$1.15
$1.71
$2.24
$1.66
$1.57
$0.00 $0.25 $0.50 $0.75 $1.00 $1.25 $1.50 $1.75 $2.00 $2.25 $2.50 $2.75 $3.00 $3.25 $3.50 $3.75
ALLURE CONDO
BOCA RATON
JUHL
MANDARIN ORIENTAL
METROPOLIS
NEWPORT LOFTS
ONE LAS VEGAS
ONE QUEENSRIDGE PLACE PHASE 1
PALMS PLACE A RESORT CONDO & S
PANORAMA TOWER PHASE III
PANORAMA TOWERS 1
$/Sq.Ft

8/8/2019 Rental Report - Mid Year 2010
http://slidepdf.com/reader/full/rental-report-mid-year-2010 13/25
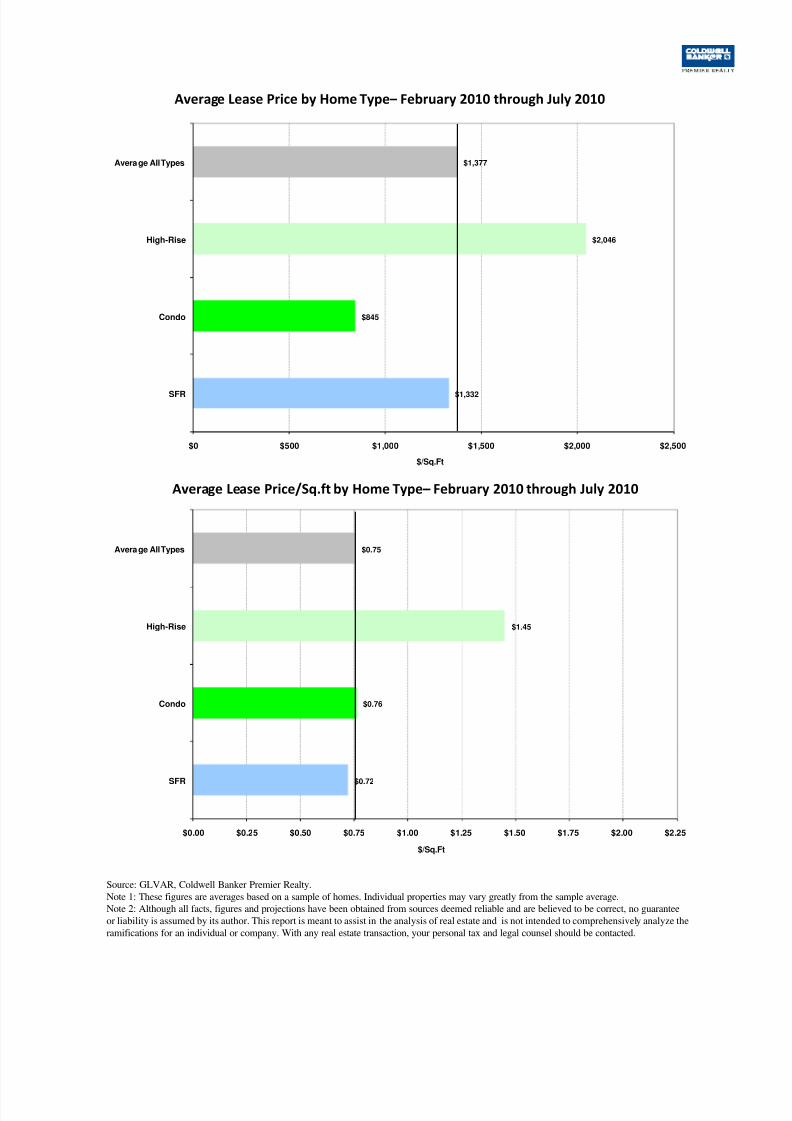
Average Lease Price by Home Type– February 2010 through July 2010
HOME TYPE
Less than
1000
1000 to
1500
1500 to
2000
2000 to
2500
2500 to
3000
Greater
than 3000
Average
All Sizes
SFR $811 $1,025 $1,213 $1,475 $1,785 $2,588 $1,332
Condo $670 $877 $1,122 $1,644 $2,098 $2,075 $845
High-Rise $1,312 $1,840 $2,292 $2,902 $3,576 $6,530 $2,046
Average All Types $766 $1,056 $1,613 $1,587 $1,835 $2,900 $1,377
HOME TYPE
Less than
1000
1000 to
1500
1500 to
2000
2000 to
2500
2500 to
3000
Greater
than 3000
Average
All Sizes
SFR $0.92 $0.78 $0.71 $0.67 $0.66 $0.68 $0.72
Condo $0.82 $0.74 $0.69 $0.77 $0.81 $0.65 $0.76
High-Rise $1.55 $1.47 $1.36 $1.33 $1.28 $1.68 $1.45
Average All Types $0.91 $0.78 $0.71 $0.68 $0.67 $0.68 $0.75
Average Lease Price/Sq.ft by Home Type– February 2010 through July 2010
Source: GLVAR, Coldwell Banker Premier Realty.
Note 1: These figures are averages based on a sample of homes. Individual properties may vary greatly from the sample average.
Note 2: Although all facts, figures and projections have been obtained from sources deemed reliable and are believed to be correct, no guarantee
or liability is assumed by its author. This report is meant to assist in the analysis of real estate and is not intended to comprehensively analyze the
ramifications for an individual or company. With any real estate transaction, your personal tax and legal counsel should be contacted.
8/8/2019 Rental Report - Mid Year 2010
http://slidepdf.com/reader/full/rental-report-mid-year-2010 14/25
Average Lease Price by Home Type– February 2010 through July 2010
$1,332
$845
$2,046
$1,377
$0 $500 $1,000 $1,500 $2,000 $2,500
SFR
Condo
High-Rise
Average All Types
$/Sq.Ft
Average Lease Price/Sq.ft by Home Type– February 2010 through July 2010
Source: GLVAR, Coldwell Banker Premier Realty.
Note 1: These figures are averages based on a sample of homes. Individual properties may vary greatly from the sample average.
Note 2: Although all facts, figures and projections have been obtained from sources deemed reliable and are believed to be correct, no guarantee
or liability is assumed by its author. This report is meant to assist in the analysis of real estate and is not intended to comprehensively analyze the
ramifications for an individual or company. With any real estate transaction, your personal tax and legal counsel should be contacted.
$0.72
$0.76
$1.45
$0.75
$0.00 $0.25 $0.50 $0.75 $1.00 $1.25 $1.50 $1.75 $2.00 $2.25
SFR
Condo
High-Rise
Average All Types
$/Sq.Ft

8/8/2019 Rental Report - Mid Year 2010
http://slidepdf.com/reader/full/rental-report-mid-year-2010 15/25
Appendix
Source: GLVAR, Coldwell Banker Premier Realty (unless otherwise noted).
Notes:
Some zip codes have few observations so averages should be used as a general guide. The
following tables (counts of leased homes) show the number of observations in each zip code.
Further, some areas have a greater proportion of leased homes in the smaller square foot
ranges so they often have higher average lease rates. Please refer to the individual tables to
ascertain figures for specific zip codes.
Homes are like other economic goods, that is, there is diminished marginal utility for
increased square footage and for price decreases, individuals will typically lease more square
feet. This is something to keep in mind when approaching lease rates as well as when viewing
absolute prices on the largest of homes. Please see the charts below for a graphical view.
The amount of vacant listed homes will keep pressures on rents for some time (see MLS
listings by Occupancy Status Exhibit as well as Clark County figures for overall vacancy
rates). In the popular rental range of homes less than 1,500 sq.ft, homes have leased in a
,
amenities and finishes (see lease price trends exhibits).
It should also be noted that lease prices vary by the duration of the lease.
Glossary
Capitalization Rate: Ratio of net operating income generated by an asset divided by its cost
(or value).
High-Rise: Building 20 stories or greater.
Mid-Rise: Building 5-20 stories.

8/8/2019 Rental Report - Mid Year 2010
http://slidepdf.com/reader/full/rental-report-mid-year-2010 16/25
-5%
0%
5%
10%
15%
20%
25%
30%
$0 $50,000 $100,000 $150,000 $200,000 $250,000 $300,000 $350,000 $400,000 $450,000 $500,000
C a p R a t e
Sale Price
Single Family Rental Cap Rates vs. Sale Price
-5%
0%
5%
10%
15%
20%
25%
30%
$0.00 $0.20 $0.40 $0.60 $0.80 $1.00 $1.20 $1.40 $1.60
C a p R a t e
Rent/Sq.ft.
Single Family Rental Cap Rates vs. Rent/Sq.ft
25%
30%
Single Family Rental Cap Rates vs. Year Built
25%
30%
Single Family Rental Cap Rates vs. Sq.ft
Asset Return – Relationship between return and property characteristics
-5%
0%
5%
10%
15%
20%
1930 1940 1950 1960 1970 1980 1990 2000 2010
C a p R a t e
Year Built-5%
0%
5%
10%
15%
20%
0 500 1000 1500 2000 2500 3000 3500 4000 4500
C a p R a t e
Sq.ft.
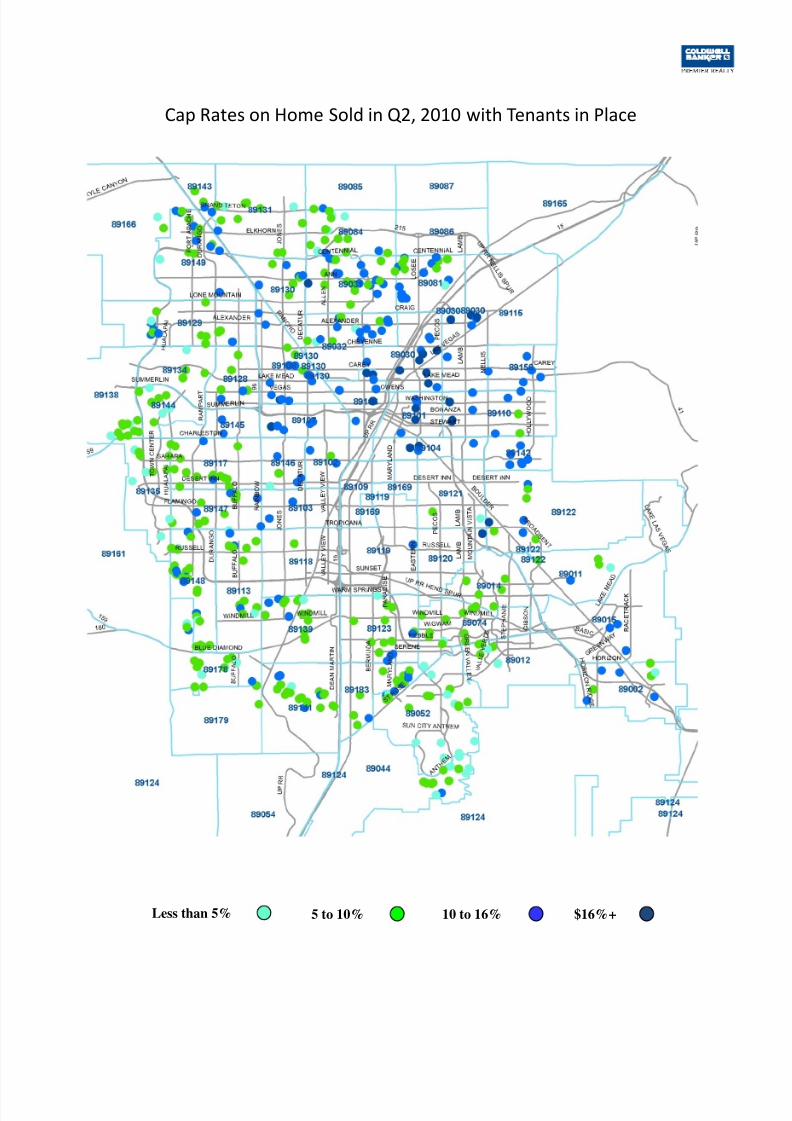
Based on a Q2, 2010 sample of single family homes that sold with tenants in place.
Source: Mlxchange, Coldwell Banker Premier Realty.

8/8/2019 Rental Report - Mid Year 2010
http://slidepdf.com/reader/full/rental-report-mid-year-2010 17/25
$-
$200
$400$600
$800
$1,000
$1,200
$1,400
$1,600
$1,800
$2,000
$2,200
$2,400
$2,600
$2,800
$3,000
$3,200
J a n - 0 7
M a r - 0 7
M a y - 0 7
J u l - 0 7
S e p - 0 7
N o v - 0 7
J a n - 0 8
M a r - 0 8
M a y - 0 8
J u l - 0 8
S e p - 0 8
N o v - 0 8
J a n - 0 9
M a r - 0 9
M a y - 0 9
J u l - 0 9
S e p - 0 9
N o v - 0 9
J a n - 1 0
M a r - 1 0
M a y - 1 0
J u l - 1 0
L e a s e P r i c e
Single Family Lease Prices - January 2007 through July 2010
Lease Price Trends
$-
$0.25
$0.50
$0.75
$1.00
$1.25
$1.50
$1.75
$2.00
J a n - 0 7
M a r - 0 7
M a y - 0 7
J u l - 0 7
S e p - 0 7
N o v - 0 7
J a n - 0 8
M a r - 0 8
M a y - 0 8
J u l - 0 8
S e p - 0 8
N o v - 0 8
J a n - 0 9
M a r - 0 9
M a y - 0 9
J u l - 0 9
S e p - 0 9
N o v - 0 9
J a n - 1 0
M a r - 1 0
M a y - 1 0
J u l - 1 0
L e a s e P r i c e
Single Family Lease Prices Per Square Foot (Avg.) - January 2007 through July 2010
Less than 1000 1000 to 1500 1500 to 2000 2000 to 2500 2500 to 3000 Greater than 3000
8/8/2019 Rental Report - Mid Year 2010
http://slidepdf.com/reader/full/rental-report-mid-year-2010 18/25
$-
$200
$400
$600
$800
$1,000
$1,200
$1,400
$1,600
$1,800
$2,000
$2,200
$2,400
$2,600
$2,800
J a n - 0 7
M a r - 0 7
M a y - 0 7
J u l - 0 7
S e p - 0 7
N o v - 0 7
J a n - 0 8
M a r - 0 8
M a y - 0 8
J u l - 0 8
S e p - 0 8
N o v - 0 8
J a n - 0 9
M a r - 0 9
M a y - 0 9
J u l - 0 9
S e p - 0 9
N o v - 0 9
J a n - 1 0
M a r - 1 0
M a y - 1 0
J u l - 1 0
L e a s e P r i c e
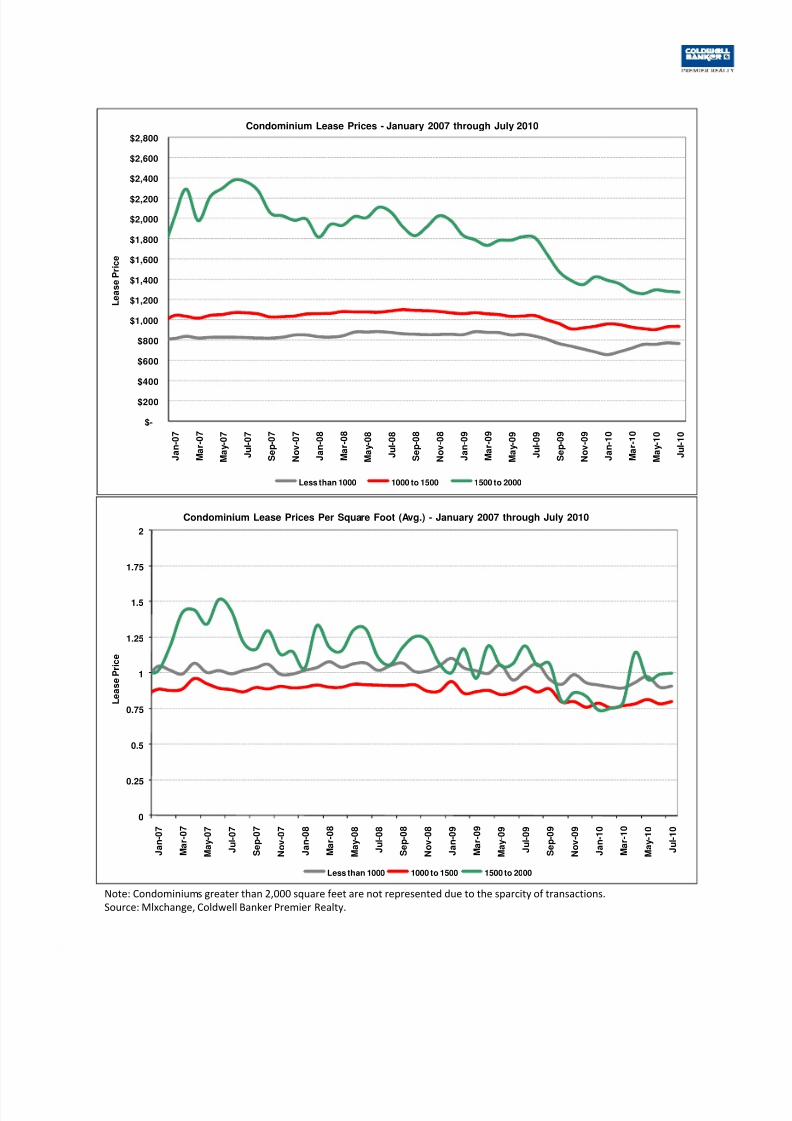
Condominium Lease Prices - January 2007 through July 2010
Less than 1000 1000 to 1500 1500 to 2000
0
0.25
0.5
0.75
1
1.25
1.5
1.75
2
J a n - 0 7
M a r - 0 7
M a y - 0 7
J u l - 0 7
S e p - 0 7
N o v - 0 7
J a n - 0 8
M a r - 0 8
M a y - 0 8
J u l - 0 8
S e p - 0 8
N o v - 0 8
J a n - 0 9
M a r - 0 9
M a y - 0 9
J u l - 0 9
S e p - 0 9
N o v - 0 9
J a n - 1 0
M a r - 1 0
M a y - 1 0
J u l - 1 0
L e a s e P r i c e
Condominium Lease Prices Per Square Foot (Avg.) - January 2007 through July 2010
Less than 1000 1000 to 1500 1500 to 2000
Note: Condominiums greater than 2,000 square feet are not represented due to the sparcity of transactions.
Source: Mlxchange, Coldwell Banker Premier Realty.

8/8/2019 Rental Report - Mid Year 2010
http://slidepdf.com/reader/full/rental-report-mid-year-2010 19/25
11.8
8.37.8
8.4
10.3
8.3
9.0
10.8
9.59.9
11.912.1
15.2
12.9
15.2
16.0
16.7
15.0
12.9 12.813.0
15.1
0
2
4
6
8
10
12
14
16
18
1Q
2005
2Q
2005
3Q
2005
4Q
2005
1Q
2006
2Q
2006
3Q
2006
4Q
2006
1Q
2007
2Q
2007
3Q
2007
4Q
2007
1Q
2008
2Q
2008
3Q
2008
4Q
2008
1Q
2009
2Q
2009
3Q
2009
4Q
2009
1Q
2010
2Q
2010
V a c a n c y %
Rental Vacancy Rate - Las Vegas
Vacancy Rates
2.0%2.5% 2.5% 2.6%
3.8%
2.8%
3.8%4.3%
6.2%
5.1%
6.4% 6.2% 6.2%
7.3%
5.8%
6.5%6.8% 6.9% 6.8%
11.3%
0.0%
2.0%
4.0%
6.0%
8.0%
10.0%
12.0%
2000 2001 2002 2003 2004 2005 2006 2007 2008 2009
V a c a n c y %
Vacancy Rates by Housing Type - Rental & Owner Occupied
Single Family Multi-Family
Source: Census.
Source: Clark County Population Estimates, GILIS, U.S Postal Service, NV Energy.
8/8/2019 Rental Report - Mid Year 2010
http://slidepdf.com/reader/full/rental-report-mid-year-2010 20/25
90.1%
92.7%
96.3%
94.3%
91.2%
90.5%
94.6%
93.8%
92.5%
93.5%83.6%
92.9%
94.9%
95.1%
95.4%
96.1%
94.5%
95.8%
92.1%
94.4%
93.4%
94.5%
93.4%
93.8%
93.5%
94.5%
91.0%
90.8%
90.7%
94.9%
93.3%
81.7%
91.5%
93.8%
94.0%
89110
89113
89115
89117
89118
89119
89120
89121
89122
8912389124
89128
89129
89130
89131
89134
89135
89138
89139
89141
89142
89143
89144
89145
89146
89147
89148
89149
89156
89161
89165
89166
89169
89178
89179
89183
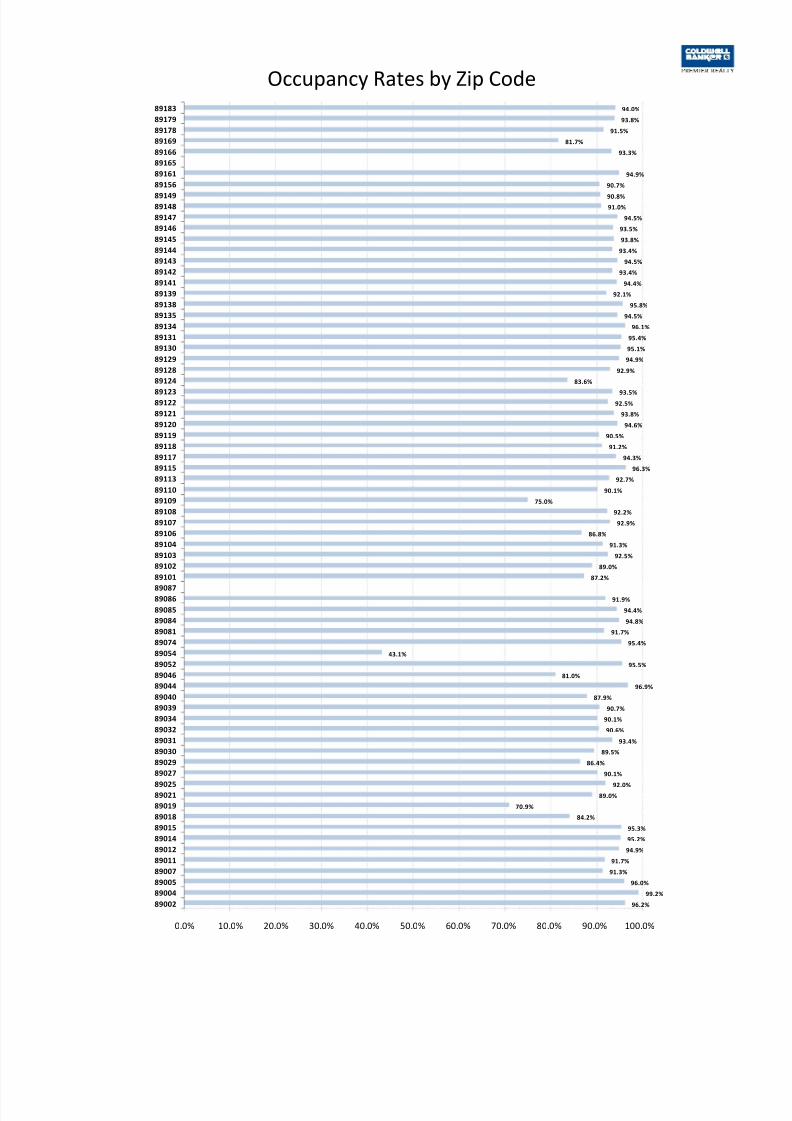
Occupancy Rates by Zip Code
96.2%
99.2%
96.0%
91.3%
91.7%
94.9%
95.2%
95.3%
84.2%
70.9%
89.0%
92.0%
90.1%
86.4%
89.5%
93.4%
90.6%
90.1%
90.7%
87.9%
96.9%
81.0%
95.5%
43.1%
95.4%
91.7%
94.8%
94.4%
91.9%
87.2%
89.0%
92.5%
91.3%
86.8%
92.9%
92.2%
75.0%
0.0% 10.0% 20.0% 30.0% 40.0% 50.0% 60.0% 70.0% 80.0% 90.0% 100.0%
89002
89004
89005
89007
89011
89012
89014
89015
89018
89019
89021
89025
89027
89029
89030
89031
89032
89034
89039
89040
89044
89046
89052
89054
89074
89081
89084
89085
89086
8908789101
89102
89103
89104
89106
89107
89108
89109
8/8/2019 Rental Report - Mid Year 2010
http://slidepdf.com/reader/full/rental-report-mid-year-2010 21/25
10
20
30
40
50
60
70
80
90
100
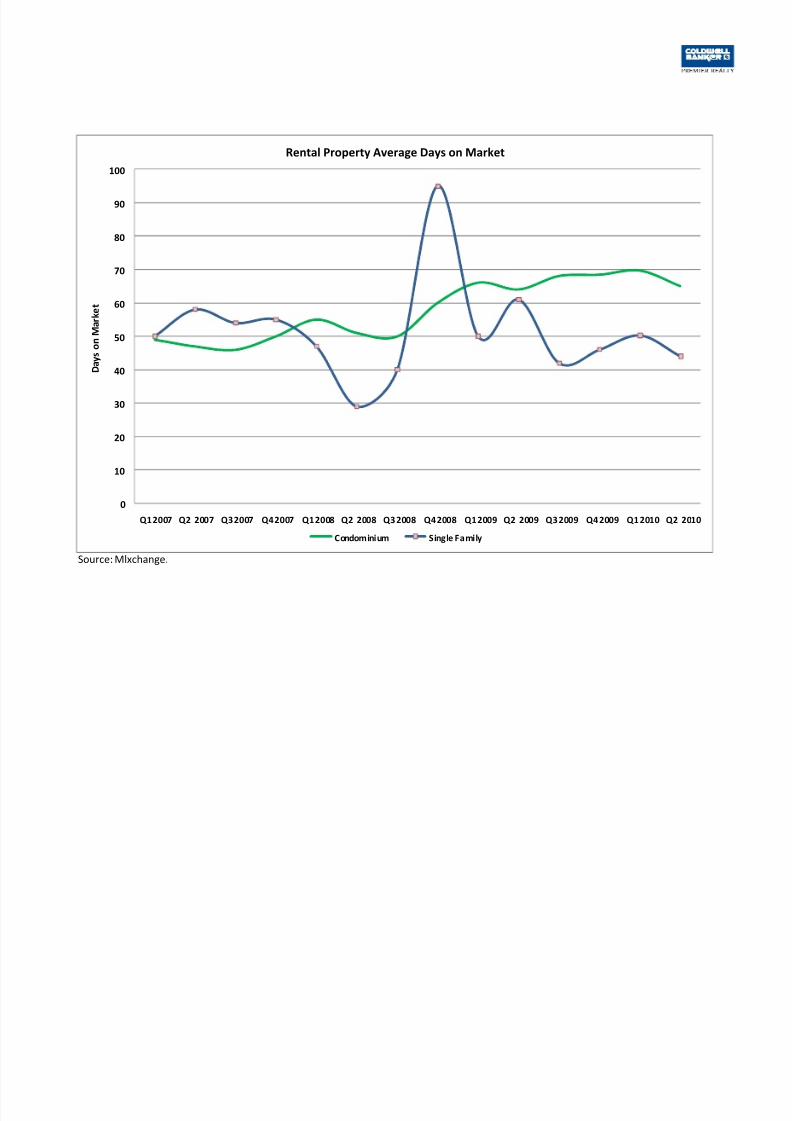
D a y s o n M a r k e t
Rental Property Average Days on Market
0
Q1 2007 Q2 2007 Q3 2007 Q4 2007 Q1 2008 Q2 2008 Q3 2008 Q4 2008 Q1 2009 Q2 2009 Q3 2009 Q4 2009 Q1 2010 Q2 2010
Condominium Single Family
Source: Mlxchange.

8/8/2019 Rental Report - Mid Year 2010
http://slidepdf.com/reader/full/rental-report-mid-year-2010 22/25
$0.00
$0.20
$0.40
$0.60
$0.80
$1.00
$1.20
$1.40
$1.60
$1.80
0 500 1,000 1,500 2,000 2,500 3,000 3,500 4,000 4,500 5,000
$ / S q . F t .
Leased Single Family - February 2010 to July 2010
$0.00
$0.20
$0.40
$0.60
$0.80
$1.00
$1.20
$1.40
$1.60
$1.80
0 500 1,000 1,500 2,000 2,500 3,000
$ / S q . F t .
Square Feet
Leased Conominiums - February 2010 to July 2010
8/8/2019 Rental Report - Mid Year 2010
http://slidepdf.com/reader/full/rental-report-mid-year-2010 23/25
Cap Rates on Home Sold in Q2, 2010 with Tenants in Place
$16%+10 to 16%5 to 10%Less than 5%

8/8/2019 Rental Report - Mid Year 2010
http://slidepdf.com/reader/full/rental-report-mid-year-2010 24/25
Q2, 20010 Rental Home Prices Per
Square Foot Las Vegas ValleyHomes Between 1,500 & 2,000 Sq.Ft
Monthly $/Sq.ft
Source: GLVAR, Coldwell Banker Premier Realty.
$1.30+$.85 to $1.30$.70 to $.85Less than $.70

8/8/2019 Rental Report - Mid Year 2010
http://slidepdf.com/reader/full/rental-report-mid-year-2010 25/25
Las Vegas Valley Zip Codes