remote systems, inc. - world-class business plans - when quality
TRANSCRIPT
Remote Systems, Inc.
Premier Provider of Digital Security Surveillance For The U.S. Private and Public Sectors
Seeks Investor Contributions In The Amount Of
$10,000,000
April 1, 2006
This document is a Business Plan and does not constitute an offer to sell or a solici-
tation to purchase. It contains confidential information, including trade secrets, and
may not be reproduced without the express permission of the company named below.
Business Plan Highlights:
Premier provider of remote video surveillance, utilizing digital technology
Exploits heightened public sensitivity to existing security vulnerabilities
Targets U.S. demand of $13B, by 2010, and worldwide demand of $28B
Highly seasoned management team, supported by top advisors & staff
TABLE OF CONTENTS:
Executive Summary… Financial Summary………… PAGES 2-3 Company…………… Services and Products.......…. PAGES 4-5 Market……………… Industry…………………… PAGES 6-7 Strategy……………... Implementation…………… PAGES 8-9 Management………... Risk Assessment………...… PAGES 10-11
Capitalization Plan….. Business Projections………. PAGES 12-13 Sales…...…...……….. Net Income……………….. PAGES 14-15 Cash Flow….……..… Balance Sheet……………... PAGES 16-17 References……………………………………………. PAGE 18
Remote Systems, Inc.
Contact: James Miller, Managing Partner, Capital Funding, Inc.
2420 Pennsylvania Ave., Washington, DC 10023
Phone: (344) 522-6278 • E-Mail: [email protected]
Executive Summary
Company. Remote Systems, Inc., will be the premier provider of remote digital video surveillance, for busi-nesses, residences, and public agencies in the U.S. It will be a North Carolina C corporation, with head-quarters and principal operating facilities, located in Raleigh, NC, within the famed Research Triangle Park.
Services and Products. The company will provide remote surveillance of private and public premises, uti-lizing existing digital and IP technology, in conjunction with high-speed cable and phone connections. It of-fers video and GPS monitoring subscriptions, security consulting services, equipment sales, and installation.
Market. Within the $66 billion U.S. security industry, digital video surveillance represents the fastest grow-ing sector, with an average annual growth rate of 55%. In 2006, the U.S. market for the types of surveillance services that Remote offers will be $2.3 billion — by 2010, this figure is anticipated to reach $13.1 billion.
Industry. Existing providers of remote surveillance cater to high-end corporate clients or focus on niche security products, but by offering a wide selection of affordable service plans and digital equipment to a broad base of businesses, consumers, and public agencies, Remote plans to quickly dominate competition.
Strategy. Strategies for success include: establishing commercial capacity, by October 1, 2006; optimizing operating processes to assure net profitability and customer satisfaction; conducting effective marketing to maximize company revenues; and promoting robust research and development to ensure long-term growth.
Implementation. The operating plan will utilize a six-month pre-operating period to finalize software devel-opment and establish a commercial capacity, capable of serving a broad range of clients, nationwide. The marketing plan will rely upon multi-channel advertising and major strategic alliances to generate revenues.
Management. The company will be led by its founder, a seasoned security industry executive and prior deputy sheriff for San Diego County. He will be supported by a high-caliber management team, well-chosen Board of Advisors, network of strategic supply partners, and a well-qualified staff of security professionals.
Risk Assessment. Remote is poised to exploit the tremendous private and public sector demand that ex-ists in the U.S. and worldwide, for affordable, remote surveillance that utilizes digital technology. Key suc-cess factors, along with critical risk factors, have been evaluated — business success is highly achievable.
Tragic events in the U.S., and elsewhere, have heightened global awareness of the need for early-warning security systems to deal with foreign terrorism, domestic crime, and natural disasters. This pandemic need has given rise to a global security industry, totaling $185 billion, with one-third of this demand generated in the U.S. Contracted security guards account for 40% of all service expenditures, but this is prohibitively expensive for small businesses or individuals seeking round-the-clock security coverage. While most security monitoring services rely on analog-based, closed circuit TV, this solution has become a legacy system, in the face of new digital products and IP technology, capable of capturing, communicating, and evaluating a wide array of sensory signals emanating from anywhere in the world. Remote Systems intends to exploit the intersection of these exploding markets, by providing the private and public sectors state-of-the-art, remote sur-veillance that is interactive, economical, comprehensive, and scalable. In 2006, the projected U.S. demand for digital video surveillance is $2.3 billion, but by 2010, this figure will reach $13.1 billion, reflecting annual growth of 55%. Keys to success include establishing commercial presence, opti-mizing operating processes, marketing company offerings, and promoting research and develop-ment. The company is led by seasoned experts, who are supported by an array of top advisors.
Page 2 REMOTE SYSTEMS, INC.

Financial Summary
Remote Systems, Inc., is seeking investor contributions, totaling $10,000,000 by April 1, 2006. This cash infusion will result in dramatic revenue and income growth over the 3-year planning peri-od and position the company for global expansion, as an industry leader in remote surveillance.
Capitalization Plan. Remote proposes to pursue its strategic goals, by obtaining investor contributions, totaling $10,000,000, by April 1, 2006. These funds will be used to cover working capital requirements, total-ing $0.4 million, plus capital expenditures requirements, totaling $8.7 million, relating to property, plant & equipment and pre-operating costs classified as deferred charges, and to establish reserves of $0.9 million.
Projected Operating Results. Sales are projected to increase, from $14.9 million in FY1, to $46.4 million in FY3. Net income is projected to increase, from $0.7 million in FY1, to $12.3 million in FY3. Net income, as a percentage of sales, ranges from 5% to 27%; return on total investment ranges, from 7% to 123%. A mini-mum cash balance of $0.8 million occurs in Month 2, FY1; ending FY3 cash balance reaches $22.7 million.
REMOTE SYSTEMS, INC. Page 3
0
5,000
10,000
15,000
20,000
25,000
30,000
35,000
40,000
45,000
50,000
FY1 FY2 FY3
Projected Operating Highlights By Year ($000)
Sales
Gross Margin
EBITDA
Net Income
(5,000)
0
5,000
10,000
15,000
20,000
25,000
1QY1 2QY1 3QY1 4QY1 1QY2 2QY2 3QY2 4QY2 1QY3 2QY3 3QY3 4QY3
Projected Cash Flow By Quarter ($000)All Fiscal Years
Net Cash Flow
Cash Balance
0
2,000
4,000
6,000
8,000
10,000
12,000
14,000
1QY1 2QY1 3QY1 4QY1 1QY2 2QY2 3QY2 4QY2 1QY3 2QY3 3QY3 4QY3
Projected Sales By Quarter ($000)All Fiscal Years
(500)
0
500
1,000
1,500
2,000
2,500
3,000
3,500
1QY1 2QY1 3QY1 4QY1 1QY2 2QY2 3QY2 4QY2 1QY3 2QY3 3QY3 4QY3
Projected Net Income By Quarter ($000)All Fiscal Years
Operations: 10/1/06 Oct Nov Dec Jan Feb Mar Apr May Jun Jul Aug Sep FY1 FY2 FY3
Sales 588 581 721 788 1,086 1,113 1,307 1,384 1,623 1,703 1,948 2,082 14,924 30,073 46,368
Gross Margin 393 476 609 683 940 998 1,157 1,254 1,473 1,559 1,784 1,919 13,245 28,422 43,744
Operating Expenses 510 506 598 663 796 808 930 966 1,071 1,146 1,257 1,321 10,572 18,058 25,285
EBITDA (117) (30) 11 20 144 190 227 288 402 413 527 598 2,673 10,364 18,459
Income Before Taxes (263) (176) (136) (126) (2) 44 81 142 255 267 381 452 919 8,259 16,449
Net Income (197) (132) (102) (94) (1) 33 61 106 191 200 286 339 690 6,194 12,334
Percentages: Gross Margin/Sales 67% 82% 84% 87% 87% 90% 89% 91% 91% 92% 92% 92% 89% 95% 94%
EBITDA/Sales -20% -5% 2% 3% 13% 17% 17% 21% 25% 24% 27% 29% 18% 34% 40%
Net Income/Sales -34% -23% -14% -12% 0% 3% 5% 8% 12% 12% 15% 16% 5% 21% 27%
Return On Investment 7% 62% 123%
Net Cash Flow (1,317) (188) 82 (4) 41 110 146 185 253 265 345 404 322 7,150 12,833
Cash Balance - Ending 1,029 841 923 919 960 1,070 1,216 1,401 1,654 1,919 2,264 2,668 2,668 9,818 22,651
Projected Operating Highlights ($000)

Company
Mission-Vision. The company’s three-year mission is to become the premier U.S. provider of digital-based, remote surveillance for the private and public sectors. By melding existing technology, with proprie-tary software designed to detect local changes in video, audio, and other sensory input, and then communi-cate these changes to remote, monitoring locations for security evaluation, Remote Systems will provide low-cost, round-the-clock protection against a wide range of human and other physical threats affecting busi-nesses, residences and public premises. The long-term vision is to leverage inaugural success in the U.S., by offering remote monitoring services, security consulting, and digital equipment to consumers, worldwide. Business Opportunity. Tragic events in the U.S., and elsewhere, have sharpened global awareness of the need for early-warning security systems to deal with foreign terrorism, domestic crime, and natural disasters. Pandemic need for greater scrutiny of our environments has given rise to a global security industry, totaling $185 billion, with one-third of this demand generated in the U.S.
1 Contracted security guards account for
40% of all service expenditures,2
but this is a prohibitively expensive solution for businesses or individuals seeking omni-present security coverage — moreover, the analog-based, closed circuit TV products that form the backbone of most onsite or remote monitoring services have become legacy systems, in the face of new digital products and IP technology, capable of capturing, communicating and evaluating a wide array of sen-sory signals, emanating from anywhere in the world.
3 Remote Systems intends to exploit the intersection of
these exploding markets, by providing private and public sector consumers with state-of-the-art security monitoring that is economical, comprehensive, and scalable. In 2006, the projected U.S. demand for digital video surveillance is $2.3 billion — by 2010, this figure is expected to reach $13.1 billion, reflecting annual growth of 55%.
4 Existing providers cater to high-end corporate clients or focus on niche security products,
but by offering a wide selection of highly affordable service plans and digital equipment to a broad base of businesses, homeowners, and public agencies, Remote intends to quickly dominate competition. Keys to success include establishing commercial presence, optimizing key operating processes, effectively market-ing company offerings, and promoting robust research and development of new services and markets. To achieve its objectives, Remote Systems is seeking $10,000,000 in investor contributions, by April 1, 2006.
Legal Entity and Ownership. The company intends to in-corporate in North Carolina, as a C corporation, under the name, Remote Systems, Inc., doing business as Remote Systems. Its founder, Mr. Ralph Player, holds 100% owner-ship interest and will actively manage company operations.
History. Mr. Player possesses 15 years of security industry experience, involving executive-level responsibility in a se-curity management firm and street-level experience, as a sworn police officer. His financial advisor, Mr. James Miller, is an experienced intermediary and will act as a business development consultant. Substantial preliminary activities that have already occurred, include feasibility studies, strate-gic planning, market research, and key consultant retention.
Location and Facilities. Remote intends to locate its head-quarters and principal Video Monitoring Center in Raleigh, NC, within the Research Triangle Park. This unique re-search and development community is home to some of the most leading-edge, technological companies in the world.
Remote Systems, Inc., will be the premier provider of remote video surveillance, for businesses, residences, and public agencies, in the U.S. It will be a North Carolina C corporation, with head-quarters and operating facilities, located in Raleigh, NC, within the famed Research Triangle Park.
Page 4 REMOTE SYSTEMS, INC.
Actual Forecasted Forecasted
2004 12/31/05 03/31/06
ASSETS:
Cash 100,000
Property, Plant & Equipment 1,500 2,500 2,800
Deferred Charges 1,350 3,800 11,700
Total Assets 2,850 6,300 114,500
LIABILITIES:
Long-Term Notes Payable 100,000
Total Liabilities 0 0 100,000
EQUITY:
Paid-In Capital 2,850 6,300 14,500
Retained Earnings 0 0
Total Equity 2,850 6,300 14,500
Total Liabilities & Equity 2,850 6,300 114,500
Inception To Business Plan Start-Up
Financial History

Services and Products
The company will provide remote surveillance of private and public premises, utilizing existing digi-tal and IP technology, along with high-speed cable and phone connections. It offers video and GPS monitoring subscriptions, security consulting services, and equipment sales and installation.
Business Summary. Remote Systems will be the premier provider of re-mote surveillance in the U.S. and around the world. Leveraging digital tech-nology and equipment that utilizes cable or telephone connections, the com-pany will offer interactive, remote surveillance of business, residential, and government premises. Round-the-clock security evaluations of video, audio, motion, temperature or other digital sensory input will be performed, which are then communicated to end clients or to emergency responders. In addi-tion to protective services, including monitoring and GPS tracking, Remote will offer security consulting services and coordinate digital equipment sales and installation. Revenues will arise from monthly monitoring subscriptions, consulting fees, and vendor referral fees on equipment sales and installa-
REMOTE SYSTEMS, INC. Page 5
Avg. Revenue / Event
Tables & Chairs: $200
Other Equipment: $500
Kitchen Use: $75-150
Catering: $750-1,500
Entertainment: $500
Patio-BBQ: $75-150
Big Event: To $2,000
DIGITAL VIDEO SURVEILLANCE October 1, 2006
Following six months of preparation, Remote will offer remote digital video surveillance, for U.S. private and public sector clients, utilizing onsite digital equipment, IP technology, and high-speed cable or telephone connections:
Business: Any size firm, retail or industrial, internal or external premises.
Residential: Single detached or multi-unit, individual or gated complexes.
Government: Homeland Security risks, public buildings, airports, schools.
Monitoring Subscriptions
Remote Surveillance: 3 levels of video sur-veillance & interactive audio communication.
GPS Tracking: Satellite tracking of business assets, personal property, individuals or pets.
Consulting Services
The company will also offer a wide range of se-curity consulting services — clients can opt for an annual Flex Plan or for project-based support.
Equipment Sales & Installation
Leveraging a network of strategic alliances, Re-mote will earn referral fees on sales of cameras, DVRs, servers, and related onsite installation.
AVG. UNIT REVENUE
Monthly Subscriptions
Surveillance: $159-349
GPS Tracking: $19
Consulting Fees
Flex Plan: $12K/Yr.
Projects: $50K/Project
Vendor Referrals
Video Equip: $400/Unit
GPS Equip: $100/Unit
Competitive Comparison. Existing competitors cater to high-end corporate clients, rely on legacy systems, or focus on product sales. Remote will merge proprietary software with high-end technology to provide a full range of protective service and security consultancy solutions, for the entire spectrum of feasible end users.
Sourcing and Fulfillment. Remote will establish an industry benchmark for operating excellence, by rely-ing on the finest security technology experts available and by forging a network of strategic supply alliances.
Future Development. The company will promote robust development of new services, products, and mar-kets, on an international scale. The same technological capabilities that allow Remote to provide digital re-mote surveillance of U.S. facilities or installations can be applied to a host of similar applications, worldwide.
REMOTE SYSTEMS
Digital Surveillance
Market
Page 6 REMOTE SYSTEMS, INC.
Market Growth and Trends. The phenomenal growth of public and private sector reliance on remote, digi-tal-based surveillance is not restricted to the U.S. — the estimated global demand for these services is pro-jected to be $28 billion, by 2010.
13 Visionaries that can satisfy this pandemic demand are poised to succeed.
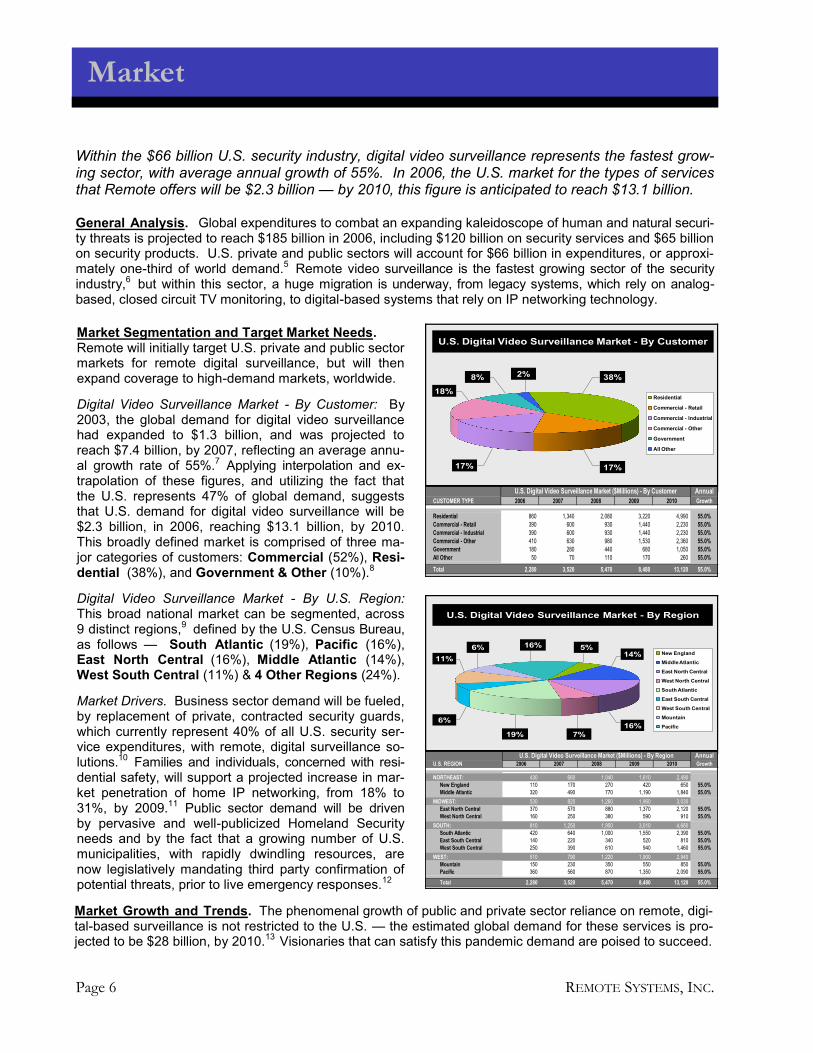
Market Segmentation and Target Market Needs. Remote will initially target U.S. private and public sector markets for remote digital surveillance, but will then expand coverage to high-demand markets, worldwide.
Digital Video Surveillance Market - By Customer: By 2003, the global demand for digital video surveillance had expanded to $1.3 billion, and was projected to reach $7.4 billion, by 2007, reflecting an average annu-al growth rate of 55%.
7 Applying interpolation and ex-
trapolation of these figures, and utilizing the fact that the U.S. represents 47% of global demand, suggests that U.S. demand for digital video surveillance will be $2.3 billion, in 2006, reaching $13.1 billion, by 2010. This broadly defined market is comprised of three ma-jor categories of customers: Commercial (52%), Resi-dential (38%), and Government & Other (10%).
8
Digital Video Surveillance Market - By U.S. Region: This broad national market can be segmented, across 9 distinct regions,
9 defined by the U.S. Census Bureau,
as follows — South Atlantic (19%), Pacific (16%), East North Central (16%), Middle Atlantic (14%), West South Central (11%) & 4 Other Regions (24%).
Market Drivers. Business sector demand will be fueled, by replacement of private, contracted security guards, which currently represent 40% of all U.S. security ser-vice expenditures, with remote, digital surveillance so-lutions.
10 Families and individuals, concerned with resi-
dential safety, will support a projected increase in mar-ket penetration of home IP networking, from 18% to 31%, by 2009.
11 Public sector demand will be driven
by pervasive and well-publicized Homeland Security needs and by the fact that a growing number of U.S. municipalities, with rapidly dwindling resources, are now legislatively mandating third party confirmation of potential threats, prior to live emergency responses.
12
Within the $66 billion U.S. security industry, digital video surveillance represents the fastest grow-ing sector, with average annual growth of 55%. In 2006, the U.S. market for the types of services that Remote offers will be $2.3 billion — by 2010, this figure is anticipated to reach $13.1 billion.
General Analysis. Global expenditures to combat an expanding kaleidoscope of human and natural securi-ty threats is projected to reach $185 billion in 2006, including $120 billion on security services and $65 billion on security products. U.S. private and public sectors will account for $66 billion in expenditures, or approxi-mately one-third of world demand.
5 Remote video surveillance is the fastest growing sector of the security
industry,6
but within this sector, a huge migration is underway, from legacy systems, which rely on analog-based, closed circuit TV monitoring, to digital-based systems that rely on IP networking technology.
Residential
Commercial - Retail
Commercial - Industrial
Commercial - Other
Government
All Other
U.S. Digital Video Surveillance Market - By Customer
38%
17%
2%8%
18%
17%
Annual
CUSTOMER TYPE 2006 2007 2008 2009 2010 Growth
Residential 860 1,340 2,080 3,220 4,990 55.0%
Commercial - Retail 390 600 930 1,440 2,230 55.0%
Commercial - Industrial 390 600 930 1,440 2,230 55.0%
Commercial - Other 410 630 980 1,530 2,360 55.0%
Government 180 280 440 680 1,050 55.0%
All Other 50 70 110 170 260 55.0%
Total 2,280 3,520 5,470 8,480 13,120 55.0%
U.S. Digital Video Surveillance Market ($Millions) - By Customer
New England
Middle Atlantic
East North Central
West North Central
South Atlantic
East South Central
West South Central
Mountain
Pacific
U.S. Digital Video Surveillance Market - By Region
14%5%16%
11%
6%
19% 7%
16%
6%
Annual
U.S. REGION 2006 2007 2008 2009 2010 Growth
NORTHEAST: 430 660 1,040 1,610 2,490
New England 110 170 270 420 650 55.0%
Middle Atlantic 320 490 770 1,190 1,840 55.0%
MIDWEST: 530 820 1,260 1,960 3,030
East North Central 370 570 880 1,370 2,120 55.0%
West North Central 160 250 380 590 910 55.0%
SOUTH: 810 1,250 1,950 3,010 4,660
South Atlantic 420 640 1,000 1,550 2,390 55.0%
East South Central 140 220 340 520 810 55.0%
West South Central 250 390 610 940 1,460 55.0%
WEST: 510 790 1,220 1,900 2,940
Mountain 150 230 350 550 850 55.0%
Pacific 360 560 870 1,350 2,090 55.0%
Total 2,280 3,520 5,470 8,480 13,120 55.0%
U.S. Digital Video Surveillance Market ($Millions) - By Region

Industry
Competitive Edge. Existing providers of remote surveillance generally target high-end corporate or other deep-pocket clients — many continue to rely on analog-based, legacy systems or limit themselves to the sale of niche products. Remote will dominate competition, by offering a wide selection of highly affordable service plans and the latest equipment to a broad base of businesses, homeowners and public agencies.
General Characteristics. In 2002, an estimated 23,000 investigative and security service firms were em-ployed in the U.S., generating $31.2 billion in revenues
14 — about 40% of these expenditures were related
to the hiring or contracting of physical security guards, with remaining costs spread among a host of investi-gative and security services. By 2006, the U.S. security services industry is projected to expand to $43 bil-lion, with approximately $15 billion related to security system services,
15 including firms that offer fire or other
alarm systems, and a growing number of techno-centric providers that offer electronic remote monitoring.
Emerging Trends. Following the tragic events of 9/11, the U.S. security industry has received huge impe-tus, from the Homeland Security Act of 2002,
16 state and municipal legislative changes, and heightened pub-
lic awareness of vulnerabilities that affect businesses, consumers, and governments. Greater reliance on technology, particularly involving digital and networking solutions, has created a high-demand environment.
Existing providers cater to high-end corporate clients or focus on niche security products, but by offering a wide selection of highly affordable service plans and digital equipment to a broad base of businesses, homeowners, and public agencies, Remote plans to quickly dominate competition.
KEY COMPETITORS
CATEGORY STRENGTHS CATEGORY WEAKNESSES
REMOTE SURVEILLANCE
Many dozens of providers, ranging from large to small:
Offers economic alternative to use of onsite security guards.
Many firms limited to alarm monitoring or legacy CCTV.
ADT Security Services Boca Raton, FL
Westec Interactive Irvine, CA
Protection One, Inc. Lawrence, KS
Monitronics International Dallas, TX
8 million customers, with 200 offices; wide range of services.
Pioneer in interactive security and video remote monitoring.
Specialist in firm alarm monitor-ing, with 1 million customers.
4th largest security alarm com-pany in U.S.; 500,00 customers.
Focus on alarms and access controls, not video monitoring.
Focus on high-end corporate clients, not smaller end users.
Little active presence, in field of remote video surveillance.
2-way interactive audio, but little or no use of remote video.
GPS MONITORING
Rapidly growing industry, with hundreds of product providers:
Allows tracking of key assets, individuals or pets, via satellite.
Very few third party monitoring services; focus is on products.
Security Intelligence Tech. Advanced Tracking Tech.
Offers turnkey home business. Offers vehicle tracking products.
Not a remote surveillance firm. No monitoring services offered.
SECURITY CONSULTING
Highly fragmented industry, with thousands of participants:
Many niche providers, with spe-cialized expertise and focus.
Usually limited to narrow field, not a full spectrum of services.
ICF Consulting Maven Security Consulting
Specialty: homeland security. Specialty: web applications.
Advisors; no real surveillance. Limited to web vulnerabilities.
REMOTE SYSTEMS, INC. Page 7

Strategy
Strategic Objectives. The company’s three-year mission is to become the premier U.S. provider of digital-based, remote surveillance for the private and public sectors. Strategies for success include: (1) complet-ing pre-operating tasks, necessary to establish full commercial capacity, by October 1, 2006; (2) optimizing key operating processes to ensure customer satisfaction and net profitability; (3) aggressively marketing company offerings to exploit competitive edge and maximize company revenues; and (4) promoting robust research and development of new services and expanded markets to position for long-tem business growth.
Establish Commercial Capacity: Commercial presence will be established, by completing six months of pre-operating tasks, designed to effectively implement the company’s business model. Critical steps include: (a) finalizing early-stage preparatory efforts, involving feasibility studies, strategic plan-ning, key management selection, consultant retention, and entity formation; (b) hiring software engi-neers to develop proprietary software that can utilize digital and IP network technology, along with high-speed cable and telephone connections, to permit remote security evaluations of video, audio, mo-tion, temperature or other digital sensory input; (c) licensing call center software to create two-way, interactive voice communication with end clients; (d) negotiating and moving into suitable commercial space, located in Raleigh, NC, in or near the Research Triangle Park; (e) hiring and training personnel, acquiring necessary data servers, purchasing and installing furniture, fixtures and equipment, and completing all other infrastructure, necessary to establish a state-of-the-art Video Monitoring Center; (f) developing early marketing initiatives and forging critical strategic alliances across the supply chain; and (g) completing all other tasks, necessary to ensure commercial operations, by October 1, 2006.
Optimize Operating Processes: Customer satisfaction and profitability will be assured, by optimizing key operating processes. This will involve: (a) minimizing labor costs, by maximizing the number of cameras that a technician can effectively monitor; (b) outsourcing equipment sales and installation to reputable vendors or contractors, utilizing drop shipments to eliminate warehousing, and conducting follow-on surveys to ensure client satisfaction; (c) confirming that camera set-ups protect individual rights of privacy; and (d) performing periodic evaluations to promote continual quality improvement.
Conduct Effective Marketing: Revenues will be maximized, by effectively marketing the company’s offerings and competitive advantages. Steps will include: (a) retaining a publicist to conduct a nation-wide, multi-channel marketing campaign, involving TV, radio, print and web-based advertising; and (b) forging strategic alliances with businesses, consumers, police associations, and local political groups.
Promote Research & Development: Long-term success will depend upon robust research and devel-opment that is focused on: (a) enlarging monitoring services to include in-transit freight surveillance and other high-value applications; (b) exploiting cross-marketing or other synergistic business opportu-nities; and (c) expanding remote surveillance services, from the U.S., to other key markets, worldwide.
MEASURES OF SUCCESS
TIME HORIZON
Establish Commercial Capacity
Optimize Operating Processes
Conduct Effective Marketing
Research & Develop Services and Markets
Short-Term FY1
Implement Model Full Operations 10/1/06
Define Processes Net Income = $0.7M
Multi-Channel Campaign Sales = $15M
N. American Markets Enlarge Services
Long-Term FY3
Add Monitoring Centers Global Network
Quality Improvement Net Income = $12M
Strategic Alliances Sales = $46M
Business Opportunities Worldwide Expansion
Strategies for success include: establishing commercial capacity, by October 1, 2006; optimizing operating processes to assure net profitability and customer satisfaction; conducting effective mar-keting to maximize revenues; and promoting robust research and development to ensure growth.
Page 8 REMOTE SYSTEMS, INC.
Implementation
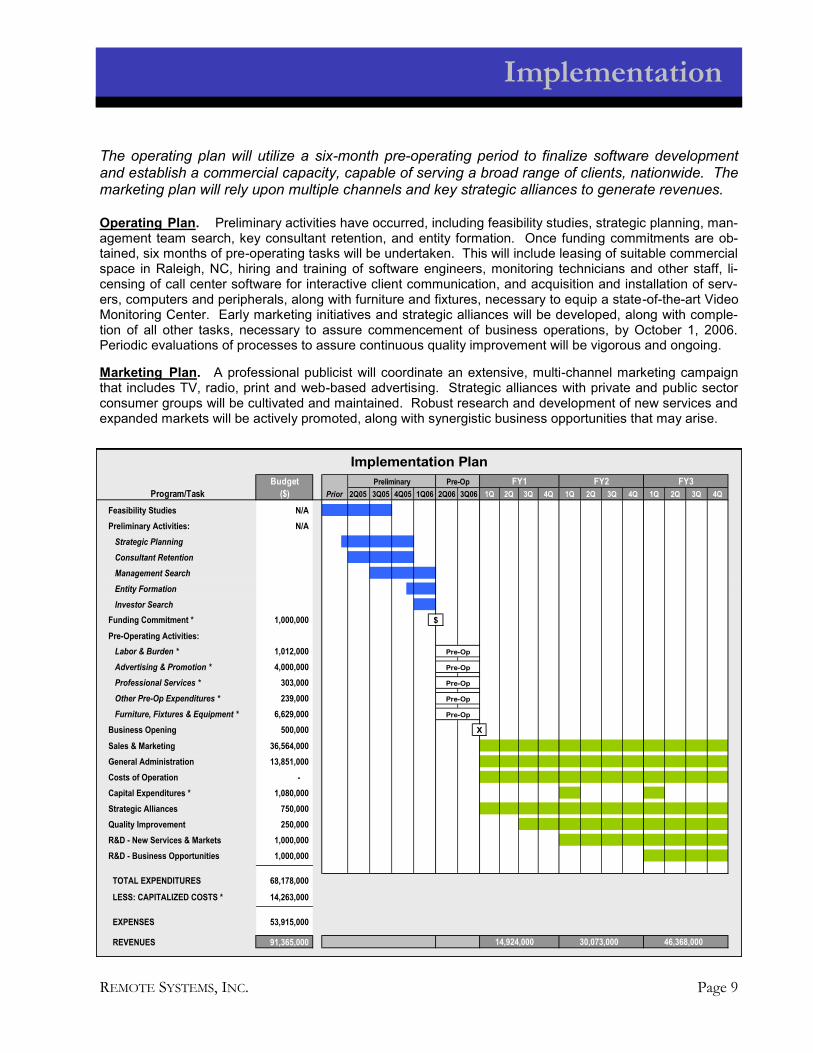
Operating Plan. Preliminary activities have occurred, including feasibility studies, strategic planning, man-agement team search, key consultant retention, and entity formation. Once funding commitments are ob-tained, six months of pre-operating tasks will be undertaken. This will include leasing of suitable commercial space in Raleigh, NC, hiring and training of software engineers, monitoring technicians and other staff, li-censing of call center software for interactive client communication, and acquisition and installation of serv-ers, computers and peripherals, along with furniture and fixtures, necessary to equip a state-of-the-art Video Monitoring Center. Early marketing initiatives and strategic alliances will be developed, along with comple-tion of all other tasks, necessary to assure commencement of business operations, by October 1, 2006. Periodic evaluations of processes to assure continuous quality improvement will be vigorous and ongoing.
Marketing Plan. A professional publicist will coordinate an extensive, multi-channel marketing campaign that includes TV, radio, print and web-based advertising. Strategic alliances with private and public sector consumer groups will be cultivated and maintained. Robust research and development of new services and expanded markets will be actively promoted, along with synergistic business opportunities that may arise.
The operating plan will utilize a six-month pre-operating period to finalize software development and establish a commercial capacity, capable of serving a broad range of clients, nationwide. The marketing plan will rely upon multiple channels and key strategic alliances to generate revenues.
REMOTE SYSTEMS, INC. Page 9
Budget
Program/Task ($) 2Q05 4Q 1Q 2Q 3Q 4Q 1Q 2Q 3Q 4Q
Feasibility Studies N/A
Preliminary Activities: N/A
Strategic Planning
Consultant Retention
Management Search
Entity Formation
Investor Search
Funding Commitment * 1,000,000
Pre-Operating Activities:
Labor & Burden * 1,012,000
Advertising & Promotion * 4,000,000
Professional Services * 303,000
Other Pre-Op Expenditures * 239,000
Furniture, Fixtures & Equipment * 6,629,000
Business Opening 500,000
Sales & Marketing 36,564,000
General Administration 13,851,000
Costs of Operation -
Capital Expenditures * 1,080,000
Strategic Alliances 750,000
Quality Improvement 250,000
R&D - New Services & Markets 1,000,000
R&D - Business Opportunities 1,000,000
TOTAL EXPENDITURES 68,178,000
LESS: CAPITALIZED COSTS * 14,263,000
EXPENSES 53,915,000
REVENUES 91,365,000 46,368,000 14,924,000 30,073,000
2Q 3Q
X
Pre-Op
Pre-Op
Implementation Plan
Prior
FY2 FY3FY1Preliminary
1Q2Q064Q053Q05 1Q06
Pre-Op
Pre-Op
3Q06
$
Pre-Op
Pre-Op

Management
Page 10 REMOTE SYSTEMS, INC.
The company will be led by its founder, a seasoned security industry executive and prior deputy sheriff for San Diego County. He will be supported by a top-caliber management team, well-chosen Board of Advisors, a network of strategic supply partners, and a staff of security experts.
Management Team. Key positions include President & CEO, which is filled, and 5 other management posi-tions, which remain unfilled — CTO; CFO; VP, Sales & Marketing; Director, Consulting; Director, Administra-tion & HR. This team will be supported by a Board of Advisors, outsourcing partners, and well qualified staff.
Board of Advisors. The company will maintain a Board of Advisors, comprised of senior executives, drawn from a cross-section of relevant industries in the private and public sectors. Initial advisors will include:
Business Development Consultant — James Miller: Over 20 years experience, in corporate finance, corporate development and investment banking, involving public and private companies, worldwide.
Technical Advisor — Barry Technical: Formerly, CEO of Digital Surveillance, a pioneering firm in the fields of interactive security and remote video surveillance, catering to high-end corporate clients.
Key Positions. The position of President & CEO will be filled, by the founder of the company; five other management positions remain unfilled, but an active recruiting search for suitable candidates is underway:
President & CEO: Provide mission, vision, strategic objectives and leadership toward company goals.
Chief Technology Officer: Execute technology strategies & manage outsourced technology vendors.
Chief Financial Officer: Ensure adequacy of financial management controls and reporting systems.
Vice President, Sales & Marketing: Promote company offerings and manage sales & marketing team.
Director, Consulting: Manage security consulting engagements & train qualified security consultants.
Director, Admin. & HR: Coordinate office administration, employee hiring and regulatory compliance.
Outsourcing Partners. The company will cultivate and maintain a broad network of strategic alliances, in-volving equipment vendors, installation contractors, and security consultants, to assure that Remote is posi-tioned to offer the finest in digital cameras, DVRs, servers, equipment installation, and security expertise.
Personnel Plan. The company will manage the pre-operating period with 27 full-time equivalent positions, including the 6-member Management Team, 17 other General & Administrative positions, and 4 Sales Rep-resentatives. During the three-year operating horizon, other positions will be added, as required. By the end of FY3, the company expects to support 140 FTE positions, including 98 G&A and 42 Sales Rep positions.
Ralph Player
Founder, President and Chief Executive Officer, Remote Systems, Inc.
Over 15 years of executive management and public service experience, including 10 years in the security industry and
5 years as a deputy sheriff and police officer. Seasoned manager, with experience in central bank vault operations,
corporate video monitoring, private security, and camera operations design. Holds B.A. degree, Criminology, UCLA.
Operations: 10/1/06 1QY1 2QY1 3QY1 4QY1 1QY2 2QY2 3QY2 4QY2 1QY3 2QY3 3QY3 4QY3 FY1 FY2 FY3
Production 9 13 18 23 25 28 29 34 36 37 42 48 23 34 48
Sales & Marketing 7 8 9 10 14 16 19 19 28 34 40 42 10 19 42
General & Administrative 24 25 25 26 27 27 29 29 29 30 32 33 26 29 33
Payroll Count 40 46 52 59 66 71 77 82 93 101 114 123 59 82 123
Total Personnel 40 46 52 59 66 71 77 82 93 101 114 123 59 82 123
Production 79 109 150 191 238 268 280 335 405 419 476 548 529 1,121 1,848
Sales & Marketing 146 205 273 346 427 481 540 588 772 894 996 1,050 970 2,036 3,712
General & Administrative 433 444 444 454 510 510 533 533 592 606 630 643 1,775 2,086 2,471
Payroll 658 758 867 991 1,175 1,259 1,353 1,456 1,769 1,919 2,102 2,241 3,274 5,243 8,031
Payroll Burden 197 227 260 297 352 377 406 437 531 575 631 672 981 1,572 2,409
Total Labor Costs 855 985 1,127 1,288 1,527 1,636 1,759 1,893 2,300 2,494 2,733 2,913 4,255 6,815 10,440
Personnel Count
Labor Costs ($000)
Personnel Plan
Risk Assessment
REMOTE SYSTEMS, INC. Page 11
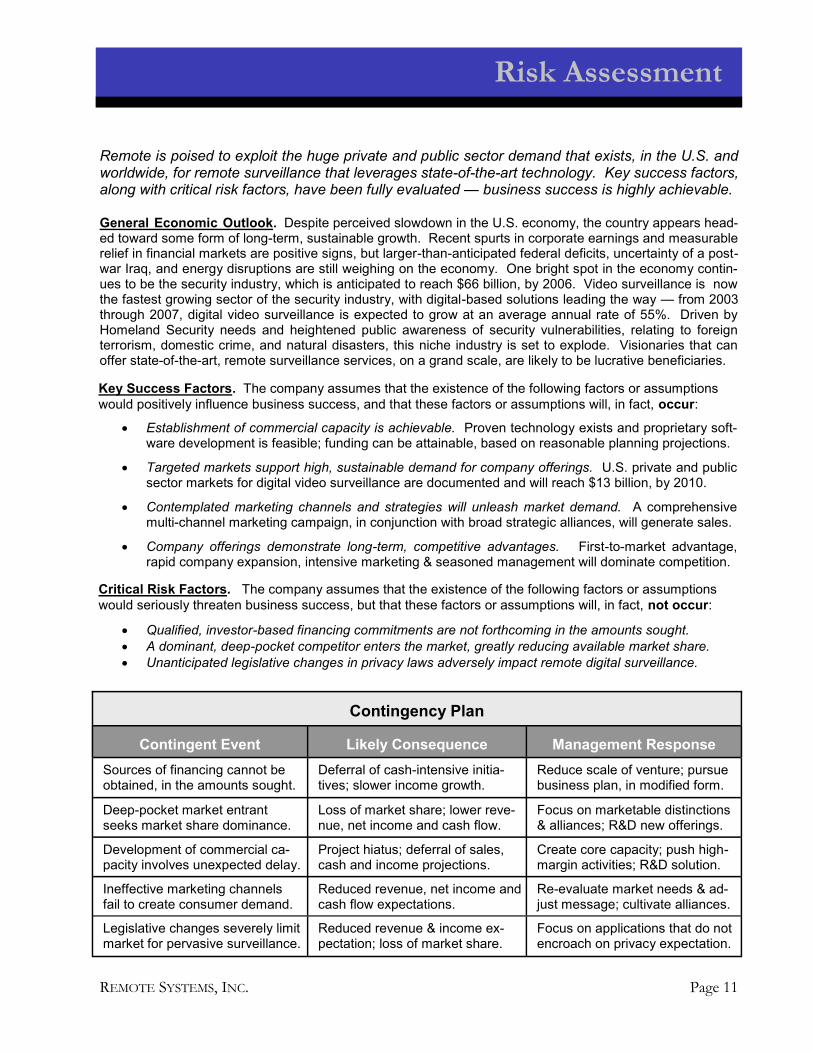
Remote is poised to exploit the huge private and public sector demand that exists, in the U.S. and worldwide, for remote surveillance that leverages state-of-the-art technology. Key success factors, along with critical risk factors, have been fully evaluated — business success is highly achievable.
Key Success Factors. The company assumes that the existence of the following factors or assumptions
would positively influence business success, and that these factors or assumptions will, in fact, occur:
Establishment of commercial capacity is achievable. Proven technology exists and proprietary soft-ware development is feasible; funding can be attainable, based on reasonable planning projections.
Targeted markets support high, sustainable demand for company offerings. U.S. private and public sector markets for digital video surveillance are documented and will reach $13 billion, by 2010.
Contemplated marketing channels and strategies will unleash market demand. A comprehensive multi-channel marketing campaign, in conjunction with broad strategic alliances, will generate sales.
Company offerings demonstrate long-term, competitive advantages. First-to-market advantage, rapid company expansion, intensive marketing & seasoned management will dominate competition.
Critical Risk Factors. The company assumes that the existence of the following factors or assumptions
would seriously threaten business success, but that these factors or assumptions will, in fact, not occur:
Qualified, investor-based financing commitments are not forthcoming in the amounts sought.
A dominant, deep-pocket competitor enters the market, greatly reducing available market share.
Unanticipated legislative changes in privacy laws adversely impact remote digital surveillance.
General Economic Outlook. Despite perceived slowdown in the U.S. economy, the country appears head-ed toward some form of long-term, sustainable growth. Recent spurts in corporate earnings and measurable relief in financial markets are positive signs, but larger-than-anticipated federal deficits, uncertainty of a post-war Iraq, and energy disruptions are still weighing on the economy. One bright spot in the economy contin-ues to be the security industry, which is anticipated to reach $66 billion, by 2006. Video surveillance is now the fastest growing sector of the security industry, with digital-based solutions leading the way — from 2003 through 2007, digital video surveillance is expected to grow at an average annual rate of 55%. Driven by Homeland Security needs and heightened public awareness of security vulnerabilities, relating to foreign terrorism, domestic crime, and natural disasters, this niche industry is set to explode. Visionaries that can offer state-of-the-art, remote surveillance services, on a grand scale, are likely to be lucrative beneficiaries.
Contingency Plan
Contingent Event Likely Consequence Management Response
Sources of financing cannot be obtained, in the amounts sought.
Deferral of cash-intensive initia-tives; slower income growth.
Reduce scale of venture; pursue business plan, in modified form.
Deep-pocket market entrant seeks market share dominance.
Loss of market share; lower reve-nue, net income and cash flow.
Focus on marketable distinctions & alliances; R&D new offerings.
Development of commercial ca-pacity involves unexpected delay.
Project hiatus; deferral of sales, cash and income projections.
Create core capacity; push high-margin activities; R&D solution.
Ineffective marketing channels fail to create consumer demand.
Reduced revenue, net income and cash flow expectations.
Re-evaluate market needs & ad-just message; cultivate alliances.
Legislative changes severely limit market for pervasive surveillance.
Reduced revenue & income ex-pectation; loss of market share.
Focus on applications that do not encroach on privacy expectation.

Capitalization Plan
Start-Up Condition. Start-up requirements for the company are anticipated to total $10,115K, including initial cash of $10,100K, property, plant & equipment totaling $3K, and various organization costs, classified as deferred charges, totaling $12K. Initial resources total $115K, including long-term, convertible debt, total-ing $100K, and initial owner investments, totaling $15K, resulting in a net resource shortfall of $10,000K. Capitalization Plan. Remote Systems proposes to cover its initial net shortfall, by obtaining investor contri-butions, totaling $10,000,000, by April 1, 2006. These funds will be used to cover identifiable working capital requirements, totaling $425K, including labor & burden, advertising & promotion, and other G&A expenses, and to cover capital expenditures requirements, totaling $8,725K, relating to property, plant & equipment and pre-operating costs classified as deferred charges, and to create contingent cash reserves totaling $850K.
Exit Strategy and Possible Later-Round Financing. The company’s competitive advantages are ex-pected to result in broad target market acceptance. The most probable investor exit strategies include stra-tegic acquisition of the company, management buyout or initial public offering. If business expansion occurs or synergistic business opportunities arise, then Remote may seek later-round funding of $15 to $25 million.
Remote Systems is seeking investor contributions, totaling $10,000,000, by April 1, 2006, to cover identifiable working capital and capital expenditure requirements, totaling $9,150,000, and to cre-ate cash reserves, totaling $850,000. Exit strategies exist and later-round funding may occur.
Page 12 REMOTE SYSTEMS, INC.
YTD Expenses Thru 3/31/06: Loans: Working Capital:
Cost of Sales 0.0 Accounts Payable 0.0 Labor and Burden 150.0Operating Expenses 0.0 Other Current Liabilities 0.0 Advertising & Promotion 238.0Less: Sales 0.0 Short-Term Loans 0.0 Other G&A Expenses 37.0
Long-Term Loans 100.0Contingency Fund 500.0
YTD Loss (Gain) 0.0 Total Loans 100.0 Total Working Capital 925.0
Start-Up Assets: Investments (% Ownership): Capital Expenditures:
Cash 10,100.0 R. Player (100%) 14.5 Property, Plant & Equip. 2,096.0Accounts Receivable 0.0 Deferred Charges 6,629.0Inventory 0.0Other Assets 0.0Property, Plant & Equipment 2.8 Contingency Fund 350.0Deferred Charges 11.7 Investor 10,000.0Accum. Deprec. & Amort. 0.0
Total Start-Up Assets 10,114.5 Total Investments 10,014.5 Total Capital Expenditures 9,075.0
TOTAL REQUIREMENTS 10,114.5 TOTAL RESOURCES 10,114.5 TOTAL USES 10,000.0
Total Resources Available 10,114.5 Start-Up ASSETS 10,114.5 Fiscal Year 1 7%
Less: Assets Purchased 10,114.5 Start-Up LIABILITIES 100.0 Fiscal Year 2 62%
Start-Up Loss (Gain) 0.0 Start-Up EQUITY 10,014.5 Fiscal Year 3 123%
USE OF PROCEEDS
CAPITALIZATION PLAN ($000)
BUSINESS PLAN START DATE: APRIL 1, 2006
REQUIREMENTS RESOURCES
RETURN ON TOTAL INVESTMENT

Business Projections
Forecasted sales for FY1 are $14.9 million, increasing to $46.4 million in FY3. Projected FY1 net income is $0.7 million, increasing to $12.3 million in FY3. During this period, net income, as a per-centage of sales, ranges from 5% to 27%; return on total investment ranges, from 7% to 123%.
REMOTE SYSTEMS, INC. Page 13
0
5,000
10,000
15,000
20,000
25,000
30,000
35,000
40,000
45,000
50,000
FY1 FY2 FY3
Projected Operating Highlights By Year ($000)
Sales
Gross Margin
EBITDA
Net Income
(1,000)
(500)
0
500
1,000
1,500
0 142 283 425 567 708 850 992 1133 1275 1417 1556 1698 1839 1981 2122
0.00 0.57 1.14 1.71 2.28 2.85 3.42 3.99 4.56 5.13 5.70 6.26 6.83 7.40 7.97 8.54
Cas
h B
asis
Pro
fit ($
000)
Sales ($000)Unit Sales (000)
Monthly Breakeven Analysis
Net Income Cash Balance
If Sales Are:1% Higher Than Projected 13.4% 3.5%1% Lower Than Projected -13.4% -3.5%
If Operating Expenses Are:1% Higher Than Projected -10.7% -2.8%1% Lower Than Projected 10.7% 2.8%
% Effect On:
Sensitivity Analysis For FY1
FY1 FY2 FY3
Profitability %'s:Gross Margin 89% 95% 94%
Net Profit Margin 5% 21% 27%
Return on Assets 6% 34% 40%
Return on Equity 6% 37% 42%
Return On Investment 7% 62% 123%
Activity Ratios:Accounts Receivable Turnover 0.08 0.08 0.08
Collection Days 30.00 30.00 30.00
Inventory Turnover 12.00 12.00 12.00
Accounts Payable Turnover 12.00 12.00 12.00
Asset Turnover 1.26 1.63 1.49
Debt Ratios:Debt To Equity 0.11 0.09 0.06
Short-Term Liabilities To Liabilities 0.91 0.94 1.00
Liquidity Indicators:Current Ratio 4.66 8.89 14.69
Quick Ratio 4.56 8.83 14.65
Net Working Capital ($000) 3809 11558 25257
Interest Coverage Ratio 93.20 826.90 3290.80
Additional Indicators:Assets to Sales Ratio 0.79 0.61 0.67
Debt To Assets Ratio 10% 8% 6%
Current Debt To Total Assets Ratio 9% 8% 6%
Acid Test 2.56 6.70 12.28
Sales To Equity Ratio 1.39 1.78 1.59
Dividend Payout % 0% 0% 0%
Financial Indicators
FY1 FY2 FY3
Sales 1.0 2.0 3.1Cost of Sales 1.0 1.0 1.6Gross Margin 1.0 2.2 3.3Operating Expenses: 1.0 1.7 2.4 Sales & Marketing 1.0 1.8 2.6 Gen. & Administrative 1.0 1.5 2.1EBITDA 1.0 3.9 6.9
Net Income 1.0 9.0 17.9
Benchmark Analysis (FY1 = 1.00)
Operations: 10/1/06 Oct Nov Dec Jan Feb Mar Apr May Jun Jul Aug Sep FY1 FY2 FY3
Sales 588 581 721 788 1,086 1,113 1,307 1,384 1,623 1,703 1,948 2,082 14,924 30,073 46,368
Gross Margin 393 476 609 683 940 998 1,157 1,254 1,473 1,559 1,784 1,919 13,245 28,422 43,744
Operating Expenses 510 506 598 663 796 808 930 966 1,071 1,146 1,257 1,321 10,572 18,058 25,285
EBITDA (117) (30) 11 20 144 190 227 288 402 413 527 598 2,673 10,364 18,459
Income Before Taxes (263) (176) (136) (126) (2) 44 81 142 255 267 381 452 919 8,259 16,449
Net Income (197) (132) (102) (94) (1) 33 61 106 191 200 286 339 690 6,194 12,334
Percentages: Gross Margin/Sales 67% 82% 84% 87% 87% 90% 89% 91% 91% 92% 92% 92% 89% 95% 94%
EBITDA/Sales -20% -5% 2% 3% 13% 17% 17% 21% 25% 24% 27% 29% 18% 34% 40%
Net Income/Sales -34% -23% -14% -12% 0% 3% 5% 8% 12% 12% 15% 16% 5% 21% 27%
Return On Investment 7% 62% 123%
Net Cash Flow (1,317) (188) 82 (4) 41 110 146 185 253 265 345 404 322 7,150 12,833
Cash Balance - Ending 1,029 841 923 919 960 1,070 1,216 1,401 1,654 1,919 2,264 2,668 2,668 9,818 22,651
Projected Operating Highlights ($000)

Sales
Forecasted sales for FY1 through FY3 are $14.9 million, $30.1 million and $46.4 million, respec-tively. Revenues derive from monthly subscription fees earned on video and GPS monitoring ser-vices, fees for security consultancy, and revenues earned on equipment sales or vendor referrals.
Page 14 REMOTE SYSTEMS, INC.
Remote
Operations: 10/1/06 Oct Nov Dec Jan Feb Mar Apr May Jun Jul Aug Sep FY1 FY2 FY3
Unit Volume (1):
Subscriptions:
Video Plan I 170 210 290 360 500 600 700 800 925 1,025 1,125 1,250 7,955 20,100 31,550
Video Plan II 250 340 500 600 785 950 1,100 1,200 1,325 1,425 1,550 1,700 11,725 25,550 37,550
Video Plan III 425 690 875 1,050 1,275 1,400 1,650 1,850 2,100 2,300 2,575 2,800 18,990 38,750 51,900
GPS Monitoring 150 200 260 350 500 575 650 775 900 1,000 1,100 1,200 7,660 18,050 27,900
Consulting:
Flex Plan 0 1 2 2 3 3 4 4 5 6 7 7 44 116 229
Project-Based 0 1 1 1 2 2 2 2 3 3 4 4 25 67 19
Equipment:
Router 845 395 425 345 550 390 500 400 500 400 500 500 5,750 2,650 3,100
GPS Unit 150 50 60 90 150 75 75 125 125 100 100 100 1,200 600 1,000
Total Unit Sales 1,990 1,887 2,413 2,798 3,765 3,995 4,681 5,156 5,883 6,259 6,961 7,561 53,349 105,883 153,248
Unit Price ($/Unit) (2):
Subscriptions:
Video Plan I 159 159 159 159 159 159 159 159 159 159 159 159
Video Plan II 229 229 229 229 229 229 229 229 229 229 229 229
Video Plan III 349 349 349 349 349 349 349 349 349 349 349 349
GPS Monitoring 19 19 19 19 19 19 19 19 19 19 19 19
Consulting:
Flex Plan 12,000 12,000 12,000 12,000 12,000 12,000 12,000 12,000 12,000 12,000 12,000 12,000
Project-Based 50,000 50,000 50,000 50,000 50,000 50,000 50,000 50,000 50,000 50,000 50,000 50,000
Equipment:
Router 400 400 400 400 400 400 400 400 400 400 400 400
GPS Unit 100 100 100 100 100 100 100 100 100 100 100 100
Forecasted Sales ($000) (3):
Subscriptions:
Video Plan I 27 33 46 57 80 95 111 127 147 163 179 199 1,264 3,398 5,648
Video Plan II 57 78 115 137 180 218 252 275 303 326 355 389 2,685 6,107 9,350
Video Plan III 148 241 305 366 445 489 576 646 733 803 899 977 6,628 13,912 19,152
GPS Monitoring 3 4 5 7 10 11 12 15 17 19 21 23 147 343 530
Consulting:
Flex Plan 0 12 24 24 36 36 48 48 60 72 84 84 528 1,508 3,206
Project-Based 0 50 50 50 100 100 100 100 150 150 200 200 1,250 3,685 6,780
Equipment:
Router 338 158 170 138 220 156 200 160 200 160 200 200 2,300 1,060 1,550
GPS Unit 15 5 6 9 15 8 8 13 13 10 10 10 122 60 152
Total Sales 588 581 721 788 1,086 1,113 1,307 1,384 1,623 1,703 1,948 2,082 14,924 30,073 46,368
Unit COS ($/Unit):
Equipment:
RouterRouter 200 200 200 200 200 200 200 200 200 200 200 200
Forecasted COS ($000):
Equipment:
Router 169 79 85 69 110 78 100 80 100 80 100 100 1,150 530 776
Total Cost of Sales 169 79 85 69 110 78 100 80 100 80 100 100 1,150 530 776
NOTES: (1) UNIT VOLUME: Remote Sytems, Inc., benefits from eight revenue streams, which are all projected to become
recognizable, on October 1, 2006, following a six-month pre-operating period, beginning April 1, 2006.
Four revenue streams arise from sales of monthly subscriptions, relating to varying levels of remote,
video monitoring services; two revenue streams arise from consulting fees earned on security consulting,
provided under a Flex Plan or on a project basis; and two revenue streams arise from direct sales or referral fees
earned on equipment sales or referrals to third party vendors, arising from remote monitoring or consulting activities.
SUBSCRIPTIONS: Metric = monthly subscribers, and reflects the following services --
VIDEO PLAN I: Defined number of video tours of the facility, during closed hours.
VIDEO PLAN II: Full-time video monitoring of the facility, during closed hours.
VIDEO PLAN III: 24/7 video monitoring coverage of the facility.
GPS Monitoring: Global position satellite tracking of assets, people or pets.
CONSULTING: Metric = number of new consulting clients, and reflects the following services --
FLEX PLAN: Seasoned security manager is secunded to client organization, as needed.
PROJECT-BASED: Traditional consulting engagement, on a project-by-project basis.
EQUIPMENT - ALL TYPES: Metric = units of equipment sold or installed.
(2) UNIT PRICE - ALL STREAMS: Reflects weighted average price, based on Remote Systems feasibility study.
(3) FORECASTED SALES - ALL STREAMS: Unit Volume x Unit Price.
(4) UNIT COST OF SALES - ROUTERS: Reflects wholesale cost of rounters.
(5) FORECASTED COST OF SALES - ROUTERS: Unit Volume x Unit Cost of Sales.
Forecasted Sales and Cost of Sales ($000)

Net Income
Following a 6-month pre-operating period, projected net income is positive, beginning in Month 6, and increases from $0.7 million in FY1, to $12.3 million in FY3. Gross margin, as a percentage of sales, ranges from 89% to 95%, and net income, as a percent of sales, ranges from 5% to 27%.
REMOTE SYSTEMS, INC. Page 15
(500)
0
500
1,000
1,500
2,000
2,500
3,000
3,500
1QY1 2QY1 3QY1 4QY1 1QY2 2QY2 3QY2 4QY2 1QY3 2QY3 3QY3 4QY3
Projected Net Income By Quarter ($000)All Fiscal Years
Operations: 10/1/06 Oct Nov Dec Jan Feb Mar Apr May Jun Jul Aug Sep FY1 FY2 FY3
Sales 588 581 721 788 1,086 1,113 1,307 1,384 1,623 1,703 1,948 2,082 14,924 30,073 46,368
Direct Cost of Sales 169 79 85 69 110 78 100 80 100 80 100 100 1,150 530 776
Production Labor 26 26 27 36 36 37 50 50 50 64 64 63 529 1,121 1,848
Total Cost of Sales 195 105 112 105 146 115 150 130 150 144 164 163 1,679 1,651 2,624
Gross Margin 393 476 609 683 940 998 1,157 1,254 1,473 1,559 1,784 1,919 13,245 28,422 43,744
Gross Margin/Sales % 67% 82% 84% 87% 87% 90% 89% 91% 91% 92% 92% 92% 89% 95% 94%
Operating Expenses:
Sales & Marketing Labor (1) 49 49 48 68 68 69 91 91 91 115 115 116 970 2,036 3,712
Advertising & Promotion (2) 206 203 288 315 434 445 523 554 649 681 779 833 5,910 10,526 13,910
Sales & Marketing 255 252 336 383 502 514 614 645 740 796 894 949 6,880 12,562 17,622
Sales & Markeing/Sales % 43% 43% 47% 49% 46% 46% 47% 47% 46% 47% 46% 46% 46% 42% 38%
General & Admin. Labor 144 144 145 148 148 148 148 148 148 151 151 152 1,775 2,086 2,471
Payroll Burden (3) 66 66 65 76 76 75 87 87 86 99 99 99 981 1,572 2,409
Rent & Utilities (4) 10 10 10 10 10 10 10 10 10 10 10 10 120 240 360
Insurance 1 1 1 3 5 7
Office Expense 2 1 2 1 2 1 2 1 2 1 2 1 18 24 30
Communications 3 3 3 3 3 3 3 3 3 3 3 3 36 48 60
Professional Services 1 1 1 2 1 1 1 2 1 1 1 2 15 17 8
Travel & Entertainment (5) 29 29 36 39 54 56 65 69 81 85 97 104 744 1,504 2,318
Other 0 0 0 0 0 0 0 0 0 0 0 0 0 0 0
Gen.& Administrative 255 254 262 280 294 294 316 321 331 350 363 372 3,692 5,496 7,663
Gen. & Admin./Sales % 43% 44% 36% 36% 27% 26% 24% 23% 20% 21% 19% 18% 25% 18% 17%
Total Operating Expenses 510 506 598 663 796 808 930 966 1,071 1,146 1,257 1,321 10,572 18,058 25,285
EBITDA (117) (30) 11 20 144 190 227 288 402 413 527 598 2,673 10,364 18,459
EBITDA/Sales % -20% -5% 2% 3% 13% 17% 17% 21% 25% 24% 27% 29% 18% 34% 40%
Depreciation & Amortization (6) 145 145 146 145 145 146 145 145 146 145 145 146 1,744 2,095 2,005
Interest Expense (7) 1 1 1 1 1 0 1 1 1 1 1 0 10 10 5
Income Before Taxes (263) (176) (136) (126) (2) 44 81 142 255 267 381 452 919 8,259 16,449
Tax Expense (8) (66) (44) (34) (32) (1) 11 20 36 64 67 95 113 229 2,065 4,115
NET INCOME (197) (132) (102) (94) (1) 33 61 106 191 200 286 339 690 6,194 12,334
Net Income/Sales % -34% -23% -14% -12% 0% 3% 5% 8% 12% 12% 15% 16% 5% 21% 27%
NOTES: (1) Includes base salary, plus a weighted average commission structure, estimated to be 4.5% of gross sales.
(2) Reflects national marketing campaign, including TV, radio, print & web-based advertising, plus extensive customer networking.
(3) Assumes 30% payroll burden rate, covering federal and state statutory burdens, plus employee vacation and medical benefits.
(4) Reflects rent & utilities, associated with administrative headquarters and Video Monitoring Center, located in Carlsbad, CA.
(5) Reflects travel & entertainment costs, associated with nationwide rollout to business, residential and public sector clients.
(6) Reflects depreciation and amortization of 5-year ($1,000K) and 7-year ($80K) class assets acquired after September 30, 2006,
plus D&A of 5-year ($2,000K) and 7-year class assets ($40K), acquired from April 1 thru September 30, 2006;
plus 5-year straightline D&A of expenditures, classified as Deferred Charges ($6,679K), from April 1 thru September 30, 2006;
plus D&A of 5-year class assets ($3K), existing at March 31, 2006;
plus 5-year straightline D&A of start-up costs, classified as Deferred Charges ($12K), as of March 31, 2006.
(7) Represents interest on convertible debt, relating to 3-year promissory notes, in the aggregate amount of $100,000,
bearing 10% interest, reflecting loans from R. Player (50%) and J. Miller (50%).
(8) Assumes cumulative, effective federal and state income tax rate of 25%.
Projected Income Statement ($000)
Start-Up: 4/1/06 Apr May Jun Jul Aug Sep 6 Mo
Pre-Op Sales 0 0 0 0 0 0 0
Production Labor 4 4 3 21 21 22 75
Total Cost of Sales 4 4 3 21 21 22 75
Pre-Op Gross Margin (4) (4) (3) (21) (21) (22) (75)
Gross Margin/Sales % N/A N/A N/A N/A N/A N/A N/A
Pre-Op Expenditures:
Sales & Marketing Labor 9 9 8 12 12 11 61
General & Admin. Labor 112 112 111 122 122 121 700
Payroll Burden 37 37 38 46 46 47 251
Advertising & Promotion 333 333 334 1,000 1,000 1,000 4,000
Rent & Utilities 10 10 10 10 10 10 60
Professional Services 1,050 51 50 51 50 51 1,303
Travel & Entertainment 25 25 25 25 25 25 150
Other 6 5 4 6 5 3 29
Total Pre-Op Expenditures 1,582 582 580 1,272 1,270 1,268 6,554
Net Pre-Op Expenditures 1,586 586 583 1,293 1,291 1,290 6,629
Pre-Operating Expenditures, Net of Sales ($000)

Cash Flow
Early net cash flow deficits occur, due to variations in key cash determinants and early losses, as revenue capacity develops. However, ending cash balance for FY1 is $2.7 million, rising to $22.7 million, by year end FY3. The minimum cash balance is $0.8 million, occurring in Month 2 of FY1.
Page 16 REMOTE SYSTEMS, INC.
(5,000)
0
5,000
10,000
15,000
20,000
25,000
1QY1 2QY1 3QY1 4QY1 1QY2 2QY2 3QY2 4QY2 1QY3 2QY3 3QY3 4QY3
Projected Cash Flow By Quarter ($000)All Fiscal Years
Net Cash Flow
Cash Balance
Operations: 10/1/06 Oct Nov Dec Jan Feb Mar Apr May Jun Jul Aug Sep FY1 FY2 FY3
Net Income (197) (132) (102) (94) (1) 33 61 106 191 200 286 339 690 6,194 12,334
Plus:
Depreciation & Amort. 145 145 146 145 145 146 145 145 146 145 145 146 1,744 2,095 2,005
Increase (Decrease) In: Accounts Payable (1) (508) (298) 184 (4) 236 (74) 156 (9) 175 (20) 179 53 70 424 380
Other Current Liabilities 0 0 0
Short-Term Notes 0 0 0
Long-Term Notes 0 0 (100)
Paid-In Capital 0 0 0
Sources of Cash (363) (153) 330 141 381 72 301 136 321 125 324 199 1,814 2,519 2,285
Less:
Increase (Decrease) In:Accounts Receivable (2) 588 (7) 140 67 298 27 194 77 239 80 245 134 2,082 1,043 1,251
Inventory (3) 169 (90) 6 (16) 41 (32) 22 (20) 20 (20) 20 0 100 (20) (5)
Other Assets 0 0 0
Prop., Plant & Equip. (4) 0 0 0 0 0 0 0 0 0 0 0 0 0 540 540
Deferred Charges 0 0 0
Dividends 0 0 0
Uses of Cash 757 (97) 146 51 339 (5) 216 57 259 60 265 134 2,182 1,563 1,786
Net Cash Flow (1,317) (188) 82 (4) 41 110 146 185 253 265 345 404 322 7,150 12,833
Cash Balance - Beginning 2,346 1,029 841 923 919 960 1,070 1,216 1,401 1,654 1,919 2,264 2,346 2,668 9,818
Cash Balance - Ending 1,029 841 923 919 960 1,070 1,216 1,401 1,654 1,919 2,264 2,668 2,668 9,818 22,651
NOTES: (1) Reflects monthly changes in account balances, as presented in the Financial History and Projected Balance Sheet.
(2) Reflects monthly changes in account balances, as presented in the Financial History and Projected Balance Sheet.
(3) Reflects monthly changes in account balances, as presented in the Financial History and Projected Balance Sheet.
(4) Reflects acquisition of data & monitoring center equipment ($1,000K) and furniture, fixtures & equipment ($80K).
Projected Cash Flow Statement ($000)
Start-Up: 4/1/06 Apr May Jun Jul Aug Sep 6 Mo
Pre-Operating Net Income 0 0 0 0 0 0 0
Plus:
Depreciation & Amort. 0 0 0 0 0 0 0
Increase (Decrease) In:
Accounts Payable 1,273 (900) (1) 602 (2) (1) 971
Sources of Cash 1,273 (900) (1) 602 (2) (1) 971
Less:
Increase (Decrease) In:
Prop., Plant & Equip. 91 1 1,001 1 1 1,001 2,096
Deferred Charges 1,586 586 583 1,293 1,291 1,290 6,629
Uses of Cash 1,677 587 1,584 1,294 1,292 2,291 8,725
Net Cash Flow (404) (1,487) (1,585) (692) (1,294) (2,292) (7,754)
Cash Balance - Beginning 10,100 9,696 8,209 6,624 5,932 4,638 10,100
Cash Balance - Ending 9,696 8,209 6,624 5,932 4,638 2,346 2,346
Projected Cash Flow: Pre-Operating Period ($000)

Balance Sheet
REMOTE SYSTEMS, INC. Page 17
Total assets for FY1 through FY3 are projected to be $11.8 million, $18.5 million and $31.1 million, respectively. Working capital does not fall below $1.3 million in Month 1 of the operating period. The debt-to-equity ratio nominally ranges, from 0.09 to 0.07, primarily reflecting payables activity.
Management Representation. The financial projections included in this business plan represent, to the best of management’s knowledge and belief, the results of opera-tions, cash flow, and account balances, which would likely occur, assuming Remote Systems, Inc., were to obtain investor contributions, totaling $10,000,000, by April 1, 2006, in support of operations commencing October 1, 2006. Management further represents that the assump-tions underlying these financial projections are reasonable and that the projections were prepared in conformity with generally accepted accounting principles, but that they were not compiled, nor examined, by an independent pub-lic accountant and should not be evaluated in that context.
Start-Up: 4/1/06 Apr May Jun Jul Aug Sep 6 Mo
ASSETS
Cash 9,696 8,209 6,624 5,932 4,638 2,346 2,346
Current Assets 9,696 8,209 6,624 5,932 4,638 2,346 2,346
Property, Plant & Equipment 94 95 1,096 1,097 1,098 2,099 2,099
Deferred Charges 1,598 2,184 2,767 4,060 5,351 6,641 6,641
Long-Term Assets 1,692 2,279 3,863 5,157 6,449 8,740 8,740
Total Assets 11,388 10,488 10,487 11,089 11,087 11,086 11,086
LIABILITIES
Accounts Payable 1,273 373 372 974 972 971 971
Current Liabilities 1,273 373 372 974 972 971 971
Long-Term Notes Payable 100 100 100 100 100 100 100
Long-Term Liabilities 100 100 100 100 100 100 100
Total Liabilities 1,373 473 472 1,074 1,072 1,071 1,071
EQUITY
Paid-In Capital 10,015 10,015 10,015 10,015 10,015 10,015 10,015
Total Equity 10,015 10,015 10,015 10,015 10,015 10,015 10,015
Total Liabilities & Equity 11,388 10,488 10,487 11,089 11,087 11,086 11,086
Balance Sheet: Pre-Operating Period ($000)
Operations: 10/1/06 Oct Nov Dec Jan Feb Mar Apr May Jun Jul Aug Sep FY1 FY2 FY3
ASSETS
Cash 1,029 841 923 919 960 1,070 1,216 1,401 1,654 1,919 2,264 2,668 2,668 9,818 22,651
Accounts Receivables (1) 588 581 721 788 1,086 1,113 1,307 1,384 1,623 1,703 1,948 2,082 2,082 3,125 4,376
Inventory (2) 169 79 85 69 110 78 100 80 100 80 100 100 100 80 75
Other Assets 0 0 0 0 0 0 0 0 0 0 0 0 0 0 0
Current Assets 1,786 1,501 1,729 1,776 2,156 2,261 2,623 2,865 3,377 3,702 4,312 4,850 4,850 13,023 27,102
Property, Plant & Equipment 2,099 2,099 2,099 2,099 2,099 2,099 2,099 2,099 2,099 2,099 2,099 2,099 2,099 2,639 3,179
Deferred Charges 6,641 6,641 6,641 6,641 6,641 6,641 6,641 6,641 6,641 6,641 6,641 6,641 6,641 6,641 6,641
Less: Depreciation & Amort. 145 290 436 581 726 872 1,017 1,162 1,308 1,453 1,598 1,744 1,744 3,839 5,844
Long-Term Assets 8,595 8,450 8,304 8,159 8,014 7,868 7,723 7,578 7,432 7,287 7,142 6,996 6,996 5,441 3,976
Total Assets 10,381 9,951 10,033 9,935 10,170 10,129 10,346 10,443 10,809 10,989 11,454 11,846 11,846 18,464 31,078
LIABILITIES
Accounts Payable (3) 463 165 349 345 581 507 663 654 829 809 988 1,041 1,041 1,465 1,845
Other Current Liabilities 0 0 0 0 0 0 0 0 0 0 0 0 0 0 0
Short-Term Notes Payable 0 0 0 0 0 0 0 0 0 0 0 0 0 0 0
Current Liabilities 463 165 349 345 581 507 663 654 829 809 988 1,041 1,041 1,465 1,845
Long-Term Notes Payable 100 100 100 100 100 100 100 100 100 100 100 100 100 100 0
Long-Term Liabilities 100 100 100 100 100 100 100 100 100 100 100 100 100 100 0
Total Liabilities 563 265 449 445 681 607 763 754 929 909 1,088 1,141 1,141 1,565 1,845
EQUITY
Paid-In Capital (4) 10,015 10,015 10,015 10,015 10,015 10,015 10,015 10,015 10,015 10,015 10,015 10,015 10,015 10,015 10,015
Retained Earnings (197) (329) (431) (525) (526) (493) (432) (326) (135) 65 351 690 690 6,884 19,218
Total Equity 9,818 9,686 9,584 9,490 9,489 9,522 9,583 9,689 9,880 10,080 10,366 10,705 10,705 16,899 29,233
Total Liabilities & Equity 10,381 9,951 10,033 9,935 10,170 10,129 10,346 10,443 10,809 10,989 11,454 11,846 11,846 18,464 31,078
NOTES: (1) Percentage of sales on credit assumed to be 100%, subject to 30-day collection period.
(2) Reflects Cost of Sales (Routers only) x 12 months, divided by 12.0 inventory turns, reflecting one month of stock.
(3) Estimated balances, assuming 10% of expenses paid in cash and an average 30-day payment period.
(4) Reflects original owner investements of $14,000, plus paid-in capital of new investors, totaling $10,000,000, on April 1, 2006.
Projected Balance Sheet ($000)

References
ENDNOTES:
1 Company, Business Opportunity, Page 4: Security Industry Association (SIA) Research Update, 3rd Quarter 2003, “World Security Services Expanding Post Sept. 11”, at http://www.siaonline.org/data/irn03q3.pdf, providing forecast of 2006 world security services expenditures ($119.6 billion), and SIA Research Update, 2nd Quarter 2003, at http://www.siaonline.org/data/irn03q2.pdf, citing comparable figures for security products ($64.9 billion).
2 Company, Business Opportunity, Page 4: Ibid., SIA Research Update, 3Q03, citing percentage of guard services.
3 Company, Business Opportunity, Page 4: TechOnline article, “Digital Video Integrates Many Technologies”, at http://www.techonline.com/community/tech_group/37613, chronicling ascendancy of digital over analog solutions.
4 Company, Business Opportunity, Page 4: See Business Confidant market analyses, discussed in Endnotes 7-10.
5 Market, General Analysis, Page 6: Ibid., SIA Research Updates, 3Q03 and 2Q03, detailing U.S. security markets.
6 Market, General Analysis, Page 6: J.P. Freeman market reports, available at http://www.jpfreeman.com/mktreport.htm#report3, citing meteoric growth of intelligent video, smart camera and network IP video markets.
7 Market, Market Segmentation and Target Market Needs, Page 6: Datamonitor market research report, "Global Digital Video Surveillance Markets: Finding Future Opportunities As Analog Makes Way For Digital", at http://www.market-research-report.com/datamonitor/DMTC1014.htm, citing 2003 actual & 2007 forecasted markets.
8 Market, Market Segmentation and Target Market Needs, Page 6: Ibid., SIA Research Update, 2Q02, p. 2, chart entitled, "Percentage of 2001 Security Installations By Customer Type", found at http://www.siaonline.org/data/irn02q2.pdf, citing percent allocation, by key customer group; plus, Ibid., Datamonitor market research report, uti-lizing global market projections for 2003 and 2007, estimated 47% U.S. share of global market, and 55% CAGR (2003 thru 2007), to interpolate (2004 thru 2006) and extrapolate (2008 thru 2010) other-year market projections.
9 Market, Market Segmentation and Target Market Needs, Page 6: U.S. Department of Commerce, Population Projections: States, 1995 - 2025, Table 1, Total Population and Net Change for States: 1995-2025, found at http://www.census.gov/prod/2/pop/p25/p25-1131.pdf, citing relative allocations of population among 9 distinct regions.
10 Market, Market Segmentation and Target Market Needs, Page 6: Ibid., SIA Research Update, 3rd Quarter 2003.
11 Market, Market Segmentation and Target Market Needs, Page 6: SIA Research Update, 4th Quarter 2001, p. 4, article entitled “New Study: Home Security Penetration at 31% in 2009”, http://www.siaonline.org/data/irn01q4.pdf.
12 Market, Market Segmentation and Target Market Needs, Page 6: See Remote Systems independent research.
13 Market, Market Growth and Trends, Page 6: Utilizing 2010 forecast of relevant U.S. market for digital-based sur-veillance ($13.1 billion), in conjunction with 47% U.S. share of world market, to extrapolate 2010 global market.
14 Industry, General Characteristics, Page 7: U.S. Census Bureau, 2002 Economic Census report, “Investigation and Security Services: 2002”, June 2004, Table 1 statistics, at http://www.census.gov/prod/ec02/ec0256i06.pdf.
15 Industry, General Characteristics, Page 7: Utilizing Endnote 14, in conjunction with Ibid., SIA Research Update, 3Q03, forecasting growth of North American security services from 2001 ($36.4 billion) through 2006 ($50.1 billion).
16 Industry, Emerging Trends, Page 7: Mindbranch, citing Sullivan & Frost research study, July 2003, entitled “Country Industry Forecast: The U.S. Security Industry”, and available at http://www.mindbranch.com/products/R1-2440.html.
Page 18 REMOTE SYSTEMS, INC.
This Business Plan was prepared by:
Business Confidant Your Business Planning Specialist
Business Confidant © 2000 - 2005
45 Ora Way, A-206, San Francisco, CA 94131
(415) 282-1044 • [email protected] • www.BusinessConfidant.com