relations between dairy food intake and arterial stiffness
TRANSCRIPT

The University of MaineDigitalCommons@UMaine
Maine-Syracuse Longitudinal Papers Maine-Syracuse Longitudinal Study
2012
Relations between dairy food intake and arterialstiffness: Pulse wave velocity and pulse pressureGeorgina E. CrichtonUniversity of South Australia
Merrill F. EliasUniversity of Maine, [email protected]
Gregory A. DoreUniversity of Maine
Walter P. Abhayaratna
Michael A. RobbinsUniversity of Maine, [email protected]
Follow this and additional works at: https://digitalcommons.library.umaine.edu/longitudinal_papers
This Article is brought to you for free and open access by DigitalCommons@UMaine. It has been accepted for inclusion in Maine-SyracuseLongitudinal Papers by an authorized administrator of DigitalCommons@UMaine. For more information, please [email protected].
Repository CitationCrichton, Georgina E.; Elias, Merrill F.; Dore, Gregory A.; Abhayaratna, Walter P.; and Robbins, Michael A., "Relations between dairyfood intake and arterial stiffness: Pulse wave velocity and pulse pressure" (2012). Maine-Syracuse Longitudinal Papers. 41.https://digitalcommons.library.umaine.edu/longitudinal_papers/41

Arterial Stiffness
Relations Between Dairy Food Intake and Arterial StiffnessPulse Wave Velocity and Pulse Pressure
Georgina E. Crichton, Merrrill F. Elias, Gregory A. Dore, Walter P. Abhayaratna, Michael A. Robbins
Abstract—Modifiable risk factors, such as diet, are becomingly increasingly important in the management of cardiovas-cular disease, one of the greatest major causes of death and disease burden. Few studies have examined the role of dietas a possible means of reducing arterial stiffness, as measured by pulse wave velocity, an independent predictor ofcardiovascular events and all-cause mortality. The aim of this study was to investigate whether dairy food intake isassociated with measures of arterial stiffness, including carotid-femoral pulse wave velocity and pulse pressure. Across-sectional analysis of a subset of the Maine-Syracuse Longitudinal Study sample was performed. A linear decreasein pulse wave velocity was observed across increasing intakes of dairy food consumption (ranging from never/rarely todaily dairy food intake). The negative linear relationship between pulse wave velocity and intake of dairy food wasindependent of demographic variables, other cardiovascular disease risk factors, and nutrition variables. The pattern ofresults was very similar for pulse pressure, whereas no association between dairy food intake and lipid levels was found.Further intervention studies are needed to ascertain whether dairy food intake may be an appropriate dietary interventionfor the attenuation of age-related arterial stiffening and reduction of cardiovascular disease risk. (Hypertension. 2012;59:1044-1051.) ● Online Data Supplement
Key Words: pulse wave velocity � arterial stiffness � blood pressure � dairy food
Cardiovascular disease (CVD) is one of the leading causesof death and disease burden in Europe, the United States,
and Australia. As populations age, the risk, prevalence andcost of CVD are likely to further increase. Positive modifiablerisk factors for CVD, including diet, will become increasinglyimportant to alter the course of this disease.
Dairy foods and milk products have received a negativereaction in the media in the recent past, largely because of theassociation between saturated fatty acids and CVD risk andthe high saturated fatty acid content in dairy foods. However,a number of recent reviews of milk and dairy consumptionand CVD have concluded that dairy foods are not associatedwith a higher risk of CVD and, indeed, may offer somebenefit. The Dietary Approaches to Stop Hypertension(DASH) Study was one of the first studies to show that a diethigh in low-fat dairy can have beneficial effects on bloodpressure (BP).1 Following the DASH diet, high in fruit,vegetables, and low-fat dairy products (�3 serves per day),for 6 months was associated with greater reduction in systolicBP (SBP) and diastolic BP (DBP) than either a control diet ora weight-reducing diet, among men and women. Thesereductions were in the range of 11 to 12 mm Hg for SBP and
6 to 7 mm Hg for DBP.1 Although the individual contribu-tions of low-fat dairy on BP could not be determined fromthis combination diet, the DASH Study researchers attributedthe beneficial BP effect to the high intake of dairy-richcalcium and potassium in the DASH Study diet. Evidencewith respect to consumption of milk and dairy products inrelation to BP reduction has been summarized in a recentreview of the literature.2 Based on results from 11 cross-sectional and 8 prospective studies, it was concluded thatincreased dairy food consumption is associated with lowerSBP and lower risk for hypertension, particularly for low-fatdairy food. A recent intervention study has also demonstrateda reduction in SBP after an intake of 3 servings of low-fatdairy products per day for 2 months.3
Traditionally, BP is measured by assessing the pressure inthe brachial artery in the upper arm, and arterial stiffness isassessed by way of pulse pressure (PP; SBP�DBP). Howeverit is becoming increasingly recognized that measures ofcentral arterial function, that is, measures of arterial stiffness,are more valuable predictors of vascular health outcomes.4
The central arteries slowly stiffen with age, with the rateinfluenced by hypertension, diabetes mellitus, and atheroscle-
Received December 16, 2011; first decision January 20, 2012; revision accepted February 26, 2012.From the Nutritional Physiology Research Centre (G.E.C.), University of South Australia, Adelaide, South Australia, Australia; Department of
Psychology (M.F.E., G.A.D., M.A.R.) and Graduate School of Biomedical Sciences (M.F.E., M.A.R.), University of Maine, Orono, ME; College ofMedicine, Biology, and Environment (W.P.A.), Australian National University, Canberra, Australian Capital Territory, Australia.
Conclusions expressed in the article are those expressed by the authors and not by the institutions providing support.The online-only Data Supplement is available with this article at http://hyper.ahajournals.org/lookup/suppl/doi:10.1161/HYPERTENSIONAHA.
111.190017/-/DC1.Correspondence to Georgina E. Crichton, Nutritional Physiology Research Centre, University of South Australia, GPO Box 2471, Adelaide, South
Australia 5001, Australia. E-mail [email protected]© 2012 American Heart Association, Inc.
Hypertension is available at http://hyper.ahajournals.org DOI: 10.1161/HYPERTENSIONAHA.111.190017
1044
by guest on June 9, 2017http://hyper.ahajournals.org/
Dow
nloaded from
by guest on June 9, 2017http://hyper.ahajournals.org/
Dow
nloaded from
by guest on June 9, 2017http://hyper.ahajournals.org/
Dow
nloaded from
by guest on June 9, 2017http://hyper.ahajournals.org/
Dow
nloaded from
by guest on June 9, 2017http://hyper.ahajournals.org/
Dow
nloaded from
by guest on June 9, 2017http://hyper.ahajournals.org/
Dow
nloaded from
by guest on June 9, 2017http://hyper.ahajournals.org/
Dow
nloaded from
by guest on June 9, 2017http://hyper.ahajournals.org/
Dow
nloaded from
by guest on June 9, 2017http://hyper.ahajournals.org/
Dow
nloaded from
by guest on June 9, 2017http://hyper.ahajournals.org/
Dow
nloaded from
by guest on June 9, 2017http://hyper.ahajournals.org/
Dow
nloaded from
by guest on June 9, 2017http://hyper.ahajournals.org/
Dow
nloaded from
by guest on June 9, 2017http://hyper.ahajournals.org/
Dow
nloaded from

rosis.5 Pulse wave velocity (PWV) is now considered the goldstandard noninvasive method for measuring arterial stiffnessand is an independent predictor of cardiovascular events andall-cause mortality.6,7
There have been few studies on the role of micronutrientsin the treatment of arterial stiffness. A recent review showedsupport for the intake of omega 3 fish oils and soy isofla-vones, as well as consumption of fermented milk productscontaining bioactive peptides.8 Studies evaluating the rela-tionship between milk and dairy products and holistic mark-ers of CVD risk, such as arterial stiffness, have beenrecommended,9 as has research to examine the role ofmicronutrients in the treatment of arterial stiffness.8 The aimof our study was to examine dairy food intake, per se, inrelation to measures of arterial stiffness via carotid-femoralPWV (cfPWV), PP, and other indices of cardiovascularhealth, including SBP and DBP.
Methods
ParticipantsParticipants were obtained from the Maine-Syracuse LongitudinalStudy (MSLS), a study designed to examine cardiovascular riskfactors in relation to cognitive performance in community-dwellingindividuals. The MSLS consists of 5 cohorts defined by time of entryinto the study (1975–2000). Recruitment and data collection proce-dures for the MSLS have been described previously in detail.10 Thedata for the present study were obtained from those participantsreturning for the seventh study wave, because both cfPWV anddietary intake measures were obtained at this examination for thefirst time.
From an initial sample of 626 individuals with cfPWV data atwave 7, participants were excluded in the following order: (1) historyof stroke (n�14); (2) probable dementia (n�2); (3) inability to readEnglish (n�1); (4) missing data on dairy consumption (n�3); or (5)suboptimal quality of data on arterial stiffness as defined a priori asa cfPWV error of estimate �20% (n�19). Dementia and stroke werereasons for exclusion, because we were interested in examining rela-tionships between diet and arterial stiffness in a community-dwelling,relatively healthy study population. The characteristics of the finalsample with complete data (N�587) are presented in Table 1.
The University of Maine Institutional Review Board approved thisstudy, and the use of deidentified MSLS data was approved by theUniversity of South Australia Human Ethics Committee. All of theparticipants provided informed consent for data collection, and all of
the procedures followed were in accordance with institutionalguidelines.
ProcedureWithin 2 weeks of the laboratory visit, participants completed theCenter for Epidemiological Studies Depression Scale (CES-D),11 theNurses’ Health Study Activity Questionnaire,12 and the Nutritionand Health Questionnaire.13 At this visit, a blood sample, brachialartery BP, and pulse wave measures were obtained before breakfast,after an overnight fast. Standard assay methods were used10,14 toobtain total cholesterol, high-density lipoprotein (HDL) cholesterol,low-density lipoprotein (LDL) cholesterol, triglycerides, fastingplasma glucose, and plasma homocysteine. After a light breakfast,including decaffeinated tea or coffee, participants underwent amedical interview, including a detailed medical history.
BP and cfPWV AssessmentBrachial artery pressures were measured in accordance with theprocedure at previous MSLS waves, taken 5 times each in reclining,sitting, and standing positions after a supine rest for 10 minutes, witha 5-minute rest between each set of measures. Measures were takenusing the traditional pressure-cuff method (Critikon Dinamap Pro-Care 100, oscillometric method).
In a supine position, cfPWV was assessed noninvasively using theSphygmoCor system (AtCor Medical) with applanation tonometry.The carotid-femoral path length was estimated as the surfacedistances joining the suprasternal notch, the umbilicus, and thefemoral pulse subtracted from distance between the suprasternalnotch and the carotid pulse. Carotid-femoral transit time wasestimated in 8 to 10 sequential ECG-gated femoral and carotidwaveforms as the average time difference between the onset of thefemoral and carotid waveforms. The intersecting tangent method wasused to identify the foot of the pulse wave. PWV was calculated asthe carotid-femoral path length divided by the carotid-femoral transittime, a reproducible measure of central arterial stiffness.6
Dietary AssessmentDiet was assessed using the Nutrition and Health Questionnaire,which is composed of 41 questions about dietary intake, smokinghistory, physical activity, marital status, medical history, self-reported health, and medication and supplement use.13,15 The ques-tionnaire has been used in a large investigation of cancer andnutrition, and its acceptable validity has been demonstrated bycomparison with dietary recall, protein excretion, and total energyexpenditure data.16 The dietary component questions participantsabout their frequency of consumption of meat, fish, dairy products,eggs, breads, cereals, and beverages including tea, coffee, carbonateddrinks, water, fruit juice, and alcohol. A comprehensive list of 37foods follows, and participants are required to stipulate how fre-
Table 1. Self-Reported Intakes of Cheese, Yoghurt/Dairy Desserts, Cream/Ice Cream, Total Dairy Food, and Milk (N�587)
Dairy Product
Dairy Food Intake
Never/Seldom,n (%)
1 Time per wk,n (%)
2–4 Timesper wk, n (%)
5–6 Timesper wk, n (%)
�1 Timeper d, n (%)
Cheese 92 (15.7) 147 (25.0) 245 (41.8) 70 (11.9) 33 (5.6)
Yoghurt and dairy desserts 275 (46.8) 98 (16.7) 130 (22.1) 44 (7.5) 40 (6.8)
Cream and ice cream 294 (50.1) 164 (28.0) 100 (17.0) 21 (3.6) 8 (1.4)
Total dairy food 37 (6.3) 40 (6.8) 141 (24.0) 153 (26.1) 216 (36.8)
0–150 mL/d 150 mL/d 300 mL/d 450 mL/d �600 mL/d
Milk 180 (30.7) 67 (11.4) 151 (25.7) 32 (5.5) 157 (26.7)
Whole fat (5.9%)* 13 (40.6) 3 (9.4) 6 (18.8) 1 (3.1) 7 (21.9)
Skim/reduced fat (80.4%)* 126 (28.7) 53 (12.1) 103 (23.5) 27 (6.2) 124 (28.3)
Other (eg, soy; 13.7%)* 28 (37.3) 7 (9.3) 12 (16.0) 3 (4.0) 23 (30.7)
*Percentage from within-milk group.
Crichton et al Dairy Food and Arterial Stiffness 1045
by guest on June 9, 2017http://hyper.ahajournals.org/
Dow
nloaded from

quently they consume each food, with 6 response options: never,seldom, once a week, 2 to 4 times a week, 5 to 6 times a week, oronce or more a day. These 6 response options were used to form the5-level categorization of total dairy food consumption, with thenever and seldom respondents grouped together because of the lownumbers in each category. Dairy products included were milk,cheese, yoghurt and dairy desserts (grouped together), ice cream andcream (grouped together), and total dairy foods. Milk was the onlydairy food for which participants were asked to stipulate the fatcontent of milk consumed (whole fat, reduced fat, or skim). Milkintake included milk on cereal and in other beverages, such as teaand coffee. Soy milk intake was not included in any analyses of dairyand cfPWV.
The median score within each response option was used toestimate total intakes per week for each food in the questionnaire; forexample, 2 to 3 times per week was estimated at 2.5. These totalswere used to determine mean daily intakes for each food. Becauseportion sizes were not stipulated, the totals are an estimate of thenumber of times each food was consumed on a daily basis.Individual foods were grouped into 5 major food categories (inaddition to dairy products), grains, fruits, vegetables, protein foods,and fats/sweets/other (empty calories), based on the US Departmentof Agriculture MyPlate.17 Intakes of individual foods and beverageswithin each food group were summed to give an estimate of totalintake for each group, and intakes for all of the food groups wereadded to estimate total energy intake. The primary predictor variablein this study was the 5-level categorization of total dairy foodconsumption.
CovariatesVariables that were measured at the physical examination and wereconsidered as candidates for inclusion in the covariate sets includedheight, weight, body mass index (BMI), waist circumference, andprevalent obesity, diabetes mellitus, hypertension, and CVD. BMIwas calculated from height and weight (in kilograms per metersquared), and obesity was defined as BMI of �30 kg/m2. Waistcircumference was measured over light clothing, using a nonextend-able tape at the level of the iliac crest. Diabetes mellitus was definedas treatment with insulin, oral antidiabetic agents, or by fastingglucose level of �7 mmol/L. Hypertension was defined as treatmentfor hypertension or a BP of �140/90 mm Hg. Prevalent CVD wasdefined by the self-reported presence of coronary artery disease,myocardial infarction, congestive heart failure, transient ischemicattack, or angina pectoris and confirmed by medical charts. Wherenecessary, diagnostic determinations were confirmed by chart reviewwith permission.
Statistical AnalysesData were analyzed with SPSS (version 18; SPSS, Chicago, IL).Preliminary analyses were performed to assess any significantcorrelations among dairy intake, cfPWV, and other demographic,health, nutrition, and lifestyle factors. The dairy intakes in the samplewere calculated, and the demographic, health, and dietary character-istics of those who consume dairy food at least once per day andthose who consume less than this were tested for differences usingANOVA or �2 tests where appropriate. For the primary analyses,univariate ANCOVA was used to compare cfPWV across increasingintakes of dairy food consumption, ranging from never/seldom to atleast once per day, and polynomial trend analyses were performedacross the 5 levels of dairy food intake only after the ANCOVA testof the dairy intake main effect was found to be statisticallysignificant (P�0.05). If the omnibus test of overall differencesamong groups was observed, any significant trends were reported.Adjustments for multiple comparisons among dairy food intakegroups were made and reported in terms of the Bonferroniadjustment.
An age-adjusted model was first performed, and then analysesfollowed using 4 covariate sets. The extended covariate sets were asfollows: (1) basic covariate set: age, sex, education, and race; (2)extended covariate set 1: basic set�height, weight, heart rate,antihypertensive drug treatment (yes/no), and mean arterial pressure
(MAP); (3) extended covariate set 2: extended covariate set 1�waistcircumference, total cholesterol, HDL, and LDL cholesterol; and (4)extended covariate set 3: extended covariate set 2�depressivesymptoms (CES-D raw score), intake of grains, vegetables, proteinfoods, empty calories (sweets, fats, and others), and total intake fromall of the food groups (all in times per day).
Because adjustment for height when assessing cfPWV has beenrecommended,18 height and weight were used in the extendedcovariate set 1 instead of BMI. However, alternative analyses(reported in the Results section) were done with height and weightremoved and with waist circumference substituted.
Variables were required to meet 1 of 2 criteria to be included as anadditional covariate: significantly related (P�0.05) to dairy foodintake (the predictor) and cfPWV (the primary outcome variable) tobe included in the second extended model or differed significantlybetween low (less than once per day) and high (at least daily) dairyconsumers to be included in the third extended model. Preliminarycorrelational analyses were performed to ensure that MAP had thesame relationship to cfPWV in each dairy intake category. MAP wascalculated as DBP�1/3(SBP�DBP). cfPWV was significantly cor-related with MAP for both low dairy consumers (�1 time per day,n�371) and high dairy consumers (�1 time per day, n�216),indicating that MAP has the same relationship to PWV regardless ofdairy intake. Additional analyses were performed with the inclusionof a dairy intake�MAP interaction term.
Supplemental Table 1 shows those health and dietary variablesthat were significantly correlated with both dairy food intake andcfPWV. Although PWV, SBP, and PP were highly correlated, theywere used as dependent variables in the current study. For all of themodels used, covariates were entered simultaneously with thepredictor variables.
ResultsThe self-reported intakes of dairy foods (milk, cheese, yo-ghurt and dairy desserts, and cream and ice cream) are shownin Table 1. Slightly more than one third of the sample (36.8%)reported eating dairy food at least once per day. Half ofparticipants (50.1%) reported eating dairy foods between 2and 6 times per week. The remaining participants (13.1%)reported eating dairy foods no more than once per week. Forindividual foods, milk was the dairy product consumed mostfrequently on a daily basis. Nearly one third of the samplereported drinking �600 mL of milk per day, equating to justover 2 servings per day. A similar proportion of the sampleconsumed �150 mL per day, with the remaining participants(42.6%) drinking between 150 and 450 mL per day. Of thosethat drank milk, the majority reported drinking skim orreduced fat milk (80.4%). Cheese was most often consumedbetween 2 and 4 times per week. Yoghurt, dairy desserts,cream, and ice cream were consumed infrequently.
In Table 2, the demographic, health, and nutritional char-acteristics of participants who consumed dairy food at leastdaily (36.8%) are compared with those who consumed dairyfood less frequently than this (63.2%). Participants whoconsumed dairy on a daily basis consumed more vegetablesand protein foods but fewer grains and empty calories(sweets/fats), adjusting for total energy intake, compared withthose who ate dairy less frequently than this. They also had ahigher number of years of education, lower body weight andwaist circumference, lower SBP and DBP, and fewer depres-sive symptoms (all P�0.05). More women than men con-sumed dairy food on a daily basis.
There was a decrease in cfPWV, PP, and SBP for partic-ipants across increasing intakes of dairy food, ranging from
1046 Hypertension May 2012
by guest on June 9, 2017http://hyper.ahajournals.org/
Dow
nloaded from
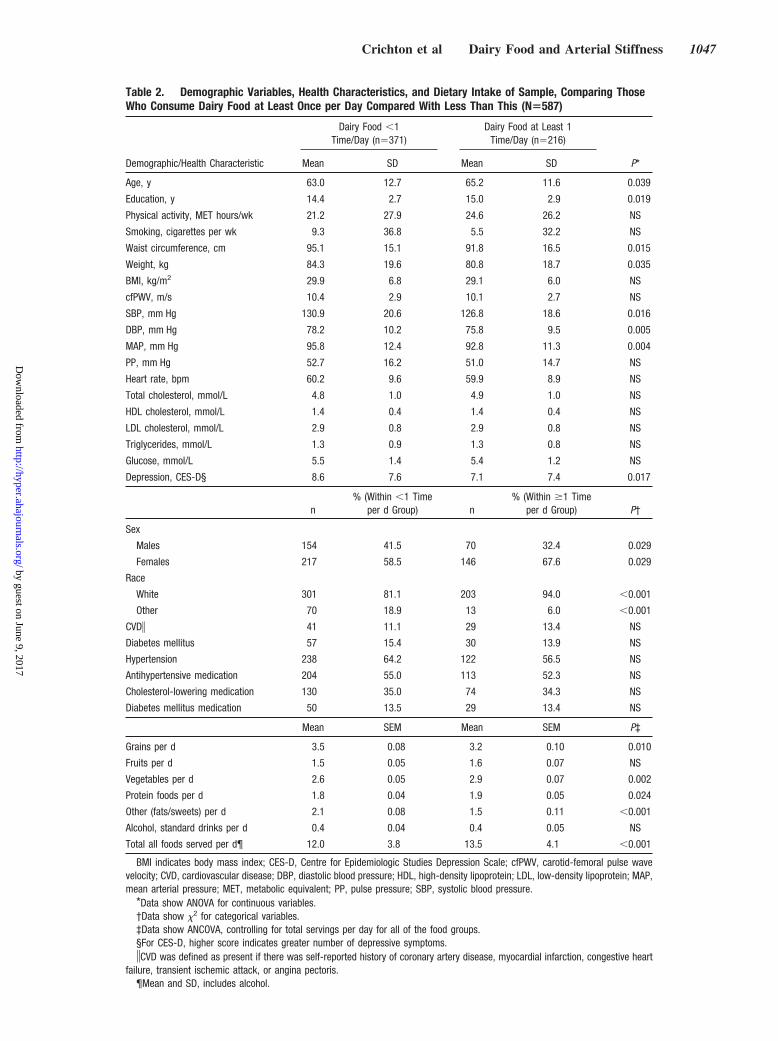
Table 2. Demographic Variables, Health Characteristics, and Dietary Intake of Sample, Comparing ThoseWho Consume Dairy Food at Least Once per Day Compared With Less Than This (N�587)
Demographic/Health Characteristic
Dairy Food �1Time/Day (n�371)
Dairy Food at Least 1Time/Day (n�216)
P*Mean SD Mean SD
Age, y 63.0 12.7 65.2 11.6 0.039
Education, y 14.4 2.7 15.0 2.9 0.019
Physical activity, MET hours/wk 21.2 27.9 24.6 26.2 NS
Smoking, cigarettes per wk 9.3 36.8 5.5 32.2 NS
Waist circumference, cm 95.1 15.1 91.8 16.5 0.015
Weight, kg 84.3 19.6 80.8 18.7 0.035
BMI, kg/m2 29.9 6.8 29.1 6.0 NS
cfPWV, m/s 10.4 2.9 10.1 2.7 NS
SBP, mm Hg 130.9 20.6 126.8 18.6 0.016
DBP, mm Hg 78.2 10.2 75.8 9.5 0.005
MAP, mm Hg 95.8 12.4 92.8 11.3 0.004
PP, mm Hg 52.7 16.2 51.0 14.7 NS
Heart rate, bpm 60.2 9.6 59.9 8.9 NS
Total cholesterol, mmol/L 4.8 1.0 4.9 1.0 NS
HDL cholesterol, mmol/L 1.4 0.4 1.4 0.4 NS
LDL cholesterol, mmol/L 2.9 0.8 2.9 0.8 NS
Triglycerides, mmol/L 1.3 0.9 1.3 0.8 NS
Glucose, mmol/L 5.5 1.4 5.4 1.2 NS
Depression, CES-D§ 8.6 7.6 7.1 7.4 0.017
n% (Within �1 Time
per d Group) n% (Within �1 Time
per d Group) P†
Sex
Males 154 41.5 70 32.4 0.029
Females 217 58.5 146 67.6 0.029
Race
White 301 81.1 203 94.0 �0.001
Other 70 18.9 13 6.0 �0.001
CVD� 41 11.1 29 13.4 NS
Diabetes mellitus 57 15.4 30 13.9 NS
Hypertension 238 64.2 122 56.5 NS
Antihypertensive medication 204 55.0 113 52.3 NS
Cholesterol-lowering medication 130 35.0 74 34.3 NS
Diabetes mellitus medication 50 13.5 29 13.4 NS
Mean SEM Mean SEM P‡
Grains per d 3.5 0.08 3.2 0.10 0.010
Fruits per d 1.5 0.05 1.6 0.07 NS
Vegetables per d 2.6 0.05 2.9 0.07 0.002
Protein foods per d 1.8 0.04 1.9 0.05 0.024
Other (fats/sweets) per d 2.1 0.08 1.5 0.11 �0.001
Alcohol, standard drinks per d 0.4 0.04 0.4 0.05 NS
Total all foods served per d¶ 12.0 3.8 13.5 4.1 �0.001
BMI indicates body mass index; CES-D, Centre for Epidemiologic Studies Depression Scale; cfPWV, carotid-femoral pulse wavevelocity; CVD, cardiovascular disease; DBP, diastolic blood pressure; HDL, high-density lipoprotein; LDL, low-density lipoprotein; MAP,mean arterial pressure; MET, metabolic equivalent; PP, pulse pressure; SBP, systolic blood pressure.
*Data show ANOVA for continuous variables.†Data show �2 for categorical variables.‡Data show ANCOVA, controlling for total servings per day for all of the food groups.§For CES-D, higher score indicates greater number of depressive symptoms.�CVD was defined as present if there was self-reported history of coronary artery disease, myocardial infarction, congestive heart
failure, transient ischemic attack, or angina pectoris.¶Mean and SD, includes alcohol.
Crichton et al Dairy Food and Arterial Stiffness 1047
by guest on June 9, 2017http://hyper.ahajournals.org/
Dow
nloaded from

never/seldom to �1 time per day (Table 3). Table 3 shows the95% confidence limits associated with each mean for eachgroup and summarizes the results of statistical analyses forthe age-adjusted, basic, and the most extended models. TableS2 describes the results for each covariate set for eachdependent variable.
For the age-adjusted model, the lowest cfPWV values(mean value: 9.9 m/s) were observed for those who consumeddairy products �5 to 6 times per week and daily (mean value:10.0 m/s). With the addition of demographic variables, othercardiovascular risk factors, and nutrition variables, this sig-nificant linear trend across increasing intakes of dairy foodremained (extended covariate set 3). The cfPWV of those inthe lowest 3 intake categories (eat dairy 0–4 times per week)was significantly higher than the cfPWV for those in thehighest 2 intake categories (eat dairy �5–7 times per week;P�0.001). No associations between individual dairy foods(milk, cheese, yoghurt and dairy desserts, and cream and icecream) and cfPWV were found (all P�0.30).
The pattern of results was very similar for PP and SBP(Table 3). For all of the fully extended models, PP and SBPdecreased in a linear fashion as dairy food intake increased.Contrasts performed between categories of intake showedthat those who consumed dairy food �5 to 6 times per weekhad significantly lower PP and SBP than those who never orrarely consumed dairy foods, after adjustment for demo-graphic, cardiovascular, and dietary factors. Figure S1 showsthe reductions in cfPWV, PP, and SBP across increasingintakes of dairy food.
No significant differences among dairy intake groups wereobserved for DBP, waist circumference, total cholesterol,
HDL and LDL cholesterol, or triglyceride measures for eitherthe basic or extended models. These results are displayed inthe supplemental data (Table S2).
Additional AnalysesThe pattern of significant results remain unchanged when thefollowing additional regression models were used: waistcircumference was substituted for height and weight, aMAP�dairy intake interaction was used in the model withMAP, and physical activity was added to the extendedcovariate sets. The analyses were repeated for participants noton any medication (n�218). Comparing those who ate dairyless than daily (n�137) with those who ate dairy food at leastdaily (n�81), the patterns of results for cfPWV were thesame as for the whole sample, with the high dairy consumershaving a lower cfPWV in all of the covariate models (data notshown).
DiscussionDairy product intake was inversely associated with cfPWVand SBP, with adjustment for demographic, cardiovascular,and dietary factors. cfPWV, PP, and SBP all decreased in alinear fashion as dairy food intake increased across categoriesof intake from never/seldom to 5 to 6 times per week or more.Importantly, we have also shown that dairy food intake is notadversely associated with higher levels of cholesterol (total,HDL, and LDL cholesterol) or increased abdominal obesity(as measured by waist circumference). Moreover, our resultsfor cfPWV, the gold standard measure of arterial stiffness,were supported by our findings for PP and SBP, surrogatehemodynamic indices of arterial stiffness.
Table 3. Results of ANCOVA, Showing Associations Among cfPWV, PP, and SBP Across Increasing Intakes of Dairy Food (N�587),for Basic, Age-Adjusted, and Extended Covariate Set 3
OutcomeMeasure Covariate Set
Dairy Food Intake
P*
Never/Seldom(n�37)
1 Time per wk(n�40)
2–4 Timesper wk (n�141)
5–6 Timesper wk (n�153) �1 Time per d (n�216)
Mean 95% CI Mean 95% CI Mean 95% CI Mean 95% CI Mean 95% CI
cfPWV Age-adjusted 10.8 10.0–11.5 11.1 10.4–11.8 10.8 10.4–11.2 9.9�¶ 9.6–10.3 10.0¶ 9.7–10.3 .000‡
Basic 10.6 9.8–11.4 10.9 10.2–11.6 10.7 10.3–11.1 10.0 9.6–10.3 10.1 9.7–10.4 .016†
Extended 3 11.0 10.3–11.7 10.8 10.1–11.5 10.6 10.3–11.0 10.0 9.6–10.3 10.1 9.8–10.4 .018‡
PP Age-adjusted 56.3 51.9–60.7 57.8 53.5–62.1 53.2 50.9–55.5 51.3 49.1–53.4 50.2� 48.3–52.0 .003‡
Basic 56.3 51.9–60.6 56.6 52.3–60.9 52.7§ 50.5–55.0 51.4§ 49.2–53.5 50.6§ 48.8–52.4 .035‡
Extended 3 57.6 54.1–61.0 53.1 49.8–56.5 52.4 50.6–54.1 50.8§ 49.2–52.4 51.6§ 50.2–53.0 .013‡
SBP Age-adjusted 131.8 125.6–137.9 138.7 132.7–144.6 131.7 128.5–134.8 128.8� 125.8–131.9 126.1� 123.6–128.7 .001‡
Basic 130.1 124.1–136.2 135.9 130.1–141.8 130.4 127.3–133.4 129.5 126.5–132.4 127.4 124.8–129.9 NS
Extended 3 133.0 130.7–135.3 130.1 127.8–132.3 129.6 128.4–130.7 128.5§ 127.4–129.6 129.1§ 128.1–130.0 .013‡
CES-D indicates Center for Epidemiologic Studies Depression Scale; cfPWV, carotid-femoral pulse wave velocity; HDL, high-density lipoprotein; LDL, low-densitylipoprotein; PP, pulse pressure; SBP, systolic blood pressure; WC, waist circumference; age-adjusted: adjusted for age; basic set: adjusted for age, education, sex,and race; extended set 3: adjusted for variables in basic set�height, weight, heart rate, antihypertensive drug treatment, mean arterial pressure, WC, total cholesterol,HDL and LDL cholesterol, CES-D raw score�grains per day, vegetables per day, sweets per day, protein per day, and total food servings per day.
*P for overall omnibus outcome.†P�0.05 for statistically significant linear trend.‡P �0.01 for statistically significant linear trend.§Data were significantly different from the never/seldom group.�Data were significantly different from 1 time per wk group.¶Data were significantly different from the 2–4 times per wk group.
1048 Hypertension May 2012
by guest on June 9, 2017http://hyper.ahajournals.org/
Dow
nloaded from
These findings are consistent with research examining theeffects of different milk-derived proteins on BP and arterialstiffness. Peptides derived from milk protein, including caso-kinins (casein derived) and lactokinins (whey derived) havebeen shown to inhibit angiotensin I–converting enzymeactivity, an important enzyme involved in BP regulation.19,20
Beneficial effects on BP and augmentation index have beenreported for both fermented milk rich in casein21–23 and richin whey protein.24,25 A more recent study found that ioniccalcium, in addition to lactic acid bacteria, released duringmilk fermentation also contributed to angiotensin I–convert-ing enzyme–inhibitory activity.26 This small collection ofresearch does provide evidence for the role of probiotic dairyproducts in BP modification. Further research is needed todetermine their role in the treatment of arterial stiffness.
Our data support one of the first intervention studies toexamine the effects of low-fat dairy product consumption onBP, in addition to other risk parameters of the metabolicsyndrome.3 Consumption of 3 servings of low-fat dairy foodsin overweight individuals for 8 weeks resulted in a significantreduction in SBP (2.9�7.4 mm Hg). The high dairy dietshowed no relationship with total cholesterol, LDL choles-terol, or triglycerides.
Our findings also support studies that have examined dairyproducts without added probiotics in relation to measures ofCVD. These include a number of recent reviews, including ameta-analysis by Elwood et al,27 who found significantreductions in the relative risk of ischemic heart disease,ischemic stroke, and hemorrhagic stroke in those who con-sume the most milk, and other reviews of prospective studies,which have failed to find a consistent relationship betweendairy food intake and coronary heart disease.28,29 Mostrecently, an increased consumption of yoghurt has beenassociated with carotid artery intima-media thickness,30 amarker of atherosclerotic vascular disease and predictor offuture cardiovascular and cerebrovascular events.31 Thisstudy showed that women aged �70 years who consumed�100 g of yoghurt per day had a significantly lower carotidartery intima-media thickness than those with lower yoghurtintakes, after adjustment for baseline, dietary, and lifestylerisk factors. Higher milk, cheese, or total dairy intakes werenot associated with carotid artery intima-media thickness orwith SBP or DBP. An earlier prospective study found thatyoghurt intake was associated with a lower risk of acutemyocardial infarction,32 a clinical consequence of atheroscle-rotic vascular disease.
Little is known about the mechanisms by which dairyfoods may improve BP or arterial stiffening, a slow processresulting from changes in the extracellular matrix of thearterial walls. The strongest evidence surrounds the role ofbioactive peptides derived from dairy protein, released duringdigestion, to inhibit angiotensin I–converting enzyme, mod-ulate endothelial function, and cause vasodilatation.33 Addi-tional components of dairy are likely to play a role. Highlevels of potassium have been associated with lower BP innumerous observational studies and clinical trials.34 Dietarypotassium is thought to cause vasodilatation by stimulatingthe sodium pump and opening potassium channels, as well asreducing vasoconstrictive sensitivity to angiotensin II.34 Mag-
nesium modulates vascular tone and reactivity and stimulatesthe production of vasodilators, improving blood flow anddecreasing vascular resistance, thereby lowering BP andincreasing arterial function.35 Phosphorus from dairy prod-ucts has been associated recently with lower BP and areduced risk of incident hypertension in a large prospectivestudy.36 Without a known mechanism on how dairy phospho-rus may reduce BP, it may be the combination of a range ofnutrients in dairy foods that is effective in modulating BP.Finally, dietary calcium has been linked with low BP,working in combination with sodium, potassium, and mag-nesium to ensure ionic balance, stabilize vascular cell mem-branes, and increase vasodilatation.34 BP reduction may alsobe mediated by body weight or fat reductions, becausesubstantial evidence exists for an antiobesity effect ofdairy,37–39 and any positive effect on weight loss will be ofbenefit to BP.
Studies have reported that consumption of caffeinated teaand coffee affects PWV if consumed immediately beforePWV analyses.40,41 Our participants consumed noncaffein-ated tea and coffee on the day of the examination. Coffee andtea consumption as a routine part of the diet was not relatedto cfPWV, PP, or BP.
Although the differences in cfPWV and SBP according todairy food intake in this study were relatively small (differ-ence of 1.0 m/s and 4.5 mm Hg between never/seldom and5–6 times per week groups for cfPWV and SBP, respec-tively), the differences are likely to be clinically significant.In a recent meta-analysis, it was estimated that, for every1 m/s increase in cfPWV, there were age-, sex,- and riskfactor–adjusted increases of 14%, 15%, and 15% in totalCVD events, CVD mortality, and all-cause mortality, respec-tively.7 Clearly, hypertension represents a modifiable riskfactor with US data suggesting that even small reductions inBP can have a great public health impact and translate intosubstantial reductions in coronary heart disease and strokeevents.42,43 It has been estimated that a reduction in SBP by2 mm Hg may reduce the risk for stroke and myocardialinfarction by �4%.44
A limitation to the study can be regarded as the lack ofdetailed information regarding quantities of foods, includingdairy food, consumed. Participants were asked, “How oftendo you eat the following foods?” but were not required toestimate portion or serving sizes. Quantities are thereforelikely to differ substantially among individuals, as well as thesame individual on different occasions. In addition, the rangeof responses to indicate how often a food is consumed waslimited in the high intake range; that is, there was not a morespecific measure of intake beyond “once or more a day.” Weare also unable to stipulate the fat content of dairy foodconsumed based on information provided (with the exceptionof milk). The study was cross-sectional, and dietary measure-ment at only 1 point in time may not reflect long-termconsumption patterns. Secondly, the cross-sectional nature ofthe study does not enable us to come to any conclusionsregarding causality. We are unable to infer that increasingdairy intake may decrease arterial stiffness. The age range inthe present study was wide, but we adjusted for age in ourstatistical analytic procedures, because we did not have
Crichton et al Dairy Food and Arterial Stiffness 1049
by guest on June 9, 2017http://hyper.ahajournals.org/
Dow
nloaded from
sufficient numbers of subjects to examine results for multipleage groups over a narrower range of ages. Finally, the MAPin this study was estimated using SBP and DBP and was nota true measure of MAP.
This study has a number of strengths. This is the firstcross-sectional study that has examined dairy food intake (notlimited to fermented dairy products) and cfPWV as a measureof arterial stiffness. We have examined this relationship in alarge, community-dwelling, healthy sample across a wide agespan and controlled for relevant demographic, health, anddietary variables.
PerspectivesHigher dairy food intake was associated with lower cfPWVand accompanying reductions of PP and SBP. Further evi-dence from long-term longitudinal or intervention studies isneeded before the incorporation of dairy foods into a bal-anced diet for the attenuation of arterial stiffening can berecommended. However, this initial analysis of dairy con-sumption in relation to arterial stiffness indicates that dairyconsumption is not associated with a worsening of traditionalrisk factors, such as hypercholesterolemia and hypertension,and may indeed have benefits in reducing arterial stiffness.
AcknowledgmentsWe thank Amanda Goodell and Suzanne Brennan (Maine-SyracuseLongitudinal Study, University of Maine) for their help with dataacquisition and data management.
Sources of FundingThe research was supported by the Maurice de Rohan InternationalScholarship (University of South Australia) and in part by theNational Heart, Lung, and Blood Institute (grants HL67358 andHL81290) and the National Institute on Aging (grant AG03055) ofthe National Institutes of Health.
DisclosuresNone.
References1. Azadbakht L, Mirmiran P, Esmaillzadeh A, Azizi T, Azizi F. Beneficial
effects of a Dietary Approaches to Stop Hypertension eating plan onfeatures of the metabolic syndrome. Diabetes Care. 2005;28:2823–2831.
2. Kris-Etherton PM, Grieger JA, Hilpert KF, West SG. Milk products,dietary patterns and blood pressure management. J Am Coll Nutr. 2009;28(suppl 1)103S–119S.
3. van Meijl LEC, Mensink RP. Low-fat dairy consumption reduces systolicblood pressure, but does not improve other metabolic risk parameters inoverweight and obese subjects. Nutr Metab Cardiovasc Dis. 2011;21:355–361.
4. Yasmin, Brown MJ. Similarities and differences between augmentationindex and pulse wave velocity in the assessment of arterial stiffness.QJM. 1999;92:595–600.
5. Benetos A, Waeber B, Izzo J, Mitchell G, Resnick L, Asmar R, Safar M.Influence of age, risk factors, and cardiovascular and renal disease onarterial stiffness: clinical applications. Am J Hypertens. 2002;15:1101–1108.
6. Laurent S, Cockcroft J, Van Bortel L, Boutouyrie P, Giannattasio C,Hayoz D, Pannier B, Vlachopoulos C, Wilkinson I, Struijker-Boudier H.Expert consensus document on arterial stiffness: methodological issuesand clinical applications. Eur Heart J. 2006;27:2588–2605.
7. Vlachopoulos C, Aznaouridis K, Stefanadis C. Prediction of cardio-vascular events and all-cause mortality with arterial stiffness: a systematicreview and meta-analysis. J Am Coll Cardiol. 2010;55:1318–1327.
8. Pase MP, Grima NA, Sarris J. The effects of dietary and nutrient inter-ventions on arterial stiffness: a systematic review. Am J Clin Nutr.2011;93:446–454.
9. Givens DI. Milk in the diet: good or bad for vascular disease? Proc NutrSoc. 2012;71:98–104.
10. Elias MF, Robbins MA, Budge MM, Elias PK, Brennan SL, Johnston C,Nagy Z, Bates CJ. Homocysteine, folate, and vitamins B6 and B12 bloodlevels in relation to cognitive performance: the Maine-Syracuse Study.Psychosom Med. 2006;68:547–554.
11. Radloff LS. The CES-D Scale: a self-report depression scale for researchin the general population. Applied Psychological Measures. 1977;1:385–401.
12. Wolf AM, Hunter DJ, Colditz GA, Manson JE, Stampfer MJ, CorsanoKA, Rosner B, Kriska A, Willett WC. Reproducibility and validity of aself-administered physical-activity quesionnaire. Int J Epidemiol. 1994;23:991–999.
13. Kaaks R, Riboli E. Validation and calibration of dietary intake mea-surements in the EPIC project: methodological considerations–EuropeanProspective Investigation into Cancer and Nutrition. Int J Epidemiol.1997;26(suppl 1)S15–S25.
14. Elias MF, Robbins MA, Budge MM, Elias PK, Dore GA, Brennan SL,Johnston C, Nagy Z. Homocysteine and cognitive performance: modifi-cation by the ApoE genotype. Neurosci Lett. 2008;430:64–69.
15. Riboli E, Kaaks R. The EPIC Project: rationale and study design–Eu-ropean Prospective Investigation into Cancer and Nutrition. Int J Epi-demiol. 1997;26(suppl 1)S6–S14.
16. Kroke A, Klipstein-Grobusch K, Voss S, Moseneder J, Thielecke F,Noack R, Boeing H. Validation of a self-administered food-frequencyquestionnaire administered in the European Prospective Investigation intoCancer and Nutrition (EPIC) Study: comparison of energy, protein, andmacronutuient intakes estimated with the doubly labeled water, urinarynitrogen, and repeated 24-h dietary recall methods. Am J Clin Nutrition.1999;70:439–447.
17. US Department of Agriculture. ChooseMyPlate.gov. http://www.choosemyplate.gov. Accessed October 19, 2011.
18. Smulyan H, Marchais SJ, Pannier B, Guerin AP, Safar ME, London GM.Influence of body height on pulsatile arterial hemodynamic data. J AmColl Cardiol. 1998;31:1103–1109.
19. FitzGerald RJ, Meisel H. Milk protein-derived peptide inhibitors ofangiotensin-I-converting enzyme. Br J Nutr. 2000;84(suppl 1)S33–S37.
20. FitzGerald RJ, Murray BA, Walsh DJ. Hypotensive peptides from milkproteins. J Nutr. 2004;134:980S–988S.
21. Hata Y, Yamamoto M, Ohni M, Nakajima K, Nakamura Y, Takano T.Placebo-controlled study of the effect of sour milk on blood pressure inhypertensive subjects. Am J Clin Nutrition. 1996;64:767–771.
22. Seppo L, Jauhiainen T, Poussa T, Korpela R. A fermented milk high inbioactive peptides has a blood pressure-lowering effect in hypertensivesubjects. Am J Clin Nutrition. 2003;77:326–330.
23. Jauhiainen T, Ronnback M, Vapaatalo H, Wuolle K, Kautiainen H, GroopPH, Korpela R. Long-term intervention with Lactobacillus helveticusfermented milk reduces augmentation index in hypertensive subjects. EurJ Clin Nutr. 2010;64:424–431.
24. Kawase M, Hashimoto H, Hosoda M, Morita H, Hosono A. Effect ofadministration of fermented milk containing whey protein concentrate torats and healthy men on serum lipids and blood pressure. J Dairy Sci.2000;83:255–263.
25. Pal S, Ellis V. The chronic effects of whey proteins on blood pressure,vascular function, and inflammatory markers in overweight individuals.Obesity (Silver Spring). 2010;18:1354–1359.
26. Gonzalez-Gonzalez CR, Tuohy KM, Jauregi P. Production ofangiotensin-I-converting enzyme (ACE) inhibitory activity in milk fer-mented with probiotic strains: effects of calcium, pH and peptides on theACE-inhibitory activity. Int Dairy J. 2011;21:615–622.
27. Elwood PC, Pickering JE, Givens DI, Gallacher JE. The consumption ofmilk and dairy foods and the incidence of vascular disease and diabetes:an overview of the evidence. Lipids. 2010;45:925–939.
28. Gibson RA, Makrides M, Smithers LG, Voevodin M, Sinclair AJ. Theeffect of dairy foods on CHD: a systematic review of prospective cohortstudies. Br J Nutr. 2009;102:1267–1275.
29. Mente A, de Koning L, Shannon HS, Anand SS. A systematic review ofthe evidence supporting a causal link between dietary factors andcoronary heart disease. Arch Intern Med. 2009;169:659–669.
30. Ivey KL, Lewis JR, Hodgson JM, Zhu K, Dhaliwal SS, Thompson PL,Prince RL. Association between yogurt, milk, and cheese consumptionand common carotid artery intima-media thickness and cardiovascular
1050 Hypertension May 2012
by guest on June 9, 2017http://hyper.ahajournals.org/
Dow
nloaded from

disease risk factors in elderly women. Am J Clin Nutrition. 2011;94:234–239.
31. Bots ML, Hoes AW, Koudstaal PJ, Hofman A, Grobbee DE. Commoncarotid intima-media thickness and risk of stroke and myocardial infarc-tion: the Rotterdam Study. Circulation. 1997;96:1432–1437.
32. Tavani A, Gallus S, Negri E, La Vecchia C. Milk, dairy products, andcoronary heart disease. J Epidemiol Community Health. 2002;56:471–472.
33. Clare DA, Swaisgood HE. Bioactive milk peptides: a prospectus. J DairySci. 2000;83:1187–1195.
34. Houston MC, Harper KJ. Potassium, magnesium, and calcium: their rolein both the cause and treatment of hypertension. J Clin Hypertens(Greenwich). 2008;10:3–11.
35. Sontia B, Touyz RM. Role of magnesium in hypertension. Arch BiochemBiophys. 2007;458:33–39.
36. Alonso A, Nettleton JA, Ix JH, de Boer IH, Folsom AR, Bidulescu A,Kestenbaum BR, Chambless LE, Jacobs DR Jr. Dietary phosphorus,blood pressure, and incidence of hypertension in the Atherosclerosis Riskin Communities Study and the Multi-Ethnic Study of Atherosclerosis.Hypertension. 2010;55:776–784.
37. Zemel MB. Role of calcium and dairy products in energy partitioning andweight management. Am J Clin Nutrition. 2004;79:907S–912S.
38. Zemel MB, Teegarden D, Van Loan MD, Schoeller DA, Matkovic V,Lyle RM, Craig BA. Dairy-rich diets augment fat loss on an energy-restricted diet: a multicenter trial. Nutrients. 2009;1:83–100.
39. Zemel MB, Thompson W, Milstead A, Morris K, Campbell P. Calciumand dairy acceleration of weight and fat loss during energy restriction inobese adults. Obes Res. 2004;12:582–590.
40. Mahmud A, Feely J. Acute effect of caffeine on arterial stiffness andaortic pressure waveform. Hypertension. 2001;38:227–231.
41. Vlachopoulos C, Hirata K, Stefanadis C, Toutouzas P, O’Rourke MF.Caffeine increases aortic stiffness in hypertensive patients. Am JHypertens. 2003;16:63–66.
42. Cook NR, Cohen J, Hebert PR, Taylor JO, Hennekens CH. Implicationsof small reductions in diastolic blood-pressure for primary prevention.Arch Intern Med. 1995;155:701–709.
43. Appel LJ, Brands MW, Daniels SR, Karanja N, Elmer PJ, Sacks FM.Dietary approaches to prevent and treat hypertension: a scientificstatement from the American Heart Association. Hypertension. 2006;47:296–308.
44. Selmer RM, Kristiansen IS, Haglerod A, Graff-Iversen S, Larsen HK,Meyer HE, Bonaa KH, Thelle DS. Cost and health consequences ofreducing the population intake of salt. J Epidemiol Community Health.2000;54:697–702.
Crichton et al Dairy Food and Arterial Stiffness 1051
by guest on June 9, 2017http://hyper.ahajournals.org/
Dow
nloaded from

A. RobbinsGeorgina E. Crichton, Merrrill F. Elias, Gregory A. Dore, Walter P. Abhayaratna and Michael
Pulse PressureRelations Between Dairy Food Intake and Arterial Stiffness: Pulse Wave Velocity and
Print ISSN: 0194-911X. Online ISSN: 1524-4563 Copyright © 2012 American Heart Association, Inc. All rights reserved.
is published by the American Heart Association, 7272 Greenville Avenue, Dallas, TX 75231Hypertension doi: 10.1161/HYPERTENSIONAHA.111.1900172012;59:1044-1051; originally published online March 19, 2012;Hypertension.
http://hyper.ahajournals.org/content/59/5/1044World Wide Web at:
The online version of this article, along with updated information and services, is located on the
http://hyper.ahajournals.org/content/suppl/2012/03/19/HYPERTENSIONAHA.111.190017.DC1Data Supplement (unedited) at:
http://hyper.ahajournals.org//subscriptions/
is online at: Hypertension Information about subscribing to Subscriptions:
http://www.lww.com/reprints Information about reprints can be found online at: Reprints:
document. Permissions and Rights Question and Answer this process is available in the
click Request Permissions in the middle column of the Web page under Services. Further information aboutOffice. Once the online version of the published article for which permission is being requested is located,
can be obtained via RightsLink, a service of the Copyright Clearance Center, not the EditorialHypertensionin Requests for permissions to reproduce figures, tables, or portions of articles originally publishedPermissions:
by guest on June 9, 2017http://hyper.ahajournals.org/
Dow
nloaded from

ONLINE SUPPLEMENT
RELATIONS BETWEEN DAIRY FOOD INTAKE AND ARTERIAL STIFFNESS: PULSE WAVE VELOCITY AND PULSE PRESSURE
Georgina E. Crichtona,*, Merrrill F. Eliasb,c, Gregory A. Doreb, Walter P. Abhayaratnad, Michael A. Robbinsb,c a Nutritional Physiology Research Centre, University of South Australia, Adelaide, Australia b Department of Psychology, University of Maine, Orono, Maine, USA c Graduate School of Biomedical Sciences, University of Maine, Orono, Maine, USA d College of Medicine, Biology and Environment, Australian National University, Canberra, Australia * Corresponding author: Georgina Crichton Nutritional Physiology Research Centre University of South Australia GPO Box 2471 Adelaide South Australia 5001 AUSTRALIA Email: [email protected] Phone: +61-8-83021452 Fax: +61-8-83022178
Tables: 2
Figures: 1 (A, B, C)
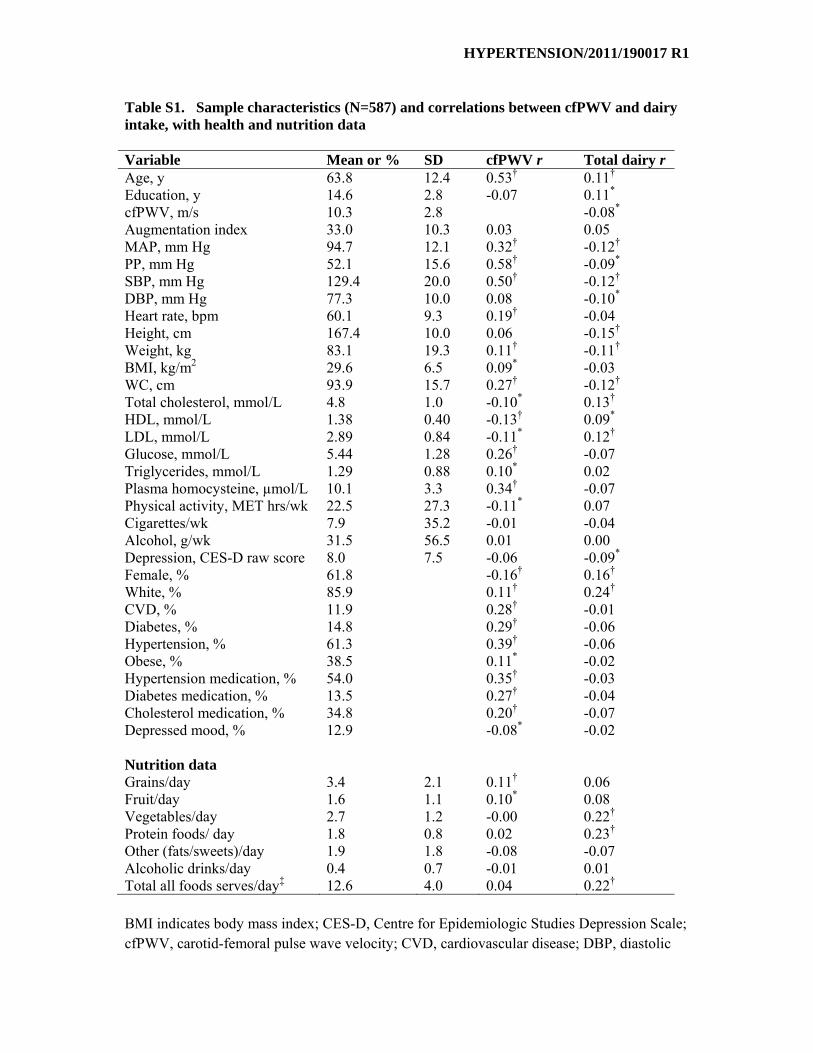
Table S1. Sample characteristics (N=587) and correlations between pulse wave velocity and dairy intake, with health and nutrition data
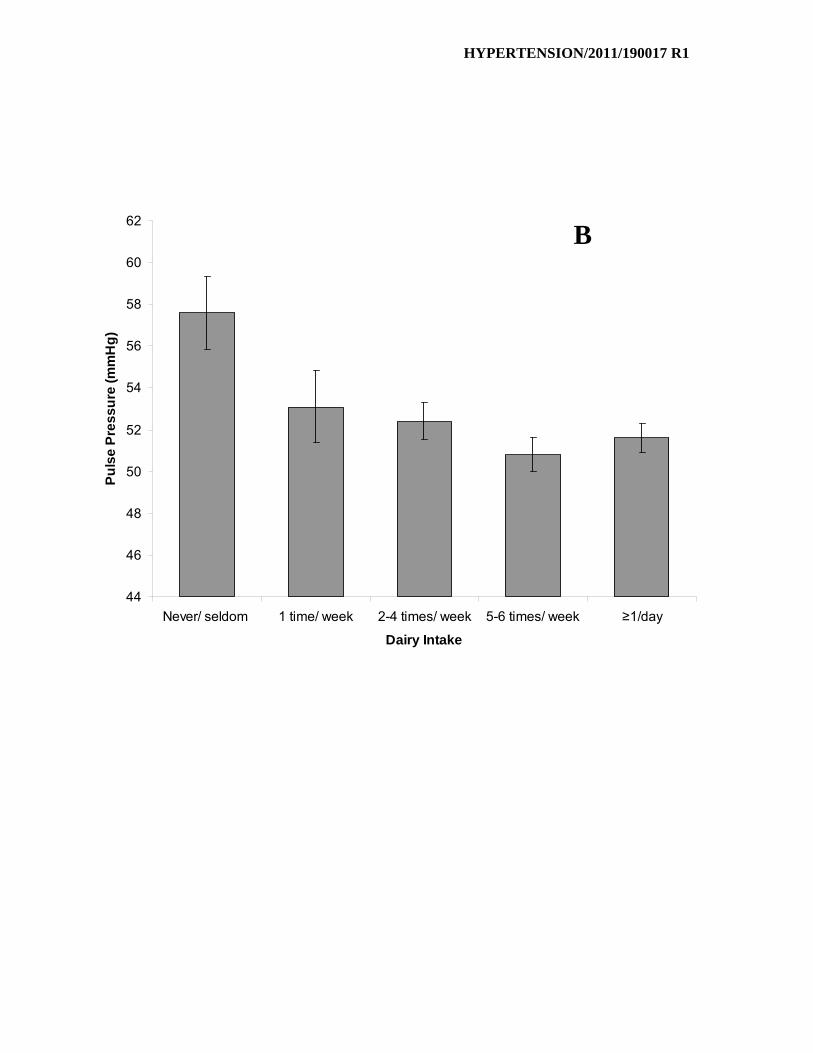
Table S2. Results of analysis of covariance, showing associations between cfPWV, BP, waist circumference, and blood lipids across increasing intakes of dairy food (N=587) Figure S1. Relationship between dairy intake and pulse wave velocity (A), pulse pressure (B), and systolic blood pressure (C) for the extended model.
HYPERTENSION/2011/190017 R1
Table S1. Sample characteristics (N=587) and correlations between cfPWV and dairy intake, with health and nutrition data Variable Mean or % SD cfPWV r Total dairy r Age, y 63.8 12.4 0.53† 0.11† Education, y 14.6 2.8 -0.07 0.11* cfPWV, m/s 10.3 2.8 -0.08* Augmentation index 33.0 10.3 0.03 0.05 MAP, mm Hg 94.7 12.1 0.32† -0.12† PP, mm Hg 52.1 15.6 0.58† -0.09* SBP, mm Hg 129.4 20.0 0.50† -0.12† DBP, mm Hg 77.3 10.0 0.08 -0.10* Heart rate, bpm 60.1 9.3 0.19† -0.04 Height, cm 167.4 10.0 0.06 -0.15† Weight, kg 83.1 19.3 0.11† -0.11† BMI, kg/m2 29.6 6.5 0.09* -0.03 WC, cm 93.9 15.7 0.27† -0.12† Total cholesterol, mmol/L 4.8 1.0 -0.10* 0.13† HDL, mmol/L 1.38 0.40 -0.13† 0.09* LDL, mmol/L 2.89 0.84 -0.11* 0.12† Glucose, mmol/L 5.44 1.28 0.26† -0.07 Triglycerides, mmol/L 1.29 0.88 0.10* 0.02 Plasma homocysteine, µmol/L 10.1 3.3 0.34† -0.07 Physical activity, MET hrs/wk 22.5 27.3 -0.11* 0.07 Cigarettes/wk 7.9 35.2 -0.01 -0.04 Alcohol, g/wk 31.5 56.5 0.01 0.00 Depression, CES-D raw score 8.0 7.5 -0.06 -0.09* Female, % 61.8 -0.16† 0.16† White, % 85.9 0.11† 0.24† CVD, % 11.9 0.28† -0.01 Diabetes, % 14.8 0.29† -0.06 Hypertension, % 61.3 0.39† -0.06 Obese, % 38.5 0.11* -0.02 Hypertension medication, % 54.0 0.35† -0.03 Diabetes medication, % 13.5 0.27† -0.04 Cholesterol medication, % 34.8 0.20† -0.07 Depressed mood, % 12.9 -0.08* -0.02 Nutrition data Grains/day 3.4 2.1 0.11† 0.06 Fruit/day 1.6 1.1 0.10* 0.08 Vegetables/day 2.7 1.2 -0.00 0.22† Protein foods/ day 1.8 0.8 0.02 0.23† Other (fats/sweets)/day 1.9 1.8 -0.08 -0.07 Alcoholic drinks/day 0.4 0.7 -0.01 0.01 Total all foods serves/day‡ 12.6 4.0 0.04 0.22† BMI indicates body mass index; CES-D, Centre for Epidemiologic Studies Depression Scale; cfPWV, carotid-femoral pulse wave velocity; CVD, cardiovascular disease; DBP, diastolic

HYPERTENSION/2011/190017 R1
blood pressure; HDL, high-density lipoprotein; LDL, low-density lipoprotein; MAP, mean arterial pressure; PP, pulse pressure; SBP, systolic blood pressure; WC, waist circumference. * P<0.05. † P<0.01. ‡ includes dairy and alcohol.

HYPERTENSION/2011/190017 R1
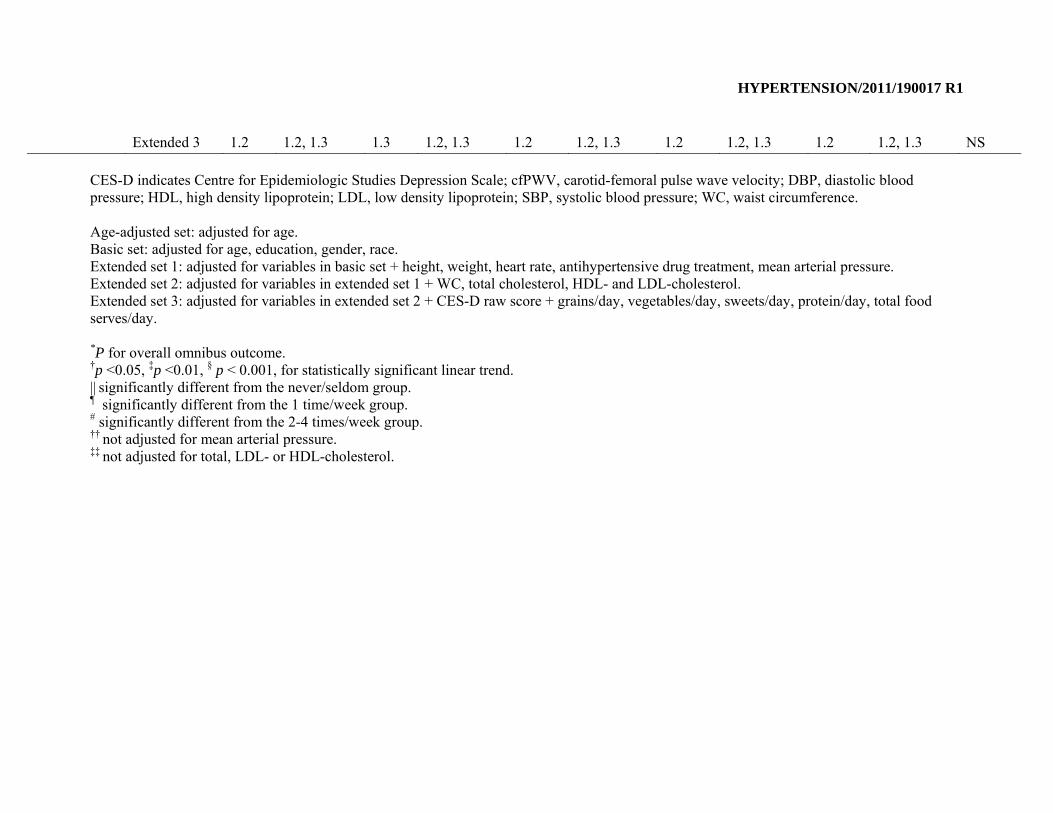
Table S2. Results of analysis of covariance, showing associations between cfPWV, BP, waist circumference, and blood lipids across increasing intakes of dairy food (N=587)
Outcome measure
Covariate set Dairy food intake P*
Never/ seldom n = 37
1 time/ week n = 40
2-4 times/ week n = 141
5-6 times/ week n = 153
≥1/day n = 216
Mean 95% CI Mean 95% CI Mean 95% CI Mean 95% CI Mean 95% CI cfPWV Age-adjusted 10.8 10.0, 11.5 11.1 10.4, 11.8 10.8 10.4, 11.2 9.9¶ # 9.6, 10.3 10.0# 9.7, 10.3 .000‡ Basic 10.6 9.8, 11.4 10.9 10.2, 11.6 10.7 10.3, 11.1 10.0 9.6,10.3 10.1 9.7, 10.4 .016† Extended 1 10.9 10.2,11.6 10.6 9.9, 11.3 10.6 10.3, 11.0 10.0 9.7,10.3 10.1 9.8, 10.4 .021‡ Extended 2 10.9 10.2,11.6 10.7 10.0, 11.4 10.6 10.3, 11.0 10.0 9.7,10.3 10.1 9.9, 10.4 .033† Extended 3 11.0 10.3, 11.7 10.8 10.1, 11.5 10.6 10.3, 11.0 10.0 9.6,10.3 10.1 9.8, 10.4 .018‡ PP Age-adjusted 56.3 51.9, 60.7 57.8 53.5, 62.1 53.2 50.9, 55.5 51.3 49.1, 53.4 50.2¶ 48.3, 52.0 .003‡ Basic 56.3 51.9, 60.6 56.6 52.3, 60.9 52.7|| 50.5, 55.0 51.4|| 49.2, 53.5 50.6|| 48.8, 52.4 .035‡ Extended 1 58.0 54.7, 61.3 54.1 50.9, 57.3 52.5|| 50.8, 54.2 50.6|| 49.0, 52.2 51.4|| 50.1, 50.8 .001§ Extended 2 58.2 54.8, 61.5 53.4 50.1, 56.7 52.5|| 50.8, 54.2 50.7|| 49.1, 52.3 51.5|| 50.2, 52.9 .003§ Extended 3 57.6 54.1, 61.0 53.1 49.8, 56.5 52.4 50.6, 54.1 50.8|| 49.2, 52.4 51.6|| 50.2, 53.0 .013‡ SBP Age-adjusted 131.8 125.6, 137.9 138.7 132.7, 144.6 131.7 128.5, 134.8 128.8¶ 125.8, 131.9 126.1¶ 123.6, 128.7 .001‡ Basic 130.1 124.1, 136.2 135.9 130.1, 141.8 130.4 127.3, 133.4 129.5 126.5, 132.4 127.4 124.8, 129.9 NS Extended 1 133.3 131.2, 135.5 130.7 128.6, 132.8 129.7|| 128.5, 130.8 128.4|| 127.3, 129.5 128.9|| 128.0, 129.8 .001§ Extended 2 133.4 131.2, 135.7 130.3 128.1, 132.5 129.7|| 128.5, 130.8 128.5|| 127.4, 129.6 129.0|| 128.1, 129.9 .003§ Extended 3 133.0 130.7, 135.3 130.1 127.8, 132.3 129.6 128.4, 130.7 128.5|| 127.4, 129.6 129.1|| 128.1, 130.0 .013‡ DBP†† Age-adjusted 75.5 72.3, 78.6 80.9 77.8, 83.9 78.5 76.8, 80.1 77.6 76.0, 79.1 76.0¶ 74.7, 77.3 .015 Basic 73.9 70.9, 76.9 79.3 76.4, 82.2 77.6 76.1, 79.1 78.1 76.6, 79.5 76.7 75.5, 78.0 NS Extended 1 74.1 71.2, 77.1 78.8 75.9, 81.6 77.5 76.0, 79.0 78.2 76.8, 79.7 76.8 75.5, 78.0 NS Extended 2 74.3 71.4, 77.2 78.4 75.5, 81.3 77.5 76.0, 79.0 78.2 76.8, 79.6 76.8 75.6, 78.0 NS Extended 3 74.9 71.9, 77.9 78.3 75.3, 81.2 77.4 75.9, 78.9 78.2 76.8, 79.6 76.8 75.6, 78.1 NS

HYPERTENSION/2011/190017 R1
WC Age-adjusted 94.7 89.6, 99.7 97.3 92.3, 102.2 96.7 94.1, 99.3 93.0 90.5, 95.5 91.9# 89.8, 94.0 .034 Basic 91.8 87.1, 96.5 94.5 89.9, 99.1 95.2 92.8, 97.6 93.9 91.6, 96.2 93.2 91.3, 95.2 NS Extended 1 95.4 93.2, 97.6 95.0 92.9, 97.2 94.2 93.1, 95.4 93.8 92.7, 94.9 93.8 92.3, 94.1 NS Extended 2 95.6 93.4, 97.7 95.4 93.3, 97.6 94.1 93.0, 95.2 93.9 92.9, 94.9 93.3 92.5, 94.2 NS Extended 3 96.0 93.8, 98.3 95.1 92.9, 97.3 93.8 92.7, 94.9 93.9 92.8, 94.9 93.3 92.4, 94.3 NS Total Age-adjusted 4.5 4.2, 4.9 4.5 4.1, 4.8 4.8 4.6, 5.0 4.9 4.8, 5.1 4.9 4.8, 5.1 .017‡ cholesterol‡‡ Basic 4.7 4.4, 5.0 4.6 4.3, 4.9 4.9 4.7, 5.0 4.9 4.7, 5.0 4.9 4.7, 5.0 NS Extended 1 4.7 4.4, 5.0 4.7 4.4, 4.9 4.8 4.7, 5.0 4.9 4.7, 5.0 4.9 4.7, 5.0 NS Extended 2 4.7 4.4, 5.0 4.7 4.4, 5.0 4.9 4.7, 5.0 4.9 4.7, 5.0 4.9 4.7, 5.0 NS Extended 3 4.7 4.4, 5.0 4.7 4.4, 5.0 4.9 4.7, 5.0 4.9 4.7, 5.0 4.8 4.7, 5.0 NS HDL- Age-adjusted 1.3 1.2, 1.4 1.4 1.3, 1.5 1.3 1.3, 1.4 1.4 1.3, 1.5 1.4 1.4, 1.5 NS cholesterol‡‡ Basic 1.4 1.3, 1.5 1.4 1.3, 1.6 1.4 1.3, 1.4 1.4 1.3, 1.4 1.4 1.3, 14 NS Extended 1 1.4 1.2, 1.5 1.5 1.3, 1.6 1.4 1.3, 1.4 1.4 1.3, 1.4 1.4 1.3, 1.4 NS Extended 2 1.4 1.3, 1.5 1.5 1.4, 1.6 1.4 1.3, 1.4 1.4 1.3, 1.4 1.4 1.3, 1.4 NS Extended 3 1.4 1.3, 1.5 1.5 1.4, 1.6 1.4 1.3, 1.4 1.4 1.3, 1.4 1.4 1.3, 1.4 NS LDL- Age-adjusted 2.7 2.4, 3.0 2.5 2.3, 2.8 2.9 2.7, 3.0 3.0¶ 2.8, 3.1 2.9¶ 2.8, 3.1 .013‡ cholesterol‡‡ Basic 2.8 2.5, 3.1 2.6 2.4, 2.9 2.9 2.8, 3.0 2.9 2.8, 3.1 2.9 2.8, 3.0 NS Extended 1 2.8 2.5, 3.1 2.7 2.4, 2.9 2.9 2.7, 3.0 3.0 2.8, 3.1 2.9 2.8, 3.0 NS Extended 2 2.8 2.5, 3.1 2.7 2.4, 2.9 2.9 2.7, 3.0 3.0 2.8, 3.1 2.9 2.8, 3.0 NS Extended 3 2.8 2.5, 3.1 2.7 2.4, 3.0 2.9 2.8, 3.0 3.0 2.8, 3.1 2.9 2.8, 3.0 NS Triglycerides Age-adjusted 1.2 0.9, 1.5 1.2 0.9, 1.5 1.3 1.2, 1.5 1.3 1.1, 1.4 1.3 1.2, 1.4 NS Basic 1.2 0.9, 1.5 1.2 1.0, 1.5 1.3 1.2, 1.5 1.3 1.1, 1.4 1.3 1.2, 1.4 NS Extended 1 1.3 1.0, 1.5 1.2 0.9, 1.5 1.3 1.2, 1.4 1.3 1.1, 1.4 1.3 1.2, 1.4 NS Extended 2 1.2 1.2, 1.3 1.3 1.2, 1.3 1.2 1.2, 1.3 1.2 1.2, 1.3 1.2 1.2, 1.3 NS
HYPERTENSION/2011/190017 R1
Extended 3 1.2 1.2, 1.3 1.3 1.2, 1.3 1.2 1.2, 1.3 1.2 1.2, 1.3 1.2 1.2, 1.3 NS
CES-D indicates Centre for Epidemiologic Studies Depression Scale; cfPWV, carotid-femoral pulse wave velocity; DBP, diastolic blood pressure; HDL, high density lipoprotein; LDL, low density lipoprotein; SBP, systolic blood pressure; WC, waist circumference. Age-adjusted set: adjusted for age. Basic set: adjusted for age, education, gender, race. Extended set 1: adjusted for variables in basic set + height, weight, heart rate, antihypertensive drug treatment, mean arterial pressure. Extended set 2: adjusted for variables in extended set 1 + WC, total cholesterol, HDL- and LDL-cholesterol. Extended set 3: adjusted for variables in extended set 2 + CES-D raw score + grains/day, vegetables/day, sweets/day, protein/day, total food serves/day. *P for overall omnibus outcome. †p <0.05, ‡p <0.01, § p < 0.001, for statistically significant linear trend. || significantly different from the never/seldom group. ¶ significantly different from the 1 time/week group. # significantly different from the 2-4 times/week group. †† not adjusted for mean arterial pressure. ‡‡ not adjusted for total, LDL- or HDL-cholesterol.

HYPERTENSION/2011/190017 R1
9
9.5
10
10.5
11
11.5
Never/ seldom 1 time/ week 2-4 times/ week 5-6 times/ week ≥1/day
Dairy Intake
Puls
e W
ave
Velo
city
(m/s
)
A
HYPERTENSION/2011/190017 R1
44
46
48
50
52
54
56
58
60
62
Never/ seldom 1 time/ week 2-4 times/ week 5-6 times/ week ≥1/day
Dairy Intake
Puls
e Pr
essu
re (m
mH
g)
B

HYPERTENSION/2011/190017 R1
124
125
126
127
128
129
130
131
132
133
134
135
Never/ seldom 1 time/ week 2-4 times/ week 5-6 times/ week ≥1/day
Dairy Intake
Syst
olic
Blo
od P
ress
ure
(mm
Hg)
C

HYPERTENSION/2011/190017 R1
Figure Legends
Figure S1. Relationship between dairy intake and pulse wave velocity (A), pulse pressure
(B), and systolic blood pressure (C) for the extended model