regions 1q17 investor deck - handouts correctedfiles.shareholder.com/downloads/amda-j4ztd/... ·...
TRANSCRIPT

Investor Meetings
February 2017

2
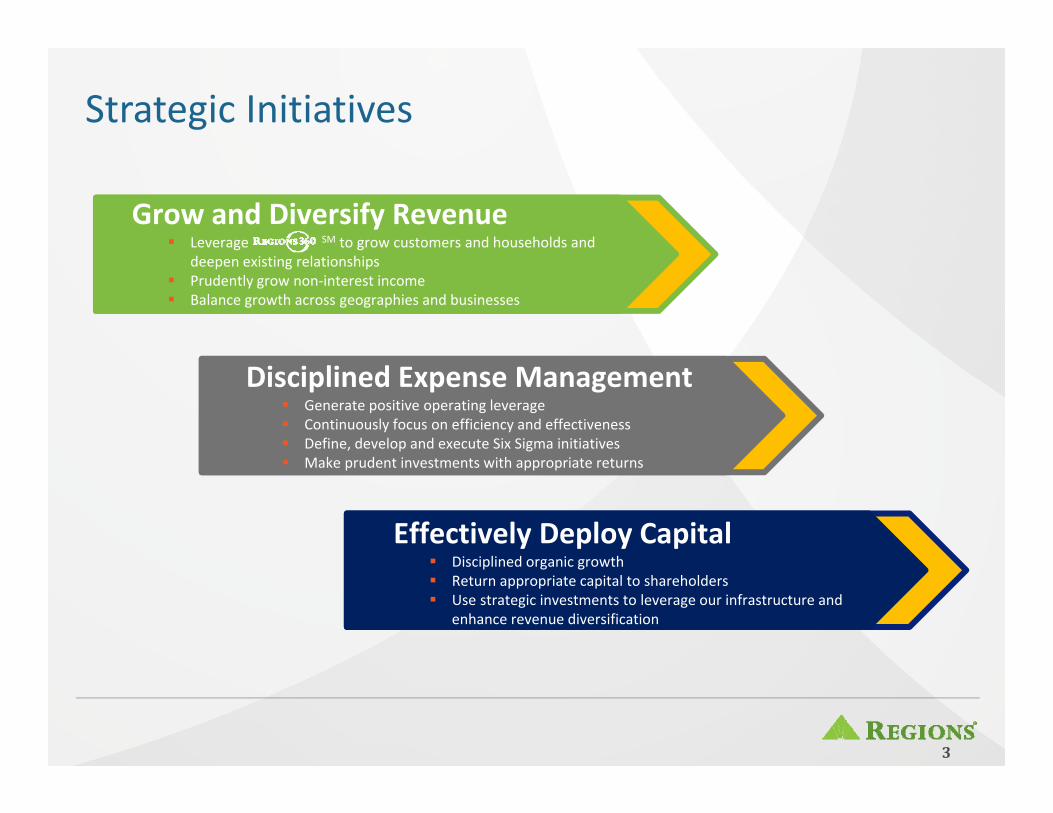
Strategic Initiatives
Effectively Deploy Capital Disciplined organic growth Return appropriate capital to shareholders Use strategic investments to leverage our infrastructure and
enhance revenue diversification
Disciplined Expense Management Generate positive operating leverage Continuously focus on efficiency and effectiveness Define, develop and execute Six Sigma initiatives Make prudent investments with appropriate returns
Grow and Diversify Revenue Leverage SM to grow customers and households and
deepen existing relationships Prudently grow non‐interest income Balance growth across geographies and businesses
3
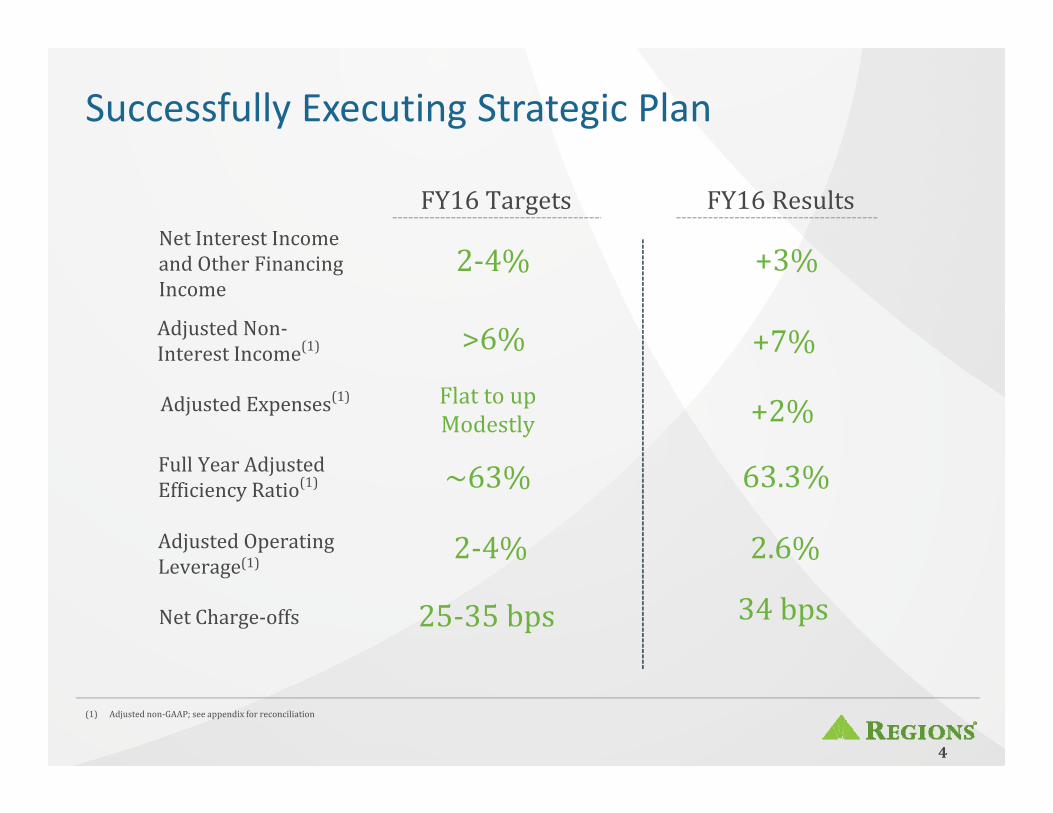
Successfully Executing Strategic Plan
(1) Adjustednon‐GAAP;seeappendixforreconciliation
FY16ResultsFY16TargetsNetInterestIncomeandOtherFinancingIncome
AdjustedNon‐InterestIncome(1)
AdjustedExpenses(1)
FullYearAdjustedEfficiencyRatio(1)
AdjustedOperatingLeverage(1)
NetCharge‐offs
+3%
+7%
+2%
63.3%
34bps
2.6%
2‐4%
>6%
FlattoupModestly
~63%
25‐35bps
2‐4%
4
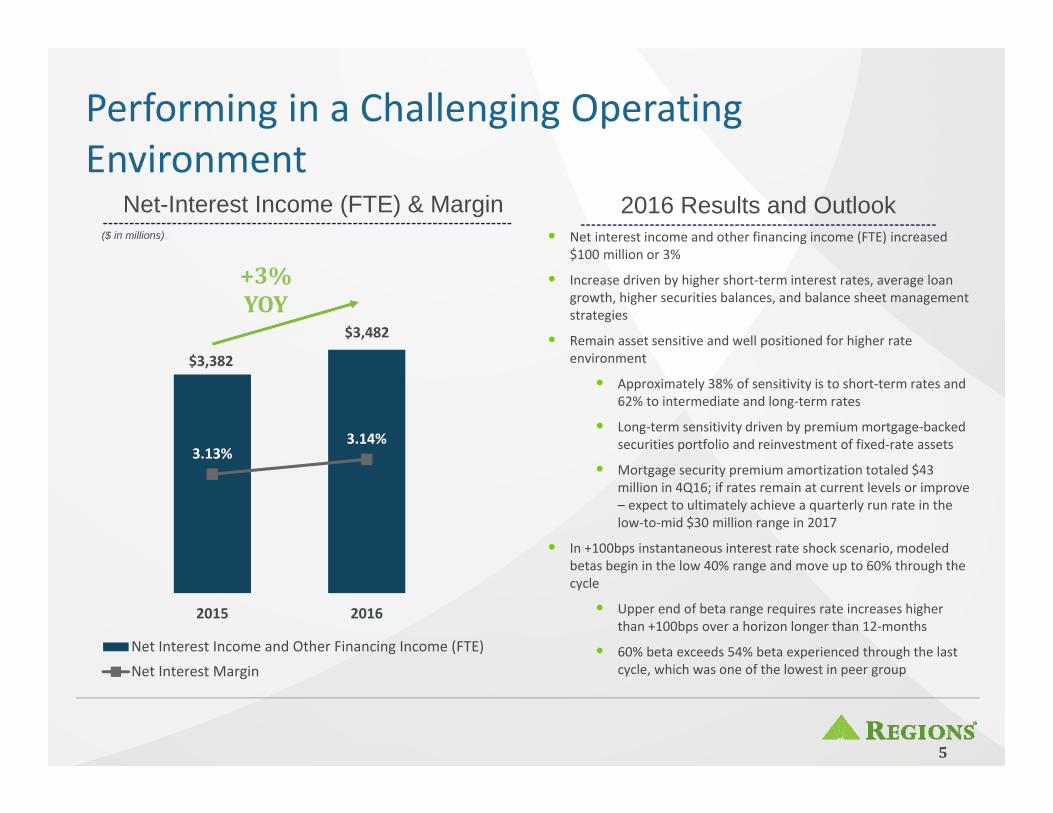
Performing in a Challenging Operating Environment
$3,382
$3,482
3.13%3.14%
2015 2016
Net Interest Income and Other Financing Income (FTE)Net Interest Margin
Net-Interest Income (FTE) & Margin($ in millions)
+3%YOY
• Net interest income and other financing income (FTE) increased $100 million or 3%
• Increase driven by higher short‐term interest rates, average loan growth, higher securities balances, and balance sheet management strategies
• Remain asset sensitive and well positioned for higher rate environment
• Approximately 38% of sensitivity is to short‐term rates and 62% to intermediate and long‐term rates
• Long‐term sensitivity driven by premium mortgage‐backed securities portfolio and reinvestment of fixed‐rate assets
• Mortgage security premium amortization totaled $43 million in 4Q16; if rates remain at current levels or improve – expect to ultimately achieve a quarterly run rate in the low‐to‐mid $30 million range in 2017
• In +100bps instantaneous interest rate shock scenario, modeled betas begin in the low 40% range and move up to 60% through the cycle
• Upper end of beta range requires rate increases higher than +100bps over a horizon longer than 12‐months
• 60% beta exceeds 54% beta experienced through the last cycle, which was one of the lowest in peer group
5
2016 Results and Outlook
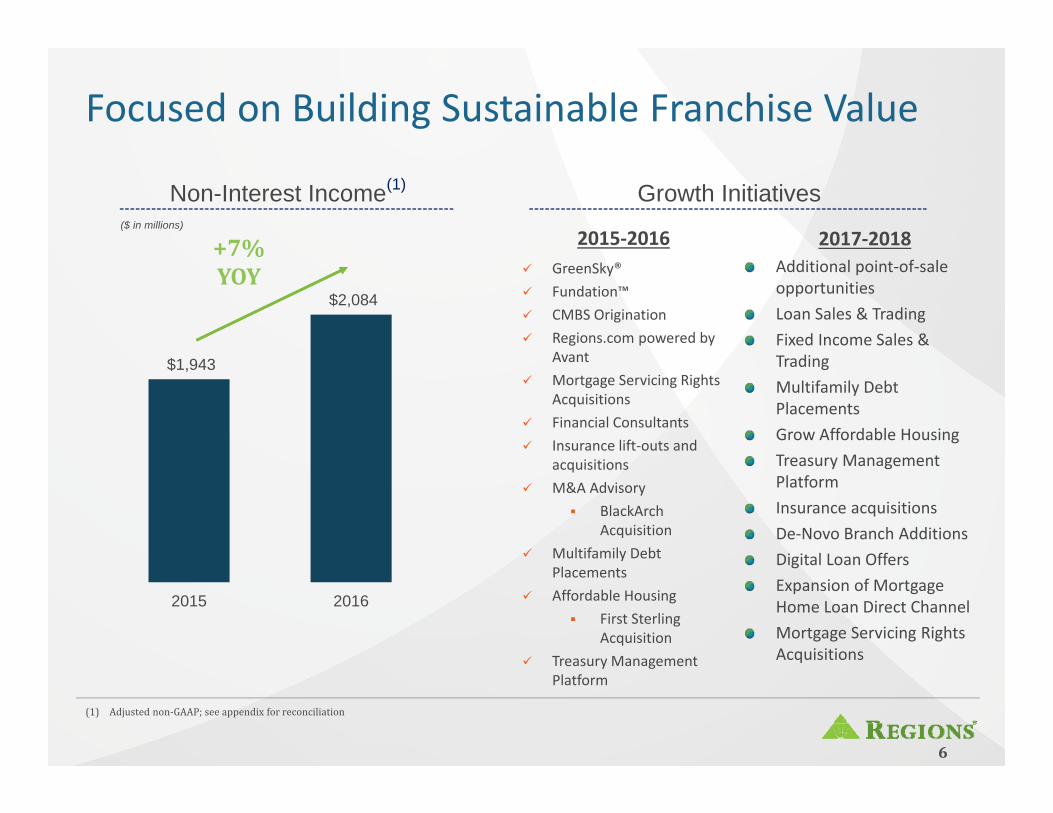
Focused on Building Sustainable Franchise Value
(1) Adjustednon‐GAAP;seeappendixforreconciliation
2015‐2016 GreenSky® Fundation™ CMBS Origination Regions.com powered by
Avant Mortgage Servicing Rights
Acquisitions Financial Consultants Insurance lift‐outs and
acquisitions M&A Advisory
BlackArch Acquisition
Multifamily Debt Placements
Affordable Housing First Sterling
Acquisition Treasury Management
Platform
2017‐2018Additional point‐of‐sale opportunitiesLoan Sales & TradingFixed Income Sales & TradingMultifamily Debt PlacementsGrow Affordable HousingTreasury Management PlatformInsurance acquisitionsDe‐Novo Branch AdditionsDigital Loan OffersExpansion of Mortgage Home Loan Direct ChannelMortgage Servicing Rights Acquisitions
Growth Initiatives
$1,943
$2,084
2015 2016
Non-Interest Income(1)
($ in millions)
+7%YOY
6
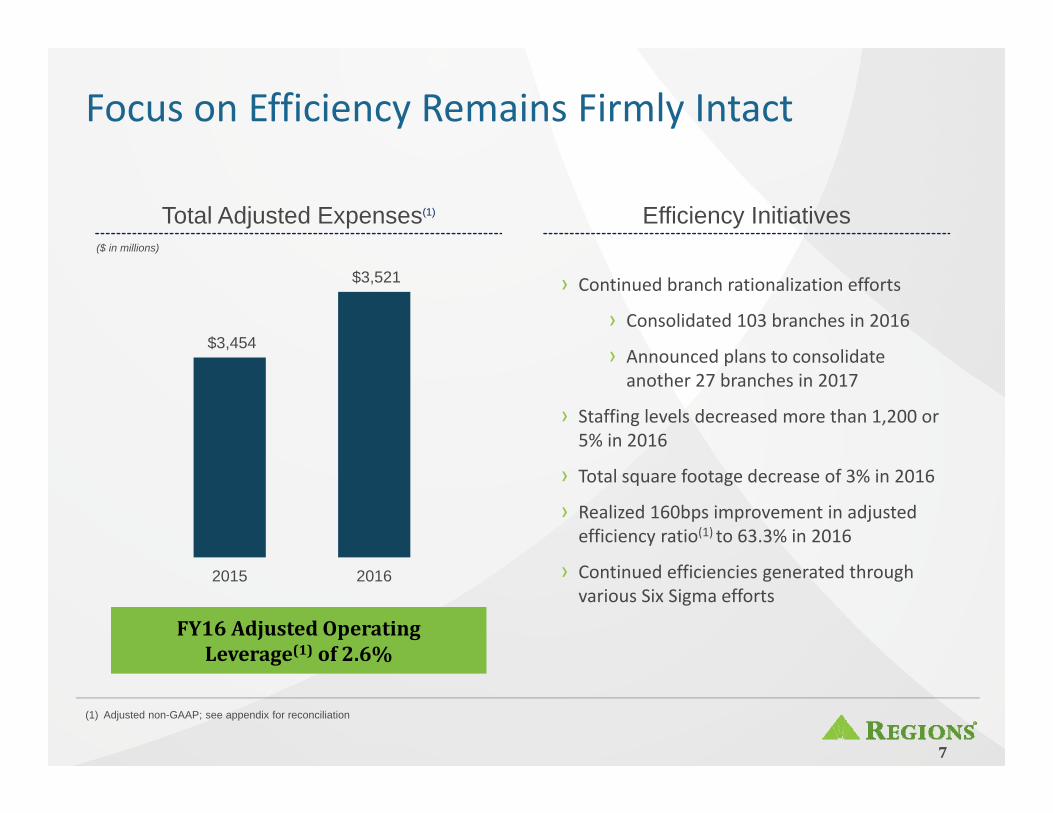
Focus on Efficiency Remains Firmly Intact
(1) Adjusted non-GAAP; see appendix for reconciliation
FY16AdjustedOperatingLeverage(1) of2.6%
$3,454
$3,521
2015 2016
Total Adjusted Expenses(1)
($ in millions)
Efficiency Initiatives
› Continued branch rationalization efforts
› Consolidated 103 branches in 2016
› Announced plans to consolidate another 27 branches in 2017
› Staffing levels decreased more than 1,200 or 5% in 2016
› Total square footage decrease of 3% in 2016
› Realized 160bps improvement in adjusted efficiency ratio(1) to 63.3% in 2016
› Continued efficiencies generated through various Six Sigma efforts
7
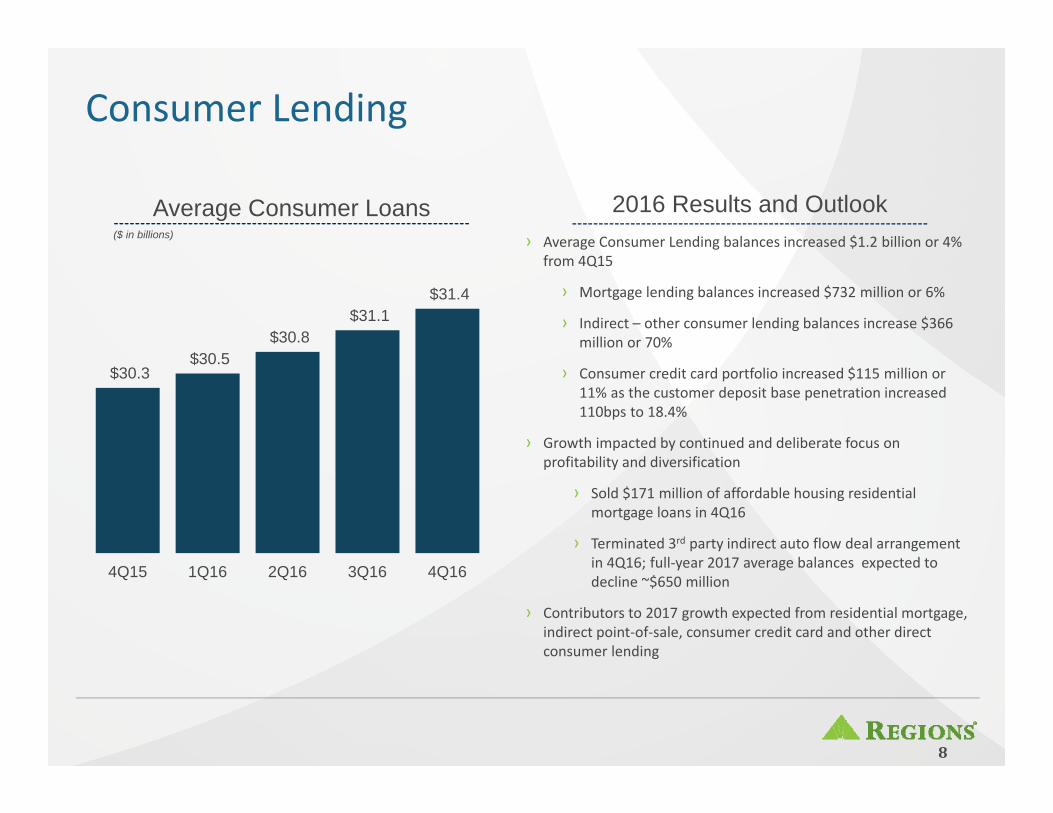
Consumer Lending
8
$30.3 $30.5
$30.8 $31.1
$31.4
4Q15 1Q16 2Q16 3Q16 4Q16
Average Consumer Loans($ in billions)
2016 Results and Outlook› Average Consumer Lending balances increased $1.2 billion or 4%
from 4Q15
› Mortgage lending balances increased $732 million or 6%
› Indirect – other consumer lending balances increase $366 million or 70%
› Consumer credit card portfolio increased $115 million or 11% as the customer deposit base penetration increased 110bps to 18.4%
› Growth impacted by continued and deliberate focus on profitability and diversification
› Sold $171 million of affordable housing residential mortgage loans in 4Q16
› Terminated 3rd party indirect auto flow deal arrangement in 4Q16; full‐year 2017 average balances expected to decline ~$650 million
› Contributors to 2017 growth expected from residential mortgage, indirect point‐of‐sale, consumer credit card and other direct consumer lending

Business Lending
9
$50.5 $51.0 $51.1 $50.2
$49.1
4Q15 1Q16 2Q16 3Q16 4Q16
Average Business Loans($ in billions)
2016 Results and Outlook
› Average Business Lending balances decreased $1.4 billion or 3% from 4Q15
› Growth impacted by continued and deliberate focus on profitability and diversification
› Improving risk‐adjusted returns
› De‐risking of certain portfolios – average direct energy and multi‐family loans decreased $491 million and $239 million, respectively
› Ongoing softness in demand for middle market commercial and small business loans
› Expect low single digit growth in average business lending; contributors to growth include technology & defense, healthcare, power & utilities, and asset‐based lending
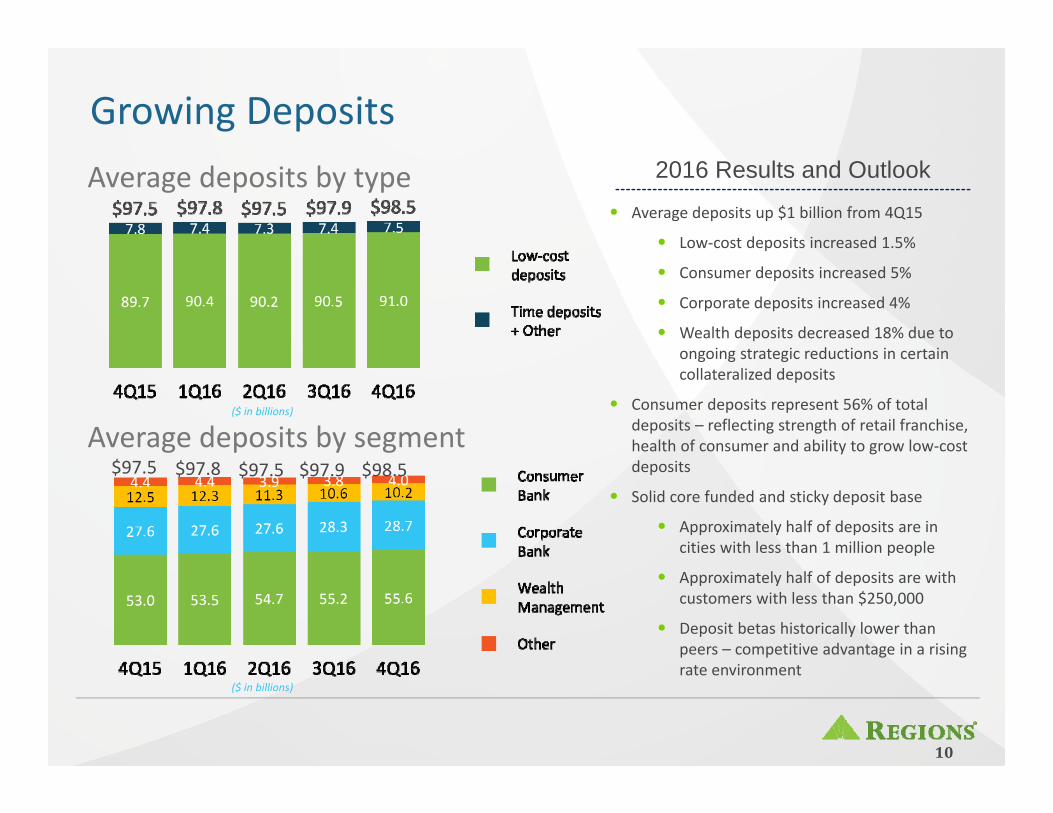
• Average deposits up $1 billion from 4Q15
• Low‐cost deposits increased 1.5%
• Consumer deposits increased 5%
• Corporate deposits increased 4%
• Wealth deposits decreased 18% due to ongoing strategic reductions in certain collateralized deposits
• Consumer deposits represent 56% of total deposits – reflecting strength of retail franchise, health of consumer and ability to grow low‐cost deposits
• Solid core funded and sticky deposit base
• Approximately half of deposits are in cities with less than 1 million people
• Approximately half of deposits are with customers with less than $250,000
• Deposit betas historically lower than peers – competitive advantage in a rising rate environment
Growing Deposits
($ in billions)
($ in billions)
Average deposits by type
$97.5 $97.8 $97.5 $97.9Average deposits by segment
$98.5
10
2016 Results and Outlook
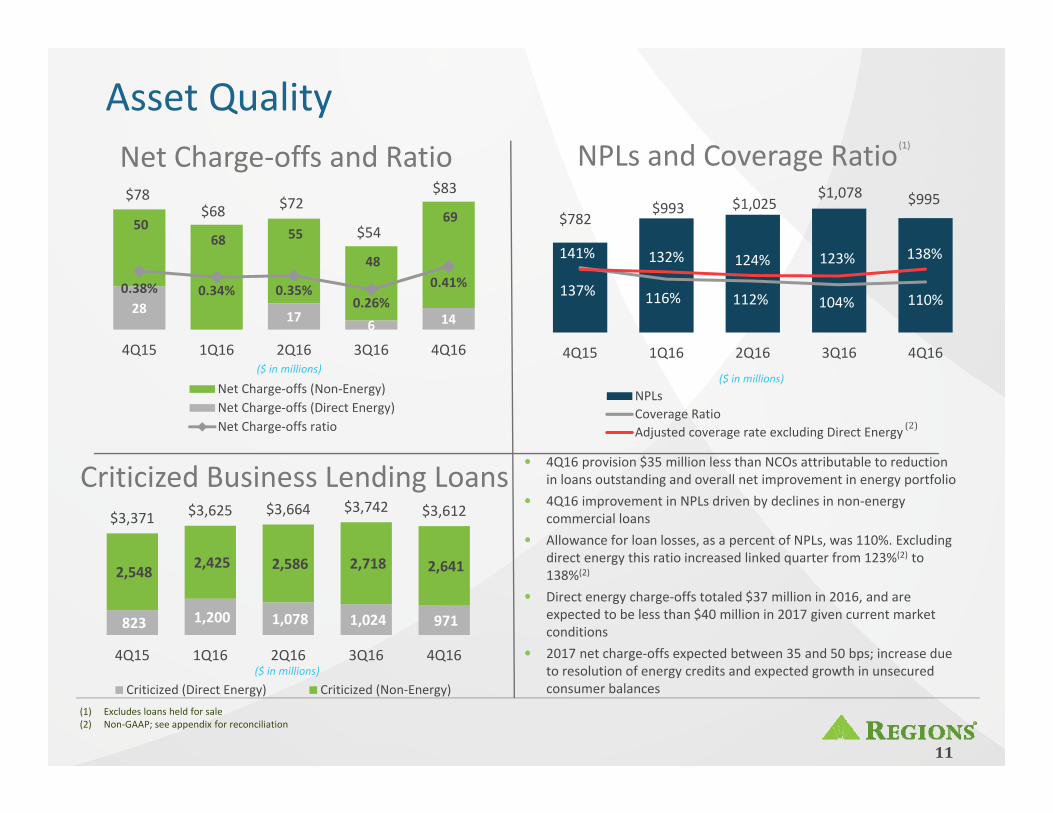
Asset Quality
• 4Q16 provision $35 million less than NCOs attributable to reduction in loans outstanding and overall net improvement in energy portfolio
• 4Q16 improvement in NPLs driven by declines in non‐energy commercial loans
• Allowance for loan losses, as a percent of NPLs, was 110%. Excluding direct energy this ratio increased linked quarter from 123%(2) to 138%(2)
• Direct energy charge‐offs totaled $37 million in 2016, and are expected to be less than $40 million in 2017 given current market conditions
• 2017 net charge‐offs expected between 35 and 50 bps; increase due to resolution of energy credits and expected growth in unsecured consumer balances
Criticized Business Lending Loans
(1) Excludes loans held for sale(2) Non‐GAAP; see appendix for reconciliation
Net Charge‐offs and Ratio
11
28 17 6 14
50 68 55
48
69
0.38% 0.34% 0.35%0.26%
0.41%
4Q15 1Q16 2Q16 3Q16 4Q16
Net Charge‐offs (Non‐Energy)Net Charge‐offs (Direct Energy)Net Charge‐offs ratio
$78$68 $72
$83
$54
($ in millions)
823 1,200 1,078 1,024 971
2,548 2,425 2,586 2,718 2,641
$3,371 $3,625 $3,664 $3,742 $3,612
4Q15 1Q16 2Q16 3Q16 4Q16
Criticized (Direct Energy) Criticized (Non‐Energy)($ in millions)
($ in millions)
$782 $993 $1,025
$1,078 $995
141%
116% 112% 104% 110%137%
132% 124% 123% 138%
4Q15 1Q16 2Q16 3Q16 4Q16
NPLsCoverage RatioAdjusted coverage rate excluding Direct Energy (2)
NPLs and Coverage Ratio(1)
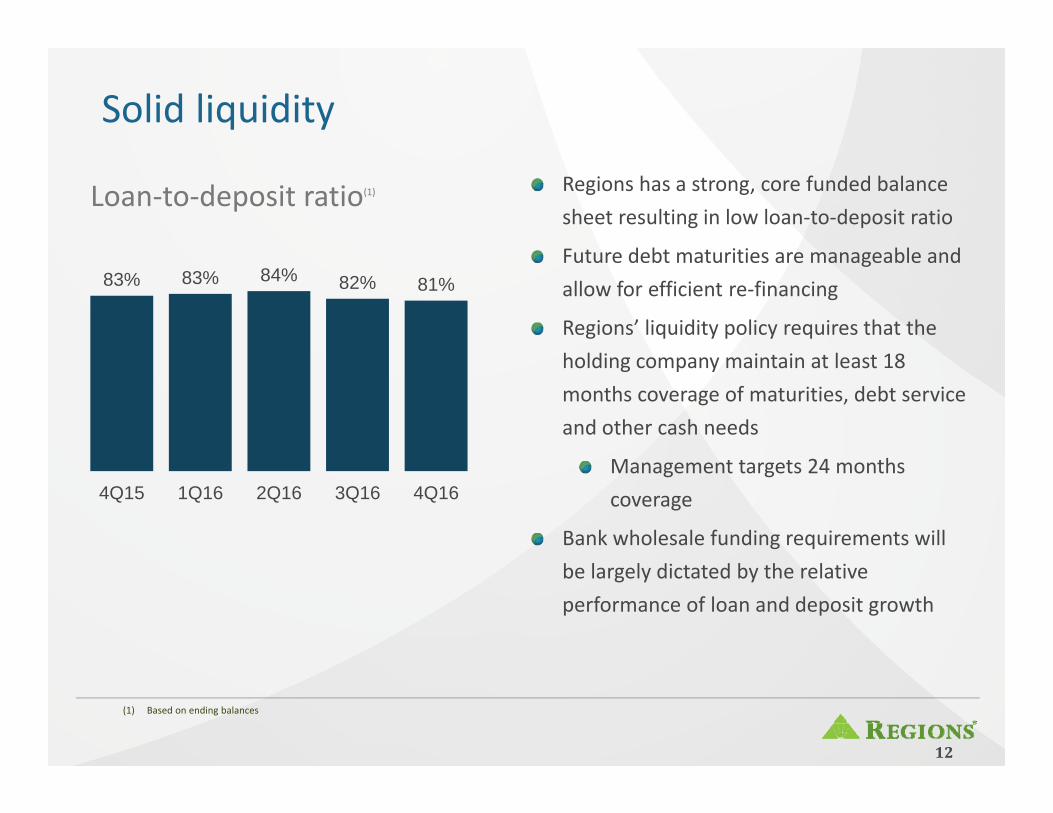
83% 83% 84% 82% 81%
4Q15 1Q16 2Q16 3Q16 4Q16
Solid liquidity
Loan‐to‐deposit ratio(1)
(1) Based on ending balances
Regions has a strong, core funded balance sheet resulting in low loan‐to‐deposit ratio
Future debt maturities are manageable and allow for efficient re‐financing
Regions’ liquidity policy requires that the holding company maintain at least 18 months coverage of maturities, debt service and other cash needs
Management targets 24 months coverage
Bank wholesale funding requirements will be largely dictated by the relative performance of loan and deposit growth
12

9.4%
9.5%
9.6%
9.6%
9.9%
10.0%
10.2%
10.4%
10.6%
11.0%
11.1%
11.2%
11.3%
12.1%
Peer #13
Peer #12
Peer #11
Peer #10
Peer #9
Peer #8
Peer #7
Peer #6
Peer #5
Peer #4
Peer #3
Peer #2
Peer #1
BaselIIICommonEquityTier1Ratio
Industry leading capital
Note: Regions’ CET1 ratio is estimated at 12/31/16. Peer financial data as of 12/31/16. Peers include BBT, CMA, FHN, FITB, HBAN, HBHC, KEY, MTB, PNC, SNV, STI, USB and ZION.
Source: SNL Financial. (1) Includes fees associated with open market share repurchases. 13
304 318
623839
$927
$1,157
2015 2016
Dividends Share Repurchases(1)
TotalCapitalreturnedtoshareholdersof105%in
2016
CapitalReturnedtoShareholders
Organic Growth
Strategic Investments
Share repurchases
Dividends
CapitalPriorities

Solid total shareholder returns
14
23%
23%
26%
29%
29%
31%
32%
38%
40%
42%
53%
59%
66%
77%
Peer #13
Peer #12
Peer #11
Peer #10
Peer #9
Peer #8
Peer #7
Peer #6
Peer #5
Peer #4
Peer #3
Peer #2
Peer #1
29%
36%
37%
39%
44%
45%
47%
47%
51%
55%
59%
62%
70%
81%
Peer #13
Peer #12
Peer #11
Peer #10
Peer #9
Peer #8
Peer #7
Peer #6
Peer #5
Peer #4
Peer #3
Peer #2
Peer #1
3 Year 5 Year
Source: BloombergNote: Total shareholder return data as of 12/31/2016Peers include BBT, CMA, FITB, HBAN, HBHC, KEY, MTB, PNC, SNV, STI, USB, FHN and ZION
58%
114%
116%
129%
133%
141%
164%
169%
171%
172%
189%
237%
263%
348%
Peer #13
Peer #12
Peer #11
Peer #10
Peer #9
Peer #8
Peer #7
Peer #6
Peer #5
Peer #4
Peer #3
Peer #2
Peer #1
1 Year
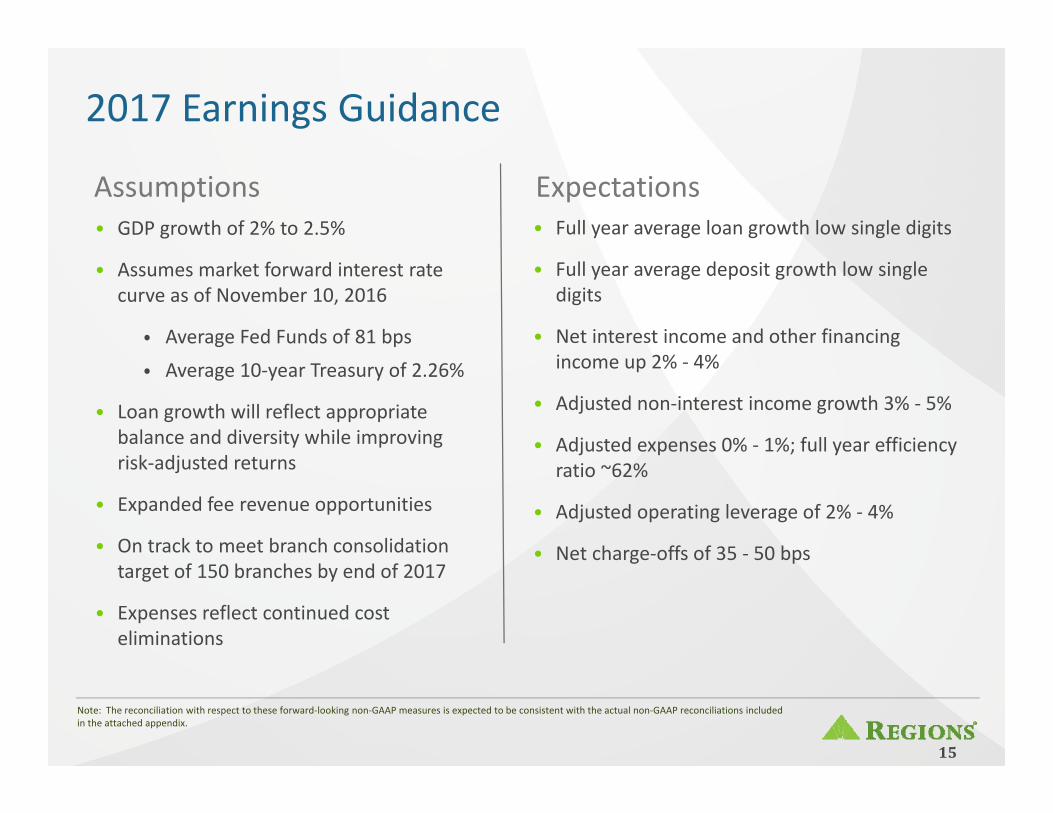
2017 Earnings Guidance
15
Assumptions Expectations• GDP growth of 2% to 2.5%
• Assumes market forward interest rate curve as of November 10, 2016
⦁ Average Fed Funds of 81 bps
⦁ Average 10‐year Treasury of 2.26%
• Loan growth will reflect appropriate balance and diversity while improving risk‐adjusted returns
• Expanded fee revenue opportunities
• On track to meet branch consolidation target of 150 branches by end of 2017
• Expenses reflect continued cost eliminations
• Full year average loan growth low single digits
• Full year average deposit growth low single digits
• Net interest income and other financing income up 2% ‐ 4%
• Adjusted non‐interest income growth 3% ‐ 5%
• Adjusted expenses 0% ‐ 1%; full year efficiency ratio ~62%
• Adjusted operating leverage of 2% ‐ 4%
• Net charge‐offs of 35 ‐ 50 bps
Note: The reconciliation with respect to these forward‐looking non‐GAAP measures is expected to be consistent with the actual non‐GAAP reconciliations included in the attached appendix.
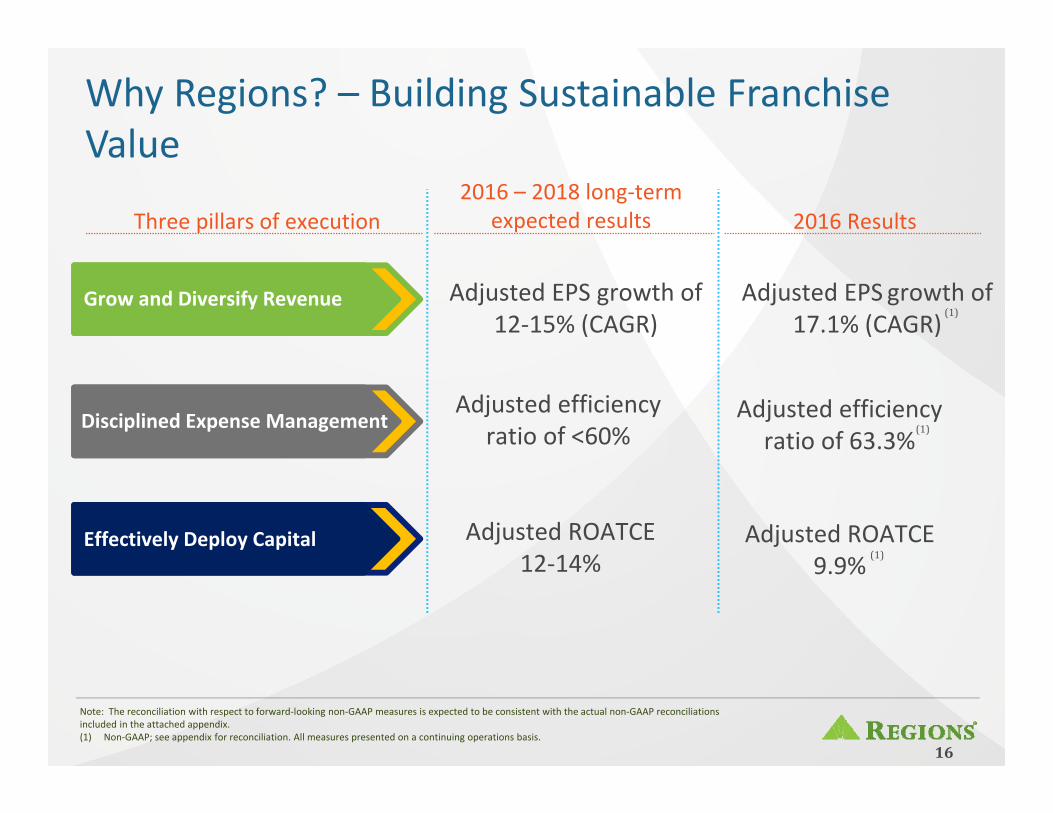
Why Regions? – Building Sustainable Franchise Value
Effectively Deploy Capital
Grow and Diversify Revenue
Disciplined Expense Management
Adjusted EPS growth of 12‐15% (CAGR)
Adjusted efficiency ratio of <60%
Adjusted ROATCE 12‐14%
Three pillars of execution2016 – 2018 long‐term
expected results 2016 Results
16
Adjusted EPS growth of 17.1% (CAGR)
Adjusted ROATCE9.9%
Adjusted efficiency ratio of 63.3%
Note: The reconciliation with respect to forward‐looking non‐GAAP measures is expected to be consistent with the actual non‐GAAP reconciliations included in the attached appendix.(1) Non‐GAAP; see appendix for reconciliation. All measures presented on a continuing operations basis.
(1)
(1)
(1)

Appendix
17
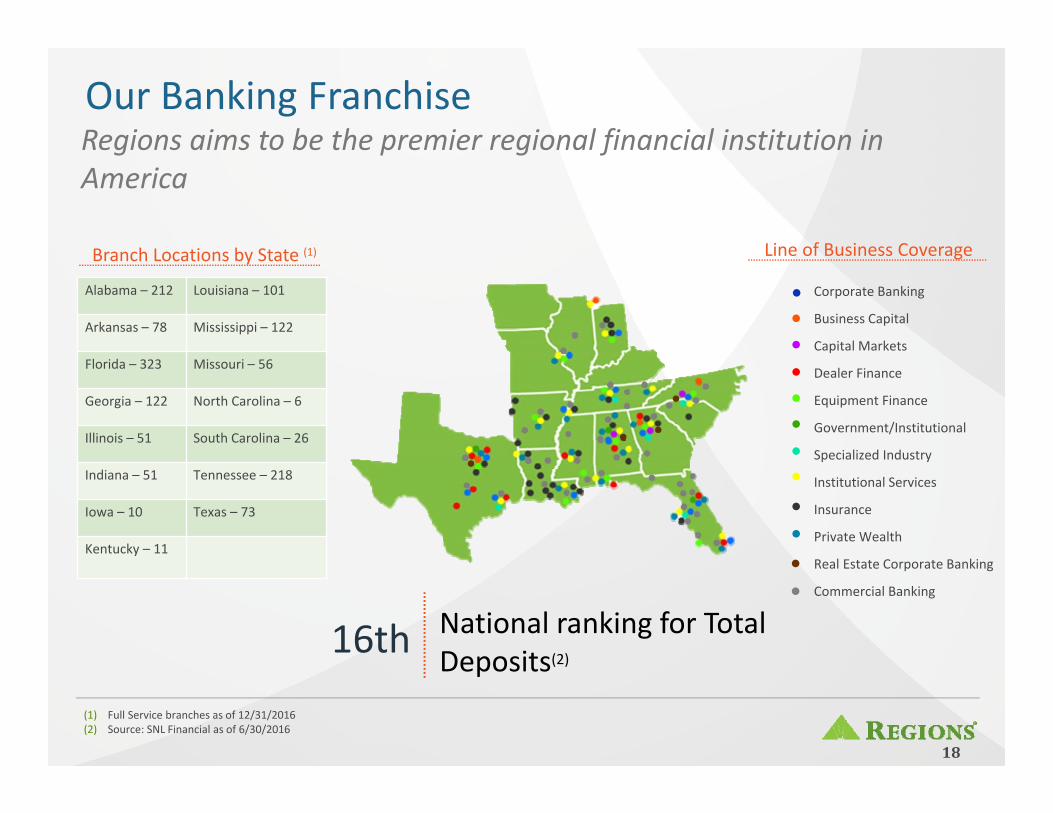
Our Banking FranchiseRegions aims to be the premier regional financial institution in America
Alabama – 212 Louisiana – 101
Arkansas – 78 Mississippi – 122
Florida – 323 Missouri – 56
Georgia – 122 North Carolina – 6
Illinois – 51 South Carolina – 26
Indiana – 51 Tennessee – 218
Iowa – 10 Texas – 73
Kentucky – 11
Branch Locations by State (1)
(1) Full Service branches as of 12/31/2016(2) Source: SNL Financial as of 6/30/2016
National ranking for Total Deposits(2)16th
18
Corporate Banking
Business Capital
Capital Markets
Dealer Finance
Equipment Finance
Government/Institutional
Specialized Industry
Institutional Services
Insurance
Private Wealth
Real Estate Corporate Banking
Commercial Banking
•••••••
•
••
Line of Business Coverage
••
63%20%
17%
Loans Securities Other
91%
7%2%
Deposits Borrowing Other
45%55%
Floating Fixed
56%36%
7%
53%47%
Floating FixedIBChecking,MoneyMarket,&SavingsNon‐InterestBearingCheckingTime
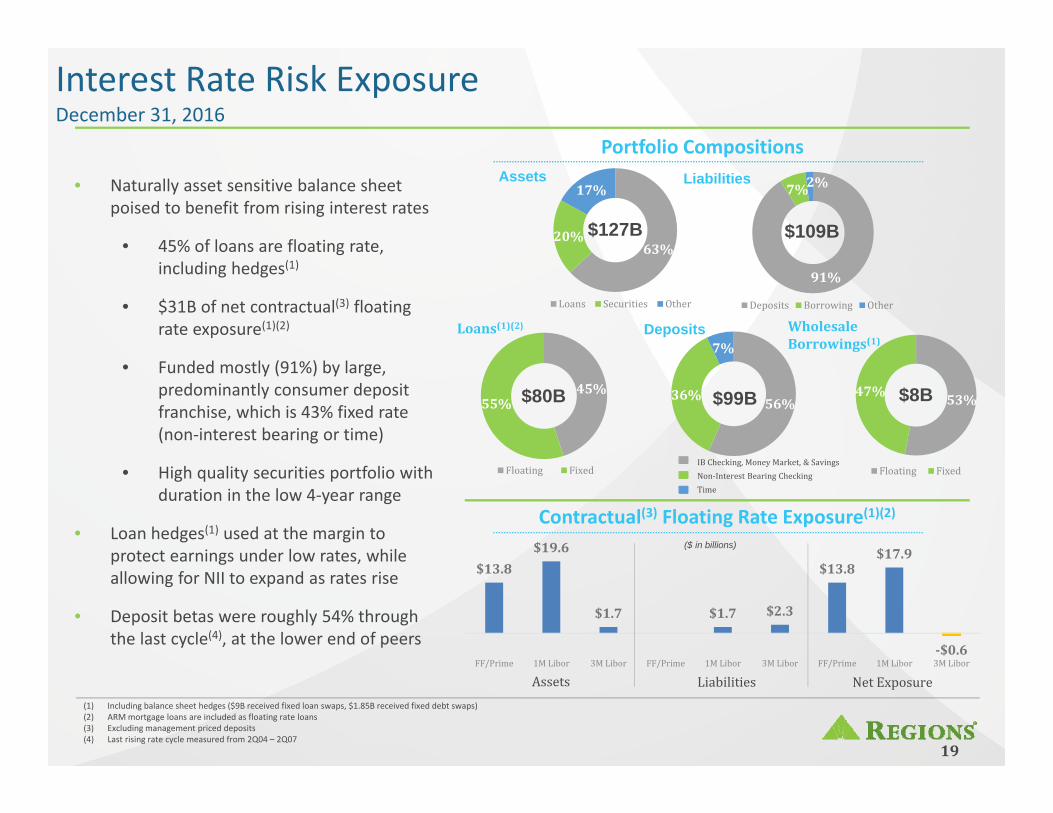
Interest Rate Risk ExposureDecember 31, 2016
Portfolio CompositionsAssets Liabilities
Loans(1)(2) WholesaleBorrowings(1)
$127B $109B
$80B $99B $8B
Deposits
(1) Including balance sheet hedges ($9B received fixed loan swaps, $1.85B received fixed debt swaps)(2) ARM mortgage loans are included as floating rate loans(3) Excluding management priced deposits(4) Last rising rate cycle measured from 2Q04 – 2Q07
• Naturally asset sensitive balance sheet poised to benefit from rising interest rates
• 45% of loans are floating rate, including hedges(1)
• $31B of net contractual(3) floating rate exposure(1)(2)
• Funded mostly (91%) by large, predominantly consumer deposit franchise, which is 43% fixed rate (non‐interest bearing or time)
• High quality securities portfolio with duration in the low 4‐year range
• Loan hedges(1) used at the margin to protect earnings under low rates, while allowing for NII to expand as rates rise
• Deposit betas were roughly 54% through the last cycle(4), at the lower end of peers
$13.8$19.6
$1.7 $1.7 $2.3
$13.8$17.9
‐$0.6FF/Prime 1MLibor 3MLibor FF/Prime 1MLibor 3MLibor FF/Prime 1MLibor 3MLibor
Contractual(3) Floating Rate Exposure(1)(2)
Assets Liabilities NetExposure
($ in billions)
19
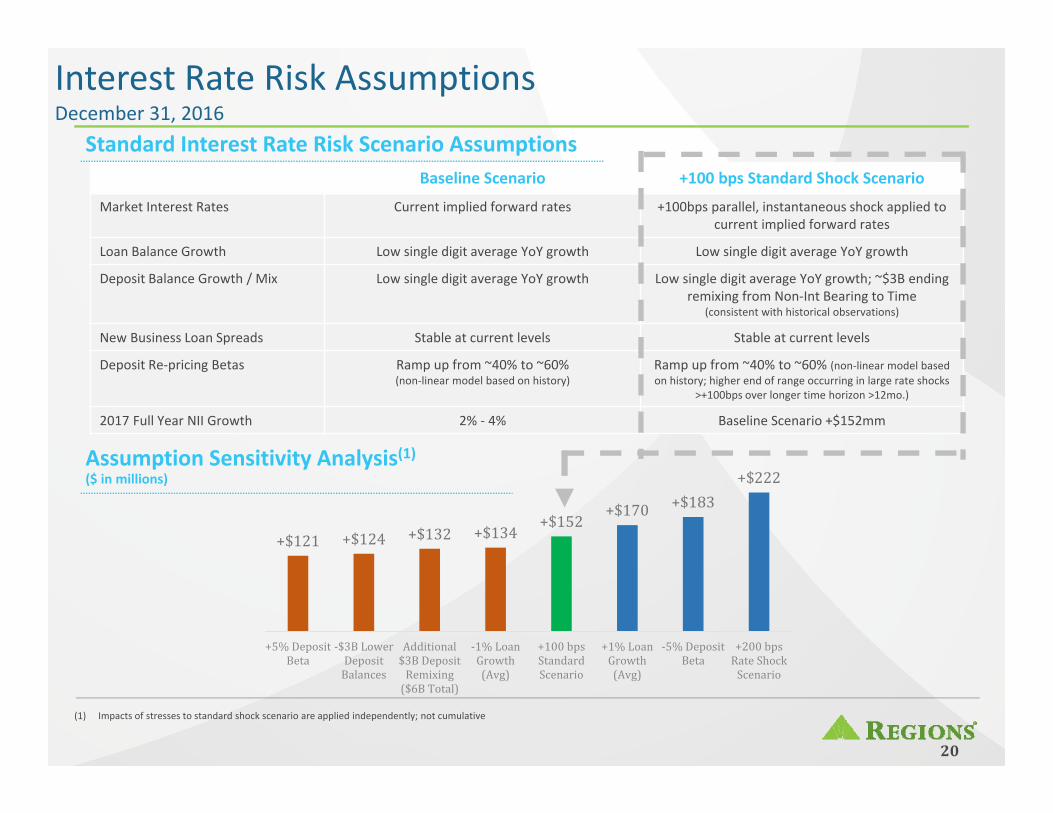
Baseline Scenario +100 bps Standard Shock Scenario
Market Interest Rates Current implied forward rates +100bps parallel, instantaneous shock applied to current implied forward rates
Loan Balance Growth Low single digit average YoY growth Low single digit average YoY growth
Deposit Balance Growth / Mix Low single digit average YoY growth Low single digit average YoY growth; ~$3B ending remixing from Non‐Int Bearing to Time
(consistent with historical observations)
New Business Loan Spreads Stable at current levels Stable at current levels
Deposit Re‐pricing Betas Ramp up from ~40% to ~60% (non‐linear model based on history)
Ramp up from ~40% to ~60% (non‐linear model based on history; higher end of range occurring in large rate shocks
>+100bps over longer time horizon >12mo.)
2017 Full Year NII Growth 2% ‐ 4% Baseline Scenario +$152mm
Interest Rate Risk AssumptionsDecember 31, 2016
Assumption Sensitivity Analysis(1)($ in millions)
(1) Impacts of stresses to standard shock scenario are applied independently; not cumulative
Standard Interest Rate Risk Scenario Assumptions
+$121 +$124 +$132 +$134+$152
+$170 +$183+$222
+5%DepositBeta
‐$3BLowerDepositBalances
Additional$3BDepositRemixing($6BTotal)
‐1%LoanGrowth(Avg)
+100bpsStandardScenario
+1%LoanGrowth(Avg)
‐5%DepositBeta
+200bpsRateShockScenario
20
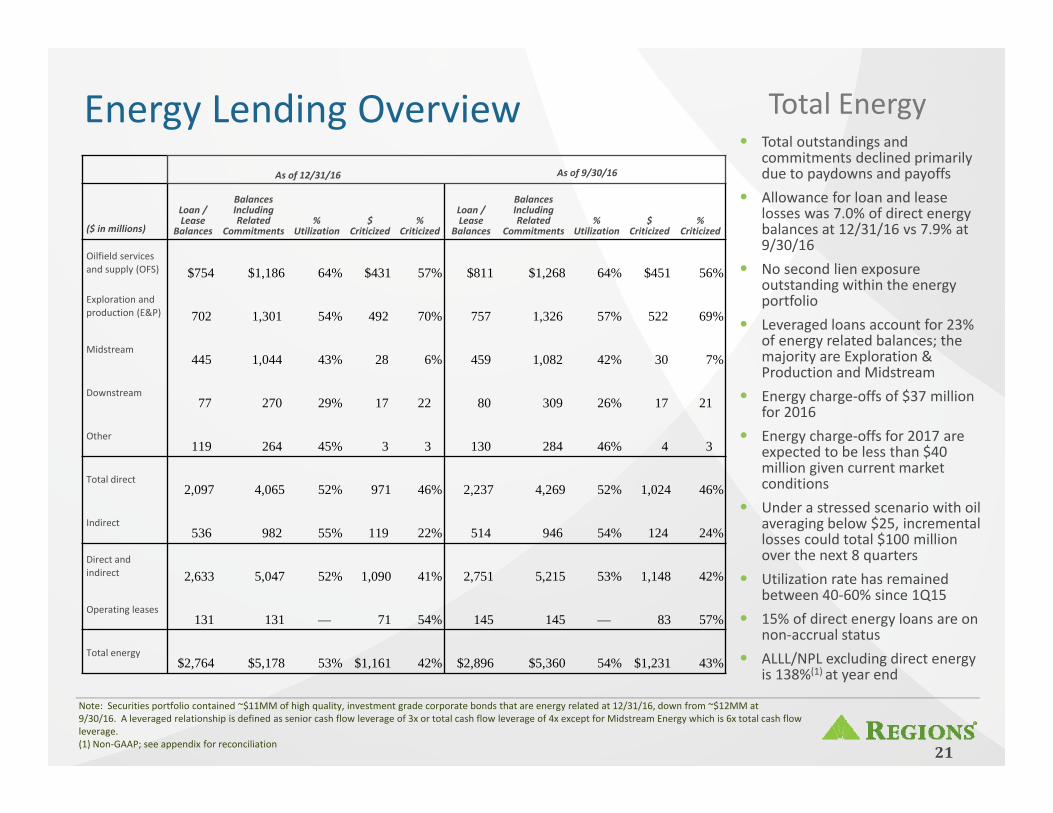
Energy Lending Overview• Total outstandings and
commitments declined primarily due to paydowns and payoffs
• Allowance for loan and lease losses was 7.0% of direct energy balances at 12/31/16 vs 7.9% at 9/30/16
• No second lien exposure outstanding within the energy portfolio
• Leveraged loans account for 23% of energy related balances; the majority are Exploration & Production and Midstream
• Energy charge‐offs of $37 million for 2016
• Energy charge‐offs for 2017 are expected to be less than $40 million given current market conditions
• Under a stressed scenario with oil averaging below $25, incremental losses could total $100 million over the next 8 quarters
• Utilization rate has remained between 40‐60% since 1Q15
• 15% of direct energy loans are on non‐accrual status
• ALLL/NPL excluding direct energy is 138%(1) at year end
Total Energy
As of 12/31/16 As of 9/30/16
($ in millions)
Loan / Lease
Balances
Balances Including Related
Commitments%
Utilization$
Criticized%
Criticized
Loan / Lease
Balances
Balances Including Related
Commitments%
Utilization$
Criticized%
Criticized
Oilfield services and supply (OFS) $754 $1,186 64% $431 57% $811 $1,268 64% $451 56%
Exploration and production (E&P) 702 1,301 54% 492 70% 757 1,326 57% 522 69%
Midstream445 1,044 43% 28 6% 459 1,082 42% 30 7%
Downstream77 270 29% 17 22 80 309 26% 17 21
Other119 264 45% 3 3 130 284 46% 4 3
Total direct2,097 4,065 52% 971 46% 2,237 4,269 52% 1,024 46%
Indirect536 982 55% 119 22% 514 946 54% 124 24%
Direct and indirect 2,633 5,047 52% 1,090 41% 2,751 5,215 53% 1,148 42%
Operating leases131 131 — 71 54% 145 145 — 83 57%
Total energy$2,764 $5,178 53% $1,161 42% $2,896 $5,360 54% $1,231 43%
Note: Securities portfolio contained ~$11MM of high quality, investment grade corporate bonds that are energy related at 12/31/16, down from ~$12MM at 9/30/16. A leveraged relationship is defined as senior cash flow leverage of 3x or total cash flow leverage of 4x except for Midstream Energy which is 6x total cash flow leverage.(1) Non‐GAAP; see appendix for reconciliation 21

Energy Lending ‐ Oil Field Services and Exploration & Production Detail
TypeAs of
12/31/16 ($ in millions)
# of Clients* Commentary
Marine $447 $9 Expect some additional stress into 2017 as contracts mature and E&P companies focus on shorter cycle onshore projects. Contract coverage for the portfolio is approximately 50% entering 2017
Integrated OFS 139 9 Average utilization is 38% indicating clients have liquidity to weather cycle.
Compression 108 4 Linked to movement of natural gas; sector is more stable and lower risk than other sectors.
Fluid Management 14 2 Some improvement in this sector as rig counts have improved. Exposure is minimal after payoffs in the quarter.
Pre‐drilling / Drilling 40 2 Reduced capex spending of many E&P companies impacted current and future cash flows; however, Regions' larger borrowers remain liquid.
Sand 6 1 Some improvement in this sector as rig counts have improved. Exposure is minimal.
Total Oil Field Services (OFS)
754 27
Exploration and production (E&P)
702 26**
Total OFS and E&P $1,456
• 47% shared national credit (SNC) loans
• 64% utilization rate compared to 65% in 3Q16
• 87% Non‐pass rated (criticized) loans paying as agreed
E&P Portfolio
*Represents the number of clients that comprise 75% of the loan balances outstanding.**Represents the number of clients that comprise 90% of the loan balances outstanding.
OFS Portfolio
• Majority of borrowing is senior secured
• 96% shared national credit (SNC) loans
• 54% utilization rate compared to 57% in 3Q16
• Essentially all non‐pass rated (criticized) loans paying as agreed
22

Loan Balances by Select StatesTexas Louisiana
Note: Intelligence from our customer assistance program (CAP) reveals no noticeable increase in assistance requests in these markets to date.
Investor Real Estate Balances by City
($ in millions)
Office Retail Multi‐Family
Single Family Other Total
Houston $32 $72 $228 $71 $18 $421
Dallas 113 32 205 52 28 430
San Antonio — 27 44 37 45 153
Other 16 60 88 4 21 189
Total $161 $191 $565 $164 $112 $1,193
Investor Real Estate Balances by City
($ in millions)
Office Retail Multi‐Family
Single Family Other Total
Baton Rouge $38 $10 $9 $47 $18 $122
New Orleans 5 9 1 2 8 25
Other 2 44 4 1 17 68
Total $45 $63 $14 $50 $43 $215
$4.3B$8.5B
23

Loan Balances by Select States Alabama Mississippi
$3.1B$9.8B
Investor Real Estate Balances by City
($ in millions)Office Retail
Multi‐Family
Single Family Other Total
Birmingham $15 $30 $5 $16 $27 $93
Huntsville 82 17 6 7 2 114
Mobile / Baldwin County 2 7 3 3 9 24
Other 8 21 21 11 13 74
Total $107 $75 $35 $37 $51 $305
Investor Real Estate Balances by City
($ in millions)
Office Retail Multi‐Family
Single Family Other Total
North Mississippi — — — — $97 $97
Jackson/Other 5 2 17 1 3 28
Gulfport / Biloxi / Pascagoula — — 18 — 8 26
Total $5 $2 $35 $1 $108 $151
24

Non‐GAAP reconciliation: Non‐interest income, non‐interest expense and efficiency ratio
NM ‐ Not Meaningful
The table below presents computations of the efficiency ratio (non‐GAAP), which is a measure of productivity, generally calculated as non‐interest expense divided by total revenue. Management uses this ratio to monitor performance and believes this measure provides meaningful information to investors. Non‐interest expense (GAAP) is presented excluding certain adjustments to arrive at adjusted non‐interest expense (non‐GAAP), which is the numerator for the efficiency ratio. Non‐interest income (GAAP) is presented excluding certain adjustments to arrive at adjusted non‐interest income (non‐GAAP), which is the numerator for the fee income ratio. Net interest income and other financing income on a taxable‐equivalent basis and non‐interest income are added together to arrive at total revenue on a taxable‐equivalent basis. Adjustments are made to arrive at adjusted total revenue on a taxable‐equivalent basis (non‐GAAP), which is the denominator for the efficiency ratio. Regions believes that the exclusion of these adjustments provides a meaningful base for period‐to‐period comparisons, which management believes will assist investors in analyzing the operating results of the Company and predicting future performance. These non‐GAAP financial measures are also used by management to assess the performance of Regions’ business. It is possible that the activities related to the adjustments may recur; however, management does not consider the activities related to the adjustments to be indications of ongoing operations. The table on the following page presents a computation of the operating leverage ratio (non‐GAAP) which is the period to period percentage change in adjusted total revenue on a taxable‐equivalent basis (non‐GAAP) less the percentage change in adjusted non‐interest expense (non‐GAAP). Regions believes that presentation of these non‐GAAP financial measures will permit investors to assess the performance of the Company on the same basis as that applied by management.
Quarter Ended($ amounts in millions) 12/31/2016 9/30/2016 6/30/2016 3/31/2016 12/31/2015 4Q16 vs. 3Q16 4Q16 vs. 4Q15
ADJUSTED EFFICIENCY AND FEE INCOME RATIOS, ADJUSTED NON-INTEREST INCOME/EXPENSE- CONTINUING OPERATIONS
Non-interest expense (GAAP) A $ 899 $ 934 $ 915 $ 869 $ 873 $ (35) (3.7)% $ 26 3.0%Adjustments:Professional, legal and regulatory expenses — — (3) — — — NM — NMBranch consolidation, property and equipment charges (17) (5) (22) (14) (6) (12) 240.0% (11) 183.3%Loss on early extinguishment of debt — (14) — — — 14 (100.0)% — NMSalary and employee benefits—severance charges (5) (3) (1) (12) (6) (2) 66.7% 1 (16.7)%Adjusted non-interest expense (non-GAAP) B $ 877 $ 912 $ 889 $ 843 $ 861 $ (35) (3.8)% $ 16 1.9%Net interest income and other financing income (GAAP) $ 853 $ 835 $ 848 $ 862 $ 836 $ 18 2.2% $ 17 2.0%
Taxable-equivalent adjustment 21 21 21 21 20 — —% 1 5.0%
Net interest income and other financing income, taxable-equivalent basis C $ 874 $ 856 $ 869 $ 883 $ 856 $ 18 2.1% $ 18 2.1%Non-interest income (GAAP) D $ 522 $ 599 $ 526 $ 506 $ 514 $ (77) (12.9)% $ 8 1.6%Adjustments:Securities (gains) losses, net (5) — (6) 5 (11) (5) NM 6 (54.5)%Insurance proceeds — (47) — (3) (1) 47 (100.0)% 1 (100.0)%Leveraged lease termination gains, net — (8) — — — 8 (100.0)% — NM
Gain on sale of affordable housing residential mortgage loans (5) — — — — (5) NM (5) NM
Adjusted non-interest income (non-GAAP) E $ 512 $ 544 $ 520 $ 508 $ 502 $ (32) (5.9)% $ 10 2.0%Total revenue, taxable-equivalent basis C+D=F $ 1,396 $ 1,455 $ 1,395 $ 1,389 $ 1,370 $ (59) (4.1)% $ 26 1.9%
Adjusted total revenue, taxable-equivalent basis (non-GAAP) C+E=G $ 1,386 $ 1,400 $ 1,389 $ 1,391 $ 1,358 $ (14) (1.0)% $ 28 2.1%
Efficiency ratio (GAAP) A/F 64.4% 64.2% 65.6% 62.5% 63.7%Adjusted efficiency ratio (non-GAAP) B/G 63.2% 65.3% 64.0% 60.6% 63.4%Fee income ratio (GAAP) D/F 37.4% 41.2% 37.7% 36.4% 37.5%Adjusted fee income ratio (non-GAAP) E/G 36.9% 38.8% 37.5% 36.5% 37.0%
25
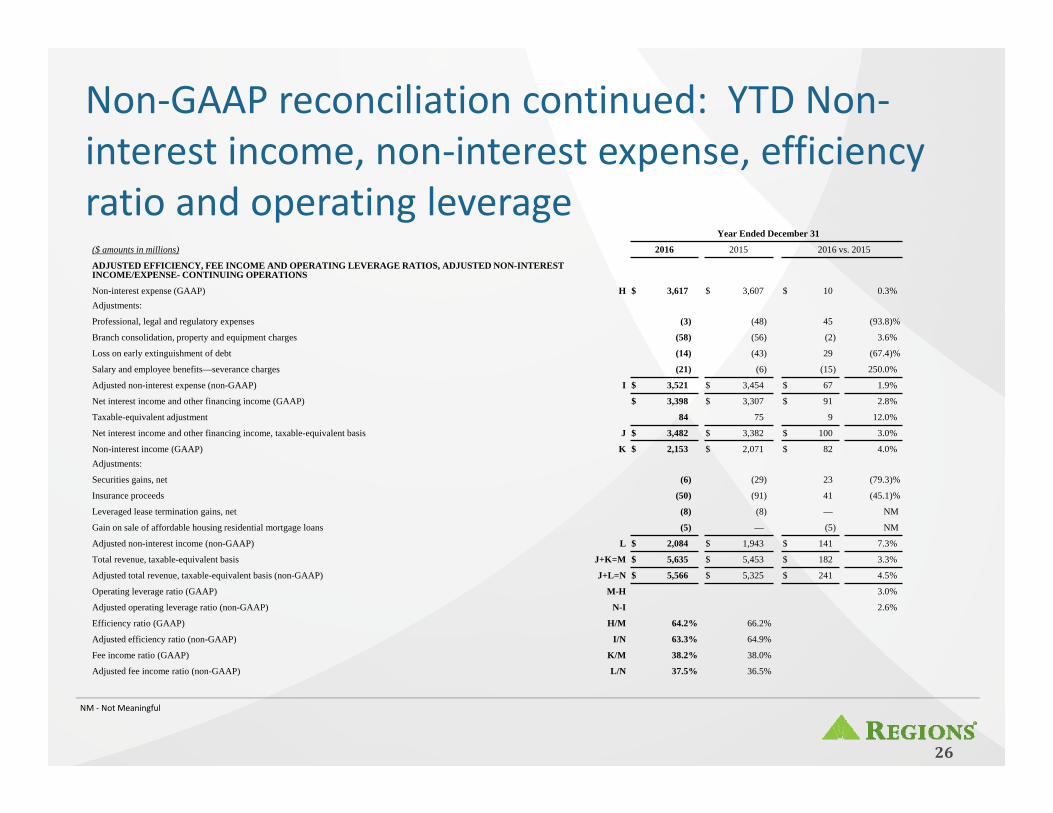
Non‐GAAP reconciliation continued: YTD Non‐interest income, non‐interest expense, efficiency ratio and operating leverage
NM ‐ Not Meaningful
Year Ended December 31
($ amounts in millions) 2016 2015 2016 vs. 2015
ADJUSTED EFFICIENCY, FEE INCOME AND OPERATING LEVERAGE RATIOS, ADJUSTED NON-INTEREST INCOME/EXPENSE- CONTINUING OPERATIONS
Non-interest expense (GAAP) H $ 3,617 $ 3,607 $ 10 0.3%Adjustments:
Professional, legal and regulatory expenses (3) (48) 45 (93.8)%
Branch consolidation, property and equipment charges (58) (56) (2) 3.6%
Loss on early extinguishment of debt (14) (43) 29 (67.4)%
Salary and employee benefits—severance charges (21) (6) (15) 250.0%
Adjusted non-interest expense (non-GAAP) I $ 3,521 $ 3,454 $ 67 1.9%
Net interest income and other financing income (GAAP) $ 3,398 $ 3,307 $ 91 2.8%
Taxable-equivalent adjustment 84 75 9 12.0%
Net interest income and other financing income, taxable-equivalent basis J $ 3,482 $ 3,382 $ 100 3.0%
Non-interest income (GAAP) K $ 2,153 $ 2,071 $ 82 4.0%Adjustments:
Securities gains, net (6) (29) 23 (79.3)%
Insurance proceeds (50) (91) 41 (45.1)%
Leveraged lease termination gains, net (8) (8) — NM
Gain on sale of affordable housing residential mortgage loans (5) — (5) NM
Adjusted non-interest income (non-GAAP) L $ 2,084 $ 1,943 $ 141 7.3%
Total revenue, taxable-equivalent basis J+K=M $ 5,635 $ 5,453 $ 182 3.3%
Adjusted total revenue, taxable-equivalent basis (non-GAAP) J+L=N $ 5,566 $ 5,325 $ 241 4.5%
Operating leverage ratio (GAAP) M-H 3.0%
Adjusted operating leverage ratio (non-GAAP) N-I 2.6%
Efficiency ratio (GAAP) H/M 64.2% 66.2%
Adjusted efficiency ratio (non-GAAP) I/N 63.3% 64.9%
Fee income ratio (GAAP) K/M 38.2% 38.0%
Adjusted fee income ratio (non-GAAP) L/N 37.5% 36.5%
26
Non‐GAAP reconciliation continued: YTD return on average tangible stockholders' equity and earnings per common share from continuing operations
27
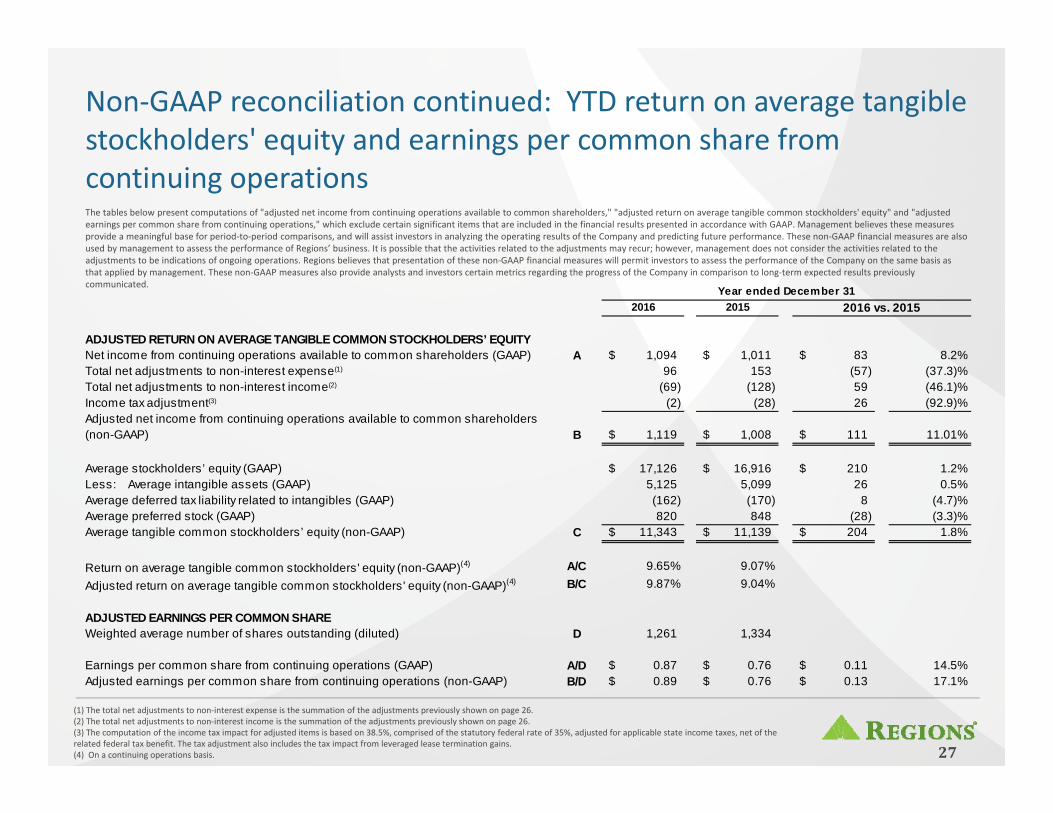
The tables below present computations of "adjusted net income from continuing operations available to common shareholders," "adjusted return on average tangible common stockholders' equity" and "adjusted earnings per common share from continuing operations," which exclude certain significant items that are included in the financial results presented in accordance with GAAP. Management believes these measures provide a meaningful base for period‐to‐period comparisons, and will assist investors in analyzing the operating results of the Company and predicting future performance. These non‐GAAP financial measures are also used by management to assess the performance of Regions’ business. It is possible that the activities related to the adjustments may recur; however, management does not consider the activities related to the adjustments to be indications of ongoing operations. Regions believes that presentation of these non‐GAAP financial measures will permit investors to assess the performance of the Company on the same basis as that applied by management. These non‐GAAP measures also provide analysts and investors certain metrics regarding the progress of the Company in comparison to long‐term expected results previously communicated.
(1) The total net adjustments to non‐interest expense is the summation of the adjustments previously shown on page 26.(2) The total net adjustments to non‐interest income is the summation of the adjustments previously shown on page 26.(3) The computation of the income tax impact for adjusted items is based on 38.5%, comprised of the statutory federal rate of 35%, adjusted for applicable state income taxes, net of the related federal tax benefit. The tax adjustment also includes the tax impact from leveraged lease termination gains.(4) On a continuing operations basis.
2016 2015
ADJUSTED RETURN ON AVERAGE TANGIBLE COMMON STOCKHOLDERS’ EQUITYNet income from continuing operations available to common shareholders (GAAP) A 1,094$ 1,011$ 83$ 8.2%Total net adjustments to non-interest expense(1) 96 153 (57) (37.3)%Total net adjustments to non-interest income(2) (69) (128) 59 (46.1)%Income tax adjustment(3) (2) (28) 26 (92.9)%Adjusted net income from continuing operations available to common shareholders (non-GAAP) B 1,119$ 1,008$ 111$ 11.01%
Average stockholders’ equity (GAAP) 17,126$ 16,916$ 210$ 1.2%Less: Average intangible assets (GAAP) 5,125 5,099 26 0.5%Average deferred tax liability related to intangibles (GAAP) (162) (170) 8 (4.7)%Average preferred stock (GAAP) 820 848 (28) (3.3)%Average tangible common stockholders’ equity (non-GAAP) C 11,343$ 11,139$ 204$ 1.8%
Return on average tangible common stockholders' equity (non-GAAP)(4) A/C 9.65% 9.07%
Adjusted return on average tangible common stockholders' equity (non-GAAP)(4) B/C 9.87% 9.04%
ADJUSTED EARNINGS PER COMMON SHARE Weighted average number of shares outstanding (diluted) D 1,261 1,334
Earnings per common share from continuing operations (GAAP) A/D 0.87$ 0.76$ 0.11$ 14.5%Adjusted earnings per common share from continuing operations (non-GAAP) B/D 0.89$ 0.76$ 0.13$ 17.1%
Year ended December 312016 vs. 2015
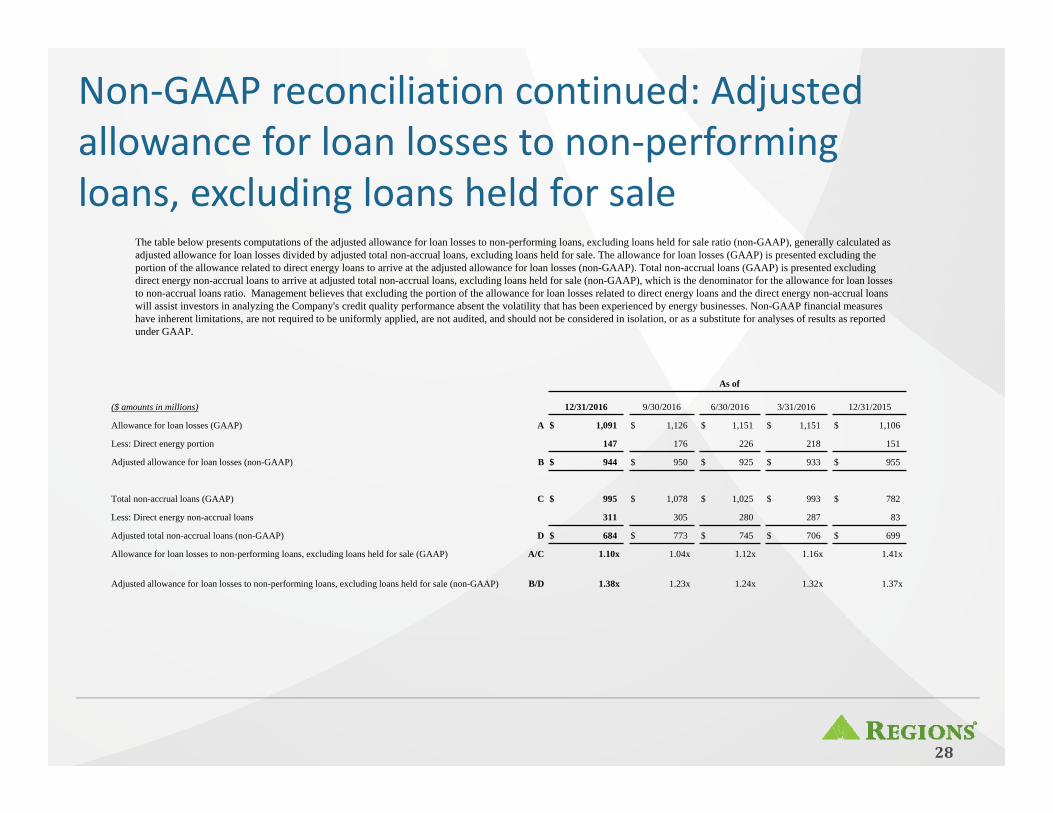
The table below presents computations of the adjusted allowance for loan losses to non-performing loans, excluding loans held for sale ratio (non-GAAP), generally calculated as adjusted allowance for loan losses divided by adjusted total non-accrual loans, excluding loans held for sale. The allowance for loan losses (GAAP) is presented excluding the portion of the allowance related to direct energy loans to arrive at the adjusted allowance for loan losses (non-GAAP). Total non-accrual loans (GAAP) is presented excluding direct energy non-accrual loans to arrive at adjusted total non-accrual loans, excluding loans held for sale (non-GAAP), which is the denominator for the allowance for loan losses to non-accrual loans ratio. Management believes that excluding the portion of the allowance for loan losses related to direct energy loans and the direct energy non-accrual loans will assist investors in analyzing the Company's credit quality performance absent the volatility that has been experienced by energy businesses. Non-GAAP financial measures have inherent limitations, are not required to be uniformly applied, are not audited, and should not be considered in isolation, or as a substitute for analyses of results as reported under GAAP.
Non‐GAAP reconciliation continued: Adjusted allowance for loan losses to non‐performing loans, excluding loans held for sale
As of
($ amounts in millions) 12/31/2016 9/30/2016 6/30/2016 3/31/2016 12/31/2015
Allowance for loan losses (GAAP) A $ 1,091 $ 1,126 $ 1,151 $ 1,151 $ 1,106
Less: Direct energy portion 147 176 226 218 151
Adjusted allowance for loan losses (non-GAAP) B $ 944 $ 950 $ 925 $ 933 $ 955
Total non-accrual loans (GAAP) C $ 995 $ 1,078 $ 1,025 $ 993 $ 782
Less: Direct energy non-accrual loans 311 305 280 287 83
Adjusted total non-accrual loans (non-GAAP) D $ 684 $ 773 $ 745 $ 706 $ 699
Allowance for loan losses to non-performing loans, excluding loans held for sale (GAAP) A/C 1.10x 1.04x 1.12x 1.16x 1.41x
Adjusted allowance for loan losses to non-performing loans, excluding loans held for sale (non-GAAP) B/D 1.38x 1.23x 1.24x 1.32x 1.37x
28

Non‐GAAP reconciliation: Basel III common equity Tier 1 ratio – fully phased‐in pro‐forma
(1) Current quarter amounts and the resulting ratio are estimated. (2) Regions continues to develop systems and internal controls to precisely calculate risk‐weighted assets as required by Basel III on a fully phased‐in basis. The
amount included above is a reasonable approximation, based on our understanding of the requirements.
The calculation of the fully phased‐in pro‐forma "Common equity Tier 1" (CET1) is based on Regions’ understanding of the Final Basel III requirements. For Regions, the Basel III framework became effective on a phased‐in approach starting in 2015 with full implementation beginning in 2019. The calculation provided below includes estimated pro‐forma amounts for the ratio on a fully phased‐in basis. Regions’ current understanding of the final framework includes certain assumptions, including the Company’s interpretation of the requirements, and informal feedback received through the regulatory process. Regions’ understanding of the framework is evolving and will likely change as analysis and discussions with regulators continue. Because Regions is not currently subject to the fully‐phased in capital rules, this pro‐forma measure is considered to be a non‐GAAP financial measure, and other entities may calculate it differently from Regions’ disclosed calculation.
A company's regulatory capital is often expressed as a percentage of risk‐weighted assets. Under the risk‐based capital framework, a company’s balance sheet assets and credit equivalent amounts of off‐balance sheet items are assigned to broad risk categories. The aggregated dollar amount in each category is then multiplied by the prescribed risk‐weighted percentage. The resulting weighted values from each of the categories are added together and this sum is the risk‐weighted assets total that, as adjusted, comprises the denominator of certain risk‐based capital ratios. Common equity Tier 1 capital is then divided by this denominator (risk‐weighted assets) to determine the common equity Tier 1 capital ratio. The amounts disclosed as risk‐weighted assets are calculated consistent with banking regulatory requirements on a fully phased‐in basis.
Since analysts and banking regulators may assess Regions’ capital adequacy using the fully phased‐in Basel III framework, we believe that it is useful to provide investors the ability to assess Regions’ capital adequacy on this same basis.
($ amounts in millions) 12/31/2016 9/30/2016 6/30/2016 3/31/2016 12/31/2015
Basel III Common Equity Tier 1 Ratio—Fully Phased-In Pro-Forma (1)
Stockholder's equity (GAAP) $ 16,664 $ 17,365 $ 17,385 $ 17,211 $ 16,844
Non-qualifying goodwill and intangibles (4,955) (4,936) (4,946) (4,947) (4,958)
Adjustments, including all components of accumulated other comprehensive income, disallowed deferred tax assets, threshold deductions and other adjustments 482 (173) (227) (64) 286
Preferred stock (GAAP) (820) (820) (820) (820) (820)
Basel III common equity Tier 1—Fully Phased-In Pro-Forma (non-GAAP) A $ 11,371 $ 11,436 $ 11,392 $ 11,380 $ 11,352
Basel III risk-weighted assets—Fully Phased-In Pro-Forma (non-GAAP) (2) B $ 103,529 $ 103,749 $ 105,199 $ 106,227 $ 106,188
Basel III common equity Tier 1 ratio—Fully Phased-In Pro-Forma (non-GAAP) A/B 11.0% 11.0% 10.8% 10.7% 10.7%
29
Forward‐looking statementsThis release may include forward‐looking statements as defined in the Private Securities Litigation Reform Act of 1995, which reflect Regions’ current views with respect to future events and financial performance. Forward‐looking statements are not based on historical information, but rather are related to future operations, strategies, financial results or other developments. Forward‐looking statements are based on management’s expectations as well as certain assumptions and estimates made by, and information available to, management at the time the statements are made. Those statements are based on general assumptions and are subject to various risks, uncertainties and other factors that may cause actual results to differ materially from the views, beliefs and projections expressed in such statements. These risks, uncertainties and other factors include, but are not limited to, those described below:
• Current and future economic and market conditions in the United States generally or in the communities we serve, including the effects of declines in property values, unemployment rates and potential reductions of economic growth, which may adversely affect our lending and other businesses and our financial results and conditions. • Possible changes in trade, monetary and fiscal policies of, and other activities undertaken by, governments, agencies, central banks and similar organizations, which could have a material adverse effect on our earnings.• The effects of a possible downgrade in the U.S. government’s sovereign credit rating or outlook, which could result in risks to us and general economic conditions that we are not able to predict.• Possible changes in market interest rates or capital markets could adversely affect our revenue and expense, the value of assets and obligations, and the availability and cost of capital and liquidity.• Any impairment of our goodwill or other intangibles, or any adjustment of valuation allowances on our deferred tax assets due to adverse changes in the economic environment, declining operations of the reporting unit, or other factors.•Possible changes in the creditworthiness of customers and the possible impairment of the collectability of loans.• Changes in the speed of loan prepayments, loan origination and sale volumes, charge‐offs, loan loss provisions or actual loan losses where our allowance for loan losses may not be adequate to cover our eventual losses.• Possible acceleration of prepayments on mortgage‐backed securities due to low interest rates, and the related acceleration of premium amortization on those securities.• Our ability to effectively compete with other financial services companies, some of whom possess greater financial resources than we do and are subject to different regulatory standards than we are.• Loss of customer checking and savings account deposits as customers pursue other, higher‐yield investments, which could increase our funding costs.• Our inability to develop and gain acceptance from current and prospective customers for new products and services in a timely manner could have a negative impact on our revenue.• The effects of any developments, changes or actions relating to any litigation or regulatory proceedings brought against us or any of our subsidiaries.• Changes in laws and regulations affecting our businesses, such as the Dodd‐Frank Act and other legislation and regulations relating to bank products and services, as well as changes in the enforcement and interpretation of such laws and regulations by applicable governmental and self‐regulatory agencies, which could require us to change certain business practices, increase compliance risk, reduce our revenue, impose additional costs on us, or otherwise negatively affect our businesses.• Our ability to obtain a regulatory non‐objection (as part of the CCAR process or otherwise) to take certain capital actions, including paying dividends and any plans to increase common stock dividends, repurchase common stock under current or future programs, or redeem preferred stock or other regulatory capital instruments, may impact our ability to return capital to stockholders and market perceptions of us. • Our ability to comply with stress testing and capital planning requirements (as part of the CCAR process or otherwise) may continue to require a significant investment of our managerial resources due to the importance and intensity of such tests and requirements.• Our ability to comply with applicable capital and liquidity requirements (including, among other things, the Basel III capital standards and the LCR rule), including our ability to generate capital internally or raise capital on favorable terms, and if we fail to meet requirements, our financial condition could be negatively impacted.• The Basel III framework calls for additional risk‐based capital surcharges for globally systemically important banks. Although we are not subject to such surcharges, it is possible that in the future we may become subject to similar surcharges.• The costs, including possibly incurring fines, penalties, or other negative effects (including reputational harm) of any adverse judicial, administrative, or arbitral rulings or proceedings, regulatory enforcement actions, or other legal actions to which we or any of our subsidiaries are a party, and which may adversely affect our results. • Our ability to manage fluctuations in the value of assets and liabilities and off‐balance sheet exposure so as to maintain sufficient capital and liquidity to support our business.• Our ability to execute on our strategic and operational plans, including our ability to fully realize the financial and non‐financial benefits relating to our strategic initiatives.• The success of our marketing efforts in attracting and retaining customers.• Possible changes in consumer and business spending and saving habits and the related effect on our ability to increase assets and to attract deposits, which could adversely affect our net income.• Our ability to recruit and retain talented and experienced personnel to assist in the development, management and operation of our products and services may be affected by changes in laws and regulations in effect from time to time.• Fraud or misconduct by our customers, employees or business partners.
30

Forward‐looking statements continued
The foregoing list of factors is not exhaustive. For discussion of these and other factors that may cause actual results to differ from expectations, look under the captions “Forward‐Looking Statements” and“Risk Factors" of Regions' Annual Report on Form 10‐K for the year ended December 31, 2015, as filed with the Securities and Exchange Commission.
The words “anticipates,” “intends,” “plans,” “seeks,” “believes,” “estimates,” “expects,” “targets,” “projects,” “outlook,” “forecast,” “will,” “may,” “could,” “should,” “can,” and similar expressions oftensignify forward‐looking statements. You should not place undue reliance on any forward‐looking statements, which speak only as of the date made. We assume no obligation to update or revise any forward‐looking statements that are made from time to time.
• Any inaccurate or incomplete information provided to us by our customers or counterparties.• The risks and uncertainties related to our acquisition and integration of other companies.• Inability of our framework to manage risks associated with our business such as credit risk and operational risk, including third‐party vendors and other service providers, which could, among otherthings, result in a breach of operating or security systems as a result of a cyber attack or similar act.• The inability of our internal disclosure controls and procedures to prevent, detect or mitigate any material errors or fraudulent acts.• The effects of geopolitical instability, including wars, conflicts and terrorist attacks and the potential impact, directly or indirectly, on our businesses.• The effects of man‐made and natural disasters, including fires, floods, droughts, tornadoes, hurricanes, and environmental damage, which may negatively affect our operations and/or our loanportfolios and increase our cost of conducting business.• Changes in commodity market prices and conditions could adversely affect the cash flows of our borrowers operating in industries that are impacted by changes in commodity prices (includingbusinesses indirectly impacted by commodities prices such as businesses that transport commodities or manufacture equipment used in the production of commodities), which could impair their ability toservice any loans outstanding to them and/or reduce demand for loans in those industries.• Our inability to keep pace with technological changes could result in losing business to competitors.• Our ability to identify and address cyber‐security risks such as data security breaches, “denial of service” attacks, “hacking” and identity theft, a failure of which could disrupt our business and result inthe disclosure of and/or misuse or misappropriation of confidential or proprietary information; disruption or damage to our systems; increased costs; losses; or adverse effects to our reputation.• Our ability to realize our adjusted efficiency ratio target as part of our expense management initiatives.• Significant disruption of, or loss of public confidence in, the Internet and services and devices used to access the Internet could affect the ability of our customers to access their accounts and conductbanking transactions.• Possible downgrades in our credit ratings or outlook could increase the costs of funding from capital markets.• The effects of problems encountered by other financial institutions that adversely affect us or the banking industry generally could require us to change certain business practices, reduce our revenue,impose additional costs on us, or otherwise negatively affect our businesses.• The effects of the failure of any component of our business infrastructure provided by a third party could disrupt our businesses; result in the disclosure of and/or misuse of confidential information orproprietary information; increase our costs; negatively affect our reputation; and cause losses.• Our ability to receive dividends from our subsidiaries could affect our liquidity and ability to pay dividends to stockholders.• Changes in accounting policies or procedures as may be required by the FASB or other regulatory agencies could materially affect how we report our financial results.• Other risks identified from time to time in reports that we file with the SEC.• The effects of any damage to our reputation resulting from developments related to any of the items identified above.
31

®
32