transformation spirit values smart growth updated 1q17...
TRANSCRIPT

low breakeven price
transformation
flexibility
acceleration
differentiation low cost of supply
SPIRIT Values
smart growth
superior returns
Updated 1Q17 Earnings May 4, 2017
1Q17 earnings have been updated as a result of a subsequent filing and information from the operator of Shenandoah, disclosing its decision to impair the carrying value of Shenandoah in the Gulf of Mexico.

2
Cautionary StatementThe following presentation includes forward-looking statements. These statements relate to future events, such as anticipated revenues, earnings, business strategies, competitive position or other aspects of our operations, operating results or the industries or markets in which we operate or participate in general. Actual outcomes and results may differ materially from what is expressed or forecast in such forward-looking statements. These statements are not guarantees of future performance and involve certain risks, uncertainties and assumptions that may prove to be incorrect and are difficult to predict such as our ability to complete the sale of our San Juan Basin Assets and certain of our assets in western Canada (together, the Sale Transactions) on the timeline currently anticipated, if at all; the possibility that regulatory approvals for either of the Sale Transactions will not be received on a timely basis, if at all, or that such approvals may require modification to the terms of either of the Sale Transactions or our remaining business; business disruptions during or following the Sale Transactions, including the diversion of management time and attention; our ability to liquidate the common stock issued to us by Cenovus Energy Inc. as part of our sale of assets in western Canada at prices we deem acceptable, or at all; the ability to deploy net proceeds from the Sale Transactions in the manner and timeframe we currently anticipate, if at all; operational hazards and drilling risks; potential failure to achieve, and potential delays in achieving expected reserves or production levels from existing and future oil and gas development projects; unsuccessful exploratory activities; unexpected cost increases or technical difficulties in constructing, maintaining or modifying company facilities; international monetary conditions and exchange controls; potential liability for remedial actions under existing or future environmental regulations or from pending or future litigation; limited access to capital or significantly higher cost of capital related to illiquidity or uncertainty in the domestic or international financial markets; general domestic and international economic and political conditions, and changes in tax, environmental and other laws applicable to ConocoPhillips’ business; and other economic, business, competitive and/or regulatory factors affecting ConocoPhillips’ business generally as set forth in ConocoPhillips’ filings with the Securities and Exchange Commission (SEC). We caution you not to place undue reliance on our forward-looking statements, which are only as of the date of this presentation or as otherwise indicated, and we expressly disclaim any responsibility for updating such information.
Use of non-GAAP financial information – This presentation may include non-GAAP financial measures, which help facilitate comparison of company operating performance across periods and with peer companies. Any non-GAAP measures included herein will be accompanied by a reconciliation to the nearest corresponding GAAP measure either within the presentation or on our website at www.conocophillips.com/nongaap.
Cautionary Note to U.S. Investors – The SEC permits oil and gas companies, in their filings with the SEC, to disclose only proved, probable and possible reserves. We use the term "resource" in this presentation that the SEC’s guidelines prohibit us from including in filings with the SEC. U.S. investors are urged to consider closely the oil and gas disclosures in our Form 10-K and other reports and filings with the SEC. Copies are available from the SEC and from the ConocoPhillips website.

low breakeven price
transformation
flexibility
acceleration
differentiation low cost of supply
SPIRIT Values
smart growth
superior returns
Don Wallette, Jr.EVP, Finance, Commercial and CFO

1Q17 Summary
4
Strategic Financial Operational
• Continued strong underlyingbusiness performance
• Production of 1,584 MBOED;2% year-over-year growth3
• Executing Lower 48unconventional developmentplan
• On track to deliver 2017operational targets
• Increased quarterly dividendby 6%
• Reduced debt by $0.8B
• Repurchased 2.2MM shares
• Announced Canadian and SanJuan asset dispositions inMarch and April, respectively• Proceeds target debt reduction and
share buybacks
• ($0.2B) adjusted earnings;($0.14) adjusted EPS
• $1.8B CFO1; $3.4B ending cash2
• CFO exceeded capital anddividend by $0.5B
• Reduced adjusted operatingcosts 6% year-over-year
• Rating agency outlooksimproved
1 Cash provided by operating activities (CFO), excluding operating working capital change of $0.04B, is $1.8B and cash provided by operating activities is $1.8B.2 Ending cash includes cash and cash equivalents of $3.1B and short-term investments of $0.3B.3 Production excludes Libya and growth is adjusted for downtime and dispositions.Adjusted earnings refer to adjusted earnings (loss).Adjusted operating costs, adjusted earnings (loss) and adjusted EPS (loss) are non-GAAP measures. A non-GAAP reconciliation is available on our website.

1Q17 Performance – Adjusted Earnings
5
Adjusted EPS ($) ($0.95) ($0.26) ($0.14)
Average Realized Price ($/BOE) $22.94 $32.93 $36.18
• Year-over-year adjusted earnings benefited from a58% improvement in realizations
• Sequential adjusted earnings benefited from a 10%improvement in realizations and lower depreciationexpense, partially offset by higher exploration expense
(1,179)
(318)(177)
1Q16 4Q16 1Q17
Adjusted Earnings ($MM)
1Q17 Adjusted Earnings ($MM)
Highlights
Lower 48 ($329)
Canada ($29)
Alaska $99
Europe & North Africa $171
Asia Pacific & Middle East $236
Other International ($20)
Corporate & Other ($305)
Total ($177)
Adjusted earnings refer to adjusted earnings (loss).Adjusted earnings (loss) and adjusted EPS (loss) are non-GAAP measures. A non-GAAP reconciliation is available on our website.

1Q17 Performance – Company Cash Flow
6
3.7 3.4
1.8
0.2
0.1
0.8
1.00.3 0.1
2017 BeginningCash & Short-
TermInvestments¹
CFO ExcludingOperating
Working Capital
Total WorkingCapital²
Debt CapitalExpenditures
& Investments
Dividends Repurchase ofCompany
Common Stock
Other 1Q17 EndingCash & Short-
TermInvestments¹
$B 1Q17 Marker Prices• Brent $53.78/BBL• WTI $51.83/BBL• Henry Hub $3.32/MMBTU
1 Beginning cash and short-term investments include cash and cash equivalents of $3.6B and short-term investments of $0.1B. Ending cash and short-term investments include cash and cash equivalents of $3.1B and short-term investments of $0.3B.2 Total working capital includes ($0.04B) and ($0.03B) of working capital changes associated with operating activities and investing activities, respectively.
1Q17• Debt of $26.4B• Debt-to-capital ratio of 43%

low breakeven price
transformation
flexibility
acceleration
differentiation low cost of supply
SPIRIT Values
smart growth
superior returns
Al HirshbergEVP, Production, Drilling and Projects
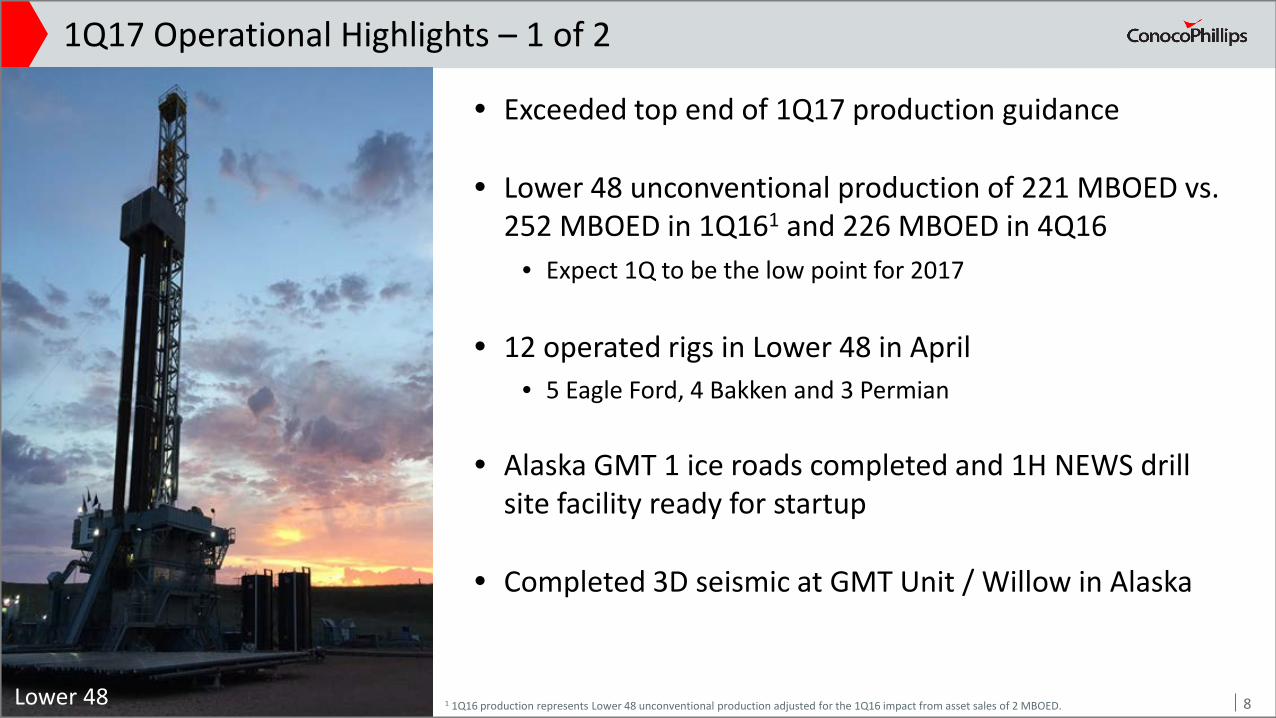
• Exceeded top end of 1Q17 production guidance
• Lower 48 unconventional production of 221 MBOED vs.252 MBOED in 1Q161 and 226 MBOED in 4Q16
• Expect 1Q to be the low point for 2017
• 12 operated rigs in Lower 48 in April• 5 Eagle Ford, 4 Bakken and 3 Permian
• Alaska GMT 1 ice roads completed and 1H NEWS drillsite facility ready for startup
• Completed 3D seismic at GMT Unit / Willow in Alaska
1Q17 Operational Highlights – 1 of 2
81 1Q16 production represents Lower 48 unconventional production adjusted for the 1Q16 impact from asset sales of 2 MBOED.Lower 48

• Surmont production curtailed by third-partyfacility fire
• Commissioning work underway at Clair Ridgeproduction platform
• Aasta Hansteen spar sailaway achieved in April
• APLNG Train 1 turnaround completed in April;loaded 27 LNG cargoes in 1Q
• Successful appraisal well at Barossa
• Malikai production exceeding expectations
1Q17 Operational Highlights – 2 of 2
9Malikai

2017 Operational Outlook
10
APLNG
1 Post-Transaction figures are presented on a pro forma basis as if the Canadian and San Juan transactions were completed on Jan. 1, 2017. Canadian transaction closing estimated in 2Q17; San Juan transaction closing estimated in 3Q17. Adjusted operating cost is a non-GAAP measure. A non-GAAP reconciliation is available on our website.Production excludes Libya.
• Underlying business exceeding expectations
• Expect Lower 48 unconventional exit rate of~250 MBOED
• Turnarounds scheduled in APME, Europe andAlaska in 2Q and 3Q
• 2017 Analyst & Investor Meeting set for Nov. 8,2017 in New York
YTD Announced Transaction Metrics
Pre-Transactions Post-Transactions Pro Forma1
5.0 5.0
6.0 5.3
1,495-1,535
1,115-1,155
1,540-1,570
1,145-1,175
CAPITAL ($B)
ADJUSTED OPERATING
COSTS($B)
2Q17 PRODUCTION
(MBOED)
FY17 PRODUCTION
(MBOED)

low breakeven price
transformation
�exibility
acceleration
di�erentiation low cost of supply
SPIRIT Values
smart growth
superior returns
Appendix

YTD Announced Transaction Metrics
Full-Year 2017 Estimated Disposition Impacts
13
1 Post-Transaction Pro Forma figures are presented on a pro forma basis as if the Canadian and San Juan transactions were completed on Jan. 1, 2017. Canadian transaction closing estimated in 2Q17; San Juan transaction closing estimated in 3Q17. 2 Upon announcement of the sale transactions, depreciation has been stopped for the Canadian assets and the San Juan Basin assets.Adjusted operating cost, adjusted corporate segment net loss, and adjusted exploration dry hole and leasehold impairment expense are non-GAAP measures. A non-GAAP reconciliation is available on our website.Guidance excludes special items. Production guidance excludes Libya and is based on $50/bbl Brent.
Full-Year 2017 Production 1,540-1,570 MBOED 280 MBOED 115 MBOED 1,145-1,175 MBOED
2Q17 Production 1,495-1,535 MBOED 265 MBOED 115 MBOED 1,115-1,155 MBOED
Adjusted Operating Costs $6.0B $0.4B $0.3B $5.3B
Capital Expenditures $5.0B -- -- $5.0B
DD&A2 $8.0B $0.5B $0.4B $7.1B
Adjusted Corporate Segment Net Loss $1.2B -- -- $1.0B
Adjusted Exploration Dry Hole and Leasehold Impairment Expense $0.45B -- -- $0.45B
Pre-Transactions Canadian Disposition
San Juan Basin Disposition
Post-Transactions Pro Forma1

2017 Annualized Net Income Sensitivities
14
• Crude• Brent/ANS: $100-120MM for $1/BBL change• WTI: $30-40MM for $1/BBL change• WCS¹: $35-45MM for $1/BBL change
• North American NGL• Representative blend: $5-10MM for $1/BBL change
• Natural Gas• Henry Hub: $65-75MM for $0.25/MCF change• International gas: $10-15MM for $0.25/MCF change
¹ WCS price used for the sensitivity represents a volumetric weighted average of Shorcan and Net Energy indices.Pro forma figures are shown as if the transactions were completed on Jan. 1, 2017. Canadian transaction closing expected in 2Q17; San Juan transaction closing expected in 3Q17.The published sensitivities above reflect annual estimates and may not apply to quarterly results due to lift timing/product sales differences, significant turnaround activity or other unforeseen portfolio shifts in production. Additionally, the above sensitivities apply to a range of commodity price fluctuations as of May 2, 2017, but may not apply to significant and unexpected increases or decreases.
$45-$65/BBL Brent
Full-Year Pre-Transactions Full-Year Post-Transactions Pro Forma
• Crude• Brent/ANS: $100-120MM for $1/BBL change• WTI: $30-40MM for $1/BBL change• WCS¹: $5-10MM for $1/BBL change
• Does not incorporate contingent payment ofCA$6MM quarterly for every CA$1 WCS price aboveCA$52/BBL
• North American NGL• Representative blend: $5-10MM for $1/BBL change
• Natural Gas• Henry Hub: $20-30MM for $0.25/MCF change• International gas: $10-15MM for $0.25/MCF change

2017 Annualized Cash Flow Sensitivities
• Crude• Brent/ANS: ~$105-115MM for $1/BBL change• WTI: ~$50-60MM for $1/BBL change• WCS: ~$10-15MM for $1/BBL change
• Lower 48 NGL• Representative Blend: ~$10-15MM for $1/BBL change
• Natural Gas• Henry Hub: ~$95-105MM for $0.25/MCF change• Int’l Gas: ~$20-25MM for $0.25/MCF change
1 Representative of cash from operating activities (CFO) within Equity Affiliates, may not all be distributed. Assumes WCS moves proportionally to Brent. Contracted LNG within equity affiliates is subject to a 3-month pricing lag. Pro forma figures shown as if the transactions were completed on Jan. 1, 2017. Canadian transaction closing expected in 2Q17; San Juan transaction closing expected in 3Q17.The published sensitivities above reflect annual estimates and may not apply to quarterly results due to lift timing/product sales differences, significant turnaround activity or other unforeseen portfolio shifts in production. Additionally, the above sensitivities apply to a range of commodity price fluctuations as of May 2, 2017, but may not apply to significant and unexpected increases or decreases.
CFO from Consolidated Operations ($45-$65/BBL Brent)
CFO from Equity Affiliates1 ($50-$65/BBL Brent)• Expect distributions from equity affiliates at >$50/BBL• $1/BBL movement in Brent: ~$55-65MM
15
Full-Year Pre-Transactions
• Crude:• Brent/ANS: ~$105-115MM for $1/BBL change• WTI: ~$50-60MM for $1/BBL change• WCS: ~$10-15MM for $1/BBL change
• Lower 48 NGL• Representative Blend: ~$10-15MM for $1/BBL change
• Natural Gas• Henry Hub: ~$35-45MM for $0.25/MCF change• Int’l Gas: ~$20-25MM for $0.25/MCF change
CFO from Consolidated Operations ($45-$65/BBL Brent)
CFO from Equity Affiliates1 ($50-$65/BBL Brent)• Expect distributions from equity affiliates at >$50/BBL• $1/BBL movement in Brent: ~$25-35MM
Full-Year Pro Forma Post-Transactions
Net Cash Flow from Contingent Payment• CA$6MM quarterly for every CA$1 WCS price above CA$52/BBL