regional dimensions of emerging labour shortage in rubber
TRANSCRIPT


NRPPD Discussion PaperNRPPD Discussion PaperNRPPD Discussion PaperNRPPD Discussion PaperNRPPD Discussion Paper
2727272727
REGIONAL DIMENSIONS OF EMERGING
LABOUR SHORTAGE IN RUBBER
PLANTATION SECTOR IN KERALA:
AN EXPLORATORY ANALYSIS
P. K. Viswanathan
2013


REGIONAL DIMENSIONS OF EMERGING LABOURREGIONAL DIMENSIONS OF EMERGING LABOURREGIONAL DIMENSIONS OF EMERGING LABOURREGIONAL DIMENSIONS OF EMERGING LABOURREGIONAL DIMENSIONS OF EMERGING LABOUR
SHORSHORSHORSHORSHORTTTTTAAAAAGE IN RUBBER PLANTGE IN RUBBER PLANTGE IN RUBBER PLANTGE IN RUBBER PLANTGE IN RUBBER PLANTAAAAATION SECTTION SECTTION SECTTION SECTTION SECTOR IN KERALA:OR IN KERALA:OR IN KERALA:OR IN KERALA:OR IN KERALA:
AN EXPLORAAN EXPLORAAN EXPLORAAN EXPLORAAN EXPLORATTTTTORORORORORY Y Y Y Y ANANANANANALALALALALYSISYSISYSISYSISYSIS
PPPPP.K. V.K. V.K. V.K. V.K. Viswanathaniswanathaniswanathaniswanathaniswanathan
2013

ABSTRAABSTRAABSTRAABSTRAABSTRACTCTCTCTCT
The unparalleled dynamism cast by the expansion of rubber in
Kerala spearheaded by the smallholder sector has become severely
challenged especially since the late 1990s in view of the emergent
labour shortage, characterized by the paucity of skilled rubber tappers
in both the smallholding as well as the plantation sectors. Labour
shortage, especially of rubber tappers in the dominant rubber
smallholding sector has become a serious issue in recent years, in view
of several reasons, such as: (a) rise in area under rubber operated by
smallholders along with a corresponding rise in rubber tapped area; (b)
the inertia among younger generations to take up rubber tapping as an
economic activity; (c) almost negligible presence and active
participation of women in rubber tapping and related activities; (d)
ageing of the existing labour force engaged in tapping job, etc. More
importantly, a serious outcome of the emerging tapper shortage in Kerala
has also been manifest in terms of the growing syndrome of ‘multiplegrower dependence of tappers’ in the traditional rubber growing regions
of Kerala. Though there have been a few attempts by researchers to
bring out the emerging labour management issues confronting the rubber
smallholdings and estate sectors in the state in the context of the market
uncertainties in recent years, there has been hardly any serious attempt
to understand the crisis in the rubber labour market in the context of the
emergent tapper shortage.
In this regard, this paper is an attempt in this direction with the
objectives to: (a) examine the nature, magnitude and causes of tapping
labour scarcity in rubber sector across the three rubber growing regions
of Kerala; (b) understand the strategies and actions adopted by the rubber
producers (large planters and small holders) and other stakeholders in
the rubber sector to address the tapper shortage problems across regions;
and (c) discuss the challenges, critical issues as well as the long-term
implications of tapper shortage on the sustainability of small holder
rubber production system in Kerala and bring out the imperatives of
policy and institutional strategies.

1. Introduction1. Introduction1. Introduction1. Introduction1. Introduction
The agrarian landscape of Kerala has undergone tremendous
transformation over the past 5 to 6 decades as caused by several socio-
economic and political factors, as widely acknowledged by researchers
while tracing the development experience of the state. One of the critical
aspects of the agrarian transformation in the state has been the persistent
decline in area under food crops owing to the expansion in area under
commercial crops, dominated by plantation crops, particularly, rubber.
The magnitude of decline in area under food crops has been quite
spectacular in the 1980s through 2000s and the share of food crops had
reached the lowest level at 16% of the gross cropped area of the state by
2009-10 while the share of area under commercial crops reached at 67%
(Viswanathan, 2012).
Apparently, one of the serious outcomes of the agrarian
transformation in the state was the virtual disintegration of the agriculture
labour market as caused by the massive exodus of farm labourers from
the rural labour market. The collapse of the rural labour market, as caused
by the decline in the labour intensive food crop (mainly paddy)
production activities had resulted in displacement of labour1 on a massive
scale. Arguably, the paradigm shift to commercial crops such as rubber
and coconut in Kerala has been predominantly guided by the unique
labour saving advantage (besides the relative profitability and
institutional support mechanisms) that these crops could claim over the
staple food crop, viz., rice grown in the state.
The resultant dynamics in the agricultural labour market in Kerala
has been widely held in terms of a persistent dichotomy of labour

6
shortage in the midst of labour abundance2. Apparently, there emerged
a situation of acute labour shortage for performing the traditional farm
operations in the state, in spite of high wage rates3. This dynamics of the
rural labour market in the state has triggered serious debates in the
academic and policy circles during the 1970s through 1990s with some
scholars (Nair, 1997; Nair 1999) narrating this paradox of ‘labour scarcity
in an avowedly labour surplus economy’ as something unique and thus
questioning the stylized theories [based on assumptions of skewed
distribution of land and predominance of annual crops] of labour market
dynamics in the larger Indian context. On the other hand, others (such as
Kannan, 1998; 1999) noted that the rural labour market dynamics has
undergone several twists and turns following the crop shift overtly
characterized by the predominance [and proliferation] of small and
marginal producers with an irreversible dependence on the perennial
cash crops, mainly rubber. The apparent dilemmas in the rural labour
market in the state have been reported (Kannan, 1998) as primarily
related to: (a) issues of choice of technology amidst rising wage costs
for labour-intensive farming activities; and (b) the glaring mismatch
between demand for and supply of labour in the context of the changing
job expectations and aspirations of the younger generations.
While the labour market dilemmas have continued hampering
the prospects of the food crops production in the state, the distinct
‘labour saving advantage’ prompted the expansion of area under rubber
and coconut. To illustrate, in terms of relative share in total cropped
area, the combined share of rubber and coconut had increased from 27%
during 1960-61 to almost 49% during 2009-10. Interestingly, it may be
seen that between the two crops, rubber had made a greater impact on
the agrarian landscape of the state as growth in rubber area was much
faster and consistent than coconut over time. For instance, while the
relative share of coconut in total cropped area has increased only by
7.8% points from 21% during 1960-61 to 29% during 2010-11, that of
rubber had increased by more than 14% from a mere 6% to almost 21%

7
during the same period. This claim is further strengthened by the fact
that rubber contributed almost 53% of the gross value of agricultural
output in Kerala (Rs. 16236.5 Crores) as compared to 17% from coconut
during 2010-11 (GoK, 2011). The unparalleled increase in the share of
rubber production in Kerala also earned it the distinction of becoming
the monopoly producer in the country with a predominant share of
almost 91% in rubber production at the national level (GoK, 2010).
1.1. The Context and Objectives1.1. The Context and Objectives1.1. The Context and Objectives1.1. The Context and Objectives1.1. The Context and Objectives
However, the unperturbed dynamism cast by the expansion of
rubber in Kerala spearheaded by the smallholder sector has become
severely challenged especially since the late 1990s in view of the
emergent labour shortage, characterized by the paucity of skilled rubber
tappers in both the smallholding as well as the plantation sectors4 On
the one hand, the labour shortage in the organised rubber plantation/
estate sector has been caused mainly by the labour displacing policies
adopted by the rubber planters as a crisis management strategy5 in the
event of the plantation crisis in the late 1990s. On the other hand, labour
shortage, especially of rubber tappers in the dominant rubber
smallholding sector has become a serious issue in recent years, in view
of several reasons, such as: (a) rise in area under rubber operated by
smallholders along with a corresponding rise in rubber tapped area; (b)
the inertia among younger generations to take up rubber tapping as an
economic activity; (c) almost negligible presence and active
participation of women in rubber tapping and related activities; (d)
ageing of the existing labour force engaged in tapping job, etc. More
importantly, a serious outcome of the emerging tapper shortage in Kerala
has also been manifest in terms of the growing syndrome of ‘multiple
grower dependence of tappers’ in the traditional rubber growing regions
of Kerala (Viswanathan, et al., 2003).
Thus, the severity of the problem of labour (tapper) shortage has
been on the rise and assumed an alarming proportion in almost all the

8
rubber growing areas in Kerala in recent years. Though there have been
a few attempts by researchers to bring out the emerging labour
management issues confronting the rubber smallholdings and estate
sectors in the state in the context of the market uncertainties in recent
years (Viswanathan, et al., 2003; Mohanakumar and Chandy, 2005;
Viswanathan and Shah, 2009; 2012a; Chandy et al., 2010), there has
been hardly any serious attempt to understand the crisis in the rubber
labour market in the context of the emergent tapper shortage. Of course,
a recent paper by George (2012) examines the multifaceted dimensions
of labour shortage by contextualizing tapper shortage scenario against
the backdrop of the specific characteristics of the tapping labour market.
This paper provides a perspective about addressing the problem of tapper
shortage in terms of policy and institutional interventions. However,
there is a perceptible gap in empirical understanding about the unfolding
labour market dynamics in the rubber production sector across regions
of Kerala in recent years which also coincided with unforeseen changes
in the production relations, market conditions, prices and wages.
Given this, it becomes important to explore the veracity of factors
causing tapper shortage in rubber sector in Kerala along with their
regional dimensions, if any. Understanding the regional dimensions of
tapper shortage especially in the smallholder rubber sector in Kerala
becomes contextually relevant from analytical as well as policy
perspectives in view of the regional differences in labour use as well as
the production relations as evolved in these regions over time. For one,
it has been observed that among the south, central and northern regions
of Kerala, there are notable differences in labour use for tapping across
farm size classes. Reportedly, the dependence on hired labour for rubber
tapping was as high as 94% in South Kerala and 87% in Central Kerala
as compared to only 44% in North Kerala (George, K.T, 1999). This
point underscores that the magnitude of tapper shortage is quite likely
to be more alarming in the Central and Southern Kerala regions than the
Northern region. However, this calls for further evidences to reflect upon:

9
(a) the regional differences in shortage of tapping labour as being
perceived and experienced by the rubber growers; and (b) the initiatives
at the local level along with institutional and policy interventions by
the Rubber Board to address labour/ tapper shortage from a long term
perspective.
This paper is an attempt in this direction with the following
objectives to:
1. Examine the nature, magnitude and causes of tapping labour
scarcity in rubber sector across the three rubber growing regions
of Kerala;
2. Understand the strategies and actions adopted by the rubber
producers (large planters and small holders) and other stakeholders
in the rubber sector to address the tapper shortage problems across
regions; and
3. Discuss the challenges, critical issues as well as the long-term
implications of tapper shortage on the sustainability of small
holder rubber production system in Kerala and bring out the
imperatives of policy and institutional strategies.
1.2. Data and Methodology1.2. Data and Methodology1.2. Data and Methodology1.2. Data and Methodology1.2. Data and Methodology
For analysis, this paper uses both the secondary and primary data
sources. It uses most of the available empirical literature and
documentation on aspects of production relations in rubber plantations
and smallholding sectors with particular emphasis on the dynamics of
the changing labour market and labour management regimes in recent
years. While doing so, the paper largely draws on the empirical data and
analysis presented in the earlier studies undertaken by the author
(Viswanathan et al., 2003; Viswanathan and Shah, 2009; 2012a). To
supplement and strengthen the analysis based on the previous studies,
the paper also uses cross sectional survey data gathered from various

10
stakeholders in the rubber sector, viz., (a) rubber planters (estates); (b)
small growers; (c) labourers, especially, rubber tappers; (d) officials and
extension staff from the Rubber Production Department of the Rubber
Board; (e) the Association of Planters, Kerala (APK); (f) Rubber Producers’
Societies (RPSs); etc.
As noted earlier, the analysis in the paper approaches the problem
of tapper shortage from a regional perspective, in which, the major rubber
growing districts of Kerala have been classified into three regions
following the geographical classification commonly used by researchers.
Accordingly, for secondary data analysis, it considers Southern region
as consisting of Trivandrum, Kollam and Alapuzha districts; Central
region covering Kottayam, Pathanamthitta, Idukki, Ernakulam and
Thrissur districts; and Northern region comprising Palakkad,
Malappuram, Wyanad, Kozhikode, Kannur and Kasargod districts.
To ably capture the regional dimensions of the problem, the
study followed a three step procedure for the primary survey. In the
first step, a structured brief questionnaire was used to gather some
crucial data regarding the broad macro level trends, such as: (a) total
area under rubber cultivation; (b) average holding size; (c) tapped
area; (d) replanted/ new planted area; (e) spread of RPSs; (f) distribution
(physical and financial) of labour welfare schemes); (g) gender aspects
of training/ skill formation in rubber tapping; (h) differences in wages
of tappers as well as general workers; (i) perceptions and impressions
about tapper shortage; (j) initiatives taken by the RPSs; and (k) policy
and institutional interventions adopted by the Rubber Board to address
the problem of tapper shortage. Data collection in this regard was also
corresponded with interactions with the extension staff and officials
of the Rubber Production Department of the Rubber Board at various
regional offices.
In the second step, a brief survey was undertaken among a select
number of growers and rubber tappers to get a feel of their impressions

11
and experiences about the emerging labour shortage issues. In the third
step, discussions and interactions were held with the members of the
RPSs in order to get an overall perspective about the labour/ tapper
shortage and the responses/ initiatives taken by them to address the
problems at the local level.
1.3. Conceptual Framework1.3. Conceptual Framework1.3. Conceptual Framework1.3. Conceptual Framework1.3. Conceptual Framework
This paper is organised into five sections including the
introductory section. Section 2 provides a brief overview of the rubber
smallholder sector in Kerala and its regional dimensions of growth
and performance with a view to contextualize the problem of tapper
shortage and its magnitude. Section 3 examines the intensity of the
problem of tapper shortage as experienced by the smallholders in the
various rubber growing regions of Kerala. This section also explores
the issue of shortage as perceived and experienced by the larger rubber
estates. Section 4 discusses the measures and actions adopted by the
rubber producers and other stakeholders to manage the problem of
tapper shortage and their outcomes across regions. In conclusion, we
discuss some critical issues confronting the sustainability of
smallholder rubber production system in Kerala in the context of the
emerging challenges in the labour market. It also brings out the
imperatives of policy and institutional strategies needed to sustain
the economic dynamism of the smallholder rubber sector in Kerala’s
specific context from a long-term perspective.
This paper uses the conceptual definition for the problem of tapper
shortage as ‘techno-economic scarcity manifested in terms of both
physical and economic scarcity of tappers, wherein more number of
rubber growers operate with less number of tappers (skilled or unskilled)
in a given region’. In a techno-economic sense, tapper scarcity may be
defined as physical and economic scarcity of tappers measured in terms
of the gap in demand for and supply of skilled tappers.

12
Chart 1: Chart 1: Chart 1: Chart 1: Chart 1: TTTTTapper scarcity in rubber smallholder sector: conceptualapper scarcity in rubber smallholder sector: conceptualapper scarcity in rubber smallholder sector: conceptualapper scarcity in rubber smallholder sector: conceptualapper scarcity in rubber smallholder sector: conceptualframeworkframeworkframeworkframeworkframework
Chart 1 presents the conceptual framework used in examining
the problem of tapper scarcity in smallholder sector in Kerala, the
management strategies adopted by the smallholders in co-ordination
with agencies that support them (RPSs, Rubber Board) and the likely or
potential outcomes of such strategies and management interventions in
reducing (if not ameliorating) the tapper shortage.
2.2.2.2.2. Growth of Rubber Economy of Kerala and its RegionalGrowth of Rubber Economy of Kerala and its RegionalGrowth of Rubber Economy of Kerala and its RegionalGrowth of Rubber Economy of Kerala and its RegionalGrowth of Rubber Economy of Kerala and its RegionalDimensionsDimensionsDimensionsDimensionsDimensions
At the outset, an analysis of the current status of the rubber
production sector and its profile is important to understand the relative
significance of the sector in the regional economy of Kerala. As is evident,
Kerala’s agriculture sector had undergone tremendous transformation
over time, characterised by a major shift from food crops (mainly paddy)
to commercial crops, dominated by two major crops, viz., coconut and
rubber (Table 1).

13TTTT T
able
1:
Lon
g-te
rm t
rend
s in
cro
ppin
g pa
tter
n in
Kab
le 1
: L
ong-
term
tre
nds
in c
ropp
ing
patt
ern
in K
able
1:
Lon
g-te
rm t
rend
s in
cro
ppin
g pa
tter
n in
Kab
le 1
: L
ong-
term
tre
nds
in c
ropp
ing
patt
ern
in K
able
1:
Lon
g-te
rm t
rend
s in
cro
ppin
g pa
tter
n in
Ker
ala,
196
0-61
– 2
011-
12 (
Are
a -
‘000
ha)
eral
a, 1
960-
61 –
201
1-12
(A
rea
- ‘0
00 h
a)er
ala,
196
0-61
– 2
011-
12 (
Are
a -
‘000
ha)
eral
a, 1
960-
61 –
201
1-12
(A
rea
- ‘0
00 h
a)er
ala,
196
0-61
– 2
011-
12 (
Are
a -
‘000
ha)
Mai
n C
rops
1961
-62
% s
hare
1980
-81
% s
hare
2001
-02
% s
hare
2011
-12
% s
hare
1.P
addy
753.
032
.280
1.7
28.0
322.
410
.720
8.2
7.8
2.C
ocon
ut50
5.0
21.6
651.
422
.890
5.7
30.0
820.
930
.8
3.R
ubbe
r13
3.1
5.7
237.
88.
347
515
.753
9.6
20.3
4.Ta
pioc
a23
6.8
10.1
245
8.6
111.
23.
774
.52.
8
5. C
offe
e18
.80.
857
.62.
084
.82.
884
.43.
2
6.Te
a37
.41.
636
.21.
336
.91.
237
.0
Sub
-Tot
al16
84.2
71.9
2029
.670
.919
3664
.117
64.6
66.3
GC
A23
41.0
100.
028
62.0
100.
030
21.7
100.
026
61.8
100.
0
Not
e: G
CA
– G
ross
Cro
pped
Are
a (‘
000
ha)
Sour
ce: A
utho
r’s
com
pila
tion
from
Eco
nom
ic R
evie
w (
GO
K);
Sta
tistic
s fo
r Pl
anni
ng (
GO
K).

14
Accordingly, the area under paddy had declined almost three times
over time from 7.53 lakh ha during 1961-62 to 2.08 lakh ha during
2011-12. In terms of relative share, the share of paddy under cultivation
had drastically declined from 32% to less than 8% over the five decades.
In contrast, the area under rubber cultivation had increased by more
than four times from 1.33 lakh ha to 5.39 lakh ha with an increase in its
relative share from 5.7% to 20% during the period. The area under
coconut though increased over time, there was a notable decline in its
area by 2011-12 as compared to the area during 2001-02. It may be
important to note that the simultaneous decline in the share of paddy
and tapioca in the total cropped area by more than 70% over time could
be considered as an outcome of the deliberate choice made by the farmers
in Kerala to switch over to the less labour intensive as well as high value
crops, such as coconut, rubber, coffee, tea, etc. Interestingly, the combined
share of coconut and rubber had increased by almost two times from
27% during 1961-62 to 51% during 2011-12.
The phenomenal increase in area under rubber cultivation as
observed at the state level has also been visible all across the districts
with rubber occupying a dominant status in the cropping pattern and
gross value of output realized from agriculture as evident from Table 2.
From a comparative perspective, it may be interesting to note that though
rubber has only a second position in gross cropped area in most of the
districts, it commands number one position in terms of gross value of
output in 11 (78%) of the 14 districts. Among the districts, the share of
rubber in gross value of output has been as high as 79% in Kottayam,
followed by Pathanamthitta (73%), Ernakulam (66%) and Kannur (51%).
At the state level, though rubber occupies only 20%, its share in gross
value of output has been 46%. More importantly, the combined share of
rubber and coconut in the gross cropped area and gross value of output
has been over 60% in 10 of the 14 districts with districts with five
districts (Kottayam, Pathanamthitta, Kozhikode, Ernakulam and Kannur)
showing a combined share of more than 70% in gross value of output.

15TTTT T
able
2: R
elat
iab
le 2
: Rel
ati
able
2: R
elat
iab
le 2
: Rel
ati
able
2: R
elat
i vvvv ve
shar
e of
rubb
er a
nd c
ocon
ut in
gro
ss c
ropp
ed a
rea
and
gros
s v
e sh
are
of ru
bber
and
coc
onut
in g
ross
cro
pped
are
a an
d gr
oss
ve
shar
e of
rubb
er a
nd c
ocon
ut in
gro
ss c
ropp
ed a
rea
and
gros
s v
e sh
are
of ru
bber
and
coc
onut
in g
ross
cro
pped
are
a an
d gr
oss
ve
shar
e of
rubb
er a
nd c
ocon
ut in
gro
ss c
ropp
ed a
rea
and
gros
s v a
lue
of o
utpu
t in
Kal
ue o
f ou
tput
in K
alue
of
outp
ut in
Kal
ue o
f ou
tput
in K
alue
of
outp
ut in
Ker
ala,
dis
tric
t-w
ise
eral
a, d
istr
ict-
wis
eer
ala,
dis
tric
t-w
ise
eral
a, d
istr
ict-
wis
eer
ala,
dis
tric
t-w
ise
Dis
tric
tSh
are
in G
ross
cro
pped
are
a, 2
011-
12 (
%)
Shar
e in
gro
ss v
alue
of
outp
ut, 2
008-
09 (
%)
Rub
ber
Coc
onut
Rub
ber
+ c
ocon
utR
ubbe
rC
ocon
utR
ubbe
r +
coc
onut
1.T
riva
ndru
m20
.146
.166
.241
.426
.467
.82.
Kol
lam
23.4
35.1
58.5
42.6
23.3
65.9
3.P
atha
nam
thit
ta49
.415
.865
.272
.66.
779
.34.
Ala
puzh
a4.
135
.940
.011
.533
.645
.15.
Kot
taya
m54
.313
.567
.879
.55.
885
.36.
Iduk
ki14
.56.
220
.734
.43.
137
.57.
Ern
akul
am34
.426
.961
.366
.110
.576
.68.
Thr
issu
r8.
549
.558
.028
.834
.663
.49.
Pal
akka
d12
.220
.032
.232
.914
.947
.810
. M
alap
pura
m16
.745
.362
.036
.030
.866
.811
. K
ozhi
kode
10.3
61.7
72.0
32.2
46.0
78.2
12.
Wya
nad
6.1
6.1
12.2
11.8
2.7
14.5
13. K
annu
r20
.439
.960
.350
.919
.270
.114
. Kas
argo
d21
.739
.661
.335
.921
.857
.7S
tate
20.3
30.8
51.1
45.8
17.8
63.6
Sour
ce: G
OK
, Eco
nom
ic R
evie
w 2
011;
DE
S, A
gric
ultu
ral
Stat
istic
s, 2
011.

16
Table 3 presents the regional dimensions of the rubber sector in
Kerala with respect to the region-wise composition of area and production
of rubber. It appears that the Central region covering 5 districts had a
clear dominance in area and production (50% each) until 1990-91, which
declined thereafter owing to the expansion of rubber cultivation in the
northern region. Thus, while the relative shares of northern districts in
area and production had increased, the other two regions reported a
drop in relative share in area and production during the last two decades.
Obviously, this trend suggests that the pace of expansion of rubber
area and production in the Central region had experienced a setback in
the recent decades owing to the scarcity of suitable land for further
expansion. In contrast, the Northern region has been showing an increase
in area and production, mainly due to rubber expansion into newer
areas, even replacing less remunerative crops, such as coconut, arecanut,
cashew, etc, as recently observed in the region. The trends also bring out
that the traditional rubber growing areas in the Southern and Central
Kerala regions have already been reeling under a crisis posed by the
constraints of land availability for rubber cultivation and the scope for
further expansion is only left with the areas available for replanting.
3. 3. 3. 3. 3. TTTTTapper Shortage: Perceptions and Realityapper Shortage: Perceptions and Realityapper Shortage: Perceptions and Realityapper Shortage: Perceptions and Realityapper Shortage: Perceptions and Reality
It is in this critical juncture that the crisis in the labour market in
the rubber sector manifested in the form of tapper shortage assumes
added significance. From a logical standpoint, the problem of labour
shortage in general, and tapper shortage in particular in Kerala, needs a
proper investigation and thorough understanding especially in a context
when the state is historically known for the contradictions in the rural
labour market characterized by high levels of labour militancy (among
the organised labour class) on the one hand and a docile labour
community (governed by traditional patron client relations) on the other.
Apparently, rubber sector in Kerala has been one such sector that
manifested the continued presence of the two contrasting scenarios in

17TTTT T
able
3:
able
3:
able
3:
able
3:
able
3:
TTTT Tre
nds
in r
ere
nds
in r
ere
nds
in r
ere
nds
in r
ere
nds
in r
e gio
n-w
ise
com
posi
tion
in
area
and
pro
duct
ion
of r
ubbe
r in
Kgi
on-w
ise
com
posi
tion
in
area
and
pro
duct
ion
of r
ubbe
r in
Kgi
on-w
ise
com
posi
tion
in
area
and
pro
duct
ion
of r
ubbe
r in
Kgi
on-w
ise
com
posi
tion
in
area
and
pro
duct
ion
of r
ubbe
r in
Kgi
on-w
ise
com
posi
tion
in
area
and
pro
duct
ion
of r
ubbe
r in
Ker
ala
eral
aer
ala
eral
aer
ala
Per
iod
Shar
e in
Rub
ber A
rea
(%)
Shar
e in
Rub
ber
Prod
uctio
n (%
)
Sou
thC
entr
alN
orth
All
Ker
ala
Sou
thC
entr
alN
orth
All
Ker
ala
Ker
ala
Ker
ala
Ker
ala
(‘00
0 ha
) K
eral
aK
eral
a K
eral
a (
‘000
Ton
nes)
1970
-71
22.7
48.6
28.8
198.
4224
.751
.324
.00
86.7
7
1990
-91
24.7
49.5
25.8
407.
8225
.650
.823
.57
307.
52
2009
-10
23.0
43.1
33.9
525.
4123
.845
.330
.83
745.
51
Sour
ce:
Com
pile
d fr
om I
ndia
n R
ubbe
r St
atis
tics,
Rub
ber
Boa
rd (
vari
ous
issu
es).

18
the labour market. For instance, the existence of the large scale rubber
plantations (estate sector) over the past 6-7 decades has been contingent
upon the sustained reproduction of the plantation workers under
conditions of servitude and sub-optimal living conditions in a large
number of cases. Similarly, the dominant smallholder sector also
survived based on a docile and more disciplined labour force which
was least organised on political or caste lines for strengthening their
stake or visibility in the labour market. Thus, it may be observed that
the foundations of the dynamic rubber production sector in Kerala
have been strongly built on a proactive labour market that co-existed
side by side in the village settings, though with less interactions in
between.
Given this scenario, it might be quite logical to examine ‘what
would have triggered the crisis in the labour market as manifested in
the form of tapper shortage’ in recent years? Apparently, this is a
tricky issue, as there are several dimensions to the problem of tapper
shortage with the possibility of several explanations that are context
or region-specific. Thus, a realistic explanation to the problem of
tapper shortage inter alia would call for addressing some critical
questions, such as:
a) Does there exist tapper shortage in Kerala in an absolute sense?;
b) If tapper shortage exists, what caused tapper shortage in the state?;
c) How tapper shortage is manifested in both the smallholder and
plantation sectors across rubber growing regions?;
d) How rubber smallholders and planters have responded to the
emergent scenario of tapper shortage?;
e) What have been the short-term responses as well as long-term
strategies/ initiatives adopted by rubber growers/ planters, Rubber
Producers’ Societies (RPSs) and the Rubber Board to address the
problem?; and

19
f) How far these responses and strategies would help sustain the
economic dynamism of the rubber production sector in Kerala
from a long-term perspective?
It is widely apprehended that rubber production sector in Kerala
is confronted with the problem of tapper shortage and it has been
gradually making inroads into the entire rubber growing regions raising
serious concerns and new challenges about the future of rubber
cultivation. As reports after reports reconfirm tapper shortage as a reality
in traditional rubber growing areas in Kerala, the major stakeholders in
the rubber sector, viz., rubber growers/ rubber planters, rubber producers’
societies (RPSs) and the Rubber Board (RB) have been concerned about
the emerging scenario and trying to face the harsh reality through various
labour tying arrangements and tapper retaining mechanisms. It may be
noted that Kerala has been experiencing rubber tapper shortage over the
past two decades or so due to a variety of reasons, some of which are
quite well known and explained by few authors (Viswanathan, et al.,
2003; George, 2012).
In techno-economic sense, tapper shortage is manifest in terms of
the physical scarcity of tappers as measured by the gap in demand for
and supply of tappers across the rubber growing areas in the state.
However, in the absence of authentic data on the demand for and supply
of rubber tappers at the state, district or sub-district (taluk) and even at
the local village/ RPS levels, it may be somewhat difficult to reflect on
the magnitude and extent of tapper shortage. Bearing this in mind, we
have tried to arrive at a rough estimation about the physical scarcity of
tappers based on the information gathered from the 22 RPSs surveyed
during the study. Tapper requirement was estimated based on a critical
minimum number of 1.7 rubber tappers required6 for tapping a hectare
of rubber plot with a tree density of 450-475 trees. The figures for tapper
shortage were estimated by taking the difference between tappers
required and available as per the information furnished by the 22 RPSs

20
surveyed. Accordingly, the 22 RPSs reported about the approximate
number of rubber tappers available under its jurisdiction.
Table 4 presents the more realistic scenario of emergent tapper
shortage as reported by the 22 RPSs and it reveals that physical scarcity
of tappers is as high as 61% with some regional differences.
TTTTTable 4:able 4:able 4:able 4:able 4: Extent of physical scarcity of tappers across regions inExtent of physical scarcity of tappers across regions inExtent of physical scarcity of tappers across regions inExtent of physical scarcity of tappers across regions inExtent of physical scarcity of tappers across regions inKerala, 2012Kerala, 2012Kerala, 2012Kerala, 2012Kerala, 2012
Region Growers Grower/ Number of Tapper(#) Tapper tappers (#) Shortage
ratio (%)$
Required Available
1. Nedumangad 748 1.64 1052 457 56.6
2. Kottarakkara 255 1.82 262 140 46.5
3. Thodupuzha 538 3.16 748 170 77.3
4. Pala 635 2.70 864 235 72.8
5. Pathanamthitta 250 3.57 340 70 79.4
6. Thrissur 799 2.44 808 327 59.5
7. Palakkad 175 1.59 230 110 52.1
8. Mannarkad 420 1.37 580 307 47.0
9. Taliparamba 244 1.91 360 128 64.5
10. Nilambur 213 1.07 318 200 37.1
Overall 4277 1.99 5561 2144 61.4
Note: Tapper shortage is estimated by taking the difference between
tappers available and required.
Source: Information gathered from 22 RPSs in the select regions
As per this, physical scarcity of tappers is very high in
Pathanamthitta region at 79%, followed by Thodupuzha (77%), Pala

21
(73%), and Taliparamba (65%). While all the 10 regions as presented in
the Table report tapper shortage, the severity of shortage seems to be
somewhat lower in regions, such as Nilambur (37%), Kottarakkara and
Mannarkad (47% each). The extent of tapper scarcity as estimated in the
local areas covered under the RPSs is presented in Figure 1.
Figure 1: Extent of physical tapper scarcity reported across regionsFigure 1: Extent of physical tapper scarcity reported across regionsFigure 1: Extent of physical tapper scarcity reported across regionsFigure 1: Extent of physical tapper scarcity reported across regionsFigure 1: Extent of physical tapper scarcity reported across regionsin Keralain Keralain Keralain Keralain Kerala
However, the estimates of physical scarcity of rubber tappers as
presented above are only a broad indication about tapper scarcity and
need further validation based on more extensive coverage of RPSs and
locations.
One of the most common explanations for the problem of labour
shortage in Kerala can be found in the vast literature subscribing to the
‘disintegration of rural labour market’ argument as discussed above. By
and large, these studies at the regional level (and several others in the
national as well as international contexts) arrive at a consensus that
labour shortage in the rural areas is entirely caused by the retreat of the
able bodied younger generations. Taking a cue from this argument,
tapper shortage in rubber production sector in Kerala could have been
reportedly caused by the sheer lack of interest or even retreat of the
youth from becoming either rubber farmers or rubber tappers.

22
However, this position blaming the youth for their disinterest in
(or retreat from) rubber farming (tapping) and other rubber farming related
activities seems to be only a partial explanation to the problem and it is
certainly prejudiced by the traditional notion of viewing the aspirations
of the youth as antithetical to social progress. In contrast, the emergent
stalemate of tapper shortage in the rubber sector needs to be more
convincingly and logically argued out from an ethical standpoint. The
question needs addressing here is that ‘should the younger generations
be held responsible for the crisis in the labour (including tapping) market
in Kerala’?. In fact, this is a tricky issue and need further explanation in
terms of the changed aspirations of the rural youth in the context of the
dramatic transformation that Kerala experienced over the past few
decades as brought about by the demographic as well as socio-economic
changes, especially, declining family size and educational advancements.
Given this, if the rural youth are least inclined towards participating in
the tapping (or agricultural) labour market, one has to resolve some of
the structural issues constraining the labour market. One such issue is
that: ‘whether policies or institutions governing rubber development in
Kerala have been quite sensitive (and responsive) to this issue by creating
conducive environments (skill development, attractive wages, upward
mobility, etc) that attract increased participation by youth in the labour
market?’. In other words, the issue at stake is that ‘under what conditions
the younger generations (of rubber farmers and rubber tappers) would
participate in the tapping labour market?’. Invariably, this issue requires
an in-depth understanding about the perceptions, value judgments, social
prestige and economic returns that the youngsters consider when it
comes to choosing rubber tapping (or farming) as an economic activity.
Thus, the issue ‘what would motivate the younger generations to
effectively participate in the tapping labour market’ is a highly loaded
question and needs to be examined in the light of the empirical scenario
within which the labour market function currently. This necessitates a
broad understanding of the status of the tapping labour market as

23
attached to the rubber smallholder and plantation sectors in Kerala.
This analysis, in turn, will enable us to draw some useful insights
regarding the eventualities leading to the tightening of the tapping
labour market as arising from the persistent tapper shortage in several
regions of Kerala.
3.1. Labour Market in Rubber Sector and its Composition3.1. Labour Market in Rubber Sector and its Composition3.1. Labour Market in Rubber Sector and its Composition3.1. Labour Market in Rubber Sector and its Composition3.1. Labour Market in Rubber Sector and its Composition
It may be argued that currently, rubber sector in Kerala could
claim to have a dominant share in the total agriculture employment, as
rubber is the single largest crop occupying almost 26% of the net sown
area (NSA) in the state. Rubber has the potential of providing year
round employment, unlike the highly seasonal employment provided
by the food and other commercial crops grown in the state. Though the
labour use intensity of rubber is relatively lower than paddy, the
phenomenal decline in area under rice cultivation alongside the
extremely lower levels of labour absorption in coconut, make rubber as
the largest source of farm sector employment in Kerala.
Of the three plantation crops, viz., tea, rubber and coffee grown in
India, Kerala accounts for almost 73% of the rubber area and 88% of
rubber production. The bi-modal nature of the production structure
composed of the dominant smallholder and the estate based plantation
sectors makes the rubber sector quite unique in the context of Kerala.
Though the relative share of the estate (plantation) sector in rubber area
and production in Kerala had declined substantially over time (currently
less than 10%), the sector still holds a prominent position in terms of
employment of workers in plantations and factories. However, in terms
of livelihood dependence, the smallholder sector has a pre-eminent
position as it supports about 1.19 million rubber producers (Rubber
Board, 2011) and about 0.8 million workers attached to the rubber sector.
Figure 2 presents the trends in five yearly average daily employment in
rubber plantations in India and the five yearly simple annual growth
rates.

24
Figure 3: Figure 3: Figure 3: Figure 3: Figure 3: TTTTTrends in arends in arends in arends in arends in avvvvverage daily emploerage daily emploerage daily emploerage daily emploerage daily employment in rubber sector inyment in rubber sector inyment in rubber sector inyment in rubber sector inyment in rubber sector inIndia, 1972 to 2010India, 1972 to 2010India, 1972 to 2010India, 1972 to 2010India, 1972 to 2010
Note: The figures are five year moving averages of daily employment
(lakhs) in rubber plantations in India and simple annual
percentage growth.
Source: Indian Rubber Statistics, Rubber Board (estimated).
It may be observed that though there was steady increase in
employment levels over the past four decades from 1.45 lakhs during
1972-73 to 4.32 lakhs during 2010-11, growth rates in employment had
shown higher inter-year fluctuations. Though employment growth had
declined during the 1990s, since 2001, the growth has picked up
significantly. It may be surmised that being the largest rubber growing
state in India, almost 70-80% of this employment was created in Kerala.
In terms of workforce composition, the rubber plantation sector
requires massive labour force for production (rubber tapping) and routine
agro-management operations (production workers). They are also
vertically integrated in terms of processing and manufacturing of the
plantation products (factory workers) as well as management workers.
The labour market as attached to the rubber plantation sector also has a

25
distinct gender dimension7, in that almost half of the plantation workers
are women who are also engaged in rubber tapping and processing.
TTTTTable 5: Structure of wable 5: Structure of wable 5: Structure of wable 5: Structure of wable 5: Structure of workforce in rubber plantations in Korkforce in rubber plantations in Korkforce in rubber plantations in Korkforce in rubber plantations in Korkforce in rubber plantations in Kerala, 2012erala, 2012erala, 2012erala, 2012erala, 2012
Category Male Female Total % share Females
(%)
1. Rubber tappers 1460 1288 2748 49.4 46.9
2. General workers 1066 1370 2436 43.8 56.2
3. Other workers@ 317 66 383 6.9 17.2
Total 2843 2724 5567 100.0 48.9
Permanent workers 2256 1655 3911
(79.4) (61.0) (70.2) 42.3
Note: @ Includes supervisors, watchman, drivers, other non-classifiedworkers, etc.
Source: Survey of 15 rubber estates in Kerala (December 2012).
Table 5 presents the structure and gender composition of workforce
engaged in rubber sector as reported by 15 rubber estates in Kerala. It
reveals that almost 47% of the rubber tappers and 56% of the general
workers are women. However, lesser proportion of women workers are
permanent (61%) compared to 79% in case of male workers. Tappers
constitute almost half of the total workforce employed in these plantations.
In sharp contrast to the distinctive structure and gender
composition of the work force in the plantations as discussed above, the
smallholdings sector differs in terms of the dominance of tapping labour,
which accounts for almost 84% of the total labour requirements in the
productive (mature) phase of rubber plantations (Burger et al, 1995).
Since a vast majority (78%) of the rubber holdings belongs to the lowest
size class of below 2 ha, the major farm management operations, like
weeding, fertiliser application, plant protection, etc have been mainly
done by using family labour, though this scenario also had changed in

26
the event of labour shortage. The labour market attached to the
smallholder sector is highly skewed with very low levels (hardly 10%)
of female labour participation (Viswanathan, et al., 2003). This is in
sharp contrast to the female labour dominance in traditional agriculture
as well as higher female labour participation to the extent of 48 per cent
in the large rubber plantations in the state. However, it is observed that
women actively engage in activities, such as latex collection, coagulation
and sheet processing, which is an informal arrangement widely practiced
in the smallholder sector, though women are not separately paid for
such assistances rendered (Viswanathan and Shah, 2012a).
3.2. 3.2. 3.2. 3.2. 3.2. TTTTTapper Shortage, its Origin and Manifestationsapper Shortage, its Origin and Manifestationsapper Shortage, its Origin and Manifestationsapper Shortage, its Origin and Manifestationsapper Shortage, its Origin and Manifestations
Tapping being a skilled activity,8 which requires scientific
extraction of the rubber latex9, involvement of hired tappers has become
necessary and hence, higher levels of engagement of hired tappers have
been reported by even the small and marginal holders throughout Kerala
with some regional variations (George, 1999). To a large extent, the
frequency of rubber tapping, characterized by almost complete adoption
of daily tapping system, has also been quite high in the early decades
(1960s through mid 1990s) of rubber expansion in Kerala.
This system of intensive or high frequency tapping, called, ‘daily
tapping’ required engagement of large number of hired rubber tappers,
as family labour was either not available or a large cross section of
growers were reluctant to do tapping by themselves. In the earlier
decades, the wide scale adoption of daily tapping system was rational
and highly justified, as majority of the rubber farmers were poor and
operated small or marginal holdings. From the perspective of an
individual grower who depends on a hired tapper, it was also essential to
provide round the year employment to him, in the absence of which the
tapper would abandon the grower and join another grower who offers
him daily tapping. However, the extent of adoption of the system of
daily tapping had also declined over time due to the interventions by

27
the Rubber Board, which were quite instrumental in effecting a major
shift in tapping system from the daily tapping system (S2D1) to alternate
daily tapping system (S2D2) especially since the mid 1990s. The wider
adoption of alternate daily tapping system by the small growers was
perhaps the first step in the process of technical innovation in rubber
tapping adopted by growers as part of the Board’s promotion of low
frequency tapping system (LFTs). A survey undertaken by the author
among rubber growers in Kerala during 2008 revealed that almost 76%
of the sample growers were are following the alternate daily tapping
system, while about 10% still follow the intensive daily tapping system.
About 14% of the growers have reported following the LFTs involving
a once in three days tapping10 (S2D3).
3.2.1. Incidence of Multiple Grower cum tapper Dependence3.2.1. Incidence of Multiple Grower cum tapper Dependence3.2.1. Incidence of Multiple Grower cum tapper Dependence3.2.1. Incidence of Multiple Grower cum tapper Dependence3.2.1. Incidence of Multiple Grower cum tapper Dependence
It may be interesting to examine some of the important factors that
would have triggered the crisis in the rubber labour market as manifested
in the form of tapper shortage. Primarily, the demand for hired tappers
continued to rise in Kerala over time in view of several simultaneous
developments, such as: (a) necessity of the small and marginal growers to
earn a stable income from rubber cultivation; (b) the urge from the otherwise
unemployed tappers to keep them engaged in tapping; (c) an increasing
proportion of part-time as well as absentee rubber farmers in most of the
traditional rubber growing areas in the Central and Southern Kerala regions
in particular11; (d) the phenomenal increase in rubber tapped area across
all districts of Kerala; and (e) the proliferation of small and marginal
holdings with perceptible decline in the average size of operational
holdings12. While the above factors had increased the demand for tappers,
there was no corresponding increase in the availability and number of
tappers mainly due to the inertia among the younger generations to take
up rubber tapping as an economic activity. The cumulative outcome of
all these factors has been the emergence of a new trend towards multiple
grower dependence13 among the tappers across regions in Kerala with
some variations in the incidence and intensity.

28TTTT T
able
6:
able
6:
able
6:
able
6:
able
6: TTTT T
rend
s in
the
inci
denc
e of
mul
tipl
e gr
ore
nds
in th
e in
cide
nce
of m
ulti
ple
gro
rend
s in
the
inci
denc
e of
mul
tipl
e gr
ore
nds
in th
e in
cide
nce
of m
ulti
ple
gro
rend
s in
the
inci
denc
e of
mul
tipl
e gr
o wer
dep
ende
nce
of ta
pper
s in
Kw
er d
epen
denc
e of
tapp
ers
in K
wer
dep
ende
nce
of ta
pper
s in
Kw
er d
epen
denc
e of
tapp
ers
in K
wer
dep
ende
nce
of ta
pper
s in
Ker
ala
eral
aer
ala
eral
aer
ala
Reg
ion
Yea
rTa
pper
s (%
) at
tach
ed t
oTa
pper
s (#
)
One
gro
wer
2 G
row
ers
3 or
mor
e
Sout
h K
eral
a19
98-9
975
.019
.06.
052
2008
-09
45.5
40.9
13.6
22
Cha
nge
(% p
oint
s)-2
9.5
21.9
7.6
Cen
tral
Ker
ala
1998
-99
43.0
40.0
17.0
138
2008
-09
30.4
47.8
21.7
23
Cha
nge
(% p
oint
s)-1
2.6
7.8
4.7
Nor
th K
eral
a19
98-9
985
.013
.02.
097
2008
-09
54.5
36.4
9.1
22
Cha
nge
(% p
oint
s)-3
0.5
23.4
7.1
All
regi
ons
1998
-99
63.0
27.0
10.0
287
2008
-09
43.3
41.8
14.9
67
Cha
nge
(% p
oint
s)-1
9.7
14.8
4.9
Sour
ce: V
isw
anat
han
et a
l., 2
003
(for
per
iod
1998
-99)
; Ta
pper
Sur
vey
duri
ng 2
008
(for
per
iod
2008
-09)
.

29
Table 6 presents the interesting scenario of intensification of
multiple grower dependence across regions between 1998-99 and 2008-
09 in Kerala. There has been a notable increase in the proportion of
tappers attached to two or more growers over the 10 year period. While
there was a decline in single grower dependence by about 20%, the
dependence on two growers increased by 15% and dependence on 3 or
more growers increased by 5% at the aggregate level. The incidence of
multiple grower dependence appears to be quite high in the central
region during both the periods with the latest period (2008-09) showing
more proportion of tappers (22%) in Central Kerala attached to three or
more growers compared to Southern (14%) and Northern (9%) regions.
Both Central Kerala and North Kerala have experienced significant
increase in the proportion of tappers attached to two growers for tapping.
It may be important to make a distinction about the multiple
grower dependence scenarios during the two periods of analysis. For
instance, in the first period, the multiple grower dependence (MGD) of
the tappers was mostly induced by their search for more number of trees
so as to earn more wages, as the tapping wages were reasonably low
during the earlier period (1998-99). Whereas during the second period
(2008-09), the increasing tapper shortage has resulted in growers
searching for tappers ushering in a new syndrome called, multiple tapper
dependence (MTD) among the growers. Hence, in the second period,
the trigger for multiple tapper dependence came from the rubber growers,
unlike the earlier period when tappers had to look around for making an
adequate tapping task that ensure a reasonable daily wage. Of course,
the period also witnessed a substantial increase in tapping wages due to
tightening of the labour market on the one hand and a consistent and
continued rise in rubber prices (Table 7).
Table 7 presents an interesting dimension about the changing
dynamics in the labour market over the last decade in the context of tapper
shortage. Most importantly, the average tapping task (trees tapped) has
significantly increased between the two periods in all the regions, overall

30TTTT T
able
7:
able
7:
able
7:
able
7:
able
7:
TTTT Tre
nds
in d
aily
tap
ping
tas
k an
d ta
ppin
g w
rend
s in
dai
ly t
appi
ng t
ask
and
tapp
ing
wre
nds
in d
aily
tap
ping
tas
k an
d ta
ppin
g w
rend
s in
dai
ly t
appi
ng t
ask
and
tapp
ing
wre
nds
in d
aily
tap
ping
tas
k an
d ta
ppin
g w
ages
in
Kag
es i
n K
ages
in
Kag
es i
n K
ages
in
Ker
ala,
199
8-99
and
200
8-09
eral
a, 1
998-
99 a
nd 2
008-
09er
ala,
199
8-99
and
200
8-09
eral
a, 1
998-
99 a
nd 2
008-
09er
ala,
199
8-99
and
200
8-09
Mea
n/C
VN
orth
Ker
ala
Cen
tral
Ker
ala
Sout
h K
eral
aTo
tal
1. T
rees
tapp
ed p
er d
ay
1998
-99
(n=
287)
Mea
n29
230
527
629
5
CV
(%)
23.7
19.9
20.7
21.6
2008
-09
(n=
67)
Mea
n41
045
236
140
8
CV
(%)
39.3
40.0
36.0
39.5
% c
hang
e40
.448
.230
.838
.2
2. T
appi
ng w
ages
(R
s./ 1
00 tr
ees)
1998
-99
(n=
287)
Mea
n25
2724
26
CV
(%)
23.2
18.4
21.9
21.1
2008
-09
(n=
67)
Mea
n71
7269
70
CV
(%)
7.3
9.8
11.3
9.6
Ann
ual
chan
ge (
%)
18.4
16.5
18.4
17.3
Sour
ce: V
isw
anat
han,
et
al.,
2003
(fo
r pe
riod
199
8-99
); T
appe
r Su
rvey
dur
ing
2008
(fo
r pe
riod
200
8-09
).

31
increase in the daily tapping task being 38% at the aggregate level.
However, the variability (CV %) in tapping task was notably high during
the second period compared to the first period. The period also witnessed
almost a three-fold increase in tapping wages from Rs. 26 to Rs. 70 per
100 trees, mainly due to a substantial and consistent rise in rubber prices
during the reporting period. It may be argued that the tightening of the
tapping labour market in the face of tapper shortage also would have
caused tapping wages to rise in the three regions. On an average, tapping
wages have increased by more than 17% per annum between the two periods.
The period since 2008 also experienced significant changes in
the tapping labour market as tapper shortage got further intensified
alongside rising rubber prices, increase in rubber tapped area and a
consistent rise in tapping wages in all regions of Kerala. As a cumulative
outcome, there was an increasing trend towards multiple tapper
dependence among the growers along with the already existing
syndrome of multiple grower dependence. A comparative assessment of
the most recent scenario showing the incidence of multiple grower/
tapper dependence (expressed in terms of tapper grower ratio) in the
rubber smallholdings as emerge from a brief survey of rubber growers
and rubber tappers in the same locations in the Central and South Kerala
regions is presented in Table 8 and Table 9 respectively.
Table 8 presents the grower responses regarding the average
number of trees they offered for tapping along with the scenario of
grower dependence on tappers and the current wage rates for tapping in
eight locations during 2012-13. It reveals that growers in Mundakayam
area reported the highest number of tapping task (600) followed by
Kanjirapally (590). Notably, daily tapping task available for tappers is
significantly low in Vengola (148) and Erumely (315) and these two
locations report the highest average tapping wage rates (ie., Rs. 263 and
Rs. 250 per 100 trees), probably because of the reason that the tappers
get a lower task which gets compensated with higher wages.

32TTTT T
able
8:
able
8:
able
8:
able
8:
able
8:
TTTT Tap
ping
tas
k, t
appe
r to
gro
appi
ng t
ask,
tap
per
to g
roap
ping
tas
k, t
appe
r to
gro
appi
ng t
ask,
tap
per
to g
roap
ping
tas
k, t
appe
r to
gro
wer
rat
io a
nd w
wer
rat
io a
nd w
wer
rat
io a
nd w
wer
rat
io a
nd w
wer
rat
io a
nd w
ages
as
repo
rted
by
gro
ages
as
repo
rted
by
gro
ages
as
repo
rted
by
gro
ages
as
repo
rted
by
gro
ages
as
repo
rted
by
gro w
ers,
201
2-13
wer
s, 2
012-
13w
ers,
201
2-13
wer
s, 2
012-
13w
ers,
201
2-13
Vill
age
(Dis
tric
t)T
rees
tap
ped
Tapp
er-
grow
erTa
ppin
g w
ages
pai
d (R
s./
100
tree
s)
per
day
(no
) ra
tio (T
GR
)M
inim
umM
axim
umA
vera
ge
1. E
rattu
petta
(K
TM
)45
41.
8020
027
523
8
2. E
rum
ely
(KT
M)
315
1.75
225
275
250
3. K
anjir
apal
ly (
KT
M)
590
1.88
125
225
175
4. M
unda
kaya
m (
KT
M)
600
1.45
130
175
153
5. T
hum
pam
on (
PTA
)39
02.
5015
017
516
3
6. V
adas
seri
kkar
a (P
TA)
480
2.60
150
200
175
7. M
utto
m (I
DK
I)53
81.
7817
525
021
3
8. V
engo
la (
EK
M)
148
1.50
250
275
263
Ove
rall
470
1.91
176
231
203
Sour
ce: P
rim
ary
Surv
ey a
mon
g 36
rub
ber
grow
ers
in s
elec
t lo
catio
ns i
n C
entr
al a
nd S
outh
ern
Ker
ala,
201
2.

33
The scenario of multiple tapper dependence among the growers is
quite evident as all the locations indicate a tapper to grower ratio (TGR)
of about 2 with two locations, viz., Vadasserikkara and Thumpamon
showing TGR of above 2 (2.6 and 2.5 respectively). Tapping wage rates
as offered by the growers ranged from lowest at Rs. 125 per 100 trees in
Kanjirapally to the maximum at Rs. 275 in three locations, viz., Vengola,
Erumely and Erattupetta.
Table 9 also presents the profile of the sample tappers interviewed
in the eight locations. The average age of the tappers is above 40 years
in five of the eight locations. The average tapping task available for
tapping seems to be lower than what reported by the growers (Table 8)
except in Vengola, where the task reported by tappers was little higher
(163) than that reported by growers (148).
Nevertheless, the incidence of multiple grower dependence, as
reported by the tappers, was higher than the multiple tapper dependence,
as reported by the growers, in four of the eight locations as also evident
from Figure 4.
Figure 4: Scenario of Figure 4: Scenario of Figure 4: Scenario of Figure 4: Scenario of Figure 4: Scenario of TTTTTapper Groapper Groapper Groapper Groapper Grower Ratio (TGR) as reported bywer Ratio (TGR) as reported bywer Ratio (TGR) as reported bywer Ratio (TGR) as reported bywer Ratio (TGR) as reported bygrowers and tappers, 2012growers and tappers, 2012growers and tappers, 2012growers and tappers, 2012growers and tappers, 2012
Source: Primary Survey among 34 rubber tappers in select locations inCentral and Southern Kerala, 2012.

34TTTT T
able
9:
able
9:
able
9:
able
9:
able
9:
TTTT Tap
ping
tas
k, t
appe
r to
gro
appi
ng t
ask,
tap
per
to g
roap
ping
tas
k, t
appe
r to
gro
appi
ng t
ask,
tap
per
to g
roap
ping
tas
k, t
appe
r to
gro
wer
rat
io a
nd w
wer
rat
io a
nd w
wer
rat
io a
nd w
wer
rat
io a
nd w
wer
rat
io a
nd w
ages
as
repo
rted
by
tapp
ers,
201
2-13
ages
as
repo
rted
by
tapp
ers,
201
2-13
ages
as
repo
rted
by
tapp
ers,
201
2-13
ages
as
repo
rted
by
tapp
ers,
201
2-13
ages
as
repo
rted
by
tapp
ers,
201
2-13
Vill
age
(Dis
tric
t)A
vera
geT
G r
atio
Tre
es t
appe
dA
vera
ge w
ages
rec
eive
dA
vera
ge
age
(yrs
)pe
r da
yea
rnin
gs
Min
.M
ax.
Ave
rage
1. E
rattu
petta
(K
TM
)40
.32.
4531
120
025
022
554
464
2. E
rum
ely
(KT
M)
41.5
2.25
411
175
225
200
8222
2
3. K
anjir
apal
ly (
KT
M)
37.6
1.60
350
100
175
150
8400
0
4. M
unda
kaya
m (
KT
M)
43.8
2.20
423
120
250
175
7397
7
5. T
hum
pam
on (
PTA
)38
.81.
7535
012
522
517
561
250
6. V
adas
seri
kkar
a (P
TA)
40.5
2.67
400
150
225
175
7000
0
7. M
utto
m (I
DK
I)41
.01.
7547
917
522
518
889
971
8. V
engo
la (
EK
M)
36.5
1.50
163
200
275
225
5512
5
Ove
rall
40.3
1.96
390
140
250
180
7013
1
Sour
ce:
Prim
ary
Surv
ey a
mon
g 34
rub
ber
tapp
ers
in s
elec
t lo
catio
ns i
n C
entr
al a
nd S
outh
ern
Ker
ala,
201
2.

35
Further, this scenario of increased intensity of the use of hired
tappers leading to the incidence of multiple tapper dependence among
the growers is also evident from the survey among 22 Rubber Producers’
Societies undertaken during the course of the study (Figure 5).
Figure 5: Incidence of dependence on hired tappers and multipleFigure 5: Incidence of dependence on hired tappers and multipleFigure 5: Incidence of dependence on hired tappers and multipleFigure 5: Incidence of dependence on hired tappers and multipleFigure 5: Incidence of dependence on hired tappers and multipletapper dependencetapper dependencetapper dependencetapper dependencetapper dependence
Source: Survey undertaken among 22RPSs in the major growing regions
of Kerala
It emerges from Figure 5 that the dependence on hired tappers
(expressed by the ratio of hired tapper use) is quite high, hovering around
70-75% as reported from the areas covered under the RPSs. As a result,
the incidence of multiple tapper dependence among the growers is also
quite high, ie., more than 2.5 and close to 3 tappers in most cases.
Thus, the above discussion clearly demonstrates that tapper
shortage has intensified the crisis in the labour market attached to the
smallholder sector as evident from the increasing tendency towards
multiple grower dependence among the tappers as well as multiple tapper
dependence among the growers. Logically, this tendency of increasing
inter-dependence between the tappers and growers may create a win-
win situation for both in the short run. On the one hand, the tappers
might stand to gain as long as they are able to get adequate number of

36TTTT T
able
10:
Bro
ad i
ndic
ator
s of
sta
tus
of t
he r
ubbe
r sm
allh
olde
r se
ctor
in
Kab
le 1
0: B
road
ind
icat
ors
of s
tatu
s of
the
rub
ber
smal
lhol
der
sect
or i
n K
able
10:
Bro
ad i
ndic
ator
s of
sta
tus
of t
he r
ubbe
r sm
allh
olde
r se
ctor
in
Kab
le 1
0: B
road
ind
icat
ors
of s
tatu
s of
the
rub
ber
smal
lhol
der
sect
or i
n K
able
10:
Bro
ad i
ndic
ator
s of
sta
tus
of t
he r
ubbe
r sm
allh
olde
r se
ctor
in
Ker
ala,
201
1-12
eral
a, 2
011-
12er
ala,
201
1-12
eral
a, 2
011-
12er
ala,
201
1-12
Indi
cato
rsSo
uth
Ker
ala
Cen
tral
Ker
ala
Nor
th K
eral
aA
ll K
eral
a
1. N
o. o
f H
oldi
ngs
(%/ ’
000
Nos
.)33
.437
.629
.010
22.7
2. T
otal
Rub
ber
area
(%
/ ’00
0 ha
)26
.638
.135
.347
9.9
3. A
vera
ge h
oldi
ng s
ize
(ha)
0.37
0.47
0.57
0.47
4. S
hare
in ta
pped
are
a (%
/ ’00
0 ha
)24
.740
.335
.034
2.7
5. T
appe
d ar
ea a
s %
tota
l rub
ber
area
66.5
75.6
70.7
71.4
6. S
hare
in r
epla
nted
(R
P) a
rea
(%/ ’
000
ha)
17.6
28.9
53.5
120.
6
7. S
hare
in N
ewpl
ante
d (N
P) a
rea
(%/ ’
000
ha)
9.3
12.6
78.1
142.
3
8. R
epla
nted
& N
ewpl
ante
d ar
ea (
%/ ’
000
ha)
13.1
20.1
66.8
262.
9
9. N
ewpl
ante
d ar
ea a
s %
of R
P+N
P ar
ea38
.434
.063
.354
.1
10. N
o of
RPS
s31
.239
.829
.020
94
11. R
ubbe
r ar
ea p
er R
PS (
ha)
195.
221
9.2
279.
422
9.2
Not
e: T
he a
ggre
gate
lev
el d
ata
may
not
mat
ch a
s it
does
not
inc
lude
dat
a fr
om T
hala
sser
y R
egio
nal
Off
ice.
Sour
ce: D
ata
gath
ered
fro
m 2
4 R
egio
nal O
ffic
es o
f th
e R
ubbe
r B
oard
, 201
2.

37
trees for tapping at a reasonable wage rate. On the other hand, the
growers stand to gain as long as they are able to find tappers with
reasonable skills, who perform the task efficiently.
However, it is important to explore ‘whether the emergent scenario
of tapper shortage results in a win-win situation for both growers and
tappers’ especially when there are imperfections in the tapping labour
market arising from several constraints. These constraints mainly include:
(a) non-availability of skilled and efficient tappers in many areas; (b)
increasing presence of aged tappers in the labour market; (c) rubber
output or income lost or forgone in the process of searching for skilled
tappers and the (resultant) high transaction costs involved in arriving at
efficient and mutually beneficial contractual arrangements; (d) damages
caused to trees by unskilled tappers and shortening of economic life of
the plantations; etc to mention a few (see also Chart 1). Invariably, all
these constraints affecting the labour market need in-depth empirical
investigations.
In what follows, we try to examine some of the major responses
and strategies adopted by the rubber smallholders and rubber planters
to overcome the problem of labour shortage in general and tapper
shortage in particular. While examining this, we also discuss some of
the major imperfections that prevail in the tapping labour market based
on the empirical surveys undertaken by the author during three different
time points, viz., 1998-99, 2008-09 and 2012-13. Hopefully, these surveys
undertaken among various stakeholders, viz., rubber growers; rubber
tappers; RPSs; Rubber Production Department (RPD) of the Rubber
Board; rubber planters, etc would enable one to bring out the micro
level issues surfacing the labour market attached to the rubber sector in
Kerala in the right perspective to arrive at meaningful conclusions and
draw actions/ strategies to address the impasse in the labour market from
a long-term perspective.

38
3.2.2. 3.2.2. 3.2.2. 3.2.2. 3.2.2. TTTTTapper Shortage: Impressions and Locations Fapper Shortage: Impressions and Locations Fapper Shortage: Impressions and Locations Fapper Shortage: Impressions and Locations Fapper Shortage: Impressions and Locations Facing Shortageacing Shortageacing Shortageacing Shortageacing Shortage
The impressions about tapper shortage as discussed here are mainly
gathered from the brief survey undertaken covering 24 out of the 25
Regional Offices of the Rubber Board and the personal discussions held
with the officials of the RP Department (RPD). Before getting into the
impressions about tapper shortage, it may be useful to examine some of
the crucial indicators of the smallholder rubber sector as emerge from
the data compiled from the regional offices of the Rubber Board for the
latest period 2011-12. The trends on the broad indicators revealing the
current status of the smallholder sector are presented in Table 10.
(See page 36)
Table 10 throws light on some interesting dimensions of the current
status of the smallholder sector in Kerala with certain clues on the
emerging impasse in the labour market as well as production sector as a
whole. First of all, it may be seen that Central Kerala has the highest
share in most of the indicators, viz., number of holdings (37.6%), total
rubber area (38%), tapped area (40%), proportion of tapped area (76%)
and number of RPSs (40%). The average size of a rubber plot as reported
from the three regions hovered around 0.47 ha with Northern Kerala
having the highest size (0.57 ha), followed by Central Kerala (0.47 ha)
and South Kerala (0.37 ha). One of the most important point emerging
from the Table is that tapped area as a proportion of total rubber area is
quite high in all the three regions (71%), with Central Kerala reporting
the highest share (76%), followed by North Kerala (71%) and South
Kerala (66%). Yet another important point is that both South Kerala and
Central Kerala report relatively lower proportions of areas being new
planted and replanted, which suggests that the problem of tapper shortage
will be much more likely to get intensified in these two regions in the
future, unless sustainable solutions for addressing tapper shortage are
arrived at. It is also important to note that all three regions report
significant presence of RPSs covering an average rubber area of 229 ha.

39
Given this, it will also be interesting to examine the kind of interventions
or strategies being adopted by these farmer organisations (namely, RPSs)
to come up with solutions to address the labour shortage problems at the
local level.
Since tapper shortage has distinct regional differences and it
changes from location to location, the impressions about tapper shortage
and the proximate reasons for the same as reported by the officials of the
Production and Extension Department of the Rubber Board are also
examined from a regional perspective. Table 11 presents a summary of
the impressions about labour/ tapper shortage; some of the prominent
reasons for the emerging situation as well as the major locations facing
acute tapper shortage in the rubber growing areas of Kerala.
The Table brings out several interesting dimensions of the
problems of tapper shortage. Some of the important factors causing
tapper shortage and the resultant outcomes in the labour market, as can
be seen from Table 11, are: (a) the apparent reluctance shown by the
younger generation in taking up tapping despite the reasonable wages;
(b) increased presence of absentee land owners which poses constraints
in adopting low frequency tapping system (LFT) as well as enhanced
casualties caused to rubber trees and loss of yield/ output due to
unscientific tapping performed by unskilled or low-skilled tappers; (c)
increased tapping tasks; (d) increasing number of untapped plots; (e)
tendency to tap crop-sharing basis; (f) emergence of piece-rate based
wage payment system for tapping, latex collection, sheet making, as
well as other farm related activities, such as fertiliser application,
Rainguarding, plant protection, etc; (g) lack of active women
participation due to hard physical nature of the work; (h) even with
increased wages tapping continuing to be low-paid than agriculture
and other sectors, especially, construction; (i) delayed replanting in
large estates due to shortage of workers; (j) conversion of rubber plots
into real estate development/ housing plots, etc.

40TTTT T
able
11:
Im
pres
sion
s ab
out
tapp
er s
hort
age,
its
maj
or c
ause
s an
d ar
eas
fab
le 1
1: I
mpr
essi
ons
abou
t ta
pper
sho
rtag
e, i
ts m
ajor
cau
ses
and
area
s f
able
11:
Im
pres
sion
s ab
out
tapp
er s
hort
age,
its
maj
or c
ause
s an
d ar
eas
fab
le 1
1: I
mpr
essi
ons
abou
t ta
pper
sho
rtag
e, i
ts m
ajor
cau
ses
and
area
s f
able
11:
Im
pres
sion
s ab
out
tapp
er s
hort
age,
its
maj
or c
ause
s an
d ar
eas
f aci
ng s
hort
age
acin
g sh
orta
geac
ing
shor
tage
acin
g sh
orta
geac
ing
shor
tage
Nam
e of
Reg
ion
Impr
essi
ons
abou
t ta
pper
sho
rtag
eL
ocat
ions
fac
ing
acut
e sh
orta
ge
1. T
riva
ndru
mR
ubbe
r ho
ldin
gs f
ace
issu
es, s
uch
as: (
a) s
izea
ble
num
ber
ofK
ilim
anoo
r, Pe
yad,
Kat
takk
ada,
abse
ntee
ow
ners
; (b
) in
tens
ive
and
unsc
ient
ific
tap
ping
due
to
Ney
yatti
nkar
ala
ck o
f di
rect
sup
ervi
sion
by
owne
rs;
(c)
exce
ssiv
e ta
ppin
g ta
sks
for
tapp
ers;
(d)
you
ngst
ers
get a
ttrac
ted
to m
ore
attr
activ
e f
ield
s lik
e co
nstr
uctio
n/ r
eal
esta
te/
over
seas
jo
bs
2. N
edum
anga
d(a
) Su
burb
an a
reas
that
are
turn
ed in
to r
ubbe
r, fa
ce s
ever
eSh
orta
ge b
eing
rep
orte
d al
mos
tta
pper
sho
rtag
e; (
b) A
lmos
t 70-
80%
of
the
farm
s ar
e ru
n on
ever
ywhe
re. M
ore
seve
re in
the
abs
ente
e ow
ners
hip,
whi
ch a
ct a
s an
obs
tacl
e to
ado
pt L
FT,
sub
urbs
, viz
., Pa
lode
, b
ecau
se o
f co
mpu
lsio
ns f
or s
uper
visi
ng t
appe
rs, m
ajor
ityPe
ring
adav
ila,
Nem
om,
of w
hom
are
not
hig
hly
skill
ed i
n th
e jo
b; (
c) A
bout
Poth
enco
de,
Kili
man
oor
20-
30%
of
hold
ings
fac
e th
e pr
oble
m o
f im
prop
er/
Dha
nuva
chap
uram
, et
cun
scie
ntif
ic t
appi
ng;
(d)
Num
ber
of p
lots
lef
t un
tapp
ed h
as b
een
on th
e ri
se
3. P
unal
ur(a
) Yet
to f
ace
a m
ajor
sho
rtag
e of
labo
ur; (
b) C
urre
ntly
,Sc
arci
ty o
f Ta
pper
s an
d ge
nera
l e
stat
e ta
pper
s he
lp s
olve
pro
blem
in
man
y ar
eas;
wor
kers
will
be
a pr
oble
m in
futu
re(c
) Sm
all g
row
ers
have
to b
e tr
aine
d fo
r se
lf ta
ppin
g

41
4. K
otta
rakk
ara
(a)
Tapp
er s
hort
age
is o
bser
ved
wid
ely;
(b)
Una
ttrac
tive
wag
eN
allil
a, P
erum
kula
m,
Pooy
appa
llyra
tes,
com
pare
d w
ith o
ther
uns
kille
d w
orke
rs a
nd t
he t
ime
and
Che
ngam
anad
u s
ched
ule
of ta
ppin
g ar
e pr
ime
reas
ons;
(c)
You
ng w
orke
rsar
e re
luct
ant
to o
pt t
appi
ng a
s th
eir
prof
essi
on a
nd c
onsi
der
tapp
ing
and
othe
r w
orks
as
low
pro
file
job,
whi
ch w
ould
badl
y af
fect
the
ir s
ocia
l st
atus
5. A
door
(a)
Due
to
shor
tage
, eff
ectiv
e ha
rves
ting
is n
ot d
one;
Shor
tage
rep
orte
d in
the
(b)
Max
imum
yie
ld c
ould
not
be
expl
oite
d du
e to
ent
ire
regi
onun
scie
ntif
ic t
appi
ng;
(c)
Deg
rada
tion
of q
ualit
y of
she
et
6. P
atha
nam
thitt
a(a
) M
any
plan
tatio
ns n
ot t
appe
d du
e to
lac
k of
suf
fici
ent
Koz
henc
herr
y, C
hitta
r, R
anny
,ta
pper
s; (
b) E
ven
trai
ned
tapp
ers
not
inte
rest
ed t
o ta
ke M
atho
orta
ppin
g as
a p
rofe
ssio
n
7. C
hang
anas
sery
(a)
Wor
k in
oth
er s
ecto
rs m
ore
rem
uner
ativ
e an
d he
nce,
ther
e is
a te
nden
cy to
mig
rate
; (b)
tapp
ing
wor
k is
mor
esk
illed
and
new
gen
erat
ion
wor
kers
are
rel
ucta
nt t
o go
to
wor
k in
the
earl
y ho
urs
Not
ser
ious
ly o
bser
ved

42
8. K
otta
yam
(a)
Maj
ority
of
the
exis
ting
tapp
ers
are
mid
dle-
aged
and
Tapp
er s
hort
age
is f
elt i
n m
ost
abo
ve;
(b) Y
oung
ster
s ar
e no
t co
min
g to
thi
s fi
eld.
par
ts in
the
regi
on.
9. P
ala
(a)
New
gen
erat
ion
not
taki
ng u
p ta
ppin
g w
ork;
(b)
Tap
pers
Ant
hial
am, A
imco
mpu
relu
ctan
t to
do
proc
essi
ng o
f L
atex
in
to s
heet
10.
Kan
jirap
pally
(a)
Del
ayin
g re
plan
ting
in l
arge
est
ates
due
to
shor
tage
of
Tapp
er s
hort
age
felt
in m
any
wor
kers
; (b
) T
here
is
conv
ersi
on o
f ru
bber
pla
nted
hol
ding
s l
ocat
ions
. t
o re
al e
stat
e de
velo
pmen
t/ ho
usin
g pl
ots
11.
Era
ttupe
tta(a
) A
ctiv
ities
oth
er t
han
tapp
ing,
lik
e w
eedi
ng i
n pa
rtic
ular
,Sh
orta
ge n
ot s
o m
uch
has
been
mec
hani
sed;
(b)
Eve
n th
ough
new
wor
kers
are
rep
orte
d. L
ikel
y to
be
muc
h t
rain
ed, h
ardl
y 20
% o
f th
em a
ctua
lly j
oin
the
labo
ur m
arke
t s
ever
e in
fut
ure.
12.
Tho
dupu
zha
(a) A
cute
sho
rtag
e of
trai
ned
tapp
ers;
(b)
plo
ts w
ithN
o sp
ecif
ic a
rea
iden
tifie
d.10
0-20
0 tr
ees
are
left
unt
appe
d du
e to
non
-via
bilit
y of
pai
dSh
orta
ge f
elt i
n se
vera
l are
asta
ppin
g; (
c) t
hese
plo
ts a
re i
ncre
asin
gly
conv
erte
d in
tore
al e
stat
es/
hous
e pl
ots
Nam
e of
Reg
ion
Impr
essi
ons
abou
t ta
pper
sho
rtag
eL
ocat
ions
fac
ing
acut
e sh
orta
ge

43
13.
Muv
attu
puzh
a(b
) A
bout
2-5
% o
f th
e ne
wly
tap
ped
hold
ings
are
tap
ped
Tapp
er s
hort
age
is n
ot m
uch
felt
in o
n ou
tput
sha
ring
bas
is;
(b)
Thi
s is
wid
ely
repo
rted
the
reg
ion
from
pla
ces
like
Ern
akul
am w
here
lab
our
avai
labi
lity
is
a bi
g pr
oble
m d
ue t
o gr
owin
g in
dust
rial
dem
and
for
labo
ur
14.
Kot
ham
anga
lam
(a)
Lab
our/
tap
per
shor
tage
is
expe
rien
ced
in a
lmos
t al
lL
abou
r sh
orta
ge i
s fe
lt in
loca
tions
; (b
) B
ut t
appi
ng i
s no
t su
spen
ded
anyw
here
in a
ll lo
catio
nsbe
caus
e of
thi
s pr
oble
m;
(c)
Peop
le a
re m
anag
ing
byw
ooin
g th
e ta
pper
s in
dif
fere
nt w
ays.
15.
Ern
akul
am(a
) C
ompa
red
to o
ther
are
a lik
e co
nstr
uctio
n se
ctor
tap
pers
Shor
tage
exp
erie
nced
in
gen
eral
are
low
pai
d; (
b) Y
outh
are
not
com
ing
forw
ard
for
tapp
ing
wor
k an
d on
ly t
he o
ld t
appe
rs a
re e
ngag
ed
16.
Thr
issu
r(a
) You
nger
gen
erat
ion
is n
ot c
omin
g to
tap
ping
. E
ven
the
No
spec
ific
loc
atio
n is
ide
ntif
ied.
uned
ucat
ed/
less
edu
cate
d yo
uth
try
mor
e at
trac
tive
jobs
; S
hort
age
is g
ettin
g sp
read
on
a (
b) I
n m
any
area
s, g
row
ers
are
eith
er c
olle
ctin
g la
tex
and
larg
er a
rea
proc
essi
ng it
or e
ngag
ing
labo
urer
s fo
r the
sam
e; (c
) Lab
oure
rsfr
om o
ther
sta
tes
are
enga
ged
Nam
e of
Reg
ion
Impr
essi
ons
abou
t ta
pper
sho
rtag
eL
ocat
ions
fac
ing
acut
e sh
orta
ge

44
17.
Pala
kkad
(a) A
s su
ch, t
appe
d ar
eas
are
not l
eft u
ntap
ped,
ie.,
grow
ers
Shor
tage
of
skill
ed t
appe
rs i
sdo
tap
ping
on
thei
r ow
n in
suc
h pl
aces
; (b
) In
ertia
of
evi
dent
in p
arts
of
area
s, li
keyo
ung
gene
ratio
n is
a s
erio
us c
once
rn;
(c)
Rel
ucta
nce
to S
hora
nur
and
Kon
gad
give
a h
ighe
r w
age
to s
kille
d ta
pper
s co
mpa
red
to w
ages
for
gene
ral w
orks
as
had
been
don
e ea
rlie
r, is
als
o a
fact
in th
ech
angi
ng l
abou
r sc
enar
io
18.
Man
nark
ad(a
) N
RE
G S
chem
e af
fect
the
avai
labi
lity
of e
xist
ing
Pala
kkay
am v
illa
gelim
ited
labo
ur s
ourc
e; (
b) N
ew g
ener
atio
n w
orke
rs p
refe
r h
igh
wag
e jo
bs w
ith l
ess
phys
ical
eff
ort;
(c)
Wom
en d
ono
t com
e fo
rwar
d du
e to
har
d ph
ysic
al n
atur
e of
the
wor
k;(d
) In
gen
eral
, wor
kers
pre
fer
jobs
req
uiri
ng le
ss p
hysi
cal
effo
rts;
(e)
Edu
cate
d yo
uth
not
inte
rest
ed i
n ta
ppin
g an
dlo
ok f
or o
ther
opp
ortu
nitie
s w
ith b
ette
r w
ages
and
hig
hdi
gnit
y.
19.
Man
jeri
(a)
Mec
hani
zatio
n is
pos
sibl
e to
som
e ex
tent
in
plan
ting
Lab
our
shor
tage
exi
sts
in m
ost
and
mai
nten
ance
ope
ratio
n bu
t no
t in
tap
ping
; (b
) E
ven
pla
ces,
inc
ludi
ng,
Urg
attir
i,th
ough
tapp
ing
is a
ski
lled
wor
k, th
e w
ages
are
alw
ays
less
Mal
apar
amba
, Nem
ini,
Pand
allu
r, t
han
the
unsk
illed
agr
icul
tura
l w
orke
rs;
(c)
Em
ploy
men
tK
aruv
arak
undu
thro
ugh
NR
EG
S is
als
o a
reas
on f
or s
hort
age
of w
orke
rs
Nam
e of
Reg
ion
Impr
essi
ons
abou
t ta
pper
sho
rtag
eL
ocat
ions
fac
ing
acut
e sh
orta
ge

45
20. N
ilam
bur
(a)
Mig
ratio
n of
labo
urer
s to
urb
an a
reas
in s
earc
h of
Cho
kkad
, K
arua
li, P
ullip
pada
m la
bour
with
hig
her
wag
es; (
b) W
orke
rs a
lso
enga
ged
in r
iver
san
d ex
cava
tion
wor
k w
hich
is
high
ly p
aid
21.
Koz
hiko
de(a
) Y
oung
ster
s no
t in
tere
sted
in
tapp
ing
due
to s
ocio
-K
undu
thod
e, K
oora
chun
du,
econ
omic
, te
chni
cal
and
job
stat
us i
ssue
s; (
b) U
nski
lled
Kal
lano
de, K
oden
cher
y, e
tc.
cons
truc
tion
wor
kers
get
mor
e re
mun
erat
ion;
(c)
Tax
i/A
utor
icks
haw
/ dr
iver
s ar
e ge
tting
bet
ter
soci
al s
tatu
s th
an t
appe
rs a
nd a
gric
ultu
ral
wor
kers
22.
Talip
aram
ba(a
) You
ngst
ers
refu
se to
ent
er r
ubbe
r ta
ppin
g as
it is
not
Che
rupu
zha,
Mat
hi,
May
yil,
muc
h re
mun
erat
ive;
(b)
Gro
wer
s th
emse
lves
sta
rted
doi
ngA
lakk
ode,
Pan
niyo
or,
tapp
ing
Per
umpa
davu
23.
Sree
kant
apur
am(a
) Abo
ut 3
0-35
% o
f th
e gr
ower
s in
the
regi
on d
o se
lfA
t pr
esen
t, ta
pper
sho
rtag
e is
not
tapp
ing,
with
the
res
t hi
ring
wor
kers
for
tap
ping
;fe
lt ve
ry m
uch,
but
it
is l
ikel
y in
(b)
A d
istin
ctio
n he
re i
s th
at o
nly
the
olde
r ge
nera
tion
the
futu
re d
oes
enga
ge i
nto
self
tap
ping
24.
Kan
hang
ad(a
) D
ue t
o sh
orta
ge o
f ta
pper
s, s
cien
tific
tap
ping
is
not
Lab
our s
hort
age
repo
rted
in a
lmos
tbe
ing
done
in
abou
t 30
% h
oldi
ngs;
(b)
Due
to
shor
tage
all
loca
tion
sof
wor
kers
hol
ding
s ar
e no
t m
aint
aine
d sc
ient
ific
ally
Sour
ce:
Bas
ed o
n in
form
atio
n ga
ther
ed f
rom
24
Reg
iona
l Off
ices
of
the
Rub
ber
Boa
rd, O
ct. –
Dec
. 201
2.
Nam
e of
Reg
ion
Impr
essi
ons
abou
t ta
pper
sho
rtag
eL
ocat
ions
fac
ing
acut
e sh
orta
ge

46
4.4.4.4.4. Managing Managing Managing Managing Managing TTTTTapper Shortage: Planter/ Groapper Shortage: Planter/ Groapper Shortage: Planter/ Groapper Shortage: Planter/ Groapper Shortage: Planter/ Grower Responses andwer Responses andwer Responses andwer Responses andwer Responses andInstitutional StrategiesInstitutional StrategiesInstitutional StrategiesInstitutional StrategiesInstitutional Strategies
It may be important to discuss the major adaptation strategies
followed by the rubber planters and rubber growers, as well as the
institutional interventions made by the Rubber Board and the RPSs to
address tapper (labour) shortage. While an in-depth survey among the
rubber plantations (estates) was outside the purview of the present
enquiry, evidences from a survey undertaken covering a few rubber
estates in Kerala (including interactions with few leading planters and
officials at the APK) reveals several proactive measures being adopted
by the rubber planters/ companies to overcome the labour/ tapper
shortage problems, as discussed below:
(a) Many estates reflected that they do not face tapper shortage at
the moment, as only 50-60% of the estate area is under tapping
currently. Since felling and replanting activities are delayed in
some plantations to take advantage of the increased prices, there
is also not much demand for general workers for planting
operations. At the same time, many plantations are reportedly
undertaking replanting programmes on a massive scale (almost
30-40% of the total rubber area) and most of the planting
operations are mechanized either due to shortage of labourers or
with a deliberate intention to reduce the size of workers.
(b) Most estates have mechanized most of the field and factory
operations, like weeding, spraying, sheet processing, etc. For
tapping, all new fields under tapping are brought under low
frequency tapping (LFT) systems, like once in three days (S2D3)
or once in 4 days (S2D4) tapping.
(c) Many estates report that new workers are being recruited
especially for tapping from nearby localities. Dependents of
permanent workers are recruited as workers in the estate against
the vacancies reported.

47
(d) Some estates claim to have sufficient young, resident labour force
attached with them. Hence, when more area is brought under
tapping, these dependent workers can be easily trained and
recruited into the tapping workforce.
(e) In some estates which face shortage, the existing tappers are given
higher task of 400 trees per day. They also employ tappers after
tapping hours for work in the store rooms, field work, etc. Actions
are also taken by the estates to curb unauthorised absenteeism
and thereby to bring in more disciplined and productive work
environment in the plantations.
(f) Most estates had already implemented wage increases since 2007
as proposed by the Plantation Labour Committee and reportedly,
this was the highest ever increase since 1951 in quantum and
percentage. Since rubber prices have also been ruling at higher
levels over the past several years, such wage increases do not
affect the profitability of the estates. The current wages in rubber
estates are reasonably high and plantation workers benefit in
terms of high wages and year full of employment as compared to
many other sectors.
(g) Since tapper and labour shortage during peak season is a cause
for concern, efforts are also being made by few plantation
companies to establish a process of migrant labour and stabilize
the same in the next few years.
As regards the management strategies adopted by the small growers,
the information gathered from the Regional Offices of the Board provide
useful insights. Figure 6 presents the major responses and strategies
adopted by the small growers as well as the RPSs across the 24 regions
under the jurisdiction of the Rubber Board. It may be observed that
sharing of tappers (multiple tapper/ grower dependence) between
adjacent growers has been reported from 83% of the locations. Other

48
major strategies adopted by the growers/ RPSs include: (a) engagement
of tappers for tapping work alone (67%); (b) switching over to latex
sales (67%); (c) shift to low frequency tapping systems (63%); (d)
encouraging women to take up tapping and processing (58%); (e)
increased shift towards self-tapping (54%); (f) engaging unskilled
tappers for tapping (46%); (g) providing accommodation and extra wages
to retain tappers (38%); (h) increasing the tapping task of existing tappers
(33%); (i) recruiting non-Keralaite tappers (29%); (j) organising labour/
Rubber Tappers Bank (RTB)14 (29%); (k) giving training in tapping to
marginal holders (21%); (l) offering higher wages to tappers (17%); (m)
introducing contract tapping with crop sharing arrangements (17%); (n)
keeping plots untapped (17%); (o) adopting new tapping system, such
as needle (puncture) tapping method (8%), etc.
Figure 6: Responses and measures adopted by rubber growers andFigure 6: Responses and measures adopted by rubber growers andFigure 6: Responses and measures adopted by rubber growers andFigure 6: Responses and measures adopted by rubber growers andFigure 6: Responses and measures adopted by rubber growers andRPSs in Kerala (n=24)RPSs in Kerala (n=24)RPSs in Kerala (n=24)RPSs in Kerala (n=24)RPSs in Kerala (n=24)
Source: Survey and discussion held with 24 RBRO officials, interaction
with RPSs members, rubber growers and tappers.

49
On the other hand, results also show that the Rubber Board has
been highly concerned about the shortage of labour and it has initiated
several innovative programmes and strategies to immediately overcome
the crisis. The major interventions made by the Rubber Board to address
the labour/ tapper shortage issues in particular, are presented in Table
12. It may be noted that the major interventions of the Board have been
certainly focused towards strengthening the human capital attached
with the rubber production sector and these programmes inter alia
included formation of Labour/ Rubber Tappers Bank (RTB); Training
in tapping for growers and women; popularizing low frequency tapping
systems; promotion of eco-friendly group processing centres; integrated
tapper training scheme for non-Keralites (ITTSNK), etc.
Among the various interventions and schemes as listed in the
Table 12, the first eight have immense significance and potential in the
context of the tapper shortage and to a large extent, these interventions
if implemented properly, might help resolve the labour market crisis.
Many of the interventions are also more national in character and all the
rubber growing regions of Kerala get benefited from them. Nevertheless,
there are several constraints that come up in the way undermining the
effectiveness of the programmes and their success at the grass roots
level, which will be discussed in the following section.
4.1. Outcomes of 4.1. Outcomes of 4.1. Outcomes of 4.1. Outcomes of 4.1. Outcomes of TTTTTapper Shortage Management Measures andapper Shortage Management Measures andapper Shortage Management Measures andapper Shortage Management Measures andapper Shortage Management Measures andInstitutional InterventionsInstitutional InterventionsInstitutional InterventionsInstitutional InterventionsInstitutional Interventions
A brief discussion about the important outcomes of the measures
adopted by the growers as well as the interventions by the Rubber Board
(RB) to address tapper shortage in Kerala may be useful here. Apparently,
the initiative for formation of Labour Bank or Rubber Tappers’ Bank15
(RTB) is of very recent origin and the outcomes are yet to be visible. The
objective of the RTB is to generate a pool (bank) of rubber tappers based
on individual tapper registrations at the RPSs or Field Stations of the
RB and it envisages more active involvement of the rubber tappers in

50TTTT T
able
12:
Maj
or i
nter
vab
le 1
2: M
ajor
int
erv
able
12:
Maj
or i
nter
vab
le 1
2: M
ajor
int
erv
able
12:
Maj
or i
nter
v ent
ions
by
the
Rub
ber
Boa
rd t
o ad
dres
s la
bour
/ ta
pper
sho
rtag
een
tion
s by
the
Rub
ber
Boa
rd t
o ad
dres
s la
bour
/ ta
pper
sho
rtag
een
tion
s by
the
Rub
ber
Boa
rd t
o ad
dres
s la
bour
/ ta
pper
sho
rtag
een
tion
s by
the
Rub
ber
Boa
rd t
o ad
dres
s la
bour
/ ta
pper
sho
rtag
een
tion
s by
the
Rub
ber
Boa
rd t
o ad
dres
s la
bour
/ ta
pper
sho
rtag
e
Mea
sure
s ad
opte
d by
the
Rub
ber
Boa
rdR
egio
ns/
loca
tion
s re
port
ing
1.Fo
rmat
ion
of L
abou
r/ T
appe
r B
anks
for
sha
ring
Tri
vand
rum
, Pa
la,
Era
ttupe
tta,
Kan
jirap
ally
,
avai
labl
e ta
pper
sA
door
, Kot
taya
m,
Tho
dupu
zha,
Kot
ham
anga
lam
, E
rnak
ulam
, K
anha
ngad
2.T
rain
ing
in ta
ppin
g fo
r gr
ower
s an
d ne
w ta
pper
s,A
ll In
dia
incl
udin
g w
omen
3.Po
pula
rizi
ng L
ow F
requ
ency
Tap
ping
sys
tem
sA
ll In
dia
4.In
tegr
ated
Tap
per
Tra
inin
g Sc
hem
e fo
r N
on-K
eral
ites
(IT
TSN
K)
Kot
tara
kkar
a, P
ala,
Era
ttupe
tta, A
door
,
Talip
aram
ba,
Kan
jirap
ally
5.Pr
omot
ion
of E
co-f
rien
dly
Gro
up P
roce
ssin
g C
entr
es a
ttach
edPa
la,
Era
ttupe
tta,
Tho
dupu
zha,
Kot
taya
m,
with
Mod
el R
PSs
Kot
ham
anga
lam
,Kan
jira
pall
y,
Mun
daka
yam
, N
ilam
bur
6.Fo
rmat
ion
of S
elf
Hel
p G
roup
s/ F
arm
er G
roup
s an
dA
ll In
dia
Em
pow
erm
ent S
chem
e (F
GE
S)
7.Pr
ovis
ion
of la
bour
wel
fare
sch
emes
for
tapp
ers
and
wor
kers
in
smal
lhol
ding
s an
d pl
anta
tions
All
Indi
a

51
8.Pr
ovid
ing
supp
ort
(fin
anci
al a
nd t
rain
ing)
for
mec
hani
satio
n
of a
gro-
man
agem
ent
activ
ities
(sp
raye
rs, w
eed
cutte
rs)
and
prod
uctio
n an
d pr
oces
sing
(sm
oke
hous
e, r
ubbe
r ro
llers
, etc
)A
ll In
dia
9.Pr
ovis
ion
of p
lant
atio
n in
puts
- R
aing
uard
ing
plas
tic a
nd
com
poun
d; P
lant
Pro
tect
ion
chem
ical
sA
ll In
dia
10.
Plan
ting
Subs
idy
for
New
plan
ting
and
Rep
lant
ing
All
Indi
a
11.
Form
atio
n of
Rub
ber
Prod
ucer
s’ S
ocie
ties
(RPS
s)A
ll In
dia
Sour
ce:
Com
pila
tion
base
d on
info
rmat
ion
gath
ered
fro
m 2
4 R
egio
nal O
ffic
es o
f th
e R
B, O
ct. –
Dec
. 201
2.
Mea
sure
s ad
opte
d by
the
Rub
ber
Boa
rdR
egio
ns/
loca
tion
s re
port
ing
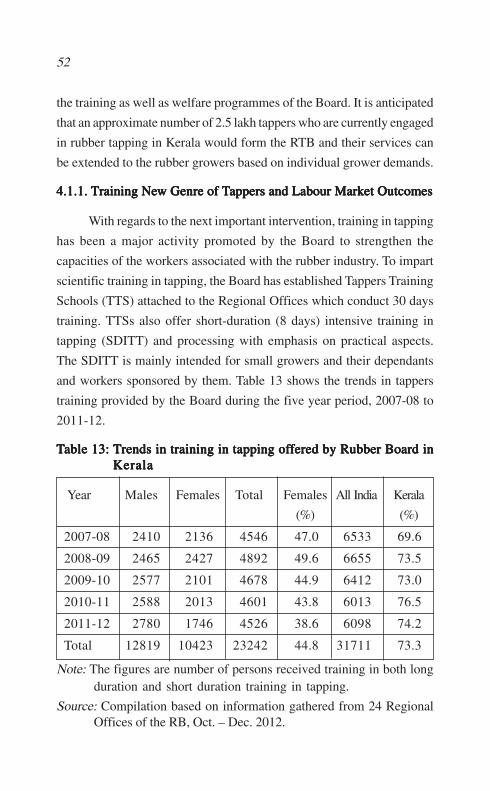
52
the training as well as welfare programmes of the Board. It is anticipated
that an approximate number of 2.5 lakh tappers who are currently engaged
in rubber tapping in Kerala would form the RTB and their services can
be extended to the rubber growers based on individual grower demands.
4.1.1. 4.1.1. 4.1.1. 4.1.1. 4.1.1. TTTTTraining Neraining Neraining Neraining Neraining New Genre of w Genre of w Genre of w Genre of w Genre of TTTTTappers and Labour Markappers and Labour Markappers and Labour Markappers and Labour Markappers and Labour Market Outcomeset Outcomeset Outcomeset Outcomeset Outcomes
With regards to the next important intervention, training in tapping
has been a major activity promoted by the Board to strengthen the
capacities of the workers associated with the rubber industry. To impart
scientific training in tapping, the Board has established Tappers Training
Schools (TTS) attached to the Regional Offices which conduct 30 days
training. TTSs also offer short-duration (8 days) intensive training in
tapping (SDITT) and processing with emphasis on practical aspects.
The SDITT is mainly intended for small growers and their dependants
and workers sponsored by them. Table 13 shows the trends in tappers
training provided by the Board during the five year period, 2007-08 to
2011-12.
TTTTTable 13: able 13: able 13: able 13: able 13: TTTTTrends in training in tapping ofrends in training in tapping ofrends in training in tapping ofrends in training in tapping ofrends in training in tapping offered by Rubber Board infered by Rubber Board infered by Rubber Board infered by Rubber Board infered by Rubber Board inKeralaKeralaKeralaKeralaKerala
Year Males Females Total Females All India Kerala
(%) (%)
2007-08 2410 2136 4546 47.0 6533 69.6
2008-09 2465 2427 4892 49.6 6655 73.5
2009-10 2577 2101 4678 44.9 6412 73.0
2010-11 2588 2013 4601 43.8 6013 76.5
2011-12 2780 1746 4526 38.6 6098 74.2
Total 12819 10423 23242 44.8 31711 73.3
Note: The figures are number of persons received training in both longduration and short duration training in tapping.
Source: Compilation based on information gathered from 24 RegionalOffices of the RB, Oct. – Dec. 2012.

53
Table 13 indicates that about a quarter lakh persons were given
training in tapping under the TTS and SDITT during the five year period.
It is also evident that Kerala has been occupying the largest share of
more than 70% in the total number of persons trained during the entire
period. Though the share of women members received training in tapping
hovered around 45%, their share had declined by more than 8% points
between 2007-08 (47%) and 2011-12 (38.6%). The reason for the
declining share of women members received training in tapping is quite
unknown and need further investigation.
However, it may be observed that even the observed level of
women participation in tapper training and skill development in
rubber processing is quite important to be considered given the lower
work participation rate (WPR) among women in agriculture and non-
agriculture sectors in Kerala16. Further analysis about women
participation in tappers’ training programme across regions shows
quite an interesting trend of increased participation ratios above the
overall average (45%) for almost half of the regions as evident from
Figure 7.
For instance, four regions have indicated women participation
rates in the range of 63-69%, highest being reported in Pathanamthitta
and Nedumangad (69% each), followed by Trivandrum (67%) and
Ernakulam (63%). The participation rates were in the range of 51-60%
in six regions, viz., Adoor (59%), followed by Sreekantapuram (57%),
Changanassery (55%), Kottarakkara (53.4%), Thrissur (52.7%) and
Kothamangalam (51%). Interestingly, most of the regions in North Kerala
have shown abysmally lower turnouts for women in tappers training,
the proportions being the lowest at Kanhangad (13%), Manjery (13.8%)
and Taliparamba (21%). Among the regions in Central Kerala,
Muvattupuzha reports the lowest level of women participation in tappers’
training.

54
The constant interest shown by women to acquire tapping skills
is to be seen as an important aspect especially in the context of the
emerging tapper shortage in the state. The important issues emerge here
is that: (a) whether the interest shown by women in learning tapping and
acquiring the skills in rubber processing get effectively translated in
terms of their active presence in the tapping labour market?; (b) if yes,
how dynamic is their presence in the labour market across regions; (c) to
what extent their presence help reduce or mitigate the pressing problems
of tapper shortage?; and (d) if women actively participate in the labour
market, are they adequately compensated for their contributions in
tapping, latex collection, transporting the latex to the collection/
processing centre (point), sheet making, etc?
Figure 7: Figure 7: Figure 7: Figure 7: Figure 7: WWWWWomen participation in training in tapping across reomen participation in training in tapping across reomen participation in training in tapping across reomen participation in training in tapping across reomen participation in training in tapping across regionsgionsgionsgionsgionsin Kerala, 2008 to 2012in Kerala, 2008 to 2012in Kerala, 2008 to 2012in Kerala, 2008 to 2012in Kerala, 2008 to 2012
Note: The figures are five yearly average of women share in total personstrained in tapping by the Rubber Board during 2007-08 to 2011-12.
Source: Compilation based on information gathered from 24 Regional
Offices of the RB, Oct. – Dec. 2012.

55
In fact, these are some of the pertinent issues that require more
empirical scrutiny in terms of region-wise analysis. As these issues are
much beyond the scope of analysis of this paper, it is possible to make
some quick reflections about the status of ‘gender dynamism’ in the
rubber production sector, including the labour market in Kerala.
Unlike the dominant presence of women in the production and
processing activities in the tea, coffee, cardamom and rubber plantations,
active participation of women in the rubber smallholdings has been
quite negligible in Kerala. This is mainly due to the fact that rubber
tapping involves physical exertion in terms of high mobility in the
rubber plots to tap the rubber plants that are located in undulating
topographies and remote areas. Added to these structural issues is the
requirement of performing the tapping activity in the early hours of the
day, which jeopardizes the routine household chores of women. In view
of these practical difficulties, the active presence of women in the
smallholdings has always been either non-existent or negligible. This
trend is in sharp contrast to the rubber plantations in Kerala, where
women account for almost 47% of the total strength of rubber tappers as
well as about 56% of the general workers engaged in weeding and other
activities, such as fertiliser application, soil conservation, etc.
However, one of the important points emerge from the stakeholder
surveys is that in many areas women are seen quite actively supporting
their male counter parts (tappers and growers) in collecting the latex,
carrying it to the sheet making point, coagulating, drying of the sheet,
etc. Reportedly, this trend, coined by some as ‘wife assisted latex
collection’ (WALC) has been on the increase in many areas17. This
arrangement, which is getting widespread in Kerala at present, is an
informal one and enables the tappers to complete their tapping
commitments with other growers. However, a major drawback of this
arrangement is that the contributions by women are not at all compensated
in terms of extra wages or any other types of incentives. Interestingly,

56
the field level interactions reveal that in the absence of any such
incentives or additional wages that compensates for the contribution by
women, a large number of women, who earlier have been actively helping
in latex collection and other activities, are now opt for participating in
the NREGS, which is economically rewarding as well. Perhaps, this
could also be one reason for the declining number of women members
undergoing training in tapping as seen in Table 13.
4.1.2. Import of 4.1.2. Import of 4.1.2. Import of 4.1.2. Import of 4.1.2. Import of TTTTTappers and the Labour Markappers and the Labour Markappers and the Labour Markappers and the Labour Markappers and the Labour Market Outcomeset Outcomeset Outcomeset Outcomeset Outcomes
Historically, expansion of rubber plantations (like other
plantations) in Kerala during early decades of the 1990s has been heavily
dependent on migrant workers, especially tappers from neighbouring
areas of Tamil Nadu. Later, wide-scale of adoption of rubber by the
smallholders also triggered inter-regional as well as intra-regional
migration of workers in Kerala between 1940 and 196018. Arguably,
such inter as well as intra-state labour migrations could resolve the
labour shortages in the rubber plantation and smallholding sectors in
the earlier decades of rubber expansion. For instance, when there had
taken place migration of labourers from Northern Kerala (erstwhile
Malabar region) to work in rubber plantations in Central and Southern
Kerala, there was a counter cyclical migration of peasants and workers
from Central and Southern Kerala to the Northern regions19.
However, such inter-regional or intra-regional migration of tappers
or workers will no longer be a possible solution to the current labour
market crisis in the face of tapper shortage, as almost all regions face
similar problems of tapper shortage. On the other hand, unlike the earlier
decades, there is no such a highly ‘distressed working class’ currently in
Kerala who are very keen to migrate internally and take the advantage
of the situation. The significant advancements taken place in the socio-
economic status of the labourers not only pre-empt them from joining
the labour (also tapping labour) market, but also persuades them to
discourage their younger children from joining the tapping labour market.

57
Given this wide-spread reality, perhaps the only short-term solution
has been to import workers from outside Kerala and employ them for
tapping in areas of acute shortage after providing necessary training.
Being the sole agency promoting rubber cultivation, the Rubber Board
has been diligently following the task of bringing workers from other
states, particularly from North Eastern states of Assam (Nagaon, Jorhat),
Arunachal Pradesh, Nagaland and Meghalaya (Tura) as well as other
states, such as Jharkhand (Ranchi), West Bengal, Orissa (Baripada), etc.
This new policy initiative, known as Integrated Tapper Training Scheme
for Non-Keralites (ITTSNK) by the Rubber Board was launched during
2010-11 with an objective to ensure the supply of migrant labourers
from non-traditional rubber growing states to perform tapping and other
plantation based activities, such as weeding, plant protection, etc. It is
reported that so far, 231 non- Keralite youths were trained and were
allotted to various RPSs in Kerala (Rubber Board, http://
rubberboard.org.in/scheme.asp).
While a detailed study on the impact of the ITTSNK in addressing
the labour market crisis including the tapper shortage issues is yet to be
made available, a preliminary assessment by George (2012) observes
that the intervention did not yield the desired results though the
allotment of the trained tappers is done through the RPS network. Based
on the details of the ITTSNK (till May 2011), it is reported that hardly
34% of the trained labourers have been retained in the smallholdings.
In this regard, our interactions with some of the Model RPSs that
have already launched the Rubber Tapper Bank scheme reveal mixed
outcomes with respect to the recruitment of migrant tappers from outside
Kerala as being promoted by the Rubber Board since the past 3-4 years.
4.1.2.1.4.1.2.1.4.1.2.1.4.1.2.1.4.1.2.1. Rubber Rubber Rubber Rubber Rubber TTTTTappers’appers’appers’appers’appers’ Bank and Changing Local Labour Mark Bank and Changing Local Labour Mark Bank and Changing Local Labour Mark Bank and Changing Local Labour Mark Bank and Changing Local Labour MarketetetetetEnEnEnEnEnvironmentvironmentvironmentvironmentvironment
The Kakkombu Model RPS in Muttom Panchayat in Idukki
district is one of the few RPSs to form Rubber Tappers’ Bank by bringing

58
young workers from Arunachal Pradesh and give them training in tapping.
The Tapper Bank was in operational since 2006 and currently, there are
10 non-Keralaite tappers, who are staying at the RPS building. While
four of the nine migrant tappers have been working in the area since the
last 4-5 years, rest of them are relatively new to join the labour bank. In
fact, 2 of them came with the influence of a senior tapper in the group,
who came here five years back. From the interactions with the Kakkombu
RPS members, it is understood that the migrant tapper arrangement with
the RPS has been going smooth so far as the workers have been able to
perform tapping and other assigned tasks to the satisfaction of the grower
community.
In turn, the migrant tappers are also able to get other jobs (along
with tapping), such as weed cutting, panel protection, rainguarding, etc
in and around the area, which also fetch them additional income besides
the tapping wages. Since the Kakkombu RPS also has a Group Processing
Centre (GPC) attached to it, the migrant workers are also employed in
the GPC for processing of latex into sheet rubber.
Interaction with the migrant workers revealed that they could
significantly benefit after joining the labour bank at the RPS. The workers
reflected that migration to work in rubber holdings in Kerala has
increased their annual earnings along with giving adequate opportunities
for improving their skill levels as evident from Table 14. It also indicates
that the non-Keralite tappers are able to send a reasonable annual income
back to their homes, which even enabled their households to invest in
buying land in their native villages back home. Those interviewed are
also very keen to encourage their friends and relatives to come to Kerala
and explore job opportunities either in tapping or other jobs, depending
on the availability.
The initiatives by Rubber Board towards launching RTB have
been reported to be making some positive impacts in some locations

59TTTT T
able
14:
Pro
fab
le 1
4: P
rof
able
14:
Pro
fab
le 1
4: P
rof
able
14:
Pro
f ile
of
mig
rant
tap
pers
and
wil
e of
mig
rant
tap
pers
and
wil
e of
mig
rant
tap
pers
and
wil
e of
mig
rant
tap
pers
and
wil
e of
mig
rant
tap
pers
and
wor
king
arr
ange
men
ts u
nder
Kak
kor
king
arr
ange
men
ts u
nder
Kak
kor
king
arr
ange
men
ts u
nder
Kak
kor
king
arr
ange
men
ts u
nder
Kak
kor
king
arr
ange
men
ts u
nder
Kak
k om
bom
bom
bom
bom
b u M
odel
RP
Su
Mod
el R
PS
u M
odel
RP
Su
Mod
el R
PS
u M
odel
RP
S
Det
ails
Tapp
er 1
(ag
e: 2
5 yr
s)Ta
pper
2 (
age:
23
yrs)
Tapp
er 3
(ag
e: 2
3 yr
s)
1.W
hen
arri
ved
in K
eral
a20
0820
0920
09
2.E
duca
tion
al s
tatu
s10
th c
lass
7th c
lass
9th c
lass
3.T
rain
ing
in t
appi
ng8
days
8 da
ys8
days
4. I
nitia
l w
ork
in t
appi
ng20
0 tr
ees
@50
pai
se/ t
ree
(3 y
ears
)20
0 tr
ees
200
tree
s
5. C
urre
nt t
appi
ng t
ask
700
tree
s (4
gro
wer
s) –
dai
ly w
age
750
(3 g
row
ers)
700
(2 g
row
ers)
of R
s. 4
50 f
rom
tapp
ing
6. D
escr
iptio
n of
wor
kSt
arts
at
4 am
; ta
ppin
g in
4 p
lots
Tapp
ing
star
ts a
t 4.
30 a
m a
nd l
atex
col
lect
ion
(las
t tw
o ye
ars)
com
plet
e by
7.3
0 am
; la
tex
fini
shed
by
11 a
m.
col
lect
ion
com
plet
e by
10
am;
wor
ks a
t the
Gro
up P
roce
ssin
g
Cen
tre
at K
akko
mbu
RPS
/ go
es
for
wee
d cu
tting
in
othe
r pl
ots:
earn
s ab
out
Rs.
350
-@65
/hr
for 5
hrs
(2 y
ears
)
7. M
oney
rem
itted
to h
ome
Rs.
800
00 –
1 l
akh
per
annu
mR
s. 7
5000
-800
00 p
er a
nnum

60
8. M
onth
ly E
arni
ngs
Rs.
120
00 f
rom
tap
ping
;
Rs.
200
0-30
00 f
rom
wee
ding
Rs.
110
00 –
120
00 f
rom
tap
ping
9. S
kill
upgr
adat
ion
Lea
rned
ele
ctri
cian
cou
rse
and
Asp
irin
g to
lea
rn t
he s
kill
Pas
sedw
eldi
ng
driv
ing
and
aspi
re f
or a
n up
war
d o
f us
ing
mec
hani
cal
wee
dte
chni
cian
cou
rse
mob
ilit
y c
uttin
g th
at w
ill p
rovi
de(2
yrs)
addi
tion
al e
mpl
oym
ent
oppo
rtun
itie
s
10. H
is im
pact
fac
tor
Bro
ught
15
peop
le f
rom
Inte
nd t
o br
ing
frie
nds/
rel
ativ
es t
o ru
bber
tap
ping
Aru
nach
al (
8 em
ploy
ed w
ith w
ork
from
nat
ive
whe
n go
nex
t tim
e
Aim
com
bu R
PS; 3
in
Ant
hiya
lam
RPS
; 4 in
nea
r
loca
lity
)
Sour
ce: I
nter
view
with
thre
e N
on-K
eral
ite ta
pper
s w
ho a
re m
embe
rs o
f R
ubbe
r Tap
per
Ban
k fo
rmed
by
Kak
kom
bu M
odel
RPS
, Mut
tom
, Idu
kki D
istr
ict.
Det
ails
Tapp
er 1
(ag
e: 2
5 yr
s)Ta
pper
2 (
age:
23
yrs)
Tapp
er 3
(ag
e: 2
3 yr
s)

61
that are reeling under tapper shortage. For instance, the Board had
brought in about 40 workers from Assam and other states and trained
them in rubber tapping and allocated them to various tapper short areas
under the jurisdiction of the regional office, Kottarakkara. However,
discussions with farmers and RPS members in this region have revealed
that despite such efforts, there exists improper management of latex
collection and sheet making in the region. This area requires proper
capacity building among the growers. Activities, such as weeding,
fertiliser application etc, are being done by workers from Nepal, West
Bengal, Bihar, etc.
One advantage of non-Kerala tappers over native tappers, as
observed by the growers, is that the non-Keralite tappers do not show
any inhibitions in doing tapping even during rainy season, if asked for.
Moreover, when non-Keralite tappers are engaged, they properly do the
latex collection as well as processing of rubber, unlike the lapse and
lack of sincerity shown by the existing native tappers. It is widely reported
that in the emergent scenario of acute tapper shortage, tappers on job
often do not collect the scrap from the rubber trees, as they consider it
waste of time. In terms of work performance, it is reported that non-
Keralite workers complete the work in a day, which workers from Kerala
do in one a half a day’s time. At the same time, it is also being reported
that proper training and monitoring of the tapping work done by non-
Keralaite tappers becomes essential to ensure that the improper or
unscientific tapping does not cause damage to the trees.
Experiments with RTBs are also going on in a few of the other
RPSs in the Pala region, viz., Anthiyalam, Aimcombu, Vayala East and
Thekkumury. In such instances, workers brought from states, such as
Jharkhand, West Bengal and Assam are trained and engaged with the
above RPSs, which also operate group processing centres (GPC).
However, it is reported that, though many workers have been given
training in tapping, hardly 25-30% of these newly trained tappers stick
to the work due to problems of adjustment in the new environment and

62
locality. By and large, the problems faced in such arrangements as
reported by the growers and the non-Keralite tappers are related to the
drastic changes to be brought in the food habits and life style in the new
place. Absence of friendship networks, separation from the family as
well as the problems in getting social acceptance among the growers
and other local people in the new areas are also reported to be major
reasons for the retreat of the newly trained non-Keralite tappers. Also,
there is a clear preference among the traditional growers in particular20,
for local tappers and this preference being so strong, all such migrant
tapper-tying arrangements to overcome tapper (labour) shortage are most
likely to have limited success and operational significance.
Similar trends are being reported from Kanjirapally area, where
hardly 5-6 non-Keralite tappers are available for work, despite training
more than 20 workers. A major reason indicated for this lukewarm
response from migrant tappers is that, perhaps the workers have been
brought in the pretext that they will be immediately absorbed in the
labour market as tappers after training. But, this was not agreeable to
many growers as they feared that these workers, who are newly introduced
into tapping, might cause more damage to the rubber trees. Hence, it was
commonly agreed that these workers be absorbed initially for non-
tapping jobs (like weeding, fertiliser application, rainguarding, panel
protection, etc) and later engage them into tapping once they acquire
skill and confidence in scientifically and efficiently managing the
tapping task assigned. In fact, this condition was not agreeable to the
newly trained migrant workers as they are asked to perform work other
than tapping which fetch them lower wages/ earnings than tapping. In
effect, this strategy of labour absorption with gradual promotion to
tapping as conceived by the RPSs in some cases has not been quite
successful in retaining the trained workers from other states, without
much positive impact in resolving the crisis in the labour market. Further,
in Taliparamba region in North Kerala, some of the RPSs have trained
workers from Nagaland and incorporated them into the labour market

63
by allocating them to areas facing tapper shortage. But, it turned out
that after few months of work, they all went back home indicating a
return, but, never turned up.
The scattered cases of recruiting non-Keralite tappers as described
above show mixed responses in terms of their implementational
outcomes. It also underscores that such ad hoc crisis management
strategies seem to work only under conditions where the migrant tappers
are given adequate facilities for accommodation, recreation, other
employment opportunities besides tapping, fulfilling the terms of
contract, etc. As such, there are several inherent limitations in broad-
basing or scaling up such an innovative strategy across regions in Kerala
due to many operational level constraints as discussed above. It is also
important to note that currently, much of such labour recruitment
processes are based on individual grower initiatives (except for a few
instances where the Rubber Board and the RPSs took the lead) and there
are several problems with respect to: (a) arriving at mutually beneficial
contractual terms; (b) provisions for social protection and health of the
migrant tappers; (c) transaction costs21 involved in accessing information
about the attributes of the workers, their assimilative capacity while
learning tapping skills, integrity in performing the assigned tasks, etc.
5. 5. 5. 5. 5. TTTTTooooowwwwwards Reinards Reinards Reinards Reinards Reinvvvvventing Policies and Institutional Strateenting Policies and Institutional Strateenting Policies and Institutional Strateenting Policies and Institutional Strateenting Policies and Institutional Strategiesgiesgiesgiesgies
The foregoing analysis clearly demonstrates the labour market
dilemmas caused by the emergent tapper shortage affecting rubber sector
in Kerala. Arguably, tapper shortage as emerged in Kerala’s rubber sector
may be equated with that of the Indian rubber plantation sector in view
of the preeminent status of Kerala in rubber production. In a comparative
sense, it may be viewed that the tapper shortage as loom large in Kerala’s
rubber sector is a replica of the labour shortages as experienced in other
dominant rubber producing countries, such as Malaysia, Thailand,
Indonesia, China and Sri Lanka and some parallels can be drawn between
India (Kerala) and these countries.

64
More precisely, the process of rubber expansion in all these
countries had passed through serious labour shortage problems due to
various exogenous and endogenous factors. For instance, Malaysia
experienced serious labour (tapper shortage) in the 1980s and 1990s
owing to: (a) land grant (settlement) policies along with intense rubber
plantation development programmes under the aegis of the FELDA;
and (b) poor wages and working conditions in the plantations22. The
phenomenal growth in the manufacturing, construction and services
sectors had caused significant labour movements from plantations to
those sectors. Malaysia tried to resolve the rubber plantation labour
shortages through: (a) increased importation of immigrant workers from
Indonesia, Nepal, China, Bangladesh, Burma (Myanmar), India, etc; (b)
adoption of low intensive tapping systems23; (c) limited adoption of
labour saving tapping implements, such as semi-automatic tapping
knives; and (d) reduced acreage under rubber along with massive land
conversion to other crops, particularly oil palm (Mascareñas, 2010; Kaur,
2006). In Indonesia, the Asian financial crisis had adversely affected its
rubber industry and many tappers have looked for jobs elsewhere or
switched to oil palm, leading to labour supply shortages in North Sumatra
(where violence compounds the current difficulties), South Sumatra
and Jambi (Balsiger, et al., 2000).
Whereas, countries, such as China and Sri Lanka have mainly
adopted measures, such as: (a) promotion of innovative tapping
techniques; (b) reducing the tapping frequency by adopting LFTs;
(c) applying gaseous stimulant to stimulate latex yield and increasing
cutting spots from two to four per tree (Xing, Lu and Lin Song, 2010;
Rodrigo, 200724). In contrast, Thailand tried to address the tapper
shortages experienced in rubber sector through a radical move
towards a system of crop sharing, wherein, almost 30-40% of the
crop is being shared as tapping wages (Somboonsuke, 2000;
Viswanathan, 2006).

65
`However, the scenario of emerging tapper shortage in Kerala is
quite distinct when compared to other major rubber producing countries,
as rubber in Kerala is produced mostly by small and marginal farmers
with an average holding size of 0.5 ha and below. Even if we examine
the scenario between smallholder and estate sectors in Kerala, it may be
seen that the smallholder sector bears the brunt of tapper shortage. This
is because, though almost 10% of the total rubber area in Kerala is under
the estate sector, many of the rubber plantations do not face serious
shortage of workers and tappers at the current moment, as observed
above.
Certainly, the tapper scarcity as experienced in the smallholder
sector had also resulted in significant increase in wages and earnings of
tappers as well as other workers. The wage increase was also induced by
the steady increase as well as stability in rubber prices over the past
several years. As prices were increasing, rubber growers also positively
responded by increasing the tapping wages significantly as already
observed (Tables 7, 8 and 9). While growers tried to manage the tapper
shortage by paying the increased tapping wages as well as adopting
other short-term crisis management measures as discussed, there was
also increased mechanisation of weeding operations in regions without
any exception. This trend towards increased mechanisation of weeding
operations was also facilitated by institutional support by the Rubber
Board through 50% subsidy for buying weed cutting machines.
5.1. Market Uncertainties and Sustainability of Income Flows5.1. Market Uncertainties and Sustainability of Income Flows5.1. Market Uncertainties and Sustainability of Income Flows5.1. Market Uncertainties and Sustainability of Income Flows5.1. Market Uncertainties and Sustainability of Income Flows
It is important to note that the tightening of the labour market in
the context of labour shortage had resulted in significant increase in
wages of all activities associated with the rubber production, besides
tapping. It also had resulted in narrowing down of the wage disparity
that existed earlier among tappers across regions in Kerala. A piece rate
based wage payment system has come to stay in almost all the regions
with minimum inter-regional variations in the rates. For instance, while

66
tapping wages hovered between Rs. 150 to 225 per 100 tree, the daily
wages for fertiliser application ranged between Rs. 550 to Rs 750.
Similarly, wages for rainguarding touched Rs. 5 to 7 Rs .50 per tree and
wages for operating mechanised weed cutter became Rs. 175 to Rs. Rs
250.
It may be observed that the simultaneous rise in rubber prices and
the subsequent increase in wages of all kinds had resulted in a win-win
situation for the growers as well as tappers and other workers as also
evident from Table 15. As evident from the Table, both the earnings of
growers and tappers have increased by more than 13% and 16% per
annum respectively between 2008 and 2012. In a relative sense, income
gain was more for tappers than growers and there was also a notable
increase in the relative share of wages paid to tappers during 2012
(56%) as compared to 2008 (50%).
TTTTTable 15: Changes in earnings of rubber groable 15: Changes in earnings of rubber groable 15: Changes in earnings of rubber groable 15: Changes in earnings of rubber groable 15: Changes in earnings of rubber growers and tappers betweenwers and tappers betweenwers and tappers betweenwers and tappers betweenwers and tappers between2008 and 20122008 and 20122008 and 20122008 and 20122008 and 2012
Earnings Year South Central North OverallKerala Kerala Kerala Kerala (67)(n=22) (n=23) (n=22)
Earnings of 2008 78687 80531 84579 81266
Growers 2012 126079 135550 145325 135652
(Rs.) (%) rise/ 12.0 13.7 14.4 13.4annum
Wages paid 2008 42853 41666 38457 41002
to tappers 2012 72438 85170 68454 75454
(Rs.) (%) rise/ 13.8 20.9 15.6 16.8 annum
Tapping 2008 54.5 51.7 45.5 50. 5
wages 2012 57.5 62.8 47.1 55.6 (% share)
Source: Survey data, 2012

67
However, it needs a mention here that the growing shortage may
further increase the tapping and other wages in the near future, which
may not be acceptable to the growers, as majority of them feel that
tapping wages are already the highest in relation to the services rendered
by the tappers. In general, it is learnt from the discussions that a large
segment of rubber growers are highly apprehensive of the poor and less
scientific ways of tapping being performed by the low-skilled tappers in
many areas. On the other hand, rubber prices have been falling in recent
times, signaling a crisis in the output market, which may not be possible
to be transmitted to the labour market in terms of depressing the wages
as had happened during the plantation crisis of late 1990s.
Hence, it may be argued that sustainability of smallholder rubber
system would face a perilous situation, if such market uncertainties as
caused by drastic price fall emerges in future and persists for long,
adversely affecting the fortunes of a vast majority of small and marginal
producers in Kerala, majority of whom are currently left with tiny plots
of rubber with smaller number of tappable trees25 (even 50-100 trees).
For instance, the census of rubber holdings undertaken by the Rubber
Board’s Regional Office, Nedumangad during 1998-99 brings out an
interesting dimension of the already declined holding size. The
distribution of 30 villages in the Nedumangad taluk based on the average
size of tapped rubber holdings reveals that in almost 57% of the villages,
the average size of rubber tapped area fall in the range of 0.21 to 0.25 ha
(average size being 0.23 ha) with the average number of trees tapped
being 103. This point to the fact that a tapper who is exclusively engaged
in tapping such a plot with few numbers of rubber trees ends up earning
an annual tapping wage of Rs. 16000-17000 even at the prevailing high
tapping wages. Similarly, it is quite likely that in the face of growing
market uncertainties, a drastic decline in prices might disrupt the
earnings of a large segment of the marginal rubber growers who own
tiny plot with small number of tappable trees.

68
5.2. Revisiting Planting and Extension Support Policies5.2. Revisiting Planting and Extension Support Policies5.2. Revisiting Planting and Extension Support Policies5.2. Revisiting Planting and Extension Support Policies5.2. Revisiting Planting and Extension Support Policies
Invariably, the perceptible decline in the operational holdings in
Kerala might have triggered the crisis in the labour market, as the already
scarce tapping labour force are getting thinly distributed with the
attendant problems involved in getting an ideal tapping task to earn a
reasonable wage income. To a certain extent, the scaling down of the
plantation development (replanting and new planting) subsidy
programme to a minimum size of 0.10 ha26 would also have induced the
process of sub-division and fragmentation of plots as the provision of
subsidy by the Rubber Board is contingent upon strict demarcation of
area intended for replanting/ new planting. Though the scale of subsidy
that a small marginal grower gets for planting rubber in 0.10 ha is
negligible, he/ she opts for the same, as such support also makes him/her
eligible for all the R&D and extension systems provided by the Board.
A case in point is the latest support provided in terms of subsidy for
purchasing weed cutter machines27. Though the subsidy for procuring
weed cutting machine has been quite helpful to a large number of farmers
facing acute labour shortage, the fact that the machine is also used for
clearing weeds in non-rubber lands makes the cash subsidy given by the
Board highly misplaced. Incidentally, such a subsidy could have been
effectively utilized for strengthening capacities of the rubber tapping
labourers.
This point leads to the important issue of labour welfare (LW)
schemes of the Board. Though labour welfare programmes of the Board
have grown in heaps and bounds over the past decades, the assistances
have been thinly distributed across labourers both in the plantation and
smallholder sectors. Table 16 presents the extent of benefits distributed
to workers across regions in Kerala during 2011-12. It shows that workers
from Central Kerala are the major benefactors of the schemes with more
than 50% share in the total number of beneficiaries (54.5%) and amount
distributed (53%). While the average amount received by beneficiary

69
was about Rs. 5000 at the aggregate level, the scale of benefit varies
across the seven LW schemes from Rs. 1000-2000 for educational stipend
scheme to Rs. 5000 for sanitation scheme and further to Rs. 15000 per
beneficiary under the housing subsidy scheme for SC/ST.
TTTTTable 16: Distribable 16: Distribable 16: Distribable 16: Distribable 16: Distribution of Benefution of Benefution of Benefution of Benefution of Benefits under Labour its under Labour its under Labour its under Labour its under Labour WWWWWelfelfelfelfelfare Schemes byare Schemes byare Schemes byare Schemes byare Schemes byRubber Board, 2011-12Rubber Board, 2011-12Rubber Board, 2011-12Rubber Board, 2011-12Rubber Board, 2011-12
Region Labour welfare schemes Amount per
beneficiary (Rs.)
Beneficiaries Amount (Lakhs)
South Kerala 1035 (20.7) 39.22 (17.8) 4036
Central Kerala 2719 (54.5) 116.06 (52.8) 4322
North Kerala 1235 (24.8) 64.69 (29.4) 5261
Total 4989 (100.0) 219.97 (100.0) 4576
Note: Figures in parentheses indicate the respective shares in total.
Source: Data gathered from 24 ROs of the Rubber Board, 2012.
However, it is important to note that while the allocations for
labour welfare schemes by the Board had increased over time, the
aggregate amount of support is nominal when compared to the support
given for the rubber growers under the rubber plantation development
(RPD) scheme. In a relative sense, the amount expended for LW schemes
constitute hardly 4% to 5% of the total amount spent for RPD schemes
at the national level (Appendix 1), which is an important area for concern
needing a fresh look in the event of growing labour and tapper shortage
in Kerala. At the same time, it is also important to note that the labour
welfare schemes in the current format is more broad-based and may not
act as effective instruments to retain the existing tappers as well as
attract newer ones into tapping. Attracting youngsters through various
incentives and innovative programmes should form the integral aspects
of labour welfare programmes of the Board in the emerging context. At
the same time, it is also important that new labour welfare programmes

70
should also be specifically devised for attracting and retaining migrant
tappers whose requirements might be different from the local tappers.
5.3. Policies and Interventions to Strengthen the Domestic Labour5.3. Policies and Interventions to Strengthen the Domestic Labour5.3. Policies and Interventions to Strengthen the Domestic Labour5.3. Policies and Interventions to Strengthen the Domestic Labour5.3. Policies and Interventions to Strengthen the Domestic LabourMarketMarketMarketMarketMarket
As clearly emerge from the analysis, sourcing migrant tappers
from outside Kerala is not going to offer sustainable solutions to the
labour/ tapper shortage problems in Kerala. This is because of the limited
success of the scattered efforts by the Rubber Board as well as RPSs and
individual growers. Besides various other concerns, including social
acceptance of the migrant tappers among the rubber growers, brining
the non-Keralite tappers involve huge transaction costs in terms of: (a)
search and recruitment costs; and (b) supervision and retention costs. It
would also entail more state level initiatives for providing adequate
social protection for the workers.
Hence, the feasible solutions to tapper shortage problems in the
state lies in strengthening the domestic labour market are through: (a)
effectively retaining the existing tapping labour force, majority of whom
are highly experienced, skilled and committed to the profession; (b)
promotion of technological innovations in rubber tapping, including
provision of incentives for wider adoption of LFTs28 ; and (c) attracting
younger generations as well as women towards tapping. The Rubber
Board and other stakeholders in the rubber sector should seriously
consider the increasing visibility of women in the tapping labour market
[through informal assistances rendered to their male counter parts] along
with the growing enthusiasm among women in acquiring tapping skills
and try to be highly responsive to such dynamism emerging in the
labour market, which was unprecedented.
More importantly, given the distinct demographic and socio-
economic transformation taken place in Kerala over the past 2-3 decades
along with changing aspirations and life styles of the youth29 [which

71
also received wider social acceptance in the state by now], it is high
time to explore how the younger generations can be attracted to join the
tapping labour market in Kerala. Primarily, this calls for devising
strategies and technological innovations for processing and product
development programmes based on a closer understanding of the
preferences of the youth in and around rubber growing regions in the
state. Even guaranteeing a fixed monthly income for rubber tapping on
par with the alternative employment options (like driving rickshaws,
cabs, construction, service providing activities) might help to a large
extent to attract youngsters into tapping.
Being the lead institution in the promotion of smallholder rubber
system in Kerala, the Rubber Board may consider the following points
for close scrutiny and examine their worthiness for possible
implementation to overcome the crisis in the labour market.
1. Forming a Rubber Tappers’ Society (RTS) to be based at the
RPSs;
2. Establishment of eco-friendly group processing centres30 with a
potential of employing a minimum of 8-10 tappers;
3. Creating locally feasible job opportunities at the RPSs for young
tappers to engage into, after doing tapping as in the case of the GPCs;
4. Providing partial financial assistances to younger tappers to start
self-employment, small business, purchase of auto rickshaws;
5. Reserving job opportunities available at the Regional/ Field
Offices to the young tappers;
6. Organising or offering support for skill development programmes
in other activities with increased upward occupational mobility;
7. Introducing a monthly pension scheme to old/ experienced
tappers and new tappers who have a minimum of five years
experience in tapping;

72
8. Creating a specific fund (realized through collection of rubber
cess), called, ‘Tapper Welfare Fund’ based at the RPSs, which is
to be given to the needy workers/ tappers for medical expenses
and other contingencies. A fixed amount can be distributed per
annum to the registered tappers without seeking for certifications
or proof of the expenses incurred;
9. Scaling up and increasing capacities of the existing group
processing centres (attached with the RPSs) with the scope for
providing employment to a minimum of five young tappers from
the local areas, etc;
10. Setting up of rubber wood primary processing factories in few
more locations, which could potentially employ a minimum of
15-20 tappers.
In summing up, the observations and arguments made in this paper
are drawn based on surveys among rubber growers, tappers, RPSs as well
as discussions with the key officials in the Production Department of
the Rubber Board. The analysis reflecting on the stakeholder impressions
about the emerging tapper shortage, its impacts on the local labour
market, agrarian relations, the responses and strategies being adopted
by growers, planters, RPSs and the Rubber Board for managing the
crisis brings out some interesting issues that need further empirical
scrutiny involving larger coverage of growers, tappers and regions. A
critical issue emerging from the entire analysis is the sustainability of
the smallholder rubber production system in Kerala in the context of the
labour market crisis, and the long-term feasibility of the institutional
and policy regime followed for the vigorous expansion of rubber devised
by the Rubber Board in the 1950s through 1980s, which apparently
pose several challenges in a severely land and labour constrained society.
This certainly calls for a fresh look at the whole gamut of policies,
institutions and governance regimes that facilitated rubber expansion
in Kerala in a historic perspective.

73A
ppen
dix
1:
App
endi
x 1:
A
ppen
dix
1:
App
endi
x 1:
A
ppen
dix
1: TTTT T
rend
s in
Exp
endi
ture
on
Rub
ber
Pla
ntat
ion
De
rend
s in
Exp
endi
ture
on
Rub
ber
Pla
ntat
ion
De
rend
s in
Exp
endi
ture
on
Rub
ber
Pla
ntat
ion
De
rend
s in
Exp
endi
ture
on
Rub
ber
Pla
ntat
ion
De
rend
s in
Exp
endi
ture
on
Rub
ber
Pla
ntat
ion
De vvvv v
elop
men
t an
d L
abou
r el
opm
ent
and
Lab
our
elop
men
t an
d L
abou
r el
opm
ent
and
Lab
our
elop
men
t an
d L
abou
r WWWW W
elf
elf
elf
elf
elf a
re s
chem
es b
y th
ear
e sc
hem
es b
y th
ear
e sc
hem
es b
y th
ear
e sc
hem
es b
y th
ear
e sc
hem
es b
y th
eR
ubbe
r B
oard
Rub
ber
Boa
rdR
ubbe
r B
oard
Rub
ber
Boa
rdR
ubbe
r B
oard
Yea
rR
ubbe
r P
lant
atio
nL
abou
r Wel
fare
(LW
) Sch
emes
LW a
s %
of
Dev
elop
men
t (R
PD)
RPD
Am
ount
Am
ount
per
Am
ount
Ben
efic
iari
esA
mou
nt p
er (
Rs.
Mill
ion)
ha
(Rs.
) (
Rs.
Mill
ion)
(#)
ben
efic
iary
2000
-01
190.
9914
232
12.1
117
410
696
6.34
2001
-02
139.
9711
370
12.2
116
456
742
8.72
2002
-03
263.
4019
834
22.5
417
965
1255
8.56
2003
-04
227.
8015
897
20.0
120
289
986
8.78
2004
-05
310.
7015
828
16.8
818
614
907
5.43
2005
-06
363.
7014
986
17.5
918
212
966
4.84
2006
-07
343.
3011
489
15.6
519
467
804
4.56
2007
-08
391.
7012
534
29.6
731
825
932
7.57
2008
-09
577.
4014
363
25.8
124
081
1072
4.47
2009
-10
680.
8018
652
29.0
624
414
1190
4.27
2010
-11
641.
3017
814
26.6
714
854
1795
4.16
Sour
ce:
Com
pile
d fr
om I
ndia
n R
ubbe
r St
atis
tics,
var
ious
vol
umes
.

74
AcknowledgementsAcknowledgementsAcknowledgementsAcknowledgementsAcknowledgements
I take this opportunity to express my sincere thanks to
the National Research Programme on Plantation
Development at the Centre for Development Studies,
Trivandrum, Kerala for providing support for undertaking
the study. I have immensely benefited from the
discussions/ interactions and interviews I had with the
various stakeholders, viz., key officials at the Regional
Offices of the Rubber Production Department, Rubber
Board, members of the Rubber Producers’ Societies;
Rubber Growers and Rubber Tappers from various regions
of Kerala. I express sincere thanks to the experts who
provided useful comments at the project proposal
discussion workshop held at the Centre for Development
Studies on the 19th September 2012. I also thank
Prof. D. Narayana for the encouragement and support
during the formative stages of the study; Prof. K.J. Joseph
and Prof. P.S. George for the valuable comments on an
earlier draft; Mr. R. Rajesh and Mr. P.R. Suresh for helping
me in the field work. The usual disclaimers apply.
PPPPP.K. .K. .K. .K. .K. VVVVViswiswiswiswiswanathananathananathananathananathan ([email protected]) is currently
working as Associate Professor at Gujarat Institute of
Development Research.

75
NotesNotesNotesNotesNotes
1 The decline in employment (excluding harvesting and post-harvestingoperations) due to a decline in area would have been around 35 millionman days between mid seventies and early eighties and around 50 millionman days by mid nineties (Kannan, 1999). The decline in employment hasoften been ascribed to the decline of area under paddy by more than 50%over time along with neglect of the highly labour intensive cultural operationsdue to the phenomenal increase in wage costs (Viswanathan, et al., 2003).
2 For more detailed discussion on the dynamics of functioning of theagricultural labour markets and changing agrarian relations in the state, seeNair (1997); Thomas and Thomas (1999a, b); and Kannan (1998, 1999).
3 Historically, agricultural wage rates in Kerala in general have been high dueto the unionised strength of the workers despite high rates of unemployment.The role of sociological factors operating through the modernising influenceof education (which has also tended to concentrate less on technical andvocational training) had played an important role in shaping people’s attitudeto work (Eapen, 1999).
4 Though rubber in Kerala was introduced as an estate/ plantation crop in theearly 1990s, it has witnessed significant adoption by the small growers overtime due to a variety of favourable factors (see George et al., 1988). Currently,rubber in Kerala is even considered as a ‘homestead crop’ and thesmallholdings sector accounts for almost 89% of area and 93% of productionof rubber.
5 As observed, the crisis has been turned as an opportunity by the planters todo away with all social security and welfare provisions as stipulated by thePlantation Labour Act 1951. The unfriendly labour policies and labourretrenchment measures as adopted by the plantations in the context of thecrisis have resulted in serious implications for the sustainable future ofplantations. This has become more evident from the acute labour shortageexperienced by the plantation units despite a reasonable improvement inprices of plantation products and wages in recent years. A significantproportion of the workers have already migrated to other industries followingthe retrenchment policies adopted by the planters (Viswanathan and Shah,2012a).
6 This figure of tapper requirement of 1.7 tappers per ha has been derivedbased on discussion with experienced rubber planters/ growers as well asexperts at the Association of Planters Kerala.
7 Based on the latest available information, rubber plantations in Kerala provideemployment for about 0.6 lakh workers and women constitute about 48%of this work force (Labour Bureau, 2009).
8 Rubber tapping requires a special skill which has to be acquired throughtraining. It is reported that majority of the existing tappers (58%) acquires

76
tapping skill undergoing apprenticeship with experienced fellow tappers,while a large number (20%) learns it by doing slaughter tapping. TheTappers Training School (TTS) established by the Rubber Board has alsobeen a major source of training as reported by 15% of the tappers (Source:Survey of Rubber Tappers undertaken by the author during 2008).
9 Tapping is the process of extracting latex from a rubber tree, which is doneby shaving the bark of a mature rubber tree at a specific height and slope.The latex flowing through the cut portion is collected in a cup and thenconverted into usable forms of processed rubber.
10 More or less similar observation has been made by Strasser (2009) whoreported that in a village (Thalanadu) in Central Kerala, about 63% of therubber growers adopted alternate daily tapping system, while 8% followedonce in three days tapping (S2D3) and 3% followed daily tapping.Interestingly, about 15% of the growers adopted variable system of tapping,which meant the flexibility exercised by the growers in adopting tappingsystem depending on prices and labour availability. Further, in an earlierstudy undertaken during 1997-98, Viswanathan and Rajasekharan (2001)reported that about 89% of the growers in Central Kerala had adoptedalternate daily tapping (S2D2) system. Interestingly, the adoption of alternatedaily tapping system was quite high in Northern Kerala (95%) and Palakkad(92%).
11 The relative share of part-time farmers was reported to be of significantproportion across regions in the state and it was exceptionally high in theSouthern region (78 %) compared to Central (52%) and Northern (24%)regions in Kerala (George, 1999).
12 While the share of smallholdings with an average size below two hectares inthe total rubber area had increased from 24% during 1955-56 to 77% in2009-10, the average holding size declined from 0.50 hectares to 0.46 ha atthe national level. The corresponding decline in the size of rubber holdingsin Kerala has been much more severe as evident from the micro-level trendsin replanting and newplanting, where the unit area planted hovers around0.25-0.30 ha in a large number of instances (Data compiled by the authorfrom the Production Department of the Rubber Board).
13 The syndrome of ‘Multiple grower dependence among tappers’ signifiesthe attachment of a tapper to more than one grower at a time in order toaccomplish the task of tapping. Under this arrangement, a tapper taps rubbertrees in more than one plots owned by a single or more growers. This trendtowards multiple grower dependence has emerged in Kerala particularlysince the late 1990s in the face of tapper shortage on the one hand and thelack of availability of adequate number of trees from a single rubber plotdue to fragmentation of holdings (Viswanathan, et al., 2003).
14 The main objective for formation of Rubber Tappers Bank (RTB) is toensure due recognition, social status, attractive remuneration and job security

77
for tappers and thereby to motivate skilled and trained hands to remain inthe job who are instrumental for realizing the envisaged production,productivity and economic life span of rubber plantations. The RubberTappers Banks are envisaged as Self Help Groups functioning under RubberProducers Society (Rubber Board).
15 The RPS based labour bank (LB) formation is being highly promoted bythe Rubber Board, to overcome the labour shortage. A minimum of 5members is the stipulated size to form a labour bank attached to the RPS.It is reported that 9 RPSs have already formed the labour bank. Theassistances provided under the labour bank include cash benefits worthRs. 8000 besides ensuring minimum 100 days tapping work. Accordingly,it ensures a minimum of 25 days of tapping work per month, weatherprotection allowance of Rs. 100 for 50 days (Rs. 5000); Medical allowanceof Rs. 1000, etc (Source: personal communication with Dy. RubberProduction Commissioner, Rubber Board Regional Office, Pala, dt. 28December 2012).
16 Census 2001 shows that Kerala has the lowest workforce participation rateamong females among all the major states in India. The total workforce inKerala, according to the 2001 Census estimates is around 10.3 million outof which 7.8 millions are males and only 2.5 millions are females. While thefemale WPR at the national level had increased from 22.3% during 1991 to25.7% during 2001, the corresponding figures for Kerala had remainedbelow 16% during both the Census periods. Even the later assessmentsmade by the NSSO 61 Round (July 2004 – June 2005) indicated a relativelylower WPR in rural farm employment for Kerala (26%) as against 33% atthe all-India level (Viswanathan and Mandal, 2012b).
17 An earlier study (Viswanathan et al., 2000) also highlighted this aspect ofsignificant contribution by women family members in helping their malecounterparts (tappers and self-tapping growers) in latex collection,coagulation, sheet making, etc. It has been reported that majority of thetappers (56%) surveyed were receiving the help from female family membersin latex collection and sheet making.
18 The process of peasant migration that took place between 1940 and 1960from Travancore to the Malabar region of Kerala and the socio-economicsituations including tenurial conditions that prevailed in these regions havebeen extensively documented (Panikar et al., 1978; Panikkar 1979; Raj andTharakan, 1983; George and Tharakan, 1984; Joseph, 1988; Radhakrishnan,1989).
19 While there are no conclusive evidences as regards the actual estimates ofthe volume of migrants from Travancore to Malabar, the 1971 Census datashows that the total Christian population in Malabar region was 442510when compared to just 31191 as per the 1931 Census. The Directory ofCatholic Diocese of Tellicherry also substantiates this point indicating thatthe catholic population in the diocese has increased from 123219 in 1960 to

78
292815 in 1971, registering an increase of almost 138 per cent (Directoryof Diocese of Tellicherry for 1960 and 1971, as cited in Joseph, 1988).
20 Reportedly, this strong preference for local workers/ tappers emerges fromthe concerns among the elderly growers that the significant presence ofmigrant workers in the village surroundings might disturb the ‘otherwisepeaceful’ life in the villages. To strengthen such emotive feelings, they alsoshare the common feeling that unlike the migrant workers, the local workersgive due respect to the social milieu in the villages.
21 Cultivators generally prefer workers whose capabilities are known to them.In the absence of such information, it may not be possible for a farmer toallocate a worker to a task in which he or she has comparative advantage,which is a case of market segmentation and information asymmetries. If thefarmers do not have adequate information about the capabilities and theintegrity of a worker, he would rather go without employing anyone. Anissue closely related to transaction cost is supervision cost. If there is nosupervision, workers have a tendency to shirk work. The cost of supervisingworkers is a barrier to the efficient allocation of workers by task and asource of inefficiency (Nair, 1997).
22 In Malaysia, labour shortage has been plaguing the rubber plantation industryand some of the smallholdings were even abandoned due to this problem.Figures from the Malaysian Agricultural Producers’ Association show thatduring 2003 the labour supply could meet only about 50 percent of theactual requirement in the estate sector. The latest census carried out by theRubber Industry Smallholders Development Authority (RISDA), in 2002indicated that the vast majority of rubber smallholders are in the age groupsof 50-60 years old or above 60 years (Xing, Lu and Lin Song, 2010).
23 Malaysia developed the short cut system of rubber latex extraction, calledthe RRIMFLOW (after Rubber Research Institute of Malaysia) to overcomethe constraints faced by the rubber industry, caused by scarcity of skilledtappers, rising costs of production, low productivity per unit area and hencepoor profitability margin. This system, which was being evaluated since1991, has been adopted commercially in large areas. It is currentlyrecommended for commercial adoption, 15 years of age and above and onold rubber, 5 to 8 years from replanting (www.emp.com.my/emp/rrimflowwriteup.html).
24 In China, as the cutting frequency was reduced and tapping with chemicalstimulus was introduced, the number of total cuts in a year dropped from105 in 1997 to less than 80 in 2002, a reduction of 30% of cuts and savingone third of bark and prolonging the service years of the rubber trees. Byreducing the cut wounds, the possibility of wound-related diseases has beenaccordingly reduced (Xing, Lu and Lin Song, 2010).
25 The details of the census of rubber holdings as undertaken by the Rubber BoardRegional Office Nedumangad during 1998-99 are presented in Table below.
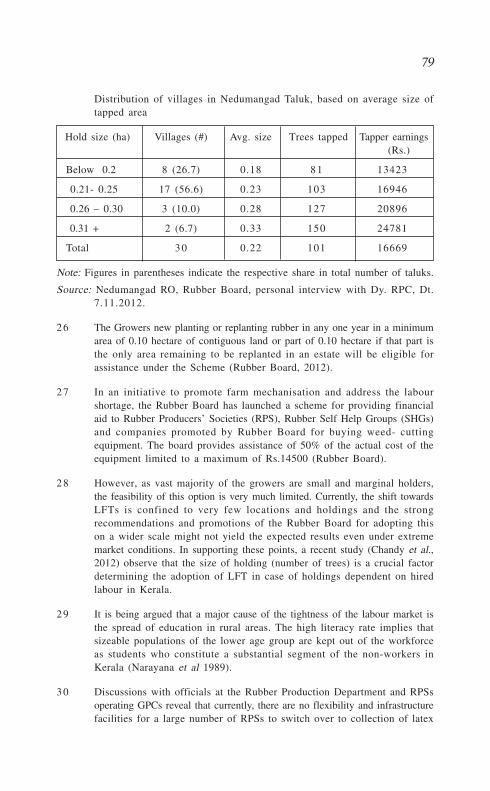
79
Distribution of villages in Nedumangad Taluk, based on average size oftapped area
Hold size (ha) Villages (#) Avg. size Trees tapped Tapper earnings(Rs.)
Below 0.2 8 (26.7) 0.18 81 13423
0.21- 0.25 17 (56.6) 0.23 103 16946
0.26 – 0.30 3 (10.0) 0.28 127 20896
0.31 + 2 (6.7) 0.33 150 24781
Total 30 0.22 101 16669
Note: Figures in parentheses indicate the respective share in total number of taluks.
Source: Nedumangad RO, Rubber Board, personal interview with Dy. RPC, Dt.7.11.2012.
26 The Growers new planting or replanting rubber in any one year in a minimumarea of 0.10 hectare of contiguous land or part of 0.10 hectare if that part isthe only area remaining to be replanted in an estate will be eligible forassistance under the Scheme (Rubber Board, 2012).
27 In an initiative to promote farm mechanisation and address the labourshortage, the Rubber Board has launched a scheme for providing financialaid to Rubber Producers’ Societies (RPS), Rubber Self Help Groups (SHGs)and companies promoted by Rubber Board for buying weed- cuttingequipment. The board provides assistance of 50% of the actual cost of theequipment limited to a maximum of Rs.14500 (Rubber Board).
28 However, as vast majority of the growers are small and marginal holders,the feasibility of this option is very much limited. Currently, the shift towardsLFTs is confined to very few locations and holdings and the strongrecommendations and promotions of the Rubber Board for adopting thison a wider scale might not yield the expected results even under extrememarket conditions. In supporting these points, a recent study (Chandy et al.,2012) observe that the size of holding (number of trees) is a crucial factordetermining the adoption of LFT in case of holdings dependent on hiredlabour in Kerala.
29 It is being argued that a major cause of the tightness of the labour market isthe spread of education in rural areas. The high literacy rate implies thatsizeable populations of the lower age group are kept out of the workforceas students who constitute a substantial segment of the non-workers inKerala (Narayana et al 1989).
30 Discussions with officials at the Rubber Production Department and RPSsoperating GPCs reveal that currently, there are no flexibility and infrastructurefacilities for a large number of RPSs to switch over to collection of latex

80
from rubber sheet. Though GPC is a good concept, there are several problemsat the local level in implementing and scaling up. For instance, In Nilambur,there are 19 such GPCs and majority of the growers do sell their latex atthese processing centres, whereas many other rubber growing areas do nothave GPCs and even if they exist, growers are not keen and motivated to selltheir latex due to several operational level issues, which are quite known.An important issue catching up at present is the potential environmentalproblems caused by the GPCs in terms of air pollution, generation of wastesfrom the processing centres and its contamination of water bodies, includinggroundwater, rivers, streams, etc. There are already issues being raised bythe local residents against such GPCs in areas such as Nilambur, etc, wherethe GPC has been processing latex in lower capacities than the designedcapacity (Source: Discussion with key informants).

81
ReferencesReferencesReferencesReferencesReferences
Balsiger, Joerg; Jamal Bahdon and Adrian Whiteman (2000): The
utilization, processing and demand for rubberwood as a source
of wood supply, Working Paper No: APFSOS/WP/50, Forestry
Policy and Planning Division, Regional Office for Asia and the
Pacific, Bangkok, Rome, December 2000, ftp://ftp.fao.org/
docrep/fao/003/Y0153E/Y0153E00.pdf (accessed 13 March
2013.
Chandy, Binni, Tharian George K and Shammi Raj (2010): ‘Trends in
Farm Income and Wages in the Era of Market Uncertainty: An
exploratory analysis of Natural Rubber Sector in Kerala’,
NRPPD Discussion Paper 5, Centre for Development Studies,
Trivandrum.
Chandy, Binni; K.U. Thomas; S. Veeraputhran, Siju, T. (2012): ‘An
Economic Analysis of the Socio-Economic Dimensions of
Participatory Experimental Trials on Low Frequency Tapping
(LFT) in Kerala’, in: Abstracts of the International Rubber
Conference (IRC 2012) held during 28-31 October 2012,
Kovalam, Rubber Research Institute of India and International
Rubber Research and Development Board.
George, K.T. and P.K. Michael Tharakan (1984): ‘Penetration of Capital
Into a Traditional Economy: The Case of Tea Plantations in
Kerala, 1880-1950’, Studies in History, New Series, 2 (2): 199-
230.
George, K.T., Haridasan, V. and Sreekumar, B (1988): ‘Role of Government
and Structural changes in Rubber Plantation Industry’, Economicand Political Weekly, 23 (48): M158-M166.
George, K. Tharian (1999): ‘The Natural Rubber Sector: Emerging Issues
in the 1990s’, in: B.A. Prakash (ed.), Kerala’s EconomicDevelopment: Issues and Problems, Sage Publications, New Delhi,
pp. 186-199.

82
George, K. Tharian (2012): ‘Tapping Labour Shortage and Dilemmas in
Policy Options: The Case of Rubber Smallholder Sector in
Kerala’, Working Paper ER/6, Rubber Research Institute of India,
Kottayam, 39p.
Joseph, K.V. (1988): Migration and Economic Development of Kerala,
Mittal Publications.
Kannan, K.P. (1999), ‘Rural Labour Relations and Development
Dilemmas in Kerala: Reflections on the Dilemmas of Socially
Transforming Labour Force in a Slowly Growing Economy’,
Journal of Peasant Studies, Vol. 26 (2&3): 140-181.
Kaur, A (2006): ‘Order (and disorder) at the Border: Mobility, International
Labour Migration and Border Controls in Southeast Asia’, in A.
Kaur and I. Metcalfe (Eds.), Mobility, Labour Migration andBorder Controls in Asia, Basingstoke: Palgrave Macmillan, pp.
23-5.
Labour Bureau (2009): Socio-economic Conditions of Women Workersin Plantation Industry, 2008-09, Government of India.
Mascareñas, B. Garcés (2010): ‘Markets, Citizenship and Rights: State
Regulation of Labour Migration in Malaysia and Spain’,
Dissertation, The institutional repository of the University of
Amsterdam (UvA), Pages 227, http://dare.uva.nl/document/
176225 (accessed 13 March 2013).
Nair, M.K.S. (1999): ‘Emerging Trends in Labour Shortage in
Agriculture’, in: B.A. Prakash (ed.), Kerala’s EconomicDevelopment: Issues and Problems, Sage Publications, New Delhi,
pp. 220-241.
Narayana, D and K.N. Nair (1989): ‘Heterogeneity, Mobility and
Dynamics of Contractual Arrangements in the Agricultural
Labour Market in an Irrigated District’, Working Paper No 230,
Centre for Development Studies, Thiruvananthapuram.

83
Paechana, Panus & Somyot Sinthurahat (1997): Rubberwood: A NewSource of Income for Smallholders, Paper presented at the IRRDB
Meetings in Vietnam in 1997.
Panikar, P.G.K., Krishnan, T.N. and Krishnaji, N (1978): ‘Population
Growth and Agricultural Development- A Case Study of Kerala,’
Rome, FAO, 84p.
Panikkar, K.N. (1979): ‘Peasant Revolts in Malabar in the Nineteenth
and Twentieth Centuries,’ in Desai A.R. (ed.) Peasant Strugglesin India, Oxford University Press, Bombay, pp: 601-630.
Radhakrishnan, P. (1989): Peasant Struggles Land Reforms and SocialChange in Malabar 1836-1982, Sage Publications, New Delhi.
Raj, K.N. and Michael Tharakan (1983): ‘Agrarian Reform in Kerala and its
Impact on the Rural Economy- A Preliminary Assessment,’ in Ghose,
A.K. (ed.): Agrarian Reform in Contemporary Developing Countries,Crown Helm London and Canberra, St. Martin’s Press, New York.
Rodrigo, V.H.L (2007): ‘Adoption of Different Tapping Systems in the
Rubber Industry of Sri Lanka with special reference to Low
Frequency Tapping,’ Journal of the Rubber Research Institute ofSri Lanka, (2007) 88:1-21.
Rubber Board (2011): Indian Rubber Statistics, Volume 34, Rubber
Board, Kottayam, Kerala, 68p.
Rubber Board (2012): Rubber Plantation Development Scheme (PhaseVI Rules), Newplanting and Replanting Components 2007-08 –2011-12, Rubber Board, Kottayam, Kerala, http://
w w w . r u b b e r b o a r d . o r g . i n / S c h e m e s / R u b b e r _
Krishi_Vikasanam_English.pdf (accessed 14 March 2013).
Somboonsuke, Buncha (2000): Rubber-based Farming System in
Thailand: Problems, Potential Solutions, and Constraints,
Unpublished PhD Thesis submitted to the Asian Institute ofTechnology, Bangkok, Thailand.

84
Strasser, Balz (2009): We are as Flexible as Rubber: LivelihoodStrategies, Diversity and the Local Institutional Setting of RubberSmall holders in Kerala, South India, New Delhi: Manohar
Publishers.
Thomas, Joseph A. and T.A. Thomas (1999a): ‘Reaping Before Sowing’:
Agrarian Relations in Kuttanad,’ In: Prakash, B.A. (ed.): Kerala’sEconomic Development: Issues and Problems, Sage Publications,
New Delhi, pp. 212-219.
Thomas, T. A. and Joseph A. Thomas (1999b): ‘Changing Agrarian
Relations and Practices: A Study with special reference to
Kuttanad’, In: Oommen, M.A. (ed.): Rethinking Development:Kerala’s Development Experience, Vol. II, Concept Publishing
Company, New Delhi, pp. 300-313.
Viswanathan, P.K. (2012): ‘Rationalisation of Agriculture in Kerala and
its Implications on Natural Environment, Agro-Ecosystems and
Livelihoods’, paper presented at the conference on Kerala’sEconomy and Society: Situating the Present, Imagining theFuture, held at Centre for Development Studies,
Thiruvananthapuram, Kerala during 26 – 27 February 2012.
Viswanathan, P.K., Tharian George, K and Toms Joseph (2000):
Employment, Working Conditions and Status of Labour in theUnorganised Rubber Smallholdings: A Case Study of RubberTappers in Kerala, Monograph (Draft), Rubber Research Institute
of India, Kottayam, 75p.
Viswanathan, P.K. and P. Rajasekharan (2001): ‘Decline in NR Prices
and Adoption of Agro-Management Practices in Smallholdings
in India: Some Observations’, The Planter (Kuala Lumpur), 77
(899): 65-76.
Viswanathan, P.K. and Amita Shah (2009): Challenges, Opportunitiesand Imperatives for Techno-Economic and Institutional Reformsunder Trade Liberalisation: Case Studies of Tea and Rubber

85
Plantation Sectors in India, The South Asia Network of Economic
Research Institutes (SANEI), May 2009, pp. ix+158.
Viswanathan, P.K. and Amita Shah (2012a): ‘Gender Impact of Trade
Reforms in Indian Plantation Sector: An Exploratory Analysis’,
National Research Programme on Plantation Development
(NRPPD), Discussion Paper No. 17, Centre for Development
Studies, Thiruvananthapuram, Kerala, 69p.
Viswanathan, P.K. and Amit Mandal (2012b): NREGS as Instrument of
Gender Mainstreaming: An Exploratory Analysis, Man andDevelopment, 34 (3): 17-36 (September).
Viswanathan, P.K., George, K.T. and Joseph, T. (2001): Employment,Working Conditions and Status of Labour in the UnorganisedRubber Smallholdings: The Case of Rubber Tappers in Kerala,unpublished report submitted to the Rubber Research Institute
of India, Kottayam, Kerala, 77p.
Viswanathan, P.K., George, K.T. and Joseph, T. (2003): ‘Informal Labour
Market and Structural Devolution’, Economic and PoliticalWeekly, 38 (31): 3277-3281.
Viswanathan, P.K. (2006): ‘A Comparative Study of Smallholder Rubber
and Rubber integrated Farm Livelihood Systems in India and
Thailand’, Report of the postdoctoral research study submitted tothe Asian Institute of Technology, Bangkok, January 2006, 108p.
Viswanathan, P.K. (2012) ‘Rationalisation of Agriculture in Kerala and
its Implications on Natural Environment, Agro-Ecosystems and
Livelihoods’, paper presented at the conference on “Kerala’s
Economy and Society: Situating the Present, Imagining the
Future”, held at Centre for Development Studies,
Thiruvananthapuram, Kerala during 26 – 27 February 2012.
Xiaofei, Zheng and Fu Guohua (2009): A Study on Countermeasure for
Labour Force Shortage in Natural Rubber Industry with Reference

86
to China-ASEAN Regional Integration, Institute of China Studies
University of Malaya 50603 Kuala Lumpur, MALAYSIA, ICS
Working Paper No. 2009-13, http://www.iadb.org/intal/intalcdi/
PE/2009/03016.pdf (accessed on March 13, 2013).
Xing, Lu and Lin Song (2010): Rubber Expansion in Xishuangbanna,
Discussion Paper for Roundtable Session Expansion of Rubberin Montane Mainland Southeast Asia: What are the prospectsfor small holders?, RCSD/ChATSEA International Conference
Revisiting Agrarian Transformation in Southeast Asia: Empirical,
Theoretical, and Applied Perspectives 13 – 15 May, 2010, Chiang
Mai, Thailand.
