redesigning the facility layout with systematic layout
TRANSCRIPT
Redesigning The Facility Layout With Systematic Layout Planning Method and Lean Manufacturing Approach On
The Production Floor At PT. Baruna Trayindo Jaya
Dino Ramadhan, Lamto Widodo, Lina Gozali, I Wayan Sukania, Frans Jusuf Daywin, Carla Olyvia Doaly
Industrial Engineering Department Universitas Tarumanagara
Jakarta, Indonesia [email protected], [email protected], [email protected]
Abstract
PT. Baruna Trayindo Jaya is a manufacturing company engaged in producing or manufacturing cable tray, cable support system, and pole pipe. PT. Baruna Trayindo Jaya still has wasted on its production floor and does not yet have effectiveness for production. Researchers conducted observations in the field and processed the data using systematic layout planning (SLP) methods to redesign the facility layout and lean manufacturing approach to minimize waste on the production floor. The data selected to be processed through OPC with the number of operations and the long duration of time is cable ladder products. Data processing using FPC, OPC, routing sheet, FTC, MPPC, ARC, ATBD, ARD, AAD, and flow process materials for alternative layouts and adjustment factor determination, looseness determination, and current value stream mapping to minimize waste. After processing the data, two alternate layouts are generated with different production distances and times. Alternate layout one is selected compared to alternate layout two because it has a shorter distance and production time. The implementation of both methods can reduce distance reduction by 56.56% and time reduction by 10.07% on alternative layout 1 of the initial layout. Keywords Facility Layout, Systematic Layout Planning, Lean Manufacturing 1. Introduction The industry is a business or activity to process raw materials or half materials into finished goods with added value. Industrial products are not only in the form of goods but also in the form of services. Types of industries there are various kinds such as the fishing industry, mining industry, automotive industry, and others. In a production process, the layout is one of the most critical components in a company's sustainability and effectiveness and efficient production process. PT. Baruna Trayindo Jaya is a manufacturing company engaged in producing or manufacturing cable trays, cable support systems, and pole pipes. There is backtracking during the production process, especially in the punching and bending process. Besides, there is a waste of transportation when finishing products because in PT. Baruna Trayindo Jaya, finishing is done hot-dip galvanize process done by factory partners. Layout or layout on PT. Baruna Trayindo Jaya still does not have effectiveness for its production, so an optimal production layout design is required. Therefore, it is necessary to redesign the layout of facilities and waste analysis for PT. Baruna Trayindo Jaya can increase production effectiveness. Redesigning the facility layout using the Systematic Layout Planning (SLP) method and waste analysis using the lean manufacturing method. 1.1 Objectives The purpose of this research is to identify waste that occurs in PT. Baruna Trayindo Jaya proposed changes to the layout for the production floor at PT. Baruna Trayindo Jaya and identified the occurrence of backtracking in the production process at PT. Baruna Trayindo Jaya. 2. Literature Review Systematic layout planning (SLP) is an organized way to conduct layout planning, consisting of a phasing framework, procedure pattern, and a set of conventions to identify, assess, and visualize the elements and areas involved in layout planning [1]. The sequence of systematic layout planning procedures is as follows [2]: 1. Data Collection and Activities
Proceedings of the 11th Annual International Conference on Industrial Engineering and Operations Management Singapore, March 7-11, 2021
© IEOM Society International 2596
At this early stage, data obtained information related to work drawings, assembly charts, part lists, bill of materials, route sheets, operation/flowchart, and others. 2. Material Flow Analysis Analysis of material flow (flow of material analysis) will be related to quantitative measurement analysis efforts for any movement of material movement between departments or operational activities. 3. Flow Process Chart At this stage, obtained data describing all activities, productive activities (operations and inspections), and unproductive (transportation, waiting, and saving). 4. Operation Process Chart Describes the process steps that raw materials will experience regarding the sequences of operations and inspections from the initial stage to the finished product or component. It contains the information needed to analyze the time, material, place, tools, and machinery used. 5. Multi-Product Process Chart (MPPC) The multi-product process chart shows the production linkage between the constituent components. MPPC is also used to analyze the flow or flow of materials in a series of production processes. 6. Routing Sheet This stage contains tabulations of the steps covered in producing specific components and the necessary details of related matters. Production sequencing becomes the backbone of production activities, which is the recollection of all data developed by process engineers and essential communication tools between product engineers and production people. 7. From To Chart (FTC) From to chart or trip frequency or travel chart is a conventional technique commonly used for planning factory layout and moving goods in a production process. 8. Activity Relationship Analysis Measuring inter-departmental activities is one of the most important elements in the layout of facilities[3]. It is important to evaluate alternative rules; an activity relationship must be established. The relationship of activity can be found in quantitative and qualitative ways. Quantitative measures can include sheets per hour, motion shifts per day, or pounds per week. 9. Activity Relationship Diagram (ARD) Activity Relationship Diagram (ARD) is a diagram of the relationship between activities (department or machine) based on the priority level of proximity, so it is expected that the cost of handling is minimum. 10. Area Allocation Diagram (AAD) Area Allocation Diagram (AAD) is a continuation of ARD where in ARD is known conclusions of importance between activities, so activities must be close to other activities and vice versa. The relationship between activities affects the level of closeness between the layout of the activity. 11. Selection and Evaluation of Alternative Layouts It is a step used to decide on the proposed layout design that must be selected or applied. The decision on alternative layout selection based on distance and time compared with an existing layout Lean manufacturing is an ongoing effort to eliminate waste and increase the value-added of products (goods and services) to provide value to customers (customer value) [4]. Waste is categorized into seven categories, namely, [5]: 1. Waste of waiting, waiting time is a waste (e.g., waiting for material to come). 2. Waste of overproduction, making more products than customer demand is a waste. 3. Waste of overprocessing, a process that is more than the customer wants, is waste. 4. Waste of defect, reject, or repair is a waste that can be directly seen. 5. Waste of motion, Unnecessary movement, and not ergonomics, so adding process time is a waste. 6. Waste of inventory, the more inventory is stored, the more waste occurs. 7. Waste of transportation, waste caused by irregular transportation. Time study is a measuring work technique by collecting data based on the time needed to complete a job. The time study method is used to calculate the standard time value of a job [6]. The following are the stages of the time study conducted: 1. Cycle Time Cycle time is the time it takes to create one product unit on one workstation. The cycle time is calculated using the following equation:
𝑊𝑊𝑊𝑊 = Σ𝑥𝑥𝑥𝑥𝑁𝑁
(1) Description: Ws = Cycle Time Xi = Measurement Data N = Number of Observations Made 2. Normal Time
Proceedings of the 11th Annual International Conference on Industrial Engineering and Operations Management Singapore, March 7-11, 2021
© IEOM Society International 2597
Normal time is an element of work operation that shows that a well-qualified worker will work to complete the work at a normal working tempo[ 8]. The following equation can calculate the normal time:
𝑊𝑊𝑊𝑊 = 𝑊𝑊𝑊𝑊 × (1 + 𝑝𝑝) (2) Description: Wn = Normal Time Ws = Cycle Time p = Adjustment Factor
3. Default Time The default time is when a normal worker reasonably takes to complete a job performed in the best working system. The following equation can calculate the default time:
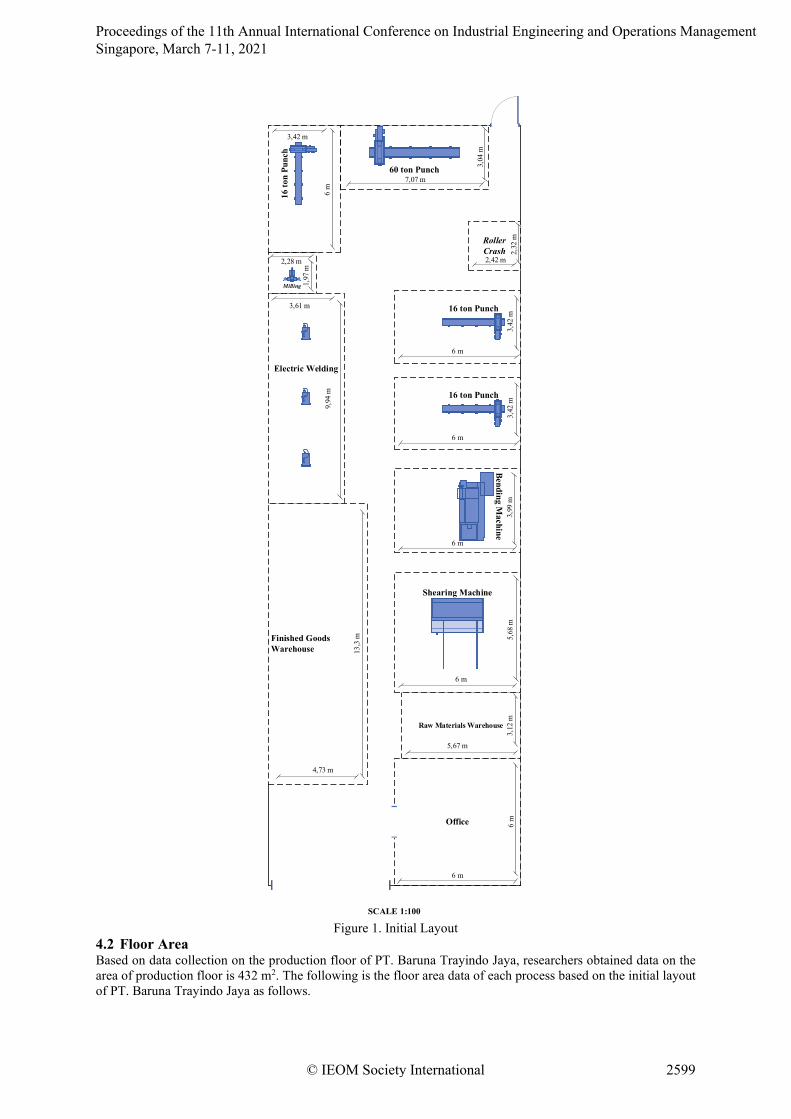
𝑊𝑊𝑊𝑊 = 𝑊𝑊𝑊𝑊 × (1 + 𝐿𝐿) (3) Description: Wb = Standard Time Wn = Normal Time L = Allowance 3. Methods Research begins with field studies and literature and literature studies. Furthermore, identify problems based on field studies that have been done. The determination of research objectives is based on the problem that occurs. Then set the boundaries of research. The next stage is data collection. The data collected are the size of the production floor area, the overall factory size, the size of the machinery and equipment, the amount of production per year, and each production process's cycle time. Then the data is processed by taking into account the distance and time during the production process. Generated design layout or new alternatives and minimize waste that occurs. Then make conclusions and suggestions for the research. 4. Data Collection 4.1 Initial Layout The initial layout of the production floor of PT Baruna Trayindo Jaya can be seen in Figure 1.
Proceedings of the 11th Annual International Conference on Industrial Engineering and Operations Management Singapore, March 7-11, 2021
© IEOM Society International 2598
Raw Materials Warehouse
Shearing Machine
Office
Bending Machine
16 ton Punch
Roller Crash
60 ton Punch
6 m
6 m
5,67 m
3,12
m
6 m
5,68
m
6 m
3,99
m
6 m
3,42
m
7,07 m
3,04
m
2,32
m
2,42 m
Milling 1,97
m
2,28 m
Electric Welding
9,94
m
3,61 m
Finished Goods Warehouse
4,73 m
13,3
m
SCALE 1:100
16 ton Punch
6 m
3,42
m
16 to
n Pu
nch
6 m
3,42 m
Figure 1. Initial Layout
4.2 Floor Area Based on data collection on the production floor of PT. Baruna Trayindo Jaya, researchers obtained data on the area of production floor is 432 m2. The following is the floor area data of each process based on the initial layout of PT. Baruna Trayindo Jaya as follows.
Proceedings of the 11th Annual International Conference on Industrial Engineering and Operations Management Singapore, March 7-11, 2021
© IEOM Society International 2599
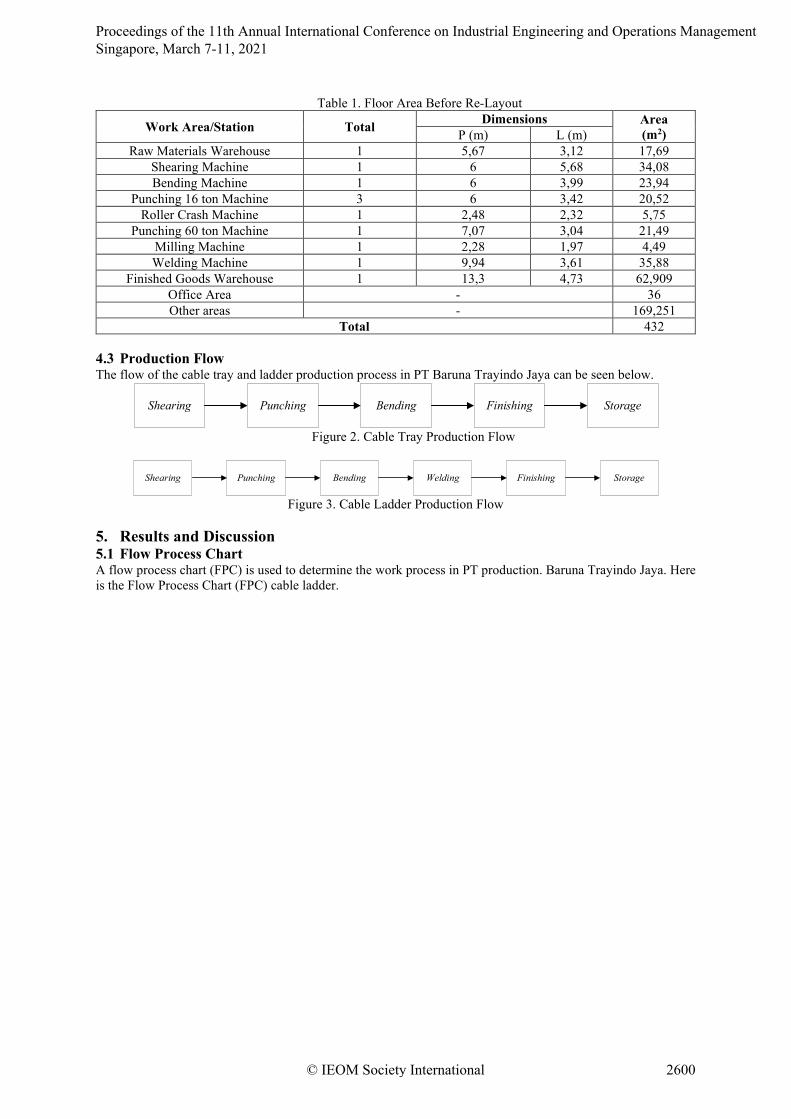
Table 1. Floor Area Before Re-Layout
Work Area/Station Total Dimensions Area (m2) P (m) L (m)
Raw Materials Warehouse 1 5,67 3,12 17,69 Shearing Machine 1 6 5,68 34,08 Bending Machine 1 6 3,99 23,94
Punching 16 ton Machine 3 6 3,42 20,52 Roller Crash Machine 1 2,48 2,32 5,75
Punching 60 ton Machine 1 7,07 3,04 21,49 Milling Machine 1 2,28 1,97 4,49 Welding Machine 1 9,94 3,61 35,88
Finished Goods Warehouse 1 13,3 4,73 62,909 Office Area - 36 Other areas - 169,251
Total 432 4.3 Production Flow The flow of the cable tray and ladder production process in PT Baruna Trayindo Jaya can be seen below.
Shearing Punching Bending Finishing Storage
Figure 2. Cable Tray Production Flow
Shearing Punching Bending Welding Finishing Storage
Figure 3. Cable Ladder Production Flow 5. Results and Discussion 5.1 Flow Process Chart A flow process chart (FPC) is used to determine the work process in PT production. Baruna Trayindo Jaya. Here is the Flow Process Chart (FPC) cable ladder.
Proceedings of the 11th Annual International Conference on Industrial Engineering and Operations Management Singapore, March 7-11, 2021
© IEOM Society International 2600
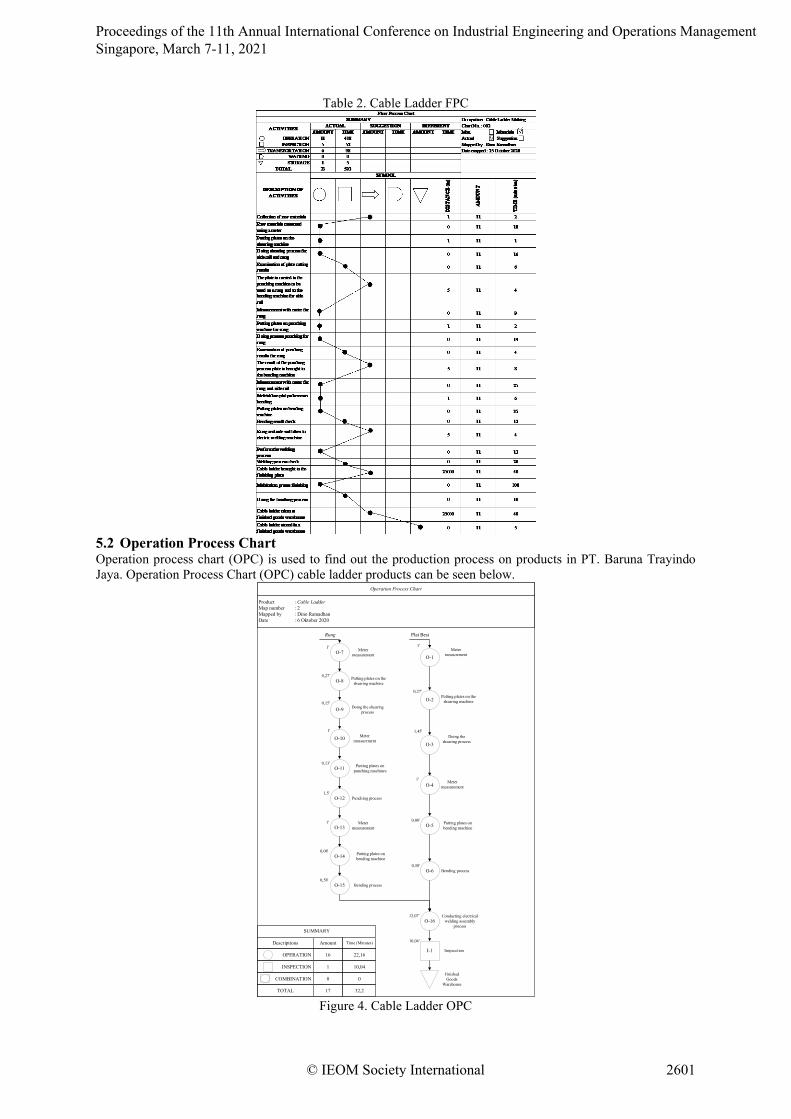
Table 2. Cable Ladder FPC
5.2 Operation Process Chart Operation process chart (OPC) is used to find out the production process on products in PT. Baruna Trayindo Jaya. Operation Process Chart (OPC) cable ladder products can be seen below.
Operation Process Chart
Product : Cable LadderMap number : 2Mapped by : Dino RamadhanDate : 6 Oktober 2020
SUMMARY
Descriptions Amount Time (Minutes)
OPERATION
INSPECTION
COMBINATION
TOTAL
16
1
0
17
22,16
10,04
0
32,2
O-1612,07' Conducting electrical
welding assembly process
O-1
Plat Besi
Putting plates on the shearing machine
0,27'
O-2
Doing the shearing process
1,45'
O-7
Rung
Putting plates on the shearing machine
0,13'
O-8
1,5'
Doing the shearing process
O-4
0,58'
Putting plates on bending machine
0,08'O-5
Bending process
I-1 Inspecction
Finished Goods
Warehouse
10,04'
O-3
1'
O-9
1' Meter measurement
O-6
1'
0,27'
O-10 Meter measurement
1'
O-11 Putting plates on punching machines
0,15'
O-12 Punching process
O-13
Putting plates on bending machineO-14
Bending processO-150,58'
0,08'
1'
Meter measurement
Meter measurement
Meter measurement
Figure 4. Cable Ladder OPC
Proceedings of the 11th Annual International Conference on Industrial Engineering and Operations Management Singapore, March 7-11, 2021
© IEOM Society International 2601
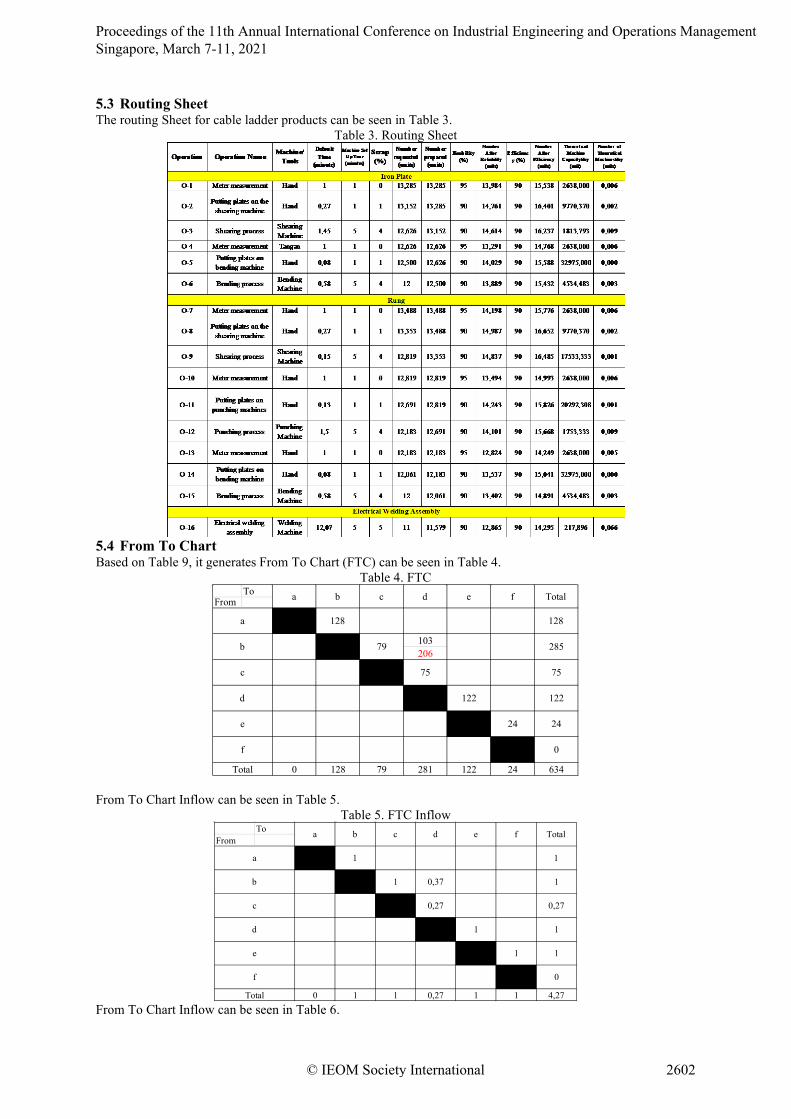
5.3 Routing Sheet The routing Sheet for cable ladder products can be seen in Table 3.
Table 3. Routing Sheet
5.4 From To Chart Based on Table 9, it generates From To Chart (FTC) can be seen in Table 4.
Table 4. FTC To
From
103206
0 128 79 281 122 24 634
b c d e f
128
Total
Total
122
24
128
0f
a
a
24
d 122
e
285
c 75 75
b 79
From To Chart Inflow can be seen in Table 5.
Table 5. FTC Inflow To
From
0 1 1 0,27 1 1 4,27
0,37
0
Total
f
1
e 1 1
d 1
1
c 0,27 0,27
b 1
Total
a 1 1
a b c d e f
From To Chart Inflow can be seen in Table 6.
Proceedings of the 11th Annual International Conference on Industrial Engineering and Operations Management Singapore, March 7-11, 2021
© IEOM Society International 2602
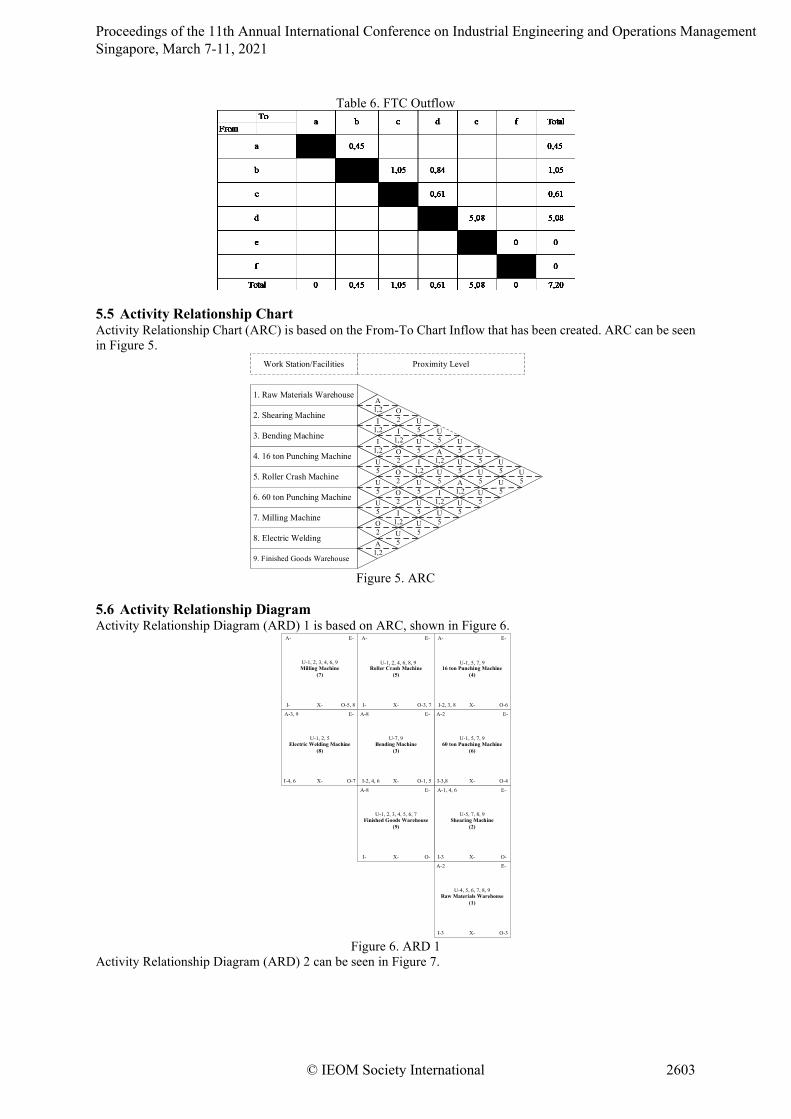
Table 6. FTC Outflow
5.5 Activity Relationship Chart Activity Relationship Chart (ARC) is based on the From-To Chart Inflow that has been created. ARC can be seen in Figure 5.
1. Raw Materials Warehouse
2. Shearing Machine
4. 16 ton Punching Machine
3. Bending Machine
8. Electric Welding
9. Finished Goods Warehouse
A1,2
Work Station/Facilities Proximity Level
5. Roller Crash Machine
7. Milling Machine
6. 60 ton Punching Machine
I1,2I
1,2U5U5U5O2A
1,2
O2I
1,2O2O2O2I
1,2U5
U5U5I
1,2U5U5U5
U5A
1,2U5I
1,2U5
U5U5A
1,2U5
U5U5U5
U5U5
U5
Figure 5. ARC
5.6 Activity Relationship Diagram Activity Relationship Diagram (ARD) 1 is based on ARC, shown in Figure 6.
Raw Materials Warehouse(1)
A-2 E-
I-3 O-3
U-4, 5, 6, 7, 8, 9
X-
60 ton Punching Machine(6)
A-2 E-
I-3,8 O-4
U-1, 5, 7, 9
X-
Shearing Machine(2)
A-1, 4, 6 E-
I-3 O-
U-5, 7, 8, 9
X-
Bending Machine(3)
A-8 E-
I-2, 4, 6 O-1, 5
U-7, 9
X-
Roller Crash Machine(5)
A- E-
I- O-3, 7
U-1, 2, 4, 6, 8, 9
X-
Milling Machine(7)
A- E-
I- O-5, 8
U-1, 2, 3, 4, 6, 9
X-
Electric Welding Machine(8)
A-3, 9 E-
I-4, 6 O-7
U-1, 2, 5
X-
Finished Goods Warehouse(9)
A-8 E-
I- O-
U-1, 2, 3, 4, 5, 6, 7
X-
16 ton Punching Machine(4)
A- E-
I-2, 3, 8 O-6
U-1, 5, 7, 9
X-
Figure 6. ARD 1
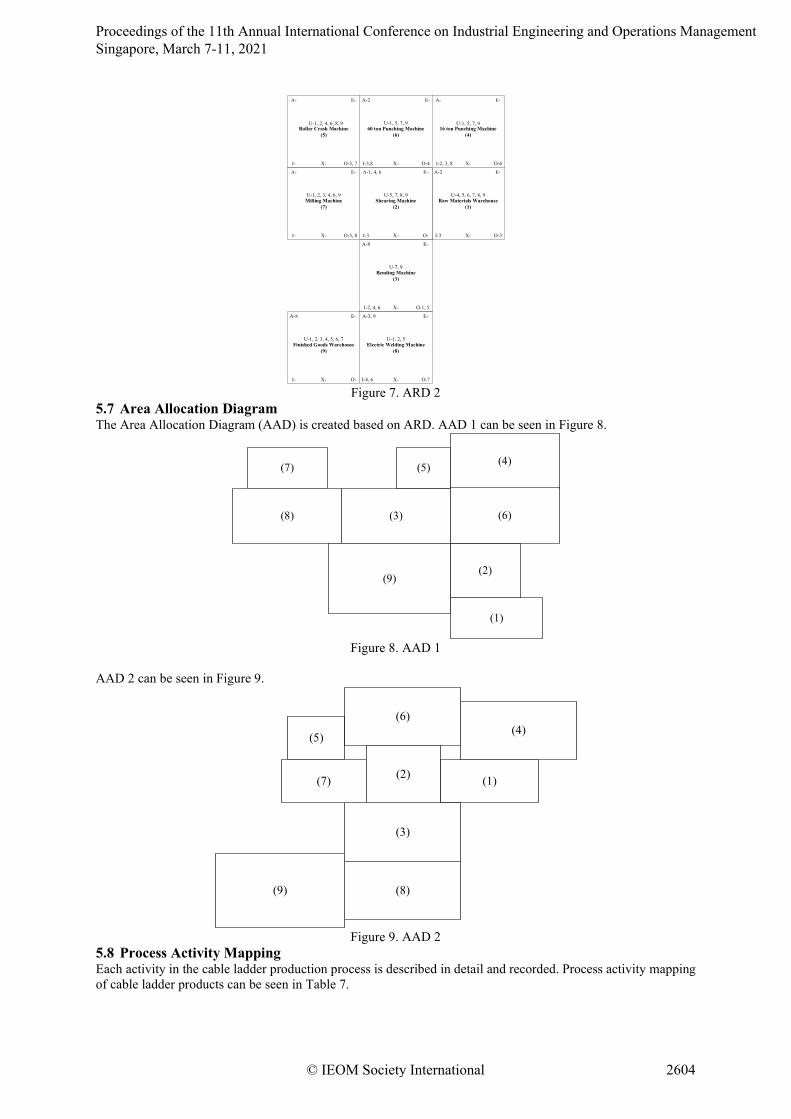
Activity Relationship Diagram (ARD) 2 can be seen in Figure 7.
Proceedings of the 11th Annual International Conference on Industrial Engineering and Operations Management Singapore, March 7-11, 2021
© IEOM Society International 2603
Raw Materials Warehouse(1)
A-2 E-
I-3 O-3
U-4, 5, 6, 7, 8, 9
X-
60 ton Punching Machine(6)
A-2 E-
I-3,8 O-4
U-1, 5, 7, 9
X-
Shearing Machine(2)
A-1, 4, 6 E-
I-3 O-
U-5, 7, 8, 9
X-
Bending Machine(3)
A-8 E-
I-2, 4, 6 O-1, 5
U-7, 9
X-
Roller Crash Machine(5)
A- E-
I- O-3, 7
U-1, 2, 4, 6, 8, 9
X-
Milling Machine(7)
A- E-
I- O-5, 8
U-1, 2, 3, 4, 6, 9
X-
Electric Welding Machine(8)
A-3, 9 E-
I-4, 6 O-7
U-1, 2, 5
X-
Finished Goods Warehouse(9)
A-8 E-
I- O-
U-1, 2, 3, 4, 5, 6, 7
X-
16 ton Punching Machine(4)
A- E-
I-2, 3, 8 O-6
U-1, 5, 7, 9
X-
Figure 7. ARD 2
5.7 Area Allocation Diagram The Area Allocation Diagram (AAD) is created based on ARD. AAD 1 can be seen in Figure 8.
(1)
(2)
(3)
(4)(5)
(6)
(7)
(8)
(9)
Figure 8. AAD 1
AAD 2 can be seen in Figure 9.
(1)
(3)
(4)(5)
(6)
(7)
(8)(9)
(2)
Figure 9. AAD 2
5.8 Process Activity Mapping Each activity in the cable ladder production process is described in detail and recorded. Process activity mapping of cable ladder products can be seen in Table 7.
Proceedings of the 11th Annual International Conference on Industrial Engineering and Operations Management Singapore, March 7-11, 2021
© IEOM Society International 2604
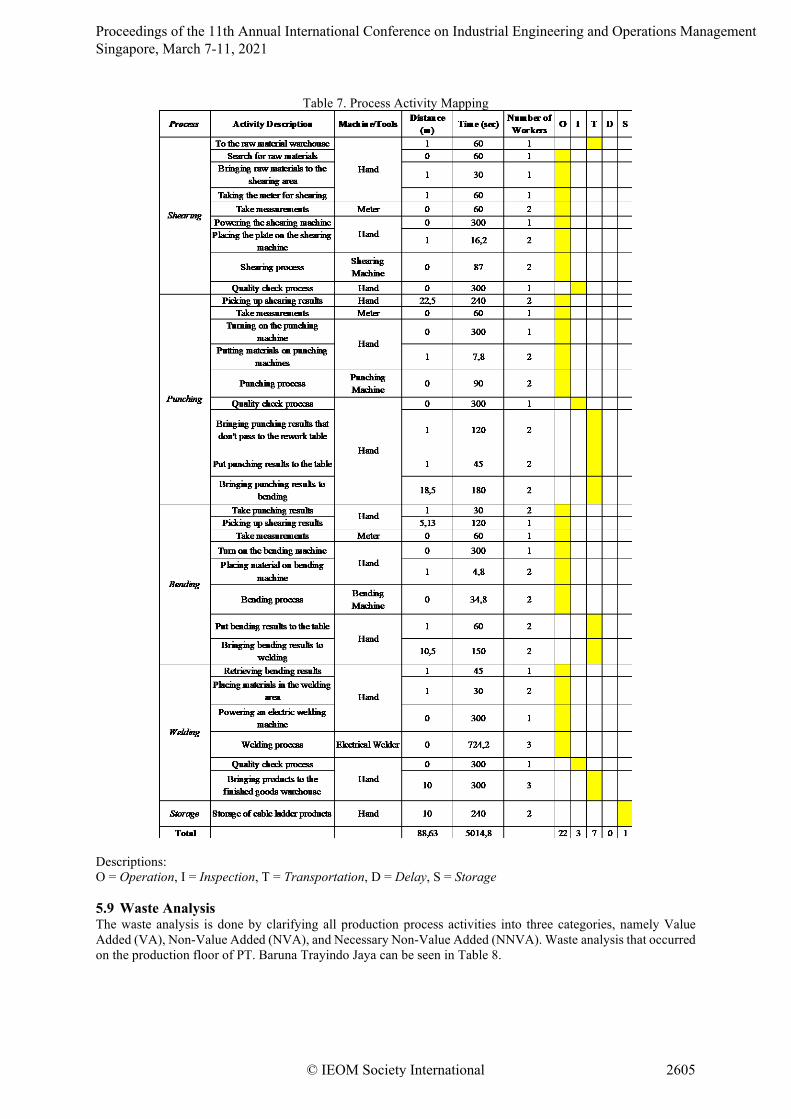
Table 7. Process Activity Mapping
Descriptions: O = Operation, I = Inspection, T = Transportation, D = Delay, S = Storage 5.9 Waste Analysis The waste analysis is done by clarifying all production process activities into three categories, namely Value Added (VA), Non-Value Added (NVA), and Necessary Non-Value Added (NNVA). Waste analysis that occurred on the production floor of PT. Baruna Trayindo Jaya can be seen in Table 8.
Proceedings of the 11th Annual International Conference on Industrial Engineering and Operations Management Singapore, March 7-11, 2021
© IEOM Society International 2605
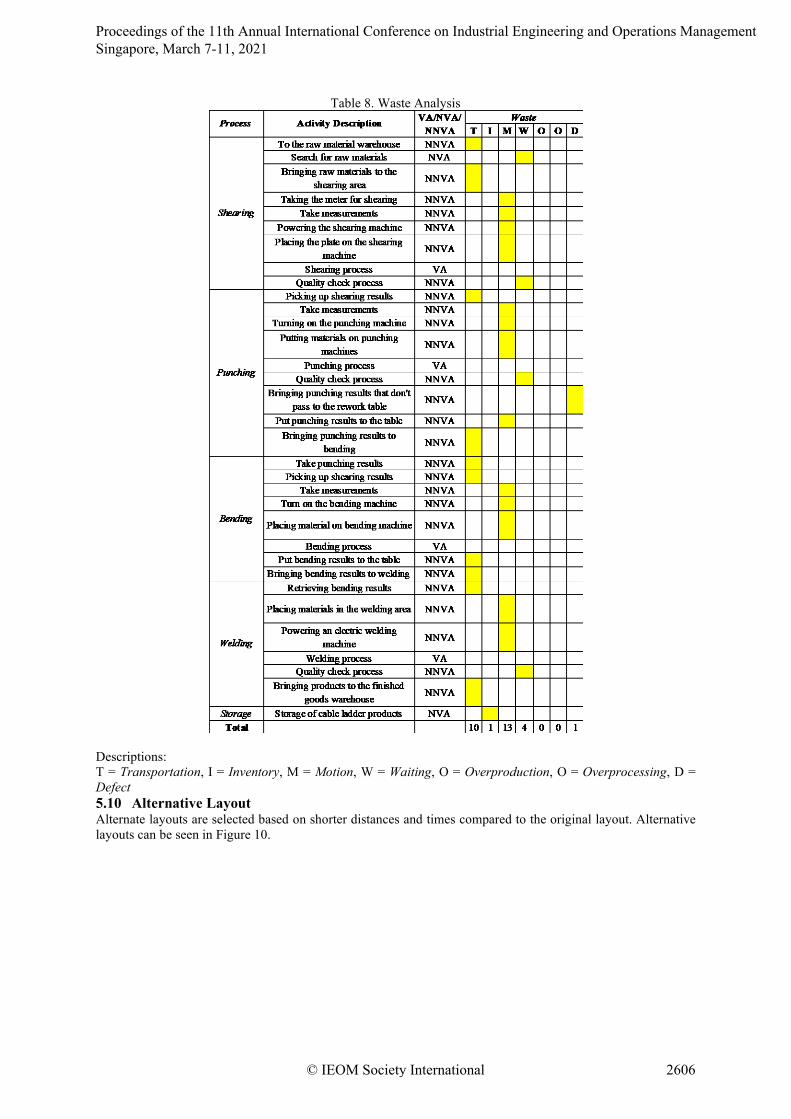
Table 8. Waste Analysis
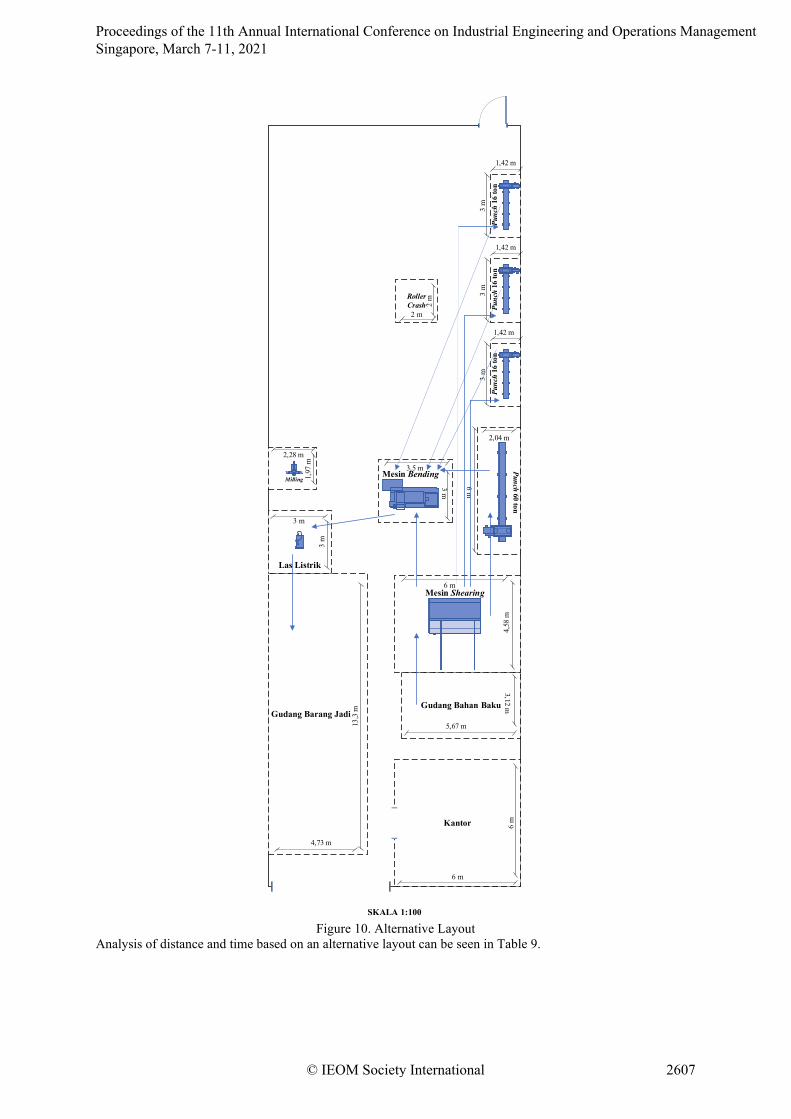
Descriptions: T = Transportation, I = Inventory, M = Motion, W = Waiting, O = Overproduction, O = Overprocessing, D = Defect 5.10 Alternative Layout Alternate layouts are selected based on shorter distances and times compared to the original layout. Alternative layouts can be seen in Figure 10.
Proceedings of the 11th Annual International Conference on Industrial Engineering and Operations Management Singapore, March 7-11, 2021
© IEOM Society International 2606
Gudang Bahan Baku
Mesin Shearing
Kantor
Mesin Bending
Punc
h 16
ton
Roller Crash
Punch 60 ton
6 m
6 m
5,67 m
3,12 m
6 m
4,58
m
3 m
3,5 m
3 m
1,42 m6 m
2,04 m2
m
2 m
Milling 1,97
m
2,28 m
Las Listrik
3 m
3 m
Gudang Barang Jadi
4,73 m
13,3
m
SKALA 1:100
Punc
h 16
ton
3 m
1,42 m
Punc
h 16
ton
3 m
1,42 m
Figure 10. Alternative Layout
Analysis of distance and time based on an alternative layout can be seen in Table 9.
Proceedings of the 11th Annual International Conference on Industrial Engineering and Operations Management Singapore, March 7-11, 2021
© IEOM Society International 2607
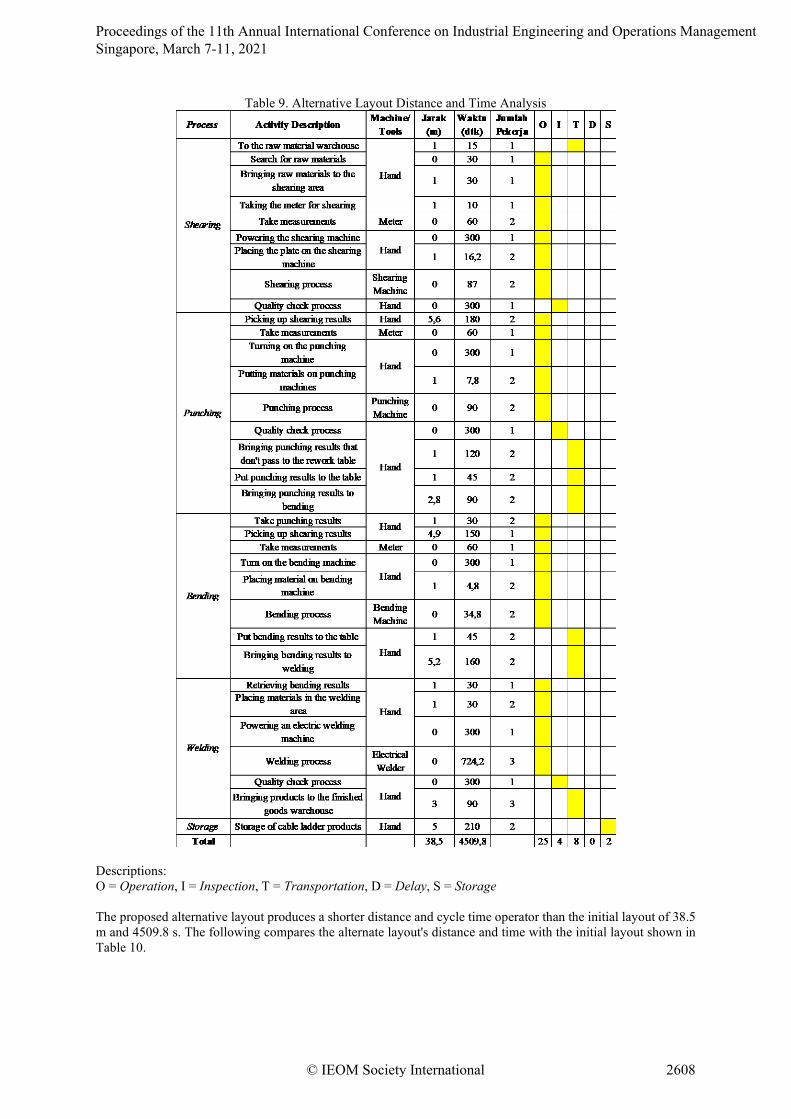
Table 9. Alternative Layout Distance and Time Analysis
Descriptions: O = Operation, I = Inspection, T = Transportation, D = Delay, S = Storage The proposed alternative layout produces a shorter distance and cycle time operator than the initial layout of 38.5 m and 4509.8 s. The following compares the alternate layout's distance and time with the initial layout shown in Table 10.
Proceedings of the 11th Annual International Conference on Industrial Engineering and Operations Management Singapore, March 7-11, 2021
© IEOM Society International 2608
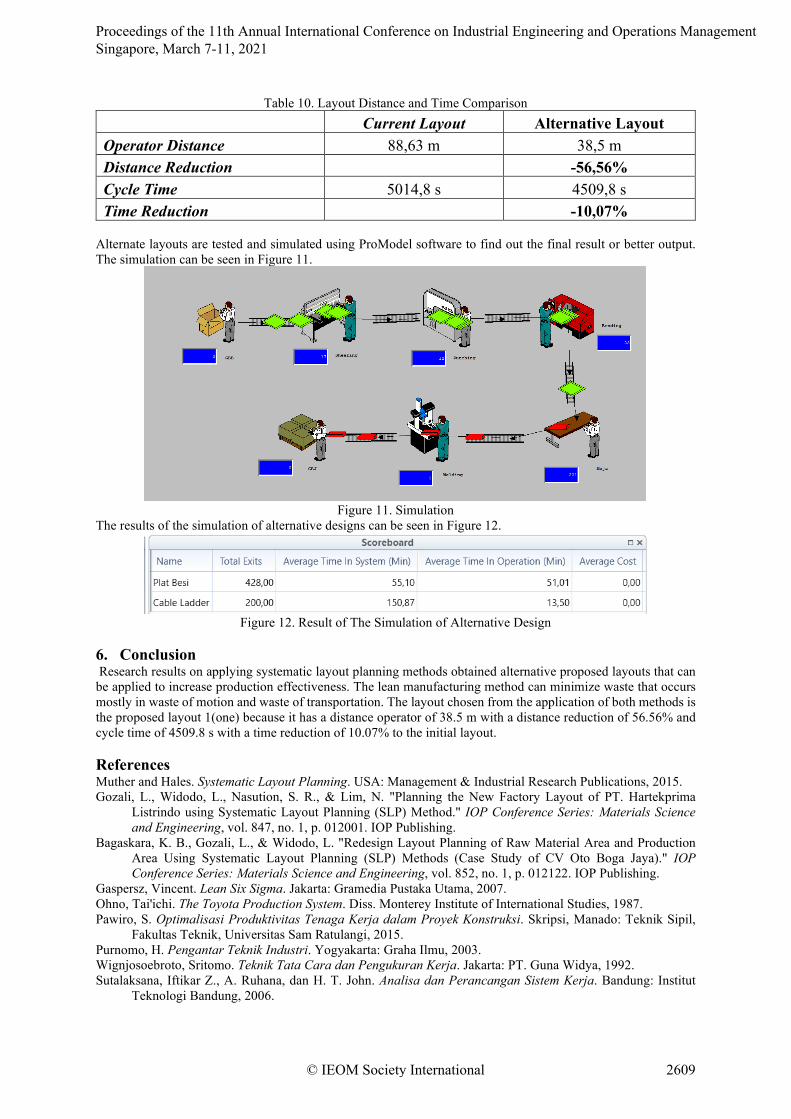
Table 10. Layout Distance and Time Comparison Current Layout Alternative Layout Operator Distance 88,63 m 38,5 m Distance Reduction -56,56% Cycle Time 5014,8 s 4509,8 s Time Reduction -10,07%
Alternate layouts are tested and simulated using ProModel software to find out the final result or better output. The simulation can be seen in Figure 11.
Figure 11. Simulation
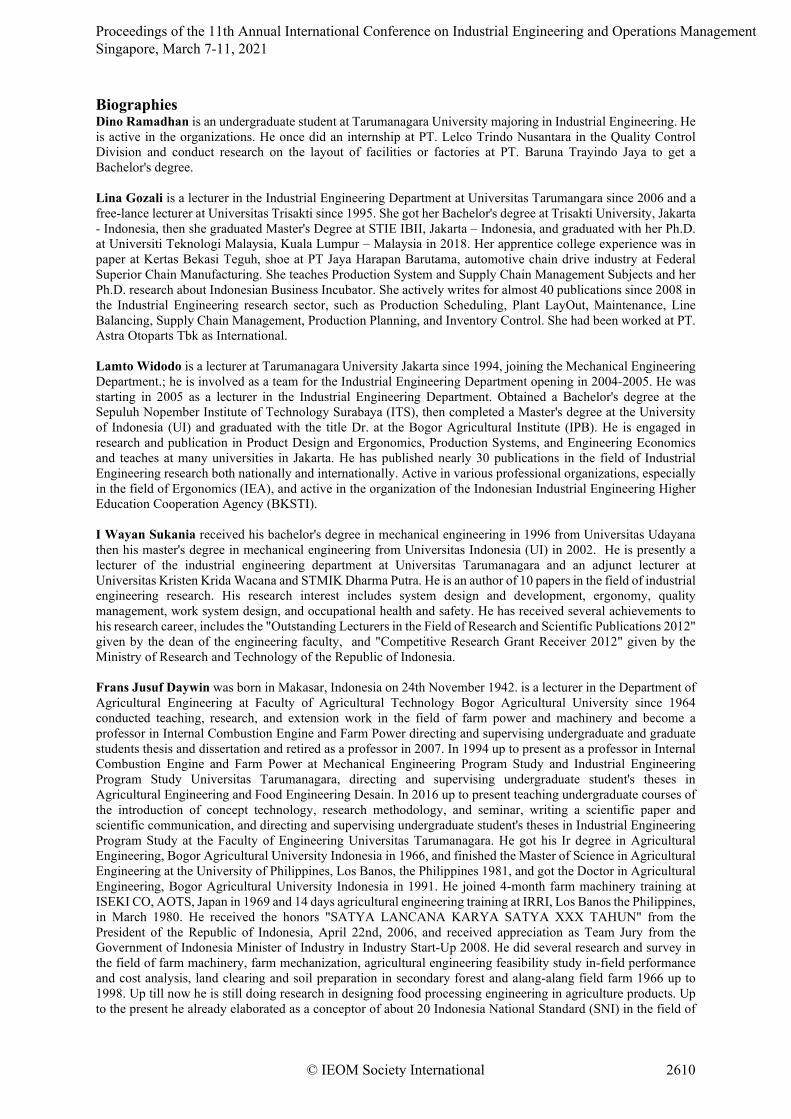
The results of the simulation of alternative designs can be seen in Figure 12.
Figure 12. Result of The Simulation of Alternative Design
6. Conclusion Research results on applying systematic layout planning methods obtained alternative proposed layouts that can be applied to increase production effectiveness. The lean manufacturing method can minimize waste that occurs mostly in waste of motion and waste of transportation. The layout chosen from the application of both methods is the proposed layout 1(one) because it has a distance operator of 38.5 m with a distance reduction of 56.56% and cycle time of 4509.8 s with a time reduction of 10.07% to the initial layout. References Muther and Hales. Systematic Layout Planning. USA: Management & Industrial Research Publications, 2015. Gozali, L., Widodo, L., Nasution, S. R., & Lim, N. "Planning the New Factory Layout of PT. Hartekprima
Listrindo using Systematic Layout Planning (SLP) Method." IOP Conference Series: Materials Science and Engineering, vol. 847, no. 1, p. 012001. IOP Publishing.
Bagaskara, K. B., Gozali, L., & Widodo, L. "Redesign Layout Planning of Raw Material Area and Production Area Using Systematic Layout Planning (SLP) Methods (Case Study of CV Oto Boga Jaya)." IOP Conference Series: Materials Science and Engineering, vol. 852, no. 1, p. 012122. IOP Publishing.
Gaspersz, Vincent. Lean Six Sigma. Jakarta: Gramedia Pustaka Utama, 2007. Ohno, Tai'ichi. The Toyota Production System. Diss. Monterey Institute of International Studies, 1987. Pawiro, S. Optimalisasi Produktivitas Tenaga Kerja dalam Proyek Konstruksi. Skripsi, Manado: Teknik Sipil,
Fakultas Teknik, Universitas Sam Ratulangi, 2015. Purnomo, H. Pengantar Teknik Industri. Yogyakarta: Graha Ilmu, 2003. Wignjosoebroto, Sritomo. Teknik Tata Cara dan Pengukuran Kerja. Jakarta: PT. Guna Widya, 1992. Sutalaksana, Iftikar Z., A. Ruhana, dan H. T. John. Analisa dan Perancangan Sistem Kerja. Bandung: Institut
Teknologi Bandung, 2006.
Proceedings of the 11th Annual International Conference on Industrial Engineering and Operations Management Singapore, March 7-11, 2021
© IEOM Society International 2609
Biographies Dino Ramadhan is an undergraduate student at Tarumanagara University majoring in Industrial Engineering. He is active in the organizations. He once did an internship at PT. Lelco Trindo Nusantara in the Quality Control Division and conduct research on the layout of facilities or factories at PT. Baruna Trayindo Jaya to get a Bachelor's degree. Lina Gozali is a lecturer in the Industrial Engineering Department at Universitas Tarumangara since 2006 and a free-lance lecturer at Universitas Trisakti since 1995. She got her Bachelor's degree at Trisakti University, Jakarta - Indonesia, then she graduated Master's Degree at STIE IBII, Jakarta – Indonesia, and graduated with her Ph.D. at Universiti Teknologi Malaysia, Kuala Lumpur – Malaysia in 2018. Her apprentice college experience was in paper at Kertas Bekasi Teguh, shoe at PT Jaya Harapan Barutama, automotive chain drive industry at Federal Superior Chain Manufacturing. She teaches Production System and Supply Chain Management Subjects and her Ph.D. research about Indonesian Business Incubator. She actively writes for almost 40 publications since 2008 in the Industrial Engineering research sector, such as Production Scheduling, Plant LayOut, Maintenance, Line Balancing, Supply Chain Management, Production Planning, and Inventory Control. She had been worked at PT. Astra Otoparts Tbk as International. Lamto Widodo is a lecturer at Tarumanagara University Jakarta since 1994, joining the Mechanical Engineering Department.; he is involved as a team for the Industrial Engineering Department opening in 2004-2005. He was starting in 2005 as a lecturer in the Industrial Engineering Department. Obtained a Bachelor's degree at the Sepuluh Nopember Institute of Technology Surabaya (ITS), then completed a Master's degree at the University of Indonesia (UI) and graduated with the title Dr. at the Bogor Agricultural Institute (IPB). He is engaged in research and publication in Product Design and Ergonomics, Production Systems, and Engineering Economics and teaches at many universities in Jakarta. He has published nearly 30 publications in the field of Industrial Engineering research both nationally and internationally. Active in various professional organizations, especially in the field of Ergonomics (IEA), and active in the organization of the Indonesian Industrial Engineering Higher Education Cooperation Agency (BKSTI). I Wayan Sukania received his bachelor's degree in mechanical engineering in 1996 from Universitas Udayana then his master's degree in mechanical engineering from Universitas Indonesia (UI) in 2002. He is presently a lecturer of the industrial engineering department at Universitas Tarumanagara and an adjunct lecturer at Universitas Kristen Krida Wacana and STMIK Dharma Putra. He is an author of 10 papers in the field of industrial engineering research. His research interest includes system design and development, ergonomy, quality management, work system design, and occupational health and safety. He has received several achievements to his research career, includes the "Outstanding Lecturers in the Field of Research and Scientific Publications 2012" given by the dean of the engineering faculty, and "Competitive Research Grant Receiver 2012" given by the Ministry of Research and Technology of the Republic of Indonesia. Frans Jusuf Daywin was born in Makasar, Indonesia on 24th November 1942. is a lecturer in the Department of Agricultural Engineering at Faculty of Agricultural Technology Bogor Agricultural University since 1964 conducted teaching, research, and extension work in the field of farm power and machinery and become a professor in Internal Combustion Engine and Farm Power directing and supervising undergraduate and graduate students thesis and dissertation and retired as a professor in 2007. In 1994 up to present as a professor in Internal Combustion Engine and Farm Power at Mechanical Engineering Program Study and Industrial Engineering Program Study Universitas Tarumanagara, directing and supervising undergraduate student's theses in Agricultural Engineering and Food Engineering Desain. In 2016 up to present teaching undergraduate courses of the introduction of concept technology, research methodology, and seminar, writing a scientific paper and scientific communication, and directing and supervising undergraduate student's theses in Industrial Engineering Program Study at the Faculty of Engineering Universitas Tarumanagara. He got his Ir degree in Agricultural Engineering, Bogor Agricultural University Indonesia in 1966, and finished the Master of Science in Agricultural Engineering at the University of Philippines, Los Banos, the Philippines 1981, and got the Doctor in Agricultural Engineering, Bogor Agricultural University Indonesia in 1991. He joined 4-month farm machinery training at ISEKI CO, AOTS, Japan in 1969 and 14 days agricultural engineering training at IRRI, Los Banos the Philippines, in March 1980. He received the honors "SATYA LANCANA KARYA SATYA XXX TAHUN" from the President of the Republic of Indonesia, April 22nd, 2006, and received appreciation as Team Jury from the Government of Indonesia Minister of Industry in Industry Start-Up 2008. He did several research and survey in the field of farm machinery, farm mechanization, agricultural engineering feasibility study in-field performance and cost analysis, land clearing and soil preparation in secondary forest and alang-alang field farm 1966 up to 1998. Up till now he is still doing research in designing food processing engineering in agriculture products. Up to the present he already elaborated as a conceptor of about 20 Indonesia National Standard (SNI) in the field of
Proceedings of the 11th Annual International Conference on Industrial Engineering and Operations Management Singapore, March 7-11, 2021
© IEOM Society International 2610

machinery and equipment. He joins the Professional Societies as a member: Indonesia Society of Agricultural Engineers (PERTETA); Indonesia Society of Engineers (PII); member of BKM-PII, and member of Majelis Penilai Insinyur Profesional BKM-PII. Carla Olyvia Doaly is a lecturer in the Industrial Engineering Department at Universitas Tarumanagara graduated with my bachelor's degree from Institut Teknologi Nasional Malang, which study the Industrial Engineering program, then continued my Master Degree at Institut Teknologi Bandung majoring in Industrial engineering and management and a special field of Enterprise Engineering. I am very interested in studying industrial engineering by doing research related to System Design and Engineering, Supply Chain Management, Operations Research and Analysis, Information System Management, Occupational Health and Safety, Facilities Engineering, Quality and Reliability Engineering
Proceedings of the 11th Annual International Conference on Industrial Engineering and Operations Management Singapore, March 7-11, 2021
© IEOM Society International 2611