red sea and gulf of adengiwa - yemenwater · gulf of aden, the gulf of suez and the gulf of aqaba....
TRANSCRIPT
Global International Waters Assessment
(Draft)
The Red Sea and Gulf of Aden
GIWA Regional Assessment
Sub-regions 48, 49
Dr. Najah Mistafa Kalmar – 2005
2
Introduction
The Red Sea and Gulf of Aden region are geographically located between two important ocean domains, namely, the Indian Ocean domain and the Atlantic Ocean domain through the Mediterranean Sea. This location gives this region a very important and strategic situation as an ocean gateway, and makes it particularly interesting scientifically and environmentally, as well as politically, socially and economically. However, it also adds tremendous pressures on its fragile environment.
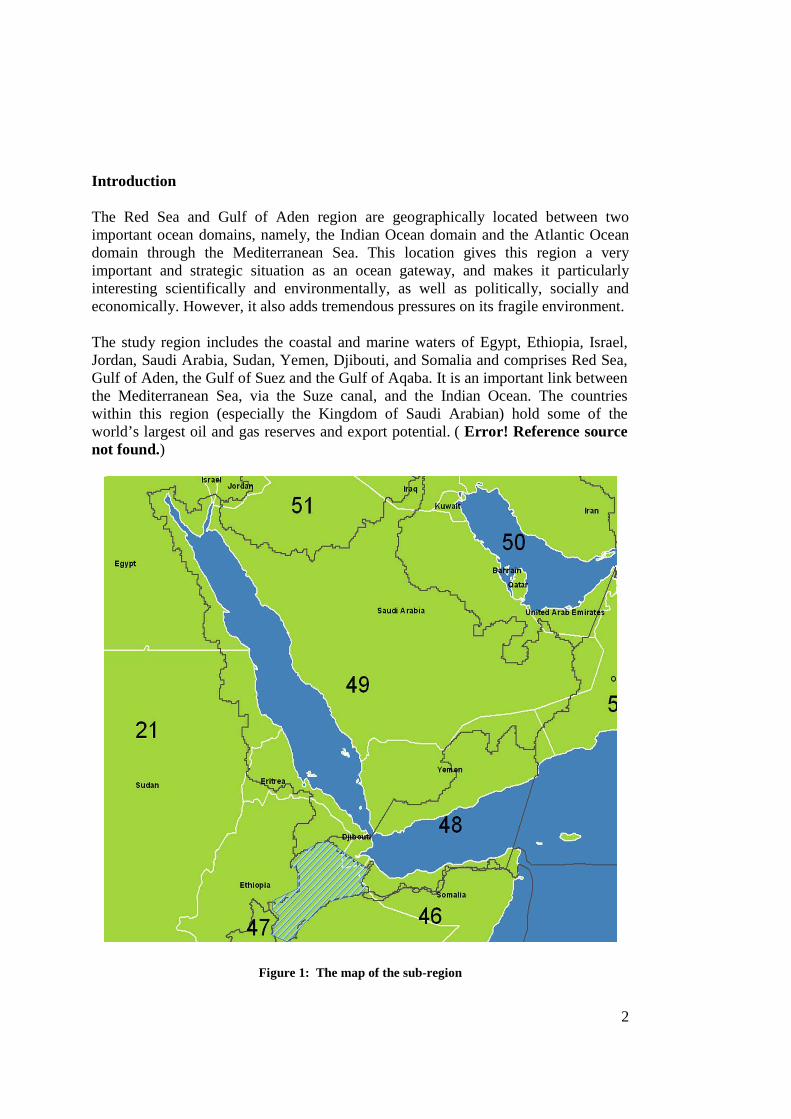
The study region includes the coastal and marine waters of Egypt, Ethiopia, Israel, Jordan, Saudi Arabia, Sudan, Yemen, Djibouti, and Somalia and comprises Red Sea, Gulf of Aden, the Gulf of Suez and the Gulf of Aqaba. It is an important link between the Mediterranean Sea, via the Suze canal, and the Indian Ocean. The countries within this region (especially the Kingdom of Saudi Arabian) hold some of the world’s largest oil and gas reserves and export potential. ( Error! Reference source not found.)
Figure 1: The map of the sub-region
3
The region is considered as arid, with low rainfall in the form of showers of short duration, often associated with thunderstorms and occasionally with dust storms. Different habitats such as mangroves with significant importance for animals (including migratory species) and many uses to man, sea grasses, and coral reef territories are fairly widespread within the Red Sea/Gulf of Aden region. Based on species distribution, the Saudi Arabian Red Sea can be divided into four physiographic sub-zones: Gulf of Aqaba, Northern Red Sea, Central Red Sea, including Outer Farasan Bank, and Southern Red Sea.
The waters of the Red Sea and Gulf of Aden constitute a unique ecosystem with high biological diversity. In particular, they host an extensive system of coral reefs and their associated animals and plants. Surrounded by arid terrestrial environments, the reefs support rich biological communities and representatives of several endangered species. There are also mangroves, seagrass beds, salt marshes and salt plans in the
4
region. Fishing and an ever growing tourism industry are important to the economy of this area. The problems of physical alteration and destruction of habitats are a result of dredging and filling operations associated with urban expansion, tourism, and industrial development. In general, the main sources of marine pollution come from land-based activities, including urbanisation and coastal development, industries including power and desalination plants, refineries, recreation and tourism, wastewater treatment facilities, coastal mining and quarrying activities, oil bunkering and oil tankers. The majority of the countries bordering the Red Sea and Gulf of Aden Djibouti, Egypt, Jordan, Saudi Arabia, Somalia, Sudan and Yemen have joined the Regional Organization for the Conservation of the Environment of the Red Sea and Gulf of Aden (PERSGA∗). Topography and bathymetry The Red Sea forms a 1,930 km long and 270 km-wide trenches that narrow at the strait of Bab al Mandab to about 27 km, where the depth is about 300 m.1 The surface area of the sea is roughly 438,000 or 450,000 km². 2 The average depth is 524 m and a deep trench with a maximum depth of 2,920 m is continues from 14° N to 28° N in the middle of the Red Sea. The Gulf of Suez (about 180 miles in length, with an average width of about 20 miles) has a relatively flat bottom with a depth in the range of 55-73 m.3 Hence, the Gulf spreads a shallow basin filled with the surface water of the Red Sea. The Tor Bank lies in the faraway of the Gulf with depth ranging from 20 to 25 m. The Gulf of Aqaba (about 100 miles long from the Straits of Tiran to the Akabah Rift, and 15 miles wide) is a deep basin with narrow shelves. This Gulf comprises two isolated depressions separated by a submarine sill. The northern depression is about 1,100 m deep and the southern depression is about 1,420 m deep. The maximum depth within the Gulf is observed near the east coast with a depth of 1,829 m (Edwards 1987). 4 The Bab-el-Mandeb (Arabic for "the gate of tears") is the straite separating the continents of Asia (Yemen on the Arabian Peninsula) and Africa (Djibouti, north of Somalia on the Horn of Africa), connecting the Red Sea to the Indian Ocean (Gulf of Aden). The distance across is about 20 miles (30 km) from Ras Menhelion the Arabian coast to Ras Siyanon the African. The island of Perim, divides the strait into two channels, of which the eastern, known as the Bab Iskender (Alexander's Strait), is 2 miles (3 km) wide and 16 fathoms (30 m) deep, while the western, or Dact-el- ∗ Programme for the Environment of the Red Sea and Gulf of Aden 1 http://en.wikipedia.org/wiki/Bab_el_Mandeb 2 http://en.wikipedia.org/wiki/Red_Sea 3 Makram A. Gerges .(2002)The Red Sea and Gulf of Aden Action Plan—Facing the challenges of an ocean gateway. Ocean & Coastal Management. Volume 45. Issues 11-12. 2002. pages 885-903. 4 Edwards, F. J. 1987. Climate and oceanography. In: Red Sea, A. J. Edwards and S. M. Head, ed., Key Environments Series, Pergamon Press, Oxford, p. 45-69.
5
Mayun, has a width of about 16 miles (25 km) and a depth of 170 fathoms (310 m). Near the African coast lies a group of smaller islands known as the "Seven Brothers" There is a surface current inwards in the eastern channel, but a strong under-current outwards in the western channel.
The shallowest section of Bab el Mandab consists of Hanish sill, close to Hanish Islands, and is located 150 km to the north of the narrowest passage near Perim Island. The greatest depth at the sill is 137 m and the total width of the sill section is about 110 km (Werner and Lange, 1975).5 The sill depth maximum occurs within a deep passage that is only 6 km wide, outside of which the depth is only of the order of 50 m. The total width at the Perim Narrows is only about 18 km (Murray and Johns, 1997) 6 with a depth of about 300 m in the central channel (Maillard and Soliman, 1986) 7
The Gulf of Aqaba, sometimes known as the Gulf of Eilat, is a gulf on the Red Sea. The northern end of the Red Sea is bifurcated by the Sinai Peninsula, creating the Gulf of Suezin the west and to the east the Gulf of Aqaba. The Gulf of Aqaba stretches some 120 miles north from the Straits of Tiran, ending where the southern border of Israel meets the borders of Egypt and Jordan. Three resort cities, Taba in Egypt, Eilat in Israel, and Aqaba in Jordan have served both as strategically important ports and popular destinations for tourists seeking to enjoy the warm waters of the Gulf of Aqaba.8
The northern end of the Red Sea is bifurcated by the Sinai Peninsula, creating the Gulf of Suez in the west and the Gulf of Aqaba to the east. The Gulf of Suez stretches some 175 miles north by northeast, terminating at the Egyptian city of Suez and the entrance to the Suez Canal. Most fringing reefs extend only a few tens of metres from the steep shores in the north, but where there are old alluvial fans, and further south, they commonly extend 1 km to seaward from alluvial plains 1 to 7 km wide. Offshore, extensive series of submerged limestone platforms form the foundations for a barrier reef. Further south, fringing reefs diminish and in many places are completely replaced by broad and thick stands of mangrove and extensive seagrass beds, by muddy flats and sand deposits. Calcareous red 'algal reefs' exist in the absence of coral reefs, and a very conspicuous increase in brown algae, mainly Sargassum, occurs on shallow hard substrate.9 5 F. Werner and K. Lange , A bathymetric survey of the sill area between the Red Sea and the Gulf of Aden. Geologisches Jahrbuch D 13 (1975), pp. 125–130. 6 S.P. Murray and W. Johns , Direct observations of seasonal exchange through the Bab el Mandab Strait. Geophysical Research Letters 24 21 (1997), pp. 2557–2560. 7 C. Maillard and G. Soliman , Hydrography of the Red Sea and exchanges with the Gulf of Aden in summer. Oceanologica Acta 9 3 (1986), pp. 249–269. 8 http://en.wikipedia.org/wiki/Gulf_of_Aqaba
9 Sheppard C.R.C. The Red Sea Seas at the millennium - an environmental evaluation - Volume 2, Published by Elsevier Science Inc., ISBN 0080432077, Editors Sheppard C.R.C. 2000, Pages 35-45
6
The Red Sea is connected to the Gulf of Aden, and hence to the Arabian Sea, via the Strait of Bab-eI-Mandab, which is only about 20 km wide and 300 m deep. The shallowest part of the passage, however, lies about 140 km further basin-inward, near greater Hanish Island. That passage is only 137 m deep, while the channel deeper than 120 m is only 11 km wide.10 The Red Sea comprises three physiographic regions: the coastal shelves located from the shores to depths of 300-600 m; the irregular broken floor of the main trough, varying from 600 to more than 1100 m in depth; and the axial trough which is continuously deep and extends along the main trough south of 23° N. The Red Sea is characterized by having three depressions greater than 2000 m in depth, known as hot brine regions in an area 20 x 20 km in the axial trough between 21° 10' and 21° 30' N. In these regions, the water temperature and salinity are anomalously high. Studies on Atlantis / Deep between 1965 and 1979, have shown that the temperature of the lower brine had increased from 55.9 to 61.7° C and that of the upper brine had risen from 41.2 to 49.9°C. Also, the brine was found highly enriched with various heavy metals such as manganese, iron, zinc, cadmium and copper. Elevated concentrations of hydrogen sulphide and carbon dioxide were also reported in the Kebrit deep brines (Morcos 1970; Karbe 1987) The Gulf of Aden continental shelf area to 200 meters depth is around 59,000 square kilometres. The coastline consists of a series of sandy beaches, broken at intervals by rock outcrops that often extend into the shallow waters. The seabed slopes steeply from the coast and the continental shelf is relatively narrow. The only shallow water banks are adjacent to, and east of Aden and extend to about 30 km offshore. Offshore islands are limited to Perim Island and the Socotra Archipelago.11
Physical Characteristics of the Red Sea and Gulf of Aden
1. Water temperature
The climate of the Red Sea is largely controlled by the distribution of atmospheric pressure and its changes over a vast area. The pressure centres involved are generally distant from the Red Sea and vary during the course of the year.12
10E.J. Rohling, W.J. Zachariassef. (1996). Red Sea Outflow During The Last Glacial Maximum. Quaternary International, Vol. 31, pp. 77-83, 1996. 11 PERSGA. (2003). Status of the Living Marine Resources in the Red Sea and Gulf of Aden and Their Management. 12 Edwards AJ (1987) Climate and oceanography. In: Edwards AJ, Head SM (eds) Red Sea: Key environments. A. Wheaton & Co. Ltd., Exter, p 45-69.
7
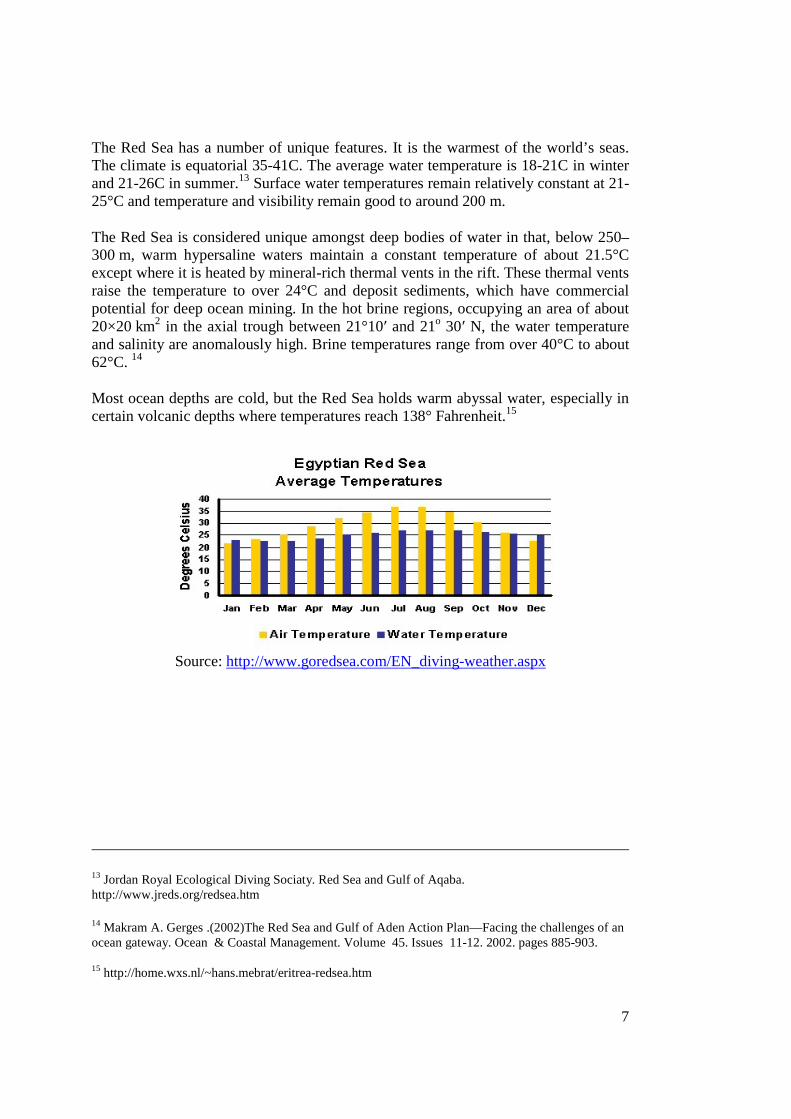
The Red Sea has a number of unique features. It is the warmest of the world’s seas. The climate is equatorial 35-41C. The average water temperature is 18-21C in winter and 21-26C in summer.13 Surface water temperatures remain relatively constant at 21-25°C and temperature and visibility remain good to around 200 m.
The Red Sea is considered unique amongst deep bodies of water in that, below 250–300 m, warm hypersaline waters maintain a constant temperature of about 21.5°C except where it is heated by mineral-rich thermal vents in the rift. These thermal vents raise the temperature to over 24°C and deposit sediments, which have commercial potential for deep ocean mining. In the hot brine regions, occupying an area of about 20×20 km2 in the axial trough between 21°10′ and 21o 30′ N, the water temperature and salinity are anomalously high. Brine temperatures range from over 40°C to about 62°C. 14
Most ocean depths are cold, but the Red Sea holds warm abyssal water, especially in certain volcanic depths where temperatures reach 138° Fahrenheit.15
Source: http://www.goredsea.com/EN_diving-weather.aspx
13 Jordan Royal Ecological Diving Sociaty. Red Sea and Gulf of Aqaba. http://www.jreds.org/redsea.htm
14 Makram A. Gerges .(2002)The Red Sea and Gulf of Aden Action Plan—Facing the challenges of an ocean gateway. Ocean & Coastal Management. Volume 45. Issues 11-12. 2002. pages 885-903.
15 http://home.wxs.nl/~hans.mebrat/eritrea-redsea.htm
8
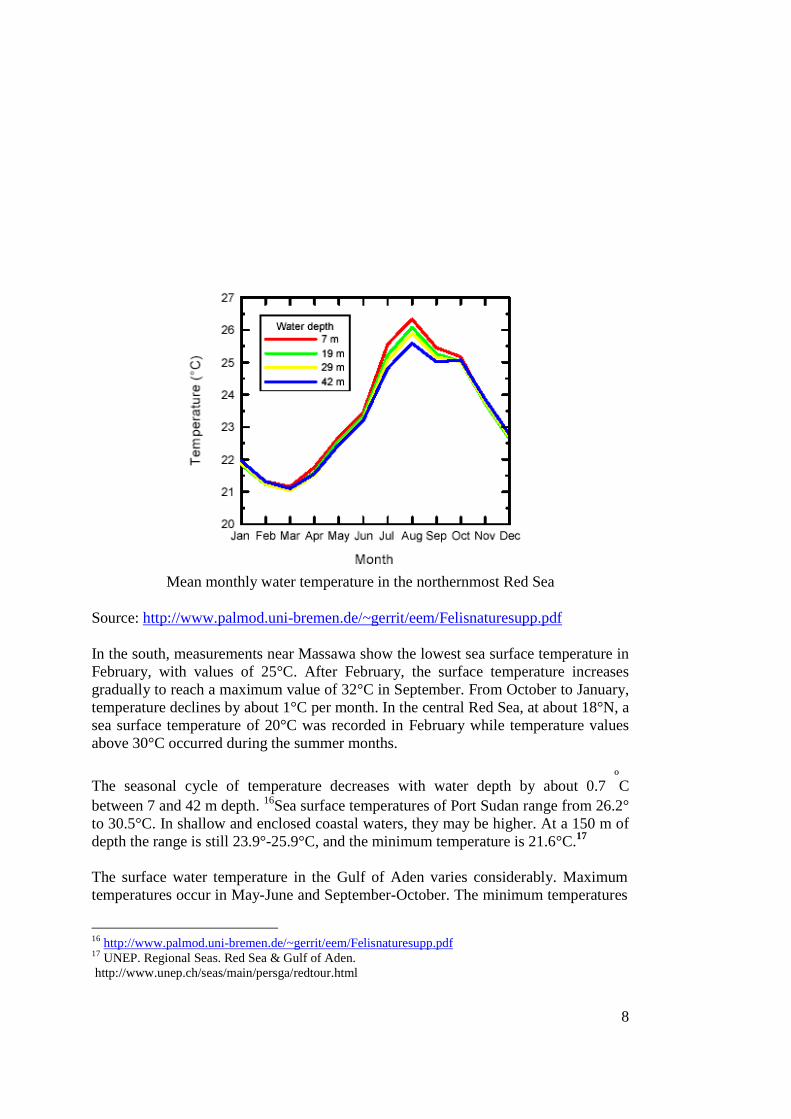
Mean monthly water temperature in the northernmost Red Sea
Source: http://www.palmod.uni-bremen.de/~gerrit/eem/Felisnaturesupp.pdf
In the south, measurements near Massawa show the lowest sea surface temperature in February, with values of 25°C. After February, the surface temperature increases gradually to reach a maximum value of 32°C in September. From October to January, temperature declines by about 1°C per month. In the central Red Sea, at about 18°N, a sea surface temperature of 20°C was recorded in February while temperature values above 30°C occurred during the summer months.
The seasonal cycle of temperature decreases with water depth by about 0.7 ºC
between 7 and 42 m depth. 16Sea surface temperatures of Port Sudan range from 26.2° to 30.5°C. In shallow and enclosed coastal waters, they may be higher. At a 150 m of depth the range is still 23.9°-25.9°C, and the minimum temperature is 21.6°C.17 The surface water temperature in the Gulf of Aden varies considerably. Maximum temperatures occur in May-June and September-October. The minimum temperatures
16 http://www.palmod.uni-bremen.de/~gerrit/eem/Felisnaturesupp.pdf 17 UNEP. Regional Seas. Red Sea & Gulf of Aden. http://www.unep.ch/seas/main/persga/redtour.html
9
in July and August, during the peak of the upwelling, are 7-10 ºC lower than the highest in May.18
2. Water circulation
The water exchange between the Red Sea and Arabian Sea occurs through the Bab el-Mandeb Strait at a depth of 137 m. Similar to the Arabian Sea, wind direction and surface water circulation reverse seasonally in the Red Sea (Wyrtki, 1973) 19 The distribution of Red Sea water in the Arabian Sea occurs entirely during the SW (June-September) and NE monsoons (December-February) ( Gamsakhurdiya et al., 1991).20 In particular, during the NE monsoon, there is enhanced spreading within the Gulf of Aden and southwards along the Somali coast (Beal et al., 2000)21, while during the SW monsoon eastward transport of Red Sea water intensifies. Hence, the volume of water transport between the Red Sea and Arabian Sea is closely coupled to the SW and NE monsoons. 22, 23,24
The Gulf of Aden is the receiving basin for the dense, saline overflow of Red Sea Water (RSW). 25Unlike many other marginal sea overflows, the Red Sea outflow transport is strongly seasonal due to monsoon winds and variations in buoyancy fluxes, with a winter maximum of 0.6 Sv (1 Sv =106 m3/ sec) and a summer minimum of 0.05 Sv (Murray and Johns, 1997).26 The dense Red Sea outflow water descends from sill depth (∼150 m) in Bab el Mandeb Strait (BAM), entrains less dense, fresher Gulf of Aden water, and reaches neutral buoyancy in the western Gulf of Aden in multiple, intermediate-depth, high-salinity layers centred around 600 m. It then 18 PERSGA. (2003). Status of the Living Marine Resources in the Red Sea and Gulf of Aden and Their Management. 19 Wyrtki, K., 1973. Physical oceanography of the Indian Ocean. In: Zeitschel, B., Gerlach, S.A. (Eds.), The Biology of the Indian Ocean. Springer-Verlag, New York, pp. 18–36. 20 G.R. Gamsakhurdiya, S.L. Meschanov and G.K. Shapiro, Seasonal variations in the distribution of Red Sea waters in the northwestern Indian Ocean. Oceanology 31 (1991), pp. 32–37. 21 L.M. Beal, R.L. Molinari, P.E. Robbins and T.K. Chereskin, Reversing bottom circulation in the Somali Basin. Geophys. Res. Lett. 27 (2000), pp. 2565–2568.
22 William C. Patzert.Wind-induced reversal in Red Sea circulation.Deep Sea Research and oceanographic abstracts. Vol 21. 2, Febr. (1974 )pages 109-121
23 Elina Tragou , Chris Garrett. The shallow thermohaline circulation of the Red Sea. Pergamon Deep-Sea Research I, Vol. 44, No. 8, pp. 1355-1376, 1997
24 Smeed D .(1997). Seasonal variation of the flow in the strait of Bab al Mandab . Oceanologica Acta . Volume 20, Issue 6, 1997, Pages 773-781 25 Amy S. Bower ,David M. Fratantoni, William E. Johns and Hartmut Peters. Gulf of Aden eddies and their impact on Red Sea Water. Geophysical Research Letters, VOL. 29, NO. 21, 2002 26 Murray, S. P., and W. Johns, Direct observations of seasonal exchange through the Bab el Mandab Strait, Geophys. Res. Let., 24, 2557– 2560, 1997.
10
spreads laterally through the gulf (Bower et al., 2000). 27The mixing and stirring processes that take place in the Gulf of Aden set the properties of RSW before it spreads farther into the open Indian Ocean, where it is a major intermediate water mass ( Beal et al., 2000).28
Red Sea Water (RSW) and Red Sea Deep Water (RSDW) are observed to flow out of the Red Sea at Bab el Mandab throughout the year. 29, 30Between November and early June (winter regime) this outflow is balanced simply by an inflow of Gulf of Aden Surface Water (GASW). From June to October the south-west monsoon winds provoke an upwelling of Gulf of Aden Intermediate Water (GAIW) to the south of the straits (Smeed, 1997). 31This intermediate layer moves towards the Red Sea, as it is up-welled. The flux of GAIW towards the Red Sea eventually becomes greater than the outflow of RSW and RSDW. The winter surface inflow of GASW is forced to reverse in order to balance the inflowing GAIW (Smeed 1997, Sofianos et al., 2002). 32, 33
The Intense evaporation in the Red sea removes an amount of water equivalent to a depth of 1 to 2 m per year, of which only a negligible part is replaced by fresh water, most coming from inflow through the southern entrance -Bab El Mandeb -.34 Besides this net inflow, a wind driven inward surface current exists that is partially balanced by an outward bottom current. These moderately strong flows correspond to moderate turnover times of 6 years for the surface layer and 200 years for the whole water body. 35, 36 Consequently, seawater constituents have either relatively long residence times or remain in the Red Sea, which can therefore be classified as a sink for many
27 Bower, A. S., H. D. Hunt, and J. F. Price, Character and dynamics of the Red Sea and Persian Gulf outflows, J. Geophys. Res., 105(C3), 6387– 6414, 2000. 28 Beal, L. M., A. Field, and A. L. Gordon, Spreading of Red Sea overflow waters in the Indian Ocean, J. Geophys. Res, 105(C4), 8537– 8548, 2000. 29 .J. Pratt, W. Johns, S.P. Murray and K. Katsumata , Hydraulic interpretation of direct velocity measurements in the Bab el Mandab Strait. Journal of Physical Oceanography 29 (1999), pp. 2769–2784 30 L.J. Pratt, H.E. Deese, S.P. Murray and W. Johns , Continuous dynamical modes in straits having arbitrary cross sections with applications to the Bab el Mandab. Journal of Physical Oceanography 30 (2000), pp. 2515–2534. 31 D.A. Smeed(1997), Seasonal Variation of the flow in the strait of Bab el Mandab. Oceanologica Acta 20 6 (1997), pp. 773–781. 32 D.A. Smeed (1997), Seasonal Variation of the flow in the strait of Bab el Mandab. Oceanologica Acta 20 6 (1997), pp. 773–781. 33 S. S. Sofianos, W. Johns and S.P. Murray , Heat and frehwater budgets in the Red Sea from direct observations at Bab el Mandab. Deep-Sea Research II 49 7-8 (2002), pp. 1323–1340
34 Sheppard C.R.C. The Red Sea Seas at the millennium - an environmental evaluation - Volume 2, Published by Elsevier Science Inc., ISBN 0080432077, Editors Sheppard C.R.C. 2000, Pages 35-45
35 Maillard and G. Soliman , Hydrography of the Red Sea and exchanges with the Indian Ocean in Summer. Oceanologica Acta 9 (1986), pp. 249–269. 36 Sheppard C, Price A, Roberts C. Marine ecology of the Arabian region. Academic Press: San DC, 1992, p. 358
11
compounds of natural or anthropogenic origin. In the same time this long turnover time makes the Red Sea extremely sensitive to pollution buildup, requiring careful consideration of any development activities in the coastal zone.37, 38
3. Tides-Currents
Currents setting in any direction may be experienced throughout the year in the main shipping track of the Red Sea. The velocity of the majority of currents experienced in any direction does not exceed 1 knot, and only on rare occasions does it exceed 2 knots. Currents in the vicinity of islands near the central passage will be described with their related features. Mean sea level is about 0.2 m higher in January and about 0.2 to 0.3 m lower in August and September, but meteorological conditions, barometric pressure, and wind may cause local variations.39 During most of the year (October to May), the strong SSE winds present in the southern Red Sea cause a large surface inflow from the Indian ocean and the mean meridional transport at the surface is directed predominantly to the north. During the southwest monsoon (June to September), the direction of the winds over the southern Red Sea and the Gulf of Aden is reversed. The surface flow also reverses and is directed toward the Gulf of Aden. During transition periods, currents are weakest and most variable. In all seasons, hydrographic observations and velocity measurements show that surface circulation consists of a series of cyclonic and anticyclonic gyres that disappear and reappear at preferential locations Quadfasel and Baudner, 1993)40 as a consequence of the wind field which is steered by the adjacent high topography. Thus, density forcing s and the wind interact at different times and places to generate a rather complex surface circulation (Sofianos and Johns, 2003).41 The central Red sea is almost tideless and has wind-driven seasonal changes in water level that are more significant. In other areas the tides are small, rarely exceeding 1 m. Tides in the Red Sea Gulf of Aden are in the range of 0.5+1.5 meters. In both two regional seas (Red Sea and Gulf) tidal movement provides nutrients necessary for the
37 Thomas Hoepner, Sabine Lattemann. Chemical impacts from seawater desalination plants - a case study of the northern Red Sea. Desalination 152 (2002) 133-140
38 Makram A. Gerges .(2002)The Red Sea and Gulf of Aden Action Plan-Facing the challenges of an ocean gateway. Ocean & Coastal Management. Volume 45. Issues 11-12. 2002. pages 885-903.
39 Red Sea and the Persian Gulf .(2001)National Imagery and Mapping Agency Bethesda, Maryland. Sector 12. Sector 3. The Red Sea-Central Passage.page. 33 40 Quadfasel, D. and Baudner, H., 1993. Gyre-scale circulation cells in the Red Sea. Oceanol. Acta 16, pp. 221–229. 41 Sofianos, S.S. and Johns, W.E., 2003. An Oceanic General Circulation Model (OGCM) investigation of the Red Sea circulation: 2. Three-dimensional circulation in the Red Sea. J. Geophys. Res. 108 C3, page, 3066.
12
vigorous growth of benthic biota.42. In the Red Sea a six hour time difference exists between tide time in the southern and northern area 43 The Gulf of Aden is heavily influenced by the Indian Ocean monsoon system. The winds blow from east to northeast during the northeast monsoon, October to April, and from the southwest during the southwest monsoon, May to September. The strongest winds, and associated water currents, occur in July and August.44
4. Water Density
Surface water density in the Red Sea rises with a fall in water temperature to the north and evaporation causing increased salinity. Decreasing temperatures and evaporation in the Gulf of Suez result in the formation of dense water that turns under and is returned southward in the deep Red Sea (Sheppard, Price, and Roberts 1992). 45Around Jeddah, the density of seawater is 1.026.46
Climatology
1. Wind and Monsoon
Wind patterns in the Red Sea region are controlled to a large extent by two distinct monsoons that are separated by 30 to 45 days each. During the Northeast Monsoon from November to March, the combined effects of the African Equatorial Low and the Siberian High pressure systems create a strong southeast wind that is pulled through the narrow Bab el Mandeb at the southern mouth of the Red Sea. This wind slows as it continues toward Mitsiwa’e where it converges with the ever-present northwest wind, a result of the Azores High, at about 168-north latitude. Much of this air mass is drawn southwestward across the Eritrean highlands toward the African Low centered in southern Sudan. During the Southwest Monsoon from May to September, the Azores High and the Pakistani Low cause surface winds along the
42 Tony Chiffings . A Global Representative System of Marine Protected Areas. MARINE REGION 11: ARABIAN SEAS. Volume 3.Central Indian Ocean, Arabian Seas, East Africa, and East Asian SeasA Report to the World Bank Environment Department. 1995 43 S.A. Morcos , Physical and chemical oceanography of the Red Sea. Oceanography and Marine Biology Annual Review 8 (1970), pp. 73–202. 44 NRL. Monterey, Marine Meteorology Division. Arabian Sea/Gulf of Aden Winds - SW Monsoon Western Gulf Tutorial. Retrieved from: http://www.nrlmry.navy.mil/sat_training/world_wind_regimes/GulfOfAden/sw_monsoon_western_gulf/. Accessed at 2004.12.17 45 Sheppard C, Price A, Roberts C. Marine ecology of the Arabian region. Academic Press: San DC, 1992, p. 358 46 http://www.saudidiving.com/red-sea-maps.htm
13
entire length of the Red Sea to blow from the northwest down the length of the Red Sea and out into the Gulf of Aden.47,48
Wind direction in the Red Sea varies with season. In the southern end of the Red Sea Southeast winds of force 5 or over can affect the southerly progress of low powered vessels between October and April. During the Southwest monsoon (June to August/September) the wind direction in the southern end of the Red Sea is reversed. Strong Southwest monsoon winds, with heavy seas, can be found in the eastern end of the Gulf of Aden.49
The wind-stress is strong in the southern part of the Red Sea; the wind direction reverses seasonally in association with the Indian monsoon system. Which of the two forcing mechanisms, wind or thermohaline, is controlling the observed circulation in the Red Sea and the exchange with the Indian Ocean is highly debated.50
The winter winds over the northern Red Sea are strongly event dominated by frontal passages which move southward from Egypt and the southern Mediterranean and decay near the latitude of the convergence zone. During summer (June - September) this convergent wind pattern is replaced by weaker northwesterly winds over the entire Red Sea.51
Over the Gulf of Aden, the Southwest Monsoon usually sets in towards the end of May or early in June, shortly after it has become fully established over the western Arabian Sea. Once established, conditions persist throughout June, July, and August. Near the eastern entrance, SSW winds prevail and the wind speed increases very rapidly as the entrance is approached from the west. In July, typical conditions consist of 11-16 kt over the Gulf and eastward to about 52E, becoming 22- 27 kt in the area of 52-54E, and further increasing to 28-33 kt in the vicinity of 56-60E. While gale-force winds are infrequent in the Gulf, gales of 34 to 40 kt are experienced on about 11 days per month in the 52- 54E zone. A marked increase in wave and swell heights
47 United States Naval Oceanography Command Detachment (1993) US Navy Regional Climatic Study of the Red Sea line. and Adjacent Waters. National Oceanic and Atmospheric Administration, Asheville, NC. 48 Karen Rosen , Robert Van Buskirk And Karina Garbesi (1999). Wind Energy Potential of Coastal Eritrea: An Analysis of Sparse Wind Data. Solar Energy Vol. 66, No. 3, pp. 201–213, 1999 49 Anthony J. Hooten (1999) Navigation Risk Assessment and Management Plan - Final Report
50 S. S. Sofianos, W. E. Johnsand S. P. Murray.Heat and freshwater budgets in the Red Sea from direct observations at Bab el Mandeb Deep Sea Research Part 2: topical Studies in oceanography. Vol.49. Issues 7-8, 2002.pages 1323-1340.
51 Arabian Marginal Seas and Gulfs. Report of a Workshop held at Stennis Space Center, Miss.11-13 May 1999 Sponsored by the Offce of Naval Research. Report prepared by the Workshop Organizing Committee: William E. Johns; Gregg A. Jacobs; John C. Kindle Steven P. Murray and Mike Carron. University of Miami RSMAS. Technical Report 2000-01
14
are also experienced as one passes eastward out of the Gulf of Aden into the western Arabian Sea.52
The Gulf of Aden is influenced mainly by the NE monsoon. Summer sea surface temperatures of 29–30°C indicate the little influence of the strong southwest winds on the Gulf of Aden that are higher by 3–6°C compared to temperature values in the upwelling regions off Somalia and Oman. (Rixen et al., 1996 and Van Couwelaar, 1997). 53,54
Wind-speed seems also to play an important roll in the extent of the surface-water cooling and the amount of deepening of the mixed layer during the NE monsoon period. Satellite derived mean wind-speed estimates indicate that during the NE monsoon the mean wind velocity is ~6 m s-1 in the Gulf of Aden (Rixen et al., 1996).55
There is no record of any cyclone having entered the Red Sea, and thunderstorms are infrequent, as is rainfall. It is extremely hot from June to September and the heat, combined with the high humidity in the S part of the Red Sea during these months, makes the climate oppressive.56
2. Haze
Haze and poor visibility can be a problem in the Region, particularly in the Red Sea and particularly between May and September. Conditions during which it is difficult to obtain a position using celestial navigation because of a «poor» horizon are not common.57
Water Balance
52 NRL. Monterey, Marine Meteorology Division. Arabian Sea/Gulf of Aden Winds - SW Monsoon Western Gulf Tutorial. Retrieved from: http://www.nrlmry.navy.mil/sat_training/world_wind_regimes/GulfOfAden/sw_monsoon_western_gulf/. Accessed at 2004.12.17 53 Rixen, T., Haake, B., Ittekkot, V., Guptha, V.M.S., Nair, R.R. and Sclossel, P., 1996. Coupling between SW monsoon-related surface and deep ocean processes as discerned from continuous particle flux measurements and correlated satellite data. J. Geophys. Res. 101, pp. 28569–28582. 54 Van Couwelaar, M., 1997. Zooplankton and microplankton biomass off Somalia and in the southern Red Sea during the SW monsoon of 1992 and the NE monsoon of 1993. Deep-Sea Res. 44 11, pp. 1213–1234. 55 Rixen, T., Haake, B., Ittekkot, V., Guptha, V.M.S., Nair, R.R. and Sclossel, P., 1996. Coupling between SW monsoon-related surface and deep ocean processes as discerned from continuous particle flux measurements and correlated satellite data. J. Geophys. Res. 101, pp. 28569–28582. 56 Red Sea and the Persian Gulf .(2001)National Imagery and Mapping Agency Bethesda, Maryland. Sector 12. Sector 3. The Red Sea-Central Passage. Page 31. 57 Anthony J. Hooten (1999) Navigation Risk Assessment and Management Plan - Final Report
15
1. Precipitation
The Red Sea is located in an arid, tropical zone. Rainfall in general is sparse estimates ranging from 0.5 to 0.15 mmyr –1 58 and varies widely, with particular areas receiving no rainfall for months or years. 59 Over the sea, rainfall may amount to as little as 10+15 millimetres per year, whereas along the coastline its estimated range is from a few millimetres per year along the northern part of the western shore, gradually increasing to 180 millimetres at Suakin (19-N). 60
Average rainfall in the Saudi Arabian coastal area is very low, less than 70 mm/yr along the broad coastal Tihama, 16 mm/yr at Al Wejh, 63 mm/yr at Jeddah and 63 mm/yr at Jizan. The average annual rainfall in the Gulf of Aqaba region is about 25-30 mm.61
2. Evaporation
The first attempt to measure the evaporation was carried out by Vercelli (1925) using pan measurements aboard a ship and on the coast. His estimated value of 3.5 myr -1 is extremely high and the results seem doubtful since pan measurements over the land are very different from those on the sea surface (Morcos, 1970).62
In the Red Sea, evaporation exceeds the freshwater supply; therefore the outflow of Red Sea water is warmer and more saline than the adjacent Arabian Sea water. 63The evaporation rate is believed to be among the highest in the world ocean, but available estimates differ considerably in annual mean value as well as seasonal cycle. The
58 da Silva, A.M., Young, C.C., Levitus, S., 1994. Atlas of surface marine data 1994. Algorithms and Procedures, Vol. 1, NOAA Atlas NESDIS 8, US Department of Commerce, NOAA, NESDIS, 83pp.
59 S. S. Sofianos, W. E. Johnsand S. P. Murray.Heat and freshwater budgets in the Red Sea from direct observations at Bab el Mandeb Deep Sea Research Part 2: topical Studies in oceanography. Vol.49. Issues 7-8, 2002.pages 1323-1340.
60 Tony Chiffings . A Global Representative System of Marine Protected Areas. MARINE REGION 11: ARABIAN SEAS. Volume 3.Central Indian Ocean, Arabian Seas, East Africa, and East Asian SeasA Report to the World Bank Environment Department. 1995 61 UNEP. Regional Seas. Red Sea & Gulf of Aden. http://www.unep.ch/seas/main/persga/redtour.html 62 S.A. Morcos , Physical and chemical oceanography of the Red Sea. Oceanography and Marine Biology Annual Review 8 (1970), pp. 73–202.
63 Pothuri Divakar Naidu and Nobuaki Niitsuma. Carbon and oxygen isotope time series records of planktonic and benthic foraminifera from the Arabian Sea: implications on upwelling processes. Palaeogeography, Palaeoclimatology, Palaeoecology. Volume 202, Issues 1-2. 2003, Pages 85-95
16
annual mean freshwater loss to the atmosphere over the Red Sea is estimated to be
2.06 ± 0.22 myr -1, while the annual mean heat loss is 11±5 Wm-2.64
High evaporation and low precipitation and run-off result in a net freshwater loss of 2 m yr-1 over the Red Sea. (Morcos, 1970) 65 More recent and precise estimates put the net annual average evaporation at 2.06±0.22 m yr-1 (Sofianos et al., 2002).66 This is the major contributor to the net buoyancy loss in the Red Sea of 2×10⁻⁸ m2 s-1 (Tragou et al., 1999). 67The buoyancy loss within the basin is responsible for the creation of Red Sea Water (RSW) throughout the basin. Red Sea Water (RSW) lies above Red Sea Deep Water (RSDW). The deeper RSDW is formed by intense wintertime evaporation over the Gulf of Suez and the Gulf of Aqaba (Maillard and Soliman, 1986; Cember, 1988). 68, 69
The climate of the Gulf of Aden is exceptionally dry and, especially from May to September, very hot. Very little rain falls over the Gulf and coastal areas, on average of 2-4 inches per year, generally during the early part of the year and in the form of showers. The climate of the western Arabian Sea is generally cooler than that of the Gulf, but still quite hot. Very little rain falls over the northern portion of the area addressed here, but near the equator annual amounts are about 25 inches, mostly falling during the Southwest Monsoon and transition seasons. This seasonal rainfall pattern is the reverse of the eastern Arabian Sea where the Southwest Monsoon brings extremely heavy rainfall to Eastern India and offshore areas.70
Chemical characteristics
1. Salinity
The Red Sea is a concentration basin where extensive evaporation and winter cooling transform the surface waters to form one of the most saline water masses of the world 64 S. S. Sofianos, W. E. Johnsand S. P. Murray.Heat and freshwater budgets in the Red Sea from direct observations at Bab el Mandeb Deep Sea Research Part 2: topical Studies in oceanography. Vol.49. Issues 7-8, 2002.pages 1323-1340.
65 S.A. Morcos , Physical and chemical oceanography of the Red Sea. Oceanography and Marine Biology Annual Review 8 (1970), pp. 73–202. 66 S.S. Sofianos, W. Johns and S.P. Murray , Heat and frehwater budgets in the Red Sea from direct observations at Bab el Mandab. Deep-Sea Research II 49 7-8 (2002), pp. 1323–1340 67 S.S. Sofianos, W. Johns and S.P. Murray , Heat and frehwater budgets in the Red Sea from direct observations at Bab el Mandab. Deep-Sea Research II 49 7-8 (2002), pp. 1323–1340 68 C. Maillard and G. Soliman , Hydrography of the Red Sea and exchanges with the Gulf of Aden in summer. Oceanologica Acta 9 3 (1986), pp. 249–269. 69 R.P. Cember , On the sources, formation and circulation of Red Sea Deep Water. Journal of Geophysical Research 93 C7 (1988), pp. 8175–8191. 70 NRL. Monterey, Marine Meteorology Division. Arabian Sea/Gulf of Aden Winds - SW Monsoon Western Gulf Tutorial. Retrieved from: http://www.nrlmry.navy.mil/sat_training/world_wind_regimes/GulfOfAden/sw_monsoon_western_gulf/. Accessed at 2004.12.17
17
ocean, the Red Sea Water (RSW).71 The Red Sea has relatively little water exchange with the Mediterranean Sea and the Indian Ocean, and is regarded as an enclosed Sea. No rivers flow into the Red Sea in addition to high temperatures, these results in very high levels of salinity and other dissolved salts. As a consequence, the salinity is higher (40-41%) than in the open ocean. 72 Within the central rift valley of the Red Sea about 25 local topographic depressions filled with high saline brines are known during the last 30 years.73
The Red Sea is the most saline sea, with salinity of 41,000 ppm at the Gulf of Suez and 39,000 ppm of salt at the southern end.74 The surface salinity is 42.5% and a temperature of 30 C during the summer, but at depths below 2000 m, the salinity exceeds 250% and the temperature exceeds 36 C (note that the very high salinity dominates the high temperature of the water.75 Minor variations in the open ocean salinity values are caused by differences in evaporation and rainfall and outflow of fresh water from rivers. Highest salinity values are found in areas where evaporation greatly exceeds precipitation. These conditions occur underneath the atmospheric subtropical high-pressure cells. The Red Sea also qualify in this category.76 The Gulf of Aden is the receiving basin for the dense, saline overflow of Red Sea Water (RSW). The overflow results from an excess of evaporation over precipitation in the Red Sea, estimated to be about 2 m yr_1 (Morcos, 1970). 77
2. Dissolved oxygen
The dissolved oxygen showed a maximum and homogeneous distribution in winter and a minimum in summer.78
A thick oxygen minimum zone (OMZ) predominates the intermediate water of the Gulf of Aden region from about 100 to 1500 m (Jean-Baptiste et al., 1990and Van
71 S. S. Sofianos, W. Johns and S.P. Murray , Heat and frehwater budgets in the Red Sea from direct observations at Bab el Mandab. Deep-Sea Research II 49 7-8 (2002), pp. 1323–1340 72 Jordan Royal Ecological Diving Sociaty. Red Sea and Gulf of Aqaba. http://www.jreds.org/redsea.htm 73 M., Scholten, J. C., Stoffers, P. and Wehner, F., 1998. Hydrographic structure of brine-filled deeps in the Red Sea: new results from the Shaban, Kebrit, Atlantis II and Discovery deep. Marine Geology 144, pp. 311–330 74 http://home.wxs.nl/~hans.mebrat/eritrea-redsea.htm
75 Introductory Oceanography. Chapter 12 - The Shore, Coastal Waters & Marginal Seas. Part 3
76 Hans Rosendal. Pressure And Density In The Atmosphere And Ocean.
77 Morcos, S. A., Physical and chemical oceanography of the Red Sea, Oceanography Marine Biology Annual Review, 8, 73–202, 1970. 78 Mohammad Ismail Badran. Dissolved oxygen, chlorophyll a and nutrient, seasonal cycles in waters of the Gulf of Aqaba, Red Sea. Journal of the Aquatic Ecosystem Health and Management. Vol.4 issues 2.(Abstract)
18
Couwelaar, 1997).79, 80 It is a part of the widespread intermediate water low-oxygen layer of the northern Arabian Sea that almost lacks any dissolved oxygen. 81The depletion of oxygen results from the combined effect of moderate consumption rates following the enormous productivity of the surface layer with initially low oxygen concentrations in the waters entering the layer from the south due to their long transit from their sea surface sources near 40°S. 82,83The somewhat more aerated intermediate water of the Gulf of Aden with minimum oxygen concentration of ~0.3–0.5 ml O2/l;
84, 85 seems to reflect the lower consumption rates due to reduced primary productivity as compared to the intense upwelling regions off Oman and Somalia.
In the western Gulf of Aden the oxygen content was below 0.5 ml/l by 30 m, while in the eastern part the upper and oxygen rich layer was deeper. Indications of local upwelling were observed at several places along the South-Yemen and Oman coast eastward to Ras Al Hadd.86
3. Nutrients
There is strong evidence which indicated that the production potential of the Red Sea is low. Over most of the basin, thermoclines and haloclines prevent the cycling of nutrients from deeper water to the euphotic zone. There is little nutrient input to the pelagic system from land surface runoff to compensate for the steady loss by sinking of nutrients out of the productive zone. On this basis, productivity can be expected to be low over most of the central Red Sea. Production increases somewhat to the north and south where mixing processes are known to occur (Zakaria A. Zakaria ;2003) 87.
79 Jean-Baptiste, P., Belviso, S., Alaux, G., Nguyen, B.C. and Mihalopoulos, N., 1990. He and methane in the Gulf of Aden. Geochim. Cosmochim. Acta 54, pp. 111–116 80 Van Couwelaar, M., 1997. Zooplankton and microplankton biomass off Somalia and in the southern Red Sea during the SW monsoon of 1992 and the NE monsoon of 1993. Deep-Sea Res. 44 11, pp. 1213–1234. 81 Wyrtki. K., 1971. Oceanographic Atlas of the International Indian Ocean Expedition, National Science Foundation, Washington, DC, 531pp 82 Wyrtki, K., 1973. Physical oceanography of the Indian Ocean. In: Zeitschel, B., Editor, , 1973. The Biology of the Indian Ocean, Springer, New York, pp. 18–36. 83 Olson, D.B., Hitchcock, G.L., Fine, R.A. and Warren, B.A., 1993. Maintenance of the low-oxygen layer in the central Arabian Sea. Deep-Sea Res. II 40, pp. 673–685. 84 Jean-Baptiste, P., Belviso, S., Alaux, G., Nguyen, B.C. and Mihalopoulos, N., 1990. He and methane in the Gulf of Aden. Geochim. Cosmochim. Acta 54, pp. 111–116 85 Van Couwelaar, M., 1997. Zooplankton and microplankton biomass off Somalia and in the southern Red Sea during the SW monsoon of 1992 and the NE monsoon of 1993. Deep-Sea Res. 44 11, pp. 1213–1234. 86 Retrieved from: http://www.fao.org/WAIRDOCS/FNS/FN023E/ch2.htm#Hydrography 87 Zekeria Abdulkerim Zekeria(2003). Butterflyfishes of the Southern Red Sea: Ecology and Population Dynamics. Chapter 1 General Introduction and Outline of the Thesis Rijksuniversiteit Groningen. Netherlands.
19
The Red Sea surface waters are exceptionally clear and low in nutrients because the hot, arid climate means that population density is low and there is little nutrient input from soil, agriculture and pollution on land. It also creates a permanent surface layer of warm, nutrient-poor water, which does not mix with nutrient-rich deeper water (a process called "stratification").88
The circulation in the northern Indian Ocean, as driven by the winter monsoon, introduces nutrient rich surface water from the Gulf of Aden into the Red Sea. Winter is the productive season in the Red Sea.89
Surface water nitrate concentration, an indicator of the upwelling strength, is undetectable in the Gulf of Aden while at the same time values of up to 19 M occur in the adjacent upwelling region off Somalia and off south Yemen. 90, 91Both very low chlorophyll concentration and carbon production indicate the lack of any significant upwelling in the Gulf of Aden.92
Chlorophyll a showed a seasonal pattern close to that of dissolved oxygen, but with a distinct summer peak between 50 and 75 m. Ammonia was absent from the entire water column in the Gulf of Aqaba, Red Sea during summer and relatively abundant and homogeneously distributed in winter. Nitrite had a seasonal pattern similar to that of chlorophyll a and exhibited a summer subsurface maximum just below that of chlorophyll a. Nitrate, phosphate and silicate had similar seasonal patterns characterized by high concentrations in deeper water during summer overlaid by vanishingly low concentrations of nitrate and phosphate and relatively low in the case of silicate. In winter the three nutrients exhibited relatively high concentrations homogeneously distributed in the entire water column.93
Mangrove and sea grass communities are an important feature of the coastal areas and provide significant productivity and input of nutrients. Available information
88 Red Sea Coast Reefs. http://www.egyptvoyager.com/redsea_formation_reefs.htm
89 Regional Blueprint And Pilot Projects For The Red Sea. http://ioc.unesco.org/goos/HOTO4/Hoto4_a12.htm
90 Van Hinte, J.E., Van Weering, Tj.C.E., Troelstra, S.R. (Eds.), 1995. Tracing a Seasonal Upwelling. National Museum of Natural History, Leiden, 146pp. 91 Van Couwelaar, M., 1997. Zooplankton and microplankton biomass off Somalia and in the southern Red Sea during the SW monsoon of 1992 and the NE monsoon of 1993. Deep-Sea Res. 44 11, pp. 1213–1234.
92 A. Almogi-Labin, G. Schmiedl , C. Hemleben , R. Siman-Tov , M. Segl and D. Meischner .The influence of the NE winter monsoon on productivity changes in the Gulf of Aden, NW Arabian Sea, during the last 530 ka as recorded by foraminifera. Marine Micropaleontology. Vol.40. issue 3. 2000, Pages 295-319
93 Mohammad Ismail Badran. Dissolved oxygen, chlorophyll a and nutrient, seasonal cycles in waters of the Gulf of Aqaba, Red Sea. Journal of the Aquatic Ecosystem Health and Management. Vol.4 issues 2.(Abstract)
20
indicates that primary productivity of the Red Sea is highest in the southern Red Sea (1.60 g/cm2/day) and decreases through the central sections (0.39 g/cm2/day), the northern sections (0.21–0.50 g/cm2/day), the Gulf of Suez (0.22 g/cm2/day) and the Gulf of Aqaba (0.21–0.09 g/cm2/day). These figures are generally lower than the surrounding waters of the Indian Ocean and Arabian Sea, and reflect the generally lower nutrient levels present in the Red Sea due to the lack of significant riverine nutrient input or oceanic upwelling, particularly in the Red Sea proper.94
4. Methane concentration
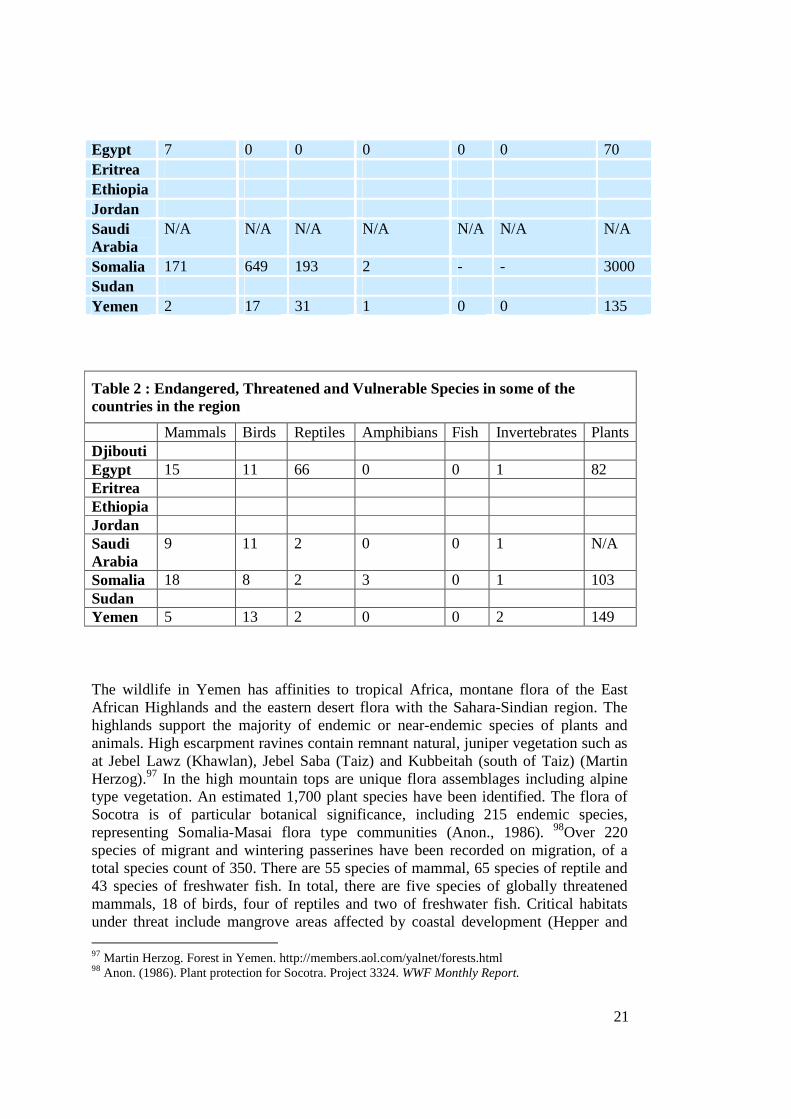
Methane concentrations of surface waters (0–30 m depth) are near 40 nL/L, which is close to the equilibrium concentration with atmospheric methane. As the stable isotope ratios of this methane is close to −47‰, which is a typical value for atmospheric methane atmospheric equilibrium conditions can be inferred for Red Sea surface water. Methane concentrations slightly increase to more than 50 nL/L with increasing water depth. However, this change is not correlated with an isotope shift. Between about 500 and 1900 m in the Red Sea deep water the concentrations are below 50 nL/L and the 13C1-values range between 30 and 40%.95 Biodiversity Over 1,000 of the estimated 3,500 plant species of the Saudi Arabia have either Mediterranean or Iranian affinities. The Red Data Book for rare and endangered mammals and birds, reptiles and amphibians lists a total of 59 terrestrial mammal species, 19 species of which are endangered, vulnerable or rare. There are 444 resident and migratory bird species, 11 species included in the Red Data Book, and 9 species of amphibian (7 of which are endemic). All the indigenous freshwater fish are full endemics. The region is important as a migration route for huge numbers of birds of a great variety of species. It has been estimated that some 2-3,000 million migrants move in a southerly direction across Arabia each autumn, involving up to 200 species (Child and Grainger, 1990).96
Table 1 : Endemic Species in the Red Sea and Gulf of Aden region
Mammals Birds Reptiles Amphibians Fish Invertebrates Plants Djibouti
94 Makram A. Gerges The Red Sea and Gulf of Aden Action Plan––Facing the challenges of an ocean gateway. Ocean&Coastal management. Vol.45.2002. pages 885-903
95 E. Faber, R. Botz, J. Poggenburg, M. Schmidt, P. Stoffers and M. Hartmann. Methane in Red Sea brines. Organic Geochemistry. Volume 29. Issues 1-3. 1998. pages 363-379
96 Child, G., and J. Grainger. 1990. A system plan for protected areas for wildlife conservation and sustainable rural development in Saudi Arabia. National Commission for Wildlife Conservation and Development, Riyadh, Saudi Arabia.
21
Egypt 7 0 0 0 0 0 70 Eritrea Ethiopia Jordan Saudi Arabia
N/A N/A N/A N/A N/A N/A N/A
Somalia 171 649 193 2 - - 3000 Sudan Yemen 2 17 31 1 0 0 135
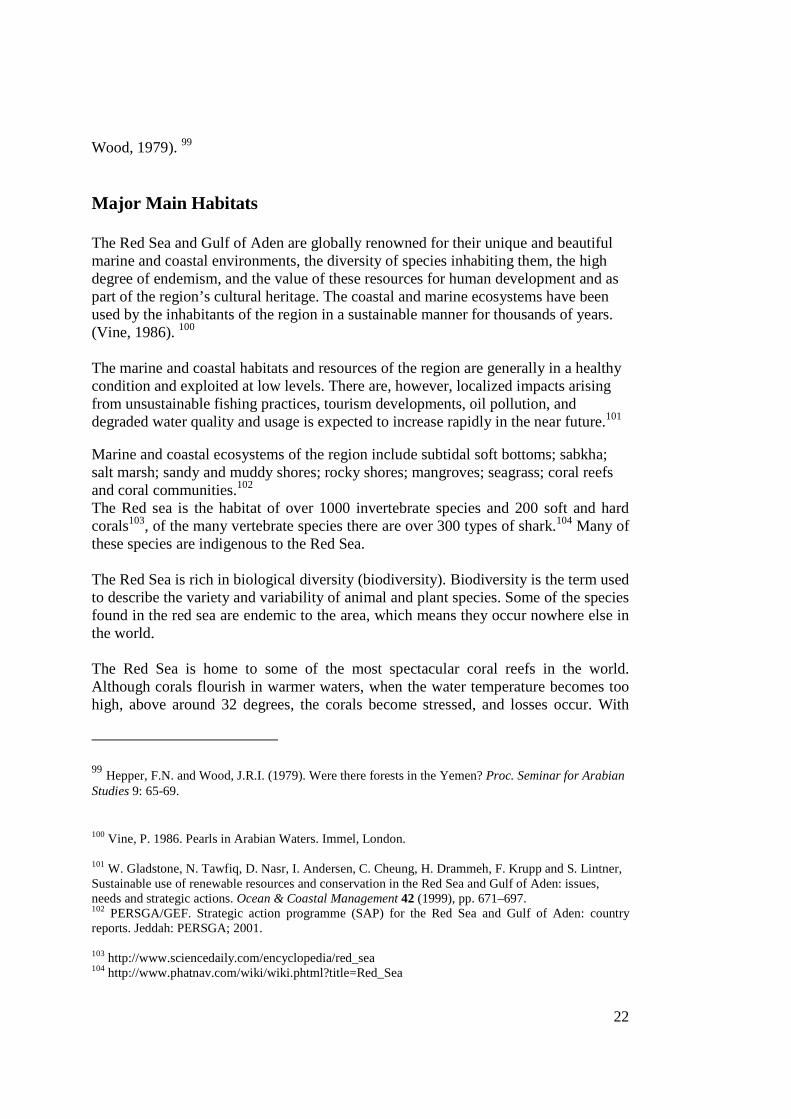
Table 2 : Endangered, Threatened and Vulnerable Species in some of the countries in the region
Mammals Birds Reptiles Amphibians Fish Invertebrates Plants Djibouti Egypt 15 11 66 0 0 1 82 Eritrea Ethiopia Jordan Saudi Arabia
9 11 2 0 0 1 N/A
Somalia 18 8 2 3 0 1 103 Sudan Yemen 5 13 2 0 0 2 149
The wildlife in Yemen has affinities to tropical Africa, montane flora of the East African Highlands and the eastern desert flora with the Sahara-Sindian region. The highlands support the majority of endemic or near-endemic species of plants and animals. High escarpment ravines contain remnant natural, juniper vegetation such as at Jebel Lawz (Khawlan), Jebel Saba (Taiz) and Kubbeitah (south of Taiz) (Martin Herzog).97 In the high mountain tops are unique flora assemblages including alpine type vegetation. An estimated 1,700 plant species have been identified. The flora of Socotra is of particular botanical significance, including 215 endemic species, representing Somalia-Masai flora type communities (Anon., 1986). 98Over 220 species of migrant and wintering passerines have been recorded on migration, of a total species count of 350. There are 55 species of mammal, 65 species of reptile and 43 species of freshwater fish. In total, there are five species of globally threatened mammals, 18 of birds, four of reptiles and two of freshwater fish. Critical habitats under threat include mangrove areas affected by coastal development (Hepper and 97 Martin Herzog. Forest in Yemen. http://members.aol.com/yalnet/forests.html 98 Anon. (1986). Plant protection for Socotra. Project 3324. WWF Monthly Report.
22
Wood, 1979). 99
Major Main Habitats The Red Sea and Gulf of Aden are globally renowned for their unique and beautiful marine and coastal environments, the diversity of species inhabiting them, the high degree of endemism, and the value of these resources for human development and as part of the region’s cultural heritage. The coastal and marine ecosystems have been used by the inhabitants of the region in a sustainable manner for thousands of years. (Vine, 1986). 100 The marine and coastal habitats and resources of the region are generally in a healthy condition and exploited at low levels. There are, however, localized impacts arising from unsustainable fishing practices, tourism developments, oil pollution, and degraded water quality and usage is expected to increase rapidly in the near future.101 Marine and coastal ecosystems of the region include subtidal soft bottoms; sabkha; salt marsh; sandy and muddy shores; rocky shores; mangroves; seagrass; coral reefs and coral communities.102 The Red sea is the habitat of over 1000 invertebrate species and 200 soft and hard corals103, of the many vertebrate species there are over 300 types of shark.104 Many of these species are indigenous to the Red Sea. The Red Sea is rich in biological diversity (biodiversity). Biodiversity is the term used to describe the variety and variability of animal and plant species. Some of the species found in the red sea are endemic to the area, which means they occur nowhere else in the world. The Red Sea is home to some of the most spectacular coral reefs in the world. Although corals flourish in warmer waters, when the water temperature becomes too high, above around 32 degrees, the corals become stressed, and losses occur. With
99 Hepper, F.N. and Wood, J.R.I. (1979). Were there forests in the Yemen? Proc. Seminar for Arabian Studies 9: 65-69.
100 Vine, P. 1986. Pearls in Arabian Waters. Immel, London. 101 W. Gladstone, N. Tawfiq, D. Nasr, I. Andersen, C. Cheung, H. Drammeh, F. Krupp and S. Lintner, Sustainable use of renewable resources and conservation in the Red Sea and Gulf of Aden: issues, needs and strategic actions. Ocean & Coastal Management 42 (1999), pp. 671–697. 102 PERSGA/GEF. Strategic action programme (SAP) for the Red Sea and Gulf of Aden: country reports. Jeddah: PERSGA; 2001. 103 http://www.sciencedaily.com/encyclopedia/red_sea 104 http://www.phatnav.com/wiki/wiki.phtml?title=Red_Sea
23
increased heat loads, together with rising sea temperatures, further impacts are likely in the future. The Gulf of Aqaba is characterized by rich and diverse habitats, which comprise extensive and rocky outcroppings, shallow coastal lagoons, fringing coral reefs and sea grass beds. Aqaba is home to some 1000 species of fish, 110 species of reef building corals and 120 species of soft corals. Dolphins, sea turtles, octopuses, and sea horses are some of the residents of these tropical waters.105 Shark, seabird and cetacean diversity are all relatively low, with no endemic species. There are no pinnipeds but one species of sirenian.106 The waters in the Gulf Of Aden are characterised by a large variety of species, but with relatively few commercially important ones. The abundance of species is strongly influenced by seasonal variations due to the monsoons. Demersal fish and crustacean are more stable and relatively unaffected by the monsoon seasons in terms of abundance. 107 1. Mangroves One of an important ecosystem, which is part of this coastal habitat in the study region, is a mangrove. There are extensive mangrove stands in the Red Sea and Gulf of Aden, especially in the southern Red Sea. Only four species are known from the Red Sea: (Avicennia marina, Rhizophora mucronata, Bruguiera gymnorrhiza and Ceriops tagal). Three species have been reported from the Red Sea coast of Yemen: A. marina, R. mucronata and B. gymnorrhiza. 108 Mangroves are an extremely important form of coastal vegetation: their extensive root systems stabilize sediments and protect the coastline; they provide shelter for an array of marine animals, birds- enhancing overall biodiversity- and the juveniles of commercially important fish and crustaceans. 109The dead leaves and branches of mangroves are a source of food within the mangrove ecosystem and also offshore,
105 Jordan Royal Ecological Diving Society. Red Sea & Gulf Of Aqaba. http://www.jreds.org/redsea.htm 106 http://www.unep-wcmc.org/resources/publications/4_diversity_of_seas/1.doc 107 PERSGA. (2003). Status of the Living Marine Resources in the Red Sea and Gulf of Aden and Their Management.
108 Rouphael, T., Turak, E., and Brodie, J. (1998). Seagrasses and Mangroves of Yemen’s Red Sea. Chapter 3 in: DouAbal, A. et al (eds) Protection of Marine Ecosystems of the Red Sea Coast of Yemen. UN Publication. pp. 41 – 49.
109 Red Sea Coast. Ecosystem. http://www.egyptvoyager.com/redsea_formation_ecosystem.htm
24
such as in shrimp communities. Mangroves generally grow in waterlogged and saline soils of the intertidal zone and are often associated with areas of run-off. Only two species have been recorded along the Saudi Arabian Red Sea coast, Avicennia marina, which is widespread, and Rhizophora mucronata, found at only six sites. They are found in such areas as broad coastal plains, protected shores, over shoals and spits, and in lagoons. While mangroves are found scattered along much of the Red Sea coast, the main concentration is in the southern Red Sea where factors such as increased sediment creates an environment more conducive to their development. This increased development in the soil also coincides with areas of greatest agricultural potential.110 Mangrove degradation has been exacerbated by droughts that have forced nomads onto the coast seeking food for camels, especially in Sudan and Somalia. Grazing of sand dune vegetation by goats, sheep, and camels is re-mobilizing sand dunes in Djibouti, Somalia,111 and the southern coast of Sudan, leading to the smothering of mangroves and other coastal vegetation.112 People living near the coast in Yemen harvest mangroves for material to construct bird traps and houses. Moreover, grazing of mangroves by camels was observed on numerous occasions near Al Hudaydah and Al Luhayyah. South of Al Hudaydah some small, isolated mangrove patches were being covered by drifting sand. This threat to mangroves in Yemen does not appear to be widespread.113 2. Seagrasses The seagrasses are fairly widespread along the Red Sea coast although they are more common in the southern Red Sea. They tend to be concentrated in shallow water areas such as lagoons, sharms (drowned wadi mouths), and mersas (shallow embayments) because of the soft-bottom sediments found in these areas. Of the 11 seagrass species
110 UNEP. Regional Seas. Red Sea & Gulf of Aden. http://www.unep.ch/seas/main/persga/redrisk.html 111 UNEP. Coastal and marine environmental problems of Somalia. UNEP Regional Seas Reports and Studies 84. United Nations Environment Programme, Nairobi, 1987. 112 W. Gladstone, N. Tawfq, D. Nasr. Andersen, C. Cheung, H. Drammeh, F. Krupp, S. Lintner Sustainable use of renewable resources and conservation in the Red Sea and Gulf of Aden: issues, needs and strategic actions. Ocean & Coastal Management. 42. (1999) 671-697
113 Rouphael, T., Turak, E., and Brodie, J. (1998). Seagrasses and Mangroves of Yemen’s Red Sea. Chapter 3 in: DouAbal, A. et al (eds) Protection of Marine Ecosystems of the Red Sea Coast of Yemen. UN Publication. pp. 41 – 49.
25
in the entire Red Sea, ten have been recorded along the Saudi Arabian coast.114 Nine species of seagrass have been reported from Yemeni Red Sea coast, 115,116only three of these species were recorded from the Gulf of Aden coast. Approximately 42% of the Yemeni Red Sea coastline supports seagrass communities where they form extensive seagrass beds in Khawba, Mukha, Luhayyah, Midi and As Salif, while in the Gulf of Aden, they occur mainly in Khor Umaira. In Socotra Island, seagrass beds are not common although a significant coverage of Halodule spp. and Cymodocea serrulata are found.117 As seagrasses are one of the most productive habitats in the coastal environment, their abundance along the Red Sea is indicative of a highly productive ecosystem. Only two species are found in the Gulf of Aqaba, where temperatures are cooler.118,119 In the north, restricted intertidal and sublittoral areas, limited soft substrate environments, and seasonal extremes in temperature and salinity, restrict seagrass beds to shallow, soft-bottom areas of sharms and mersas, or to intertidal and submarine wadi outwash plains.120 Studies on seagrass standing crop have been undertaken mostly in the northern Red Sea. Highest biomass is associated with Thalassodendron ciliatum, Thalassia hemprichii and Syringodium isoetifolium. Biomass of Halodule uninervis+dominated communities in the Gulf are comparable to figures for similar species in the Red Sea and elsewhere.121
114 UNEP. PERSGA.(1997). Regional Seas. Assessment of Land-based Sources and Activities Affecting the Marine Environment in the Red Sea and Gulf of Aden. 1997 115 UNEP.Regional Seas. Red Sea and Gulf of Aden. http://www.unep.ch/seas/main/persga/redtour.html 116 Barratt, L., Dawson-Shepherd, A., Ormond, R. and McDowell, R., 1987, Yemen Arab Republic Marine Conservation Survey, Volume 1,Distribution of habitats, species along the YAR coastline, unpublished report, International Union for Conservation of Nature and Natural Resources.
117 Physical Alterations and Destruction of Habitats. http://www.unep.org/unep/gpa/padh/seagrass.htm
118 Mohammad I. Wahbeh . Seasonal distribution and variation in the nutritional quality of different fractions of two seagrass species from Aqaba (Red Sea), Jordan .Aquatic Botany. Volume 32 . Issue 4. Pages 383-392
119 Anne-Maree Schwarz and Frida Hellblom. The photosynthetic light response of Halophila stipulacea growing along a depth gradient in the Gulf of Aqaba, the Red Sea . Aquatic Botany. Volume 74 . Issue 3. Pages 363-372
120 Physical Alterations and Destruction of Habitats. http://www.unep.org/unep/gpa/padh/seagrass.htm
121 Tony Chiffings.(1995) A Global Representative System of Marine Protected Areas. Marine Region 11: Arabian Seas. Volume 3.Central Indian Ocean, Arabian Seas, East Africa, and East Asian SeasA Report to the World Bank Environment Department. 1995
26
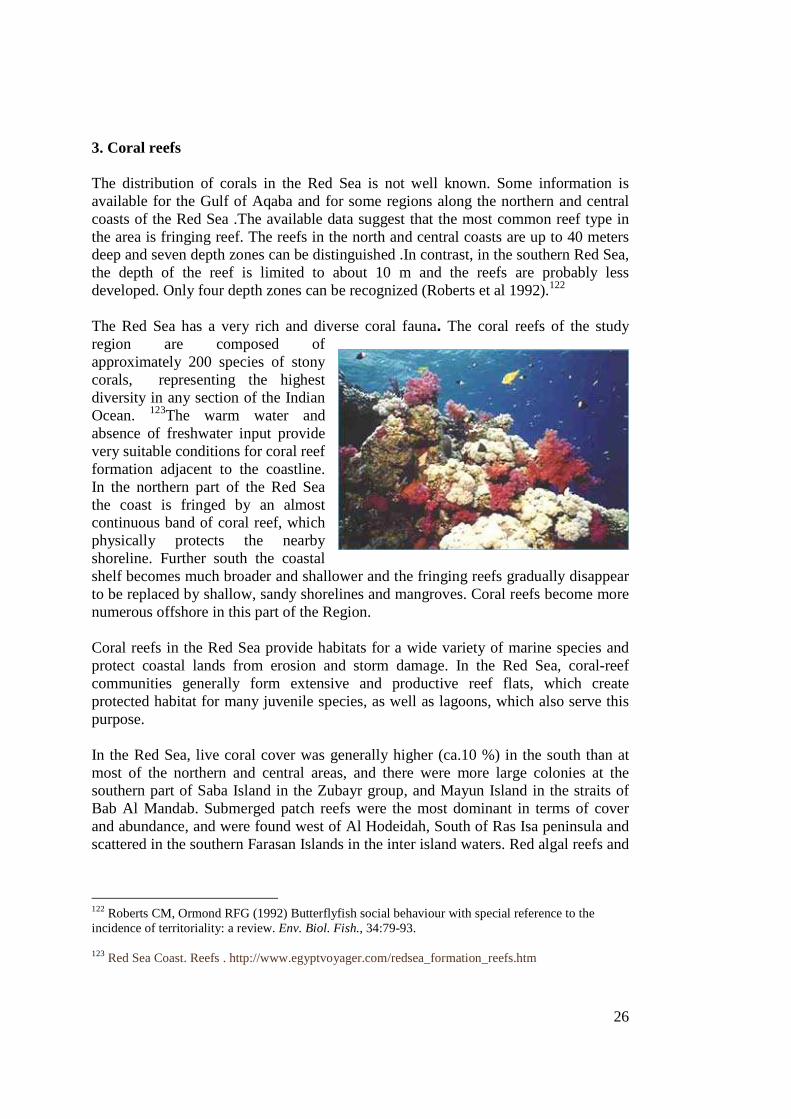
3. Coral reefs The distribution of corals in the Red Sea is not well known. Some information is available for the Gulf of Aqaba and for some regions along the northern and central coasts of the Red Sea .The available data suggest that the most common reef type in the area is fringing reef. The reefs in the north and central coasts are up to 40 meters deep and seven depth zones can be distinguished .In contrast, in the southern Red Sea, the depth of the reef is limited to about 10 m and the reefs are probably less developed. Only four depth zones can be recognized (Roberts et al 1992).122 The Red Sea has a very rich and diverse coral fauna. The coral reefs of the study region are composed of approximately 200 species of stony corals, representing the highest diversity in any section of the Indian Ocean. 123The warm water and absence of freshwater input provide very suitable conditions for coral reef formation adjacent to the coastline. In the northern part of the Red Sea the coast is fringed by an almost continuous band of coral reef, which physically protects the nearby shoreline. Further south the coastal shelf becomes much broader and shallower and the fringing reefs gradually disappear to be replaced by shallow, sandy shorelines and mangroves. Coral reefs become more numerous offshore in this part of the Region. Coral reefs in the Red Sea provide habitats for a wide variety of marine species and protect coastal lands from erosion and storm damage. In the Red Sea, coral-reef communities generally form extensive and productive reef flats, which create protected habitat for many juvenile species, as well as lagoons, which also serve this purpose. In the Red Sea, live coral cover was generally higher (ca.10 %) in the south than at most of the northern and central areas, and there were more large colonies at the southern part of Saba Island in the Zubayr group, and Mayun Island in the straits of Bab Al Mandab. Submerged patch reefs were the most dominant in terms of cover and abundance, and were found west of Al Hodeidah, South of Ras Isa peninsula and scattered in the southern Farasan Islands in the inter island waters. Red algal reefs and
122 Roberts CM, Ormond RFG (1992) Butterflyfish social behaviour with special reference to the incidence of territoriality: a review. Env. Biol. Fish., 34:79-93. 123 Red Sea Coast. Reefs . http://www.egyptvoyager.com/redsea_formation_reefs.htm
27
associated coral communities occurred in the shallow coastal waters from the Saudi Arabian border south to the Ras Isa peninsula and around many nearshore islands.124 The number of corals species in this region are difficult to estimate. Moshira Hassan indicated that the Red Sea has at least 266 coral species in Saudi Arabian waters, and 160 species in the Gulf of Aqaba.125 But UNEP pointed out in one of its reports that there are 194 species of corals recorded along the Saudi Arabian coast. About 30 coral species have been recognized in the Gulf of Aqaba, about 80 near Jeddah, less than 50 near Al Birk, and less than 10 on the southernmost Saudi inshore reefs.126
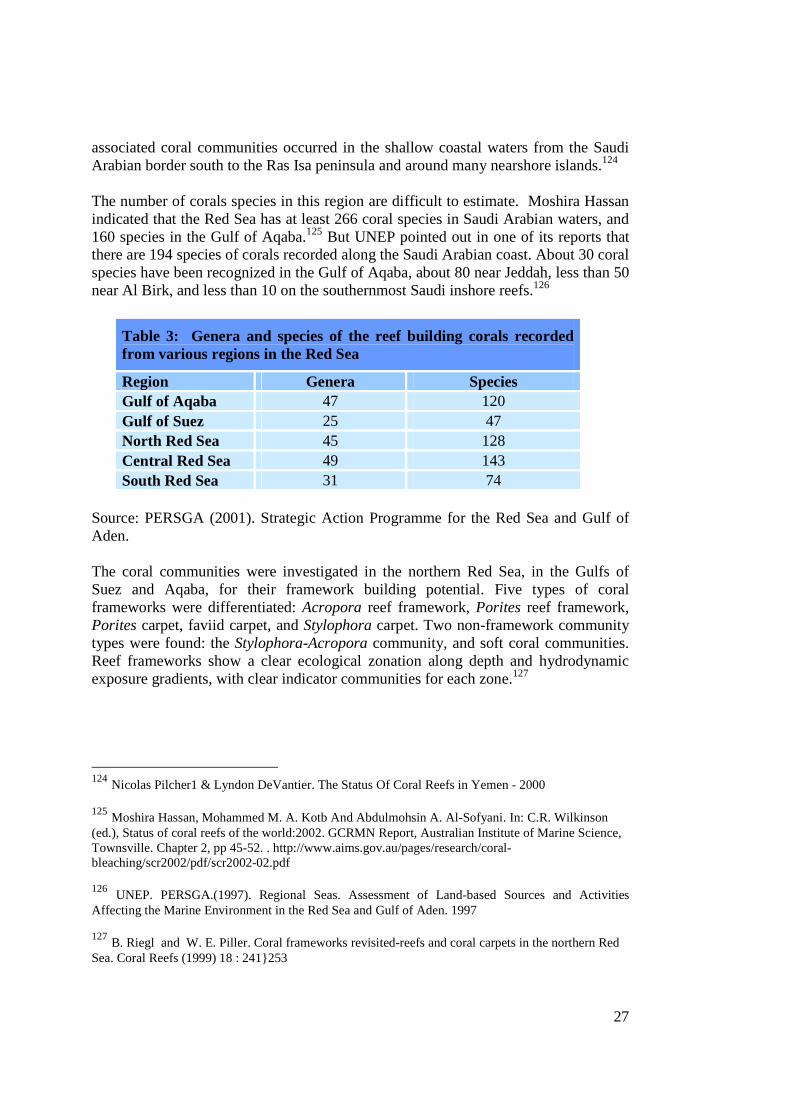
Table 3: Genera and species of the reef building corals recorded from various regions in the Red Sea
Region Genera Species Gulf of Aqaba 47 120 Gulf of Suez 25 47 North Red Sea 45 128 Central Red Sea 49 143 South Red Sea 31 74
Source: PERSGA (2001). Strategic Action Programme for the Red Sea and Gulf of Aden. The coral communities were investigated in the northern Red Sea, in the Gulfs of Suez and Aqaba, for their framework building potential. Five types of coral frameworks were differentiated: Acropora reef framework, Porites reef framework, Porites carpet, faviid carpet, and Stylophora carpet. Two non-framework community types were found: the Stylophora-Acropora community, and soft coral communities. Reef frameworks show a clear ecological zonation along depth and hydrodynamic exposure gradients, with clear indicator communities for each zone.127
124 Nicolas Pilcher1 & Lyndon DeVantier. The Status Of Coral Reefs in Yemen - 2000 125 Moshira Hassan, Mohammed M. A. Kotb And Abdulmohsin A. Al-Sofyani. In: C.R. Wilkinson (ed.), Status of coral reefs of the world:2002. GCRMN Report, Australian Institute of Marine Science, Townsville. Chapter 2, pp 45-52. . http://www.aims.gov.au/pages/research/coral-bleaching/scr2002/pdf/scr2002-02.pdf 126 UNEP. PERSGA.(1997). Regional Seas. Assessment of Land-based Sources and Activities Affecting the Marine Environment in the Red Sea and Gulf of Aden. 1997 127 B. Riegl and W. E. Piller. Coral frameworks revisited-reefs and coral carpets in the northern Red Sea. Coral Reefs (1999) 18 : 241}253
28
Five areas along the Saudi coast are noted for their extensive coral reefs: the Tiran islands area, Wejh bank, the area north of Yanbu, the coastline between Obhur and Thuwal, north of Jeddah; and the outer Farasan bank.
There are 260 species of hard corals in the Red Sea with 6% believed to be endemic128 and the number of coral-reef species in the southern Red Sea and the Gulf of Aden is estimated to be around 130 species. But DeVantier, (2000) indicated that the Red Sea coral communities were composed of at least 260 species of reef-building stony corals from 68 genera in 16 families of the Scleractinia. The coral communities were composed predominantly, both in terms of composition and cover, by the families Acroporidae, Faviidae and Poritidae. A diverse mix of soft corals, hydrozoan fire corals, gorgonians, corallimorpharians and zoanthids were also present.129 In the Gulf of Aden region there are at least six discrete areas where coral communities are developed, from the entrance to the Red Sea to Aden in the west, and from Belhaf to Al Mukalla in the east. In the north-east Gulf of Aden, coral communities are also found at the islands offshore from Bir Ali. The Bir Ali area supports the most concentrated distribution of coral communities known from the northern Gulf of Aden, with large coral patches developed offshore from the village and coral communities fringing the offshore islands. Around the Socotra archipelago, coral communities are distributed patchily around the islands, with most extensive development on the north coasts. 130 Live coral cover averaged 53% with a maximum of 69% on the Red Sea coast of Yemen. Cover on Socotra Island had an average of 31%, with the average cover being 27% at 5m depth and 36% at 10m. Hard coral cover on reefs off the Yemeni coast ranges from 15% cover in Mukalla to 69% in Belhaf at 2m depth where there was 2% of recently killed coral at several sites. Despite this apparent high coral cover, the surveyed reefs seem to have declined recently.131
The Gulf of Aden has very poor reefs because of upwelling water and sandy shorelines, Coral reef development on the Gulf of Aden coast is severely constrained by the low temperature caused by seasonal upwelling resulting in the domination of hard substrates by brown algae, and soft substrates by seagrass.
The poor visibility in the south part of the Red Sea (less than 5m at some transects in the Southern Red Sea.) is reflected in lower coral cover at 8-12m compared to 3-6m.
128 Sheppard CRC, Sheppard ALS. Corals and coral communities of Arabia. Fauna of Saudi Arabia 1991;12:3–170. 129 DeVantier, L. and N. Pilcher, 2000, The Status of Coral Reefs in Saudi Arabia.. Global Coral Reef Monitoring Network (GCRMN) 130 Nicolas Pilcher1 & Lyndon DeVantier. The Status Of Coral Reefs in Yemen - 2000 131 Hassan, M., M.M. A. Kotb and A. A. Al-Sofyani, 2002, Status of Coral Reefs in the Red Sea-Gulf of Aden.. In: C.R. Wilkinson (ed.), Status of coral reefs of the world:2002. GCRMN Report, Australian Institute of Marine Science, Townsville. Chapter 2, pp 45-52
29
Therefore the Coral-based fringing reefs are less common in the Gulf of Aden, occurring on only 5% of the coastline of Yemen particularly in the Belhaf-Bir Ali area. 132, 133, 134There are extensive areas of coral reefs in the Gulf of Aden coastline of Somalia around Saad ad-Din Island in the extreme north-west of the coast near the border with Djibouti, which may be the largest coral reefs in the Gulf of Aden. 135There is only minor development of coral reefs around the Socotra Archipelago, existing mostly as small reef .and at a few locations on the northern sides of islands in the Archipelago.136 The cover of live hard corals in the Gulf of Tadjoura in Djubouti ranged from 12% in south Maskali to over 60% off Sable Blanc with an overall average of 36%. This is virtually unchanged since the previous report by PERSGA in 2000. However, several sites off Maskali Island were deteriorating, with previously healthy coral reefs being largely covered with algae. There were also reef-flats covered in rubble from eroding table corals around Maskali, and the mortality has been attributed to the 1998 bleaching event, and large numbers of the crown-of-thorns starfish (COTS) seen in 2000. These damaged sites were not included in the above average coral cover. In addition, increased numbers of the coral-eating gastropods (Drupella and Coralliophila) were seen at most sites, and the bioeroding urchin Diadema averaged 12 individuals per 100 m2. Human pressures include increasing coastal construction, dredging and land filling, and shipping impacts around the port of Djibouti (the major harbour for Ethiopia). Anchor damage and tourism impacts are increasing in Djibouti with little increase in environmental awareness in the population. 137 Living hard coral cover was significantly higher in the Red Sea than in the Gulf of Aqaba. Cover ranged from 16-67% at 5m depth, with an average of 45% in the Red Sea, and 35% in the Gulf of Aqaba. There was an average of 10% soft coral cover. The coral cover was significantly lower at 10m depth, with an average of 26% (Red Sea 33%; Gulf of Aqaba 20%). A comparison of two sites surveyed in 1997 and 2002
132 PERSGA/GEF. Strategic action programme (SAP) for the Red Sea and Gulf of Aden: country reports. Jeddah: PERSGA; 2001. 133 Kemp JM, Benzoni F. A preliminary study of coral communities in the northern Gulf of Aden. Fauna of Arabia 2000;18:67–86. 134 Kemp JM. Zoogeography of the coral reef .shes of the Socotra Archipelago. Journal of Biogeography 1998;25:919–33. 135 PERSGA/GEF. Strategic action programme (SAP) for the Red Sea and Gulf of Aden: country reports. Jeddah: PERSGA; 2001. 136 William Gladstone, Fareed Krupp, Mohammed Younis.(2003). Development and management of a networkof marine protected areas in the Red Sea and Gulf of Aden region. Ocean & Coastal Management 46 (2003) 741–761 137 Hassan, M., M.M. A. Kotb and A. A. Al-Sofyani, 2002, Status of Coral Reefs in the Red Sea-Gulf of Aden.. In: C.R. Wilkinson (ed.), Status of coral reefs of the world:2002. GCRMN Report, Australian Institute of Marine Science, Townsville. Chapter 2, pp 45-52.
30
in the Gulf of Aqaba show that coral cover decreased from 37% to 13%, probably due to repeated outbreaks of COTS during 1998. There have also been major decreases in giant clam populations between 1997 and 2002, with many of the small clams seen in 1997 not surviving through to 2002. This is attributed to sediment from major constructions in South Sinai over the last 5 years.138
The reefs in southern Egypt are more diverse than those in the north, with nearly double the number of coral species. The distribution and development of reef-building corals is restricted in the Gulf of Suez by several factors, including temperature, sediment load, salinity and light penetration. During 1997 to 1999 three different, but coordinated, projects conducted surveys from approximately 130 reef sites between 1997 and 1999 from Hurghada to Shakateen (and more detailed studies to assess diving impacts at 11 sites near Hurghada). These have been summarised by respectively in reports by the: Egyptian Red Sea Coastal and Marine Resources Management Project; the Ecological Sustainable Tourism Project and the Coral Reef Biodiversity Project. Rapid Environmental Asssessments (REAs) have been made at 48 frequently visited dive sites as part of the Environmentally Sustainable Tourism Project. Collectively the results from the above surveys indicate there was 55% coral cover in non-sheltered areas, and 85% in sheltered areas. Live coral cover generally ranged from 11 to 35% on the reef flats, with the highest cover on reef walls (12-85%) and reef slopes (5-62%). Live coral cover was highly variable along the coast, with the highest being on reef walls and the leading edges of the reefs. A decline of 20-30% in coral cover has been recorded at most sites, and this corresponds with increases in the cover of recently dead coral, and crown-of-thorns starfish (COTS) outbreaks. 139
Israel has approximately 12 km of coastline in the northern Gulf of Aqaba (Eilat), between Jordan and Egypt, with one Marine Protected Area (155ha), and one Costal Protected Area (16ha). The reserves are governed by the state of Israel. These are among the most northerly coral reefs in the world (30°N), which grow on a narrow shelf before it drops to 400-700m. The hard coral diversity is relatively high with over 100 species, as well as about 350 species of reef fishes including a high proportion of endemics. Anthropogenic stresses from intensive tourism activity and poor water quality from mariculture effluents, sewage discharges, flood waters, ballast and bilge water, and discharges of fuel, oil, detergents, phosphates, pesticides, anti-fouling compounds are damaging the reefs. Monitoring of the coral community in the Nature Reserve of Eilat, reveals that the live coral cover has decreased in the last 15 years by 76% and the number of coral colonies by 73%. During this period, there has been a major decrease in the abundance and cover of the key coral species. Coral recruitment has been declining steadily by 53-96% since 1997. During winter and spring, nutrient-rich deep water rises and causes seasonal blooms of algae, which can smother corals
138 Hassan, M., M.M. A. Kotb and A. A. Al-Sofyani, 2002, Status of Coral Reefs in the Red Sea-Gulf of Aden.. In: C.R. Wilkinson (ed.), Status of coral reefs of the world:2002. GCRMN Report, Australian Institute of Marine Science, Townsville. Chapter 2, pp 45-52. 139 Wilkinson, C.R. (Ed), 2000, Status of coral reefs of the world: 2000.. Australian Institue of Marine Science, Cape Ferguson, Queensland, 363 p.
31
and block light penetration. About 20% of shallow water corals died during a severe upwelling in 1992. During the last 10 years, the mariculture industry has grown exponentially from 300 tons of fish per year in 1993 to 2,000 tons per year in 2000. The fish are fed with 4150 tons per year of ‘fish pellets’ which adds 242 tons of Nitrogen and 40 tons of Phosphate annually into the area. Currents carry the nutrients from the mariculture industry into the Coral Nature Reserve, and are probably the major cause for 49% coral colony mortality and a decrease of 62% in coral cover between 1993-2000. By any criteria, the coral reefs of Eilat are extremely degraded and considered to be in a ‘critical state’. If eutrophication of the water is not be stopped immediately, the final collapse and total destruction of the unique coral reefs of Eilat is almost certain. The only chances for restoration of the reefs are extreme protection measures against all human disturbances.140
Little current research data is available for Jordan's reefs. The reefs are in relatively good condition, with over 90% coral cover, and no evidence of bleaching was observed after the 1997/1998 climatic event. 141
All countries have a legal framework for coral reef conservation, and the scope of the laws and the degree of implementation differs widely between and even within the countries of the region. Stronger enforcement of national and international laws, the development of public awareness programs and the adoption of sustainable management strategies are all needed for coral reef conservation to improve and for the current trend in deterioration of the environment to be reversed.142
8. Marine Protection Area
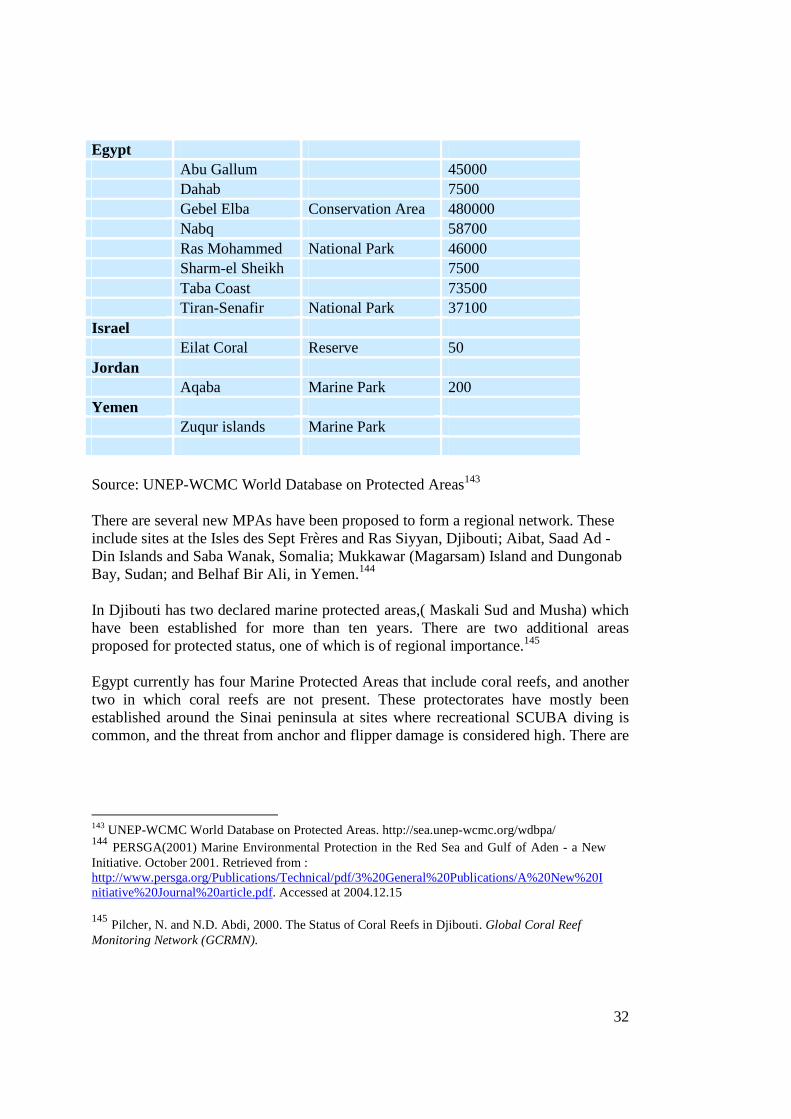
The Red Sea and Gulf of Aden already have a small number of protected areas, the most well known being the Parks at Ras Mohammed, Hurghada and the Egyptian Red Sea Islands, Sanganeb atoll in Sudan, the Farasan Islands in Saudi Arabia, and most recently Socotra Island, Yemen. (table below)
Table 4 : The main Marine Protected Area in the region
Country Name Designation Area ( hectares) Djibouti Maskali Sud Integral Reserve 0 Musha Territorial Park 0 140 Obura, D., L. Celliers, H. Machano, S. Mangubhai, M. S. Mohammed, H. Motta, C. Muhando, N. Muthiga, M. Pereira and M. Schleyer, 2002, Status of Coral Reefs in Eastern Africa: Kenya, Tanzania, Mozambique and South Africa.. In: C.R. Wilkinson (ed.), Status of coral reefs of the world:2002. GCRMN Report, Australian Institute of Marine Science, Townsville. Chapter 4, pp 63-78 141 Pilcher, N. and S.M. Al-Moghrabi, 2000, The Status of Coral Reefs in Jordan. Global Coral Reef Monitoring Network (GCRMN) 142 Moshira Hassan, Mohammed M. A. Kotb And Abdulmohsin A. Al-Sofyani. Status Of Coral Reefs In the Red Sea-Gulf Of Aden. http://www.aims.gov.au/pages/research/coral-bleaching/scr2002/pdf/scr2002-02.pdf
32
Egypt Abu Gallum 45000 Dahab 7500 Gebel Elba Conservation Area 480000 Nabq 58700 Ras Mohammed National Park 46000 Sharm-el Sheikh 7500 Taba Coast 73500 Tiran-Senafir National Park 37100 Israel Eilat Coral Reserve 50 Jordan Aqaba Marine Park 200 Yemen Zuqur islands Marine Park
Source: UNEP-WCMC World Database on Protected Areas143
There are several new MPAs have been proposed to form a regional network. These include sites at the Isles des Sept Frères and Ras Siyyan, Djibouti; Aibat, Saad Ad -Din Islands and Saba Wanak, Somalia; Mukkawar (Magarsam) Island and Dungonab Bay, Sudan; and Belhaf Bir Ali, in Yemen.144
In Djibouti has two declared marine protected areas,( Maskali Sud and Musha) which have been established for more than ten years. There are two additional areas proposed for protected status, one of which is of regional importance.145
Egypt currently has four Marine Protected Areas that include coral reefs, and another two in which coral reefs are not present. These protectorates have mostly been established around the Sinai peninsula at sites where recreational SCUBA diving is common, and the threat from anchor and flipper damage is considered high. There are
143 UNEP-WCMC World Database on Protected Areas. http://sea.unep-wcmc.org/wdbpa/ 144 PERSGA(2001) Marine Environmental Protection in the Red Sea and Gulf of Aden - a New Initiative. October 2001. Retrieved from : http://www.persga.org/Publications/Technical/pdf/3%20General%20Publications/A%20New%20Initiative%20Journal%20article.pdf. Accessed at 2004.12.15 145 Pilcher, N. and N.D. Abdi, 2000. The Status of Coral Reefs in Djibouti. Global Coral Reef Monitoring Network (GCRMN).
33
seven additional areas that have been proposed or suggested to the Government for protected status.146
The Aqaba Coral Reef Protected Area is the only proposed protected area for Jordan. It will enclose an undefined areas of diverse reefs and associated fauna at the northern tip of the Gulf of Aqaba.147
There is only one protected area (Zuqur islands ) and six proposed protected areas in Yemen. Establishment of marine protected areas is a relatively new process in Yemen.148
Living Marine Resources
1. Turtles
Marine turtle populations are under increasing pressure in this region due to pollution, over-harvesting of eggs and adults, destruction of nesting sites by coastal development, and accidental killing in the nets of fishing vessels.
Turtles in the region are caught either accidentally or intentionally by fishermen throughout the southern red Sea and Gulf of Aden. 149, 150 Most of the turtle collecting occurs in areas with rich resources of pelagic fishes Local recreational use of beaches has led to nesting turtles being killed and feral dog predation on eggs at Dhobba, Shihr, and Ras Sharma (Yemen).151
There are five species of marine turtles in the region, But the most important species are the green turtle Chelonia mydas and the hawksbill Eretmochelys imbricata are the
146 Pilcher, N. and Abou Zaid, M., 2000, The Status of Coral Reefs in Egypt.. Global Coral Reef Monitoring Network (GCRMN). 147 Pilcher, N. and S.M. Al-Moghrabi, 2000, The Status of Coral Reefs in Jordan. Global Coral Reef Monitoring Network (GCRMN). 148 Pilcher, N. and N.D. Abdi, 2000. The Status of Coral Reefs in Yemen. Global Coral Reef Monitoring Network (GCRMN) 149 IUCN. Yemen Arab republic marine conservation strategy: the distribution of habitats and species along the Yemen Arab Republic Coastline. IUCN, Gland and PERSGA, Jeddah, 1987. 150 UNDP/GEF, Biodiversity conservation and sustainable development programme. Socotra Archipelago, Republic of Yemen. UK: MacAllister Elliott and Partners Ltd., 1996. 151 W. Gladstone, N. Tawfq, D. Nasr. Andersen, C. Cheung, H. Drammeh, F. Krupp, S. Lintner Sustainable use of renewable resources and conservation in the Red Sea and Gulf of Aden: issues, needs and strategic actions. Ocean & Coastal Management. 42. (1999) 671-697
34
most important. 152 Marine turtles form a prominent part of the fauna of the Red Sea, all the four pan tropical species were recorded from the coastline of Egypt: Hawksbill turtle Eremochelys imbricata, Green turtle, Chelonia mydas, Leather back, Adenturtle Dermochelys coriacea, and Logger headturtle, Caretta caretta.153
Assessment of Marine Turtle populations is very difficult. Moderate population levels appear to persist around the Torres Straits islands, in the Red Sea and Gulf of Aden. The Marine and Environmental Protection Agency study in Saudi Arabia estimated the Red Sea population of both species at only around 3,500 individuals.154
The hawksbill is evidently the most abundant of the Red Sea turtles, with records from every country but Jordan. 155 Nesting is also widely reported but most commonly from islands. The Dehlak Archipelago, in Eritrea, was found to have nesting. The Sudan's Suakin Archipelago may have some of the most concentrated nesting anywhere. Nesting along the Egyptian coast from RAS Banas to islands at the mouths of the Gulfs of Suez and Aqaba, such as Gubal el Kebir and Tiran Nesting spoor, probably of this species, has been seen on islands along the coast of Saudi Arabia, and there is likely to be nesting on Yemeni islands, for the species is common there each year.
Important nesting grounds located in the Tiran Islands, Wajh Bank, and Farasan Islands (Saudi Arabia); the south Sinai (Egypt); DahlakIsland s (Eritrea); Ras Sharma and Dhobah (Yemen).156,157,158 The Ras Sharma nesting site for green turtles is internationally significant with about 10,000 females nesting there each year.159 Four species of turtle nest along Egypt's coast: green, loggerhead, hawksbill and leatherback; turtles, particularly greens and hawksbills, are frequently seen by divers foraging on reefs.160
152 IUCN European Union. Somali Natural Resources Management Programme Preliminary Ecological Assessment of the Saad ed Din Islands
153 http://www.redsealive.com/diver/environment.htm 154Essam Al-Ghalib. Litter & Lines Kill Rare Turtle., Arab News. JEDDAH, 28 April 2004 155 UNEP. Regional Seas. Red Sea and Gulf of Aden. 156 PERSGA/GEF. Strategic action programme for the Red Sea, Gulf of Aden. Main report. Washington, DC: The World Bank; 1998. 157 Miller JD. An assessment of the conservation status of marine turtles in Saudi Arabia, vol. 1. MEPA coastal and marine management series report No. 9. Jeddah: MEPA; 1989. 158 PERSGA/GEF. Strategic action programme (SAP) for the Red Sea and Gulf of Aden: country reports. Jeddah: PERSGA; 2001. 159 William Gladstone, Fareed Krupp, Mohammed Younis.(2003). Development and management of a networkof marine protected areas in the Red Sea and Gulf of Aden region. Ocean & Coastal Management 46 (2003) 741–761 160 Red Sea Coast. Ecosystem. http://www.egyptvoyager.com/redsea_formation_ecosystem.htm
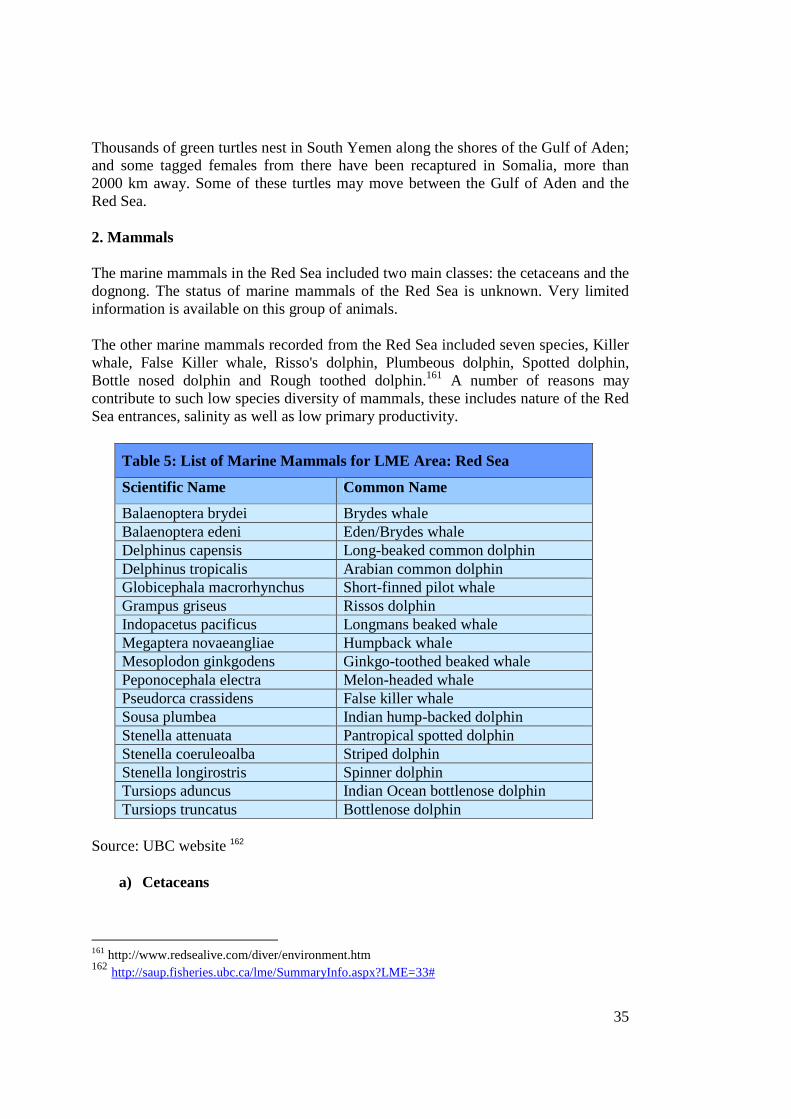
35
Thousands of green turtles nest in South Yemen along the shores of the Gulf of Aden; and some tagged females from there have been recaptured in Somalia, more than 2000 km away. Some of these turtles may move between the Gulf of Aden and the Red Sea.
2. Mammals
The marine mammals in the Red Sea included two main classes: the cetaceans and the dognong. The status of marine mammals of the Red Sea is unknown. Very limited information is available on this group of animals.
The other marine mammals recorded from the Red Sea included seven species, Killer whale, False Killer whale, Risso's dolphin, Plumbeous dolphin, Spotted dolphin, Bottle nosed dolphin and Rough toothed dolphin.161 A number of reasons may contribute to such low species diversity of mammals, these includes nature of the Red Sea entrances, salinity as well as low primary productivity.
Table 5: List of Marine Mammals for LME Area: Red Sea
Scientific Name Common Name
Balaenoptera brydei Brydes whale Balaenoptera edeni Eden/Brydes whale Delphinus capensis Long-beaked common dolphin Delphinus tropicalis Arabian common dolphin Globicephala macrorhynchus Short-finned pilot whale Grampus griseus Rissos dolphin Indopacetus pacificus Longmans beaked whale Megaptera novaeangliae Humpback whale Mesoplodon ginkgodens Ginkgo-toothed beaked whale Peponocephala electra Melon-headed whale Pseudorca crassidens False killer whale Sousa plumbea Indian hump-backed dolphin Stenella attenuata Pantropical spotted dolphin Stenella coeruleoalba Striped dolphin Stenella longirostris Spinner dolphin Tursiops aduncus Indian Ocean bottlenose dolphin Tursiops truncatus Bottlenose dolphin
Source: UBC website 162
a) Cetaceans
161 http://www.redsealive.com/diver/environment.htm 162 http://saup.fisheries.ubc.ca/lme/SummaryInfo.aspx?LME=33#
36
Thirteen species of cetaceans (whales and dolphins) have been reported from the Red Sea and Gulf of Aden, including dolphins, toothed and baleen whales. There have been few systematic surveys, making the identification of significant sites for cetaceans difficult.163 The species of cetaceans in the Red Sea including the rough-toothed dolphin, spinner dolphin, striped dolphin and common dolphin, the hump-backed dolphin, the bottlenose dolphin, and the Risso's dolphin.164
b) Dugongs
The only sea-cow occurring in the Red Sea and Gulf of Aden region is the dugong, Dugong dugon. It is a quiet, harmless animal found in sheltered, isolated, shallow bays and lagoons with seagrass beds on which it feeds. Dugong distribution in the Red Sea is not continuous; populations are found in isolated channels and bays. They are rare but occasionally reported from the Gulf of Aqaba, scarce in the Gulf of Suez, reported regularly but are not common in the Sudanese Red Sea, and are very rare along the Eritrean coast. 165 There are likely to be 4000 dugong (Dugong dugong) within the Red Sea and important areas for dugong within the Red Sea include the Tiran Islands, Wajh Bank, Farasan Islands, Jizan (Saudi Arabia); Quesir (Egypt); and the Dahlac Archipelago (Eritrea).166, 167
It seems that dugongs are no longer hunted systematically in the region, but are frequently taken as by-catch in trawls and nets.168 3. Sea Birds Population (resident & migratory) in the region
Information available on seabirds for this region is limited, with the majority of studies carried out on the last twenty years ago. PERSGA (2003) indicated that there are 17 true seabird species and 14 other water bird species. Among these birds the Jouanin’s petrel and swift tern have the smallest sub-populations. The white-eyed gull, endemic to the Red Sea and Gulf of Aden, has large populations on the northern
163 Gladstone W, Fisher PR. Status and ecology of cetaceans in the Farasan Islands marine protected area (Red Sea). Fauna of Arabia 2000;18:385–96. 164 http://whale.wheelock.edu/archives/ask99/0061.html 165 Al -Sambouk, ( PERSGA Newsletter ) No. 10, October 1999, page 12. http://www.unep.ch/seas/main/persga/samb10.pdf 166 Sheppard C, Price A, Roberts C.(1992) Marine ecology of the Arabian region: patterns and processes in extreme tropical environments. London: Academic Press; 1992. 167 Preen A.The status and conservation of dugongs in the Arabian region, vol. 1. MEPA coastal and marine management series report no. 10. Jeddah: MEPA; 1989. 168 W. Gladstone, N. Tawfq, D. Nasr. Andersen, C. Cheung, H. Drammeh, F. Krupp, S. Lintner Sustainable use of renewable resources and conservation in the Red Sea and Gulf of Aden: issues, needs and strategic actions. Ocean & Coastal Management. 42. (1999) 671-697
37
Egyptian Red Sea islands unlike the sooty gull and spoonbill that are apparently abundant in the southern Red Sea.169
The Coastal wetlands, the shallow waters adjacent to reefs and islands, and the numerous islands throughout the Red Sea and Gulf of Aden region provide ideal habitat for a large number of seabirds. Some of the important resident species include the Lesser Flamingoes (Phoenicopterus minor) and the Yellow–vented Bulbul (Pycnonotus xanthopygos), while the important wintering species include the Greater Spotted Eagle (Aquila clanga), White–eyed Gull (Larus leucophthalmus) and the Greater and Lesser Sand Plover (Charadrius leschenault, C. mongolus). The Red Sea is a flyway for many species of birds which seasonally migrate between Europe and Africa, and the islands of the southern Red Sea, in particular the Farasan Islands, are utilized by many hundreds of thousands of birds in the spring and autumn migrations. Here there are internationally important populations of Saunders’ Little Tern (Sterna saundersi), Bridled Tern (Sterna anaethetus) and the resident Egyptian Vulture (Neophron percnopterus).170
Arabian Gulf and Red Sea coastline support internationally important concentration of sea birds. Particularly, the Socotra Cormorant Phalacrocorax nigrogularis, Lesser crested tern Sterna bengalensis and Bridled tern S. anaethetus in the gulf, and the brown booby Sula leucogaster, Pink-backed pelican Pelecanus rufescens, sooty gull Larus hempricii, white-eyed gull L. leucophthalmus, and Crab plover Dromas ardeola in the Red Sea.171
The Northern Egyptian Red Sea supports a number of bird species either rare or found nowhere else in the Western Palearctic and is thus an area of ornithological importance. The islands near Hurghada at the Gulf of Suez mouth support significant breeding seabird populations and are stopover points for migrants in spring and autumn. Several species e.g. Brown Booby Sula leucogaster, Swift Tern Sterna bergii and Striated Heron Butorides striatus breed nowhere else in the Western Palearctic, whilst White-eyed Gull Larus leucophthalmus is endemic to the Red Sea, the breeding population of this region representing an important percentage of the world population (Cramp & Simmons 1983).172
The Red Sea support internationally important concentration of sea birds. Particularly, the brown booby Sula leucogaster, Pink-backed pelican Pelecanus rufescens, sooty gull Larus hempricii, white-eyed gull L. leucophthalmus, and Crab plover Dromas ardeola .173
169 PERSGA. (2003) Status of Breeding Seabirds in the Red Sea and Gulf of Aden 170 http://www.persga.org/RedSea/RSGA/RSGA.asp 171 172 Cramp, S. And Simmons, K. E. L. (eds.) (1983) The birds of the Western Palearctic Vol 3. Oxford University Press. 173 Birdlife- Saudi Arabia. http://www.birdlifemed.org/Contries/saudi/saudi.html
38
Seabirds in the Red Sea are threatened by hunting, disturbance at their breeding sites and habitat destruction. During the breeding season, egg collecting occurs wherever there are fishermen.174
PERSGA (2003) indicated that following points need immediate attention for the development and implementation of seabird conservation strategies in the region: lack of accurate and available information, lack of institutional effectiveness in conservation, lack of funds to support seabird research and conservation, lack of capacity regarding regional expertise, lack of research on seabird conservation and lack of awareness of the importance of seabird conservation.175 4. Fishes Information regarding the fish communities of the Red Sea is also limited. About 1200 species of fishes are known to occur in the Red Sea (Ormond & Edwards 1987).176 The majority of these inhabit coral reefs where they constitute a dominant component of the fish fauna. There are marked differences among the different regions of the Red Sea in fish species richness, assemblage compositions and species’ abundance (Sheppard et al 1992).177 Shore fish community structure off the Jordanian Red Sea coast was determined on fringing coral reefs and in a seagrass-dominated bay at 6 m and 12 m depths. A total of 198 fish species belonging to 121 genera and 43 families was recorded. Labridae and Pomacentridae dominated the ichthyofauna in terms of species richness and Pomacentridae were most abundant. Neither diversity nor species richness was correlated to depth. The abundance of fishes was higher at the deep reef slope, due to schooling planktivorous fishes. At 12 m depth abundance of fishes at the seagrass-dominated site was higher than on the coral reefs. Multivariate analysis demonstrated a strong influence on the fish assemblages by depth and benthic habitat. Fish species richness was positively correlated with hard substrate cover and habitat diversity. Abundance of corallivores was positively linked with live hard coral cover.178
174 Gladstone W, Fisher PR. Status and ecology of cetaceans in the Farasan Islands marine protected area (Red Sea). Fauna of Arabia 2000;18:385–96. 175 PERSGA. (2003) Status of Breeding Seabirds in the Red Sea and Gulf of Aden. 176 Ormond RFG, Edwards A (1987) Red Sea fishes. In: Edwards AJ, Head SM (eds), Red Sea. Pergamon Press, Oxford, p 252-287. 177 Shepperd C, Price A, Roberts C (1992) Marine ecology of the Arabian region: Patterns and processes in the extreme tropical environments. Academic Press, Cambridge. 178 Maroof A. Khalaf, Marc Kochzius(2001) Community structure and biogeography of shore fishes in the Gulf of Aqaba, Red Sea. Helgoland Marine Research , Volume 55, Number 4, January 2001. Pages: 252 - 284
39
The unique value of the biological resources of the Red Sea and Gulf of Aden to the prosperity of the region has long been recognised, particularly among the coastal populations. The local fisheries have provided food and employment for hundreds, nay thousands, of years especially in the Gulf of Aden where nutrient-rich cold water rises during the monsoon periods providing ideal conditions for the growth of plankton and subsequently their predators, the fish. The Gulf of Aden is considered a fish-rich area and is underexploited, the fisheries consisting of mostly small pelagics (sardines and anchovy) and several high-value demersal species. Crustaceans resources and cephalopods are also available and could withstand further exploitation. The unexploited resource of mesopelagic fish in the Gulf of Aden as well as in the Gulf of Oman, estimated to be not less than 1.5 - 2 MT, is another resource which offers potential. The southern part of Red Sea waters bordering Somalia, is considered rich in small pelagics (sardines) as well as a good resources of demersal species, tunas and crustaceans.179 In the Red Sea, Roberts et al (1992),180 Righton et al (1996),181 and Righton et al (1998)182 observed regional differences in the distribution of butterflyfishes. Roberts et al (1992) 183conducted a detailed investigation on the large-scale distribution of chaetodontids. They grouped the species into four categories:
• Endemic to the Red Sea: found in the northern and central Red Sea only (Chaetodon austriacus and C. paucifasciatus)
• Endemic to the Red Sea region also occurring in the Gulf of Aden and sometimesin the Arabian Gulf (C. larvatus, C. fasciatus, C. semilarvatus, C. mesoleucos,and Heniochus intermedius)
• Present in the Gulf of Aden but not in the Red Sea (C. melapterus and C.vagabundus).
• Occurring throughout the Indian Ocean and the whole (or major parts) of the Red Sea (C. auriga, C. lineolatus, C. melannotus, C. trifascialis, and H. diphreutes).
179 Izzat H. Feidi. Fisheries Development in the Arab World. Middle Eastern natural Environments Food and Agriculture Organization of the United Nations (FAO). Rome, Italy 180 Roberts CM, Shepherd ARD, Ormond RFG (1992) Large-scale variation in assemblage structure of Red Sea butterflyfishes and angelfishes. J.Biogeogr., 19:239-250. 181 Righton D, Kemp J, Ormond R (1996) Biogeography, community structure and diversity of Red Sea and western Indian Ocean butterflyfishes. J. Mar. Biol. Ass. U.K., 76:223-228. 182 Righton D, Miller M, Ormond R (1998) Correlates of territory size in the butterflyfish Chaetodon austriacus (Rueppell). J. Exp. Mar. Biol. Ecol., 226:183-193. 183 Roberts CM, Shepherd ARD, Ormond RFG (1992) Large-scale variation in assemblage structure of Red Sea butterflyfishes and angelfishes. J.Biogeogr., 19:239-250.
40
Zakaria A. Zakaria (2003) indicated that six species of butterflyfishes , C. lineolatus, C. fasciatus, H. intermedius, C. larvatus, C. semilarvatus, and C. mesoleucos, are widely distributed in the Red Sea and in the Western Gulf of Aden. The last five species are endemic to the Red Sea and the Gulf of Aden but C. lineolatus occurs in the Red Sea and in the whole Western Indian Ocean .184 The butterflyfish assemblage in the southern Red Sea differs from that in the north (Righton et al 1996).185 Chaetodon austriacus and C. paucifasciatus dominate the northern reefs and are absent in the south. C. larvatus, the most dominant chaetodontid inthe south, has a very low density in the north (Roberts et al 1992).186 The most valuable fish resources (rock lobster, cuttlefish, shrimp, and demersal fish) in Yemen with a potential sustainable yield valued at about $95 million annually are dangerously over-exploited. The growth of the industrial fleet as led to declines in fish-stocks and large unofficial fish exports, critically undermining the viability of a major segment of the small-scale fishing fleet.187 In Yemen, the main exports of the fisheries sector include the crustacean shrimps from the Red Sea, mainly Penaeus semisulcatus and P. indicus, and from the Gulf of Aden the rock lobsters Panulirus homarus and P. versiclour, and the deep sea lobster Periulus semelli. Among the molluscs, the main export was the cuttlefish Sepia pharaonis from the Gulf of Aden and dried sea cucumber from mainly the western part of the Gulf of Aden and the northern part of the Yemeni Red Sea waters.188
Productivity of the shelf adjacent to Tuwwal along the Saudi coast was estimated to be about 0.38 and 0.41 t/sq km in 1982 and 1983 respectively. Many shallow water species (typically found between depths of 10 and 50 m) occur closer to the surface in the Gulf of Aqaba than further south in the Red Sea. For example, the butterfly fish Chaelodon paucifasciatus is usually found deeper than 15 m in the central Red Sea, but occurs right up to the surface in the Gulf of Aqaba. The fishing industry in Aqaba is small and artisanal, consisting in 1995 of approximately 85 fishermen and 40 boats.
184 Zekeria Abdulkerim Zekeria(2003). Butterflyfishes of the Southern Red Sea: Ecology and Population Dynamics. Chapter 1 General Introduction and Outline of the Thesis Rijksuniversiteit Groningen. Netherlands. 185 Righton D, Miller M, Ormond R (1998) Correlates of territory size in the butterflyfish Chaetodon austriacus (Rueppell). J. Exp. Mar. Biol. Ecol., 226:183-193. 186 Roberts CM, Shepherd ARD, Ormond RFG (1992) Large-scale variation in assemblage structure of Red Sea butterflyfishes and angelfishes. J.Biogeogr., 19:239-250. 187 The World Bank (1999). Republic Of Yemen fisheries Sector Strategy Note 188 UNEP (1997). Assessment of Land-based Sources and Activities Affecting the Marine Environment in the Red Sea and Gulf of Aden. UNEP Regional Seas Reports and Studies No. 166 .
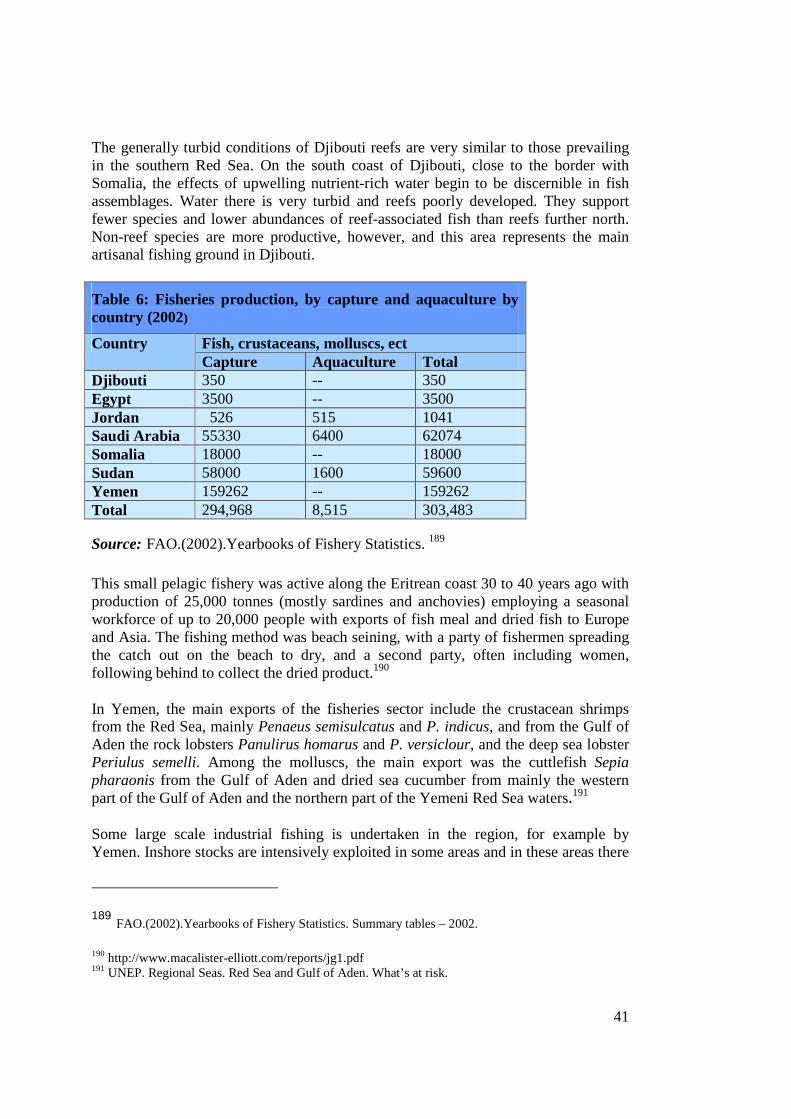
41
The generally turbid conditions of Djibouti reefs are very similar to those prevailing in the southern Red Sea. On the south coast of Djibouti, close to the border with Somalia, the effects of upwelling nutrient-rich water begin to be discernible in fish assemblages. Water there is very turbid and reefs poorly developed. They support fewer species and lower abundances of reef-associated fish than reefs further north. Non-reef species are more productive, however, and this area represents the main artisanal fishing ground in Djibouti.
Table 6: Fisheries production, by capture and aquaculture by country (2002)
Fish, crustaceans, molluscs, ect Country Capture Aquaculture Total
Djibouti 350 -- 350 Egypt 3500 -- 3500 Jordan 526 515 1041 Saudi Arabia 55330 6400 62074 Somalia 18000 -- 18000 Sudan 58000 1600 59600 Yemen 159262 -- 159262 Total 294,968 8,515 303,483
Source: FAO.(2002).Yearbooks of Fishery Statistics. 189
This small pelagic fishery was active along the Eritrean coast 30 to 40 years ago with production of 25,000 tonnes (mostly sardines and anchovies) employing a seasonal workforce of up to 20,000 people with exports of fish meal and dried fish to Europe and Asia. The fishing method was beach seining, with a party of fishermen spreading the catch out on the beach to dry, and a second party, often including women, following behind to collect the dried product.190
In Yemen, the main exports of the fisheries sector include the crustacean shrimps from the Red Sea, mainly Penaeus semisulcatus and P. indicus, and from the Gulf of Aden the rock lobsters Panulirus homarus and P. versiclour, and the deep sea lobster Periulus semelli. Among the molluscs, the main export was the cuttlefish Sepia pharaonis from the Gulf of Aden and dried sea cucumber from mainly the western part of the Gulf of Aden and the northern part of the Yemeni Red Sea waters.191
Some large scale industrial fishing is undertaken in the region, for example by Yemen. Inshore stocks are intensively exploited in some areas and in these areas there
189 FAO.(2002).Yearbooks of Fishery Statistics. Summary tables – 2002.
190 http://www.macalister-elliott.com/reports/jg1.pdf 191 UNEP. Regional Seas. Red Sea and Gulf of Aden. What’s at risk.
42
is believed to be little room for expansion. Extensive areas of upwelling in the Gulf of Aden have given rise to a high biomass of small pelagics and mesopelagic species, which are currently very little exploited compared with potential yields. Mesopelagic stock is described in more detail under the South Asian Seas.192 In the Gulf of Aden, large industrial fisheries using 'distant water' factory trawlers based in the area have exploited demersal and small pelagic fish resources in the past, but because of lack of profitability have not been functioning for some time. The situation in Somalia remains confused with informal reports of many small fishing companies starting operations and also high levels of illegal fishing, particularly outside of the Gulf of Aden. 193
Several coastal states in the region have had regionally important shrimp fisheries, particularly Saudi Arabia and the Yemen and, to a lesser extent, Eritrea.194 The shrimps are mainly caught by the artisanal fishery by using small nets like trawls, which are pulling by small boat (8-10m long). 195 Two commercial species of lobsters inhabit Yemen waters the rock lobsters Panulirus hamarus and the deep sea Puerulus sewelli. The total catch of rock lobster for 2000 year was 200 t, traditional fishermen catch rock lobster using traps. The main lobster regions are Almahra and Hadramout government (East of Yemen). The deep sea lobster was caught by industrial fishery for the period 1975-1989 in the offshore sea in depth between 300-700 m.196 Shark fisheries are very vulnerable to stock collapse from overfishing, especially in Sudan, Djibouti, Yemen Socotra Archipelago and Somalia.197 The traditional artisanal fishery in the Region catches only small numbers of sharks and the whole animal is utilized. However, there is a large–scale illegal fishery for the East Asian shark fin market involving fishermen working outside their normal territorial boundaries. Sharks are caught by lines and also by nets which damage the coral reefs. The fins are removed, often while the shark is still alive, and the body is thrown back into the sea
192 http://www.unep-wcmc.org/resources/publications/4_diversity_of_seas/1.doc
193 FAO. (1997). Review Of The State Of World Fishery Resources: Marine Fisheries. Western Indian Ocean. Marine Resources Service, Fishery Resources Division,Fisheries Department, FAO, Rome, Italy. 1997
194 FAO (1997). Fisheries Circular No. 920 FIRM/C920. Review Of The State Of World Fishery Resources: Marine Fisheries . Western Indian Ocean. Rome, 1997 195 FIGIS Country Profile Fact Sheet. Yemen. http://www.fao.org/figis/servlet/static?dom=country&xml=fims_ye.xml#N00961630009C7468 196 FIGIS Country Profile Fact Sheet. Yemen. http://www.fao.org/figis/servlet/static?dom=country&xml=fims_ye.xml#N00961630009C7468 197 PERSGA. (2003). Status of the Living Marine Resources in the Red Sea and Gulf of Aden and Their Management.
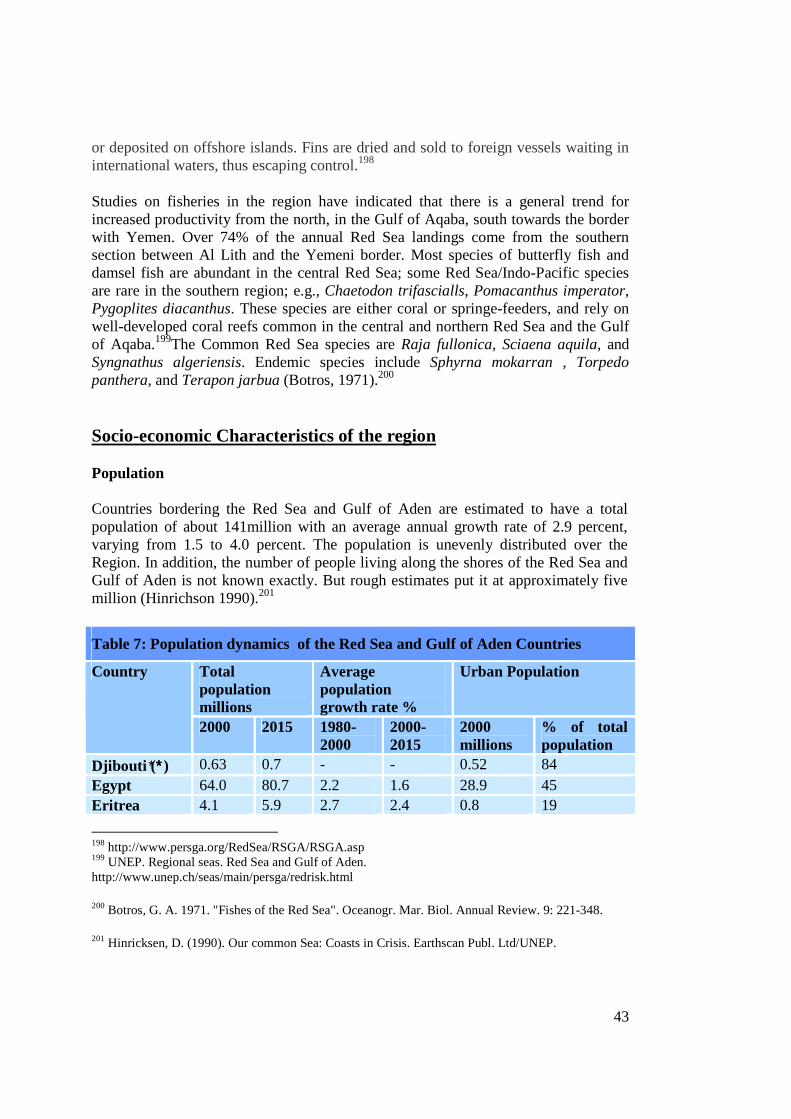
43
or deposited on offshore islands. Fins are dried and sold to foreign vessels waiting in international waters, thus escaping control.198
Studies on fisheries in the region have indicated that there is a general trend for increased productivity from the north, in the Gulf of Aqaba, south towards the border with Yemen. Over 74% of the annual Red Sea landings come from the southern section between Al Lith and the Yemeni border. Most species of butterfly fish and damsel fish are abundant in the central Red Sea; some Red Sea/Indo-Pacific species are rare in the southern region; e.g., Chaetodon trifascialls, Pomacanthus imperator, Pygoplites diacanthus. These species are either coral or springe-feeders, and rely on well-developed coral reefs common in the central and northern Red Sea and the Gulf of Aqaba.199The Common Red Sea species are Raja fullonica, Sciaena aquila, and Syngnathus algeriensis. Endemic species include Sphyrna mokarran , Torpedo panthera, and Terapon jarbua (Botros, 1971).200
Socio-economic Characteristics of the region
Population
Countries bordering the Red Sea and Gulf of Aden are estimated to have a total population of about 141million with an average annual growth rate of 2.9 percent, varying from 1.5 to 4.0 percent. The population is unevenly distributed over the Region. In addition, the number of people living along the shores of the Red Sea and Gulf of Aden is not known exactly. But rough estimates put it at approximately five million (Hinrichson 1990).201
Table 7: Population dynamics of the Red Sea and Gulf of Aden Countries
Total population millions
Average population growth rate %
Urban Population Country
2000 2015 1980-2000
2000-2015
2000 millions
% of total population
Djibouti ( ∗∗∗∗) 0.63 0.7 - - 0.52 84 Egypt 64.0 80.7 2.2 1.6 28.9 45 Eritrea 4.1 5.9 2.7 2.4 0.8 19
198 http://www.persga.org/RedSea/RSGA/RSGA.asp 199 UNEP. Regional seas. Red Sea and Gulf of Aden. http://www.unep.ch/seas/main/persga/redrisk.html
200 Botros, G. A. 1971. "Fishes of the Red Sea". Oceanogr. Mar. Biol. Annual Review. 9: 221-348.
201 Hinricksen, D. (1990). Our common Sea: Coasts in Crisis. Earthscan Publ. Ltd/UNEP.
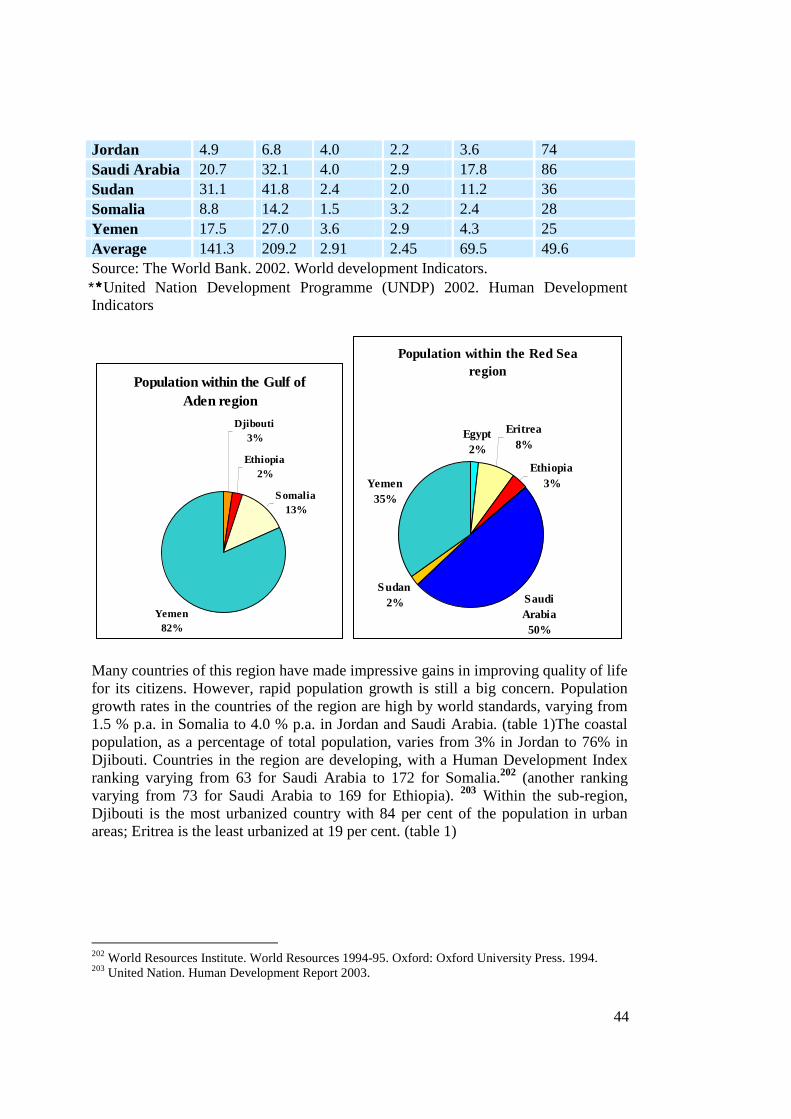
44
Jordan 4.9 6.8 4.0 2.2 3.6 74 Saudi Arabia 20.7 32.1 4.0 2.9 17.8 86 Sudan 31.1 41.8 2.4 2.0 11.2 36 Somalia 8.8 14.2 1.5 3.2 2.4 28 Yemen 17.5 27.0 3.6 2.9 4.3 25 Average 141.3 209.2 2.91 2.45 69.5 49.6 Source: The World Bank. 2002. World development Indicators. ∗∗∗∗United Nation Development Programme (UNDP) 2002. Human Development Indicators
Population within the Gulf of Aden region
Djibouti3%
Ethiopia2%
Somalia13%
Yemen82%
Population within the Red Sea region
Egypt2%
Eritrea8%
Ethiopia3%
Saudi Arabia50%
Sudan2%
Yemen35%
Many countries of this region have made impressive gains in improving quality of life for its citizens. However, rapid population growth is still a big concern. Population growth rates in the countries of the region are high by world standards, varying from 1.5 % p.a. in Somalia to 4.0 % p.a. in Jordan and Saudi Arabia. (table 1)The coastal population, as a percentage of total population, varies from 3% in Jordan to 76% in Djibouti. Countries in the region are developing, with a Human Development Index ranking varying from 63 for Saudi Arabia to 172 for Somalia.202 (another ranking varying from 73 for Saudi Arabia to 169 for Ethiopia). 203 Within the sub-region, Djibouti is the most urbanized country with 84 per cent of the population in urban areas; Eritrea is the least urbanized at 19 per cent. (table 1)
202 World Resources Institute. World Resources 1994-95. Oxford: Oxford University Press. 1994. 203 United Nation. Human Development Report 2003.
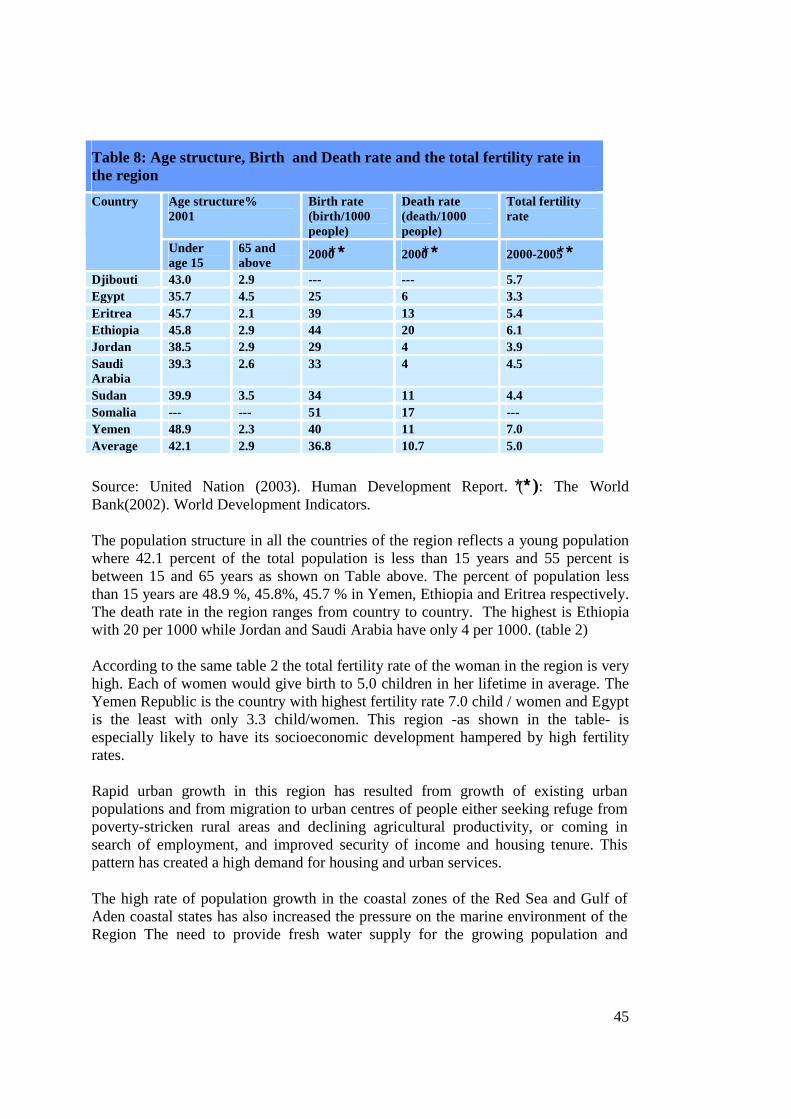
45
Table 8: Age structure, Birth and Death rate and the total fertility rate in the region
Age structure% 2001
Birth rate (birth/1000 people)
Death rate (death/1000 people)
Total fertility rate
Country
Under age 15
65 and above
2000 ∗∗∗∗ 2000 ∗∗∗∗ 2000-2005 ∗∗∗∗
Djibouti 43.0 2.9 --- --- 5.7 Egypt 35.7 4.5 25 6 3.3 Eritrea 45.7 2.1 39 13 5.4 Ethiopia 45.8 2.9 44 20 6.1 Jordan 38.5 2.9 29 4 3.9 Saudi Arabia
39.3 2.6 33 4 4.5
Sudan 39.9 3.5 34 11 4.4 Somalia --- --- 51 17 --- Yemen 48.9 2.3 40 11 7.0 Average 42.1 2.9 36.8 10.7 5.0
Source: United Nation (2003). Human Development Report. (∗∗∗∗): The World Bank(2002). World Development Indicators.
The population structure in all the countries of the region reflects a young population where 42.1 percent of the total population is less than 15 years and 55 percent is between 15 and 65 years as shown on Table above. The percent of population less than 15 years are 48.9 %, 45.8%, 45.7 % in Yemen, Ethiopia and Eritrea respectively. The death rate in the region ranges from country to country. The highest is Ethiopia with 20 per 1000 while Jordan and Saudi Arabia have only 4 per 1000. (table 2)
According to the same table 2 the total fertility rate of the woman in the region is very high. Each of women would give birth to 5.0 children in her lifetime in average. The Yemen Republic is the country with highest fertility rate 7.0 child / women and Egypt is the least with only 3.3 child/women. This region -as shown in the table- is especially likely to have its socioeconomic development hampered by high fertility rates.
Rapid urban growth in this region has resulted from growth of existing urban populations and from migration to urban centres of people either seeking refuge from poverty-stricken rural areas and declining agricultural productivity, or coming in search of employment, and improved security of income and housing tenure. This pattern has created a high demand for housing and urban services.
The high rate of population growth in the coastal zones of the Red Sea and Gulf of Aden coastal states has also increased the pressure on the marine environment of the Region The need to provide fresh water supply for the growing population and
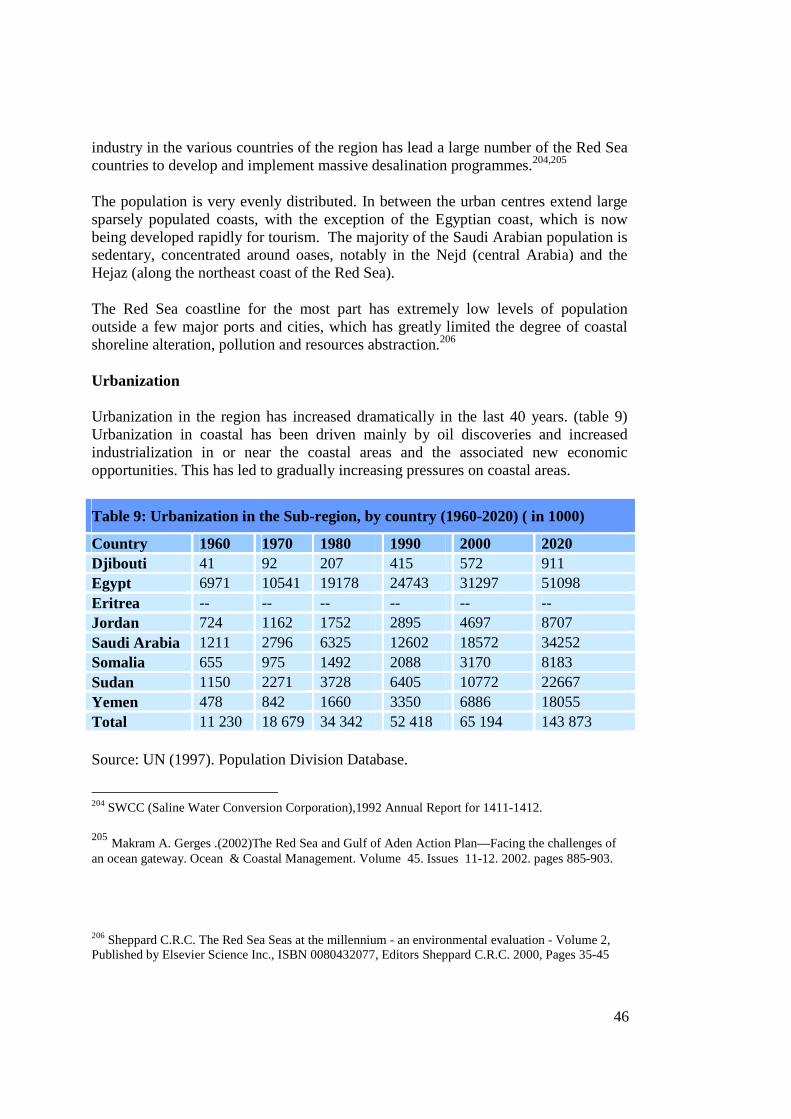
46
industry in the various countries of the region has lead a large number of the Red Sea countries to develop and implement massive desalination programmes.204,205
The population is very evenly distributed. In between the urban centres extend large sparsely populated coasts, with the exception of the Egyptian coast, which is now being developed rapidly for tourism. The majority of the Saudi Arabian population is sedentary, concentrated around oases, notably in the Nejd (central Arabia) and the Hejaz (along the northeast coast of the Red Sea).
The Red Sea coastline for the most part has extremely low levels of population outside a few major ports and cities, which has greatly limited the degree of coastal shoreline alteration, pollution and resources abstraction.206
Urbanization
Urbanization in the region has increased dramatically in the last 40 years. (table 9) Urbanization in coastal has been driven mainly by oil discoveries and increased industrialization in or near the coastal areas and the associated new economic opportunities. This has led to gradually increasing pressures on coastal areas.
Table 9: Urbanization in the Sub-region, by country (1960-2020) ( in 1000)
Country 1960 1970 1980 1990 2000 2020 Djibouti 41 92 207 415 572 911 Egypt 6971 10541 19178 24743 31297 51098 Eritrea -- -- -- -- -- -- Jordan 724 1162 1752 2895 4697 8707 Saudi Arabia 1211 2796 6325 12602 18572 34252 Somalia 655 975 1492 2088 3170 8183 Sudan 1150 2271 3728 6405 10772 22667 Yemen 478 842 1660 3350 6886 18055 Total 11 230 18 679 34 342 52 418 65 194 143 873
Source: UN (1997). Population Division Database.
204 SWCC (Saline Water Conversion Corporation),1992 Annual Report for 1411-1412.
205 Makram A. Gerges .(2002)The Red Sea and Gulf of Aden Action Plan—Facing the challenges of an ocean gateway. Ocean & Coastal Management. Volume 45. Issues 11-12. 2002. pages 885-903.
206 Sheppard C.R.C. The Red Sea Seas at the millennium - an environmental evaluation - Volume 2, Published by Elsevier Science Inc., ISBN 0080432077, Editors Sheppard C.R.C. 2000, Pages 35-45
47
In Saudi Arabia for example 20.4 percent of population live in towns and village larger than 2,400 people within the coastal zone207 for a total of 2.5million along the Red sea coast.208 One of the largest Red Sea coastal cities in Saudi Arabia is Jeddah with 2 million inhabitants.
More than 25 urban centres scattered exist along the coast of the Red Sea and they vary from a small town with limited harbour facilities to a very highly developed area such as Port Sudan, Jiddah, al-Hudaydah, Asseb, Aqaba, Suez, Hurgada and Sharm El-Sheikh. The principal harbors in the region are Jeddah in Saudi Arabia (the port for Mecca), Eilat in Israel on the Gulf of Aqaba, and Suez, Port Sudan, Massowa on the African coast and Aden in Yemen.
In Yemen Republic about 1,080,000 people live in major Red Sea and Gulf of Aden coastal settlements. Aden is the largest coastal city with 620,000 inhabitants; follow by al-Hudaydah with 160,000 and Al-Mukalla with over 50,000.While in Sudan Port Sudan is the largest coastal city with a population of about 308,000.209 In 1993, Djibouti had an estimated 557,000 inhabitants, 75 percent of whom live in the capital Djibouti, which situated on the Gulf of Aden.
The Jordanian Gulf of Aqaba coastline has been transformed by a variety of developments associated with economic growth. This economic growth has been accompanied by a parallel growth in its population. Since 1972, Aqaba has growth from a town of 10,000 to its current population of 65,000. The projected population in the year 2020 is 150,000.
Migration and urbanization have played an important role in the overall growth of the coastal region of the Red Sea and Gulf of Aden. Diversification of socioeconomic activities in the coastal cities has enhanced employment opportunities their, encouraging an unprecedented drift to the coast. For example, Jeddah grew from a small town of 1 square kilometers in area with less than 30,000 inhabitants at the beginning of the last century, to a metropolis covering an area of 560 square kilometers with a population exceeding 1.5 million and stretches for 80km north to south along its coastline 210. Unplanned settlements have negative impacts on the social and biophysical environment. In Balbala, for example an unplanned settlement of 240 000 residents in the city of Djibouti, accounted for the largest share of the city’s growth during the last decade. Population densities in these settlements are usually very high, which encourages the transmission of diseases such as parasites and respiratory diseases.211 207 Ministry of planning. 1995. Achievement of the development plans: 1972-1994 Min. planning press 208 World Resources institute. 1995. Data Base of World resources Institute. 209United Nations Statistics City Data: http://unstats.un.org/unsd/citydata/default.asp?contid=1&cid=736 210 Jeddah: growth of the glittering city. http://www.arab.net/saudi/sa_jeddahgrowth.htm 211UNEP.2002. Africa Environment Outlook Past, present and future perspectives
48
Economy
For the countries of the Red Sea and Gulf of Aden, two centuries of industrialization came all at once, when oil wealth brought both the benefits and problems of fast economic growth to one of the world's most fragile environments. Today oil is the fuel for development, but the promise for tomorrow is that onshore and offshore mineral mining will provide even more earnings.
Oil production is by far the most important industry in the some of the countries in the region, with the economy of almost all countries being oil-based. Oil and gas exploration, refining, petrochemicals industries, and oil transportation all affect the environment.
Saudi Arabia has the largest reserves of petroleum in the world (26% of the proved reserves), ranks as the largest exporter of petroleum, and plays a leading role in OPEC. The petroleum sector accounts for roughly 75% of budget revenues, 45% of GDP, and 90% of export earnings. About 25% of GDP comes from the private sector. Roughly 4 million foreign workers play an important role in the Saudi economy, for example, in the oil and service sectors.212Fossil fuels are still the main source of wealth in the Saudi Arabia. The countries of the region like (Eritrea, Ethiopia, Somalia and Sudan) are all among the economically poorest of the world. The four most economically disadvantaged states (Eritrea, Ethiopia, Somalia and Sudan) have a per capita GNP of only US$88 that is less than 1.2 percent of the oil exporters with small populations.213 Industry plays an increasing role in social and economic development in the region and also constitutes a major source of pollution in the region. Much of the industry is highly concentrated in few locations in most countries in the region and has led to areas of potentially severe industrial pollution of surface and ground-water bodies. Uncontrolled discharge of industrial effluents, undetected seepage of toxic substances into aquifers, and the unprotected dumping of hazardous wastes are increasing as rapidly as industry expands.
Per capita GDP in countries averaged US$ 1,751, with the lowest in Ethiopia (US$ 95) and the highest in the Saudi Arabia (US$ 8,711) (table). However, economic progress in some countries in the region during the past 30 years, coupled with increasing population pressures, has led to extensive degradation of the region's natural resources.
Table 10 : Gross national income and GDP per capita
Country Gross national
Gross national income per
GDP (US $
billions) 2001∗∗∗∗
GDP per capita
212 http://www.cia.gov/cia/publications/factbook/print/sa.html 213 Adel El-Beltagy West Asia and North Africa: A Regional Vision. Consultative Group on International Agricultural ResearchVolume 4, Number 2. April 1997
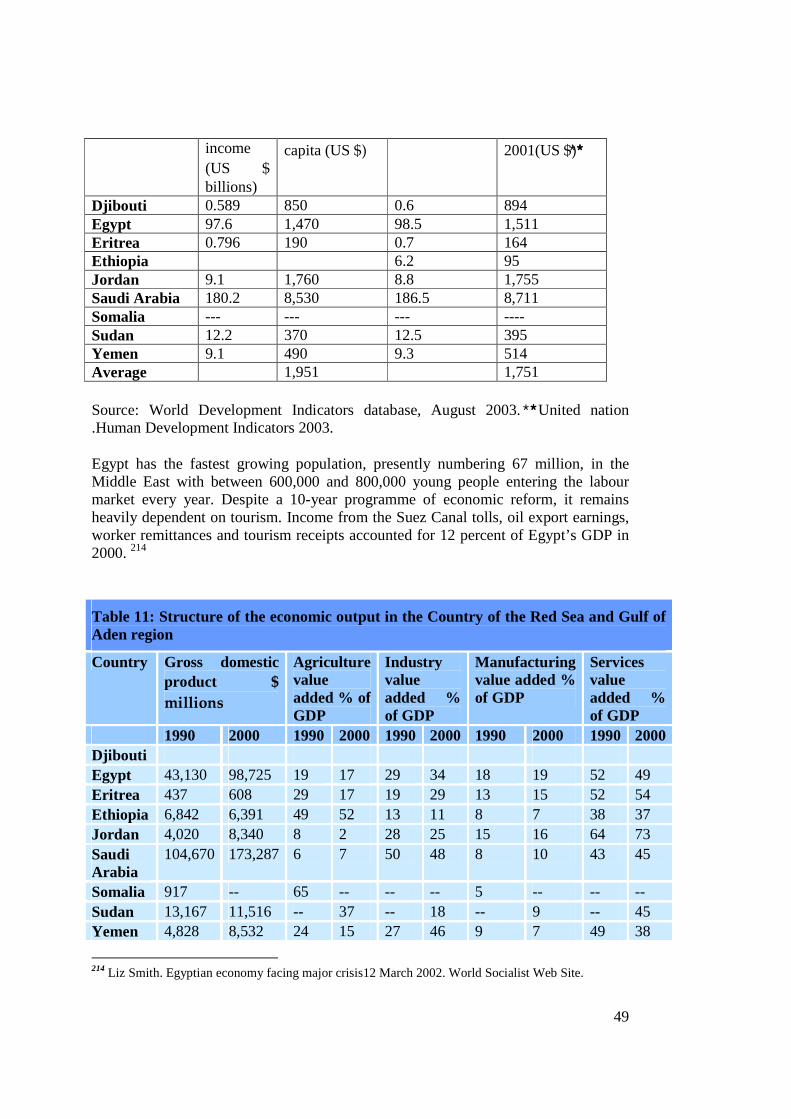
49
income (US $
billions)
capita (US $) 2001(US $)∗∗∗∗
Djibouti 0.589 850 0.6 894 Egypt 97.6 1,470 98.5 1,511 Eritrea 0.796 190 0.7 164 Ethiopia 6.2 95 Jordan 9.1 1,760 8.8 1,755 Saudi Arabia 180.2 8,530 186.5 8,711 Somalia --- --- --- ---- Sudan 12.2 370 12.5 395 Yemen 9.1 490 9.3 514 Average 1,951 1,751
Source: World Development Indicators database, August 2003. ∗∗∗∗United nation .Human Development Indicators 2003.
Egypt has the fastest growing population, presently numbering 67 million, in the Middle East with between 600,000 and 800,000 young people entering the labour market every year. Despite a 10-year programme of economic reform, it remains heavily dependent on tourism. Income from the Suez Canal tolls, oil export earnings, worker remittances and tourism receipts accounted for 12 percent of Egypt’s GDP in 2000. 214
Table 11: Structure of the economic output in the Country of the Red Sea and Gulf of Aden region
Country Gross domestic product $
millions
Agriculture value added % of GDP
Industry value added % of GDP
Manufacturing value added % of GDP
Services value added % of GDP
1990 2000 1990 2000 1990 2000 1990 2000 1990 2000 Djibouti Egypt 43,130 98,725 19 17 29 34 18 19 52 49 Eritrea 437 608 29 17 19 29 13 15 52 54 Ethiopia 6,842 6,391 49 52 13 11 8 7 38 37 Jordan 4,020 8,340 8 2 28 25 15 16 64 73 Saudi Arabia
104,670 173,287 6 7 50 48 8 10 43 45
Somalia 917 -- 65 -- -- -- 5 -- -- -- Sudan 13,167 11,516 -- 37 -- 18 -- 9 -- 45 Yemen 4,828 8,532 24 15 27 46 9 7 49 38
214 Liz Smith. Egyptian economy facing major crisis12 March 2002. World Socialist Web Site.
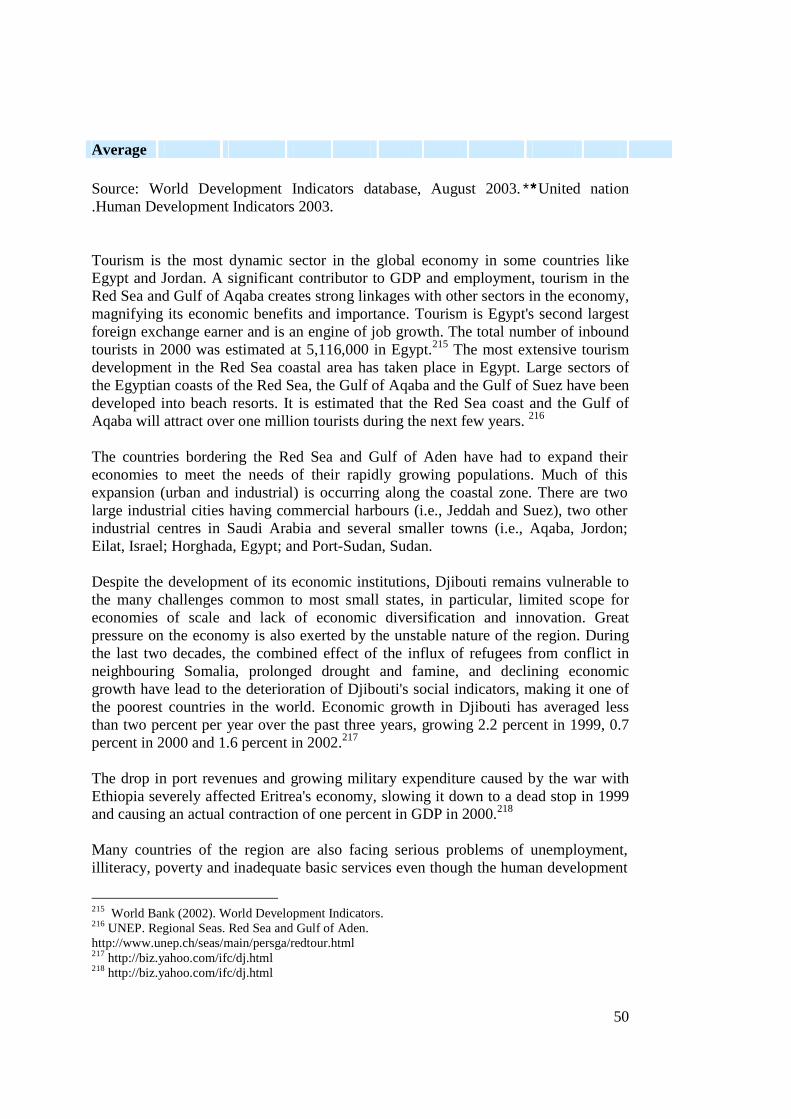
50
Average
Source: World Development Indicators database, August 2003. ∗∗∗∗United nation .Human Development Indicators 2003.
Tourism is the most dynamic sector in the global economy in some countries like Egypt and Jordan. A significant contributor to GDP and employment, tourism in the Red Sea and Gulf of Aqaba creates strong linkages with other sectors in the economy, magnifying its economic benefits and importance. Tourism is Egypt's second largest foreign exchange earner and is an engine of job growth. The total number of inbound tourists in 2000 was estimated at 5,116,000 in Egypt.215 The most extensive tourism development in the Red Sea coastal area has taken place in Egypt. Large sectors of the Egyptian coasts of the Red Sea, the Gulf of Aqaba and the Gulf of Suez have been developed into beach resorts. It is estimated that the Red Sea coast and the Gulf of Aqaba will attract over one million tourists during the next few years. 216 The countries bordering the Red Sea and Gulf of Aden have had to expand their economies to meet the needs of their rapidly growing populations. Much of this expansion (urban and industrial) is occurring along the coastal zone. There are two large industrial cities having commercial harbours (i.e., Jeddah and Suez), two other industrial centres in Saudi Arabia and several smaller towns (i.e., Aqaba, Jordon; Eilat, Israel; Horghada, Egypt; and Port-Sudan, Sudan. Despite the development of its economic institutions, Djibouti remains vulnerable to the many challenges common to most small states, in particular, limited scope for economies of scale and lack of economic diversification and innovation. Great pressure on the economy is also exerted by the unstable nature of the region. During the last two decades, the combined effect of the influx of refugees from conflict in neighbouring Somalia, prolonged drought and famine, and declining economic growth have lead to the deterioration of Djibouti's social indicators, making it one of the poorest countries in the world. Economic growth in Djibouti has averaged less than two percent per year over the past three years, growing 2.2 percent in 1999, 0.7 percent in 2000 and 1.6 percent in 2002.217 The drop in port revenues and growing military expenditure caused by the war with Ethiopia severely affected Eritrea's economy, slowing it down to a dead stop in 1999 and causing an actual contraction of one percent in GDP in 2000.218 Many countries of the region are also facing serious problems of unemployment, illiteracy, poverty and inadequate basic services even though the human development
215 World Bank (2002). World Development Indicators. 216 UNEP. Regional Seas. Red Sea and Gulf of Aden. http://www.unep.ch/seas/main/persga/redtour.html 217 http://biz.yahoo.com/ifc/dj.html 218 http://biz.yahoo.com/ifc/dj.html
51
index has risen, in some cases quite sharply, over the past three decades. Population living below 1 dollar a day (1990-2001) in Yemen was 15.7% while in Egypt was 3.1%.219 Although income poverty remains a severe problem in the region, human poverty affects a larger share of the population especially in Sudan, Yemen and the horn of Africa countries. Despite there is no official estimate of poverty in Yemen, the unofficial results from a 1998 government survey suggest that about 30% of the population is poor. 220The total unemployment in percent of total labour force in Egypt (1998-2000) was 8.2%.221 Absolute figures on the volume and shares of animal exports in the region are difficult to obtain. Different sources come up with different numbers. The estimates of the number of animals exported also vary considerably. Somaliland's (total; including also minor ports) livestock turnover for the year 1996 was 3.6 million heads and in 1997 more than 2.7 million heads were exported to Saudi Arabia and the Emirates. Somaliland's annual earnings from livestock are estimated over 200,000,000 dollars every year.222 Livestock, mainly cattle, goats, are an important contributor to the agricultural economy in many countries of the region. However, economic growth has lagged growth of population and urbanization, recording on average a positive trend in the 1990-2000 periods, although with wide differences between countries. Sudan, for example, reported an average annual GDP growth of 8.1 per cent in the period, where as Eritrea reported only 3.9 per cent 223(UNDP 2000). Negative economic growth has resulted in fewer funds being available for development and maintenance of infrastructure, in increased unemployment, and in people being less able to afford basic housing and services. Human activity in the region Agriculture Agriculture represented the most important sector in this region as it still mobilizes a very high percentage of the labour force. This percentage exceeds more than 50% in some countries, which are among the poorest: Eritrea (80%), Ethiopia (80%), Somalia (76%), Sudan (63%)and Yemen (63). In Egypt the agriculture sector mobilizes about (34%)224. The remaining countries (Jordan, Saudi Arabia), agriculture is currently a marginal sector (10% and 16 % respectively).225 Agriculture however meets an
219 United Nation. 2003. Human Development Report. 220 UNDP Poverty Report .Yemen Country Assessment.2000 221 World Bank. 2002. World development Indicators. 222 Joachim D. Ahrens (1998).Cessation of livestock exports severely affects the pastoralist economy of Somali Region. UNDP .(Mission: 31 March to 7 April 1998) 223 World Bank. 2002. World development Indicators. 224 Egypt general data of the country. http://www.library.uu.nl/wesp/populstat/Africa/egyptg.htm 225 FAO.2003. Livestock Dynamics in the Arabian Peninsula. A Regional Review of National Livestock Resources and International Livestock Trade
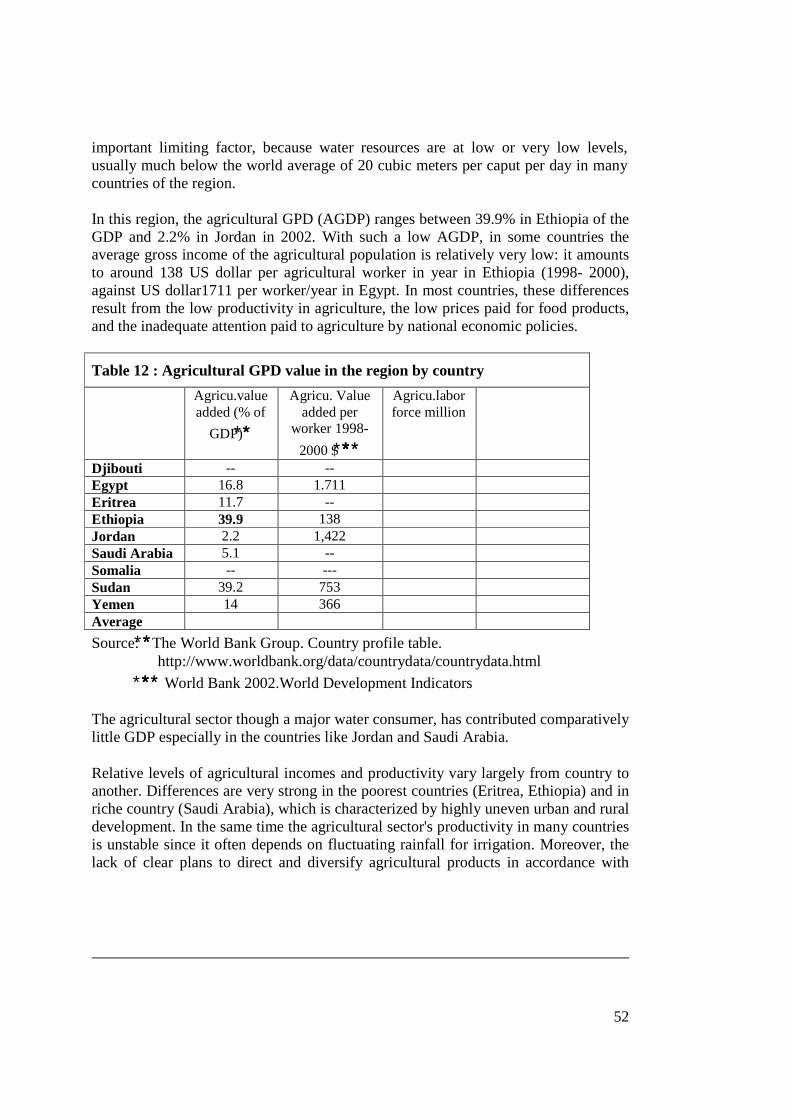
52
important limiting factor, because water resources are at low or very low levels, usually much below the world average of 20 cubic meters per caput per day in many countries of the region. In this region, the agricultural GPD (AGDP) ranges between 39.9% in Ethiopia of the GDP and 2.2% in Jordan in 2002. With such a low AGDP, in some countries the average gross income of the agricultural population is relatively very low: it amounts to around 138 US dollar per agricultural worker in year in Ethiopia (1998- 2000), against US dollar1711 per worker/year in Egypt. In most countries, these differences result from the low productivity in agriculture, the low prices paid for food products, and the inadequate attention paid to agriculture by national economic policies.
Table 12 : Agricultural GPD value in the region by country
Agricu.value added (% of
GDP)∗∗∗∗
Agricu. Value added per
worker 1998-
2000 $ ∗∗∗∗∗∗∗∗
Agricu.labor force million
Djibouti -- -- Egypt 16.8 1.711 Eritrea 11.7 -- Ethiopia 39.9 138 Jordan 2.2 1,422 Saudi Arabia 5.1 -- Somalia -- --- Sudan 39.2 753 Yemen 14 366 Average
Source: ∗∗∗∗The World Bank Group. Country profile table. http://www.worldbank.org/data/countrydata/countrydata.html
∗∗∗∗∗∗∗∗ World Bank 2002.World Development Indicators The agricultural sector though a major water consumer, has contributed comparatively little GDP especially in the countries like Jordan and Saudi Arabia.
Relative levels of agricultural incomes and productivity vary largely from country to another. Differences are very strong in the poorest countries (Eritrea, Ethiopia) and in riche country (Saudi Arabia), which is characterized by highly uneven urban and rural development. In the same time the agricultural sector's productivity in many countries is unstable since it often depends on fluctuating rainfall for irrigation. Moreover, the lack of clear plans to direct and diversify agricultural products in accordance with
53
both local and international market requirements in Jordan for example has seriously impacted the agricultural sector. 226
“In the Horn of Africa, aggregate cereal output in 1995/96 estimated to be lower than last year, despite a good second season cereal crop. A decline in the main season harvest more than offset an increase in the second season crop output. In both Eritrea and Somalia, outputs were poor and the food situation is expected to deteriorate in coming months, unless flows of food assistance are maintained until the next harvests later in the year.” 227
The value of agricultural exports are marginal in most countries, (less than 10% of the total exports) except in Jordan, and Sudan (11.1 and 25.3%) while in Yemen only 9.1 %.228 Jordan last year exported nearly 371,000 tonnes of these agricultural products worth about JD83 million to Kuwait, Lebanon, Qatar, Bahrain, Saudi Arabia, Oman and Iraq, among other buyers.229 Over the past decade, the sub-region’s total cereal production has been declining in the last years due mainly to adverse weather. Similarly, the per caput cereal production saw little variations and was declining also. Consequently, to meet consumption needs, the sub-region’s total cereal imports were growing. The Agricultural foods imports are important in Saudi Arabia. In 2000 Saudi Arabia was by far the largest importer of live animals, with 4.17 million sheep, 2.97 million chickens and 1.1 million goats. Historically, Somalia and Sudan have been major suppliers of sheep, goats and camels.230 In the same time with an increase in both personal income and population, Egypt has become one of the world's largest food importers. In response to the early warnings issued by FAO’s Global Information and Early Warning SystemOverall, with the estimated cereal production and imports of wheat and rice estimated at 680 000 tonnes and 38 000 tonnes respectively, the Sudan’s
226 Khalid Dalal. (2002). Agriculture experts urge clear export strategy to defend sector against looming competition. Jordan Times Friday-Saturday, March 31-April 1, 2000
227 http://www.fao.org/documents/show_cdr.asp?url_file=/docrep/004/w1144e/w1144e52.htm 228 ESCWA( 2001). Progress achieved in the implementation of chapter 18 of Agenda 21, with emphasis on water for sustainable agricultural production: case studies. United Nation , New York, 2001.
229 Jordan Times. Monday, June 15, 1998. http://www.jordanembassyus.org/061598005.htm
230 FAO.2003. Livestock Dynamics in the Arabian Peninsula. A Regional Review of National Livestock Resources and International Livestock Trade
54
cereal requirement of about 5.2 million tonnes in 1999/2000 is expected to be met by a draw-down of stocks of nearly 240 000 tonnes.231
. The links of agriculture with the rest of the economy are still rather weak, but are rapidly improving. National agro-industrial sectors were very limited at the beginning of the 1990s (operating often with national and imported agricultural raw materials). Dramatic progress have occurred during the past years in some countries of the region like Jordan, Saudi Arabia and Egypt, mostly owing to investments by foreign and international enterprises involved in food processing, feed production, textiles, etc. The same evolution is reported (data not precise) for industries related to input production (seeds, pesticides, fertilizers, irrigation equipment, agricultural machinery). Agricultural growth has been uneven from country to another. The Saudi Arabia is in the top with a total 132% growth per capita over the period considered because of large investments made in irrigation schemes. Agriculture's share of gross domestic product (GDP) has risen from 1.3% in 1970 to 9.4% in 1998, and 16% of the population are employed in the agricultural sector.232
Agriculture production including crops, dates, grains, fruits, livestock (camel, goats, cattle, sheep, and poultry), forests, fish, and wildlife has been the backbone and engine of economy in the region. All other sectors, including trade, industry, transportation, and services heavily depend on agriculture.
The figures on irrigated crops are very incomplete and do not allow the establishment of statistical tables by country showing the distribution of the major crops under irrigation in the region. However, by using all the data available, information for the permanent cropland in percentage indicated that this area in 1999 represents only 0.47 % of the lands area while the arable land represents not more than 4.2% of the lands area. In Djibouti, Eritrea and Somalia, less than 5 per cent of the land area is under cultivation (FAOSTAT 2001).233
231 FAO: A Human Catastrophe Looms in the Horn of Africa. FAO Global Information and Early Warning System On Food And Agriculture Special Alert No. 306. 18 April 2000
232 FAO.2003. Livestock Dynamics in the Arabian Peninsula. A Regional Review of National Livestock Resources and International Livestock Trade.
233 FAOSTAT (2001). Statistics Database of the United Nations Food and Agriculture Organization. FAO, Rome
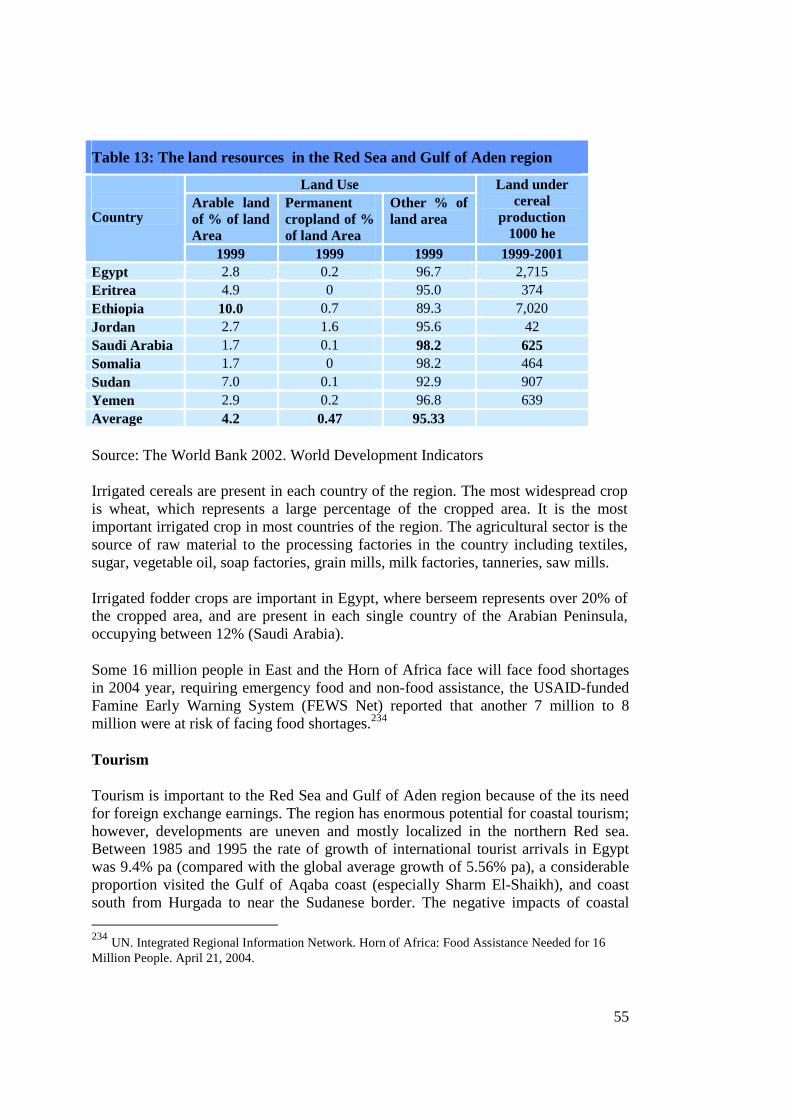
55
Table 13: The land resources in the Red Sea and Gulf of Aden region
Land Use Arable land of % of land Area
Permanent cropland of % of land Area
Other % of land area
Land under cereal
production 1000 he
Country
1999 1999 1999 1999-2001 Egypt 2.8 0.2 96.7 2,715 Eritrea 4.9 0 95.0 374 Ethiopia 10.0 0.7 89.3 7,020 Jordan 2.7 1.6 95.6 42 Saudi Arabia 1.7 0.1 98.2 625 Somalia 1.7 0 98.2 464 Sudan 7.0 0.1 92.9 907 Yemen 2.9 0.2 96.8 639 Average 4.2 0.47 95.33 Source: The World Bank 2002. World Development Indicators Irrigated cereals are present in each country of the region. The most widespread crop is wheat, which represents a large percentage of the cropped area. It is the most important irrigated crop in most countries of the region. The agricultural sector is the source of raw material to the processing factories in the country including textiles, sugar, vegetable oil, soap factories, grain mills, milk factories, tanneries, saw mills. Irrigated fodder crops are important in Egypt, where berseem represents over 20% of the cropped area, and are present in each single country of the Arabian Peninsula, occupying between 12% (Saudi Arabia).
Some 16 million people in East and the Horn of Africa face will face food shortages in 2004 year, requiring emergency food and non-food assistance, the USAID-funded Famine Early Warning System (FEWS Net) reported that another 7 million to 8 million were at risk of facing food shortages.234
Tourism
Tourism is important to the Red Sea and Gulf of Aden region because of the its need for foreign exchange earnings. The region has enormous potential for coastal tourism; however, developments are uneven and mostly localized in the northern Red sea. Between 1985 and 1995 the rate of growth of international tourist arrivals in Egypt was 9.4% pa (compared with the global average growth of 5.56% pa), a considerable proportion visited the Gulf of Aqaba coast (especially Sharm El-Shaikh), and coast south from Hurgada to near the Sudanese border. The negative impacts of coastal 234 UN. Integrated Regional Information Network. Horn of Africa: Food Assistance Needed for 16 Million People. April 21, 2004.
56
tourism are evident in these areas, including anchor damage to corals by tourist boats, coral breakage by divers, souvenir collecting, and habitat damage from off-road vehicles. Indirect impacts occur with the physical destruction of coastal habitats for construction works, dredging, and reclamation.235, 236
Sharm El Sheikh is a prosperous Egyptian Red Sea tourist resort area remote from the Nile com- prising isolated and developing communities. It accommodates more than 200 hotels of differing status, but most are in the 3 to 5 star bracket. The total number of foreign tourists to Sharm El Sheikh is estimated to be about 500,000 per year in addition to the local visitors, and rising. There is an on-going and critical need for expanding and updating the infrastructure for dealing with the Municipal Solid Waste (MSW) and for supplying potable water.237
Another important pressure being put on the marine and coastal environments of the Red Sea and Gulf of Aden is resulting from uncontrolled tourism in the area. The clear and relatively pristine waters and spectacular fringing coral reefs along most of the coast have held a fascination for tourists. Significant expansions of touristic and coastal recreation facilities in Egypt, Saudi Arabia, and Jordan have taken place and are expected to continue in the future, thus leading to increased competition over the coastal and marine resources in these areas.238
Tourist development impacts can already be seen off Hurghada, Egypt, where land reclamation and sedimentation associated with coastal development have destroyed or very seriously damaged large areas of reef. The use of imported fine sand for hotel beaches off Dahab threatens these reefs.239 Fishing pressure is increasing as the emphasis shifts from sustainable to extractive fishing practices. Lobsters are presently over-fished around the Sinai. Sharks in the area are reportedly declining for unknown reasons, possibly because of tourist-related activities such as boating. Increased recreational diving will also bring more diver-related damage to coral through kicking, trampling, or holding all of which tear the delicate tissues of the corals, increasing the chances of mortality and making the corals more susceptible to replacement by algal competitors (Hawkins and Roberts, 1993).240
235 Det Norske Veritas (DNV). Navigation risk assessment and management plan for the Red Sea and Gulf of Aden. Prepared for PERSGA and the World Bank with support from the Government of Norway. 1997. 237 M. Abdel-Rahman, A. Connollyb, P. Costenb, D; Dajnakb, F.C. Lockwoodb. Application of the ‘waste to water’ concept to Sharm El She&h through a CFD simulation. Desalination 152 (2002) 125-132.
238 Makram A. Gerges .(2002)The Red Sea and Gulf of Aden Action Plan—Facing the challenges of an ocean gateway. Ocean & Coastal Management. Volume 45. Issues 11-12. 2002. pages 885-903.
239 http://www.ogp.noaa.gov/mpe/paleo/coral/sor/sor_mideast.html 240 http://www.ogp.noaa.gov/mpe/paleo/coral/sor/sor_mideast.html
57
Coral reefs provide a major impetus for tourist development throughout the study region. Present development is restricted almost entirely to Egypt, Israel and Jordan. Approximately 19% of Egypt's reefs are currently affected, but this figure is expected to rise to over 30% by the year 2000. However, the intensity of use of reefs is likely to increase much more during this period. Of the planned expansion in Egypt, 55% will occur around the established resorts of Hurghada and Sharm-el-Sheikh. Tourist development has already caused substantial damage to inshore reefs near Hurghada from infilling, sedimentation and over-fishing for marine curios. Elsewhere, new constructions are also beginning to modify reef habitats.241
About one-third of the visitors to the Gulf of Eilat (Aqaba) participate in water sports, including snorkeling and SCUBA diving, which both depend on and impact the state of the reefs ( Hawkins and Roberts, 1994).242 Current levels of tourist diving on Eilat’s reefs directly cause high levels of damage to reef-building corals, and are above the ecological carrying capacity of the reef ( Zakai and Chadwick-Furman, 2002).243
The narrow belt of hotels and resorts along the coast has left the public with no access to the beach. Development has also drastically changed the coastal region from calm and secluded places to semi urban, intensively developed areas. Together with limited knowledge of coastal ecological systems, lack of pollution control, and enforcement procedures, uncontrolled development has lead to the rapid deterioration of coral reefs.244
Although tourism impacts in the southern Red Sea and Gulf of Aden are not as prominent as in the north, growing tourism investment plans will potentially cause environmental impacts on a regional scale. The pressures from tourism are spreading to new areas as popular sites become over-used and as foreign tourists continue to seek new, exotic destinations. This includes damage to coral reefs through collection for souvenir markets.245
241 Hawkins J.P.; Roberts C.M. The growth of coastal tourism in the Red Sea: present and future effects on coral reefs. Ambio,Volume 23, Issue 8, 1994, Pages 503-508
242Hawkins , J.P. and Roberts, C.M., 1994. The growth of coastal tourism in the Red Sea: present and future effects on coral reefs. Ambio 23, 8, pp. 503–508. 243 Zakai , D. and Chadwick-Furman, N.E., 2002. Impacts of intensive recreational diving on reef corals at Eilat, northern Red Sea. Biological Conservation 105, pp. 179–187 244 http://www.persga.org/about/tour/Egypt.asp 245 W. Gladstone, N. Tawfq, D. Nasr. Andersen, C. Cheung, H. Drammeh, F. Krupp, S. Lintner Sustainable use of renewable resources and conservation in the Red Sea and Gulf of Aden: issues, needs and strategic actions. Ocean & Coastal Management. 42. (1999) 671-697
58
Dredging has taken place in order to provide for the expansion of ports, industrial and tourist facilities, and for beach protection.246 The hidden consequences however involve a change in the characteristics of the seabed which reduces its capacity as a fisheries resource, and the creation of problems such as increased turbidity and siltation, which affects fish respiration and smothers benthic organisms.247
Fisheries
Fisheries resources of the region including the coastal waters, inland waters, and aquaculture potential, are an important sector for development. If rationally and scientifically exploited, fisheries could play a role in meeting increased food demand, and in activating the economies of the region. As with similar tropical areas, the fisheries resources can be characterized as those associated with coral reefs, small pelagics fisheries and those for the larger more mobile scrombroids, including some tunas. Fishing is mainly artisanal, though purse seining and trawling activities occur in shallow areas, especially the Gulf of Suez. The Red Sea artisanal sector comprises at least 29,500 fishermen and 9,000 vessels. The Gulf of Aden artisanal sector comprises at least 28,000 fishermen and 6,400 vessels. 248Fishing in most of the Red Sea has probably been mostly at sustainable levels to date, but such fisheries are very difficult to monitor and manage, and there is concern that regulations which do exist are commonly ignored. There is good potential for continued sustainable use, partly because of the existence of a regional programme and, equally importantly, because the overall population density of the coast remains very low.249
Artisanal fishermen in the region use a range of gears, including long-lines, hand lines, gill nets, trawls, trammel nets, tangle nets, set nets, traps and spears. The Red Sea industrial sector totals at least 7,500 fishermen and 1,600 industrial vessels. The
246 Joseph Sebastian Paimpillil, Jamie C.Se & Munir Dahalawi Impact of Treated Industrial Effluents on Yanbu (Red Sea) Coral Reefs and the Efficiency of Coastal Ecosystem Conservation. Littoral 2002, The Changing Coast. EUROCOAST / EUCC, Porto – Portugal Ed. EUROCOAST – Portugal. 247 Ahmed Barrania. Pollution of the Fisheries in the Gulf of Suez and the Socio- Economic Impacts Al Sambouk, No. 8, October 1998.page.8. http://www.unep.ch/seas/main/persga/samb8.pdf 248 PERSGA. (2003). Status of the Living Marine Resources in the Red Sea and Gulf of Aden and Their Management.
249 Sheppard C.R.C. The Red Sea Seas at the millennium - an environmental evaluation - Volume 2, Published by Elsevier Science Inc., ISBN 0080432077, Editors Sheppard C.R.C. 2000, Pages 35-45
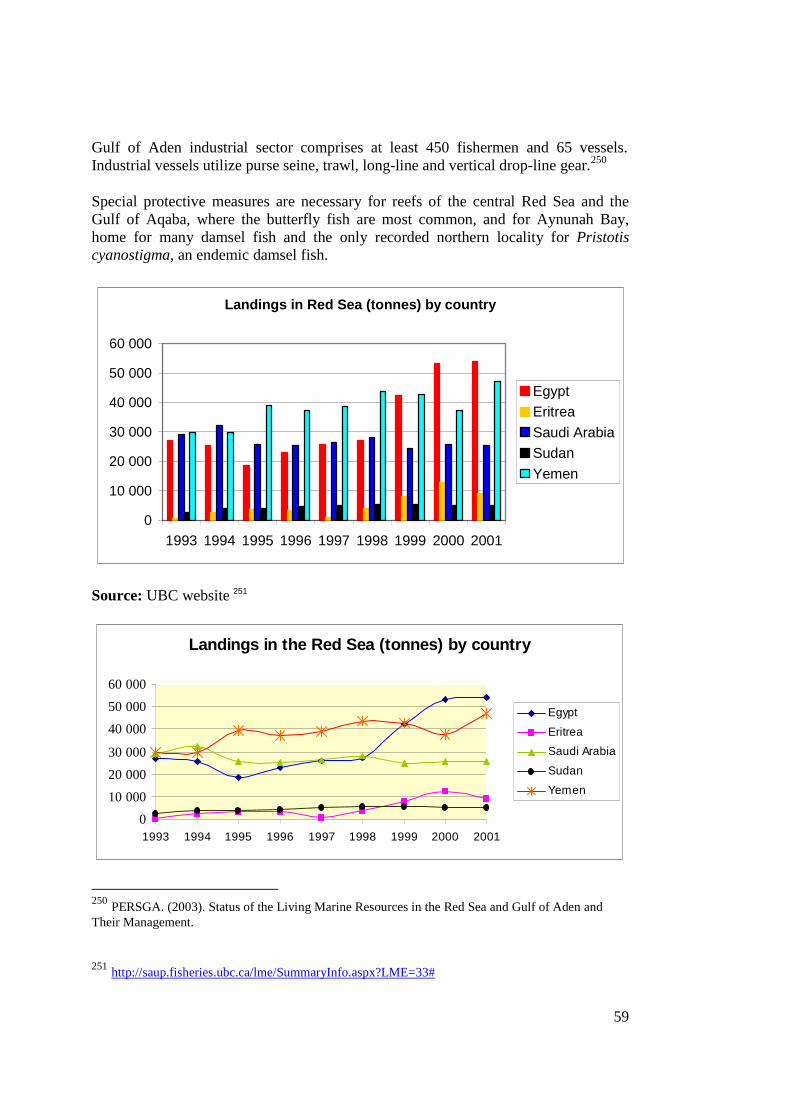
59
Gulf of Aden industrial sector comprises at least 450 fishermen and 65 vessels. Industrial vessels utilize purse seine, trawl, long-line and vertical drop-line gear.250
Special protective measures are necessary for reefs of the central Red Sea and the Gulf of Aqaba, where the butterfly fish are most common, and for Aynunah Bay, home for many damsel fish and the only recorded northern locality for Pristotis cyanostigma, an endemic damsel fish.
Landings in Red Sea (tonnes) by country
0
10 000
20 000
30 000
40 000
50 000
60 000
1993 1994 1995 1996 1997 1998 1999 2000 2001
EgyptEritrea
Saudi ArabiaSudan
Yemen
Source: UBC website 251
Landings in the Red Sea (tonnes) by country
0
10 000
20 000
30 000
40 000
50 000
60 000
1993 1994 1995 1996 1997 1998 1999 2000 2001
Egypt
Eritrea
Saudi Arabia
Sudan
Yemen
250 PERSGA. (2003). Status of the Living Marine Resources in the Red Sea and Gulf of Aden and Their Management. 251 http://saup.fisheries.ubc.ca/lme/SummaryInfo.aspx?LME=33#
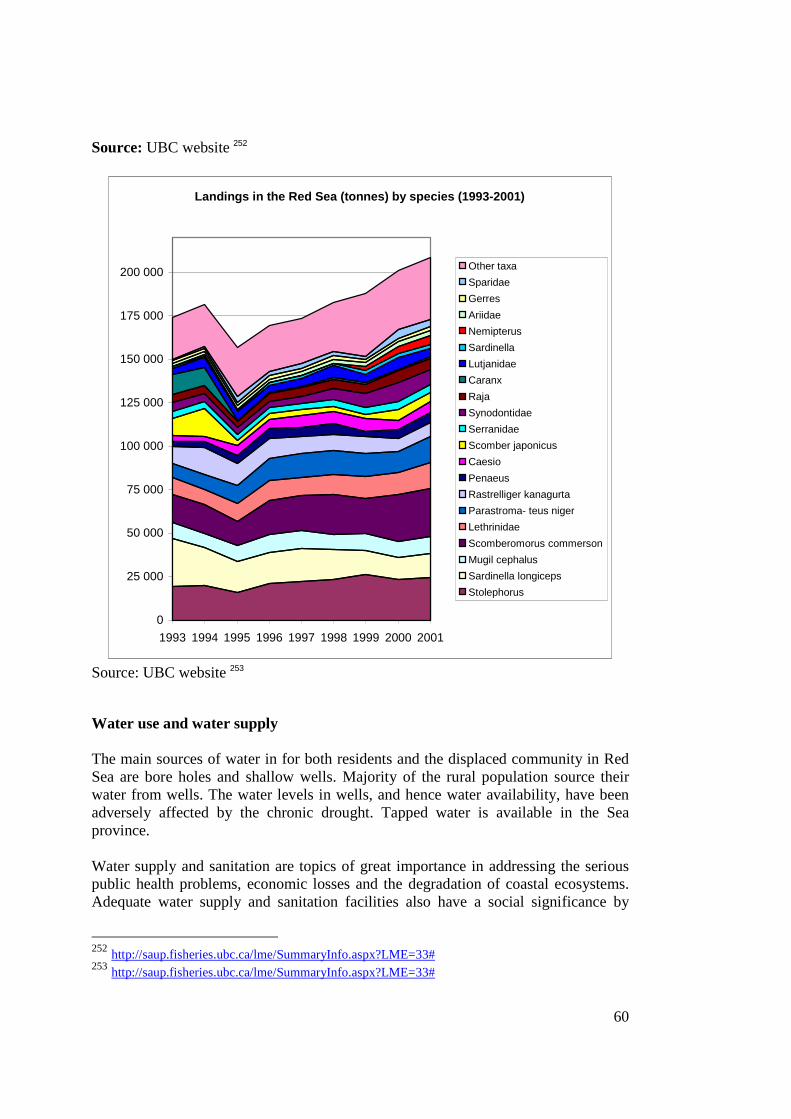
60
Source: UBC website 252
Landings in the Red Sea (tonnes) by species (1993-2001)
0
25 000
50 000
75 000
100 000
125 000
150 000
175 000
200 000
1993 1994 1995 1996 1997 1998 1999 2000 2001
Other taxa
Sparidae
Gerres
Ariidae
Nemipterus
Sardinella
Lutjanidae
Caranx
Raja
Synodontidae
Serranidae
Scomber japonicus
Caesio
Penaeus
Rastrelliger kanagurta
Parastroma- teus niger
Lethrinidae
Scomberomorus commerson
Mugil cephalus
Sardinella longiceps
Stolephorus
Source: UBC website 253 Water use and water supply The main sources of water in for both residents and the displaced community in Red Sea are bore holes and shallow wells. Majority of the rural population source their water from wells. The water levels in wells, and hence water availability, have been adversely affected by the chronic drought. Tapped water is available in the Sea province. Water supply and sanitation are topics of great importance in addressing the serious public health problems, economic losses and the degradation of coastal ecosystems. Adequate water supply and sanitation facilities also have a social significance by
252 http://saup.fisheries.ubc.ca/lme/SummaryInfo.aspx?LME=33# 253 http://saup.fisheries.ubc.ca/lme/SummaryInfo.aspx?LME=33#
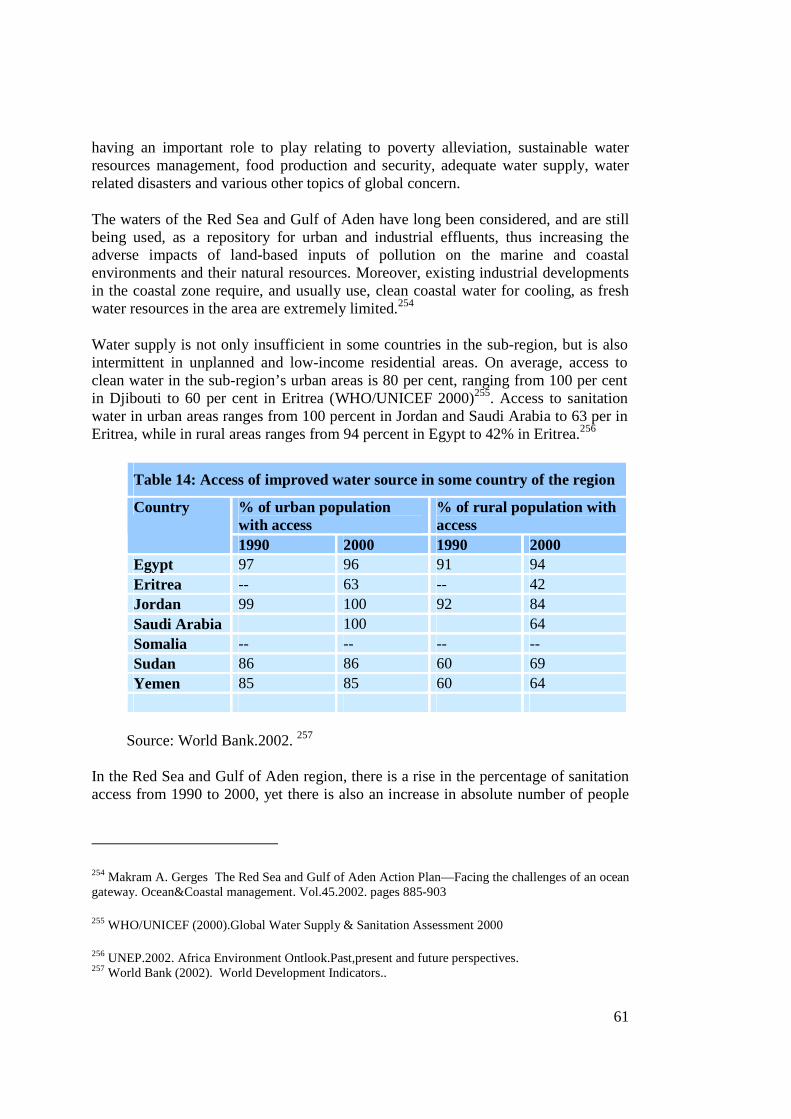
61
having an important role to play relating to poverty alleviation, sustainable water resources management, food production and security, adequate water supply, water related disasters and various other topics of global concern.
The waters of the Red Sea and Gulf of Aden have long been considered, and are still being used, as a repository for urban and industrial effluents, thus increasing the adverse impacts of land-based inputs of pollution on the marine and coastal environments and their natural resources. Moreover, existing industrial developments in the coastal zone require, and usually use, clean coastal water for cooling, as fresh water resources in the area are extremely limited.254
Water supply is not only insufficient in some countries in the sub-region, but is also intermittent in unplanned and low-income residential areas. On average, access to clean water in the sub-region’s urban areas is 80 per cent, ranging from 100 per cent in Djibouti to 60 per cent in Eritrea (WHO/UNICEF 2000)255. Access to sanitation water in urban areas ranges from 100 percent in Jordan and Saudi Arabia to 63 per in Eritrea, while in rural areas ranges from 94 percent in Egypt to 42% in Eritrea.256
Table 14: Access of improved water source in some country of the region
% of urban population with access
% of rural population with access
Country
1990 2000 1990 2000 Egypt 97 96 91 94 Eritrea -- 63 -- 42 Jordan 99 100 92 84 Saudi Arabia 100 64 Somalia -- -- -- -- Sudan 86 86 60 69 Yemen 85 85 60 64
Source: World Bank.2002. 257 In the Red Sea and Gulf of Aden region, there is a rise in the percentage of sanitation access from 1990 to 2000, yet there is also an increase in absolute number of people
254 Makram A. Gerges The Red Sea and Gulf of Aden Action Plan––Facing the challenges of an ocean gateway. Ocean&Coastal management. Vol.45.2002. pages 885-903
255 WHO/UNICEF (2000).Global Water Supply & Sanitation Assessment 2000
256 UNEP.2002. Africa Environment Ontlook.Past,present and future perspectives. 257 World Bank (2002). World Development Indicators..
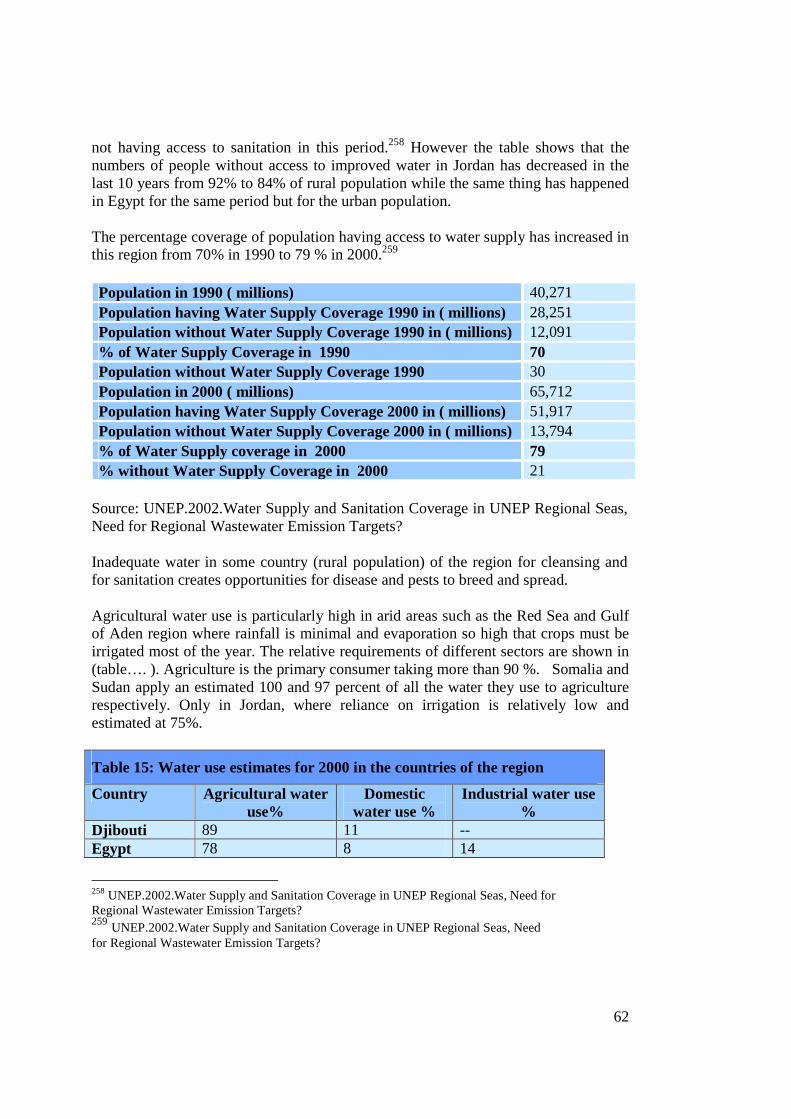
62
not having access to sanitation in this period.258 However the table shows that the numbers of people without access to improved water in Jordan has decreased in the last 10 years from 92% to 84% of rural population while the same thing has happened in Egypt for the same period but for the urban population. The percentage coverage of population having access to water supply has increased in this region from 70% in 1990 to 79 % in 2000.259 Population in 1990 ( millions) 40,271 Population having Water Supply Coverage 1990 in ( millions) 28,251 Population without Water Supply Coverage 1990 in ( millions) 12,091 % of Water Supply Coverage in 1990 70 Population without Water Supply Coverage 1990 30 Population in 2000 ( millions) 65,712 Population having Water Supply Coverage 2000 in ( millions) 51,917 Population without Water Supply Coverage 2000 in ( millions) 13,794 % of Water Supply coverage in 2000 79 % without Water Supply Coverage in 2000 21
Source: UNEP.2002.Water Supply and Sanitation Coverage in UNEP Regional Seas, Need for Regional Wastewater Emission Targets? Inadequate water in some country (rural population) of the region for cleansing and for sanitation creates opportunities for disease and pests to breed and spread.
Agricultural water use is particularly high in arid areas such as the Red Sea and Gulf of Aden region where rainfall is minimal and evaporation so high that crops must be irrigated most of the year. The relative requirements of different sectors are shown in (table…. ). Agriculture is the primary consumer taking more than 90 %. Somalia and Sudan apply an estimated 100 and 97 percent of all the water they use to agriculture respectively. Only in Jordan, where reliance on irrigation is relatively low and estimated at 75%.
Table 15: Water use estimates for 2000 in the countries of the region
Country Agricultural water use%
Domestic water use %
Industrial water use %
Djibouti 89 11 -- Egypt 78 8 14
258 UNEP.2002.Water Supply and Sanitation Coverage in UNEP Regional Seas, Need for Regional Wastewater Emission Targets? 259 UNEP.2002.Water Supply and Sanitation Coverage in UNEP Regional Seas, Need for Regional Wastewater Emission Targets?
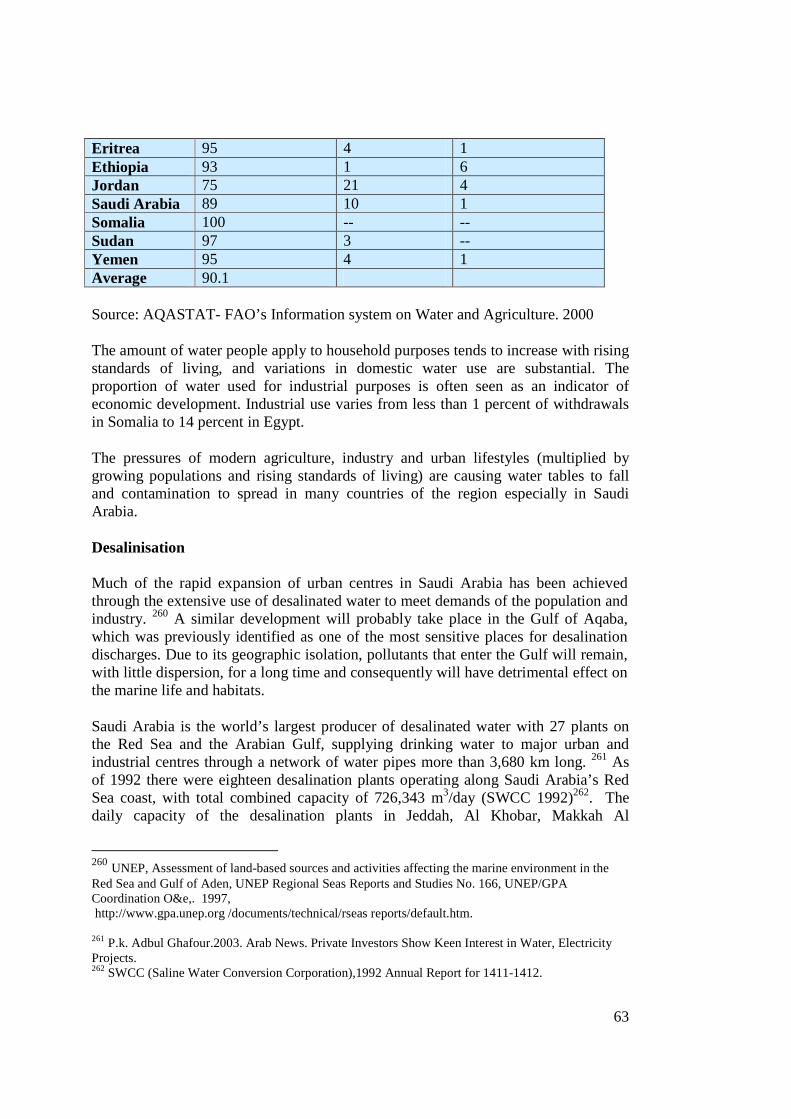
63
Eritrea 95 4 1 Ethiopia 93 1 6 Jordan 75 21 4 Saudi Arabia 89 10 1 Somalia 100 -- -- Sudan 97 3 -- Yemen 95 4 1 Average 90.1
Source: AQASTAT- FAO’s Information system on Water and Agriculture. 2000
The amount of water people apply to household purposes tends to increase with rising standards of living, and variations in domestic water use are substantial. The proportion of water used for industrial purposes is often seen as an indicator of economic development. Industrial use varies from less than 1 percent of withdrawals in Somalia to 14 percent in Egypt.
The pressures of modern agriculture, industry and urban lifestyles (multiplied by growing populations and rising standards of living) are causing water tables to fall and contamination to spread in many countries of the region especially in Saudi Arabia.
Desalinisation Much of the rapid expansion of urban centres in Saudi Arabia has been achieved through the extensive use of desalinated water to meet demands of the population and industry. 260 A similar development will probably take place in the Gulf of Aqaba, which was previously identified as one of the most sensitive places for desalination discharges. Due to its geographic isolation, pollutants that enter the Gulf will remain, with little dispersion, for a long time and consequently will have detrimental effect on the marine life and habitats.
Saudi Arabia is the world’s largest producer of desalinated water with 27 plants on the Red Sea and the Arabian Gulf, supplying drinking water to major urban and industrial centres through a network of water pipes more than 3,680 km long. 261 As of 1992 there were eighteen desalination plants operating along Saudi Arabia’s Red Sea coast, with total combined capacity of 726,343 m3/day (SWCC 1992)262. The daily capacity of the desalination plants in Jeddah, Al Khobar, Makkah Al
260 UNEP, Assessment of land-based sources and activities affecting the marine environment in the Red Sea and Gulf of Aden, UNEP Regional Seas Reports and Studies No. 166, UNEP/GPA Coordination O&e,. 1997, http://www.gpa.unep.org /documents/technical/rseas reports/default.htm. 261 P.k. Adbul Ghafour.2003. Arab News. Private Investors Show Keen Interest in Water, Electricity Projects. 262 SWCC (Saline Water Conversion Corporation),1992 Annual Report for 1411-1412.
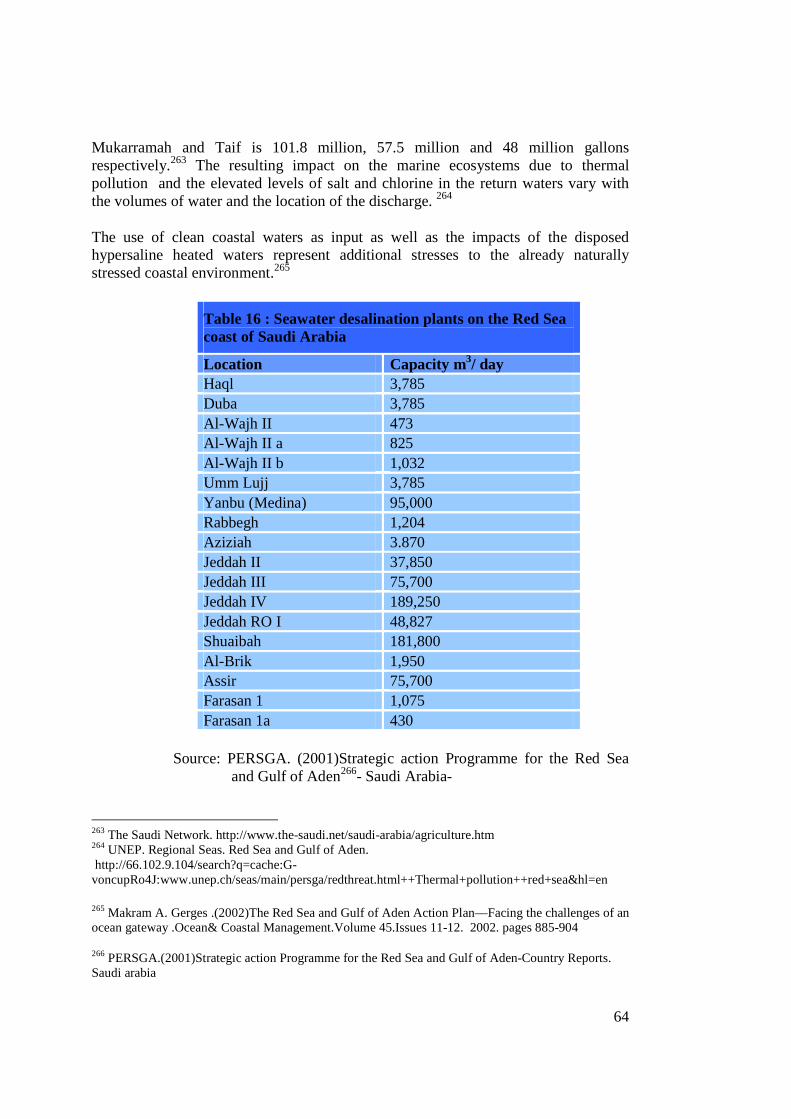
64
Mukarramah and Taif is 101.8 million, 57.5 million and 48 million gallons respectively.263 The resulting impact on the marine ecosystems due to thermal pollution and the elevated levels of salt and chlorine in the return waters vary with the volumes of water and the location of the discharge. 264
The use of clean coastal waters as input as well as the impacts of the disposed hypersaline heated waters represent additional stresses to the already naturally stressed coastal environment.265
Table 16 : Seawater desalination plants on the Red Sea coast of Saudi Arabia
Location Capacity m3/ day Haql 3,785 Duba 3,785 Al-Wajh II 473 Al-Wajh II a 825 Al-Wajh II b 1,032 Umm Lujj 3,785 Yanbu (Medina) 95,000 Rabbegh 1,204 Aziziah 3.870 Jeddah II 37,850 Jeddah III 75,700 Jeddah IV 189,250 Jeddah RO I 48,827 Shuaibah 181,800 Al-Brik 1,950 Assir 75,700 Farasan 1 1,075 Farasan 1a 430
Source: PERSGA. (2001)Strategic action Programme for the Red Sea and Gulf of Aden266- Saudi Arabia-
263 The Saudi Network. http://www.the-saudi.net/saudi-arabia/agriculture.htm 264 UNEP. Regional Seas. Red Sea and Gulf of Aden. http://66.102.9.104/search?q=cache:G-voncupRo4J:www.unep.ch/seas/main/persga/redthreat.html++Thermal+pollution++red+sea&hl=en
265 Makram A. Gerges .(2002)The Red Sea and Gulf of Aden Action Plan––Facing the challenges of an ocean gateway .Ocean& Coastal Management.Volume 45.Issues 11-12. 2002. pages 885-904
266 PERSGA.(2001)Strategic action Programme for the Red Sea and Gulf of Aden-Country Reports. Saudi arabia
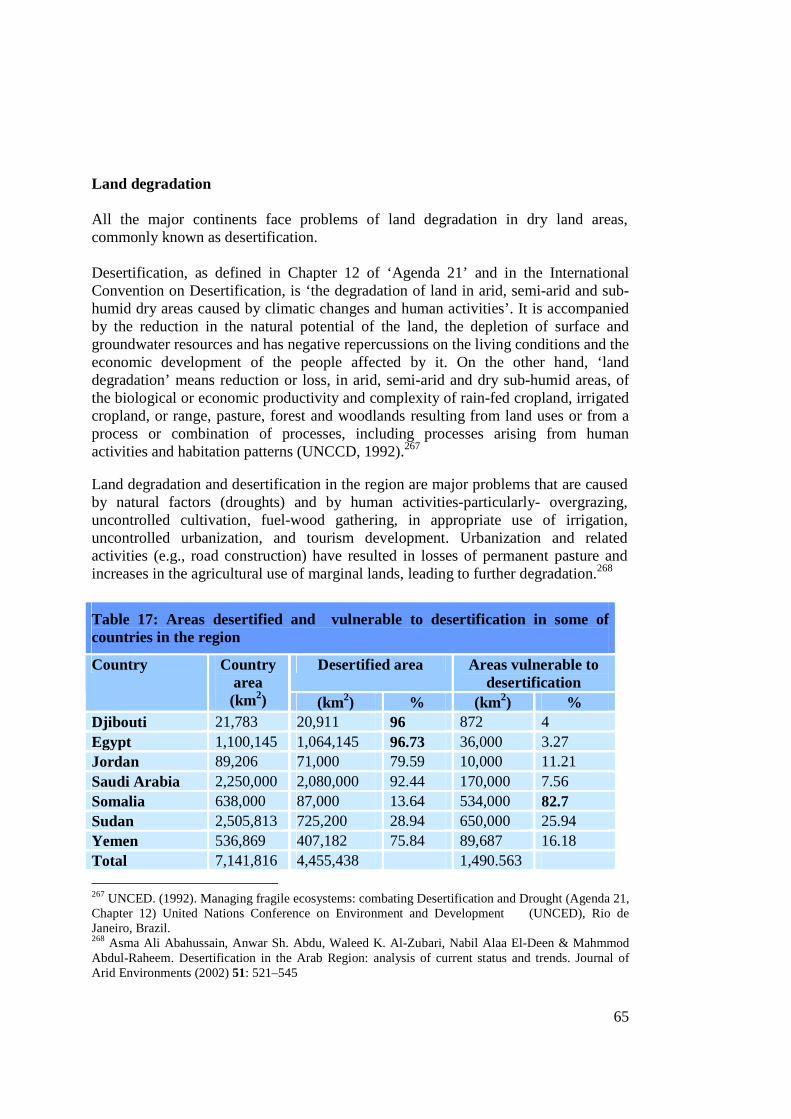
65
Land degradation All the major continents face problems of land degradation in dry land areas, commonly known as desertification. Desertification, as defined in Chapter 12 of ‘Agenda 21’ and in the International Convention on Desertification, is ‘the degradation of land in arid, semi-arid and sub-humid dry areas caused by climatic changes and human activities’. It is accompanied by the reduction in the natural potential of the land, the depletion of surface and groundwater resources and has negative repercussions on the living conditions and the economic development of the people affected by it. On the other hand, ‘land degradation’ means reduction or loss, in arid, semi-arid and dry sub-humid areas, of the biological or economic productivity and complexity of rain-fed cropland, irrigated cropland, or range, pasture, forest and woodlands resulting from land uses or from a process or combination of processes, including processes arising from human activities and habitation patterns (UNCCD, 1992).267 Land degradation and desertification in the region are major problems that are caused by natural factors (droughts) and by human activities-particularly- overgrazing, uncontrolled cultivation, fuel-wood gathering, in appropriate use of irrigation, uncontrolled urbanization, and tourism development. Urbanization and related activities (e.g., road construction) have resulted in losses of permanent pasture and increases in the agricultural use of marginal lands, leading to further degradation.268
Table 17: Areas desertified and vulnerable to desertification in some of countries in the region
Desertified area Areas vulnerable to desertification
Country Country area (km2) (km2) % (km2) %
Djibouti 21,783 20,911 96 872 4 Egypt 1,100,145 1,064,145 96.73 36,000 3.27 Jordan 89,206 71,000 79.59 10,000 11.21 Saudi Arabia 2,250,000 2,080,000 92.44 170,000 7.56 Somalia 638,000 87,000 13.64 534,000 82.7 Sudan 2,505,813 725,200 28.94 650,000 25.94 Yemen 536,869 407,182 75.84 89,687 16.18 Total 7,141,816 4,455,438 1,490.563
267 UNCED. (1992). Managing fragile ecosystems: combating Desertification and Drought (Agenda 21, Chapter 12) United Nations Conference on Environment and Development (UNCED), Rio de Janeiro, Brazil. 268 Asma Ali Abahussain, Anwar Sh. Abdu, Waleed K. Al-Zubari, Nabil Alaa El-Deen & Mahmmod Abdul-Raheem. Desertification in the Arab Region: analysis of current status and trends. Journal of Arid Environments (2002) 51: 521–545
66
62.3% 20.8% Source Adopted from( Abahussain A.A. et al 2002)41
The reported results suggest that desertification directly affected about 4.45 millions km2, representing 62.3% of total countries area while the areas vulnerable to desertification represented about 20.8%. As show from table the total desertified area in the region is very high in such countries like Egypt and Djibouti and represented about 96.75% and 96 % of total countries area. The area vulnerable to desertification in Somalia is seriously high also represented 534,000 km2 or 82.7% of the total country area. Agricultural practices place additional pressure on the coastal environment. Overgrazing by livestock results in increased siltation in coastal waters due to erosion of coastal soils and sand dunes. The destabilization of coastal sand dunes is the single most important hazard. The accelerating rate at which active dunes appear is of major concern. All over Somalia some 465,000 hectares of formerly stable dunes have been reactivated in coastal areas.269
Most of the land in this region is desert, and an increasing part of the permanent pasture areas is subject to erosion because of reduced vegetation cover (LAS/AOAD, 1995).270 Additionally, much of the cropland is losing its inherent productivity due to poor agricultural practices. The direct loss of agricultural land is most acute in Yemen, where fertile land is scarce and concentrated in the narrow coastal strip (ESCWA, 1995).271 In some countries like Egypt, Yemen, Sudan and the horn of Africa countries, the irrigated areas close to the main urban centers, established agricultural land is being lost to alternative uses, including urbanization, industrialization, and transport infrastructure. To compensate for this, new land is being brought into production through reclamation. The productivity of the reclaimed land, however, is in many cases only a fraction of the old, and new land is being brought into production more slowly than old land is being lost.
Overgrazing in desert areas is a major cause of plant cover loss, particularly in the northern regions of Saudi Arabia. (UNEP/ESCWA, 1991).272
269 PERSGA 2001. Strategic Action Programme for the Red Sea and Gulf of Aden . Country Reports
270 LAS/AOAD. 1995. Deteriorated rangelands in the Arab region and the projects recommended for development. League of Arab States (LAS) and Arab Organisation for Agricultural Development (AOAD). Khartoum (in Arabic).
271 ESCWA. 1995. Expert group meeting on the implications of Agenda 21 for integrated water management in the ESCWA region. 2-5 October. Amman.
272 UNEP/ESCWA. 1991. The National Plan of Action to Combat Desertification in Bahrain. UNEP. Bahrain.
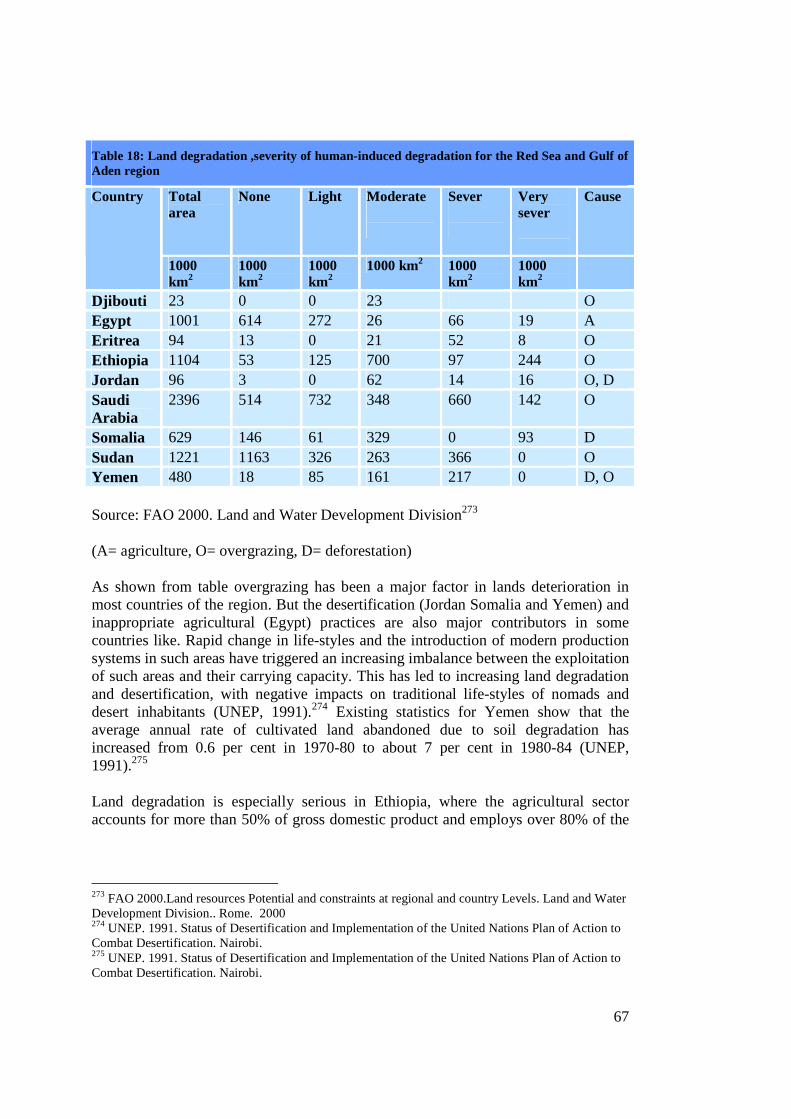
67
Table 18: Land degradation ,severity of human-induced degradation for the Red Sea and Gulf of Aden region
Total area
None Light Moderate
Sever
Very sever
Cause Country
1000 km2
1000 km2
1000 km2
1000 km2 1000 km2
1000 km2
Djibouti 23 0 0 23 O Egypt 1001 614 272 26 66 19 A Eritrea 94 13 0 21 52 8 O Ethiopia 1104 53 125 700 97 244 O Jordan 96 3 0 62 14 16 O, D Saudi Arabia
2396 514 732 348 660 142 O
Somalia 629 146 61 329 0 93 D Sudan 1221 1163 326 263 366 0 O Yemen 480 18 85 161 217 0 D, O
Source: FAO 2000. Land and Water Development Division273
(A= agriculture, O= overgrazing, D= deforestation)
As shown from table overgrazing has been a major factor in lands deterioration in most countries of the region. But the desertification (Jordan Somalia and Yemen) and inappropriate agricultural (Egypt) practices are also major contributors in some countries like. Rapid change in life-styles and the introduction of modern production systems in such areas have triggered an increasing imbalance between the exploitation of such areas and their carrying capacity. This has led to increasing land degradation and desertification, with negative impacts on traditional life-styles of nomads and desert inhabitants (UNEP, 1991).274 Existing statistics for Yemen show that the average annual rate of cultivated land abandoned due to soil degradation has increased from 0.6 per cent in 1970-80 to about 7 per cent in 1980-84 (UNEP, 1991).275
Land degradation is especially serious in Ethiopia, where the agricultural sector accounts for more than 50% of gross domestic product and employs over 80% of the
273 FAO 2000.Land resources Potential and constraints at regional and country Levels. Land and Water Development Division.. Rome. 2000 274 UNEP. 1991. Status of Desertification and Implementation of the United Nations Plan of Action to Combat Desertification. Nairobi. 275 UNEP. 1991. Status of Desertification and Implementation of the United Nations Plan of Action to Combat Desertification. Nairobi.
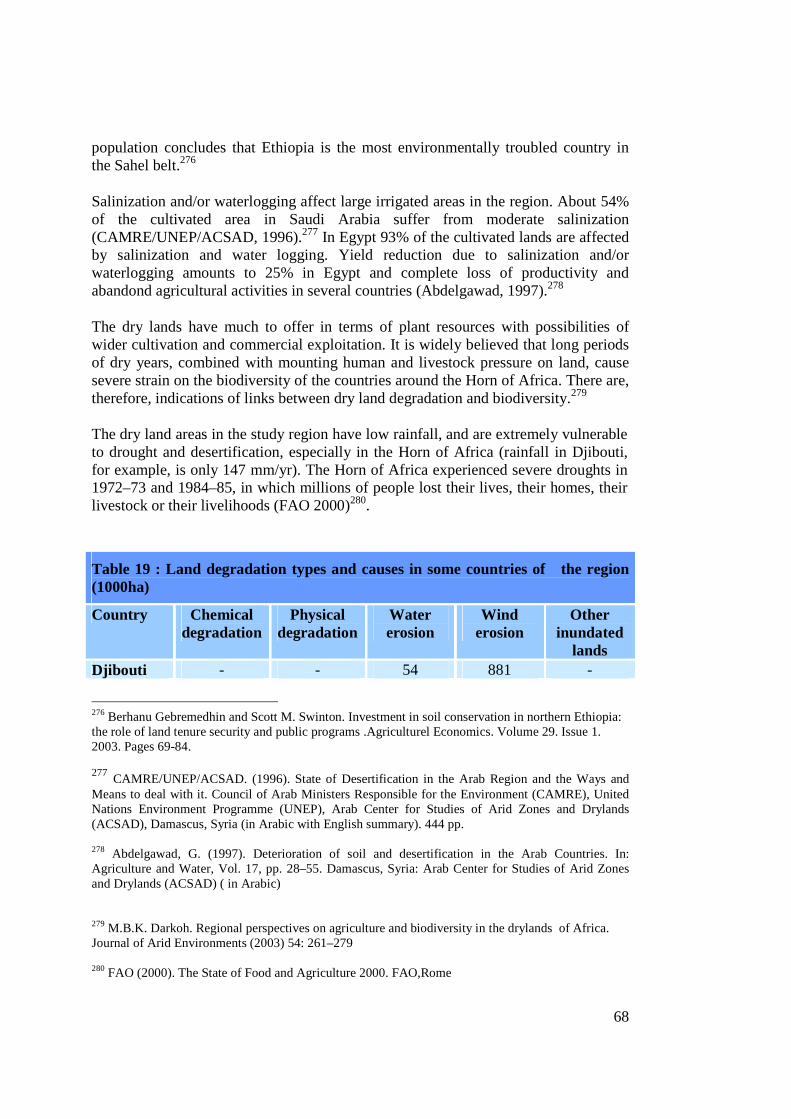
68
population concludes that Ethiopia is the most environmentally troubled country in the Sahel belt.276
Salinization and/or waterlogging affect large irrigated areas in the region. About 54% of the cultivated area in Saudi Arabia suffer from moderate salinization (CAMRE/UNEP/ACSAD, 1996).277 In Egypt 93% of the cultivated lands are affected by salinization and water logging. Yield reduction due to salinization and/or waterlogging amounts to 25% in Egypt and complete loss of productivity and abandond agricultural activities in several countries (Abdelgawad, 1997).278
The dry lands have much to offer in terms of plant resources with possibilities of wider cultivation and commercial exploitation. It is widely believed that long periods of dry years, combined with mounting human and livestock pressure on land, cause severe strain on the biodiversity of the countries around the Horn of Africa. There are, therefore, indications of links between dry land degradation and biodiversity.279
The dry land areas in the study region have low rainfall, and are extremely vulnerable to drought and desertification, especially in the Horn of Africa (rainfall in Djibouti, for example, is only 147 mm/yr). The Horn of Africa experienced severe droughts in 1972–73 and 1984–85, in which millions of people lost their lives, their homes, their livestock or their livelihoods (FAO 2000)280.
Table 19 : Land degradation types and causes in some countries of the region (1000ha)
Country Chemical degradation
Physical degradation
Water erosion
Wind erosion
Other inundated
lands Djibouti - - 54 881 -
276 Berhanu Gebremedhin and Scott M. Swinton. Investment in soil conservation in northern Ethiopia: the role of land tenure security and public programs .Agriculturel Economics. Volume 29. Issue 1. 2003. Pages 69-84. 277 CAMRE/UNEP/ACSAD. (1996). State of Desertification in the Arab Region and the Ways and Means to deal with it. Council of Arab Ministers Responsible for the Environment (CAMRE), United Nations Environment Programme (UNEP), Arab Center for Studies of Arid Zones and Drylands (ACSAD), Damascus, Syria (in Arabic with English summary). 444 pp. 278 Abdelgawad, G. (1997). Deterioration of soil and desertification in the Arab Countries. In: Agriculture and Water, Vol. 17, pp. 28–55. Damascus, Syria: Arab Center for Studies of Arid Zones and Drylands (ACSAD) ( in Arabic) 279 M.B.K. Darkoh. Regional perspectives on agriculture and biodiversity in the drylands of Africa. Journal of Arid Environments (2003) 54: 261–279 280 FAO (2000). The State of Food and Agriculture 2000. FAO,Rome
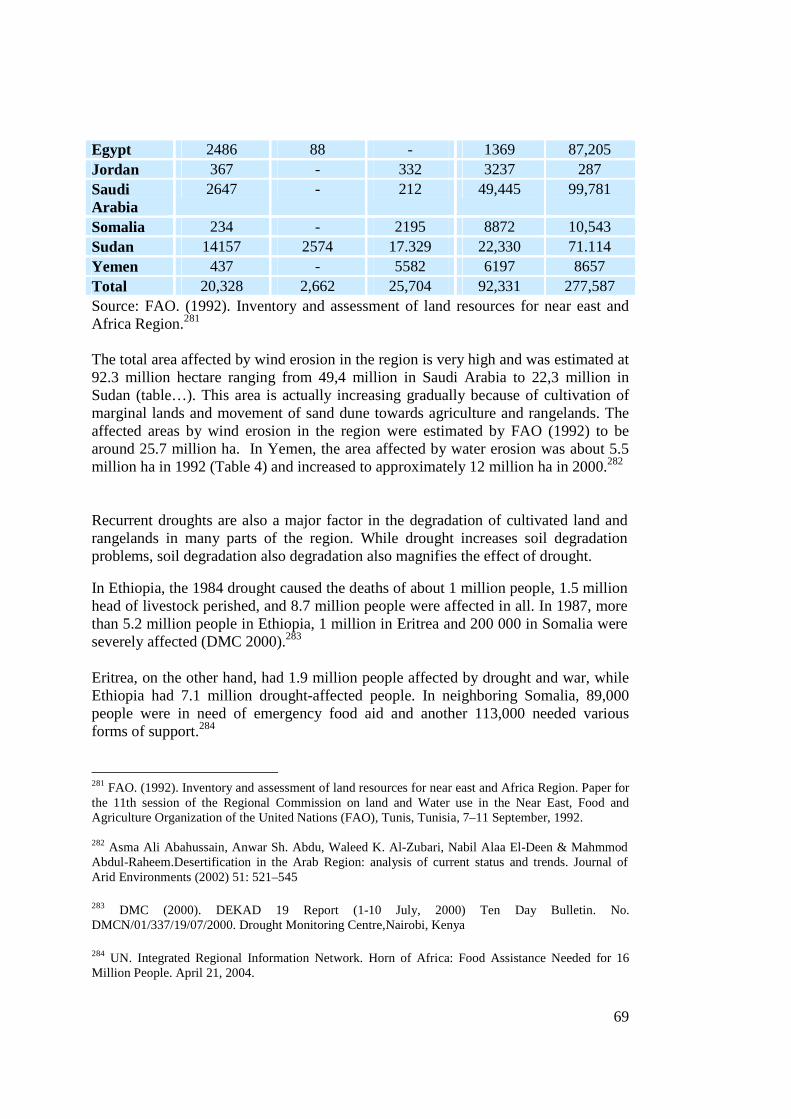
69
Egypt 2486 88 - 1369 87,205 Jordan 367 - 332 3237 287 Saudi Arabia
2647 - 212 49,445 99,781
Somalia 234 - 2195 8872 10,543 Sudan 14157 2574 17.329 22,330 71.114 Yemen 437 - 5582 6197 8657 Total 20,328 2,662 25,704 92,331 277,587 Source: FAO. (1992). Inventory and assessment of land resources for near east and Africa Region.281 The total area affected by wind erosion in the region is very high and was estimated at 92.3 million hectare ranging from 49,4 million in Saudi Arabia to 22,3 million in Sudan (table…). This area is actually increasing gradually because of cultivation of marginal lands and movement of sand dune towards agriculture and rangelands. The affected areas by wind erosion in the region were estimated by FAO (1992) to be around 25.7 million ha. In Yemen, the area affected by water erosion was about 5.5 million ha in 1992 (Table 4) and increased to approximately 12 million ha in 2000.282 Recurrent droughts are also a major factor in the degradation of cultivated land and rangelands in many parts of the region. While drought increases soil degradation problems, soil degradation also degradation also magnifies the effect of drought. In Ethiopia, the 1984 drought caused the deaths of about 1 million people, 1.5 million head of livestock perished, and 8.7 million people were affected in all. In 1987, more than 5.2 million people in Ethiopia, 1 million in Eritrea and 200 000 in Somalia were severely affected (DMC 2000).283
Eritrea, on the other hand, had 1.9 million people affected by drought and war, while Ethiopia had 7.1 million drought-affected people. In neighboring Somalia, 89,000 people were in need of emergency food aid and another 113,000 needed various forms of support.284
281 FAO. (1992). Inventory and assessment of land resources for near east and Africa Region. Paper for the 11th session of the Regional Commission on land and Water use in the Near East, Food and Agriculture Organization of the United Nations (FAO), Tunis, Tunisia, 7–11 September, 1992. 282 Asma Ali Abahussain, Anwar Sh. Abdu, Waleed K. Al-Zubari, Nabil Alaa El-Deen & Mahmmod Abdul-Raheem.Desertification in the Arab Region: analysis of current status and trends. Journal of Arid Environments (2002) 51: 521–545
283 DMC (2000). DEKAD 19 Report (1-10 July, 2000) Ten Day Bulletin. No. DMCN/01/337/19/07/2000. Drought Monitoring Centre,Nairobi, Kenya
284 UN. Integrated Regional Information Network. Horn of Africa: Food Assistance Needed for 16 Million People. April 21, 2004.
70
Rapid population growth and increasing demand for food, combined with high variability in rainfall and frequent drought in this region, is putting pressure on farmers to clear more natural vegetation, and to cultivate more and more marginal land.
National Institutions involved in water and environment In Djibouti several institutions involved in water resources and irrigation these include the Land Resources Division (LRD) of the Ministry of Agriculture, which is responsible for land and water resource development and conservation, including soil and water conservation, small dam construction, and irrigation. It is divided into a natural resources section, and a water development and construction section. A re-organization of the Ministry of Agriculture is under consideration; the Land Resources Division could be split into a Division of Soil Conservation, Irrigation and Land Use, and a Division of Forestry, Wildlife and Environment. The Ministry of Agriculture has offices in nine provinces, each of which is intended to have a structure similar to that of the headquarters.
The Water Resources Department (WRD) of the Ministry of Energy, Mining and Water Resources (MEMWR) in Djibouti is in charge of the evaluation of surface and groundwater resources, the control of the use of water resources, the establishment and the operation of meteorological and hydrological networks, urban and rural water supply, sanitation, and protection of water sources from pollutants.
The Ministry of Public Works and Water Resources (MPWWR) in Egypt is in charge of water resources research, development and distribution, and undertakes the construction, operation and maintenance of the irrigation and drainage networks. At central level, the Planning Sector is responsible for data collection, processing and analysis for planning and monitoring investment projects. Water resources development works are coordinated by the Sector of Public Works and Water Resources. The Nile Water Sector is in charge of cooperation with Sudan and other Nile basin countries. The Irrigation Department provides technical guidance and monitoring of irrigation development, including dams. The Mechanical and Electrical Department is in charge of the construction and maintenance of pumping stations for irrigation and drainage. Further to these institutions, other public authorities operate in direct relation to the MPWWR.
They are the High Aswan Dam Authority, responsible for dam operation; the Drainage Authority, responsible for the construction and maintenance of tile and open drains; and the Water Research Centre. The Water Research Centre comprises 12 institutes and is the scientific body of MPWWR for all aspects related to water resources management.
71
The Ministry of Agriculture and Land Reclamation (MALR) In Yemen is in charge of agricultural research and extension, land reclamation and agricultural, fisheries and animal wealth development.
In Ethiopia several institutions are involved in water sector assessment and development. The Ministry of Natural Resources Development and Environmental Protection (MNRDEP), created in 1994, with a Natural Resources Bureau office in every region. This Ministry is in charge of soil and water protection, rural water supply, sanitation,and medium- to large-scale irrigation schemes. This Ministry supervises the activities of different Departments or Organizations.
In Saudi Arabia the Ministry of Agriculture (MOA), in charge of small-scale irrigation. The Irrigation Development Department, created in 1983 and formerly responsible for small-scale irrigation development and management, was dissolved in 1994.The Ministry of State Farm Development (MSFD), responsible for the management and operation of large, state irrigation farms. The Ministry of Economic Planning and Development (MEPD), coordinating all the sectorial resource assessment and development planning that can be done by the different ministries. The Ministry of Agriculture and Water (MAW) is in charge of water resources research, drinking water supply, construction, and the operation and maintenance of water resources projects. The General Organization for Desalination of MAW is responsible for the construction, operation and maintenance of desalination plants. The Ministry of Municipal and Rural Affairs is responsible for the construction, operation and maintenance of drinking water supply networks and for the installation of water connections at house level. It is also responsible for the construction, operation and maintenance of wastewater treatment plants. Sudan has established since independence (in 1956) a well developed institutional infrastructure in an attempt to make its irrigation sector more efficient. At the top, the National Nile Waters Commission determines the allocation of water to each province. The Ministry of Irrigation and Water Resources (MOI&WR) is responsible for the delivery of irrigation water to the major canals and, jointly with the Agricultural Corporations (AC), for the operation of minor canals. MOI&WR is the sole authority for surface water resources assessment and development in Sudan, whereas the Groundwater Corporation has the same responsibility regarding subterranean water resources. The Hydraulic Research Station (HRS) of MOI&WR deals with the development of theoretical and applied research concerning surface water resources. Regarding the domestic water supply, the responsibility for its management and development is divided between the Urban Waters Corporation and the Rural Waters Corporation. In Yemen the Ministry of Agriculture and Water Resources (MAWR) is responsible for formulating policies for water resources, for food security and for crops, livestock and forestry production, and for coordinating public investment and services in the sector. The General Directorate of Water Resources is located within the Ministry with four general departments: water resources; irrigation and maintenance of water
72
installations; farm mechanization and land reclamation; irrigation studies. Responsibility for coordinating rural water supplies lies within the Water Supply Department of the Ministry of Water and Electricity (MWE). The General Department of Hydrology is located within the Ministry of Oil and Mineral Resources (MOMR).
The Regional Convention
The Regional Convention, formally titled "Regional Convention for the Conservation of the Environment of the Red Sea and Gulf of Aden" provides an important basis for environmental cooperation in the Region. Initiated by the coastal states of the Red Sea and Gulf of Aden under the auspices of the Arab League Educational, Cultural and Scientific Organization (ALECSO), and supported by UNEP under its Regional Seas Programme, the Convention was adopted by the Regional Conference of Plenipotentiaries, held in Jeddah, Saudi Arabia, 13–15 February 1982. It was signed by the Governments of Egypt, Jordan, Saudi Arabia, Somalia, Sudan, Arab Republic of Yemen, People's Democratic Republic of Yemen and Palestine (represented by the Palestinian Liberation Organization ). 285
Together with the Convention, the Jeddah Conference also adopted a "Programme for the Environment of the Red Sea and Gulf of Aden" (PERSGA) and established a Secretariat for the Programme in Jeddah. In addition, the Conference produced two important instruments, namely, an "Action Plan for the Conservation of the Environment of the Red Sea and Gulf of Aden" and a "Protocol Concerning Regional Cooperation in Combating Pollution by Oil and other Harmful Substances in Cases of Emergency".286
One major is to increase the safety of navigation and hence reduce the risk of marine pollution. The southern Red Sea is a navigational ‘high-risk area’ as there are no official traffic lanes dividing the vessels heading north from those steaming south. In order to establish a separation scheme, have it officially recognised by the International Maritime Organization and shown on ships’ charts, the area has to be surveyed to a very high standard. Interestingly enough this section of the Red Sea has not been surveyed since the 1880’s when the British Navy used sailing ships and lead-lines for measuring water depth. A detailed work programme has now been completed, more than 21,000 km sailed, 900 seabed samples collected, 13 new wrecks located and hazardous rocks located and correctly positioned. Data is currently being analysed by the United Kingdom Hydrographic Office and it is anticipated that new charts will be prepared based on the latest discoveries.
285 United Nations. Regional Convention for the Conservation of the Red Sea, Gulf of Aden Environment; Protocol concerning regional cooperation in Combatting Pollution by Oil and other Harmful Substances in Cases of Emergency. New York: United Nations, 1983.
286 Makram A. Gerges .(2002)The Red Sea and Gulf of Aden Action Plan––Facing the challenges of an ocean gateway .Ocean& Coastal Management.Volume 45.Issues 11-12. 2002. pages 885-904
73
Assessment of the Red Sea and Gulf of Aden region
I. Freshwater shortage
Freshwater is the most precious and limited resource in many countries of the study region. Freshwater resources are classified as renewable (surface and shallow groundwater) and non-renewable (deep fossil groundwater). Rainfall is the major renewable water form in the region but most of it dose not contribute effectively to the wealth of the region as great part of it is lost by evaporation and or runoff.
Many countries of the region do not have sufficient water to meet their demand, with the result that aquifer due to overextraction is common. Moreover the scarcity of water is accompanied by deterioration in the quality of available water due to pollution and environmental degradation. Water scarcity is a major constraint, at the national level and in coasatal areas, to security and development in many parts of the region. Worsening the problem is the fact that high rates of population growth in the region are causing a continued lowering of the per capita water share and consequently increasing competition for the limited freshwater resources.
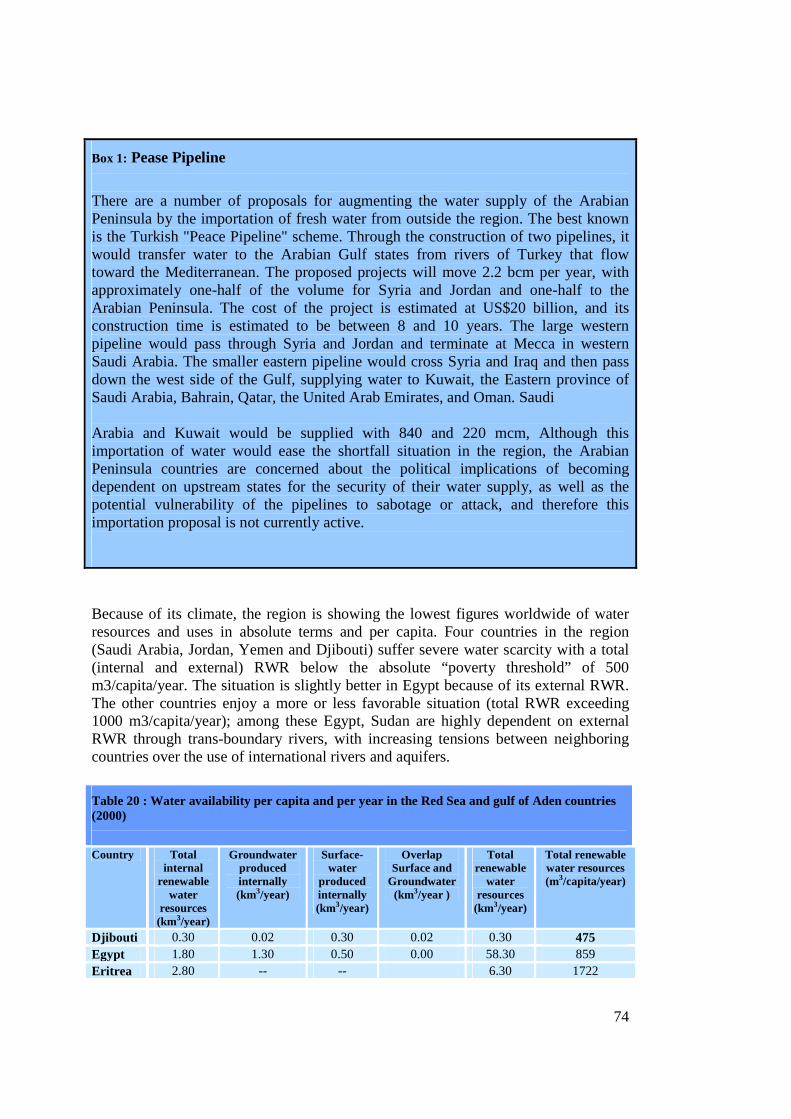
74
Box 1: Pease Pipeline
There are a number of proposals for augmenting the water supply of the Arabian Peninsula by the importation of fresh water from outside the region. The best known is the Turkish "Peace Pipeline" scheme. Through the construction of two pipelines, it would transfer water to the Arabian Gulf states from rivers of Turkey that flow toward the Mediterranean. The proposed projects will move 2.2 bcm per year, with approximately one-half of the volume for Syria and Jordan and one-half to the Arabian Peninsula. The cost of the project is estimated at US$20 billion, and its construction time is estimated to be between 8 and 10 years. The large western pipeline would pass through Syria and Jordan and terminate at Mecca in western Saudi Arabia. The smaller eastern pipeline would cross Syria and Iraq and then pass down the west side of the Gulf, supplying water to Kuwait, the Eastern province of Saudi Arabia, Bahrain, Qatar, the United Arab Emirates, and Oman. Saudi Arabia and Kuwait would be supplied with 840 and 220 mcm, Although this importation of water would ease the shortfall situation in the region, the Arabian Peninsula countries are concerned about the political implications of becoming dependent on upstream states for the security of their water supply, as well as the potential vulnerability of the pipelines to sabotage or attack, and therefore this importation proposal is not currently active.
Because of its climate, the region is showing the lowest figures worldwide of water resources and uses in absolute terms and per capita. Four countries in the region (Saudi Arabia, Jordan, Yemen and Djibouti) suffer severe water scarcity with a total (internal and external) RWR below the absolute “poverty threshold” of 500 m3/capita/year. The situation is slightly better in Egypt because of its external RWR. The other countries enjoy a more or less favorable situation (total RWR exceeding 1000 m3/capita/year); among these Egypt, Sudan are highly dependent on external RWR through trans-boundary rivers, with increasing tensions between neighboring countries over the use of international rivers and aquifers.
Table 20 : Water availability per capita and per year in the Red Sea and gulf of Aden countries (2000)
Country Total
internal renewable
water resources (km3/year)
Groundwater produced internally (km3/year)
Surface-water
produced internally (km3/year)
Overlap Surface and
Groundwater (km3/year )
Total renewable
water resources (km3/year)
Total renewable water resources (m3/capita/year)
Djibouti 0.30 0.02 0.30 0.02 0.30 475 Egypt 1.80 1.30 0.50 0.00 58.30 859 Eritrea 2.80 -- -- 6.30 1722
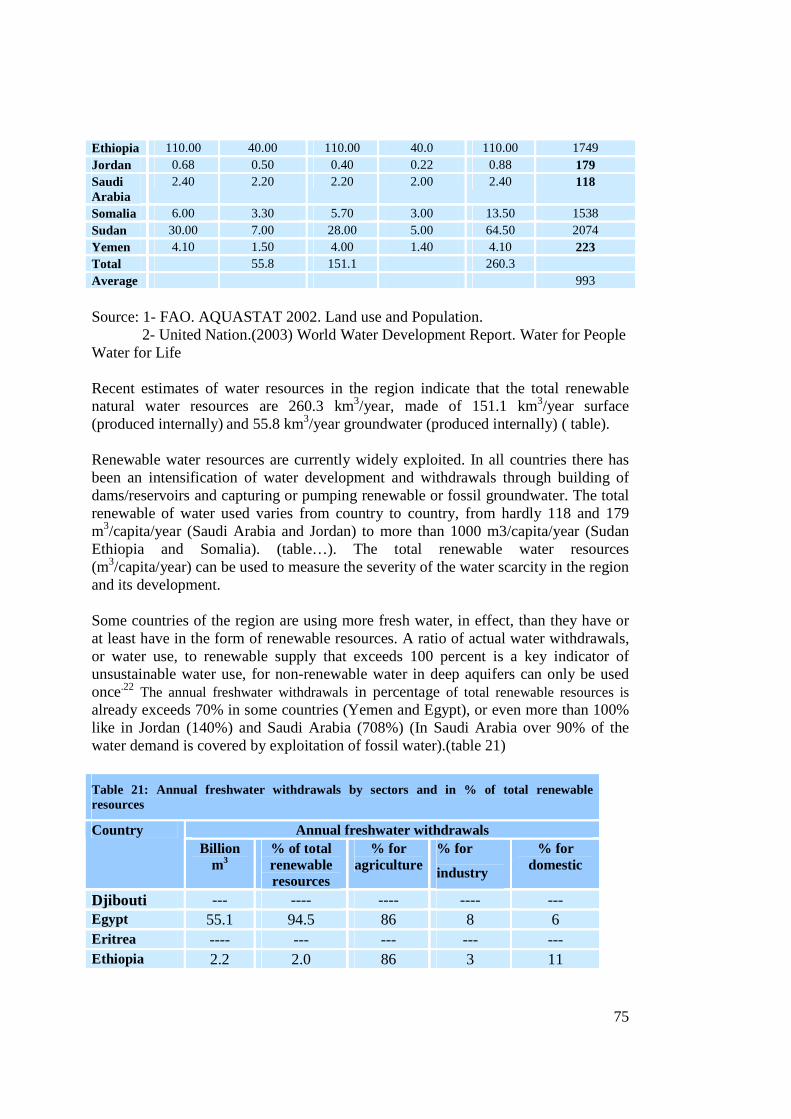
75
Ethiopia 110.00 40.00 110.00 40.0 110.00 1749 Jordan 0.68 0.50 0.40 0.22 0.88 179 Saudi Arabia
2.40 2.20 2.20 2.00 2.40 118
Somalia 6.00 3.30 5.70 3.00 13.50 1538 Sudan 30.00 7.00 28.00 5.00 64.50 2074 Yemen 4.10 1.50 4.00 1.40 4.10 223 Total 55.8 151.1 260.3 Average 993
Source: 1- FAO. AQUASTAT 2002. Land use and Population. 2- United Nation.(2003) World Water Development Report. Water for People Water for Life Recent estimates of water resources in the region indicate that the total renewable natural water resources are 260.3 km3/year, made of 151.1 km3/year surface (produced internally) and 55.8 km3/year groundwater (produced internally) ( table). Renewable water resources are currently widely exploited. In all countries there has been an intensification of water development and withdrawals through building of dams/reservoirs and capturing or pumping renewable or fossil groundwater. The total renewable of water used varies from country to country, from hardly 118 and 179 m3/capita/year (Saudi Arabia and Jordan) to more than 1000 m3/capita/year (Sudan Ethiopia and Somalia). (table…). The total renewable water resources (m3/capita/year) can be used to measure the severity of the water scarcity in the region and its development. Some countries of the region are using more fresh water, in effect, than they have or at least have in the form of renewable resources. A ratio of actual water withdrawals, or water use, to renewable supply that exceeds 100 percent is a key indicator of unsustainable water use, for non-renewable water in deep aquifers can only be used once.22 The annual freshwater withdrawals in percentage of total renewable resources is already exceeds 70% in some countries (Yemen and Egypt), or even more than 100% like in Jordan (140%) and Saudi Arabia (708%) (In Saudi Arabia over 90% of the water demand is covered by exploitation of fossil water).(table 21)
Table 21: Annual freshwater withdrawals by sectors and in % of total renewable resources
Annual freshwater withdrawals Country Billion
m3 % of total renewable resources
% for agriculture
% for
industry
% for domestic
Djibouti --- ---- ---- ---- --- Egypt 55.1 94.5 86 8 6 Eritrea ---- --- --- --- --- Ethiopia 2.2 2.0 86 3 11
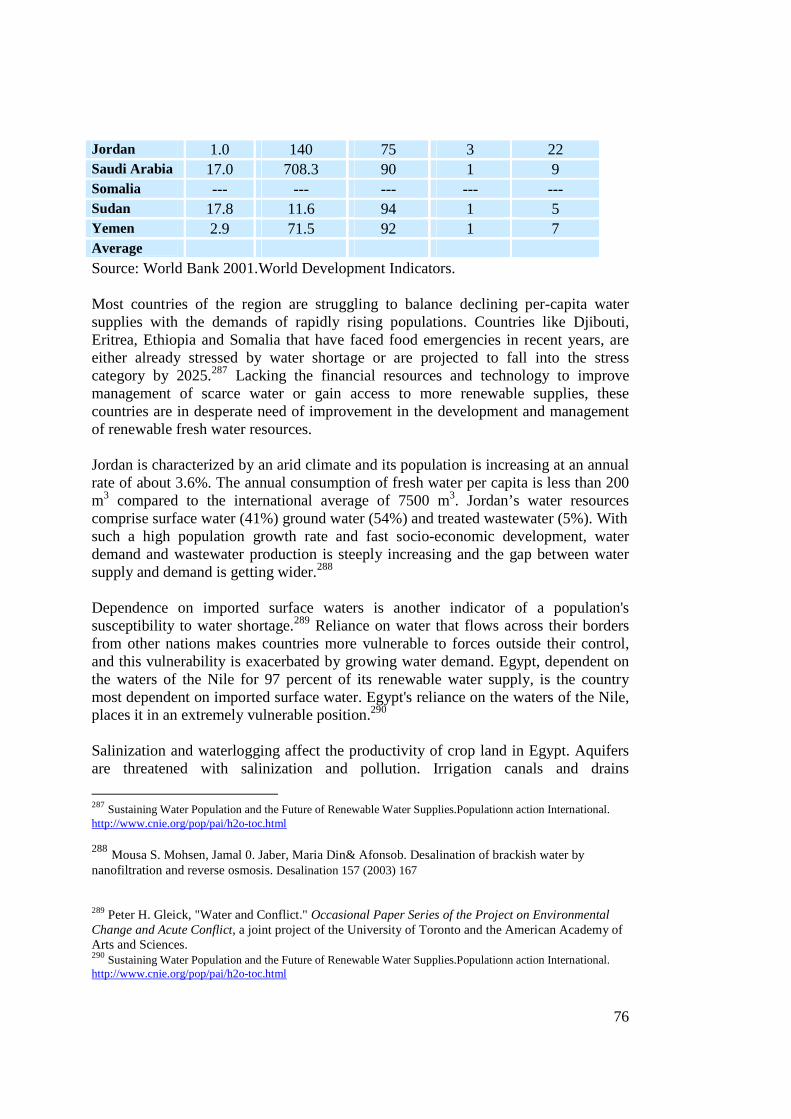
76
Jordan 1.0 140 75 3 22 Saudi Arabia 17.0 708.3 90 1 9 Somalia --- --- --- --- --- Sudan 17.8 11.6 94 1 5 Yemen 2.9 71.5 92 1 7 Average Source: World Bank 2001.World Development Indicators. Most countries of the region are struggling to balance declining per-capita water supplies with the demands of rapidly rising populations. Countries like Djibouti, Eritrea, Ethiopia and Somalia that have faced food emergencies in recent years, are either already stressed by water shortage or are projected to fall into the stress category by 2025.287 Lacking the financial resources and technology to improve management of scarce water or gain access to more renewable supplies, these countries are in desperate need of improvement in the development and management of renewable fresh water resources. Jordan is characterized by an arid climate and its population is increasing at an annual rate of about 3.6%. The annual consumption of fresh water per capita is less than 200 m3 compared to the international average of 7500 m3. Jordan’s water resources comprise surface water (41%) ground water (54%) and treated wastewater (5%). With such a high population growth rate and fast socio-economic development, water demand and wastewater production is steeply increasing and the gap between water supply and demand is getting wider.288 Dependence on imported surface waters is another indicator of a population's susceptibility to water shortage.289 Reliance on water that flows across their borders from other nations makes countries more vulnerable to forces outside their control, and this vulnerability is exacerbated by growing water demand. Egypt, dependent on the waters of the Nile for 97 percent of its renewable water supply, is the country most dependent on imported surface water. Egypt's reliance on the waters of the Nile, places it in an extremely vulnerable position.290 Salinization and waterlogging affect the productivity of crop land in Egypt. Aquifers are threatened with salinization and pollution. Irrigation canals and drains
287 Sustaining Water Population and the Future of Renewable Water Supplies.Populationn action International. http://www.cnie.org/pop/pai/h2o-toc.html 288 Mousa S. Mohsen, Jamal 0. Jaber, Maria Din& Afonsob. Desalination of brackish water by nanofiltration and reverse osmosis. Desalination 157 (2003) 167 289 Peter H. Gleick, "Water and Conflict." Occasional Paper Series of the Project on Environmental Change and Acute Conflict, a joint project of the University of Toronto and the American Academy of Arts and Sciences. 290 Sustaining Water Population and the Future of Renewable Water Supplies.Populationn action International. http://www.cnie.org/pop/pai/h2o-toc.html
77
increasingly suffer from weeds and the accumulation of pesticides. Urban areas and archaeological sites are affected by rises in water tables due to poor drainage. Industrial wastewater and urban sewage are discharged into drains with little or no treatment because of the shortage of wastewater treatment capacity (and of operation and maintenance problems in existing plants).291
Modification of stream flow
No modification of stream flow impacts in this region
Pollution of existing supplies
Ground water in the shallow aquifers in, Saudi Arabia, and Yemen is the only renewable water source in these countries. 292In south western Saudi Arabia the Cambro-Ordovician Wajid Sandstone contains reserves of 30 Bm3 of good quality fossil water about 30,000 years old. In northern Saudi Arabia the Cambro-Ordovician Saq Sandstone contains 280 Bm3 of water reserves but due to heavy exploitation for agricultural uses salinity has rapidly increased in recent years. In north-western Saudi Arabia the Ordovician-Silurian Tabuk Formation contains several aquifer beds some of which show evidence of the late Ordovician glaciation. The water supply for the city of Riyadh is obtained from the Triassic Minjur Formation, which is unusual in receiving some recharge due to hydraulic connection with aquifers both above and below.293
J. W. A. Foppen ( 2002) showed in his results that groundwater in the urban area in Sana'a (the capital of the Yemen Arab Republic) was characterized by high concentrations of almost all major cations and anions due to the continuous infiltration of wastewater into the aquifers via cesspits. The dominant water type appeared to be CaCl2. The Cl--concentration ranged from 3 to 10 mmol/l and NO3
--concentration ranged from 1 to 3 mmol/l while NH4
+ was absent in all samples. It is concluded that cation exchange has taken place. Ca2+ in groundwater has been enriched, while Na+, K+ and NH4
+ have been depleted. Groundwater affected by
291 Alain Marcoux. Water Resources Issues in the Arab States Region. from the paper "Population Change-Natural Resources-Environment Linkages in the Arab States Region" (FAO, April 1996) 292 UNEP(1997). Global Environment Outlook -1. Chapter 2.West Asia. Major Environmental Concerns.
293 A.S. Alsharhan, Z.A. Rizk, A.E.M. Nairn, D.W. Bakhit and S.A. Alhajari (2001). Hydrogeology of an arid region: the Arabian Gulf and adjoining areas. New York 2001. 331 pp.
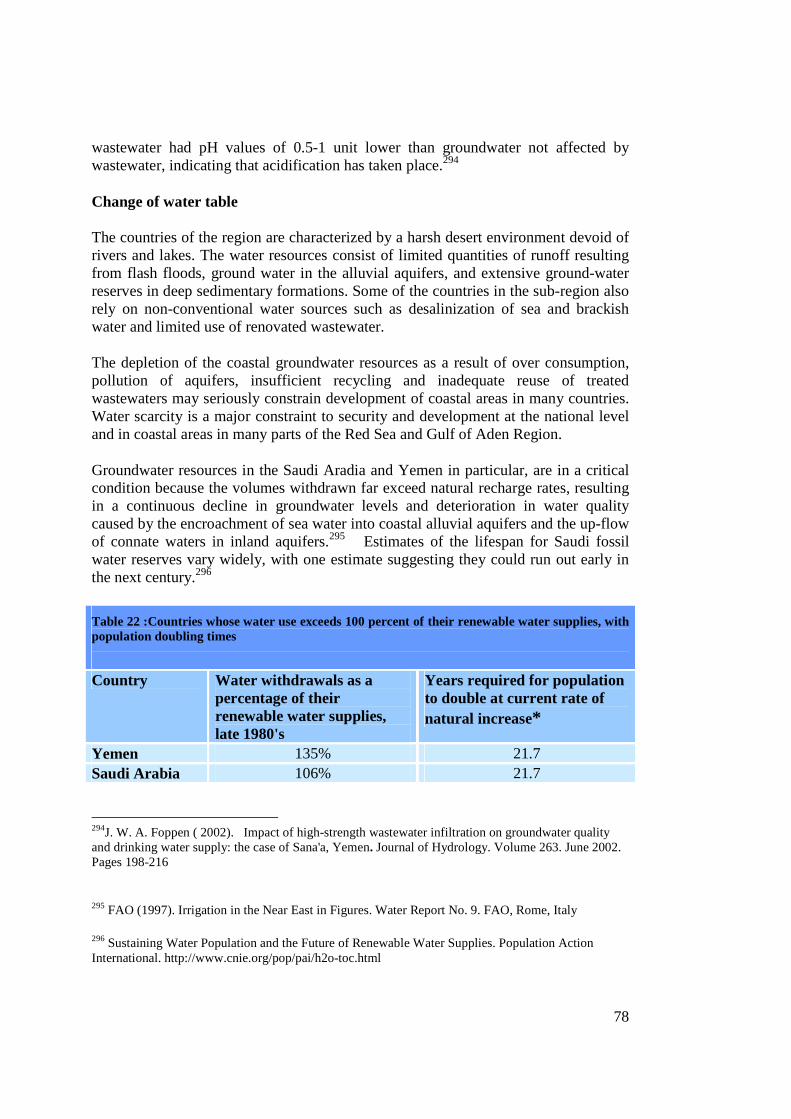
78
wastewater had pH values of 0.5-1 unit lower than groundwater not affected by wastewater, indicating that acidification has taken place.294
Change of water table
The countries of the region are characterized by a harsh desert environment devoid of rivers and lakes. The water resources consist of limited quantities of runoff resulting from flash floods, ground water in the alluvial aquifers, and extensive ground-water reserves in deep sedimentary formations. Some of the countries in the sub-region also rely on non-conventional water sources such as desalinization of sea and brackish water and limited use of renovated wastewater.
The depletion of the coastal groundwater resources as a result of over consumption, pollution of aquifers, insufficient recycling and inadequate reuse of treated wastewaters may seriously constrain development of coastal areas in many countries. Water scarcity is a major constraint to security and development at the national level and in coastal areas in many parts of the Red Sea and Gulf of Aden Region.
Groundwater resources in the Saudi Aradia and Yemen in particular, are in a critical condition because the volumes withdrawn far exceed natural recharge rates, resulting in a continuous decline in groundwater levels and deterioration in water quality caused by the encroachment of sea water into coastal alluvial aquifers and the up-flow of connate waters in inland aquifers.295 Estimates of the lifespan for Saudi fossil water reserves vary widely, with one estimate suggesting they could run out early in the next century.296
Table 22 :Countries whose water use exceeds 100 percent of their renewable water supplies, with population doubling times
Country Water withdrawals as a
percentage of their renewable water supplies, late 1980's
Years required for population to double at current rate of natural increase*
Yemen 135% 21.7 Saudi Arabia 106% 21.7
294J. W. A. Foppen ( 2002). Impact of high-strength wastewater infiltration on groundwater quality and drinking water supply: the case of Sana'a, Yemen. Journal of Hydrology. Volume 263. June 2002. Pages 198-216
295 FAO (1997). Irrigation in the Near East in Figures. Water Report No. 9. FAO, Rome, Italy
296 Sustaining Water Population and the Future of Renewable Water Supplies. Population Action International. http://www.cnie.org/pop/pai/h2o-toc.html
79
*Excludes rates of migratory flows, which are significant in some of these countries
Sources: Adapted from Peter H. Gleick. (1993)297 "Water and Conflict," Population Reference Bureau, 1993 World Population Data Sheet.
Some countries of the region such as Saudi Arabia and Jordan have limited renewable freshwater supplies, which have been nearly fully developed, and the only dependable source is fossil groundwater reserves. In some regions, depletion of these nonrenewable groundwater resources is taking place at an alarming rate, owing to over-pumping in order to meet agricultural requirements. The water table at Sana'a, capital of Yemen, has dropped seriously as a result of heavy pumping (Environmental Protection Council, Yemen, 1995)298 For Jordan, whose population more than doubled from 1.5 million in 1955 to 4 million in 1990, increasing scarcity means deteriorating water quality and growing reliance on groundwater when water tables are dropping rapidly.299
The intensive use of groundwater resources from shallow and deep aquifers to meet rising demand in the Saudi Arabia has led to further exploitation of water resources in excess of natural renew ability and has contributed towards water-quality deterioration, especially in the coastal zones. This has compelled many countries in this region, with the exception of Yemen, to invest in the construction of sea-water desalination plants. By necessity, desalination has become a major component of the water-supply system in Saudi Arabia for providing water to satisfy domestic requirements.300 Competition among sectors over utilization of available groundwater sources in some of the countries has created water deficits. Rising demand is not only placing pressure on water resources, especially the most easily accessible sources, but also brings about an entirely new progression of environmental concerns and their associated development costs.
A comparison between the annual groundwater recharge and groundwater abstraction rates, which are used mainly to fulfil the agricultural sector demands, indicates that most of the countries' groundwater resources are over-drafted and are being depleted. In other words, water abstracted is being taken from groundwater storage, with no significant recharge for the amounts withdrawn. This has resulted in a continuous decline in groundwater levels and quality deterioration in most of the countries due to seawater and connate waters encroachment.
297 Peter H. Gleick.(1993). "Water and Conflict," Population Reference Bureau, 1993 World Population Data Sheet.
298 Environmental Protection Council, Yemen (1995). The Status of the Environment in the Republic of Yemen (in Arabic) 299 Sustaining Water Population and the Future of Renewable Water Supplies. Population Action International. http://www.cnie.org/pop/pai/h2o-toc.html 300 Munther J. Haddadin. (2002).Water issues in the Middle East challenges and opportunities. Water policy. Vol. 4. Issue 3.pages 205-222. 2002
80
The agriculture still consumes the largest proportion of the freshwater in this region. The proportion of water utilized for domestic and industrial use is much smaller. In Saudi Arabia, water use for agriculture rose from 2 BCM in 1980 to 14.58 BCM in 1995.In the year 2000 it is expected to reach 17.9 BCM. 301 This has caused a depletion of about 35 per cent of the non-renewable groundwater resources estimated at 500 BCM.302 Underground water withdrawal on a large scale is being done in Saudi Arabia for domestic and agricultural use. Nearly 2,000 billion cubic meters of water are deposited in the aquifers beneath Saudi Arabia which provides 88 percent of the country's water needs. In early 1992, Kingdom payments totalling $2.1 billion for 1991's record four million ton wheat production, which he could have purchased from the global market for one fourth of that price. But, this remarkable increase of agricultural production threatens to drain the country's underground water resources completely in 20 or 30 years.303
The Groundwater resources in the region as shown in the table 11 in particular, are in a critical condition because the volumes withdrawn far exceed natural recharge rates, resulting in a continuous decline in groundwater levels and deterioration in water quality caused by the encroachment of sea water into coastal alluvial aquifers and the up-flow of connate waters in inland aquifers. The water withdrawals in Saudi Arabia and Yemen as a percentage of their renewable water supplies are exceed more than 100 percent their renewable water supplies.
Groundwater reserves in both renewable shallow and non-renewable deep aquifers have been exploited to meet domestic and agricultural water requirements. Saudi Arabia have been exploiting their non-renewable groundwater, while other countries like Yemen are in the process of utilizing their fossil water resources that are over 20,000 years old to meet rising water demand in agricultural sector. 304 Using MOP’s (Ministry of Planning) 1997 estimate of Saudi overall water uses, 500 billion m3 of non-renewable water reserves could be depleted within 33 years. Using MAW’s data will extend the expected period to 38 years.305
The current level of groundwater abstraction greatly exceeds recharge in most of the aquifers, specially in northern areas of Yemen and the intermontane plains, including 301 Al-Turbak, A.S. (1999).Future water supply and demand predictions in Saudi Arabia. Water in the gulf: Challenges in the 21st Century. WSTA Fourth Gulf Conference, Manama, 13-17 February 1999 pp. 93-101 302 ESCWA. (2001). Development of Freshwater Resources In the Rural areas of The ESCWA Region Using Non- conventional Techniques. United Nation. New York. 2001. 303 Ashok Swain. A New Challenge: Water Scarcity In The Arab World Precious Water: Growing Demand And Increasing Scarcity. Source: Arab Studies Quarterly, Winter 98, Vol. 20 Issue 1, p1 304 ESCWA (2003). Updating the Assessment of Water Resources in ESCWA member Countries. 305 Elhadj Elie, (2003), Camels Don’t Fly. Deserts Don’t Bloom: An Assessment of Saudi Arabia’s Experiment in Desert Agriculture. http://www2.soas.ac.uk/Geography/WaterIssues/OccasionalPapers/AcrobatFiles/Occ48.pdf
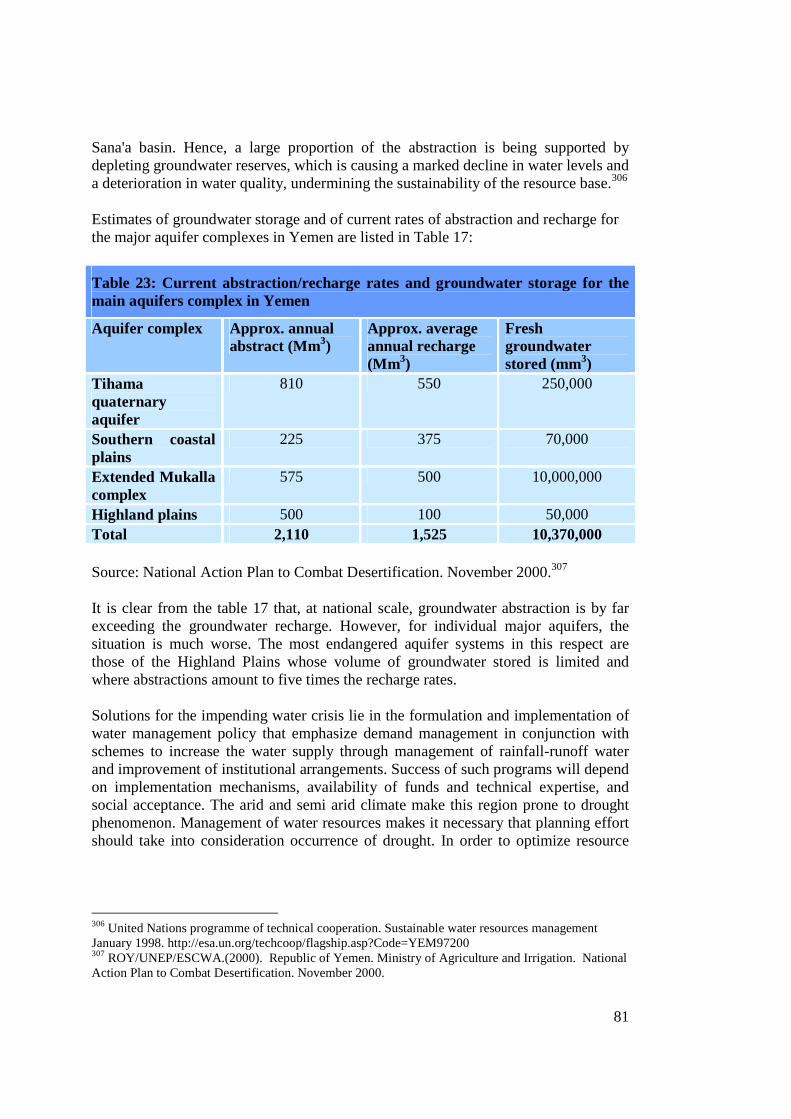
81
Sana'a basin. Hence, a large proportion of the abstraction is being supported by depleting groundwater reserves, which is causing a marked decline in water levels and a deterioration in water quality, undermining the sustainability of the resource base.306
Estimates of groundwater storage and of current rates of abstraction and recharge for the major aquifer complexes in Yemen are listed in Table 17:
Table 23: Current abstraction/recharge rates and groundwater storage for the main aquifers complex in Yemen
Aquifer complex Approx. annual abstract (Mm3)
Approx. average annual recharge (Mm3)
Fresh groundwater stored (mm3)
Tihama quaternary aquifer
810 550 250,000
Southern coastal plains
225 375 70,000
Extended Mukalla complex
575 500 10,000,000
Highland plains 500 100 50,000 Total 2,110 1,525 10,370,000
Source: National Action Plan to Combat Desertification. November 2000.307
It is clear from the table 17 that, at national scale, groundwater abstraction is by far exceeding the groundwater recharge. However, for individual major aquifers, the situation is much worse. The most endangered aquifer systems in this respect are those of the Highland Plains whose volume of groundwater stored is limited and where abstractions amount to five times the recharge rates.
Solutions for the impending water crisis lie in the formulation and implementation of water management policy that emphasize demand management in conjunction with schemes to increase the water supply through management of rainfall-runoff water and improvement of institutional arrangements. Success of such programs will depend on implementation mechanisms, availability of funds and technical expertise, and social acceptance. The arid and semi arid climate make this region prone to drought phenomenon. Management of water resources makes it necessary that planning effort should take into consideration occurrence of drought. In order to optimize resource
306 United Nations programme of technical cooperation. Sustainable water resources management January 1998. http://esa.un.org/techcoop/flagship.asp?Code=YEM97200 307 ROY/UNEP/ESCWA.(2000). Republic of Yemen. Ministry of Agriculture and Irrigation. National Action Plan to Combat Desertification. November 2000.
82
utilization, water policy should always account for uncertainty of rainfall runoff process.308
Socio- economic impacts
1. Many countries in the region are very vulnerable to the drying up of the aquifers in the near future. This creates a highly uncertain future for the people who are dependent on the waters of these underground sources and also the economy of these countries.
2. Freshwater shortage in the region can influence on many economical activities- Agriculture and Industrial- in the same effect on the municipal water supply.
3. Groundwater depletion in terms of quantity and quality resulting in increasing the dependence on unconventional resources such as desalination.
4. There is expected to be increased costs of alternative water supplies (desalination water) and deepening wells and pumping.
5. Over exploitation of groundwater can potentially bring large scale human suffering and migration.
6. Salt water intrusion due to extensive groundwater withdrawal has caused salinisation of coastal agricultural lands, resulting in the reduction of agricultural production and the complete loss of some arable land.
7. Shortage of rainfall can result in major impacts on agriculture, city water supplies, tourism and recreation, energy (power) production, aquifers navigation, and the environment.
8.
Health impacts
1. Drinking and bathing in polluted water supplies are among the most common routes for the spread of infectious disease. Most of those affected are poor and almost all live in poor countries like Somalia, Eritrea and Ethiopia.
2. A drop in water level in the aquifers could adversely affect the quality of
water by increasing the concentrations of sewage waste and industrial effluents, thereby increasing the potential for the outbreak of diseases and reducing the quality and quantity of fresh water available for domestic use.
3. Decreases in water availability and consequently food production in this
region would lead to indirect impacts on human health associated with nutritional and hygiene issues.
308 Mohamed Abdulrazzak (2000) Water Management Experiences In The Arabian Peninsula. http://www.regione.sardegna.it/confsicita/abdulrazzak.html
83
4. With many water-short in the region, households forced to rely on contaminated water supplies, waterborne diseases like diarrhoea and cholera are on the rise.
5. The most health problem related to water is the occurrence of cholera
outbreaks in region. “Since 1994, outbreaks of cholera cases have been recorded annually in Mogadishu and many other parts of Somalia. The illness was endemic to Mogadishu”309
Pollution
The major threats to the marine environment of the Red Sea and Gulf of Aden are related to land-based activities. These include urbanization and coastal development (for example, dredge and fill operations), industries including power and desalination plants and refineries, recreation and tourism, waste water treatment facilities, power plants, coastal mining and quarrying activities, oil bunkering
Because of rapid population growth and urbanization and the lack of adequate treatment and disposal facilities for municipal waste, poorly treated or untreated sewage dumped in the coastal areas and into sea in and around the main cities. Therefore Sewage is considered an important environmental threat throughout the region.
Urban expansion, tourism and industrial developments are one of the main sources of environmental deterioration in the Red Sea. Much of the rapid expansion of urban centers has been achieved through the extensive use of desalinated water to meet demands of the population and industry.
There are quite considerable agricultural activities in the region. Fertilizer, pesticide, insecticides and herbicides residues are discharge into the Red Sea as s result of agricultural run-off.
Tourist developments on the coast of the Red Sea and its two gulfs have required significant dredging and filling operations, to develop huge marine structures, with artificial lagoons and sandy beaches. The dredging and filling operations have caused considerable damage to marine life.
Environmental impacts
Microbiological
During the period 1990-2000 the total population increased by (61.3%) (About 25.4 millions). The population growth of the 1990’s has meant that an estimated
309 Cholera on the rise in Mogadishu. Integrated Regional Information Networks. 14 Apr 2004. http://www.reliefweb.int/w/rwb.nsf/0/4b23d6cbef03d08785256e7600572a81?OpenDocument
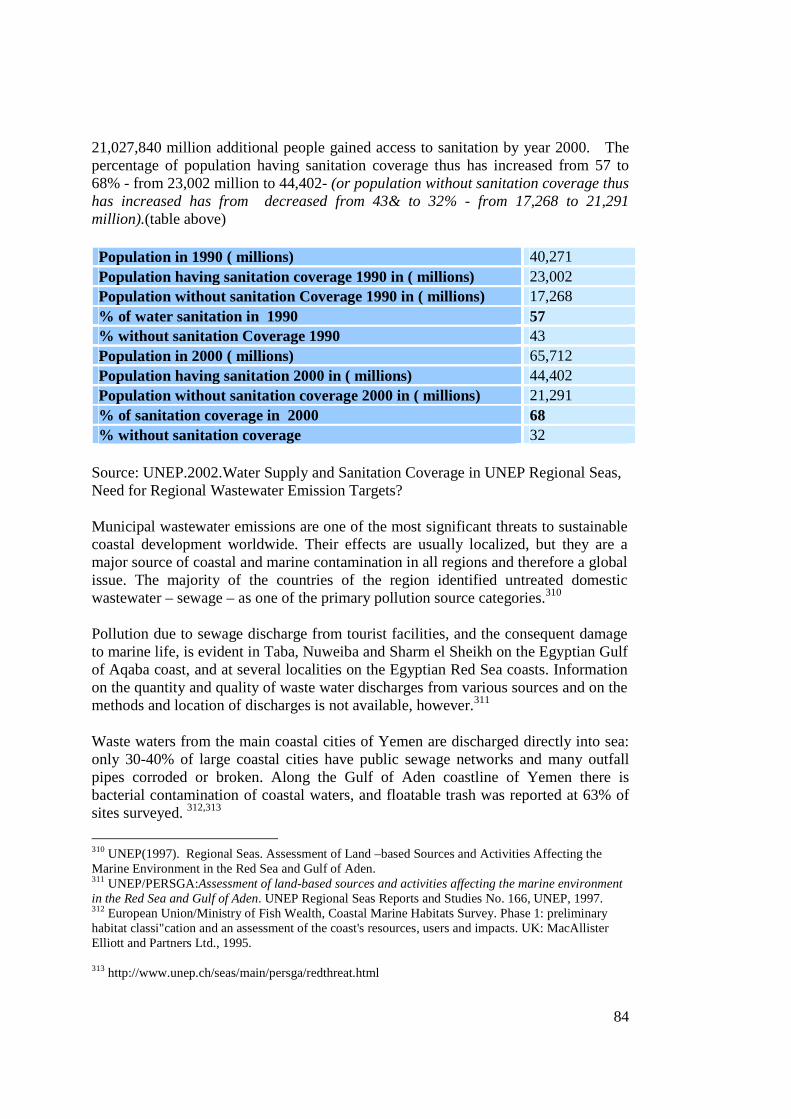
84
21,027,840 million additional people gained access to sanitation by year 2000. The percentage of population having sanitation coverage thus has increased from 57 to 68% - from 23,002 million to 44,402- (or population without sanitation coverage thus has increased has from decreased from 43& to 32% - from 17,268 to 21,291 million).(table above) Population in 1990 ( millions) 40,271 Population having sanitation coverage 1990 in ( millions) 23,002 Population without sanitation Coverage 1990 in ( millions) 17,268 % of water sanitation in 1990 57 % without sanitation Coverage 1990 43 Population in 2000 ( millions) 65,712 Population having sanitation 2000 in ( millions) 44,402 Population without sanitation coverage 2000 in ( millions) 21,291 % of sanitation coverage in 2000 68 % without sanitation coverage 32
Source: UNEP.2002.Water Supply and Sanitation Coverage in UNEP Regional Seas, Need for Regional Wastewater Emission Targets?
Municipal wastewater emissions are one of the most significant threats to sustainable coastal development worldwide. Their effects are usually localized, but they are a major source of coastal and marine contamination in all regions and therefore a global issue. The majority of the countries of the region identified untreated domestic wastewater – sewage – as one of the primary pollution source categories.310
Pollution due to sewage discharge from tourist facilities, and the consequent damage to marine life, is evident in Taba, Nuweiba and Sharm el Sheikh on the Egyptian Gulf of Aqaba coast, and at several localities on the Egyptian Red Sea coasts. Information on the quantity and quality of waste water discharges from various sources and on the methods and location of discharges is not available, however.311
Waste waters from the main coastal cities of Yemen are discharged directly into sea: only 30-40% of large coastal cities have public sewage networks and many outfall pipes corroded or broken. Along the Gulf of Aden coastline of Yemen there is bacterial contamination of coastal waters, and floatable trash was reported at 63% of sites surveyed. 312,313
310 UNEP(1997). Regional Seas. Assessment of Land –based Sources and Activities Affecting the Marine Environment in the Red Sea and Gulf of Aden. 311 UNEP/PERSGA:Assessment of land-based sources and activities affecting the marine environment in the Red Sea and Gulf of Aden. UNEP Regional Seas Reports and Studies No. 166, UNEP, 1997. 312 European Union/Ministry of Fish Wealth, Coastal Marine Habitats Survey. Phase 1: preliminary habitat classi"cation and an assessment of the coast's resources, users and impacts. UK: MacAllister Elliott and Partners Ltd., 1995. 313 http://www.unep.ch/seas/main/persga/redthreat.html
85
Discharge of sewage to the Gulf of Suez is estimated at 80,000 cubic meters per day. The effluent consists of domestic waste water as well as waste water used for washing streets, workshops, petrol stations, certain factories and waste from ships waiting to pass along the Canal.314 In addition, dumping of vessel sewage and solid waste occurs in Port Sudan harbor, the ports of Djibouti and Yemen, and has led to large amounts of waste on the beaches of the Gulfs of Suez and Aqaba.315 Awad el Karim indicated that all water sources in Port Sudan and South Kordofan Province were invariably contaminated with coliforms. Tap and zeer (home pots) water in Port Sudan was also contaminated with coliforms. The content of suspended and dissolved solids and turbidity of hafirs water was exceptionally high, which warrants proper protection and water treatment before distribution to the public.316 In Djibouti and Somalia, sewage treatment plants are few in number and are, generally, poorly maintained (Pilcher & Alsuhaibany 2000).317 But a large volume of solid and liquid waste are therefore disposed of at Red sea or are disposed of in an unsatisfactory manner and end up by being washed or blown out to sea, where they pose a threat to wildlife and human health.318 Eutrophication in the Red Sea Zakaria A. Zakaria (2003) reported that, in the southern Red Sea a secondary peak in primary production and phytoplankton standing stock was observed in winter. The effect of summer eutrophication on the plankton biota may, however, be confined to the coastal and the northern and southern ends of the Red Sea. The vast oceanic region between 27°N and 18°N is less affected by seasonal changes. Indeed the most substantial import of phosphate into the Red Sea occurs by subsurface inflow of Gulf of Aden water from July to September. The mass development of blue-green algae
314 Ahmed Barrania. Pollution of the Fisheries in the Gulf of Suez and the Socio- Economic Impacts Al Sambouk, No. 8, October 1998, page 8 315 W. Gladstone, N. Tawfq, D. Nasr. Andersen, C. Cheung, H. Drammeh, F. Krupp, S. Lintner Sustainable use of renewable resources and conservation in the Red Sea and Gulf of Aden: issues, needs and strategic actions. Ocean & Coastal Management. 42. (1999) 671-697
316 Awad el Karim MA, el Hassan BM, Hussein KK.Social and public health implication of water supply in arid zones in the Sudan. Soc Sci Med. 1985;20(4):393-8.
317 Pilcher, N.,& Alsuhaibany, A. (2000).Regional Status Of Coral Reefs In The Red Sea And Gulf Of Aden. Pp 35–54 In Wilkinson, C. Status Of Coral Reefs Of The World: 2000.Australian Institute Of Marine Science And Global Coral Reef Monitoring Network,Townsville
318 UNEP.Africa Environment Outlook. Past, present and future perspectives

86
provides further evidence of depletion of plant nutrients in oceanic waters during the summer season.319
Eutrophication problems related to nutrient rich sewage water from hotel gardens, as well as desalinization effluents pumped onto reefs from hotels in Quseir and threaten reef health.320
The discharge of municipal wastewaters continues to present significant management problem in the Region. Despite the progress made in some countries to deal with the problem, some areas, particularly on the west coast of the Red Sea south of Suez still receive a considerable load of nutrients and BOD discharges from domestic sewage. This contributes to eutrophication of the coastal waters around selected population centers, major ports and tourist facilities.321
Effects of nutrients on the Yemeni marine environment are neither well unknown nor well documented. Some national specialists consider eutrophication - as a natural phenomenon- is the source of the sever fish mortality event occurred in February 2002 in the western Gulf of Aden and Arabian Sea regions, but others believe it was a result of human activities. In Yemen the agriculture and sewage could be sources of nutrients contamination through the use of substances increasing nutrients in the sea. Importantly, most coastal areas of Yemen are not affected by the eutrophication. The discharge of partially treated municipal wastewater poses a significant management problem as the excessive nutrient loads, especially phosphorus and nitrogen compounds, cause significant ecological changes. Results of coral reef surveys in Yanbu region in Yemen had revealed a low coral cover and high algal growth, particularly at the Gap station in the Port Barrier Reef. It also had reduced the number of associated fish species proportionately, so that when the coral reef communities were damaged, one of the first fish populations affected by the disturbances was the coral feeder. For this reason, butter-flyfish is a useful indicator of environmental quality. 322 Pollution loads discharged to the Red Sea through
319 Zekeria Abdulkerim Zekeria(2003). Butterflyfishes of the Southern Red Sea: Ecology and Population Dynamics. Chapter 1 General Introduction and Outline of the Thesis Rijksuniversiteit Groningen. Netherlands. 320 http://www.ogp.noaa.gov/mpe/paleo/coral/sor/sor_mideast.html
321 Makram A. Gerges(2002). The Red Sea and Gulf of Aden Action Plan-Facing the challenges of an ocean gateway . Ocean & Coastal Management. Volume.45, Issues 11-12. 2002.pages 885-903.
322 Joseph Sebastian Paimpillil, Jamie C.Se & Munir Dahalawi Impact of Treated Industrial Effluents on Yanbu (Red Sea) Coral Reefs and the Efficiency of Coastal Ecosystem Conservation. Littoral 2002, The Changing Coast. EUROCOAST / EUCC, Porto – Portugal Ed. EUROCOAST – Portugal.
87
municipal waste treatment facilities, according to a 1996 study, reached 2,763 tonnes per year of BOD and nil in Yanbu. 323 In the upper Gulf of Aqaba sewage discharge has caused increased algae growth in shallow coastal waters. The Aqaba-Nuweiba ferry, carrying about 1.2 m passengers per annum discharges raw sewage into the Gulf of Aqaba. Near Djibouti city there is discharge of untreated/partially treated sewage from households, small industry, hospitals and sewage from septic tanks is pumped directly into the sea. Similarly, in Somalia untreated domestic sewage adjacent to major population centers is discharged into coastal waters.
Chemical
a. Industrial facilities
Industrial located along the coast usually discharge their effluents directly into the sea The combination of a number of activities in a single area is associated with a range of issues, for example in the South Coast Industrial Zone at Aqaba (Jordan) there is risk of gypsum runoff, discharge of chlorinated cooling water from fertilizer factory, spillages during loading and unloading of ships (e.g. phosphate) and disposal of waste oil from trucks in the intertidal zone. Particulate emissions from a cement factory at Ras Bairidi (Saudi Arabia) create hazards for nesting turtles and emerging hatchlings. Spillages of phosphate, manganese, and bauxite during ship loading are major sources of pollution along the Egyptian Red Sea coast. In many cases major industrial facilities, both estates and individual plants, have been sited without regard to their potential environmental impact on groundwater quality, air quality and coastal environments.324 In the same time there is unregulated discharge of waste oil into Port Sudan harbour, and discharge of urea from fertilizer plants at Suez (Egypt) The exportation of phosphate from Jordanian industries is a major type of pollution from the port of Aqaba. Approximately one percent of phosphate is lost into the atmosphere during the loading process. The Gulf settles in the Gulf of Aqaba, increasing the water born phosphate concentration. The increase of phosphate in the sea leads to several possible consequences, the most serious being "phosphate poisoning." Phosphate dust can bring about the death of corals through stress caused by reduced light intensity and increased sediment load325
The study on the concentrations of heavy metal pollution in the Egyptian Red Sea, over 50 years period (1934–1984), has shown that the concentrations of most of the heavy metals has increased, due to natural pollution from hot brine pools or due to 323 UNEP/PERSGA:Assessment of land-based sources and activities affecting the marine environment in the Red Sea and Gulf of Aden. UNEP Regional Seas Reports and Studies No. 166, UNEP, 1997. 324 W. Gladstone, N. Tawfq, D. Nasr. Andersen, C. Cheung, H. Drammeh, F. Krupp, S. Lintner Sustainable use of renewable resources and conservation in the Red Sea and Gulf of Aden: issues, needs and strategic actions. Ocean & Coastal Management. 42. (1999) 671-697 325 http://www.american.edu/projects/mandala/TED/aqaba.htm
88
man-made pollution from oil, heavy metal mining, discharge of domestic industrial wastes and phosphate mining and transportation along the Red Sea coastal areas (Rifaat G. M. Hanna 1992). 326
It is estimated that the fertilizer industry discharges up to 10,000 liters of wastewater in Gulf of Suez each day, water contaminated with high levels of phosphates and other chemicals. An increase in phosphate concentrations may lead to an excessive growth of algae and seaweed, an ‘algal bloom’. Pollution from this mentioned sources will undoubtedly continue to cause quantitative and qualitative changes in the living organisms (plankton, fish and other marine species) 327 On the Red Sea coast, there are three main centers for phosphate ore mining: Aqaba (Jordan) Safaga and Quseir (Egypt) and three shipping harbors.328 Mining of the Red Sea coastal phosphorites began in 1910, for export to the Far East. The phosphate deposits in the Quseir–Safaga district of the Red Sea coast are mined at many localities in the Quseir group of mines (Hamadat, Atshan, Duwi, Anz, Abu Tundub, Hamrawein), and at Safaga group of mines (Um El-Howeitat, Gasus, Wasif, Mohamed Rabah). Phosphate ore dust spilled over into the Sea during shipping is considered as a continuous source for contaminating the Red Sea coastal environment (IOC, 1997).329 Tone pf phosphate ore dust spill over into the sea during shipping. Although the ore is insoluble, phosphate contamination is believed to affect reproduction and the rate of calcification in corals.330 The desalination plans in the Red Sea is probably very susceptible to disturbances and the accumulation of harmful materials could have negative consequences for this unique environment. In this context, a daily discharge of 2.7 t chlorine and 36 kg copper will not produce measurable effects in the Red Sea, but local effects may be high. This is especially true for areas of high installed capacity, and it should be noted that 98% of the calculated chlorine and copper loads are discharged by five urban areas.331 326Rifaat G. M. Hanna, 1992. The level of heavy metals in the Red Sea after 50 years. Science of the total environment 125, pp. 417–448. 327 Ahmed Barrania. Pollution of the Fisheries in the Gulf of Suez and the Socio- Economic Impacts Al Sambouk, No. 8,page 8. October 1998. http://www.unep.ch/seas/main/persga/samb8.pdf
328 Regional Blueprint And Pilot Projects For The Red Sea. http://ioc.unesco.org/goos/HOTO4/Hoto4_a12.htm
329 Intergovernmental Oceanographic Commission (of UNESCO), 1997. Regional blueprint and pilot projects for the Red Sea, Fourth Session of the GOOS Health of the Oceans Panel, the National University of Singapore, 13–17 October 1997. (http://ioc.unesco.org/ goos/hoto4_toc.htm).
330 Regional Blueprint And Pilot Projects For The Red Sea. http://ioc.unesco.org/goos/HOTO4/Hoto4_a12.htm
331 Thomas Hoepner, Sabine Lattemann. Chemical impacts from seawater desalination plants - a case
89
Erling Povlesen et.al. identified a number of pollution "hotspots" where the sediments were SuezBay Which was polluted by Heavy metals (Copper, mercury, lead, zinc) on the northernmost site), PAH, Aliphatic hydrocarbons, Ain Sukhna was polluted by DDT, Aldrin, and aliphatic hydrocarbons, Ras Abu Darag was polluted by DDT, PAH, aliphatic hydrocarbons, Ras Gharib was polluted by Cadmium, DDT, HCH, Dieldrin, Aldrin, PAH, aliphatic hydrocarbons, Ras Shukeir was polluted by Cadmium, DDT, HCH, Dieldrin, Aldrin, PAH, aliphatic hydrocarbons, Ras El Sudr was polluted by HCH, PAH, Abu Rude by PAH, Abu Zenima by Dieldrin, aliphatic hydrocarbons and El: Tur was polluted by Dieldrin. The sources of PAH and aliphatic hydrocarbons on the sites are the oil production and transport activities in the areas.332
There is an indication of the radiological impacts of the oil industries in the Northern region of the Red Sea coast and phosphate mining in Safaga–Qusier region that need more detailed investigation on the pollution sources and the environmental distribution pattern of different pollutants.333
Agriculture There are quite considerable agricultural activities in Suze Gulf. Fertilizer and pesticide residues are discharged into the Gulf as a result of agricultural run-off. The issue of persistent organic pollutants is of particular importance because of the substantial use of pesticides, insecticides, and herbicides for agricultural purposes. As mentioned before,.334 In Yemen the use of fertilizers and pesticides to increase agricultural production is widespread throughout the country. These chemicals are introduced into the marine environment by the flow of agricultural run-off and drainage and, to a lesser extent, by atmospheric depositions.335
study of the northern Red Sea. Desalination 152 (2002) 133-140 332 Erling Povlesen, Alshabrawy M. M., Mohammed A. Shindy., Ahmed Abu El-Seoud Heavy Metals and Hazardous Organic Pollutants in Sediment and Mussels in the Gulf of Suez, 1999 and 2001. Retrieved from : http://www.eeaa.gov.eg/English/main/Env2003/Day2/Solidwaste/presentationpovlesen.pdf. accessed at 2005.01.21
333 M. H. El Mamoney and Ashraf E. M. Khater .Environmental characterization and radio-ecological impacts of non-nuclear industries on the Red Sea coast. Jour. Of Environmental Radioactivity vol. 73 .2004.pages 151-168
334UNEP( 1997). Assessment of Land –based Sources and activities affecting the manrine Environment in the Red Sea and Gulf of Aden. 335 UNEP( 1997). Assessment of Land –based Sources and activities affecting the manrine Environment in the Red Sea and Gulf of Aden.
90
Every year a large quantities of insecticides are being sprayed along most of the coast in Egypt. Sometimes untested chemicals are used without any follow-up to observe possible residues or environmental impact. This is a serious issue that needs urgent study.336 Several types of chlorinated and organo-phosphorus pesticides are used extensively on farms and plantations. The agricultural drainage waters, which may be presumed to contain high concentrations of pesticides, find their way to coastal waters via both rivers and land run-off.337 This situation is indeed a global concern. Agriculture appears not to be causing one of the major coastal environmental problems in the region, but further studies are needed.
Suspended solids
No evidence ……
Solid wastes
The management of solid waste from household, commercial, industrial and construction activities is a major problem for coastal urban areas, industrial facilities and ports in the region. It is also an increasing problem in the smaller settlements along the coast which often lack formal systems for waste collection and disposal. Shoreline and sea dumping of solid waste is occurring at Port Sudan, Djibouti city, Somalia (at Bosaso, Berbera, Sailac). In the Gulf of Aqaba beaches and coral reefs are heavily impacted from solid waste from ships' crews, ferry passengers, beach vacationers and local residents.338
Solid waste is considered a particular problem in Jordan. The beaches and near shore reef and sea grass areas of Jordan's Gulf of Aqaba are heavily polluted by discarded plastic and other refuse materials.339
336 PERSGA 2001. Strategic Action Programme for the Red Sea and Gulf of Aden . Country Reports 337 UNEP( 1997). Assessment of Land –based Sources and activities affecting the manrine Environment in the Red Sea and Gulf of Aden. 338 W. Gladstone, N. Tawfq, D. Nasr. Andersen, C. Cheung, H. Drammeh, F. Krupp, S. Lintner Sustainable use of renewable resources and conservation in the Red Sea and Gulf of Aden: issues, needs and strategic actions. Ocean & Coastal Management. 42. (1999) 671-697 339 PERSGA 2001. Strategic Action Programme for the Red Sea and Gulf of Aden . Country Reports
91
Urban solid waste dumps form another possible source of local pollution in Somalia. A large open tipping site is located right on the coast at Mogadishu, close to the city abattoir. In the rainy season, leachates run off directly into the sea.340
The shoreline and sea dumping of solid waste is occurring at Port Sudan, Djibouti city, Somalia (at Bosaso, Berbera, and Sailac). In the Gulf of Aqaba beaches and coral reefs are heavily impacted from solid waste from ships' crews, ferry passengers, beach vacationers and local residents.341 Reported incidents of dumping toxic wastes by developed countries into Somalia’s unguarded waters has prompted Greenpeace and other environmental NGOs to investigate but these findings have not yet been made public.342 Thermal pollution
The waters of the Red Sea and Gulf of Aden have long been considered, and are still being used, as a repository for urban and industrial effluents, thus increasing the adverse impacts of land-based inputs of pollution on the marine and coastal environments and their natural resources. Moreover, existing industrial developments in the coastal zone require, and usually use, clean coastal water for cooling, as fresh water resources in the area are extremely limited.
The large –scale desalination plants in the region are located along the coastline and discharge brine water into the adjacent costal area. The discharge water contributes brine, chlorine and thermal pollution which continue to pose a serious threat to the marine environment of the Red Sea.
Most of the Egyptian Red Sea coastal towns have their own desalination plants. These governments owned desalination plants discharge their brine effluent into the sea, which most likely has resulted in considerable local damage to marine life. Tourist facilities outside these towns have their own desalination plants, using causing massive destruction of marine life and key habitats in several locations along the Egyptian coast.343
The major by-product of the desalination process is highly concentrated brine, which is mainly disposed of into the sea. In Saudi Arabia, for instance, more than 1.8 Mm3d
340 PERSGA 2001. Strategic Action Programme for the Red Sea and Gulf of Aden . Country Reports 341 W. Gladstone, N. Tawfiq, D. Nasr I. Andersen, C. Cheung, H. Drammeh, F. Krupp, S. Lintner Sustainable use of renewable resources and conservation in the Red Sea and Gulf of Aden: issues, needs and strategic actions. Ocean & Coastal Management 42 (1999) 671-697 342 PERSGA. (2000). Status of the Living Marine Resources in the Red Sea and Gulf of Aden Region and their Management. Strategic Action Programme for the Red Sea and Gulf of Aden 343 http://www.redsealive.com/diver/environment.htm
92
-1 of fresh water is produced by desalination based on the installed capacity. The Red Sea receives most of the concentrated brine from the desalination plants with apparent danger to the benthic environment. 344
Industries in the Gulf of Aqaba often use water for cooling and other manufacturing processes. Power generation and fertilizer production are currently the primary sources of heated effluents released into coastal marine water from the city of Aqaba. Several thousand cubic meters of water are released per hour in the form of jets 180 meters off shore and at a depth of 20 meters. A consequence of the discharge into the Gulf is that the water is 3 degrees Celsius higher than that of the surrounding water, which has an average temperature of 23.1 degrees Celsius. Considering that the Gulf of Aqaba marine organisms live within a few degrees of their upper thermal limits, an increase in temperature of about one or a few degrees Celsius can have profound affects on these organisms. 345
Radionuclide
There is a lack of information about the radioactivity levels and characterisation of the Egyptian Red Sea coastal environment. This information is essential to create a scientific database of the radiological base-line levels and to identify the radiological impacts of non-nuclear industries (e.g. phosphate mining, phosphate shipping and oil production activities) or any accidental contamination on the coastal region of the Red Sea.
Oil industries in the Gulf of Suez, phosphate ore mining activities in Safaga-Quseir region and intensified navigation activities are actually non-nuclear pollution sources that could have serious radiological impacts on the marine environment and the coastal ecosystems of the Red Sea.346
But the results of mineralogical, geochemical, and radiogeological studies of forty-nine phosphorite samples from three main mining areas in Egypt, Abu Tartur (Western Desert), Sibaiya (Nile Valley), and Safaga (Red Sea) have showed that the phosphorites of Nile Valley are relatively rich in Co and Zn whereas the Red Sea phosphorites are relatively rich in Pb and U.347 But Mamoney and Khater (2004) in their results imply that there is an indication of the radiological impacts of the oil
344 Baba EI-Yakubu Jibril and Ahmed Aidid Ibrahim. Chemical conversions of salt concentrates from desalination plants. Desalination 139 (2001) 287-295 345 http://www.american.edu/projects/mandala/TED/aqaba.htm
346 M. H. El Mamoney and Ashraf E. M. Khater. Environmental characterization and radio-ecological impacts of non-nuclear industries on the Red Sea coast. Jornai of Environmental Radioactivity .Volume.73. Issue 2. pages 151-168
347Dabous, A.A.A.(19819.Mineralogy, geochemistry and radioactivity of some Egyptian phosphorite deposits. Thesis (Ph. D.). http://www.osti.gov/energycitations/product.biblio.jsp?osti_id=5291148
93
industries in the Northern region of the Red Sea coast and phosphate mining in Safaga–Qusier region that need more detailed investigation on the pollution sources and the environmental distribution pattern of different pollutants.348 As all know the Red Sea-Suez Canal pathway is one of the most important international marine pathways with highly intensive ship traffic. Some of these ships are running by nuclear power or carrying radioactive materials, which is a source of possible accidental contamination.349 Although no data are available on the man-made radioactive contamination that might have reached the Sudanese coastal zone of the Red Sea prior to the Chernobyl accident in 1986, the small amounts of the anthropogenic radionuclide 137Cs measured show that only long-lived radionuclides 137Cs from the previous atmospheric nuclear explosions remain in sediments.350
Oil Spills
The oil spills in international waterways are always transnational issues. Moreover the oil spills have many adverse effects: it causes economic losses to many parties, it may foul the coastline, and it may cause severe harm to ecosystems in the body of water. Oil is and will continue to be, for decades to come, the main source of energy for both the developed and developing countries all over the world. Sea transport will continue to be the main transportation mean to move oil and oil products from producing countries to consumers all over the world. In spite of continuous improvement in safety of maritime transportation, tankers industry and ports facilities, oil spills incidents and vessels accidents will continue to occur. The Red Sea is one of the important oil tanker highways of the world. This level of shipping incurs a high risk of disastrous of oil spills. The Gulf of Suez is one of the world’s busiest industrial shipping routes. More than 117 million tons of oil pass through Egyptian waters each year and cross Egypt’s main land through the SUME D pipeline from Ain Sokhna terminal (at the head of the Gulf of Suez) to Sidi Kreir
348 M. H. El Mamoney and Ashraf E. M. Khater (2004). Environmental characterization and radio-ecological impacts of non-nuclear industries on the Red Sea coast. Journal of Environmental radioactivety. Volume 73. Issue 2, 2004. Pages 151-168
349 Hawkins, J.P. and Roberts, C.M., 1993. The growth of coastal tourism in the Red Sea: present and possible future effects on coral reefs. In: Ginsburg, R.N. and W. Smith, F.G., Editors, 1993. , pp. 385–391.
350 Adam Khatir Sam, Mustafa M. O. Ahamed, F. A, El Khangi, Y. O. El Nigumi And Elis Holm. Radioactivity Levels in the Red Sea Coastal Environment of Sudan. Marine Pollution Bulletbz, Vol. 36, No. 1, pp. 19-26, 1998
94
terminal on the Mediterranean. Another 28 to 30 million tons of oil go through the Suez Canal directly and there is 15000 ship movement every year in Egypt.351 There are 25,000-30,000 ship transits annually of the Red Sea, mostly involving the transport of petrochemical products between Yanbu, the Suez Canal, and the Sumed pipeline. 352, 353Approximately 2,300 ships arrive annually in the Port of Aqaba (Jordan), and between 1993 and 1996 there were 49 small (0-2 t) to minor (2-20 t) oil spills that caused localized damage to coral reefs. On average, there are 5-10 accidents annually in Jeddah port, some resulting in oil pollution. Low-level oil leakages from port bunkering facilities in Port Sudan 354 and Aden are a further source of pollution. As a result of high usage and dependence on petroleum, the annual volume of oil pollution entering the Red Sea from shipping is 1.5 times the global average, and 11 times the global average from refineries.355
The oil industries and the related maritime transport are of high strategic importance to the economies of the Red Sea coastal states. However, in the same time, they pose serious threats to the fragile coastal and marine environments of this highly sensitive regional sea. In addition to routine operational leaks and spills from oil exploration and production, pollution by oil resulting from tank washing and discharges from passing ships is the most significant form of pollution in the Red Sea, being one of the most important marine routs for oil tankers. Furthermore, as oil exploration and production activities continue to take place, the Region tends to be more and more susceptible to major oil incidents. Chronic oil pollution has already been observed in the immediate vicinity of some major Red Sea ports as a result of operations at oil terminals or discharges from power plants in the area.356
Most of the oil produced from both inland and offshore wells in the region is exported (local refining and consumption account for less than 10% of production), with over
351 Hazem M. Bashat. Challenges of Oil Spill Response Capabilities in Egypt Retrieved from : http://www.eeaa.gov.eg/English/main/Env2003/Day1/Oil/bashat.aeec1.pdf accessed at 2004.12.17 352 Lintner SF, Arif S, Hatziolos M. The experience of the World Bank in the legal, institutional and "nancial aspects of regional environmental problems. potential applications of lessons learned for the ROPME and PERSGA programs. The World Bank, Washington, 1996 353 W. Gladstone, N. Tawfiq, D. Nasr I. Andersen, C. Cheung, H. Drammeh, F. Krupp, S. Lintner Sustainable use of renewable resources and conservation in the Red Sea and Gulf of Aden: issues, needs and strategic actions. Ocean & Coastal Management 42 (1999) 671-697 354 Abu Bakr OA. The effect of waste oil disposal into the Red Sea. Unpublished MSc thesis, Institute of Environmental studies, University of Khartoum, Khartoum, 1995. 355 Kingdom of Saudi Arabia. Country Report. Prepared for PERSGA with support of the Kingdom of Saudi Arabia. 1997.
356 Makram A. Gerges(2002). The Red Sea and Gulf of Aden Action Plan-Facing the challenges of an ocean gateway . Ocean & Coastal Management. Volume.45, Issues 11-12. 2002.pages 885-903.
95
100 million tons of oil transported through the Red Sea annually. 357Sixty percent of the world's oil is transported through the Arabian Sea and Gulf of Aden. Oil tankers and other ships constitute another significant source of oil pollution and the southern entrance to the Gulf of Suze is presently used as a waiting area for ships before they enter the canal. These two chronic sources of pollution constitute a considerable hazard to the local fisheries. 358 Therefore Petroleum hydrocarbon levels are relatively high in the Gulf of Suez, where there is substantial oil and tar on shores, and refuse and beach debris is also marked in localised areas.359 There are numerous shipping and industrial activities that could cause a major oil spill at any time in the Gulf of Aqaba. Although oil spills are detrimental in any habitat of the world, it is of particular importance to prevent oil spills and the resulting ecological damage in the Gulf of Aqaba because of its delicate physical characteristics: its unique and vulnerable marine habitats, its highly valued recreational beaches, and the sensitive political relationships among the four countries bordering the Gulf. The physical characteristics of a body of water in which an oil spill occurs are of paramount importance in determining how the oil will spread, what its impact on the environment will be, and what methods will be used to clean up the spill.360 The high volume of ship traffic has led to chronic marine pollution resulting from illegal discharges of oily ballast water, tank washings, oily sludge, and accidental spillages. Tar balls are common throughout Gulf of Aden coastlines of Yemen where densities of 200/10 m transect have been reported 361 and Somalia 362, the Red Sea coasts of Djibouti, Saudi Arabia and Yemen 363 and the Gulf of Suez coast of Egypt.
357 UNEP(2002) .Global Environment Outlook 3. Chapter 2. Coastal and marine areas –Africa- pages 189 358Ahmed Barrania. Pollution of the Fisheries in the Gulf of Suez and the Socio- Economic Impacts Al Sambouk, No. 8, October 1998, page 8. http://www.unep.ch/seas/main/persga/samb8.pdf
359 Sheppard C.R.C. The Red Sea Seas at the millennium - an environmental evaluation - Volume 2, Published by Elsevier Science Inc., ISBN 0080432077, Editors Sheppard C.R.C. 2000, Pages 35-45
360 http://www.american.edu/projects/mandala/TED/aqaba.htm 361 Rushdie AI, Abubakr MM, Hebba HM. Marine habitats of the Red Sea at A1 Urj-Al Salif and Dhubab-Yakhtul areas: their ecology, environment and management recommendations. University of Sana'a, Sana'a and United Nations Development Programme, Sana'a, 1994. 362 UNEP. Environmental problems of the East African Region. UNEP Regional Seas reports and studies 12. United Nations Environment Programme, Nairobi, 1982. 363 European Union/Ministry of Fish Wealth, Coastal Marine Habitats Survey. Phase 1: preliminary habitat classi"cation and an assessment of the coast's resources, users and impacts. UK: MacAllister Elliott and Partners Ltd., 1995.
96
Other oil export terminals are in Yemen (at Ras Isa in the Red Sea, Bir Ali and Shihr on Gulf of Aden coastline), and the Sumed pipeline and terminal at Ain Sukhna (which transports oil to the Mediterranean). The installation of the Ain Sukhna terminal has led to increased oil pollution in the northern Gulf of Suez. 364 The plans to increase the volume of oil transported via the Yanbu Petroline and the SUMED Pipeline, along with the possibility of expanding the capacity of the Suez Canal to accommodate fully laden vessels of 250,000 tonnages pose increased risks for major oil spills.365 Despite the low occurrence of major accidents within the region, the high volume of shipping results in chronic pollution in the form of tarballs arriving on the shorelines. Studies of water quality suggest that the Red Sea environment receives more oil per square kilometre than any other regional sea. The coast of Saudi Arabia between Jeddah and Yemen is heavily tarred in places. The Egyptian coast near the offshore oil fields of the Gulf of Suez is similarly affected by oil discharges.366Inadequate environmental standards in Egyptian and Saudi oil facilities and the de-ballasting of ships in the Red Sea pose pollution threats to coral reef ecosystems. 367 Major shipping routes run close to the coral reefs near the port of Djibouti and Port Sudan and ships often discharge oily wastes and sewage. Ships also cause physical damage to the reefs when poor navigation brings them into collision with the reefs (Pilcher & Alsuhaibany 2000).368 There is a constant threat of oil spills of any magnitude along the coastline in Djibouti. Oil may leak from oil terminals and tankers, causing chronic pollution in the
364 W. Gladstone, N. Tawfiq, D. Nasr I. Andersen, C. Cheung, H. Drammeh, F. Krupp, S. Lintner Sustainable use of renewable resources and conservation in the Red Sea and Gulf of Aden: issues, needs and strategic actions. Ocean & Coastal Management 42 (1999) 671-697
365 Makram A. Gerges .(2002)The Red Sea and Gulf of Aden Action Plan—Facing the challenges of an ocean gateway. Ocean & Coastal Management. Volume 45. Issues 11-12. 2002. pages 885-903.
366 Regional Profiles. A Summary of the Risk of Oil Spills & State of Preparedness in UNEP Regional Seas RegionsRed Sea & Gulf of Aden. http://www.itopf.com/country_profiles/profiles/redsea.pdf
367 Stephen C. Jameson, John W. McManus and Mark D. Spalding. State of the Reefs. Regional and Global Perspectives. International Coral Reef Initiative Executive Secretariat Background Paper May 1995
368 Pilcher, N.,& Alsuhaibany, A. (2000).Regional Status Of Coral Reefs In The Red Sea And Gulf Of Aden. Pp 35–54 In Wilkinson, C. Status Of Coral Reefs Of The World: 2000.Australian Institute Of Marine Science And Global Coral Reef Monitoring Network,Townsville
97
intertidal zone. Considering prevailing currents and winds, oil pollution may occur in almost any part of the coast, at least at certain times of the year.369 The coastline in Somalia is generally clean except around the main urban areas of Bosaso, Berbera and Zeila. However, signs of oil pollution have been observed on the extreme west of the north coast close to the Strait of Bab al-Mandab. This is believed to be due to large amount of maritime traffic that passes through the narrow area at the entrances to the Red Sea (Awad 1995).370 Socio-Economic Impacts
1. Pollution was considered to have a moderate Economic impact. 2. Pollution from the above-mentioned sources will undoubtedly continue to
cause quantitative and qualitative changes in the living organisms (plankton, fish and other marine species) as well as to other physical environmental components (salts, oxygen, water temperature). This will result in a myriad of negative effects that will reduce the capacity of the natural resource base to provide a sustainable future for the inhabitants of the area.
3. Increased the costs for raw water.
4. It is important to understand that a healthy fishery can only be maintained if
the whole ecosystem remains in a good condition. Damage to or loss of habitat for juvenile stages, or to the organisms that are their food supply are equally detrimental to the population as factors that directly affect the adult fish.
Health Impacts
• Sewer outflows and runoffs from farms and urban areas not only threaten life in coastal regions but also endanger human health. There are frequent reports of enteric diseases, skin, ear, and eye infections of exposed swimmers in recreational beaches.
Awad el Karim indicated that the scarcity of water in tap and zeers in Port Sudan rather than bacterial contamination was the cause of alarmingly high prevalence of diarrhoeal, skin and eye communicable
369 PERSGA. (2000). Status of the Living Marine Resources in the Red Sea and Gulf of Aden Region and their Management. Strategic Action Programme for the Red Sea and Gulf of Aden 370 Awad, H. 1995. Oil Pollution in the Red Sea: A State of the Art Assessment. PERSGA/IOC/UNEP Workshop on Oceanographic Inputs into Coastal Zone Management in the Red Sea and Gulf of Aden. Oct. 12, 1995. Jeddah.
98
diseases (water-washed diseases) among children and adults of Port Sudan and South Kordofan Province.371
• Diseases associated with swimming in beach waters are usually not
severe or life threatening but could take substantial toll in children and immunocompromised individuals.
• Ali A-Z DouAbul et al 1997 indicated that the most probable source of Polynuclear Aromatic Hydrocarbons( PAHs) in the Red Sea Coast of Yemen is oil contamination originating from spillages and/or heavy ship traffic. It is concluded that the presence of (PAHs) in the fish muscles is not responsible for the reported fish kill phenomenon. However, the high concentrations of carcinogenic chrysene encountered in these fishes should be considered seriously as it is hazardous to human health. Based on fish consumption by Yemeni‘s population it was calculated that the daily intake of total carcinogens were 0.15 µg/person/day.372
•
II. Habitat and community modification Envioronmental impacts Mangrove Coastal vegetation in the region has been degraded and lost in areas of rapid population growth where mangroves are cut for firewood, for construction, and are grazed by camels e.g. near Hodeyda (Yemen), the southern coast of Sudan, west of Djibouti city, and Bosaso (Somalia). Mangrove degradation has been exacerbated by droughts that have forced nomads onto the coast seeking food for camels, especially in Sudan and Somalia. 373,374Grazing of sand dune vegetation by goats, sheep, and
371 Awad el Karim MA, el Hassan BM, Hussein KK.Social and public health implication of water supply in arid zones in the Sudan. Soc Sci Med. 1985;20(4):393-8.
372 Ali A-Z DouAbul , Hassan M. A. Heba and Khalid H. Fareed (1997). Polynuclear Aromatic Hydrocarbons (PAHs) in fish from the Red Sea Coast of Yemen. Hydrobiologia. 352 (1-3): 251-262, 1997 373 UNEP. Coastal and marine environmental problems of Somalia. UNEP Regional Seas Reports and Studies 84. United Nations Environment Programme, Nairobi, 1987.
99
camels is re-mobilizing sand dunes in Djibouti, Somalia, and the southern coast of Sudan, leading to the smothering of mangroves and other coastal vegetation. 375Large areas of mangroves have been lost in Saudi Arabia due to construction of coastal recreation facilities (at Ras Hatiba north of Jeddah) and shrimp aquaculture ponds (along the southern Red Sea coast). Off-road vehicle use around Hurgada (Egypt) has destroyed coastal vegetation, and threatened coastal dune stability.376 Development of coastal recreation facilities and coastal villages in the Ras Hatiba area north of Jeddah, shrimp aquaculture along the southern Red Sea coast and extensive landfill operations in Tarut Bay and Qatif Island and the Gulf War oil spill in Mardumah Island and Tanajib in the Eastern Province have all contributed to decline of the region's coastal mangroves.377 Coral reefs Coral reefs at Eilat, northern Red Sea, are among the most heavily used in the world for recreational diving, with >250,000 dives per year on only 12 km of coastline.378The coral reef at Eilat is subject to pollution from the port of Eilat, sewage outflows, and fish culture facilities, which has depleted the biodiversity of shallow benthic communities (Fishelson, 1995).379 Deep convective mixing in the winter (December–March) contributes to the eutrophication of surface waters (Lindell and Post, 1995). 380Following episodes of high nutrient loading,(Vago et al. 1994) 381observed extensive tissue loss in colonies of the branching coral Stylophora pistillata. The rate of death of colonies of the coral Stylophora pistillata was found to be 4–5 times as great in the polluted area as in a control area (Walker and Ormond
374 W. Gladstone, N. Tawfiq, D. Nasr I. Andersen, C. Cheung, H. Drammeh, F. Krupp, S. Lintner Sustainable use of renewable resources and conservation in the Red Sea and Gulf of Aden: issues, needs and strategic actions. Ocean & Coastal Management 42 (1999) 671-697 375 UNEP. Coastal and marine environmental problems of Somalia. UNEP Regional Seas Reports and Studies 84. United Nations Environment Programme, Nairobi, 1987. 376 PERSGA.1998.Strategic Action programme for the Red Sea and Gulf of Gden. 377UNEP. PERSGA.(1997). Regional Seas. Assessment of Land-based Sources and Activities Affecting the Marine Environment in the Red Sea and Gulf of Aden. 1997 378Zakai , D. and Chadwick-Furman, N.E., 2002. Impacts of intensive recreational diving on reef corals at Eilat, northern Red Sea. Biological Conservation 105, pp. 179–187.
379 Fishelson, L., 1995. Eilat (Gulf of Aqaba) littoral: life on the red line of biodegradation. Israeli Journal of Zoology 41, pp. 43–55
380 Lindell, D. and Post, A.F., 1995. Ultraphytoplankton succession is triggered by deep winter mixing in the Gulf of Aqaba (Eilat), Red Sea. Limnology and Oceanography 40 6, pp. 1130–1141. 381Vogo , R., Vago, E., Achituv, Y., Ben-Zion, M. and Dubinsky, Z., 1994. A non-destructive method for monitoring coral growth affected by anthropogenic and natural long-term changes. Bulletin of Marine Science 55 1, pp. 126–132.
100
1982)382 reported coral mortality attributable to sewage discharges in the neighboring Jordanian port of Aqaba. The highest coral cover is in the Red Sea of Yemen, despite the reefs being relatively poorly developed, compared to more complex reefs in the northern Red Sea. However, some of the most damaged reefs were seen in Yemen and Djibouti in the south, where there were more COTS and Diadema sea urchins damaging the corals. Edible sea cucumbers are currently being fished in most countries for export to Southeast Asia. Densities averaged between 3 and 5 individuals per 100m2 respectively in Yemen (Red Sea and Socotra) despite the increasing trade. Data on reef-destruction worldwide are rapidly accumulating, including information on species disappearance. For example, following prolonged pollution from oil tankers and phosphate dust from a nearby harbor ( Fishelson, 1973),383 the northern, Israeli part of the Gulf of Aqaba has seen a drastic decline in species richness and diversity, especially the disappearance or extreme rarity of once common littoral crustaceans, such as Ibla cumingi, Lybia tesselata, Hymenocera picta, of the irregular sea-urchins (Clypeaster spp.), the sea-stars of the genus Astropecten and various molluscs. Some of the most heavily-used coral reefs for recreational diving are located at Eilat, Israel, in the northern Red Sea. Due to their proximity to Europe, extensive tourist facilities, and diverse fauna, coral reefs at Eilat are exposed to >250,000 dives per year along only 12 km of coast, with most dives occurring along <4 km of fringing reefs inside the Coral Beach Nature Reserve (Meshi and Ortal, 1995; Wilhelmsson et al., 1998).384 ,385
In the northern Yemen Red Sea, there has been extensive coral mortality in the past 10 years with major reductions in living coral cover. Reefs of the southern Yemen Red Sea, and fringing offshore islands, were less disturbed, and had higher living coral cover. Semi-protected island reefs in the northern Yemen Red Sea had low average live coral cover (17%), high average dead coral cover (34%) and high macroalgae cover (20%). The northern and central coast and nearshore islands had
382 Walker, D.I. and Ormond, R.F., 1982. Coral death from sewage and phosphate pollution at Aqaba, Red Sea. Marine Pollution Bulletin 13, pp. 21–25.
383 L. Fishelson , Ecology of coral reefs in the Gulf of Aqaba (Red Sea) influenced by pollution. Oecologia 12 (1973), pp. 55–67. 384 Meshi, N., Ortal, R., 1995. Diving, boating and submarine activities in Eilat Coral Reef Nature Reserve, Gulf of Aqaba. Proceedings of the Second Conference on the Ecosystem of the Gulf of Aqaba in Relation to Enhanced Economic Development and the Peace Process. Interuniversity Institute for Marine Science, Eilat, pp. 30–31. 385 Wilhelmsson, D., Ohman, M.C., Stahl, H., Shlesinger, Y., 1998. Artifcial reefs and dive tourism in Eilat, Israel. Ambio 27, 764–766.
101
very low live coral cover (3%), with very high recently dead coral (averaging 34%) and macroalgae cover (34%). Clear water reefs facing the open sea had the highest live coral cover (29%) and lowest dead coral cover (14%) in the Yemen Red Sea, along with the highest coral species diversity (46) and the largest coral colonies. Deep water pinnacles and submerged patch reefs once high coral cover (52%), but now there are similar levels of live (24%) and dead coral (28%). Exposed reefs with algal crests and mono-specific corals often had dead coral (branching and table Acroporacolonies plus dead massive corals). Previously these had very high coral cover (averaging over 50%), but now it was mostly dead standing coral (44%). Southern fringing reefs also have more dead corals (23%) than live corals (15%), with cover of macroalgae (14%). 386
The reefs of Djibouti are also under pressure from many anthropogenic sources of impact Despite these threats, the living hard coral cover averaged 39% with a maximum of 80% (predominantly Pocillopora). Water turbidity was high at all sites. Patches of coral substrate were widely spaced and interspersed with mud and soft sediment. However, living coral is able to persist in small patches around the Capital and very close to the port area. 387
Lack of widespread sewage treatment facilities in most Red Sea countries has resulted in extensive localized damage to coral reefs and in some areas has caused eutrophication problems in ponded or lagoonal areas, or over extensive reef flats near towns.388
However, some of the most damaged reefs were seen in Yemen and Djibouti in the south, where there were more COTS and Diadema sea urchins damaging the corals. Edible sea cucumbers are currently being fished in most countries for export to Southeast Asia. Densities averaged between 3 and 5 individuals per 100m2 respectively in Yemen (Red Sea and Socotra) despite the increasing trade.389 Tourists near Hurgada have extensively collected corals, fish; and shells, and the collection of pufiers (Arothron hispidus) may have led to outbreaks of predatory sea urchins that have damaged coral reefs near Hurgada. 390Divers, snorkellers, reef-
386 Wilkinson, C.R. (Ed), 2000, Status of coral reefs of the world: 2000.. Australian Institue of Marine Science, Cape Ferguson, Queensland, 363 p. 387 Pilcher, N. and N.D. Abdi, 2000, The Status of Coral Reefs in Djibouti.. Global Coral Reef Monitoring Network (GCRMN)
388 Sheppard C.R.C. The Red Sea Seas at the millennium - an environmental evaluation - Volume 2, Published by Elsevier Science Inc., ISBN 0080432077, Editors Sheppard C.R.C. 2000, Pages 35-45
389 Moshira Hassan, Mohammed M. A. Kotb And Abdulmohsin A. Al-Sofyani. Status Of Coral Reefs In The Red Sea-Gulf Of Aden. http://www.aims.gov.au/pages/research/coral-bleaching/scr2002/pdf/scr2002-02.pdf 390 Ormond RFG. Report on the need for management and marine parks in the Egyptian Red Sea. Institute of Oceanography and Fisheries. Academy of Science, Cairo, 1982.
102
walkers, and souvenir collectors have damaged coral reefs in Aqaba (Jordan), the Egyptian coastal resort towns of Hurgada and Sharm Al- Shaikh391,392 , and in the marine protected areas of Musha and Maskali (Djibouti). Anchor damage to corals is reported from Wingate and Towartit Reefs (Sudan), Aqaba, Hurgada, and Musha and Maskali. Along the north-west Gulf of Aden coast of Somalia coral is collected for shipment to Djibouti for sale to tourists. Siltation from passing ship trafic has been implicated in degradation of coral reefs in the Bab al-Mandab and near Djibouti city393.
Bleaching was patchy along the Saudi Arabian coast, being more severe to the south. In Sudan, bleaching occurred at several locations, above all south of Port Sudan. In Eritrea, some coral bleaching and die-off was reported, predominantly from shallow waters, but recovery appeared to be fast. Along the Red Sea coastline of Yemen, where reefs are already under considerable human-induced stress, effects of coral bleaching were severe. In Somalia, almost all corals in an area east of Berbera were killed, whereas further west, corals were only slightly affected. In Yemen, many corals along the shoreline died, and more than half of the corals of the Socotra Archipelago were affected by the bleaching.394 Widespread mortality of corals was reported at some locations in Yemen following the 1998 bleaching event, but other locations showed little or no impacts and recovery, with rapid growth of new recruits, was reported in 2000.395 The coral reef at Eilat in Israel is subject to pollution from the port of Eilat, sewage outflows, and fish culture facilities, which has depleted the biodiversity of shallow benthic communities (Fishelson, 1995).396 Walker and Ormond (1982) reported coral mortality attributable to sewage discharges in the neighboring Jordanian port of Aqaba and as a result of spillage of phosphate dust during loading of phosphate
391 UNEP. Coastal and marine environmental problems of Somalia. UNEP Regional Seas Reports and Studies 84. United Nations Environment Programme, Nairobi, 1987. 392 Hawkins JP, Roberts CM. Efects of recreational SCUBA diving on fore-reef slope communities of coral reefs. Biological Conservation 1992; 62:171. 8. 393 Sheppard CRC, Wells S. Directory of coral reefs of international importance. vol. 2, Indian Ocean Region. Nairob: IUCN Gland & UNEP, 1988.
394 Vogt. H. Coral Reefs and Coral Bleaching in the Region. Reefs in the Red Sea and Gulf of Aden
395 Spalding, M.D., C. Ravilious and E.P. Green, 2001. World Atlas of Coral Reefs Prepared at the UNEP World Conservation Monitoring Centre. University of California Press,Berkeley,USA 396 Fishelson L., 1995. Eilat (Gulf of Aqaba) littoral: life on the red line of biodegradation. Israeli Journal of Zoology 41, pp. 43–55
103
mineral onto ships. The rate of death of colonies of the coral Stylophora pistillata was found to be 4–5 times as great in the polluted area as in a control area.397 One of the main sources of pollution on Egypt's Red Sea coast for example is the discharge of poorly treated or untreated sewage effluents into the marine environment. Tourist areas located outside city limits have their own sewage treatment facilities, many of which use compact treatment units that operate under widely fluctuating flows, the result of significant variations in hotel occupancy. Treated effluents are occasionally discharged into the sea. Damage to marine life is evident in Taba, Nuweiba and Sharm el Sheikh on the Gulf of Aqaba, and at several localities on the Egyptian Red Sea coasts. 398,399, 400Information on the quantity and quality of waste water discharges from various sources and on the methods and location of discharges is not available, however.
Censuses taken above the coral reef tables in the protected part of the Israeli Red Sea shore show an immense decline in numbers of the small bottom-dwelling fish there. In 1985, in a count taken along 10 transects of 10 m each, 85 (±6) gobies, blennies and clinids of various species, were counted per transect. A census at the same site in 1994 showed only 24 (±4) individuals/transect ( Fishelson, 1995).401 Local fishermen in Eritrea reported that over 250 dead turtles were washed ashore during a one-month period from early March to early April 2003. The number of turtles stranded may represent only approximately a quarter of the actual mortalities (Murphy & Hopkins-Murphy, 1989)402. The actual number of turtles killed may therefore be considerably higher. As the Eritrean coastline is so sparsely inhabited, the reported strandings may represent an even smaller fraction of the total actual mortalities.403 Seagrass Beds
397 Walker, D.I. and Ormond, R.F., 1982. Coral death from sewage and phosphate pollution at Aqaba, Red Sea. Marine Pollution Bulletin 13, pp. 21–25. 398 PERSGA 2001. Strategic Action Programme for the Red Sea and Gulf of Aden . Country Reports 399 http://www.redsealive.com/diver/environment.htm 400 UNEP/PERSGA:Assessment of land-based sources and activities affecting the marine environment in the Red Sea and Gulf of Aden. UNEP Regional Seas Reports and Studies No. 166, UNEP, 1997. 401 L. Fishelson ,(1995). Eilat (Gulf of Aqaba) littoral: life on the red line of biodegradation. Israel J Zool 41 (1995), pp. 43–55.
402 Murphy, T.M. & S.R. Hopkins-Murphy. 1989. Sea turtle and shrimp fishing interactions: a summary and critique of relevant information. Center for Marine Conservation. Washington, D.C. 52 pp.
403 S.A. Howe, B. Asfaha & J.M. Kemp.Turtle Strandings in the Southern Eritrean Red Sea. Marine Turtle Newsletter 103:4-7, 2004
104
Their location in shallow waters close to the shoreline renders seagrasses very susceptible to activities related to unplanned and unmanaged urban, industrial, tourism, and fishing activities. Seagrasses are destroyed directly by dredging and landfilling. Productivity is degraded by changes in water flow caused by coastal constructions, by excessive sediment in the water reducing available light, and by the impacts of increased nutrients in the water from sewage disposal. Wetland Although this region has an extremely arid climate, a wide variety of natural wetland types are located within its area, and each major physiographic unit supports some permanent wetlands. Natural freshwater wetlands are the most vulnerable, of the key biological sites in arid landscapes of the region including ponds, streams and springs, as well as artificial wetlands such as reservoirs and effluent streams outside urban areas and agricultural developments. They attract and support a diverse assemblage of plants and animals and are important centers of endemism. Small-scale natural wetlands have had a pivotal role in the subsistence economics of many inland areas; such oasis areas have a long history of date palm cultivation especially in the Saudi Arabia. In recent decades, many man-made wetlands have been created, and away from the coastal zones, these are often very significant features in the landscape. The importance of wetlands in the coastal in this region is outstanding and they play a vital role in the region. People of the region exploit the components of wetlands directly as products (water, fish, timber, wildlife), or they benefit indirectly from wetland functions such as groundwater recharge, storm protection, flow regulation, flood alleviation, sediment and nutrient retention, and from the attributes of wetlands, such as biodiversity and aesthetic beauty. It is the use of these various characteristics that gives wetlands high economic value and supports the local people directly whilst providing goods and services to the world outside the wetland. In some part of the region the warm shallow coastal waters provide suitable environment for the development of coral reefs and seagrass beds. In the Red Sea, well-developed fringing reefs are largely restricted to the northern and central portions. A large number of artificial wetlands in the Arabian Peninsula have come into existence. The majority are either water storage reservoirs, areas of spillage from irrigation systems, sewage treatment ponds, or artificial lagoons created by waste water from urban and industrial areas. Some of these wetlands can be surprisingly large, and many rank among the most important freshwater habitats for wildlife in the region, providing stop-over areas for a wide variety of migratory birds:Wadi Jizan and Wadi Hanifa in Saudi Arabia, are some examples. The Arabian Peninsula lacks major natural inland wetlands but has widespread wetlands on the coast. Bordering the coastal areas of Saudi Arabia, especially around Farazan Island in the Red Sea,
105
various types of wetlands exist, including mangroves, mudflats and inter-tidal areas.404 The wetlands in the region are host to thousands of migratory birds from all the world, which use its wetlands as wintering, breeding or staging areas. High populations of numerous species occur throughout the region. The wetlands in the region harbour a diversity of duck and goose species, while mudflats along coast of Saudi Arabia are important for terns, gulls and waders. Saudi Arabia is also home to between two and three million migratory birds, whose habitats are jeopardized by human activity. In the southern parts of the Red Sea, many new marsh communities are appearing as a result of sewage outfalls along the coast of Saudi Arabia and near Port Sudan. Enrichment not only stimulates marsh development, but in the case of the Red Sea, also adds significant nutrient loads. These areas act as a focus for numerous species of birds, especially migrants. Red Sea and Gulf Aden The coastal wetlands in the Red Sea and Gulf Aden region support internationally important populations of breeding seabirds, wintering shorebirds, breeding turtles, dugongs, fish and a vast array of corals and other invertebrate taxa (Abuzinada & Krupp, 1994; Gladstone, 1994).405, 406
In the Yemen there are no natural freshwater lakes and few permanent freshwater marshes of any size, due partly to the precipitous terrain and partly to alterations in the landscape by agriculture over many millennia. In a few areas, notably in Wadi al-Malih and Wadi Warazan, sub-surface seepage feeds grassy marshes in valley bottoms. The Wadi al-Malih marshes near Ta'izz are of special interest as they regularly hold small numbers of the critically endangered Northern Bald Ibis Geronticus eremita. The only other significant sites for waterfowl in the interior of Yemen are man-made wetlands, notably Ma'rib Dam, a water storage reservoir on Wadi Ma'rib, and the extensive sewage lagoons near Ta'izz. At the latter site, treated waste water has created a system of small lakes and marshes which regularly support 2,000-3,000 waterfowl in winter. There are also small water storage reservoirs in Wadi Mawr and Wadi Hajar.407
404 Parastu Mirabzadeh A.(1999). Wetlands in Western Asia, The Ramsar Convention on Wetlands Retrieved from : http://www.ramsar.org/about_western_asia_bkgd.htm. accessed at 2004.12.21
405 Abuzinada, A.H. & Krupp, F. (eds). (1994). The Status of Coastal and Marine Habitats Two Years after the Gulf War Oil Spill. Cour. Forsch. Inst. Senckenberg 166. 80 pp. 406 Gladstone, W. (1994a). The Farasan Marine Protected Area: biological resources, conservation values, human uses and impacts. IUCN/NCWCD Report. 163 pp. 407 Scott, D.A. (ed.) 1995. A Directory of Wetlands in the Middle East. IUCN, Gland, Switzerland and IWRB, Slimbridge, U.K. 560pp.
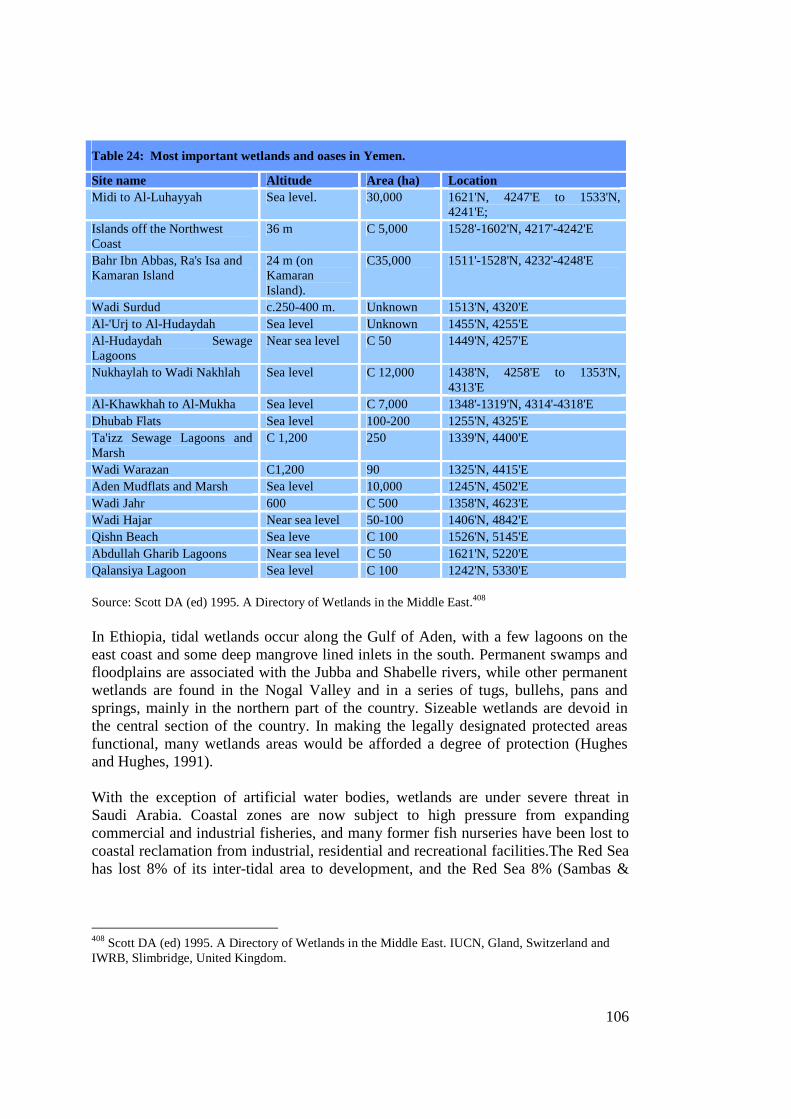
106
Table 24: Most important wetlands and oases in Yemen.
Site name Altitude Area (ha) Location Midi to Al-Luhayyah Sea level. 30,000 1621'N, 4247'E to 1533'N,
4241'E; Islands off the Northwest Coast
36 m C 5,000 1528'-1602'N, 4217'-4242'E
Bahr Ibn Abbas, Ra's Isa and Kamaran Island
24 m (on Kamaran Island).
C35,000 1511'-1528'N, 4232'-4248'E
Wadi Surdud c.250-400 m. Unknown 1513'N, 4320'E Al-'Urj to Al-Hudaydah Sea level Unknown 1455'N, 4255'E Al-Hudaydah Sewage Lagoons
Near sea level C 50 1449'N, 4257'E
Nukhaylah to Wadi Nakhlah Sea level C 12,000 1438'N, 4258'E to 1353'N, 4313'E
Al-Khawkhah to Al-Mukha Sea level C 7,000 1348'-1319'N, 4314'-4318'E Dhubab Flats Sea level 100-200 1255'N, 4325'E Ta'izz Sewage Lagoons and Marsh
C 1,200 250 1339'N, 4400'E
Wadi Warazan C1,200 90 1325'N, 4415'E Aden Mudflats and Marsh Sea level 10,000 1245'N, 4502'E Wadi Jahr 600 C 500 1358'N, 4623'E Wadi Hajar Near sea level 50-100 1406'N, 4842'E Qishn Beach Sea leve C 100 1526'N, 5145'E Abdullah Gharib Lagoons Near sea level C 50 1621'N, 5220'E Qalansiya Lagoon Sea level C 100 1242'N, 5330'E Source: Scott DA (ed) 1995. A Directory of Wetlands in the Middle East.408 In Ethiopia, tidal wetlands occur along the Gulf of Aden, with a few lagoons on the east coast and some deep mangrove lined inlets in the south. Permanent swamps and floodplains are associated with the Jubba and Shabelle rivers, while other permanent wetlands are found in the Nogal Valley and in a series of tugs, bullehs, pans and springs, mainly in the northern part of the country. Sizeable wetlands are devoid in the central section of the country. In making the legally designated protected areas functional, many wetlands areas would be afforded a degree of protection (Hughes and Hughes, 1991). With the exception of artificial water bodies, wetlands are under severe threat in Saudi Arabia. Coastal zones are now subject to high pressure from expanding commercial and industrial fisheries, and many former fish nurseries have been lost to coastal reclamation from industrial, residential and recreational facilities.The Red Sea has lost 8% of its inter-tidal area to development, and the Red Sea 8% (Sambas &
408 Scott DA (ed) 1995. A Directory of Wetlands in the Middle East. IUCN, Gland, Switzerland and IWRB, Slimbridge, United Kingdom.
107
Symens 1993, Scott 1995).409,410 The Taizz marshes in Yemen are critically threatened by excessive extraction of groundwater and conversion to agriculture.411Relatively few of the coastal wetlands are subject to severe and immediate problems or are currently undergoing major changes, but mangroves are under threat locally from coastal development, e.g. around Al-Hudaydah. Oil exploration is occurring off the northwest coast, and there are potential threats from pollution.412 Somalia has comparatively few wetland areas. There are tidal wetlands along the Gulf of Aden, the best developed in the west between Saada Din Island and Saba Wanak where 24 water courses approach the sea. There are several lagoons on the east coast. The Juba discharges into the Indian Ocean near Kismayo, and there are a number of seasonal streams elsewhere (UNEP 1987; Hughes and Hughes 1992).413, 414
Saudi Arabian coastal wetlands support internationally important populations of breeding seabirds, wintering shorebirds, breeding turtles, dugongs, fish and a vast array of corals and other invertebrate taxa (Gladstone, 1994). 415Floristically, they show less diversity, although the Red Sea coast supports extensive mangrove forests, seagrass beds and algal-flats. The wetlands in Saudi Arabia are under severe threat with the exception of these man-made water bodies. Coastal zones are the subject to high pressure from expanding commercial and industrial fisheries, and many former fish nurseries have been lost to coastal reclamation from industrial, residential and recreational facilities. The Red Sea has lost over 8% of its inter-tidal area to development, (Sambas & Symens,
409 Sambas A & Symens P 1993. Developing a conservation plan for wetlands in Saudi Arabia: The
NCWCD system plan for protected areas. In Wetland and Waterfowl Conservation in South and West
Asia, Proceedings of an International Symposium, Karachi, Pakistan 14–20 December 1991, eds M
Moser & J van Vessem, IWRB Special Publication No. 25, AWB Publication No. 85, IWRB,
Slimbridge, United Kingdom, and AWB, Kuala Lumpur, Malaysia, 109–112.
410 Scott DA (ed) 1995. A Directory of Wetlands in the Middle East. IUCN, Gland, Switzerland and
IWRB, Slimbridge, United Kingdom.
411 Frazier .S & Stevenson. N. Review of wetland inventory information in the Middle East. Wetlans
International- Africa, Europe, Middle East. Netherlands.
412 Scott DA (ed) 1995. A Directory of Wetlands in the Middle East. IUCN, Gland, Switzerland and IWRB, Slimbridge, United Kingdom. 413UNEP 1987. Coastal and marine environmental problems of Somalia.
ESCWA/FAO/UNESCO/IMO/IAEA/IUCN/UNEP, UNEP Regional Seas Reports and Studies 84.
414 Hughes, R.H. and Hughes, J.S. 1992. A Directory of African Wetlands. IUCN, Gland, Switzerland
and Cambridge, UK/UNEP, Nairobi, Kenya/WCMC, Cambridge, UK. 820 pp. 415 Gladstone, W. (1994). The Farasan Marine Protected Area: biological resources, conservation values, human uses and impacts. IUCN/NCWCD Report. 163 pp.
108
1993).416 Burgeoning human populations in the Gulf and Jeddah, Jizan and Yanbu areas on the Red Sea are resulting in considerable pollution from domestic sewage and industrial discharges. Recent events have proved how vulnerable the Gulf coast is to oil pollution.417
Sabkha,* in Saudi Arabia, covers extensive areas along the coasts of the Red Sea and Arabian Gulf. It covers prime areas that are tempting for urban planning. However, the geotechnical problems associated with the sabkha environment scares the planners from developing it without remedial measures.
Al-Lith sabkha is one of the typical coastal sabkhas located along the Red Sea coast. Al-Lith sabkha is a silty sabkha covered by a salt crust and underlained by coralline limestone near the shoreline. The groundwater level is shallow and similar to other sabkhas ranging in depth from 0.31 to 1.45 m in winter and increasing in depth to a range from 0.54 to 2.39 m in the summer. The maximum groundwater level fluctuation during the year 1996 is recorded as 0.86 m and the average is 0.60 m. The permeability of the silt is extremely low with respect to that of the limestone creating a confined condition. The soil evaporation studied indicates that the rate of evaporation can be up to 20% of that of the free water surface at a depth of 0.45 m and decreases downward. It can also be higher than the free water surface near the surface due to the higher ambient soil temperature. 418
The salinity of the sabkha brines generally increases towards the shore and increases sharply with depth indicating both intermixing with surface fresh water and salt-water intrusion. The brines are generally of the Cl+SO4 type indicating a seawater origin.
Socio- economic impacts The loss of habitats in the Red Sea and Gulf of Aden would impact upon the tourism attractiveness of the area. IV. Unsustainable exploitation of fisheries and other living resources 416 Sambas, A. & Symens, P. (1993). Developing a conservation plan for wetlands in Saudi Arabia: the NCWCD system plan for protected areas. In: Moser, M. & van Vessem, J. (eds), Wetland and Waterfowl Conservation in South and West Asia: 109-112. Proc. International Symposium, Karachi, Pakistan 14-20 December 1991. IWRB Special Publication No. 25. AWB Publication No. 85. IWRB, Slimbridge, U.K., & AWB, Kuala Lumpur, Malaysia. 417 Scott DA (ed) 1995. A Directory of Wetlands in the Middle East. IUCN, Gland, Switzerland and IWRB, Slimbridge, United Kingdom.
418 Abdullah A. Sabtan and William M. Shehata. Hydrogeology of Al-Lith Sabkha, Saudi Arabia. Journal of Assian Earth.Sciences. Volume 21. Issue 4. 2003. Pages 423-429
109
The status of fisheries in some nations of the region is unknown, because of a lack of stock assessments and incomplete fisheries statistics. But the declines in catches and average size of fish landed are good indicators of over-fishing in this region. With the exception of some small pelagic resources, the status of the different resources assumed to be fully exploited.419 The status of fisheries in some nations of the Region is unknown, because of a lack of stock assessments and incomplete fisheries statistics. Reported declines in catches and average size of fish landed are possible indicators of overfishing. Besides finfish, catches of lobster and strombids are rapidly declining. Cuttlefish stocks in major fishing grounds have completely collapsed. Overfishing, illegal fishing and non-compliance with national fisheries laws and regulations pose a significant threat to the longer-term sustainability of living marine resources.420 Exports of fish products from the Region are small; only Yemen is a significant exporter. Saudi Arabia and Egypt are net importers of fish products. Although investment in shore infrastructure on Yemen’s Gulf of Aden coastline has enabled a wide range of fisheries products to be exported, Yemen is currently suffering from the loss of its European market as a result of failure to comply with European fish quality and hygiene standards. From a global perspective, fisheries in the Red Sea and Gulf of Aden are insignificant, amounting to an estimated 160,000 tonnes or so per year. For most of the countries in the region, however, they provide an important source of fish, and often the only source. Artisanal subsistence fishermen, local commercial fisheries, and foreign industrial fisheries that target local reef-based species and pelagic species that cross national boundaries currently exploited the fisheries resources in the region. Artisanal fisheries are under-exploited in Djibouti, Sudan, and Somalia. Declines in catches are reported from several sectors of the commercial and industrial fisheries e.g. Indian mackerel (Rastrelliger kanagurta) and kingfish (Scomberomorus commerson) in Yemen. In Sudan a high percentage of under-sized najil (Plectropomus spp.) are caught. Reduced fish catches in Sudan led artisanal fishermen
419 FAO (1997). Fisheries Circular No. 920 FIRM/C920. Review Of The State Of World Fishery Resources: Marine Fisheries . Western Indian Ocean. Rome, 1997 420 PERSGA(2002). Status of the Living Marine Resources in the Red Sea and Gulf of Aden and Their Management.
110
to change to kokian (Trochus dentatus), which in turn suffered a dramatic decline in catch, causing a change to sea cucumber.421
Until 1981, Saudi Arabia's fishery was exploited almost exclusively by artisanal fishermen from small boats and larger (up to 20 m) sambouks. After 1991, an industrial fishery began, which has grown to a point where the largest company, Saudi Fisheries, currently lands around 1500mt of shrimp and a similar amount of finfish.422
The total Yemen fish catch was approximately 100,000 tonnes in 1992 and it was expected that it could be increased to 300,000 tonnes using modern gear (Rushdi et al. 1994).423 About 95% Of the catch is consumed locally and 5,000 tonnes is exported to the other countries. The Red Sea catch was about 40,000 tonnes in 1997 (Al-Sorimi, 1998). 424
A wide variety of fin-fishes, crustaceans and mollusks are exploited in the Red Sea. Important seine fisheries exist in the Gulf of Aqaba and Foul Bay in the north while trawling and beach seine fishing operations take place in the shallow waters of the south. Prospects for increasing overall fishery production are limited although reef fish resources may offer some potential for expanded landings. In the southern Red Sea, off the Eritrean coast, local increases may be possible. Management of fishery resources is hampered by a general lack of data on catch and effort. Stocks of shrimp and spiny lobsters are heavily exploited. Yemen's cuttlefish fishery colapsed in the early 1980s and recovered following implementation of a management programme and a reduction in the level of fishing effort.425,426 In general, however, the greatest threat to the Region's fishery resources lies in the destruction of coastal habitats as a result of uncontrolled land-filling and pollution in the developed areas. Repeated occurrence of oil spills and the resulting high levels of pollution by oil also represent
421 W. Gladstone, N. Tawfiq, D. Nasr I. Andersen, C. Cheung, H. Drammeh, F. Krupp, S. Lintner Sustainable use of renewable resources and conservation in the Red Sea and Gulf of Aden: issues, needs and strategic actions. Ocean & Coastal Management 42 (1999) 671-697. 422 UNEP. Regional seas. Red Sea and gulf of Aden. http://www.unep.ch/seas/main/persga/redrisk.html 423 Rushdi, A.I., Abubakr, M. M. and Hebba, H. A., 1994, Marine Habitats of the Red Sea at Alurj-Alsalif and Dubab-Yakhtul areas: Ecology,Environment and Management Recommendations, Faculty of Science, San’a University and UNDP. 424 Al-Sorimi, M., 1998, Fisheries of the Red Sea, Republic of Yemen, Unpublished Report, Ministry of Fish Wealth, Al Hudaydah. 425 PERSGA. Regional Programme of Action for Sustainable Utilization of the Marine Environment of the Red Sea, Gulf of Aden, PERSGA, 1995. p. 38.
426 Makram A. Gerges .(2002)The Red Sea and Gulf of Aden Action Plan—Facing the challenges of an ocean gateway. Ocean & Coastal Management. Volume 45. Issues 11-12. 2002. pages 885-903.
111
a significant threat to fisheries production due to their impacts on the vulnerable larval stages of fish.427
The total saleable catch in 1995 was an estimated 15 tonnes, with a value of 45,000 Jordanian dinars. This represented a significant drop from the 1993 catch of 105 tonnes, and was well below the largest registered catch of 194 tons in 1966.
The Red Sea waters catch of ‘reef’ fish (grunts, bream, groupers and snappers) increased in Yemen from 5,100 tonnes in 1988 to 8,000 tonnes in 1992. Catch of fish more loosely associated with reefs (sharks, jacks, barracuda) increased from 3,100 tonnes to 12,200 tonnes in the same period (Rushdi et al. 1994).428 The catch of pelagic fish rose from 12,400 tonnes to 14,200 tonnes. The total Red Sea catch shows catch rising from about 18,000 tonnes in 1983 to 40,000 tonnes in 1994and thereafter stabilizing at this level to 1997 (Al Sorimi, 1998).429
Over-exploitation in localized areas of Djibouti (Dorale, Khor- Ambado, Arta Plage, islands of Musha, Muskali, Waramous) by sport and artisanal fishing is further compounded by habitat destruction. In the absence of law enforcement, poaching and habitat destruction by foreign vessels in occurring of the Gulf of Aden coast of Somalia .430There is potential overfishing of game fish in Djibouti resulting in a decrease in average catch size, as the level of fishing efforts exceeds the Maximum Sustainable Yield. The lack of surveillance and enforcement of existing regulations, such as that regulating the use of spearguns in capital areas and MPAs is widespread. The illegal shark fisheries supplying the Oriental shark fin market has resulted in a decline in shark stocks. There is also a large by-catch of turtles, dolphins and finfish, and damage to reefs from nets.431 Catches of spiny lobster in the Gulf of Aden coast of Yemen have declined by 60% in last 2 yr, and collapse of cuttlefish (Sepia pharaonis) stocks possibly indicates
427 Makram A. Gerges .(2002)The Red Sea and Gulf of Aden Action Plan—Facing the challenges of an ocean gateway. Ocean & Coastal Management. Volume 45. Issues 11-12. 2002. pages 885-903.
428 Rushdi, A.I., Abubakr, M. M. and Hebba, H. A., 1994, Marine Habitats of the Red Sea at Alurj-Alsalif and Dubab-Yakhtul areas: Ecology, Environment and Management Recommendations, Faculty of Science, San’a University and UNDP. 429 Al-Sorimi, M., 1998, Fisheries of the Red Sea, Republic of Yemen, Unpublished Report, Ministry of Fish Wealth, Al Hudaydah. 430 FAO. Towards a strategy for agricultural development in Somalia, from relief, rehabilitation and reconstruction to development. Food and Agriculture Organisation of the United Nations, Rome, 1995. 431 Pilcher, N. and N.D. Abdi, 2000. The Status of Coral Reefs in Djibouti. Global Coral Reef Monitoring Network (GCRMN
112
recruitment collapse. Increased effort following price rises has led to a decline in shrimp catches in Yemen.432 In Sudan, stocks are fully exploited in waters adjacent to Suakin in the south and Mohammed Qol in the north. A steady decline in finfish catches of species of snapper such as Lutjanus bohar, Aprion virescens and Pristipomoides filamentosus. In the Suakin area landings of the trochus shell Tectus dentatus have declined and the main area of production has now shifted to Mohammed Qol. Production from Suakin dropped from 163 mt in 90/91 to 26.3 mt in 92/93 and exports as a whole declined from 485 mt in 91/92 to 432.7 mt in 94/95. Catch per unit of effort has dropped from 3 to 1.5 mt per trip. Shark resources have also shown rapid decline to only 163 mt in 1990/91 to 26.3 mt in 1993/94. Catches of ‘najil’ (Plectropomus maculatus) show a high percentage of small individuals due to the use of small mesh sizes.433
The concentration of the Jordanian fishing effort within the limited national waters in the upper Gulf of Aqaba has reportedly led to reductions in numbers and diversity of fishes caught. Over-exploitation in localized areas of Djibouti (Dorale, Khor- Ambado, Arta Plage, islands of Musha, Muskali, Waramous) by sport and artisanal fishing is further compounded by habitat destruction. In the absence of law enforcement, poaching and habitat destruction by foreign vessels in occurring off the Gulf of Aden coast of Somalia .434 Somali fisheries are driven principally by foreign interests and demand for high-value tuna, shark and ray fins, lobster, deepwater shrimp and demersal whitefish. Since it is unknown whether marine resources are being harvested sustainably, biological resources are potentially at risk and may face imminent collapse, affecting long-term socio-economic welfare of coastal communities. Lobster and shark resources are fished intensely - almost a mining operation. Local fishing pressure on lobster stocks is very intense due to its being a high-value species for overseas export and relatively easy to harvest. Biodiversity concerns relate to by-catch of turtles, dolphin, and dugong by foreign vessels in the offshore fishery and the inshore artisanal gillnet fishery, plus destruction of critical reef habitat by foreign trawlers. 435
432 W. Gladstone, N. Tawfiq, D. Nasr I. Andersen, C. Cheung, H. Drammeh, F. Krupp, S. Lintner Sustainable use of renewable resources and conservation in the Red Sea and Gulf of Aden: issues, needs and strategic actions. Ocean & Coastal Management 42 (1999) 671-697 433 PERSGA. (2000). Status of the Living Marine Resources in the Red Sea and Gulf of Aden Region and their Management. Strategic Action Programme for the Red Sea and Gulf of Aden 434 FAO. Towards a strategy for agricultural development in Somalia, from relief, rehabilitation and reconstruction to development. Food and Agriculture Organisation of the United Nations, Rome, 1995. 435 Scott Coffe, Smout.Pirates, Warlords and Rogue Fishing Vessels in Somalia's Unruly Seas. http://www.chebucto.ns.ca/~ar120/somalia.html
113
In Yemen, the lucrative industrial fishery for cuttlefish (Sepia pharaonis) in the Gulf of Aden illustrates a clear example of over-fishing and resultant decline of the fishery.436
The Butter-flyfish have decreased in the Gulf of Aqaba and the Red Sea proper, with an average of 9.7 butterflyfish per 100m2 in 1997, and only 5.2 per 100m2 in 2002, and sweetlip populations dropped by 69%. Abundance of groupers and parrotfish remained stable in the Gulf of Aqaba, but decreased in the Red Sea. There is better enforcement of no-take zones and fishing regulations in South Sinai and Gulf of Aqaba than in the Red Sea, where fish poaching is evident. Some solid wastes were seen, but there was little anchor damage. 437
There are no stock assessment studies on sharks, and the taxonomic identification of species found in the region is incomplete.438 More than 80 species of sharks and 40 species of rays and skates inhabit Yemen waters, especially around Socotra Island. 439Almost the big catches are from the artisanal fishery using bottom lines, gill nets. The dried fins of sharks are exported to East Asian countries. 440The shark resources of the region are heavily fished especially in Sudan, Djibouti, Yemen 441and Somalia, where there is evidence of depletion. Average annual catches of sharks and rays from the Red Sea and Gulf of Aden by Yemeni artisanal fishermen in the 1990s had always exceeded the total annual landings of the countries in the region. 442 The meat of
436 PERSGA. (2000). Status of the Living Marine Resources in the Red Sea and Gulf of Aden Region and their Management. Strategic Action Programme for the Red Sea and Gulf of Aden 437 Hassan, M., M.M. A. Kotb and A. A. Al-Sofyani, 2002, Status of Coral Reefs in the Red Sea-Gulf of Aden.. In: C.R. Wilkinson (ed.), Status of coral reefs of the world:2002. GCRMN Report, Australian Institute of Marine Science, Townsville. Chapter 2, pp 45-52. 438 Khaled Ibrahim Hariri Problems With Shark Management in The Red Sea And The Gulf Of Aden (RSGA). Shark Conference 2000 Online Documents . Honolulu, Hawaii February 21-24 439 FIGIS Country Profile Fact Sheet. Yemen. http://www.fao.org/figis/servlet/static?dom=country&xml=fims_ye.xml#N00961630009C7468 440 PERSGA. (2000). Status of the Living Marine Resources in the Red Sea and Gulf of Aden Region and their Management. Strategic Action Programme for the Red Sea and Gulf of Aden 441 PERSGA. (2002). Status of the Living Marine Resources in the Red Sea and Gulf of Aden and their Management.. strategic Action Programme for the Red Sea and Gulf of Aden. 442 Khaled Ibrahim Hariri Problems With Shark Management in the Red Sea And the Gulf of Aden (RSGA). Shark Conference 2000 Online Documents . Honolulu, Hawaii February 21-24
114
sharks and rays is preferable to many people in Yemen especially in the east areas. The total catch of these species was about 3965 t in 1998.443
Generally, increased exploitation in the region is dependent on expansion into new fishing areas. This will entail the use of more advanced fishing methods. Exploitation of the mesopelagic stock, which remains little known at present, is currently not considered economically or technically viable. Much attention has been given to fisheries development in Eritrea since independence. At the end of the protracted war of independence, fishing capacity was low because of destruction and deterioration of vessels and infrastructure. Agreements are being negotiated with a number of countries seeking access to Eritrean waters.444 In the absence of strict surveillance, monitoring, and control of the fisheries resources of the fish-rich countries, it is difficult to substantiate and document the actual fish volumes caught from the Red Sea and Gulf of Aden waters. It is well known that there are several joint ventures between states of the region and foreign companies, but the extent and volume of their actual operations are not publicly known or documented. The illegal fishing in the region by vessels operating outside their natural waters is commonplace. The absence of effective control, surveillance and enforcement of regulations has thus resulted in widespread poaching and habitat destruction by foreign and national vessels.445 There also lies the problem of national over-exploitation as well as concentration of fishing within limited waters, which leads to a reduction in the number and diversity of fish as well as to habitat destruction in some cases.446 The most used fishing methods are hand lines, trolling lines, cast nets and traps. The used of all these methods depends on seasonal catch variations, fishing ground, the size of the vessel and target species. Unsustainable fishery practices in egypt include spear fishing, the use of closed mesh nets, and dynamite (blast) fishing have been reported to occur along the Egyptian coastline. These practices remove many reef herbivores, resulting in changes to natural reef ecological processes such as algal blooms.447
443 FIGIS Country Profile Fact Sheet. Yemen. http://www.fao.org/figis/servlet/static?dom=country&xml=fims_ye.xml#N00961630009C7468 444 http://www.unep-wcmc.org/resources/publications/4_diversity_of_seas/1.doc 445 PERSGA. (2000). Status of the Living Marine Resources in the Red Sea and Gulf of Aden Region and their Management. Strategic Action Programme for the Red Sea and Gulf of Aden 446 http://www.persga.org/about/history/history.asp 447 Pilcher, N. and N.D. Abdi, 2000. The Status of Coral Reefs in Djibouti. Global Coral Reef Monitoring Network (GCRMN
115
Where possible, trawl fisheries are carried on, generally using trawls with extremely small mesh in their codends, taking a wide variety of perciform fishes. Large amounts of bycatch from net fishing, including turtles, dolphins and finfish, are discarded, almost invariably dead. Socio- economic impact
Fisheries and others resources in the region have for centuries provided food and employment to the people of the Red Sea. But the potential for fishing is being eroded in some coastal areas due to the degradation of the environment caused by pollution associated with industrial and urban development. The sustainable use of the important local resources requires a reduction in current pollution inputs.
The important of fisheries to the economies of the region states is reflected in a number of indications as following
1. Number of fishermen and peoples employed directly in this sector or indirectly related to fisheries.
2. National market in the region depending on the fish supply. 3. Revenues generated from experts and other duties .
Health impact The fish resources of the Red Sea and Gulf of Aden are regarded as an important source of domestic protein. The figures available from 1991 indicated that average national daily protein intake is around 107 grams per capita of which fish is calculated to provide only 6 percent. The total fish consumption along both Yemeni coastlines is high and represents now 16 kilograms per capita annually. Meanwhile the total average consumption of fish in the whole country is 6-7 kilograms per capita, and expected to be expanding in the future.448 V. Global Change
Global change and coral bleaching
Coral reef bleaching is caused by undesirable variations in the reef environment including sea temperature, UV radiation, sedimentation, lack of aeration, inorganic nutrients, freshwater dilution, and increased atmospheric dust. Coral bleaching events have been increasing in both frequency and extent worldwide in the past 20 years. Global climate change may play a role in the increase in coral bleaching events, and 448 PERSGA. (2000). Status of the Living Marine Resources in the Red Sea and Gulf of Aden Region and their Management. Strategic Action Programme for the Red Sea and Gulf of Aden
116
could cause the destruction of major reef tracts and the extinction of many coral species. It is normally blamed on the higher water temperatures, and clearly correlates to it, but it's not as simple as that. In 1998, a very warm summer resulted in elevated air and water temperatures, and widespread coral bleaching was observed in the Saudi Arabian side of the Red Sea as well as in many other tropical areas of the world. 449 Yusef Fadlallah indicated that the temperature stress is apparently responsible for bleaching and subsequent mortality of corals in the Rabigh (central Red Sea). The mortality observed in Rabigh was locally (50 km x 20 km) extensive.450
Within the Red Sea, no bleaching was observed in the Gulf of Aqaba, the Gulf of Suez or along the Egyptian coast of the main basin. Bleaching was patchy along the Saudi Arabian coast, being more severe to the south. In Sudan, bleaching occurred at several locations, above all south of Port Sudan. In Eritrea, some coral bleaching and die-off was reported, predominantly from shallow waters, but recovery appeared to be fast. Along the Red Sea coastline of Yemen, where reefs are already under considerable human-induced stress, effects of coral bleaching were severe. However, no quantitative data are available. Many areas of the Gulf of Aden were affected by bleaching. In Somalia, almost all corals in an area east of Berbera were killed, whereas further west, corals were only slightly affected. In Yemen, many corals along the shoreline died, and more than half of the corals of the Socotra Archipelago were affected by the bleaching.451
Sea-level change
At the time of the last glacial maximum sea-level was 120m lower than it is today and the Hannish Sill was just 20m deep. Consequently the exchange between the Red Sea and the global ocean is very sensitive to changes in sea-level during the glacial cycle. A recent study at the SOC (Siddall et al 2003, see also Sirocko 2003)452 has exploited this sensitivity to derive an estimate of global sea-level during the last 500,000 years from the analysis of sediment cores taken in the Red Sea . A model of the exchange through the strait was used to determine the concentration of oxygen isotopes in the upper layers of the Red Sea as a function of sea-level
449 http://www.saudidiving.com/coral-bleaching.htm 450Yusef Fadlallah. Reef Destruction and Bleaching in the Red Sea. http://www.saudidiving.com/red-sea-coral-bleaching.htm
451 Al-Sanbouk. Newsletter of the Regional Organization for the Conservation of the Environment othe Red Sea & Gulf of Aden. Issue 12. September 2000.
452 Sirocko, F. (2003). Global change: Ups and downs in the Red Sea. Nature, 423, 813-814.
117
Siddall et al (2003)453 use oxygen isotope records together with a hydrological model for water exchange between the Red Sea and the world ocean to study sea level fluctuations over the last 470,000 years. They document changes of sea level of up to 35 m and find rates of sea level change in the past have been as high as 2 cm/yr. This method is useful for detecting the occurrence of abrupt climate change of the past.
The Red Sea has a connection with the open ocean which is 137 m deep and a net evaporation of 2.06 m/yr. This limited connection and high evaporation force modern Red Sea outflow salinites to values as high as 40. The glacial to interglacial change in sea level was around 120 m or 90% of the sill depth (137 m). Inevitably the sea-level driven choking of the connection between the Red Sea and the open ocean leads to large changes in the refreshment rate of the basin and increases in salinity to values greater than 49 for sea levels lower than around 80 m below modern.454
Fouda and Gerges (1994)455 indicated in their study that in addition to the expected changes in the monsoon winds, leading to notable changes in weather and particularly in precipitation patterns over the Red Sea Region, it is also expected that changes in temperature will have deleterious effects on crops and water resources in the dry areas where these resources are generally limited. Furthermore, assuming a global sea-level rise of about 20 cm, the local sea-level rise could actually be greater due to land subsidence, as in the case of Port Said in the northern part of the Suez Canal where the rate of subsidence is estimated at about 3 mm/year.
Fouda and Gerges (1994) also showed that climatic changes leading to sea-level rise in the Red Sea and Gulf of Aden will affect the coastal zones of the Region considerably. The direct effect of inundation would produce a large loss of inhabited areas, wetlands and low islands of the Red Sea. Any sea-level rise will allow waves to cover the coral reefs, increasing coastal vulnerability to erosion and storms, at least until reef growth can catch up with the sea level. In many areas, the shoreline retreat from rising sea level will be greater than from inundation alone, because land well above sea level could also erode. This would eliminate existing recreational beaches at the major resorts of the Red Sea, threaten wildlife (particularly turtles and birds), mineral resources development (including oil pipeline terminals and other oil installations and infrastructures in the Gulf of Suez), human settlements and harbor facilities. Capital values at lost by shoreline retreat and especially from flooding, will be of enormous proportion.
453 Siddall, M., E. J. Rohling, A. Almogi-Labin, C. Hemleben, D. Meischner, I. Schmelzer, and D. A. Smeed, 2003: Sea-level fluctuations during the last glacial cycle. Nature 423, 853-858.
454 M. Siddall , D.A. Smeed , E.J. Rohling , W.R. Peltier , C. Hemleben , I. Schmelzer. Red Sea Response To Sea Level Change - Application Of Hydraulics in Paleoceanography Geophysical Research Abstracts, Vol. 6, 02490, 2004 455 Fouda M, Gerges M. Implications of climate change in the Red Sea and Gulf of Aden Region: an overview. UNEP Regional Seas Reports and Studies, No. 156, UNEP, 1994. p. 58.
118
The monsoon reversal in the Red Sea circulation near and above sill depth is described and related to the winds at the sea surface. During winter (October–May), the surface waters flow north, sink in the northern Red Sea, and return to the south as a warm, high-salinity subsurface current that flows out over the shallow sill into the Gulf of Aden. During summer (June–September), the pattern reverses: i.e. the surface waters of the Sea flow south, causing upwelling in the northern Red Sea, while in the southern Red Sea a subsurface inflow over the shallow sill of cool, low-salinity Gulf of Aden water occurs. This reversal in circulation is closely associated with reversals in the monsoon winds acting at the sea surface and the resulting changes in sea level in the southern Red Sea and Gulf of Aden.456, 457,458
Although sea level rise will not extensively inundate the Red Sea coast of Israel because of the steep drop of the coastal sea bed, Elat’s narrow recreational beaches and the transportation lines along the beaches may be affected by the increase in water level, wave activity and increase in storminess. The overall impact of sea level rise on the ports of Elat and the marina has not been assessed4. The Red Sea Coral reefs are subtidal, and therefore reduce wave activity less efficiently than the Mediterranean vermetid reefs. Nevertheless, coral reefs usually have a relatively high growth-rate. It is not known whether sea level will rise slowly enough to allow the corals to grow upward and to what extent the coral reef will not be instrumental in coast protection. 459
Makram A. Gerges (2002) indicated that the impacts of climate change and sea-level rise would include fisheries, although the level of impact could vary widely depending on attributes of the species as well as on their regional specificity. However, it is clear that rise in sea level could inundate and displace wetlands, the nursery grounds for small fishes, and hence fish production could rise as a result of expanding the wetland areas.460
Socio-economic impacts
456 William C. Patzert.Wind-induced reversal in Red Sea circulation.Deep Sea Research and oceanographic abstracts. Vol 21. 2, Febr. (1974 )pages 109-121
457 Elina Tragou , Chris Garrett. The shallow thermohaline circulation of the Red Sea. Pergamon Deep-Sea Research I, Vol. 44, No. 8, pp. 1355-1376, 1997
458 Smeed D .(1997). Seasonal variation of the flow in the strait of Bab al Mandab . Oceanologica Acta . Volume 20, Issue 6, 1997, Pages 773-781
459 Guy Pe’er and Uriel N. Safriel. Climate Change Israel National Report under. The United Nations Framework Convention on Climate Change Impact, Vulnerability and Adaptation. October 2000
460 Makram A. Gerges .The Red Sea and Gulf of Aden Action Plan—Facing the challenges of an ocean gateway . Ocean & Coastal Management. Volume 45, issues 11-12. 2002. pages 885-903
119
Land degradation problems and limited water supplies constrain present agricultural productivity and threaten the food security of some countries. Though there are few projections of the impacts of climate change on food and fiber production for the region.
Water shortages already are a problem in many countries of this predominantly arid region, and are unlikely to be reduced and may be exacerbated by climate change. Projected precipitation increases are small, and temperatures and evaporation are projected to rise. Rapid development is threatening some water supplies through salinization and pollution, and expanding populations are increasing the demand for water.
The projected small increase in precipitation is unlikely to improve land conditions in the near future, partly because soil conditions take a long time to improve and partly because human pressure on these systems may contribute to land degradation. Improved water-use efficiency by some plants under elevated carbon dioxide (CO2) may lead to some improvement in plant productivity and changes in ecosystem composition. Grasslands, livestock, and water resources are likely to be most vulnerable to climate change in this region because they are located mostly in marginal areas. Management options, such as better stock management and more integrated agroecosystems, could improve land conditions and counteract pressures arising from climate change.
Forests/woodlands are important resources, although they cover only a small area. They will have to be safeguarded, given the heavy use of wood for fuel in some countries.
Other impacts of climate change and sea-level rise would include fisheries, although the level of impact could vary widely depending on attributes of the species as well as on their regional specificity. However, it is clear that rise in sea level could inundate and displace wetlands, the nursery grounds for small fishes, and hence fish production could rise as a result of expanding the wetland areas.461
Health impacts
Human health in the region is variable, reflecting the economies of the countries. Some countries, where poverty is high, have high infant mortality rates and low life expectancies. The impacts of climate change are likely to be detrimental to the health of the population, mainly through heat stress and possible increases in vector-borne (e.g., dengue fever and malaria) and waterborne diseases. Decreases in water availability and food production (especially if there is a shortage of water for
461 Makram A. Gerges(2002). The Red Sea and Gulf of Aden Action Plan-Facing the challenges of an ocean gateway . Ocean & Coastal Management. Volume.45, Issues 11-12. 2002.pages 885-903.
120
irrigation) would lead to indirect impacts on human health associated with nutritional and hygiene issues.
Conclusion
The Red Sea and Gulf of Aden are geographically located between two important ocean domains, namely, the Indian Ocean domain and the Atlantic Ocean domain through the Mediterranean Sea. This location gives the Red Sea Region a very important and strategic situation as an ocean gateway, and makes it particularly interesting scientifically and environmentally, as well as politically, socially and economically. However, it also adds tremendous pressures on its fragile environment.
The water situation in the region is precarious. Rapid population growth, urbanization, and improvement of standards of living, agricultural and industrial development in the region have overwhelmed traditional management practice. In addition to domestic, agricultural irrigation and industrial use other requirements have become increasingly important in the region, such as sanitation, livestock supply as well as for recreational purposes. Therefore the GIWA Assessment for the Red Sea and Gulf of Aden ranked freshwater shortage and pollution as severe as anywhere in the developing world.
From the GIWA assessment review, it becomes evident that the coastal and marine environments of the Red Sea and Gulf of Aden and their resources are subject to a number of individual and cumulative threats that have significant short- and long-term consequences on sustainable development in the Region. This, therefore, presents a real challenge to present and future generations.
ANNEXES
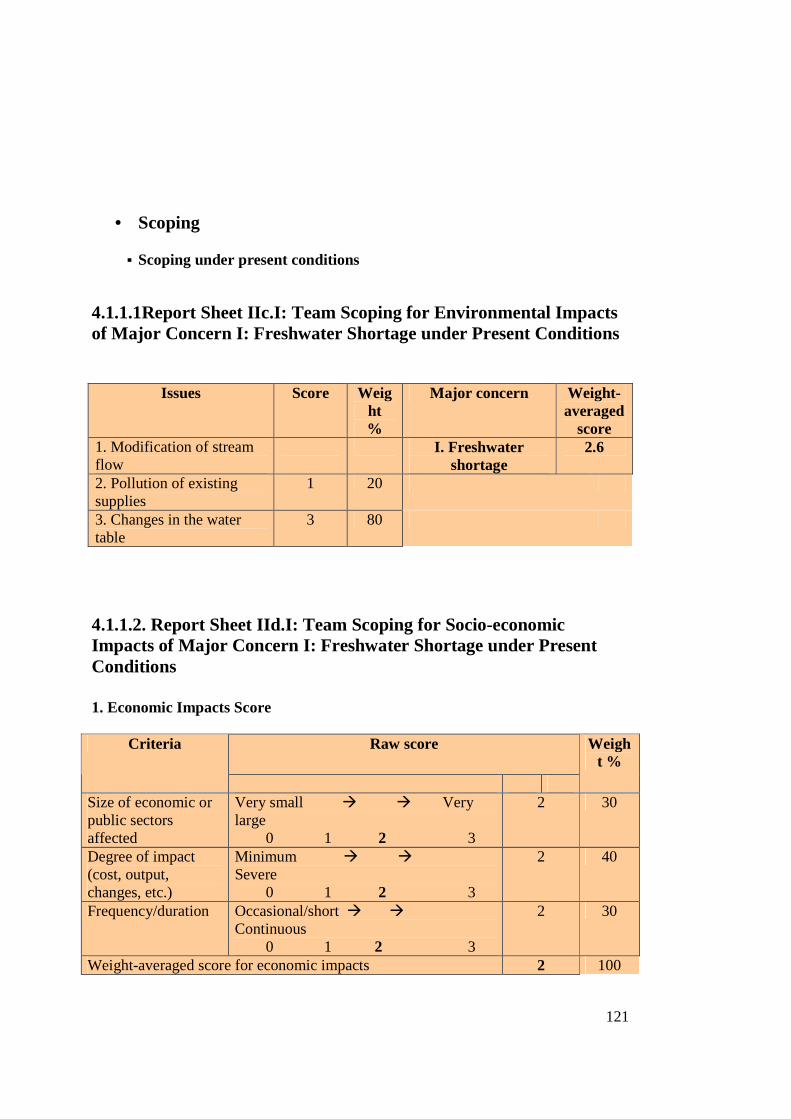
121
• Scoping
� Scoping under present conditions
4.1.1.1Report Sheet IIc.I: Team Scoping for Environmental Impacts of Major Concern I: Freshwater Shortage under Present Conditions
Issues Score Weight %
Major concern Weight-averaged
score 1. Modification of stream flow
I. Freshwater shortage
2.6
2. Pollution of existing supplies
1 20
3. Changes in the water table
3 80
4.1.1.2. Report Sheet IId.I: Team Scoping for Socio-economic Impacts of Major Concern I: Freshwater Shortage under Present Conditions 1. Economic Impacts Score
Raw score Criteria
Weight %
Size of economic or public sectors affected
Very small � � Very large 0 1 2 3
2 30
Degree of impact (cost, output, changes, etc.)
Minimum � � Severe 0 1 2 3
2 40
Frequency/duration Occasional/short � � Continuous 0 1 2 3
2 30
Weight-averaged score for economic impacts 2 100
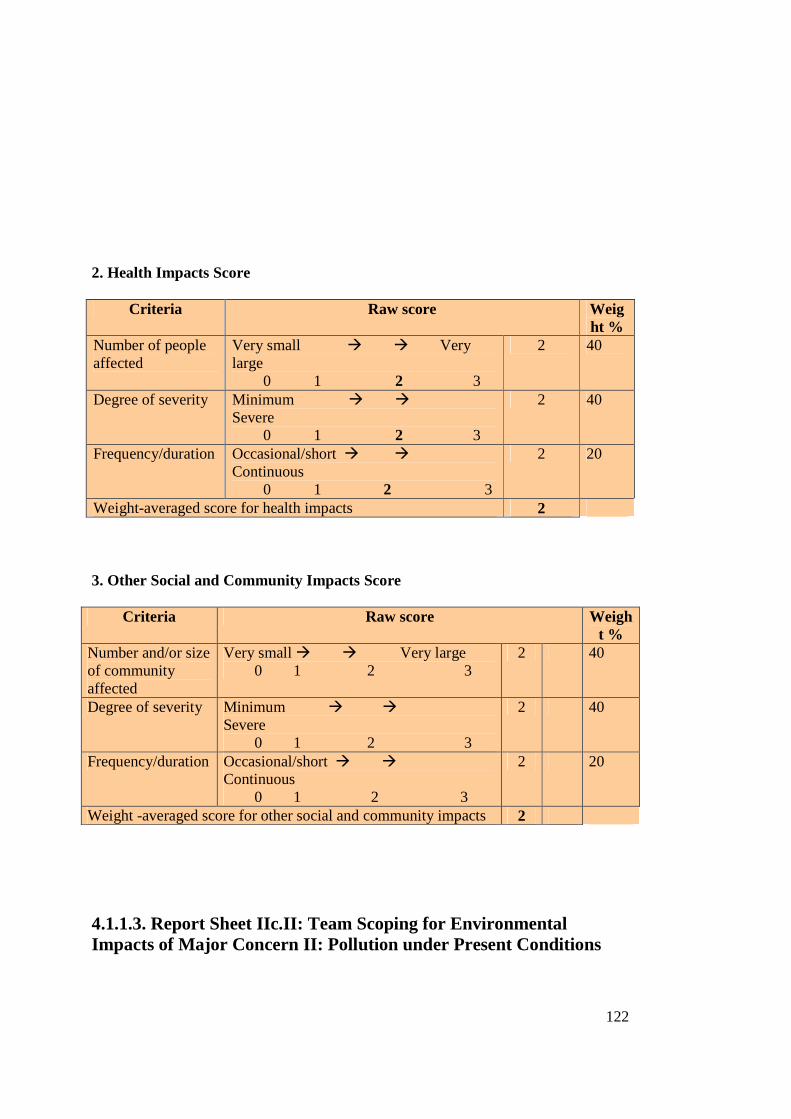
122
2. Health Impacts Score
Criteria Raw score Weight %
Number of people affected
Very small � � Very large 0 1 2 3
2 40
Degree of severity Minimum � � Severe 0 1 2 3
2 40
Frequency/duration Occasional/short � � Continuous 0 1 2 3
2 20
Weight-averaged score for health impacts 2 3. Other Social and Community Impacts Score
Criteria Raw score Weight %
Number and/or size of community affected
Very small � � Very large 0 1 2 3
2 40
Degree of severity Minimum � � Severe 0 1 2 3
2 40
Frequency/duration Occasional/short � � Continuous 0 1 2 3
2 20
Weight -averaged score for other social and community impacts 2
4.1.1.3. Report Sheet IIc.II: Team Scoping for Environmental Impacts of Major Concern II: Pollution under Present Conditions
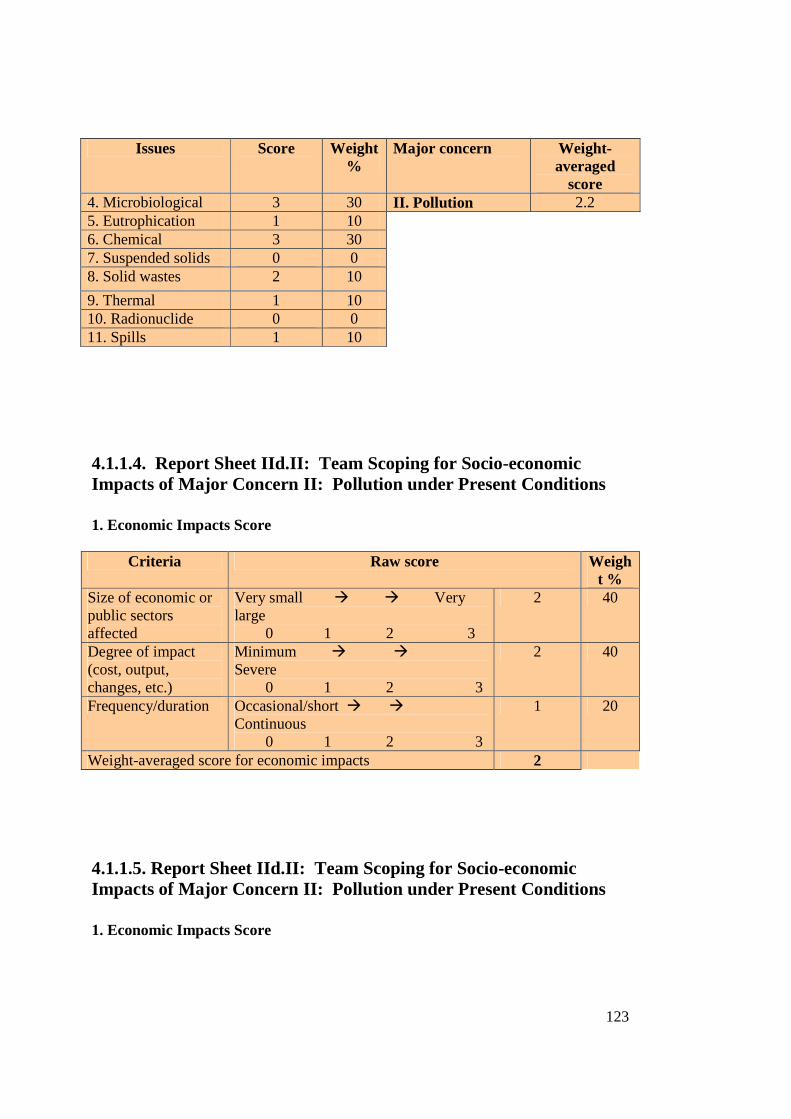
123
Issues Score Weight %
Major concern Weight-averaged
score 4. Microbiological 3 30 II. Pollution 2.2 5. Eutrophication 1 10 6. Chemical 3 30 7. Suspended solids 0 0 8. Solid wastes 2 10
9. Thermal 1 10 10. Radionuclide 0 0 11. Spills 1 10
4.1.1.4. Report Sheet IId.II: Team Scoping for Socio-economic Impacts of Major Concern II: Pollution under Present Conditions 1. Economic Impacts Score
Criteria Raw score Weight %
Size of economic or public sectors affected
Very small � � Very large 0 1 2 3
2 40
Degree of impact (cost, output, changes, etc.)
Minimum � � Severe 0 1 2 3
2 40
Frequency/duration Occasional/short � � Continuous 0 1 2 3
1 20
Weight-averaged score for economic impacts 2
4.1.1.5. Report Sheet IId.II: Team Scoping for Socio-economic Impacts of Major Concern II: Pollution under Present Conditions 1. Economic Impacts Score
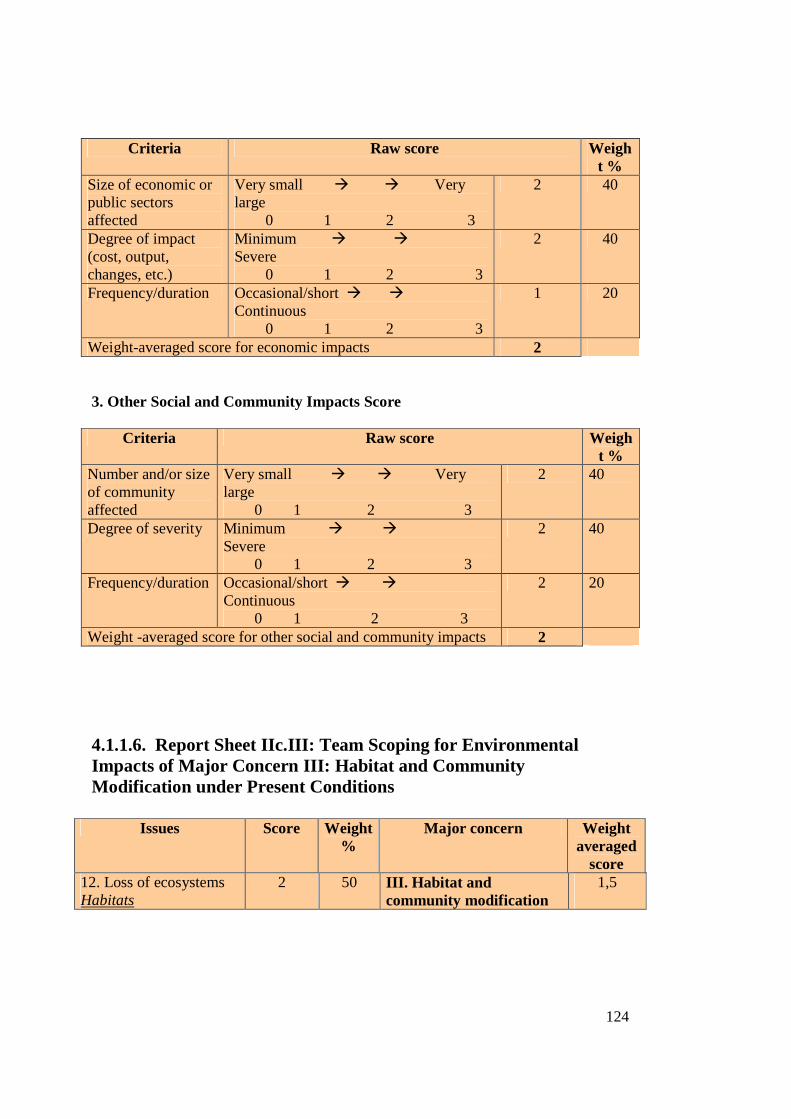
124
Criteria Raw score Weight %
Size of economic or public sectors affected
Very small � � Very large 0 1 2 3
2 40
Degree of impact (cost, output, changes, etc.)
Minimum � � Severe 0 1 2 3
2 40
Frequency/duration Occasional/short � � Continuous 0 1 2 3
1 20
Weight-averaged score for economic impacts 2 3. Other Social and Community Impacts Score
Criteria Raw score Weight %
Number and/or size of community affected
Very small � � Very large 0 1 2 3
2 40
Degree of severity Minimum � � Severe 0 1 2 3
2 40
Frequency/duration Occasional/short � � Continuous 0 1 2 3
2 20
Weight -averaged score for other social and community impacts 2
4.1.1.6. Report Sheet IIc.III: Team Scoping for Environmental Impacts of Major Concern III: Habitat and Community Modification under Present Conditions
Issues Score Weight %
Major concern Weight averaged
score 12. Loss of ecosystems Habitats
2 50 III. Habitat and community modification
1,5
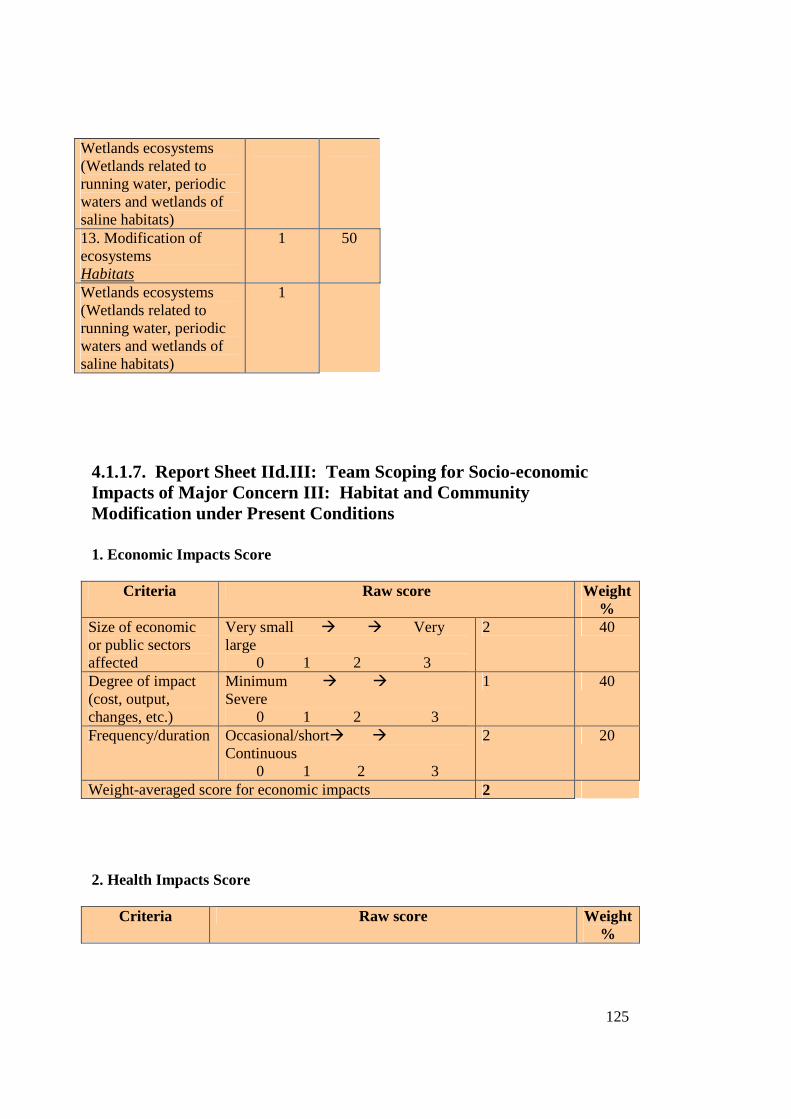
125
Wetlands ecosystems (Wetlands related to running water, periodic waters and wetlands of saline habitats)
13. Modification of ecosystems Habitats
1 50
Wetlands ecosystems (Wetlands related to running water, periodic waters and wetlands of saline habitats)
1
4.1.1.7. Report Sheet IId.III: Team Scoping for Socio-economic Impacts of Major Concern III: Habitat and Communit y Modification under Present Conditions 1. Economic Impacts Score
Criteria Raw score Weight %
Size of economic or public sectors affected
Very small � � Very large 0 1 2 3
2 40
Degree of impact (cost, output, changes, etc.)
Minimum � � Severe 0 1 2 3
1 40
Frequency/duration Occasional/short� � Continuous 0 1 2 3
2 20
Weight-averaged score for economic impacts 2 2. Health Impacts Score
Criteria Raw score Weight %
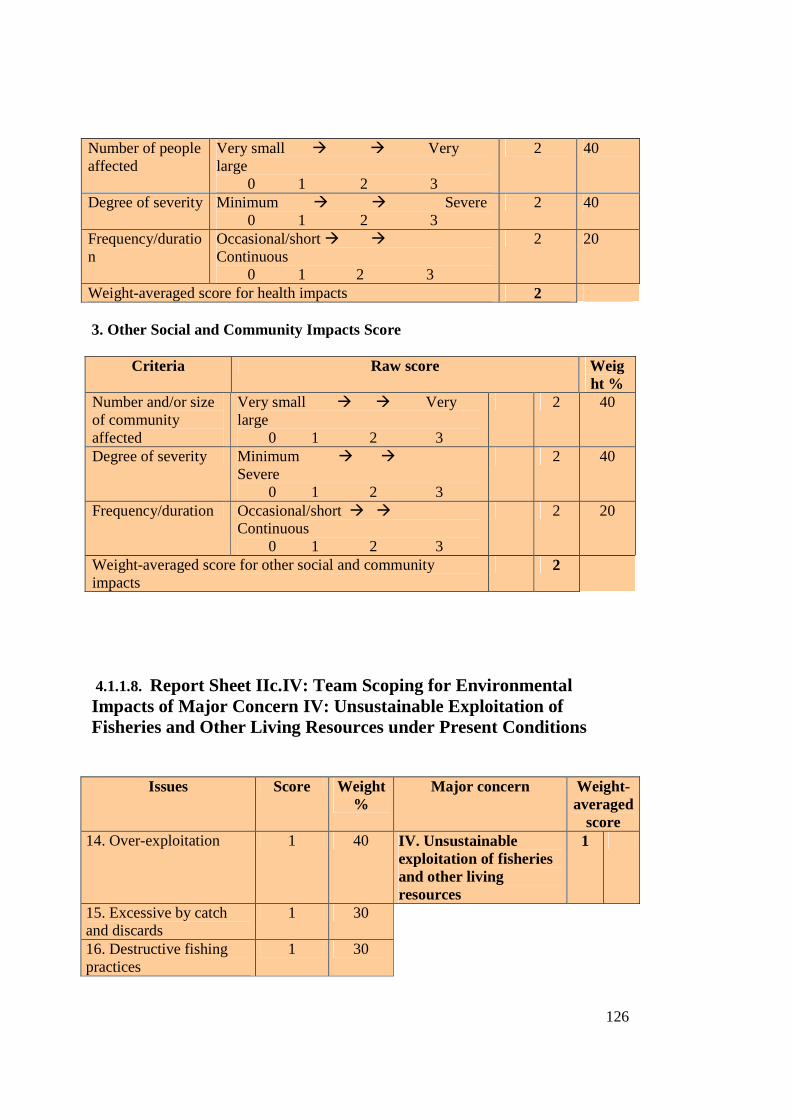
126
Number of people affected
Very small � � Very large 0 1 2 3
2 40
Degree of severity Minimum � � Severe 0 1 2 3
2 40
Frequency/duration
Occasional/short � � Continuous 0 1 2 3
2 20
Weight-averaged score for health impacts 2 3. Other Social and Community Impacts Score
Criteria Raw score Weight %
Number and/or size of community affected
Very small � � Very large 0 1 2 3
2 40
Degree of severity Minimum � � Severe 0 1 2 3
2 40
Frequency/duration Occasional/short � � Continuous 0 1 2 3
2 20
Weight-averaged score for other social and community impacts
2
4.1.1.8. Report Sheet IIc.IV: Team Scoping for Environmental Impacts of Major Concern IV: Unsustainable Exploitation of Fisheries and Other Living Resources under Present Conditions
Issues Score Weight %
Major concern Weight-averaged
score 14. Over-exploitation 1 40 IV. Unsustainable
exploitation of fisheries and other living resources
1
15. Excessive by catch and discards
1 30
16. Destructive fishing practices
1 30
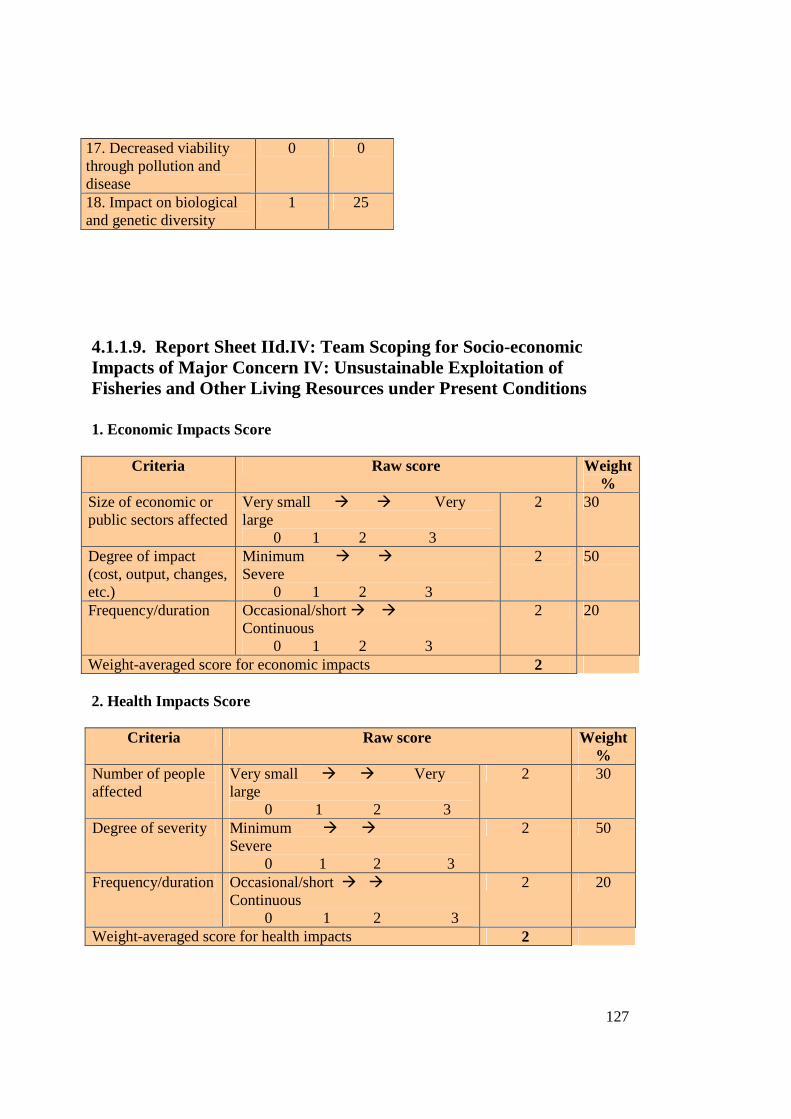
127
17. Decreased viability through pollution and disease
0 0
18. Impact on biological and genetic diversity
1 25
4.1.1.9. Report Sheet IId.IV: Team Scoping for Socio-economic Impacts of Major Concern IV: Unsustainable Exploitation of Fisheries and Other Living Resources under Present Conditions 1. Economic Impacts Score
Criteria Raw score Weight %
Size of economic or public sectors affected
Very small � � Very large 0 1 2 3
2 30
Degree of impact (cost, output, changes, etc.)
Minimum � � Severe 0 1 2 3
2 50
Frequency/duration Occasional/short � � Continuous 0 1 2 3
2 20
Weight-averaged score for economic impacts 2 2. Health Impacts Score
Criteria Raw score Weight %
Number of people affected
Very small � � Very large 0 1 2 3
2 30
Degree of severity Minimum � � Severe 0 1 2 3
2 50
Frequency/duration Occasional/short � � Continuous 0 1 2 3
2 20
Weight-averaged score for health impacts 2
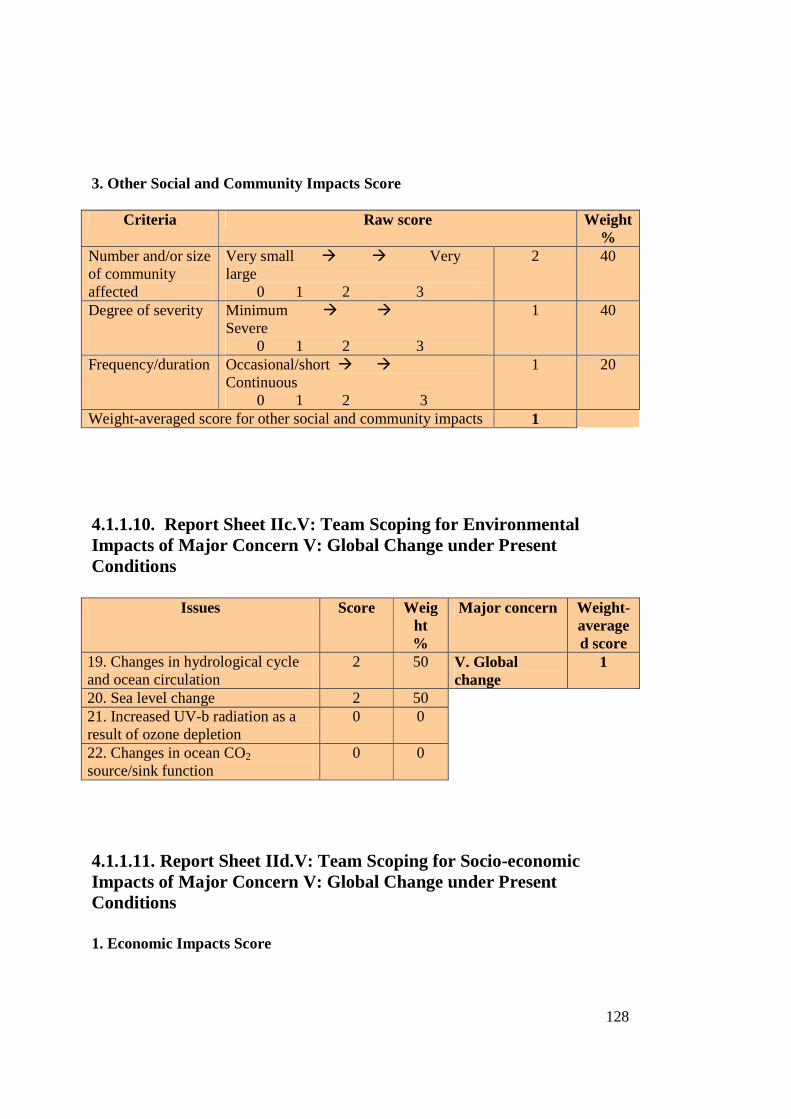
128
3. Other Social and Community Impacts Score
Criteria Raw score Weight %
Number and/or size of community affected
Very small � � Very large 0 1 2 3
2 40
Degree of severity Minimum � � Severe 0 1 2 3
1 40
Frequency/duration Occasional/short � � Continuous 0 1 2 3
1 20
Weight-averaged score for other social and community impacts 1
4.1.1.10. Report Sheet IIc.V: Team Scoping for Environmental Impacts of Major Concern V: Global Change under Present Conditions
Issues Score Weight %
Major concern Weight-averaged score
19. Changes in hydrological cycle and ocean circulation
2 50 V. Global change
1
20. Sea level change 2 50 21. Increased UV-b radiation as a result of ozone depletion
0 0
22. Changes in ocean CO2 source/sink function
0 0
4.1.1.11. Report Sheet IId.V: Team Scoping for Socio-economic Impacts of Major Concern V: Global Change under Present Conditions 1. Economic Impacts Score
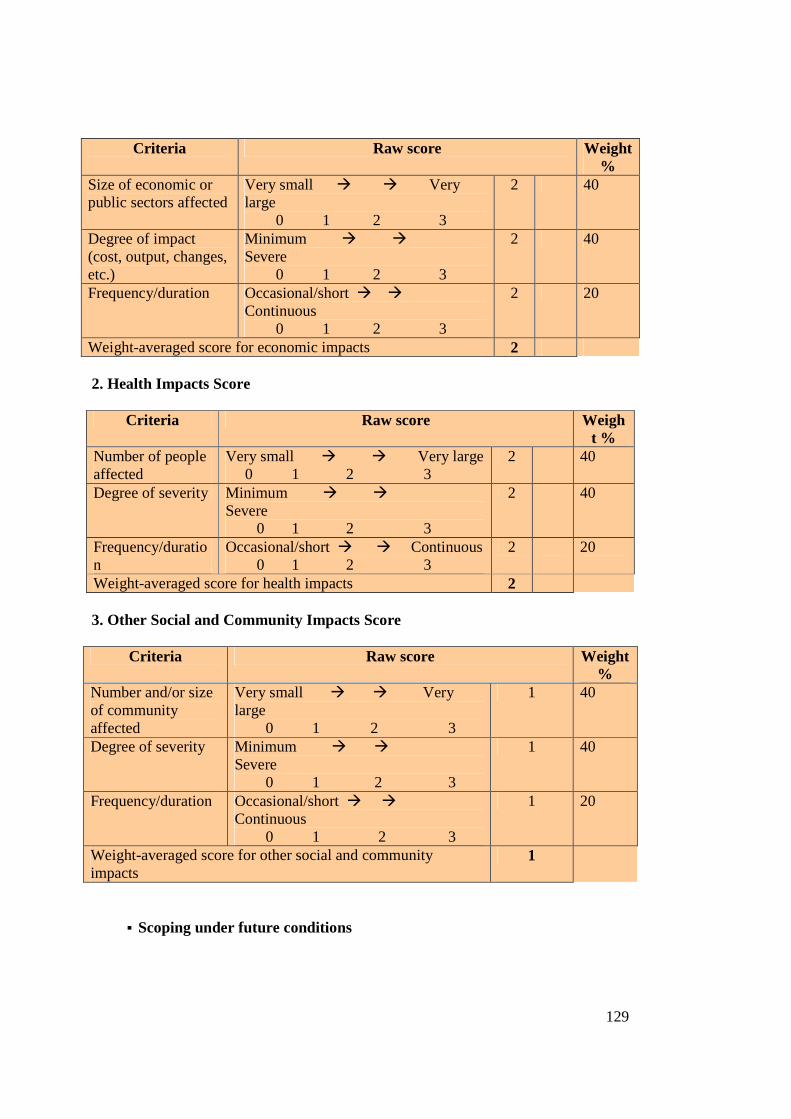
129
Criteria Raw score Weight %
Size of economic or public sectors affected
Very small � � Very large 0 1 2 3
2 40
Degree of impact (cost, output, changes, etc.)
Minimum � � Severe 0 1 2 3
2 40
Frequency/duration Occasional/short � � Continuous 0 1 2 3
2 20
Weight-averaged score for economic impacts 2 2. Health Impacts Score
Criteria Raw score Weight %
Number of people affected
Very small � � Very large 0 1 2 3
2 40
Degree of severity Minimum � � Severe 0 1 2 3
2 40
Frequency/duration
Occasional/short � � Continuous 0 1 2 3
2 20
Weight-averaged score for health impacts 2 3. Other Social and Community Impacts Score
Criteria Raw score Weight %
Number and/or size of community affected
Very small � � Very large 0 1 2 3
1 40
Degree of severity Minimum � � Severe 0 1 2 3
1 40
Frequency/duration Occasional/short � � Continuous 0 1 2 3
1 20
Weight-averaged score for other social and community impacts
1
� Scoping under future conditions
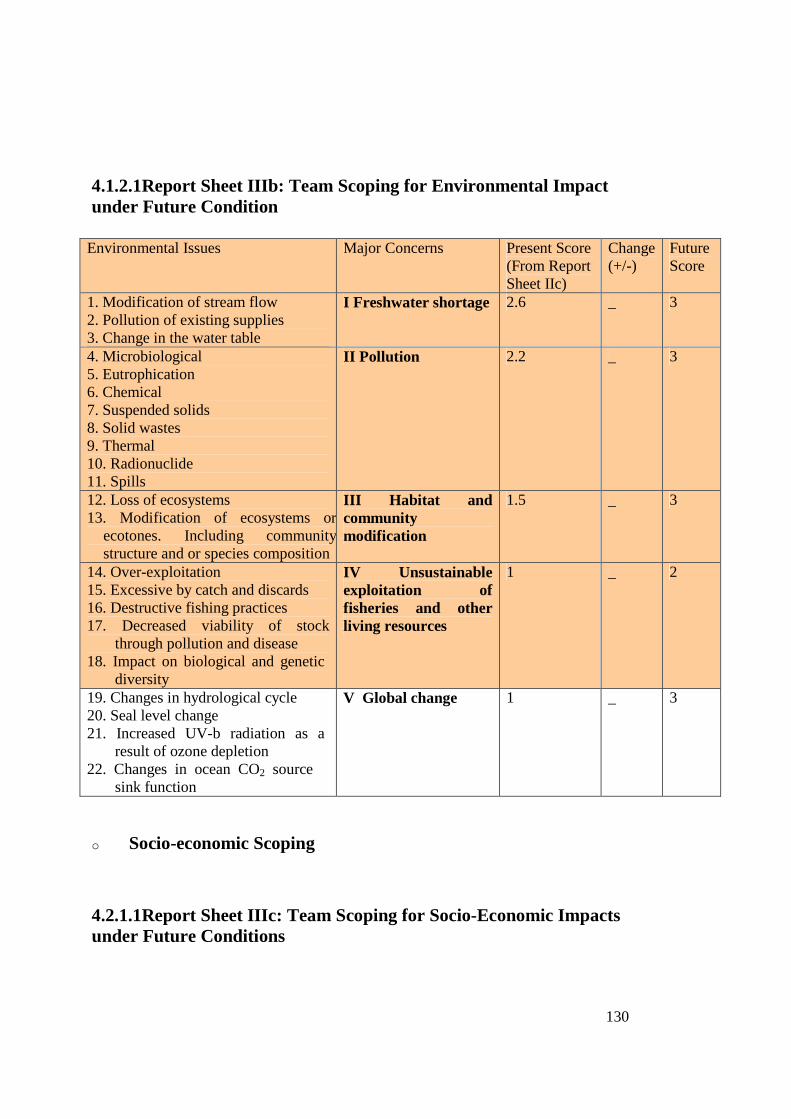
130
4.1.2.1Report Sheet IIIb: Team Scoping for Environmental Impact under Future Condition
Environmental Issues Major Concerns Present Score (From Report Sheet IIc)
Change (+/-)
Future Score
1. Modification of stream flow 2. Pollution of existing supplies 3. Change in the water table
I Freshwater shortage 2.6 _ 3
4. Microbiological 5. Eutrophication 6. Chemical 7. Suspended solids 8. Solid wastes 9. Thermal 10. Radionuclide 11. Spills
II Pollution 2.2 _ 3
12. Loss of ecosystems 13. Modification of ecosystems or
ecotones. Including community structure and or species composition
III Habitat and community modification
1.5 _ 3
14. Over-exploitation 15. Excessive by catch and discards 16. Destructive fishing practices 17. Decreased viability of stock
through pollution and disease 18. Impact on biological and genetic
diversity
IV Unsustainable exploitation of fisheries and other living resources
1 _ 2
19. Changes in hydrological cycle 20. Seal level change 21. Increased UV-b radiation as a
result of ozone depletion 22. Changes in ocean CO2 source
sink function
V Global change 1 _ 3
o Socio-economic Scoping
4.2.1.1Report Sheet IIIc: Team Scoping for Socio-Economic Impacts under Future Conditions
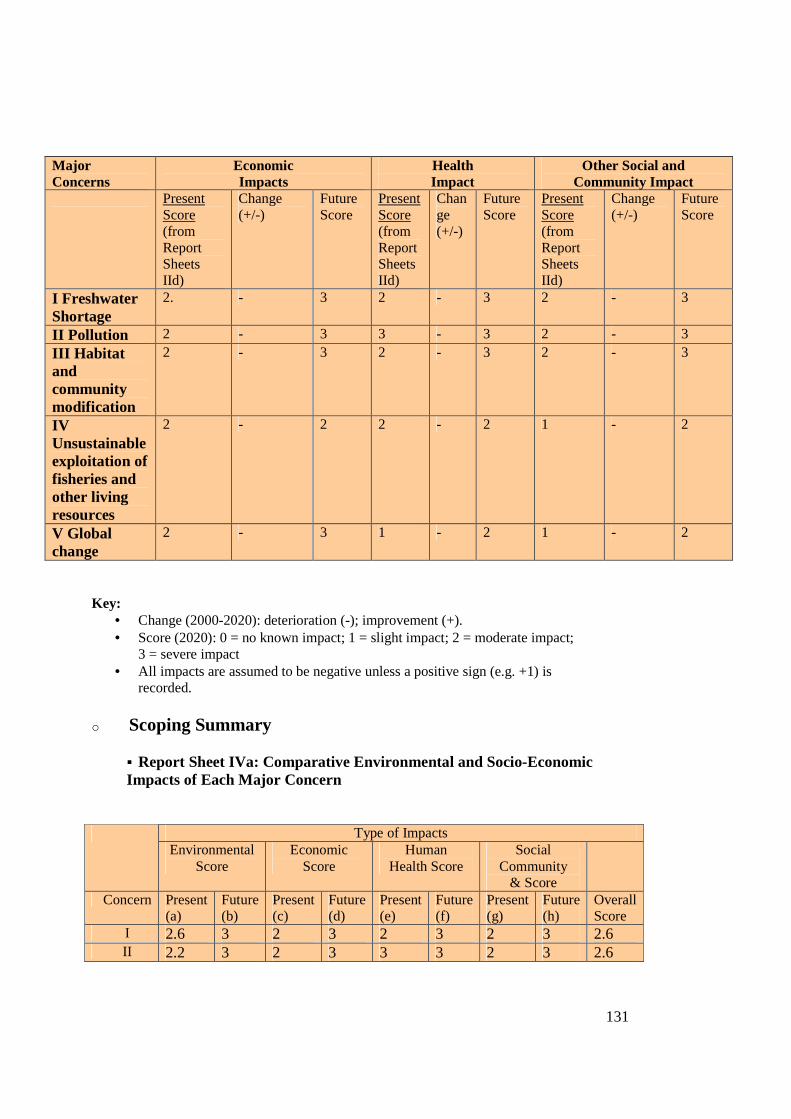
131
Major Concerns
Economic Impacts
Health Impact
Other Social and Community Impact
Present Score (from Report Sheets IId)
Change (+/-)
Future Score
Present Score (from Report Sheets IId)
Change (+/-)
Future Score
Present Score (from Report Sheets IId)
Change (+/-)
Future Score
I Freshwater Shortage
2. - 3 2 - 3 2 - 3
II Pollution 2 - 3 3 - 3 2 - 3
III Habitat and community modification
2 - 3 2 - 3 2 - 3
IV Unsustainable exploitation of fisheries and other living resources
2 - 2 2 - 2 1 - 2
V Global change
2 - 3 1 - 2 1 - 2
Key:
• Change (2000-2020): deterioration (-); improvement (+). • Score (2020): 0 = no known impact; 1 = slight impact; 2 = moderate impact;
3 = severe impact • All impacts are assumed to be negative unless a positive sign (e.g. +1) is
recorded. o Scoping Summary
� Report Sheet IVa: Comparative Environmental and Socio-Economic Impacts of Each Major Concern
Type of Impacts Environmental
Score Economic
Score Human
Health Score Social
Community & Score
Concern Present (a)
Future (b)
Present (c)
Future (d)
Present (e)
Future (f)
Present (g)
Future (h)
Overall Score
I 2.6 3 2 3 2 3 2 3 2.6 II 2.2 3 2 3 3 3 2 3 2.6
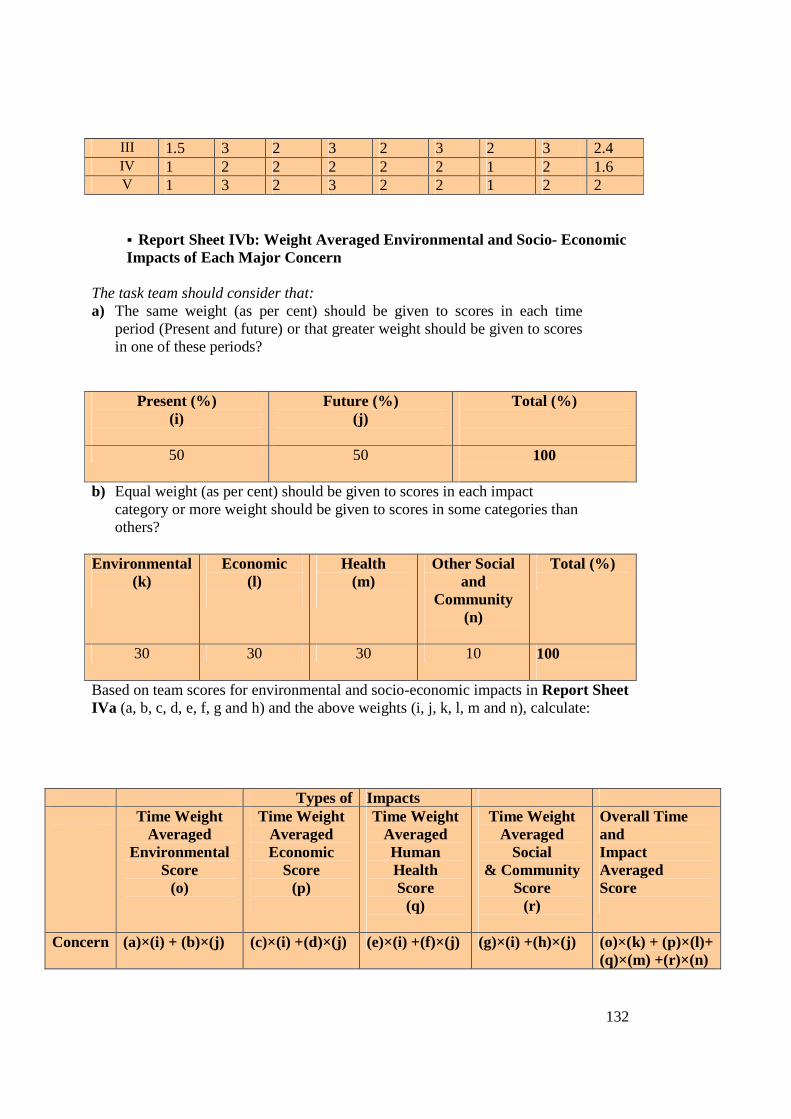
132
III 1.5 3 2 3 2 3 2 3 2.4 IV 1 2 2 2 2 2 1 2 1.6 V 1 3 2 3 2 2 1 2 2
� Report Sheet IVb: Weight Averaged Environmental and Socio- Economic Impacts of Each Major Concern
The task team should consider that: a) The same weight (as per cent) should be given to scores in each time
period (Present and future) or that greater weight should be given to scores in one of these periods?
Present (%) (i)
Future (%) (j)
Total (%)
50 50 100
b) Equal weight (as per cent) should be given to scores in each impact category or more weight should be given to scores in some categories than others?
Environmental
(k)
Economic (l)
Health (m)
Other Social and
Community (n)
Total (%)
30 30 30 10 100
Based on team scores for environmental and socio-economic impacts in Report Sheet IVa (a, b, c, d, e, f, g and h) and the above weights (i, j, k, l, m and n), calculate:
Types of Impacts Time Weight
Averaged Environmental
Score (o)
Time Weight Averaged Economic
Score (p)
Time Weight Averaged Human Health Score
(q)
Time Weight Averaged
Social & Community
Score (r)
Overall Time and Impact Averaged Score
Concern (a)×(i) + (b)×(j) (c)×(i) +(d)×(j) (e)×(i) +(f)×(j) (g)×(i) +(h)×(j) (o)×(k) + (p)×(l)+ (q)×(m) +(r)×(n)
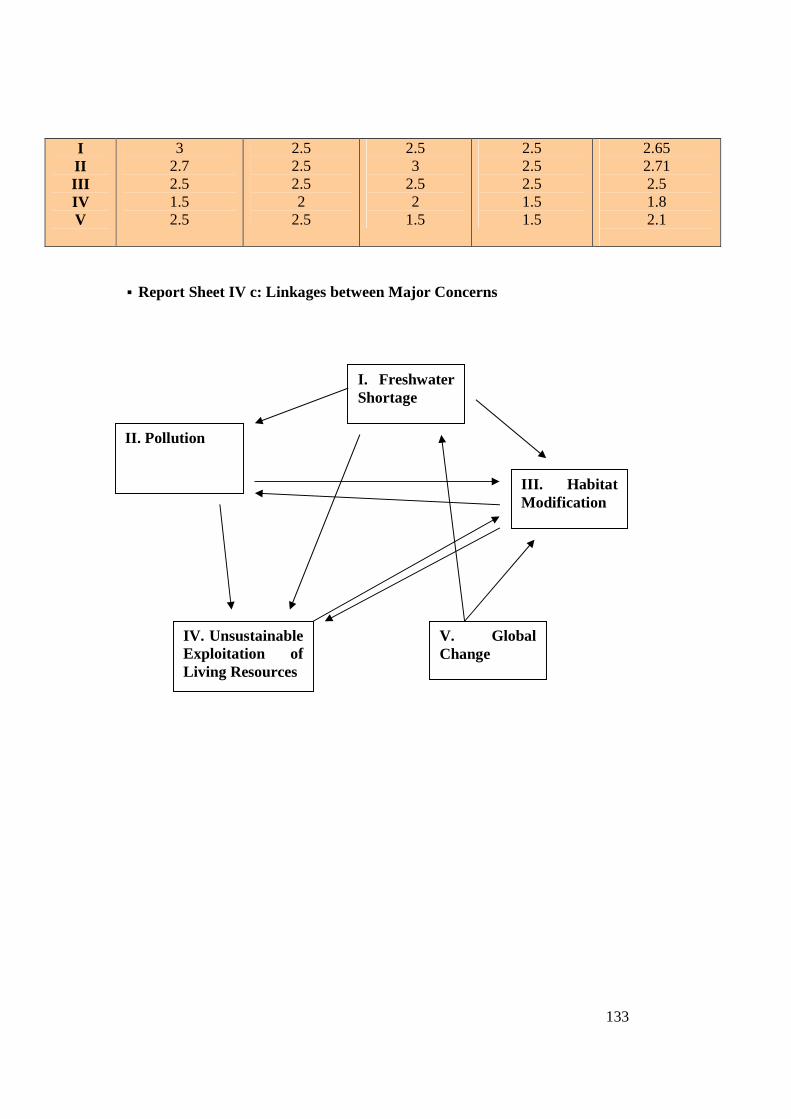
133
I II III IV V
3 2.7 2.5 1.5 2.5
2.5 2.5 2.5 2
2.5
2.5 3
2.5 2
1.5
2.5 2.5 2.5 1.5 1.5
2.65 2.71 2.5 1.8 2.1
� Report Sheet IV c: Linkages between Major Concerns
II. Pollution
I. Freshwater Shortage
III. Habitat Modification
IV. Unsustainable Exploitation of Living Resources
V. Global Change
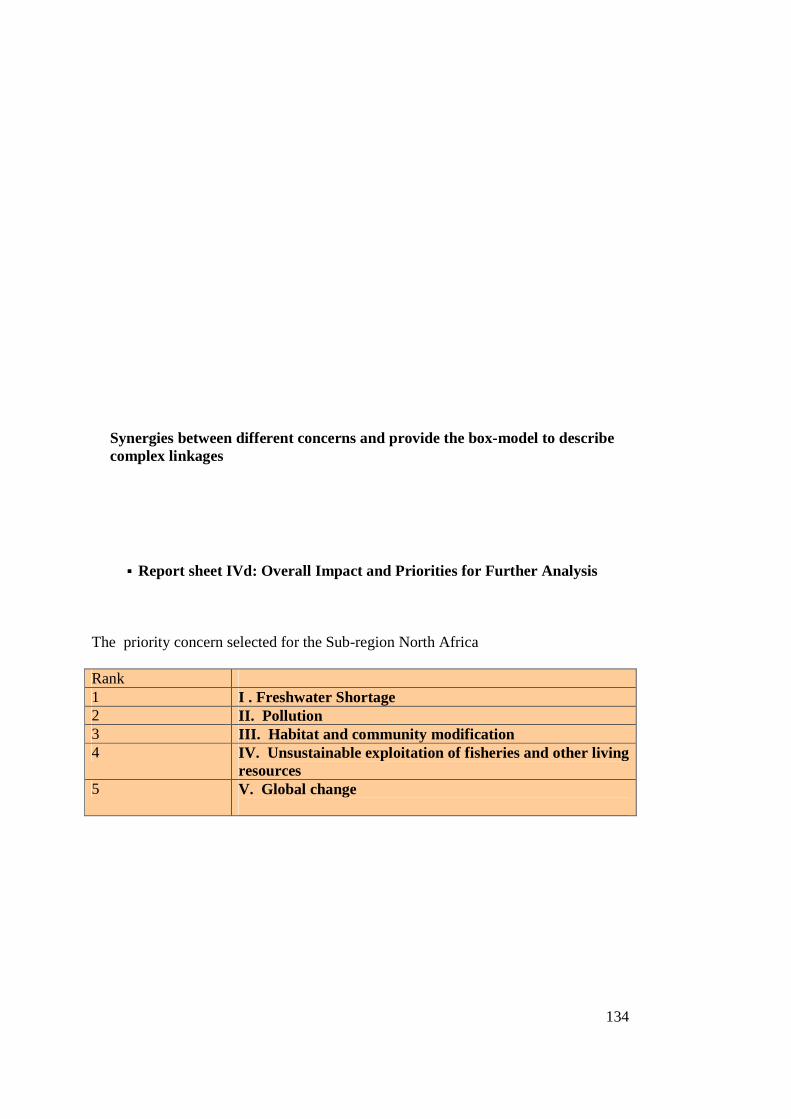
134
Synergies between different concerns and provide the box-model to describe complex linkages
� Report sheet IVd: Overall Impact and Priorities for Further Analysis The priority concern selected for the Sub-region North Africa Rank 1 I . Freshwater Shortage 2 II. Pollution 3 III. Habitat and community modification 4 IV. Unsustainable exploitation of fisheries and other living
resources 5 V. Global change

135
REFERENCES