reconstructing the future capacity planning with data that’s gone “troppo” steve jenkin - info...
Post on 19-Dec-2015
218 views
TRANSCRIPT

Reconstructing the Future
Capacity Planning with data that’s gone “Troppo”
Steve Jenkin - Info Tech.
Neil Gunther - Performance Dynamics

2
Overview
• Background• Process: acquire data, investigate, analyse/model
– The detail– Sifting through the lumps– Data Analysis and Modeling
• Summary

3
Aims
• With relic data, wanted to write up analysis in performance modeling terms.
• Believed techniques for success in project useful to designers and practitioners.

4
Background
• ATO project - one of many hosted sites– 12-18 month project– Replacements I & II followed
• “Complex Environment”• System Diagram• Software Contractor• Our bad days
– Runaway Failure late February– Anzac Day - security pinhole

5
System Diagram
F Web F DBNet
System Design required by DSD

6
System Diagram - II
F
Bal
F
DB
Net
WebWeb Web
Admin
System as Run

7
System Diagram - III
F
Bal
F
DB
Net
WebWeb Web
Admin
The “rate limiting” factor

8
Good Design Aspects
• Secure Hosting Facility, Dual Firewalls.• No cookies, some javascript.• Through testing on many browsers and OS.• 128-bit SSL + Unique ID + Random + Password• Dual paths for transferring registrations
– E-mail - MD5 + acknowledgements– ‘Plan B’ - CD’s of files
• Load Balancer best operational decision.

9
Software Contractor
• “0NF” database design.
• “Don’t worry about faults”.
• Message flood(s).
• “Everything in the Database” strategy.
• Monitoring, Capacity Planning, Traffic Forecasting, Stress Testing, Pre-Production
• …

10
Zeroth Normal Form (“0NF”)
• Single 3-column table.– Key {ID + tag} + 255 “varchar” data
• 600,000 full registrations with 300-500 fields
• Random check number, not Unique (sequential) ID, used in Key.
• Performance, scalability, capacity impacts
• Great for knocking up a quick PHP prototype.

11
The Detail or Getting the Numbers
• 'struct acct' ain't 'struct acct’– Solaris: 40 bytes, Linux: 64 bytes– Available process accounting tools didn’t work.– missing bytes: ‘undocumented feature’
• “Word alignment” on 4 byte boundaries - padding required
– SPARC is “big-endian”, Intel is “little-endian”.– perl can be better than ‘C’ - pack/unpack
• Raw Data:– 4 machines, 165 days, 1 compressed file/day– 3Gb uncompressed binary data

12
struct acct - Solarisstruct acct{ char ac_flag; /* Accounting flag */ char ac_stat; /* Exit status */ char ac_pad[2]; /* PADDING */ uid_t ac_uid; /* Accounting user ID */ gid_t ac_gid; /* Accounting group ID */ dev_t ac_tty; /* control tty */ time_t ac_btime; /* Beginning time */ comp_t ac_utime; /* accounting user time in clock ticks */ comp_t ac_stime; /* accounting system time in clock ticks */ comp_t ac_etime; /* accounting total elapsed time in clock ticks */ comp_t ac_mem; /* memory usage in clicks (pages) */ comp_t ac_io; /* chars transferred by read/write */ comp_t ac_rw; /* number of block reads/writes */ char ac_comm[8]; /* command name */};
Sizeof is 40 bytes, But 1+1+2+(2*4)+2+4+(6*2)+8 = 38 Huh?
How long is a ‘clock tick’?
What’s a ‘comp_t’, ‘uid_t’, …?

13
struct acct - PerlFormat string for unpack:my $SPACCT_T = 'C C n N N N N n n n n n n A8';
Pack/unpack:C - 1 charn - 2 byte int (network order)N - 4 byte int (network order)A8 - 8 byte ascii string
Compt_t, dev_t: 16 bits, rest 32.“comp_t is a 16-bit floating point number with a 3-bit (base 8) exponent and a 13-bit fraction.”

14
Concluding ‘struct’
• Converted Solaris binary ‘acct’ records to tab-separated ascii. The Unix standard.– Ended up adding the ‘unix time’ number in there, not just YYYY-MM-
DD HH:MM:SS - better for sorting and joins.
• Concatenated all those pesky daily files.– 42M records compressed into 121Mb ascii for DB server.
• ‘awk’, grep, sort, join, etc to manipulate data.• Created summary tools. EG: Total counts in an interval.

15
The Last Detail
• Why only the DB Server? – Too hard lining up times on servers and identifying web traffic.
• Why ORACLE ‘connections’?– Summary count of commands run by the DB server.
19975897 oracle19965977 tnslsnr 888528 beprms 480040 bepsend 453807 beprms-r 447294 beptms 54489 bepqueue 14479 beptest. 5984 imotof_a 399 beprms_r 382 bepimoto 6 bepcd_ac 5 bepmanag

16
Sifting through the lumps
• With 20M records and 1M on your busiest day, simple tools aren’t going to cut it.
• Selecting and aggregating data is critical.
• Visualising the effects is really important.– But asking ‘gnuplot’ (or anything) to plot 5 minute
samples for 165 days (~50,000 points) isn’t a good idea.
17
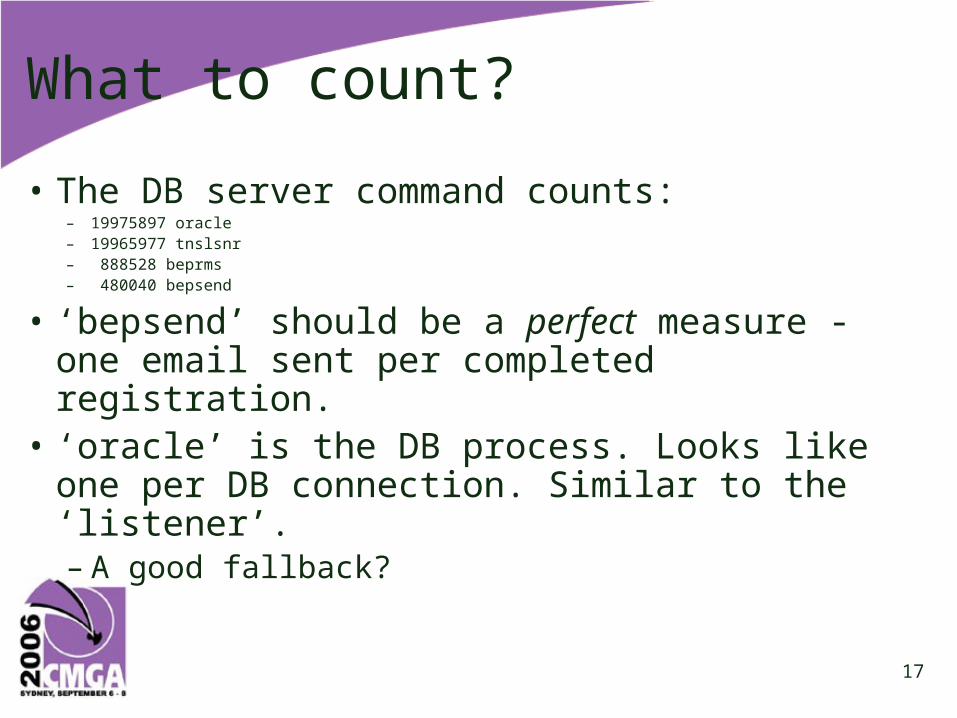
What to count?
• The DB server command counts:– 19975897 oracle– 19965977 tnslsnr– 888528 beprms– 480040 bepsend
• ‘bepsend’ should be a perfect measure - one email sent per completed registration.
• ‘oracle’ is the DB process. Looks like one per DB connection. Similar to the ‘listener’.– A good fallback?

18
‘bepsend’. Why not - I
‘bepsend’ completed registrations - whole period

19
‘bepsend’. Why not - II
‘bepsend’ completed registrations - 3 weeks of spike

20
‘bepsend’. Why not - III
• E-mails not always sent.
• There were floods after ‘stoppages’.
• The rate was capped at 600 or 1000/hr.
• Turned off ‘bepsend’ for the Busiest day.– spent next 3 days clearing the backlog.
• Close, but no cigar.

21
Why Oracle Connections?
Oracle Connections vs ‘bepsend’

22
Analysing the Data
• “Exponential Growth” was initially used to model the site traffic.– But was that right?– Never went back and checked the model.
• From inspection, the traffic (DB connections), has at least three distinct regions.– Is the “obvious” correct?– Is traffic growth exponential or something else?– Is there anything else useful in there?

23
Mathematica Marvels
• Reconstructing the original exponential model– – Doubling period ~6 weeks– But significantly low around the spike
• Enter the Power Law - – “highly correlated behaviour” as a cause– “The system is primarily doing just one thing for
a longer than average time” [Gun06]
€
ˆ y (t) = αeβt
€
ˆ y (t) =α
t − tc
β

24
Power Law
Log-Log plot demonstrating
Power Law behaviour

25
Exponential vs Power Law Fit

26
The Spike
• Problems:– The spike is too high for the simple model– Ummm, just how many registrations were there?
• Major Insight - something else was going on.– Busy Tone impact wasn’t modeled.– PDQ model of two linked queues possible
• Busy Tone queue (~ 5 seconds Q service time)• Registration queue (~30 minutes Q service time)

27
Other time-series models
• Simpoint• Irregular Sampling• Holt-Winters - for seasonal (repeating) data• From the paper:
– Neil Gunther’s expert area– The other techniques are appropriate when many chunks
are missing.– That wasn’t the problem here. But we know what to do in
those cases.

28
Getting Expert help
• With my trusty Excel & modest arsenal of techniques, no surprising results likely.
• Having someone to talk the problems through was invaluable.
• Especially when they have much better Maths, a bunch of powerful tools and lots of experience using them.
29
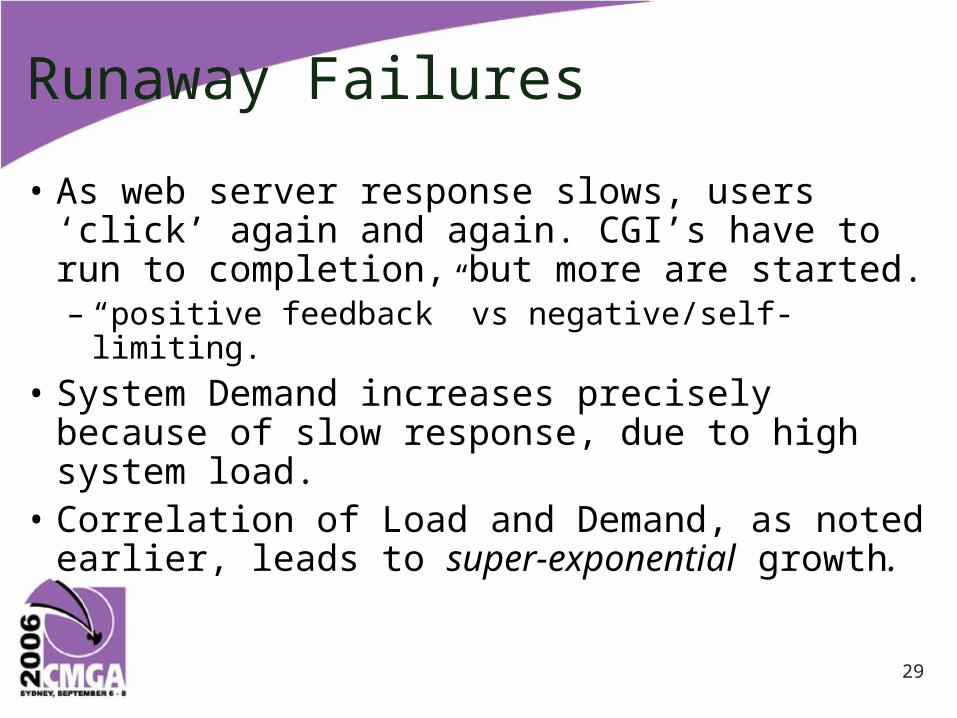
Runaway Failures
• As web server response slows, users ‘click’ again and again. CGI’s have to run to completion, but more are started.– “positive feedback” vs negative/self-limiting.
• System Demand increases precisely because of slow response, due to high system load.
• Correlation of Load and Demand, as noted earlier, leads to super-exponential growth.

30
Busy Tone
• A response to a system ‘meltdown’ due to sudden increase in demand when the site was first advertised.
• Load Average incr. from ~1 to 150 in meltdown.• Response Time not measured. “Off the chart”.• BT implementation weakness - DB access.• Consumed large fraction of system on Busy Day.
– System averaged 1250-1500 registrations/hr.

31
The ‘Fudge Factor’
• On the busiest day, sending completed registrations halted to lighten load.– Email sent by DB server.
• Because of previous mail floods, email rate limited - first to 600/hr, then 1000/hr.
• From 3am Tuesday evening to 2am Sunday, ~55,000 completed registrations.
• How much did Busy Tone increase workload?– A ‘Fudge Factor’ to convert work-load units:
‘connections’ to ‘registrations’ (internal to external)

32
The ‘Fudge Factor’ - II
Completed Registrations sent/hour over Busy 4 Days

33
The ‘Fudge Factor’ - III
Adjusted Completed Registrations May-June

34
The ‘Fudge Factor’ - IV
• For whole period– 19,965,976 Connections, 480,076 registrations, and ratio of 41.5
• For the ‘busiest 4 days’ 3am Tue 30/5 - 2am Sun 04/06 – 2,517,219 Oracle Connections– 54,245 Registrations completed (12.5% total)– 46.4 Connections/Registration ratio
• Rough effect of Busy Day– ~55,000 Connections at ‘average rate” = 2,256,006
an excess of 261,213 connections. – 10% for busy 4 days.– 20% if all on the day of the spike.– Averaged 12-13 ‘retries’ for all users.

35
Traffic Characteristics - Weekly
• Morning and Afternoon peaks– distinct lunch and tea times.
• High evening peak.
• But not on Friday nights.
• People are surprisingly busy on weekends.
• And many work late Sunday night.

36
Traffic Characteristics - I
37
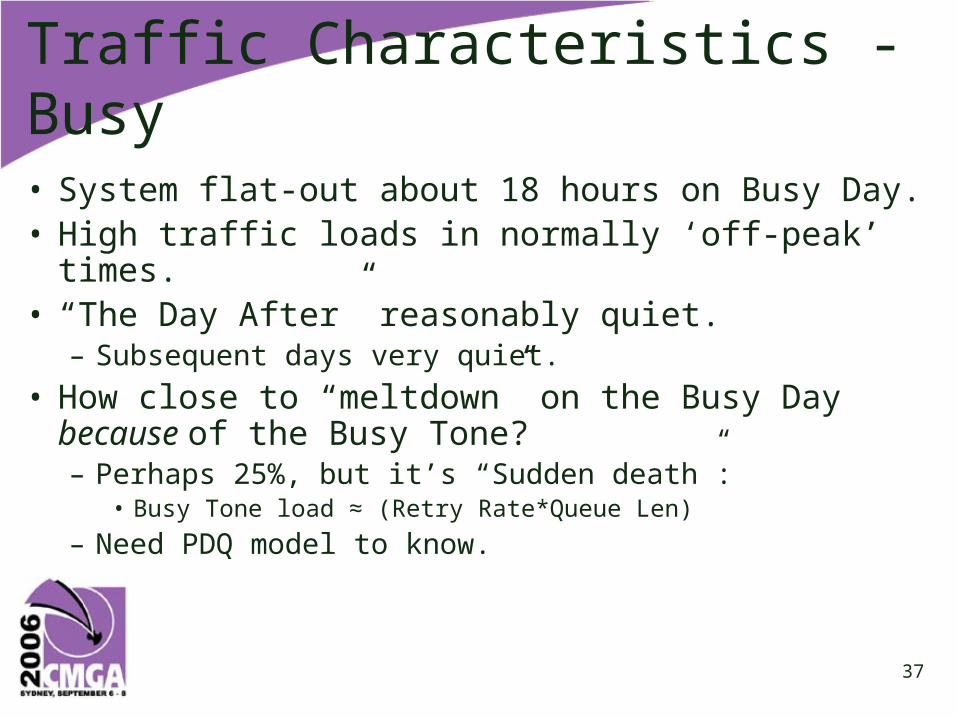
Traffic Characteristics - Busy
• System flat-out about 18 hours on Busy Day.• High traffic loads in normally ‘off-peak’ times.• “The Day After” reasonably quiet.
– Subsequent days very quiet.
• How close to “meltdown” on the Busy Day because of the Busy Tone?– Perhaps 25%, but it’s “Sudden death”:
• Busy Tone load ≈ (Retry Rate*Queue Len)
– Need PDQ model to know.

38
Traffic Characteristics - II
Monday, Tuesday and Wednesday Load

39
Traffic Characteristics - IV
Load in equivalent hours @ max throughput

40
Our new insights
• Metrics captured/displayed during the life of the system did not fully describe the load on the system.– registrations, response time and ‘vmstat’s. – No DB connects.
• Busy Tone created significant load.• The ‘spike’ on Busy Day was super-
exponential, not the original model.

41
Coulda, Woulda, Shoulda -Further work …• Develop simple PDQ model to incorporate busy
tone effect and show power law criticality.• Categorise connection data.• Investigate webserver data to reconstruct user
response time, and correlate with load. • Show problems tuning Busy Tone parameters.• Reconstruct system activity, % CPU and IO activity,
by aggregating process accounting data.

42
Further work …
• General Recommendations:– Design in instrumentation,Performance measurement, reporting and
analysis, Capacity Planning and Load Projections– Expect and prepare to report on “Lessons Learned”.
• E.g: Canadian report - half or more of the traffic in last 6 weeks.
– Design Operational Support & Fault Procedures, Fault Prioritisation, escalation, a war-room, security failure or disaster response plan.
– For e-mail transfer, use digests as well as backup CD's..
• Describe the many different traffic periods: – Pre-Xmas, Xmas, January Holidays, “Christmas rush”, The Next Day,
False Deadline and well afterwards

43
Summary
• We banged on some different system data and were able to verify some important system effects.
• And learnt a few new things along the way.– About the system.– About Busy Tone and more runaway failures.– About handling and processing large datasets.– About performance analysis and modeling .