recent workload characterization activities at nersc · recent workload characterization activities...
TRANSCRIPT
Recent Workload Characterization Activities at NERSC
Harvey Wasserman NERSC Science Driven System Architecture Group
www.nersc.gov/projects/SDSA October 15, 2008
Los Alamos Computer Science Symposium Workshop on Performance Analysis of Extreme-Scale Systems and Applications
Acknowledgments
• Contributions to this talk by many people:
1
Bill Kramer NERSC General
Manager
Katie Antypas NERSC USG
John Shalf NERSC SDSA
Erich Strohmaier LBNL FTG
Lin-Wang Wang LBNL SCG
Kathy Yelick NERSC Director
Esmond Ng LBNL SCG
Andrew Canning LBNL SCG
Full Report Available
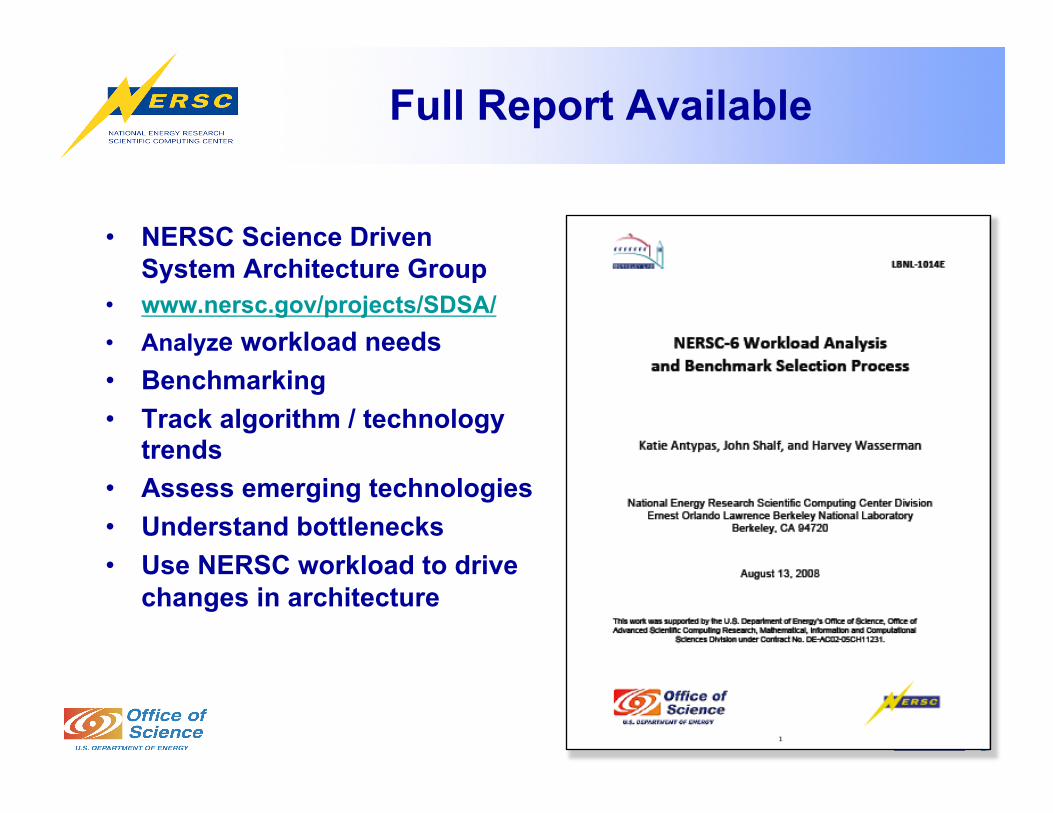
• NERSC Science Driven System Architecture Group
• www.nersc.gov/projects/SDSA/ • Analyze workload needs • Benchmarking • Track algorithm / technology
trends • Assess emerging technologies • Understand bottlenecks • Use NERSC workload to drive
changes in architecture
“Benchmarks are only useful insofar as they model the intended
computational workload.” Ingrid Bucher & Joanne Martin, LANL, 1982
“For better or for worse, benchmarks shape a field.”
Prof. David Patterson, UCB CS267 2004
3
Motivation
Science Driven Evaluation
• Translate scientific requirements into computational needs and then to a set of hardware and software attributes required to support them.
• Question: how do we represent these needs so we can communicate them to others? – Answer: a set of carefully chosen
benchmark programs.
NERSC Benchmarks Serve 3 Critical Roles
• Carefully chosen to represent characteristics of the expected NERSC workload.
• Give vendors opportunity to provide NERSC with concrete performance and scalability data; – Measured or projected.
• Part of acceptance test and the basis of performance obligations throughout a system’s lifetime.
5 www.nersc.gov/projects/procurements/NERSC6/benchmarks/
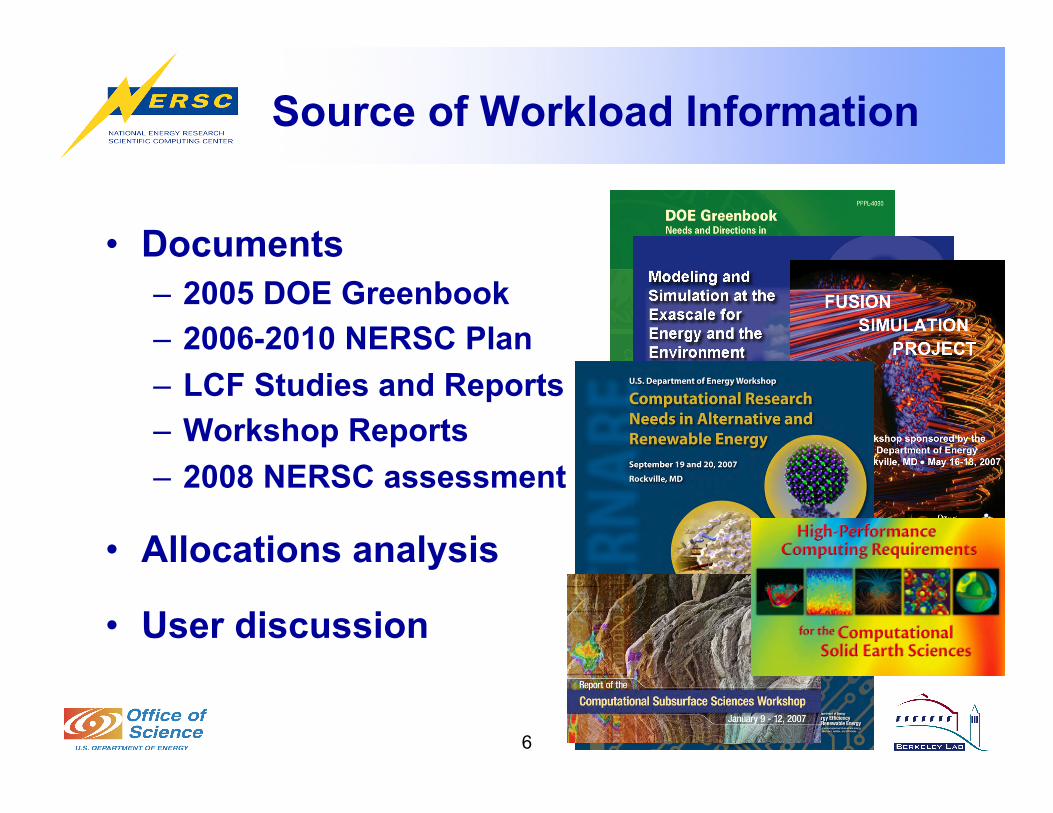
Source of Workload Information
6
• Documents – 2005 DOE Greenbook – 2006-2010 NERSC Plan – LCF Studies and Reports – Workshop Reports – 2008 NERSC assessment
• Allocations analysis
• User discussion

New Model for Collecting Requirements
• Modeled after ESnet activity rather than Greenbook – Two workshops per year, initially BER and BES
• Sources of Requirements – Office of Science (SC) Program Managers – Direct gathering through interaction with science users of
the network – Case studies, e.g., from ESnet
• Magnetic Fusion • Large Hadron Collider (LHC) • Climate Modeling • Spallation Neutron Source
7
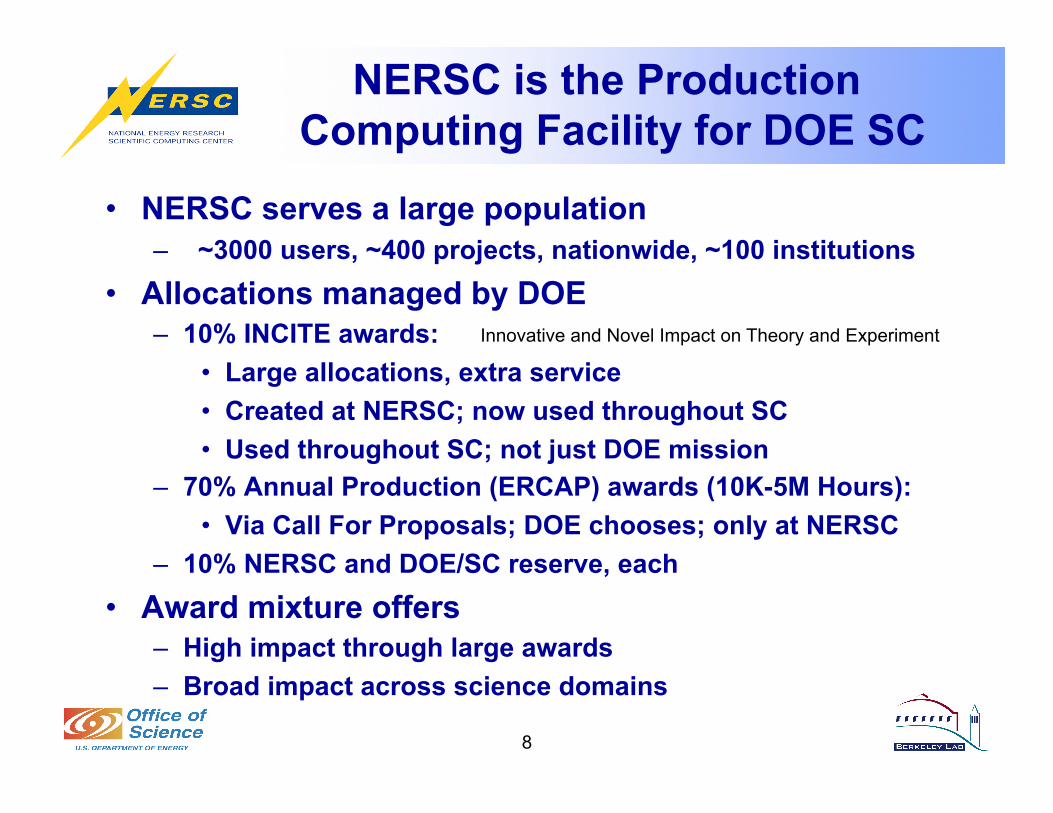
NERSC is the Production Computing Facility for DOE SC
• NERSC serves a large population – ~3000 users, ~400 projects, nationwide, ~100 institutions
• Allocations managed by DOE – 10% INCITE awards:
• Large allocations, extra service • Created at NERSC; now used throughout SC • Used throughout SC; not just DOE mission
– 70% Annual Production (ERCAP) awards (10K-5M Hours): • Via Call For Proposals; DOE chooses; only at NERSC
– 10% NERSC and DOE/SC reserve, each • Award mixture offers
– High impact through large awards – Broad impact across science domains
8
Innovative and Novel Impact on Theory and Experiment
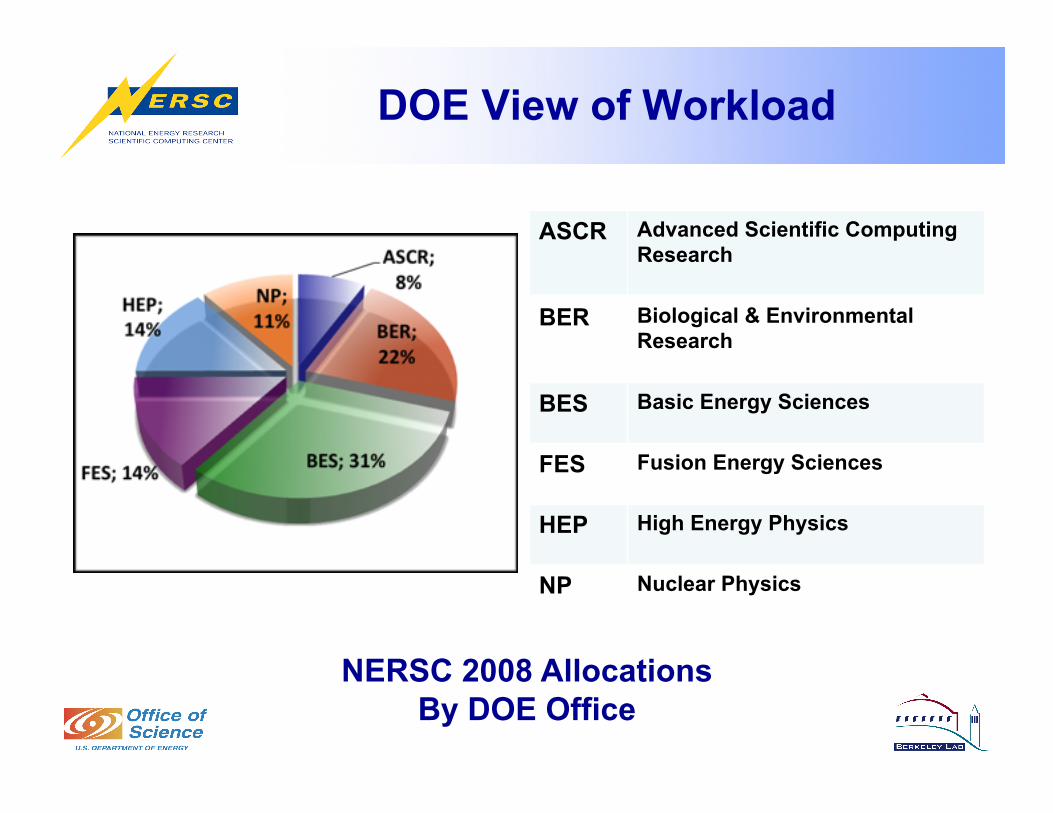
DOE View of Workload
ASCR Advanced Scientific Computing Research
BER Biological & Environmental Research
BES Basic Energy Sciences
FES Fusion Energy Sciences
HEP High Energy Physics
NP Nuclear Physics
NERSC 2008 Allocations By DOE Office
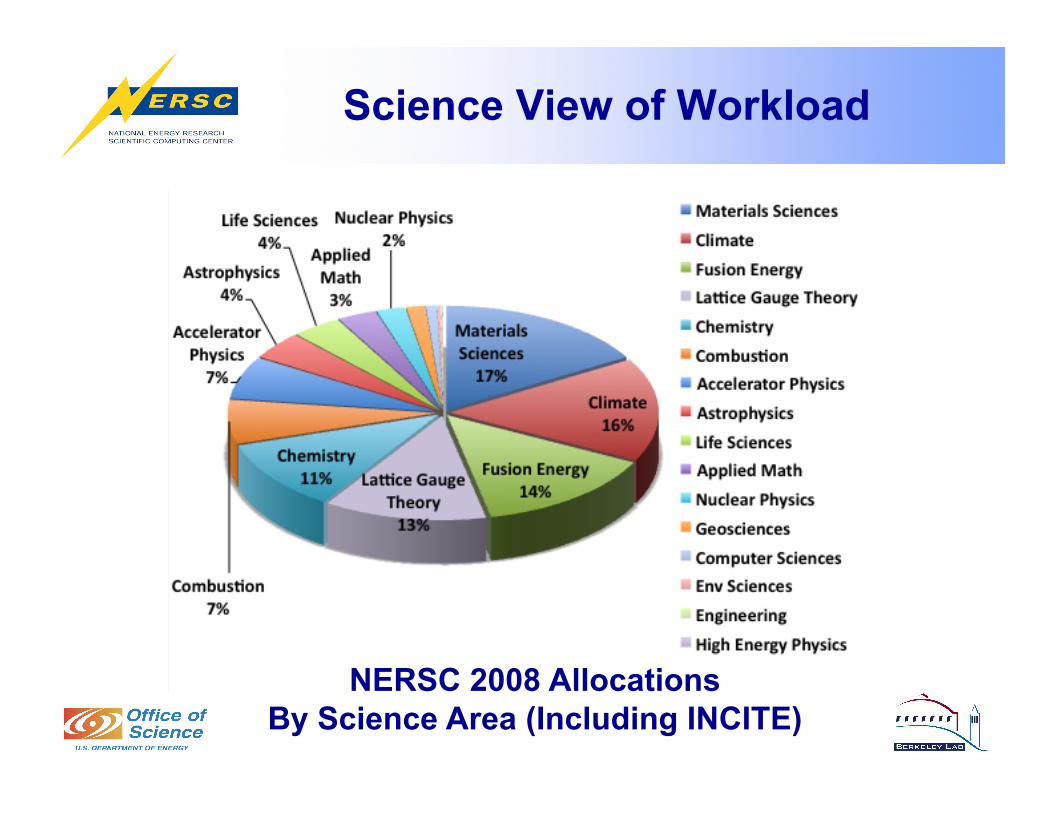
Science View of Workload
NERSC 2008 Allocations By Science Area (Including INCITE)
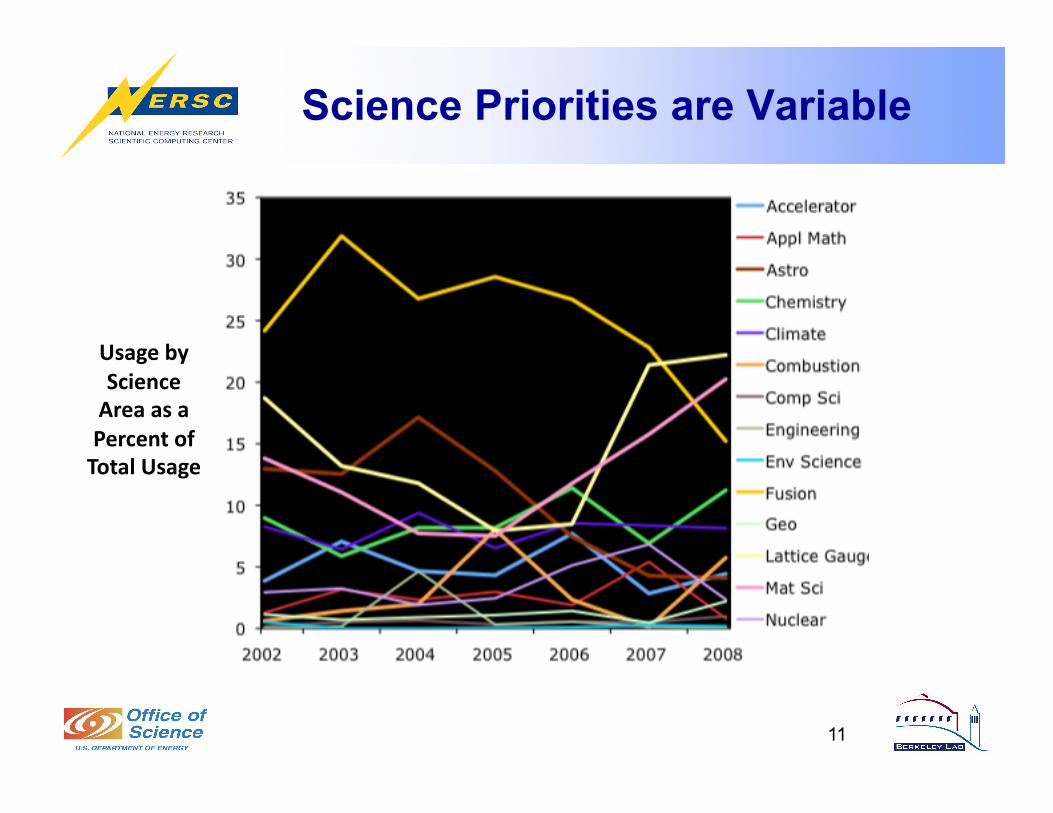
Science Priorities are Variable
11
UsagebyScienceAreaasaPercentofTotalUsage
Code / Needs by Science Area
12

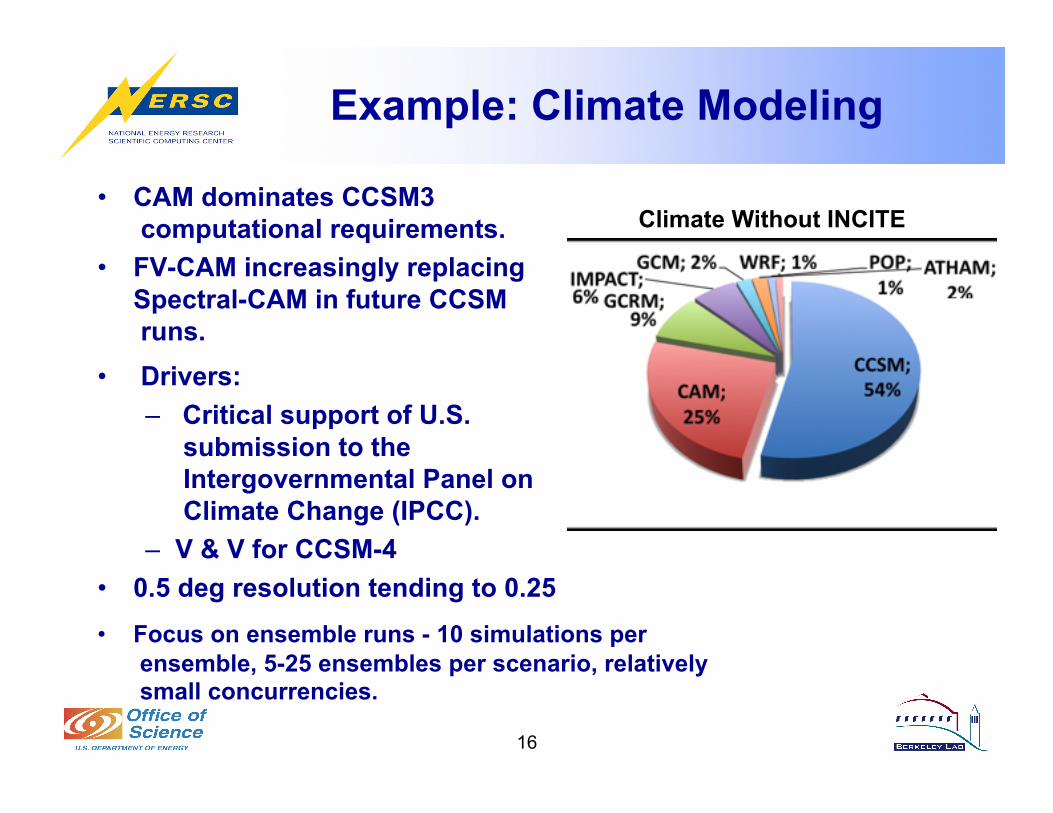
Example: Climate Modeling
• CAM dominates CCSM3 computational requirements.
• FV-CAM increasingly replacing Spectral-CAM in future CCSM runs.
• Drivers: – Critical support of U.S.
submission to the Intergovernmental Panel on Climate Change (IPCC).
– V & V for CCSM-4 • 0.5 deg resolution tending to 0.25
13
Climate Without INCITE
• Focus on ensemble runs - 10 simulations per ensemble, 5-25 ensembles per scenario, relatively small concurrencies.
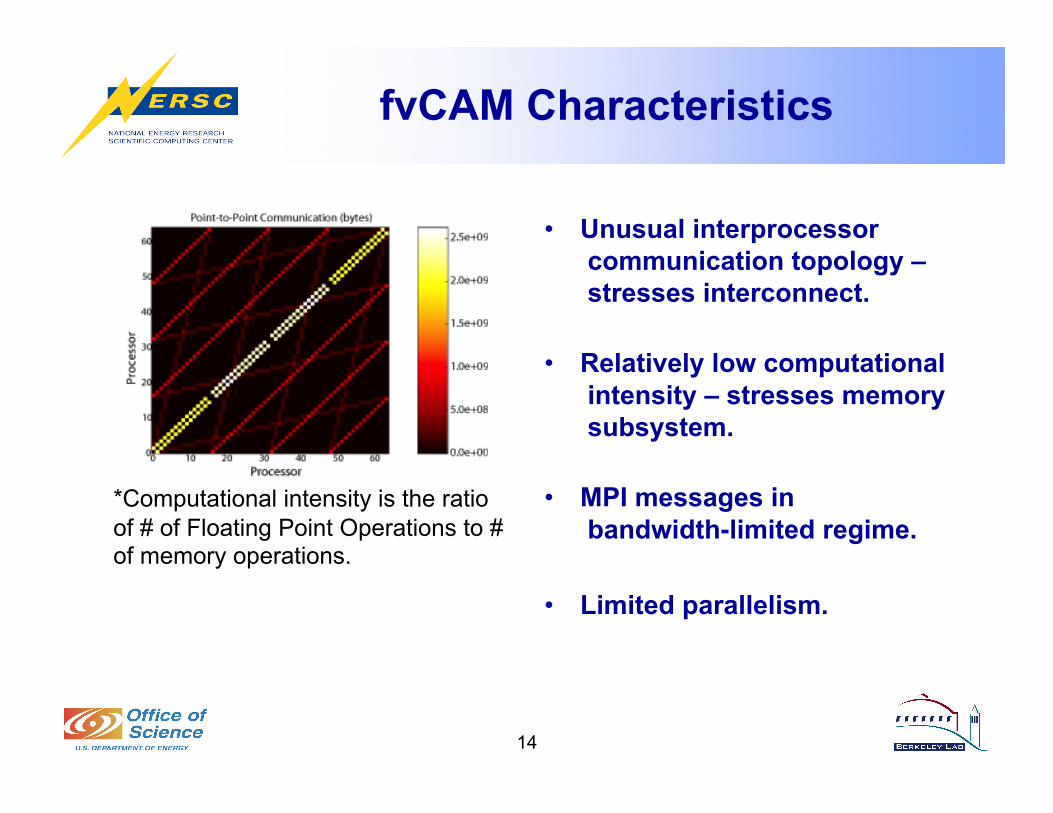
• Unusual interprocessor communication topology – stresses interconnect.
• Relatively low computational intensity – stresses memory subsystem.
• MPI messages in bandwidth-limited regime.
• Limited parallelism.
14
fvCAM Characteristics
*Computational intensity is the ratio of # of Floating Point Operations to # of memory operations.
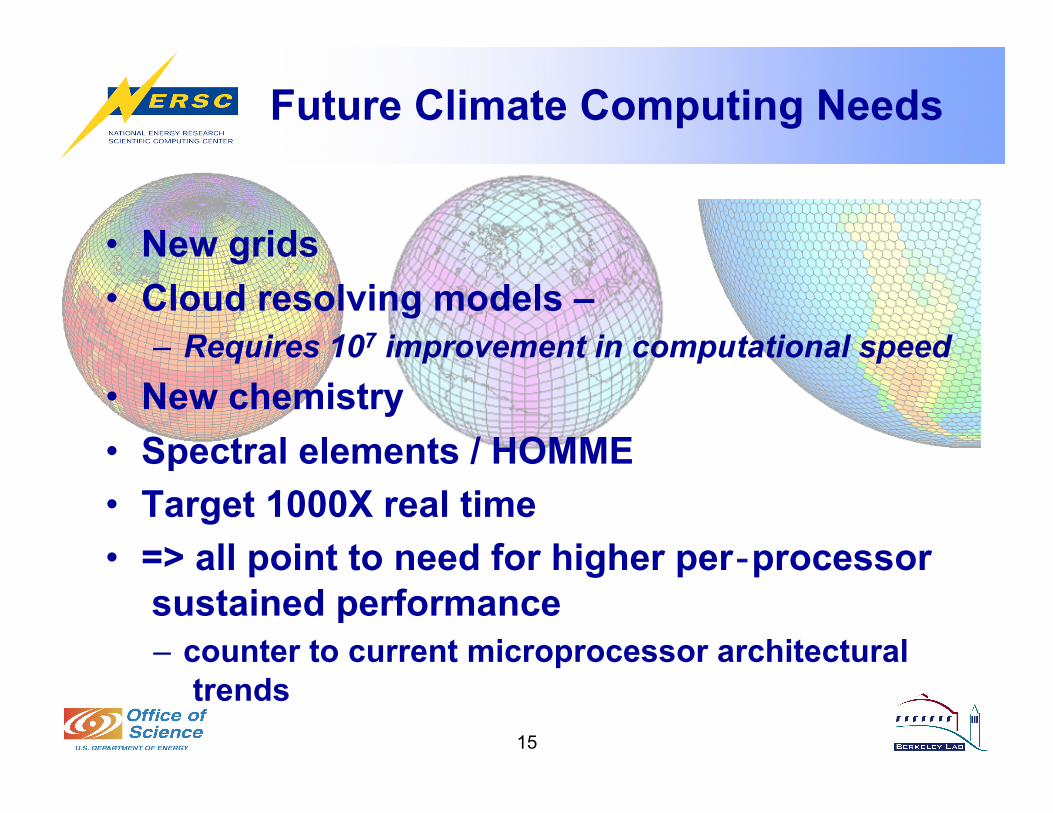
Future Climate Computing Needs
15
• New grids • Cloud resolving models –
– Requires 107 improvement in computational speed • New chemistry • Spectral elements / HOMME • Target 1000X real time • => all point to need for higher per‐processor
sustained performance – counter to current microprocessor architectural
trends
Example: Climate Modeling
• CAM dominates CCSM3 computational requirements.
• FV-CAM increasingly replacing Spectral-CAM in future CCSM runs.
• Drivers: – Critical support of U.S.
submission to the Intergovernmental Panel on Climate Change (IPCC).
– V & V for CCSM-4 • 0.5 deg resolution tending to 0.25
16
Climate Without INCITE
• Focus on ensemble runs - 10 simulations per ensemble, 5-25 ensembles per scenario, relatively small concurrencies.
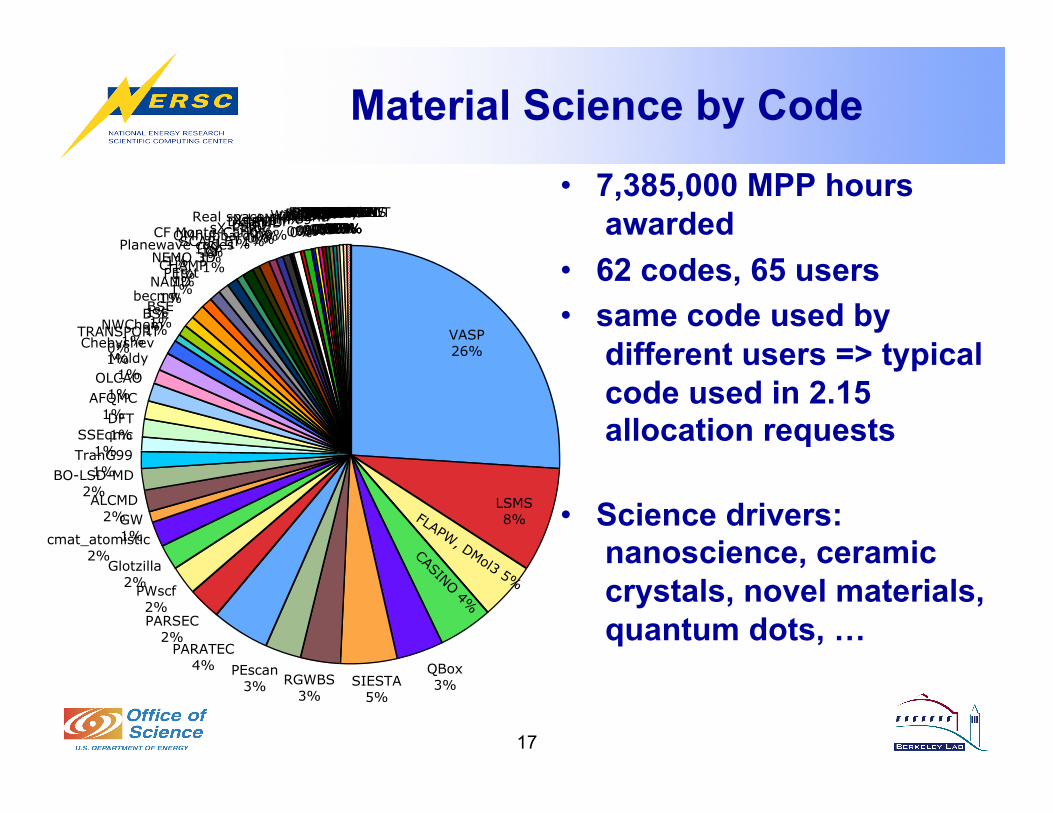
Material Science by Code
17
QBox3%SIESTA
5%RGWBS
3%
PEscan3%
PARATEC4%
PARSEC2%
PWscf2%
Glotzilla2%
cmat_atomistic2%
GW1%
ALCMD2%
BO-LSD-MD2%
TranG991%
SSEqmc1%
DFT1%
AFQMC1%
OLCAO1%
Moldy1%
Chebyshev1%
TRANSPORT0%
NWChem1%
BSE1%
BSE1%
becmw1%
NAMD1%
PEtot1%
CHAMP1%
NEMO 3D1%
CP1%
Planewave codes1%
SCARLET1%
QMhubbard1%
CF Monte-Carlo1%
sX-PEtot1%LS3DF
1%TBMD1%
DL_POLY0%
XqmmmX0%
LAMMPS0%
Real space multigrid0%
flair0%
WIEN2K0%GCMC0%
mol_dyn0%MC0%
FDTDGA0%
mxmat0%mxci0%
freepar0%
CL/GCMD0%
ESPRESSO0%
Tmatrix0%
Smatrix0%
MomMeth0%
FDTD5130%BEST0%
HOLLICITA0%
FEFF_OPCONS0%AndyS
0%ABINIT-DW
0%ARPES
0%NBSE-ABINIT
0%FEFFMPI
0%Hartree
0%
CASINO 4%
FLAPW, DMol3 5%
VASP26%
LSMS8%
GINGER0%
• 7,385,000 MPP hours awarded
• 62 codes, 65 users • same code used by
different users => typical code used in 2.15 allocation requests
• Science drivers: nanoscience, ceramic crystals, novel materials, quantum dots, …
18
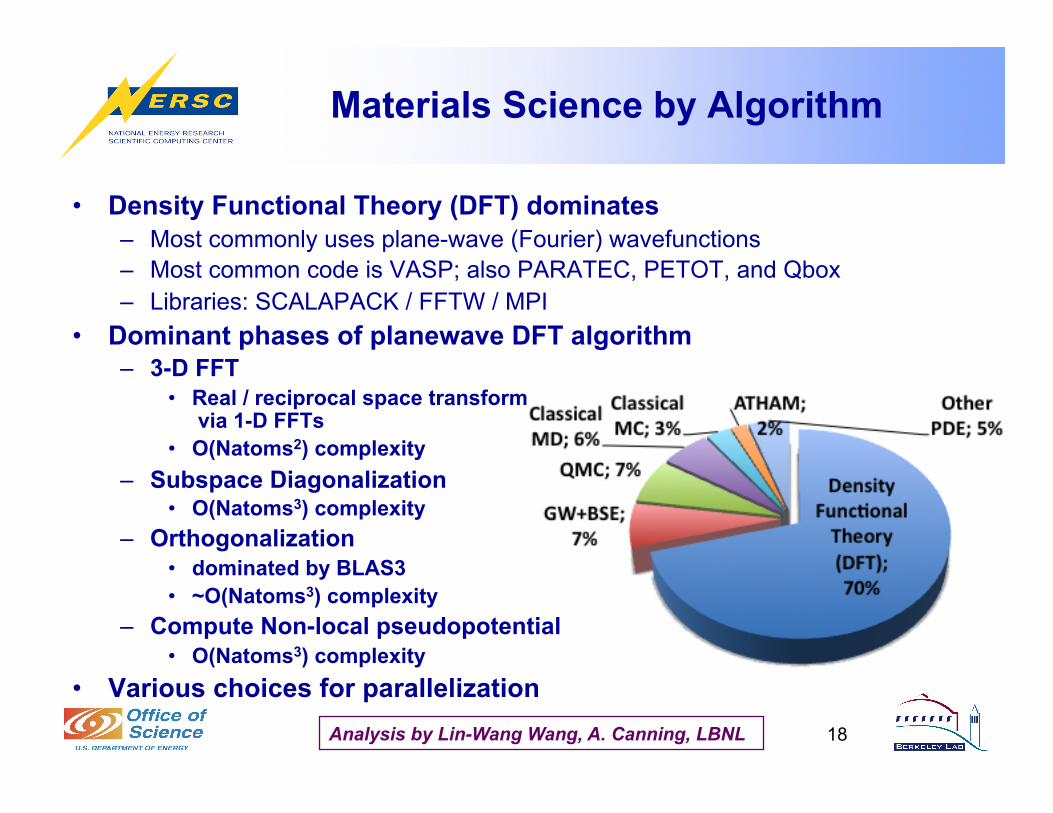
Materials Science by Algorithm
• Density Functional Theory (DFT) dominates – Most commonly uses plane-wave (Fourier) wavefunctions – Most common code is VASP; also PARATEC, PETOT, and Qbox – Libraries: SCALAPACK / FFTW / MPI
• Dominant phases of planewave DFT algorithm – 3-D FFT
• Real / reciprocal space transform via 1-D FFTs
• O(Natoms2) complexity – Subspace Diagonalization
• O(Natoms3) complexity – Orthogonalization
• dominated by BLAS3 • ~O(Natoms3) complexity
– Compute Non-local pseudopotential • O(Natoms3) complexity
• Various choices for parallelization
18 Analysis by Lin-Wang Wang, A. Canning, LBNL
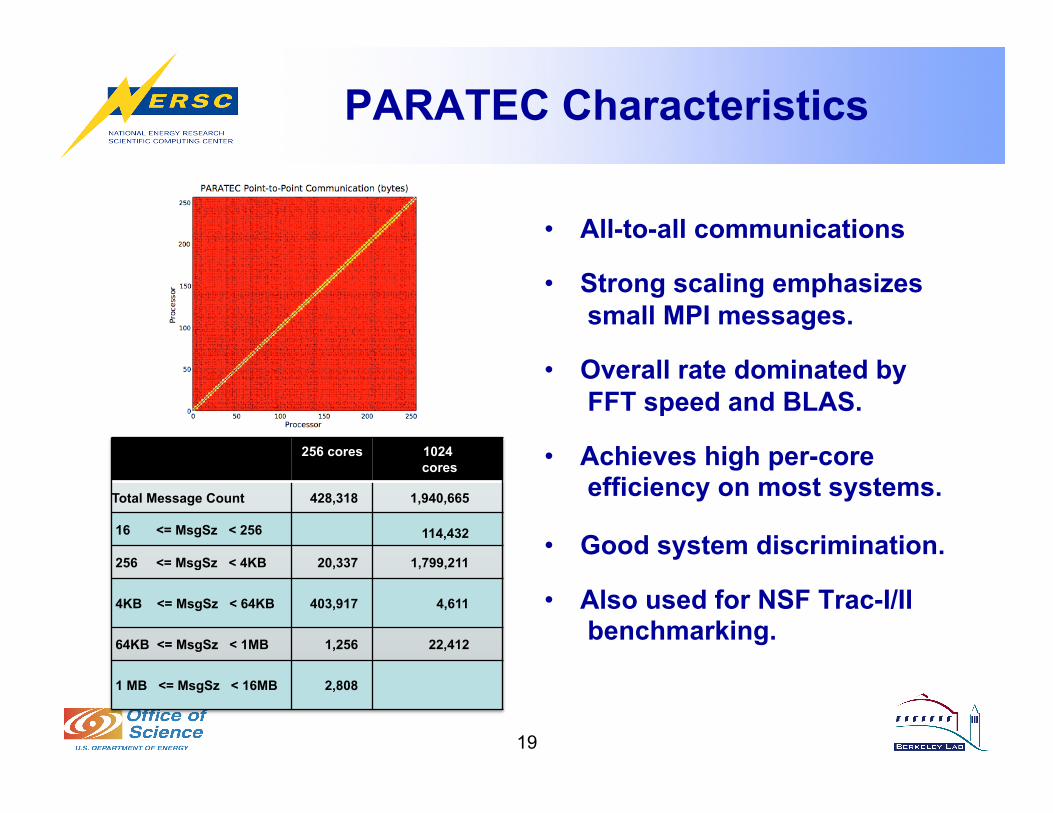
PARATEC Characteristics
19
• All-to-all communications
• Strong scaling emphasizes small MPI messages.
• Overall rate dominated by FFT speed and BLAS.
• Achieves high per-core efficiency on most systems.
• Good system discrimination.
• Also used for NSF Trac-I/II benchmarking.
256 cores 1024 cores
Total Message Count 428,318 1,940,665
16 <= MsgSz < 256 114,432
256 <= MsgSz < 4KB 20,337 1,799,211
4KB <= MsgSz < 64KB 403,917 4,611
64KB <= MsgSz < 1MB 1,256 22,412
1 MB <= MsgSz < 16MB 2,808
Performance of CRAY XT4
• NERSC “Franklin” system • Undergoing dual-core -> quad-core
upgrade – ~19,344 cores to ~38,688 – 667-MHz DRAM to 800-MHz DRAM
• Upgrade done in phases “in-situ” so as not to disrupt production computing.
20
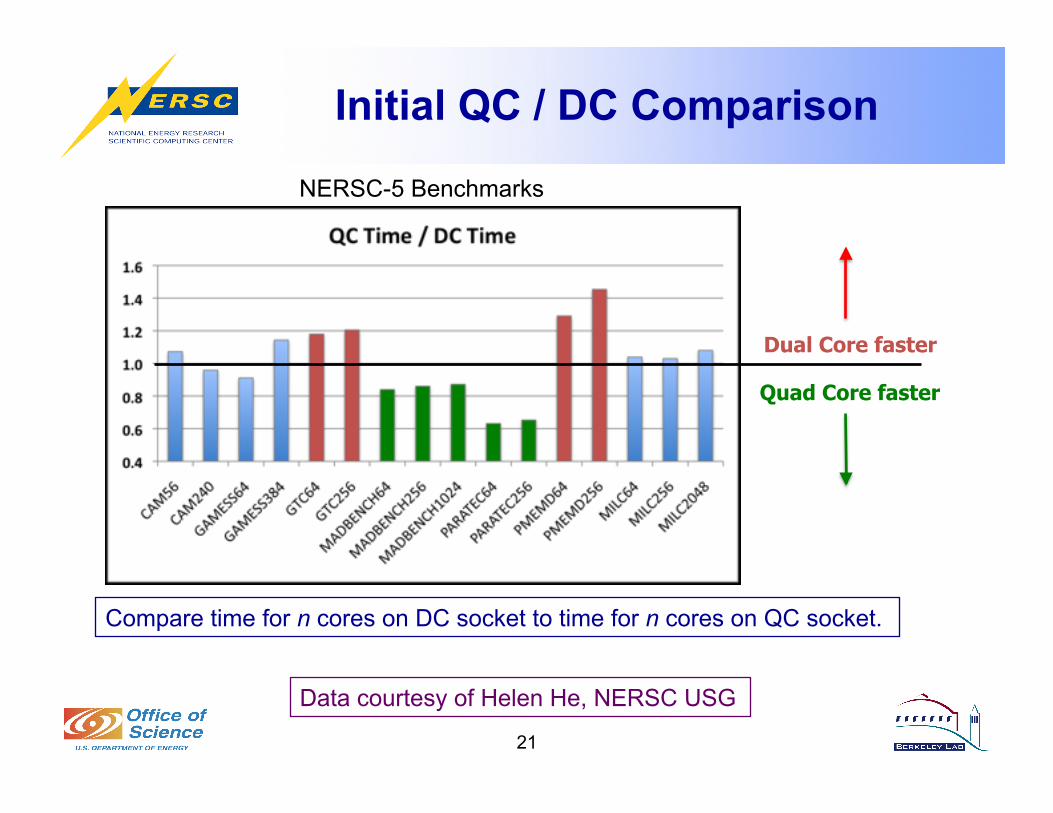
Initial QC / DC Comparison
21
Dual Core faster
Quad Core faster
NERSC-5 Benchmarks
Data courtesy of Helen He, NERSC USG
Compare time for n cores on DC socket to time for n cores on QC socket.
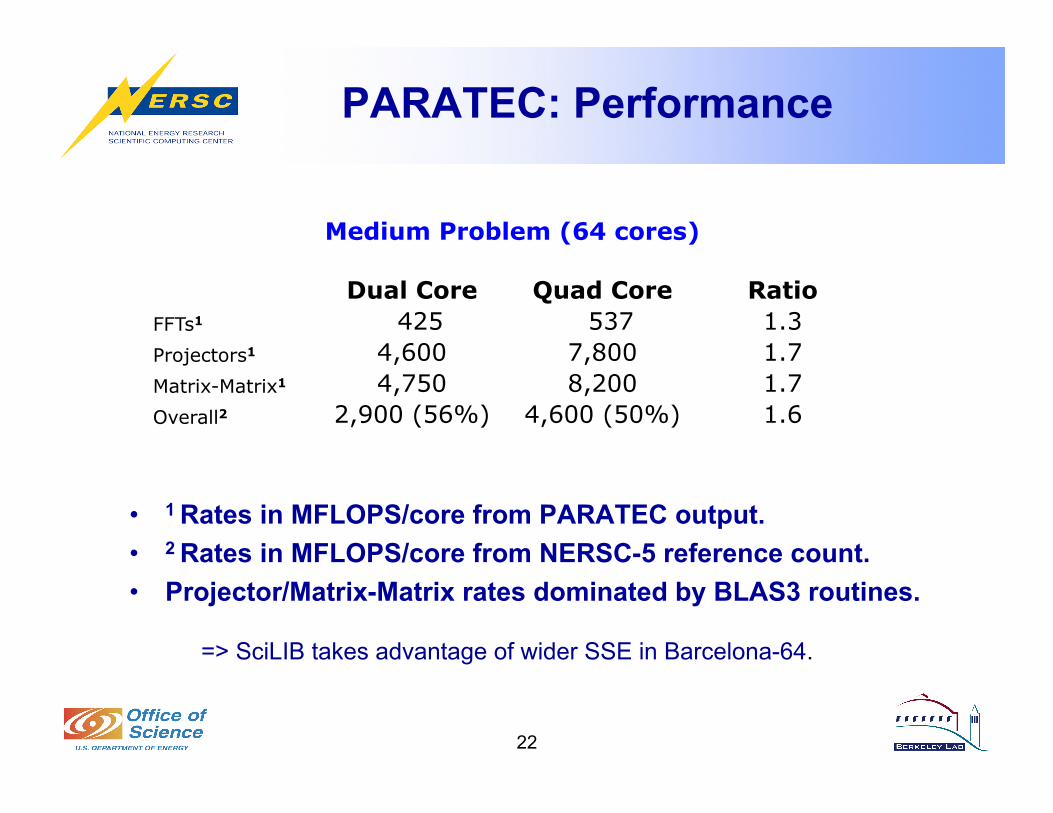
PARATEC: Performance
• 1 Rates in MFLOPS/core from PARATEC output. • 2 Rates in MFLOPS/core from NERSC-5 reference count.
• Projector/Matrix-Matrix rates dominated by BLAS3 routines.
22
Medium Problem (64 cores)
Dual Core Quad Core Ratio FFTs1 425 537 1.3 Projectors1 4,600 7,800 1.7 Matrix-Matrix1 4,750 8,200 1.7 Overall2 2,900 (56%) 4,600 (50%) 1.6
=> SciLIB takes advantage of wider SSE in Barcelona-64.
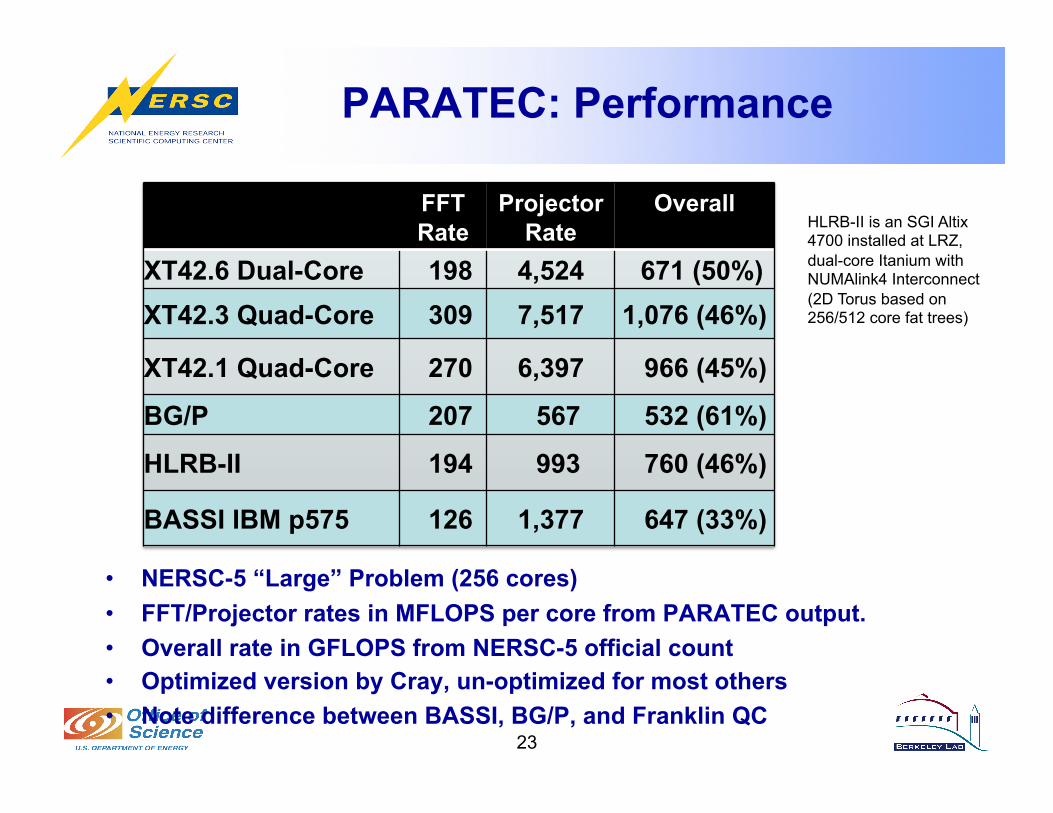
PARATEC: Performance
• NERSC-5 “Large” Problem (256 cores) • FFT/Projector rates in MFLOPS per core from PARATEC output. • Overall rate in GFLOPS from NERSC-5 official count • Optimized version by Cray, un-optimized for most others • Note difference between BASSI, BG/P, and Franklin QC
HLRB-II is an SGI Altix 4700 installed at LRZ, dual-core Itanium with NUMAlink4 Interconnect (2D Torus based on 256/512 core fat trees)
FFT Rate
Projector Rate
Overall
XT42.6 Dual-Core 198 4,524 671 (50%) XT42.3 Quad-Core 309 7,517 1,076 (46%)
XT42.1 Quad-Core 270 6,397 966 (45%)
BG/P 207 567 532 (61%)
HLRB-II 194 993 760 (46%)
BASSI IBM p575 126 1,377 647 (33%)
23
Response to Technology Trends
• Parallel computing has thrived on weak-scaling for past 15 years
• Flat CPU performance increases emphasis on strong-scaling
• Benchmarks changed accordingly – Concurrency: Increased 4x over NERSC-5 benchmarks – Strong Scaling: Input decks emphasize strong-scaled problems – Implicit Methods: Added MAESTRO application benchmark – Multiscale: Added AMR Poisson benchmark – Lightweight Messaging: Added UPC FT benchmark
24
MAESTRO: Low Mach Number Flow
• Authors: LBNL Computing Research Division; SciDAC07 • Relation to NERSC Workload:
– Model convection leading up to Type 1a supernova explosion; – Method also applicable to 3-D turbulent combustion studies.
• Description: Structured rectangular grid plus patch-based AMR (although NERSC-6 code does not adapt);
– hydro model has implicit & explicit components; • Coding: ~ 100,000 lines Fortran 90/77. • Parallelism: 3-D processor non-overlapping decomposition, MPI.
– Knapsack algorithm for load distribution; move boxes close in physical space to same/close processor.
• More communication than necessary but has AMR communication characteristics.
• NERSC-6 tests: weak scaling on 512 and 2048 cores; 16 boxes (323 cells each) per processor.
25
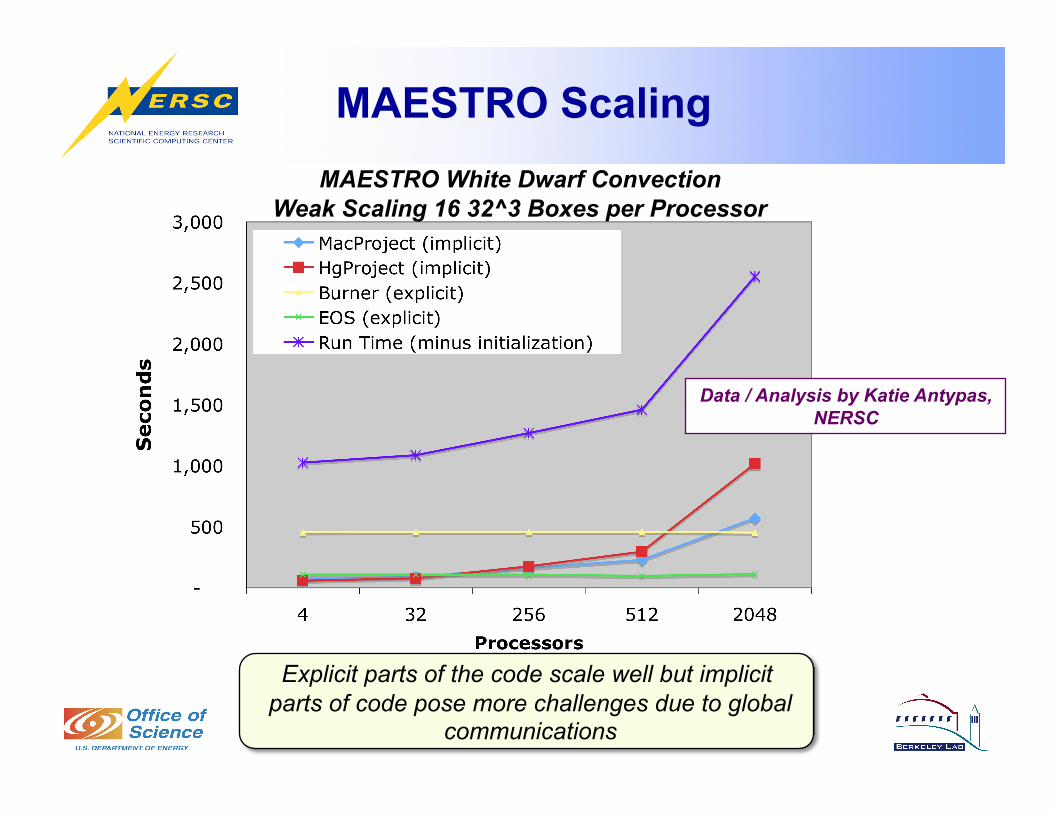
MAESTRO Scaling MAESTRO White Dwarf Convection
Weak Scaling 16 32^3 Boxes per Processor
26
Explicit parts of the code scale well but implicit parts of code pose more challenges due to global
communications
Data / Analysis by Katie Antypas, NERSC
Key Tool
• NERSC’s Integrated Performance Monitor (IPM)
• Portable, lightweight, and scalable tool for extracting MPI message-passing (and other) information.
• David Skinner, NERSC • http://sourceforge.net/projects/ipm-hpc/
27
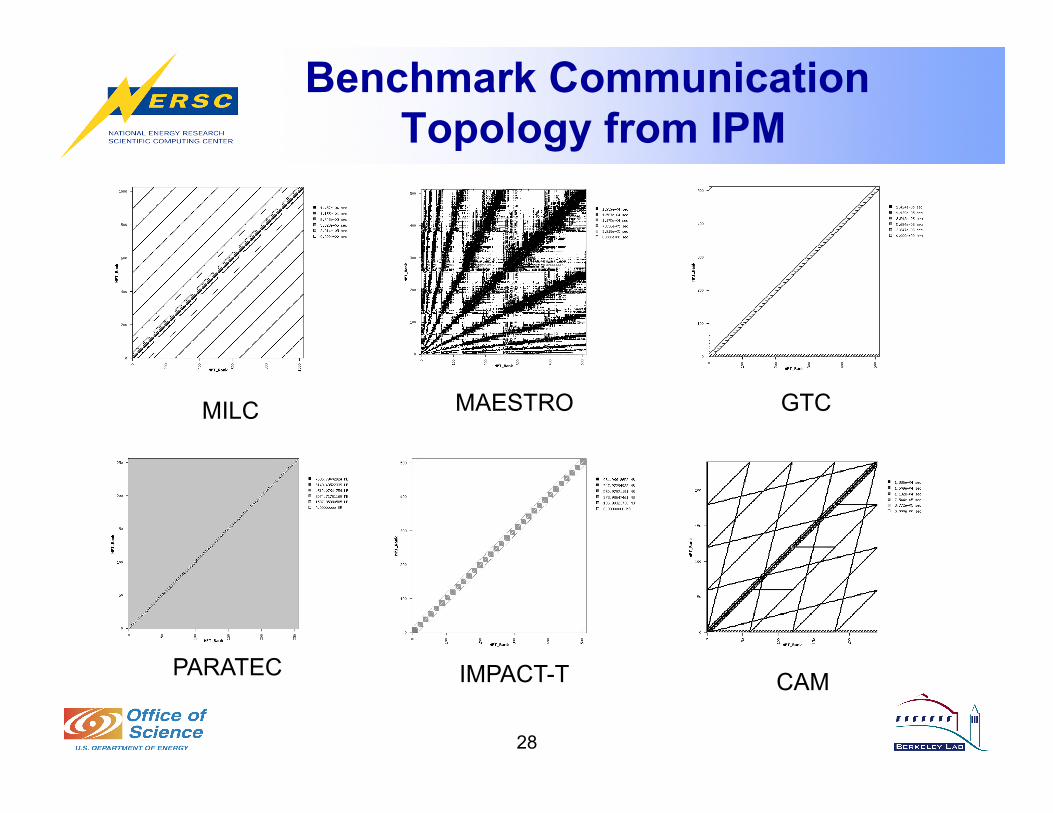
Benchmark Communication Topology from IPM
MILC
PARATEC IMPACT-T CAM
MAESTRO GTC
28
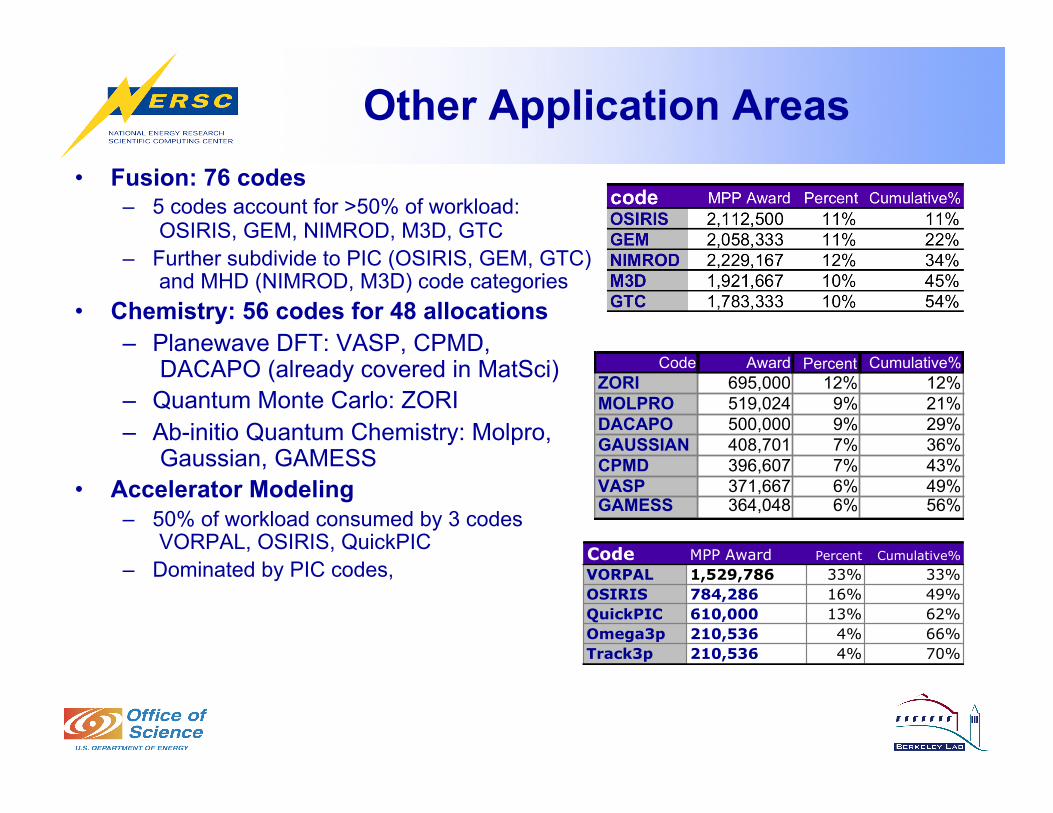
Other Application Areas • Fusion: 76 codes
– 5 codes account for >50% of workload: OSIRIS, GEM, NIMROD, M3D, GTC
– Further subdivide to PIC (OSIRIS, GEM, GTC) and MHD (NIMROD, M3D) code categories
• Chemistry: 56 codes for 48 allocations – Planewave DFT: VASP, CPMD,
DACAPO (already covered in MatSci) – Quantum Monte Carlo: ZORI – Ab-initio Quantum Chemistry: Molpro,
Gaussian, GAMESS • Accelerator Modeling
– 50% of workload consumed by 3 codes VORPAL, OSIRIS, QuickPIC
– Dominated by PIC codes,
Code Award Percent Cumulative%ZORI 695,000 12% 12%MOLPRO 519,024 9% 21%DACAPO 500,000 9% 29%GAUSSIAN 408,701 7% 36%CPMD 396,607 7% 43%VASP 371,667 6% 49%GAMESS 364,048 6% 56%
Code MPP Award Percent Cumulative%
VORPAL 1,529,786 33% 33%OSIRIS 784,286 16% 49%QuickPIC 610,000 13% 62%Omega3p 210,536 4% 66%Track3p 210,536 4% 70%
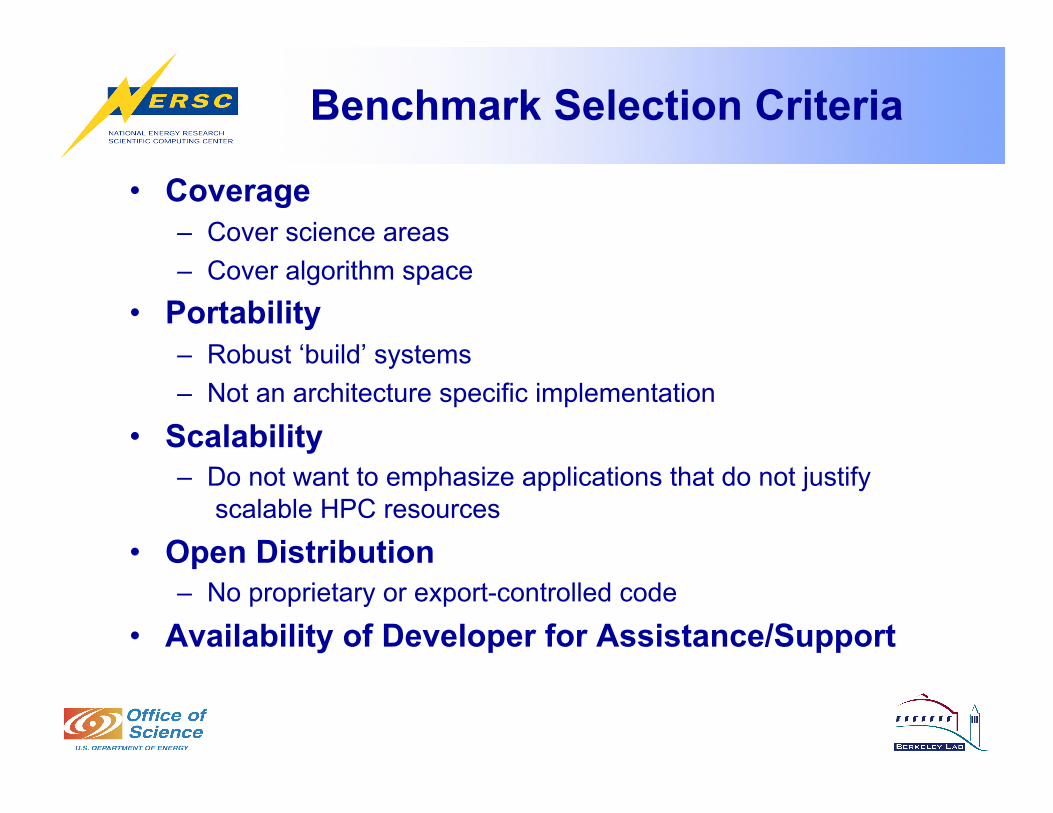
Benchmark Selection Criteria
• Coverage – Cover science areas – Cover algorithm space
• Portability – Robust ‘build’ systems – Not an architecture specific implementation
• Scalability – Do not want to emphasize applications that do not justify
scalable HPC resources
• Open Distribution – No proprietary or export-controlled code
• Availability of Developer for Assistance/Support
“Related Work”
• L. Van Ertvelde, L. Eeckhout, “Dispersing Proprietary Applications as Benchmarks through Code Mutation,”
ASPLOS’08, March 1–5, 2008, Seattle, Washington
31
32
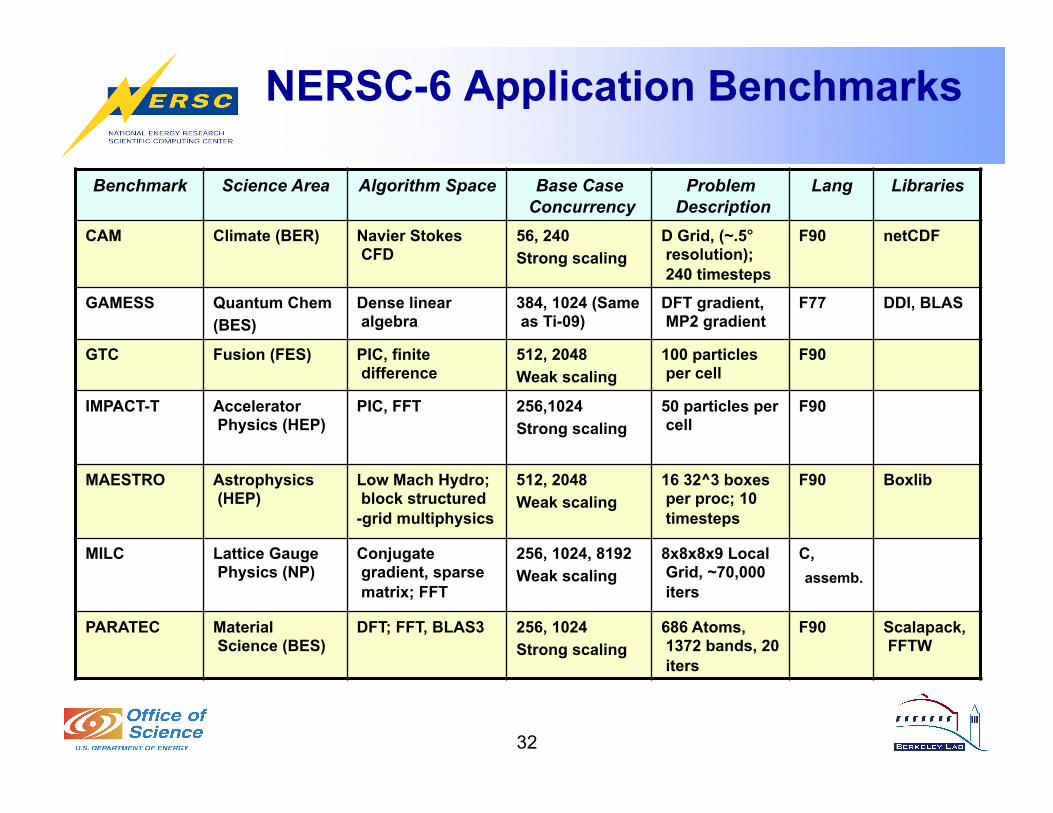
NERSC-6 Application Benchmarks
Benchmark Science Area Algorithm Space Base Case Concurrency
Problem Description
Lang Libraries
CAM Climate (BER) Navier Stokes CFD
56, 240 Strong scaling
D Grid, (~.5° resolution); 240 timesteps
F90 netCDF
GAMESS Quantum Chem (BES)
Dense linear algebra
384, 1024 (Same as Ti-09)
DFT gradient, MP2 gradient
F77 DDI, BLAS
GTC Fusion (FES) PIC, finite difference
512, 2048 Weak scaling
100 particles per cell
F90
IMPACT-T Accelerator Physics (HEP)
PIC, FFT 256,1024 Strong scaling
50 particles per cell
F90
MAESTRO Astrophysics (HEP)
Low Mach Hydro; block structured-grid multiphysics
512, 2048 Weak scaling
16 32^3 boxes per proc; 10 timesteps
F90 Boxlib
MILC Lattice Gauge Physics (NP)
Conjugate gradient, sparse matrix; FFT
256, 1024, 8192 Weak scaling
8x8x8x9 Local Grid, ~70,000 iters
C, assemb.
PARATEC Material Science (BES)
DFT; FFT, BLAS3 256, 1024 Strong scaling
686 Atoms, 1372 bands, 20 iters
F90 Scalapack, FFTW
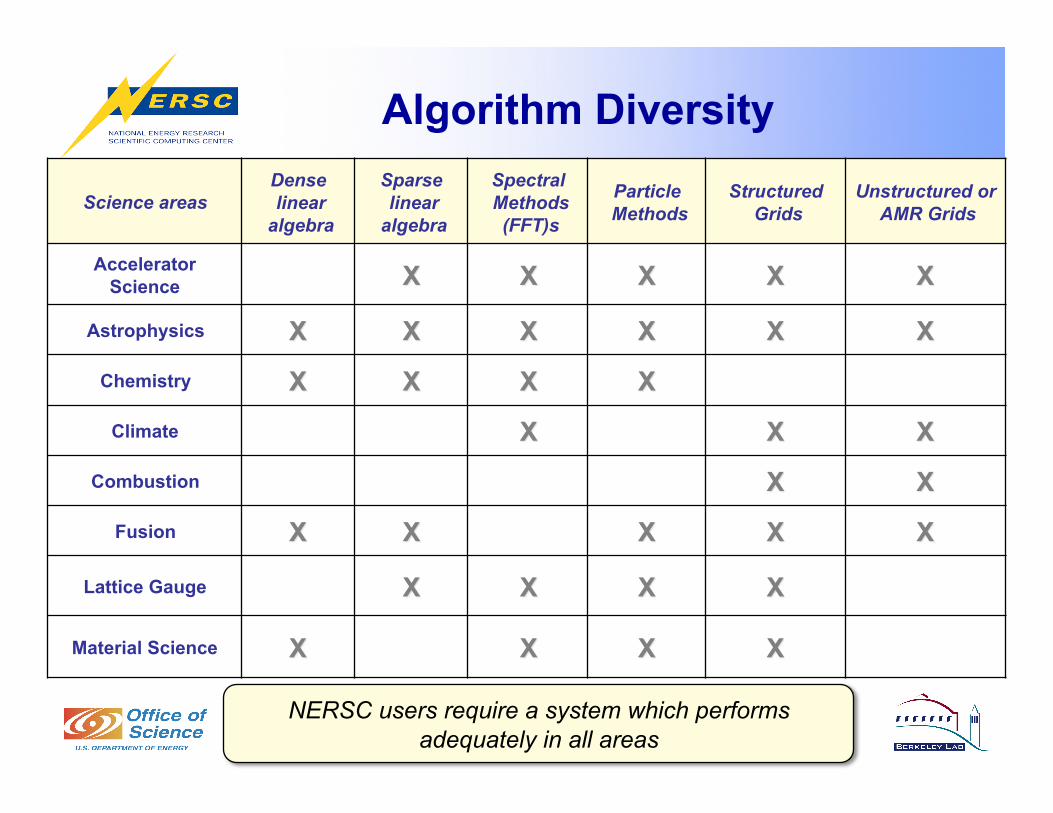
Algorithm Diversity
Science areas Dense linear
algebra
Sparse linear
algebra
Spectral Methods (FFT)s
Particle Methods
Structured Grids
Unstructured or AMR Grids
Accelerator Science
Astrophysics
Chemistry
Climate
Combustion
Fusion
Lattice Gauge
Material Science
NERSC users require a system which performs adequately in all areas

N6 Benchmarks Coverage
Science areas Dense linear
algebra
Sparse linear
algebra
Spectral Methods (FFT)s
Particle Methods
Structured Grids
Unstructured or AMR Grids
Accelerator Science X X
IMPACT-T X
IMPACT-T X
IMPACT-T X
Astrophysics X X MAESTRO X X X
MAESTRO X
MAESTRO
Chemistry X GAMESS X X X
Climate X CAM
X CAM X
Combustion X
CHOMBO X
MAESTRO
Fusion X X X
GTC X
GTC X
Lattice Gauge X MILC
X MILC
X MILC
X MILC
Material Science X PARATEC
X PARATEC
X X
PARATEC
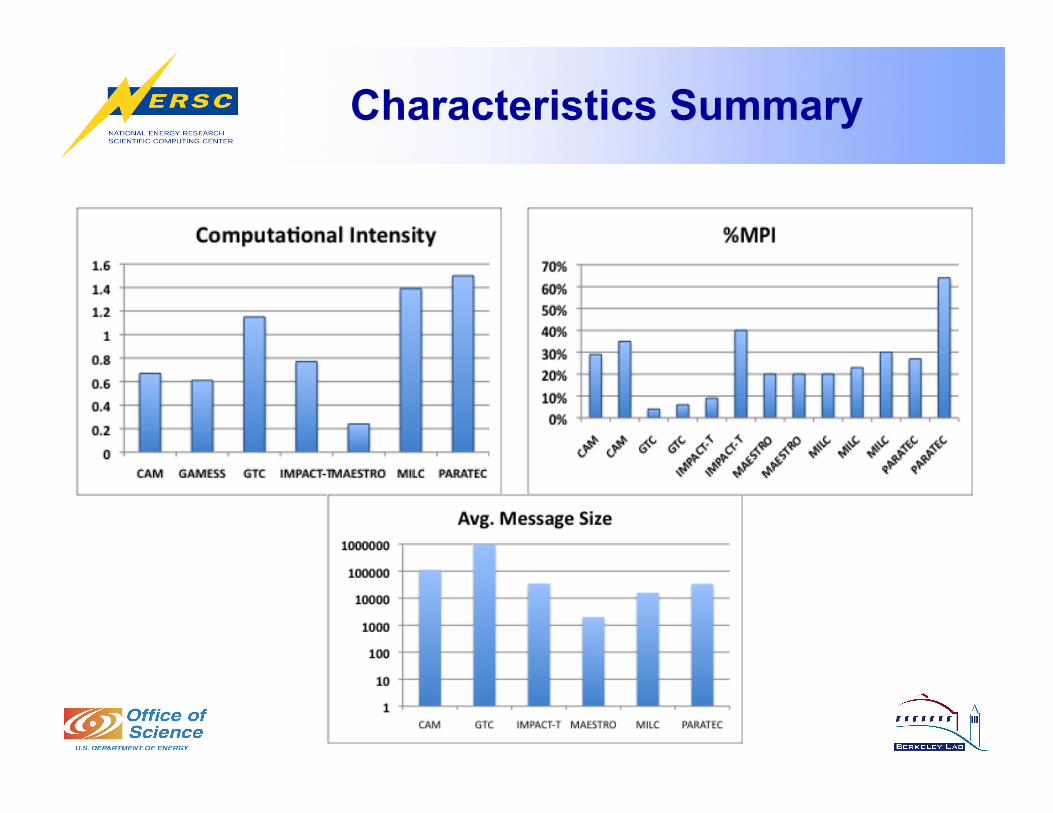
Characteristics Summary
Summary So Far
• Codes represent important science and/or algorithms and architectural stress points such as CI*, message type/size/topology.
• Codes provide a good means of system differentiation during acquisition and validation during acceptance.
• Strong suite of scalable benchmarks (256-8192+ cores).
*CI = Computational Intensity, # FLOPs / Memory references
36
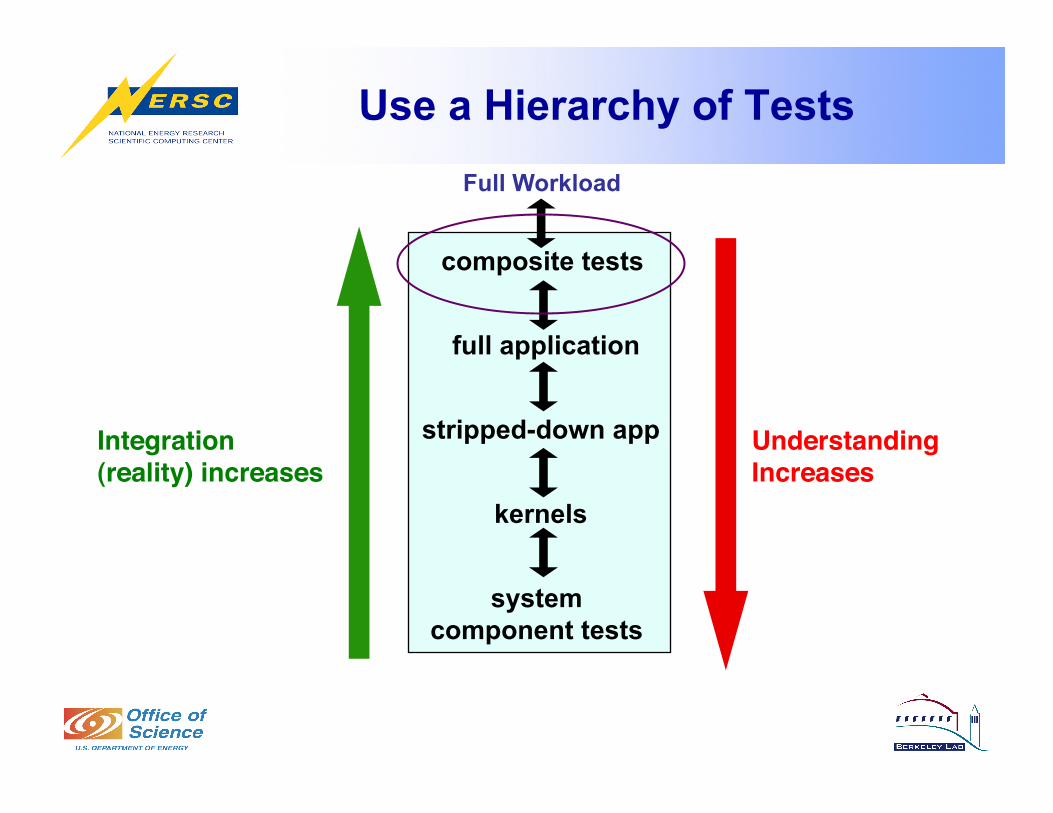
Understanding Increases
Integration (reality) increases
Full Workload
stripped-down app
composite tests
system component tests
kernels
full application
Use a Hierarchy of Tests
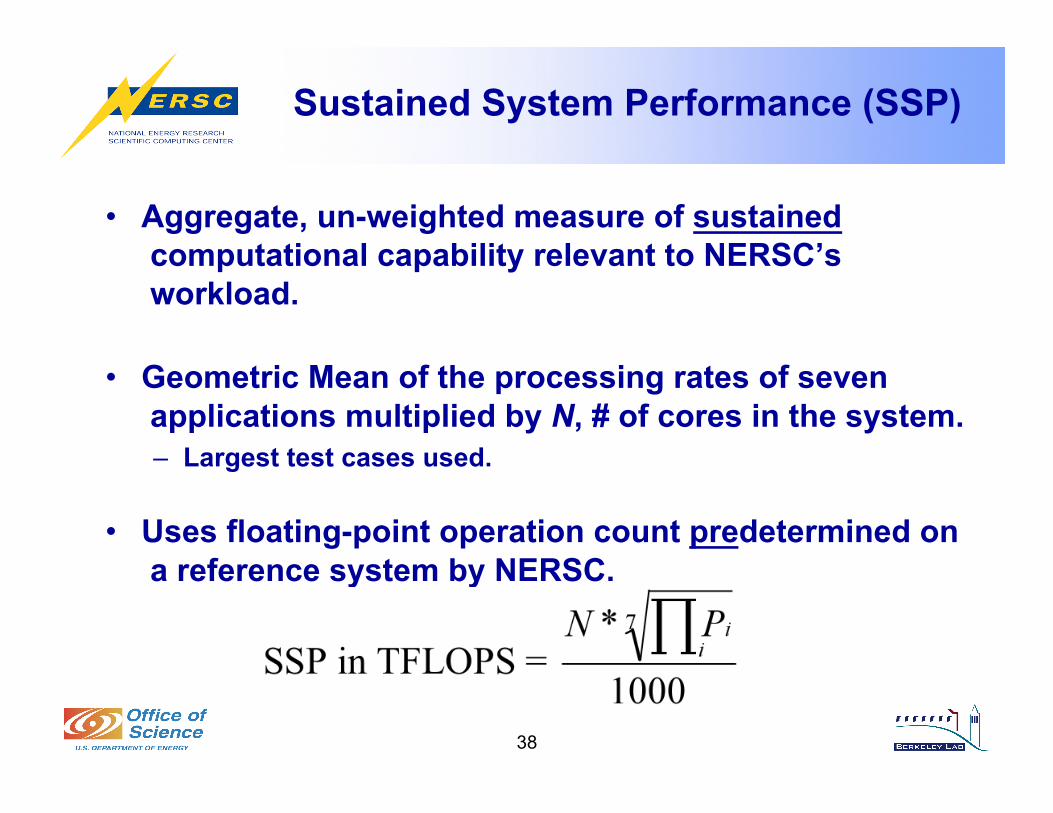
Sustained System Performance (SSP)
• Aggregate, un-weighted measure of sustained computational capability relevant to NERSC’s workload.
• Geometric Mean of the processing rates of seven applications multiplied by N, # of cores in the system. – Largest test cases used.
• Uses floating-point operation count predetermined on a reference system by NERSC.
38
39
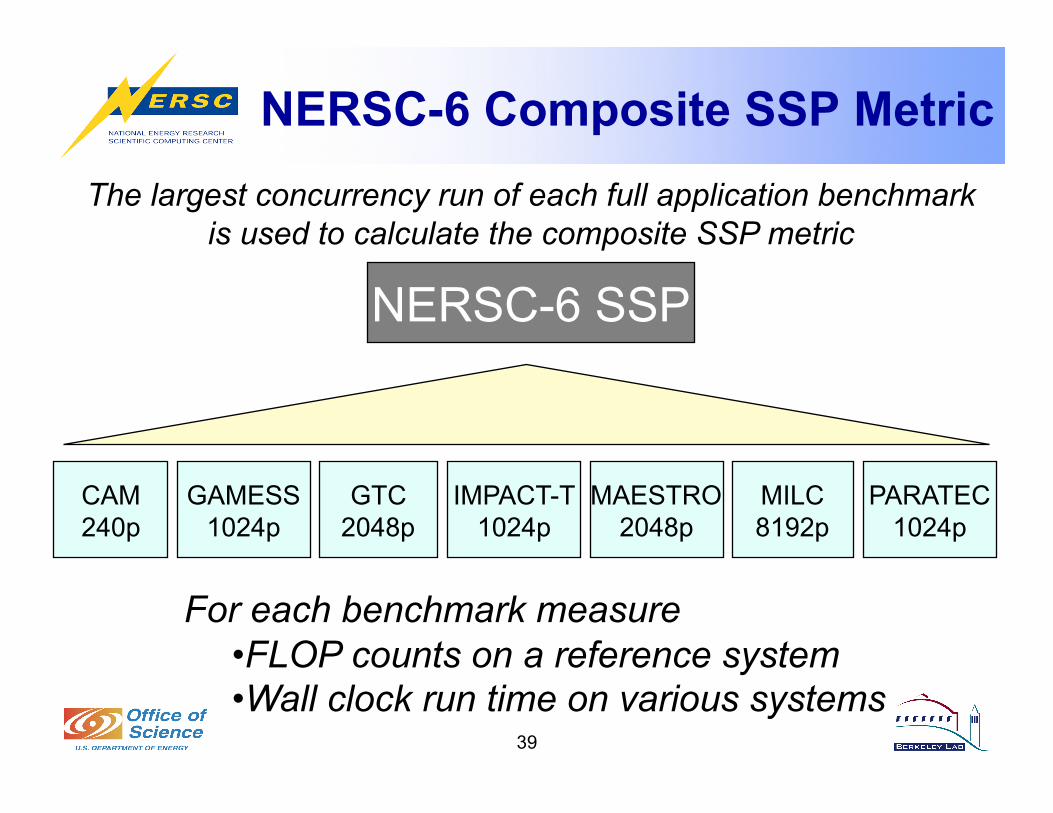
NERSC-6 Composite SSP Metric The largest concurrency run of each full application benchmark
is used to calculate the composite SSP metric
NERSC-6 SSP
CAM 240p
GAMESS 1024p
GTC 2048p
IMPACT-T 1024p
MAESTRO 2048p
MILC 8192p
PARATEC 1024p
For each benchmark measure • FLOP counts on a reference system • Wall clock run time on various systems
40
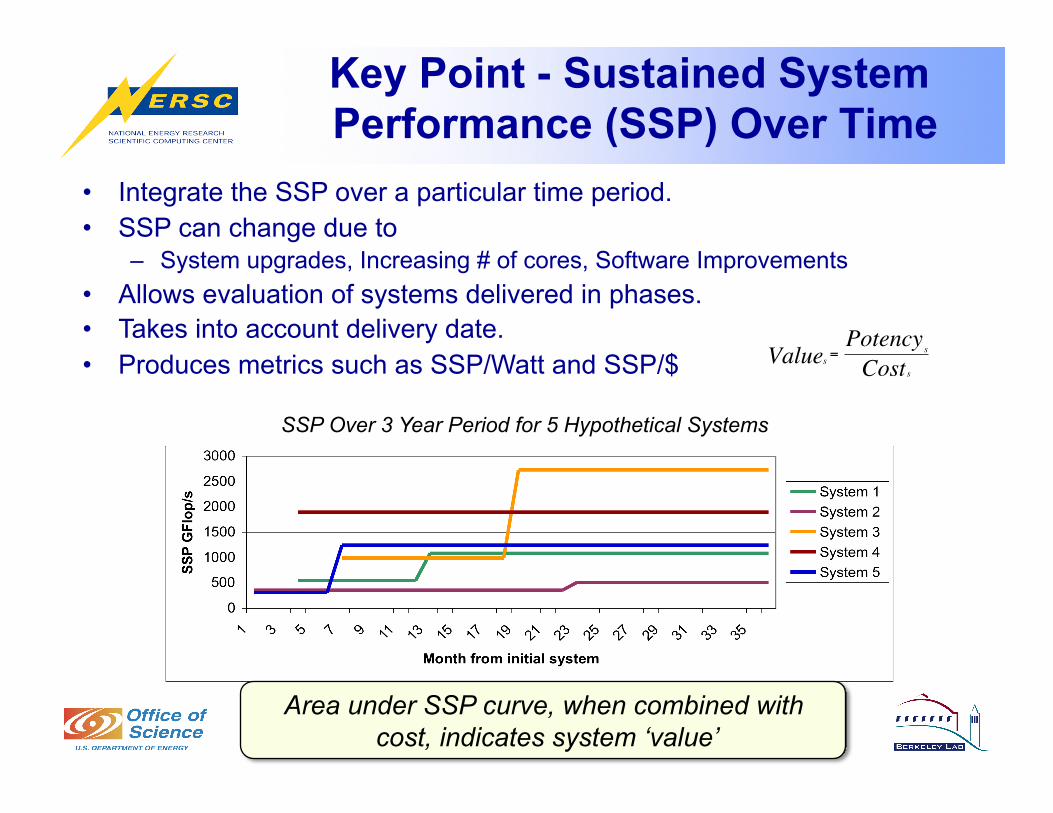
Key Point - Sustained System Performance (SSP) Over Time
• Integrate the SSP over a particular time period. • SSP can change due to
– System upgrades, Increasing # of cores, Software Improvements • Allows evaluation of systems delivered in phases. • Takes into account delivery date. • Produces metrics such as SSP/Watt and SSP/$
Area under SSP curve, when combined with cost, indicates system ‘value’
SSP Over 3 Year Period for 5 Hypothetical Systems €
sValue = sPotency
sCost
41
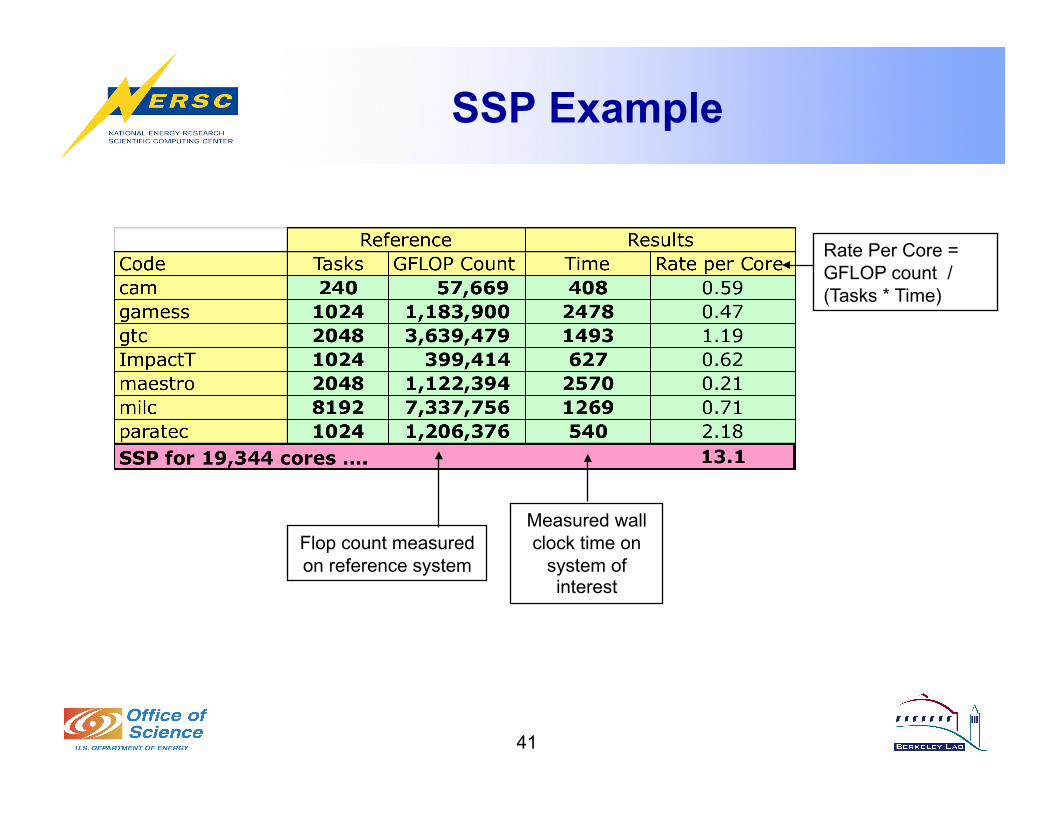
SSP Example
Rate Per Core = GFLOP count / (Tasks * Time)
Flop count measured on reference system
Measured wall clock time on
system of interest
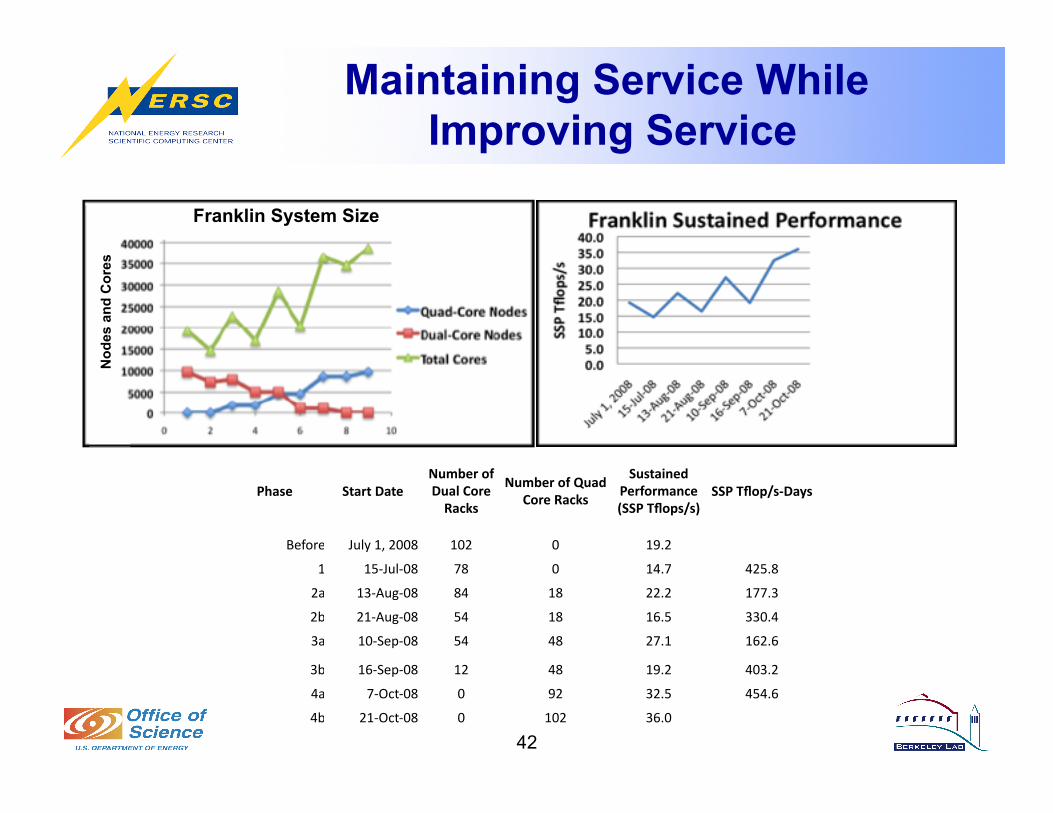
Maintaining Service While Improving Service
42
Phase StartDateNumberofDualCoreRacks
NumberofQuadCoreRacks
SustainedPerformance(SSPTflops/s)
SSPTflop/s‐Days
Before July1,2008 102 0 19.2
1 15‐Jul‐08 78 0 14.7 425.8
2a 13‐Aug‐08 84 18 22.2 177.3
2b 21‐Aug‐08 54 18 16.5 330.4
3a 10‐Sep‐08 54 48 27.1 162.6
3b 16‐Sep‐08 12 48 19.2 403.2
4a 7‐Oct‐08 0 92 32.5 454.6
4b 21‐Oct‐08 0 102 36.0
Nod
es a
nd C
ores
Franklin System Size
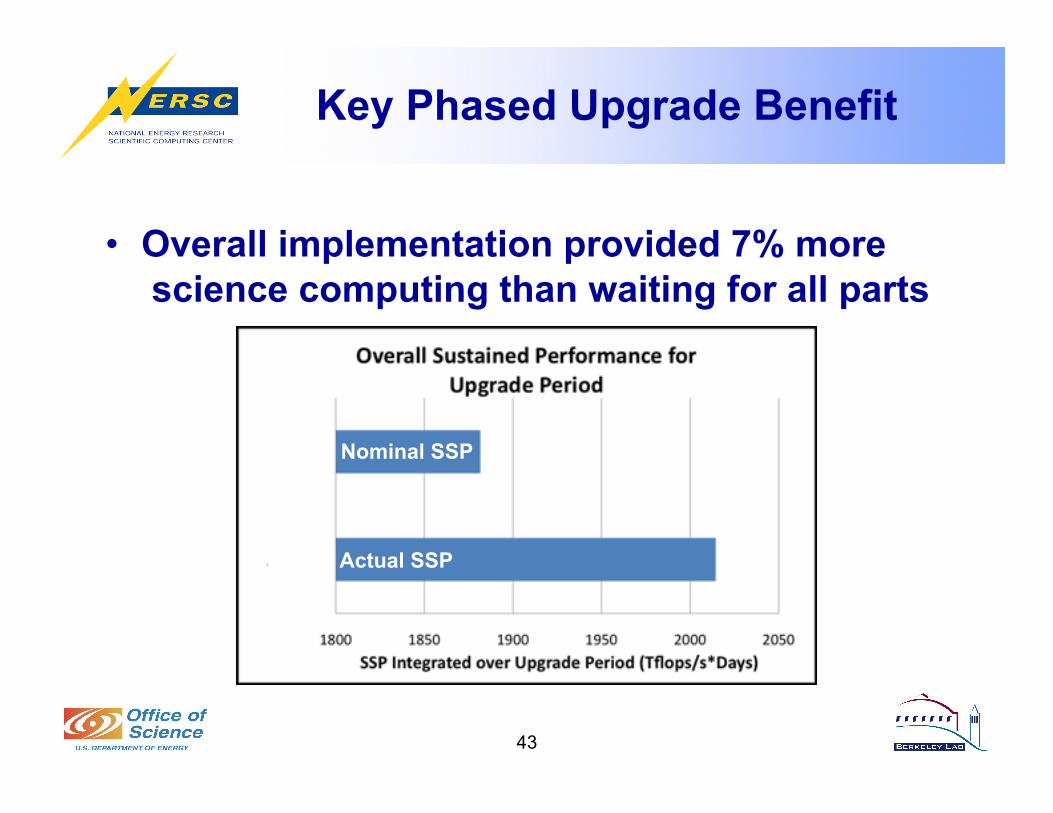
Key Phased Upgrade Benefit
43
• Overall implementation provided 7% more science computing than waiting for all parts
Nominal SSP
Actual SSP
Some Common Science Trends
• Increase support of engineering design studies – Eg., ITER and laser/plasma wakefield accelerators
• V&V increasingly important – Only scant experimental data available; often large
uncertainties • Hundreds of 2-D runs required to optimize beam
properties for 3-D runs. – Parameter studies to reproduce experimental beam charge / energy
• Multiple length and time scales: – Requires resolution of the laser wavelength (microns, in 3-
D) over the acceleration length (mm-cm, in 2-D), order 10^5 steps, 10^8 cells, and 10^9 particles
44
Summary
• Workload-based evaluation. • Workload characterization at different levels • Main challenge: Living benchmarks, Good science • Need to abstract the methods rather than the code. • Appropriate aggregate metrics. • Formal methodology for tests. • Wide range of tests from all levels of the benchmark
hierarchy. • Metrics for system effectiveness.
45

Scientists Need More Than Flop/s
• Performance — How fast will a system process a code in isolation?
• Effectiveness — How fast will a system process an entire workload?
• Reliability — How often is the system available and operating correctly?
• Consistency — How often will the system process user work as fast as it can?
• Usability — How easy is it for users to get the system to go as fast as possible?
PERCU: NERSC’s method for ensuring HPC system usability.

THANK YOU. www.nersc.gov
47
“Backup” Slides
48
“Related Work”
• Workload Characterization Analysis (WCA): – Simple: list of programs known to be important,
and a sample run-time for each. – Thorough:
• distributions of program run-times, • frequencies of execution, • fraction of total time consumed, • plus historical trends used to estimate likely changes.
• Also Workload Analysis with Weights (WAW)
49
John R. Mashey, “War of the Benchmark Means: Time for a Truce,” ACM SIGARCH Computer Architecture News, Vol. 32, No. 4, September 2004
“Related Work”
• Sample Estimation of Relative Performance Of Programs (SERPOP): – constructs a multi-element benchmark suite as a
sample of some population of programs – Examples: LFK, NPB, SPEC
50
John R. Mashey, “War of the Benchmark Means: Time for a Truce,” ACM SIGARCH Computer Architecture News, Vol. 32, No. 4, September 2004
Chemistry Workload
• Some overlap with Material Science • Multi-functional codes: GAMESS
/Gaussian/NWChem • Codes are proxies for exposing
communication performance characteristics not visible from MPI
• Inflection point in terms of methods due to machine scale?
51
About the Cover
52
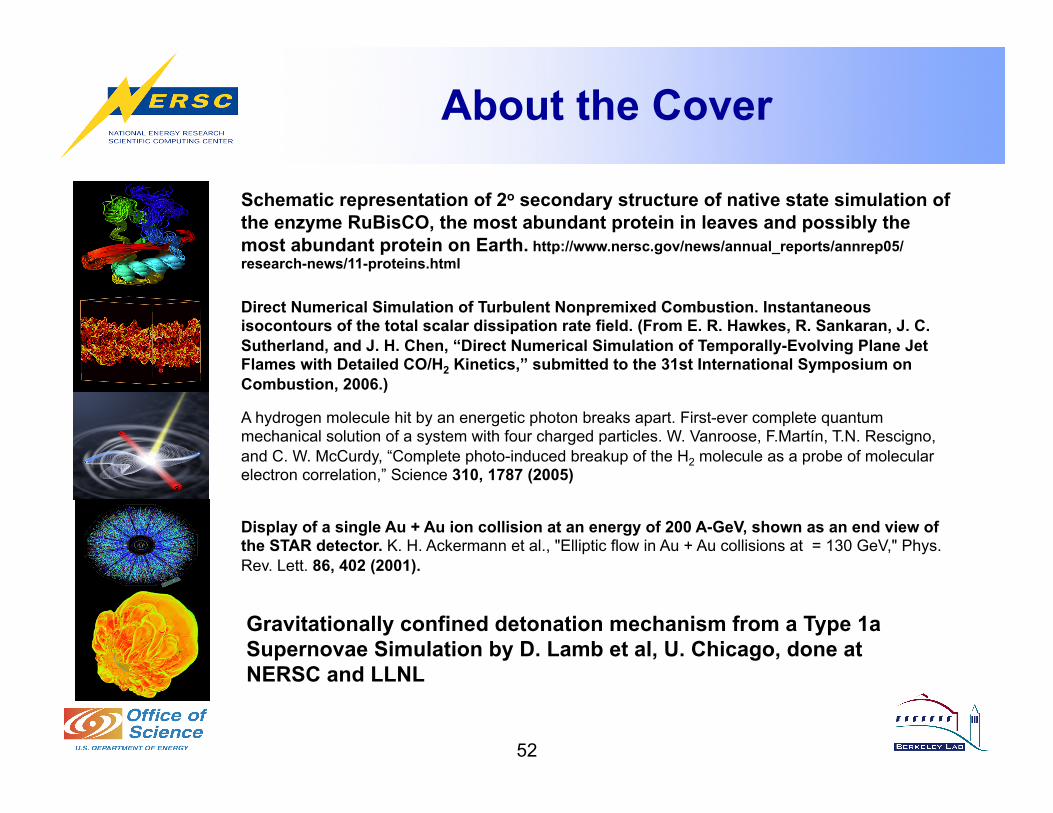
Schematic representation of 2o secondary structure of native state simulation of the enzyme RuBisCO, the most abundant protein in leaves and possibly the most abundant protein on Earth. http://www.nersc.gov/news/annual_reports/annrep05/research-news/11-proteins.html
Direct Numerical Simulation of Turbulent Nonpremixed Combustion. Instantaneous isocontours of the total scalar dissipation rate field. (From E. R. Hawkes, R. Sankaran, J. C. Sutherland, and J. H. Chen, “Direct Numerical Simulation of Temporally-Evolving Plane Jet Flames with Detailed CO/H2 Kinetics,” submitted to the 31st International Symposium on Combustion, 2006.)
A hydrogen molecule hit by an energetic photon breaks apart. First-ever complete quantum mechanical solution of a system with four charged particles. W. Vanroose, F.Martín, T.N. Rescigno, and C. W. McCurdy, “Complete photo-induced breakup of the H2 molecule as a probe of molecular electron correlation,” Science 310, 1787 (2005)
Display of a single Au + Au ion collision at an energy of 200 A-GeV, shown as an end view of the STAR detector. K. H. Ackermann et al., "Elliptic flow in Au + Au collisions at = 130 GeV," Phys. Rev. Lett. 86, 402 (2001).
Gravitationally confined detonation mechanism from a Type 1a Supernovae Simulation by D. Lamb et al, U. Chicago, done at NERSC and LLNL