rec-erc-73-19 - bureau of reclamation · rec-erc-73-19 engineering and ... (see conclusion 1...
TRANSCRIPT

REC-ERC-73-19
Engineering and Research Center
Bureau of Reclamation
October 1973
Prepared for
U.S. BUREAU OF MINES
under Agreement No. HD23OO11,
dated October 4, 1972

MS-230 (8-70) Bureau of Reclamation TECHNICAL REPORT STANDARD TITLE PAGE
1. REPORT NO.
R EC-E RC-73-19 4. TITLE AND SUBTITLE
Hydraulic Model Studies for Backfilling Mine Cavities
7. AUTHOR(S)
E. J. Carlson
9. PERFORMING ORGANIZATION NAME AND ADDRESS
Engineering and Research Center Bureau of Reclamation Denver, Colorado 80225
12. SPONSORING AGENCY NAME AND ADDRESS
Bureau of Mines Department of the Interior Washington, D.C.
15. SUPPLEMENTARY NOTES
16. ABSTRACT
3. RECIPIENT'S CATALOG NO.
S. REPORT DATE
Sept 73 6. PERFORMING ORGANIZATION CODE
8. PERFORMING ORGANIZATION REPORT NO.
R EC-E RC-73-19
10. WORK UNIT NO.
11. CONTRACT OR GRANT NO.
HD 230011 13. TYPE OF REPORT AND PERIOD
COVERED
14. ~PONSORING AGENCY CODE
Hydraulic models of an idealized coal mine were tested to demonstrate the pattern of deposition of sand material by pumping a slurry of fine sand and water into the mine cavity. A distorted geometrical scale with the horizontal scale 1m :24P (model to prototype) and vertical scale 1m :8P was used first to give transport velocities in the model equal to transport velocities in the prototype. An undistorted model with a scale 1m :24P, was also tested in which transport velocities were not equal in the model and prototype. Prototype sand, 0.14 mm mean diameter, was used for backfill material in all model tests. Tests were made to simulate the following mine cavity conditions: ( 1) level floor with cavity submerged; (2) level floor with cavity dry; (3) sloping floor with bottom of injection hole submerged; (4) sloping floor with bottom of injection hole above the water surface; (5) corridor between pillars partially blocked and totally blocked; (6) solid walls on one and two adjacent sides of a rectangular section of pillars surrounding the injection hole. Approximate bearing strengths of backfill material were determined by soils mechanics tests. Model tests showed that transport and deposit of backfill material depend on the flow of slurry in the mine cavity. Roof falls which block or partially block corridors affect the radial flow and deposit patterns of backfill material.
17. KEY WORDS AND DOCUMl!:NT ANALYSIS
a. DESCRIPTORS- - /hydraulic models/ *backfills/ *mines/ *hydraulic mine-filling/ cavities/ underground openings/ scale (ratio)/ models/ sands/ fines/ velocity/ pressure/ injection/ injectors/ *slurries/ back pressure/ bearing strength/ hydraulic pressure/ deposition/ hydraulic transportation
b. IDENTIFIERS-- /Bureau of Mines/ mine openings
c. COSATI Field/Group 13B
18. DISTRIBUTION STATEMENT
Available from the National Technical Information Service, Operations Division, Springfield, Virginia 22151.
19. SECURITY CLASS. 1. NO. OF PA GE (THIS REPORT)
UNCLASSIFIED 32 20 . SECURITY CLASS 22 . PRICE
(THIS PAGE)
UNCLASSIFIED

REC-ERC-73-19
HYDRAULIC MODEL STUDIES FOR
BACKFILLING MINE CAVITIES
by E. J. Carlson
October 19 73
Prepared for
U.S. BUREAU OF MINES.
under Agreement No. HD230011, dated October 4, 1972
Hydraulics Branch Division of General Research Engineering and Research Center Denver, Colorado
UNITED STATES DEPARTMENT OF THE INTERIOR * Rogers C. B. Morton Secretary
BUREAU OF RECLAMATION Gilbert G. Stamm Commissioner

ACKNOWLEDGMENT
The studies described in this report were conducted by the author. W. E. Wagner is Chief of the Hydraulics Branch and J. C. Schuster is Head of the Hydraulics Research Section. William J. Organ, Robert E. Williams, and others assisted in the operation of the hydraulic model and taking data. Numerous photographs and motion pictures were taken by photographer W. M. Batts. Representatives from Bureau of Mines offices in Washington, D.C., Denver, Colorado, and Wilkes Barre, Pennsylvania, visited the Engineering and Research Center during the study to observe the hydraulic model tests and give guidance. A Memorandum of Understanding between the Bureau of Mines and the Bureau of Reclamation, Agreement Number HD 230011, was the contractural arrangement for the study.
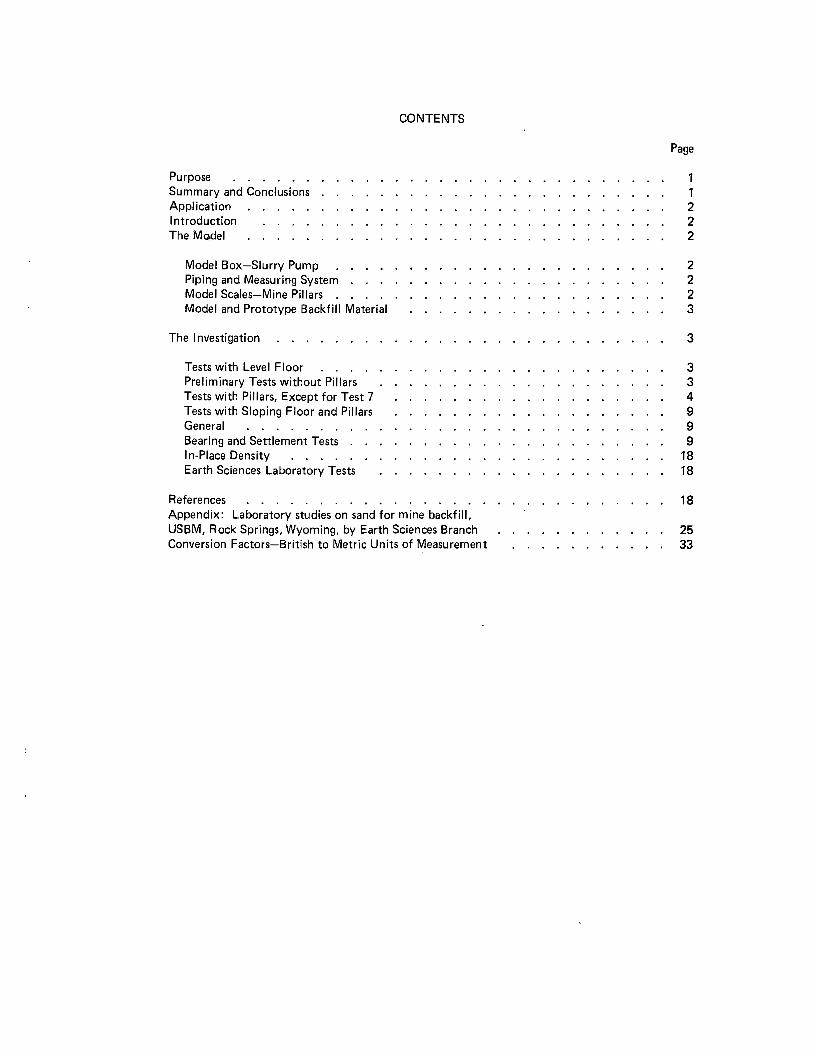
Purpose . . . . . . Summary and Conclusions Application Introduction The Model
Model Box-Slurry Pump Piping and Measuring System Model Scales-Mine Pillars . Model and Prototype Backfill Material
The Investigation
Tests with Level Floor Preliminary Tests without Pillars Tests with Pillars, Except for Test 7 Tests with Sloping Floor and Pillars General . . . . . . . Bearing and Settlement Tests . In-Place Density . . . . . Earth Sciences Laboratory Tests
References . . . . . . . .
CONTENTS
Appendix: Laboratory studies on sand for mine backfill, USBM, Rock Springs, Wyoming, by Earth Sciences Branch Conversion Factors-British to Metric Units of Measurement
Page
1 1 2 2 2
2 2 2 3
3
3 3 4 9 9 9
18 18
18
25 33

PURPOSE
The purpose of this study was to obtain qualitative and quantitative information on the deposit pattern of fine sand when used for backfill material and injected into a typical coal mine cavity. Backfilling of mine cavities with sand and waste material is a method used to reduce land subsidence. The study was performed for the Bureau of Mines.
SUMMARY AND CONCLUSIONS
A model of an idealized coal mine was constructed and operated to determine the characteristics of backfilling a mine by pumping a sand slurry into the cavities. The model simulated the hydraulic action in the coal mine under the city of Rock Springs, Wyomimg, where subsidence due to coal mine cavities has been experienced. Fine, uniform blow sand with a median size of approximately 0.14 mm from the Rock Springs area was used in the model studies. Similar materials will be used in future backfilling operations for mines in the Rock Springs area.
Eighteen tests were made simulating the pumping of fine sand into a mine cavity with the following conditions:
1. Level floor with cavity submerged 2. Level floor wi.th cavity dry 3. Sloping floor with injection pipe exit below the
water surface 4. Sloping floor with injection pipe exit above the
water surface 5. Selected corridors between pillars partially
blocked and totally blocked 6. Solid walls on one and two adjacent sides of a
rectangular section of pillars surrounding the injection hole
The test conditions are summarized in Table 1.
The approximate bearing strengths of the backfill material were determined by soils mechanics tests.
Data from the 18 tests lead to the following conclusions, which may be modified as additional information is obtained and analyzed:
1. Initial deposition of fine sand backfill material pumped vertically into a level submerged mine cavity takes the shape of a truncated broad-based cone which builds up to the roof of the unobstructed mine cavity, Figure 2.
2. The general pattern of the cone-shaped deposit in a level submerged mine backfill operation is not dependent on slurry concentration nor on injection pipe velocity. However, low pipe velocities result in a smaller radius of the initial deposit than for higher injection velocities.
3. Segregation of graded backfill material occurs in the central cavity when backfilling a level submerged mine. The larger particles deposit near the injection pipe and the finer particles deposit farther from the injection pipe in a radial direction. The particles at the bottom of the deposit ring are larger than the particles at the top of the deposit ring.
4. Fine sand backfill material injected into a submerged mine cavity having a 5° slope deposits in an initial broad-cone pattern almost identical to the deposition pattern in a level submerged mine cavity (see Conclusion 1 above). A solid wall located a short distance from the injection pipe does not prevent slurry from flowing nor backfill from depositing in that direction.
5. Fine sand backfill material pumped into a submerged mine cavity having a 15° slope will deposit in an initial cone around the injection pipe. Backfill material will then be transported and deposited downslope and laterally along breakout paths. As the back pressure on the injection area builds up from deposits, fine material is transported along breakout paths and deposited in directions of least resistance from the injection pipe.
6. All tests showed that fine sand backfill material will be transported past partial blocks in corridors as deposits build up. Fine sand backfill material will be transported into slack water areas and deposited by flow circulation.
7. Backfill material pumped into a dry mine cavity will develop a deposit with a surface slope of the deposited material which is dependent on a critical tractive force* required to move the backfill material at shallow flow depths in an open channel. For the fine sand material obtained from Rock Springs, the slope of the deposit surface was 0.05 to 0.06 in a dry mine cavity.
8. When the top of the deposit cone reaches the mine ceiling in a submerged mine cavity, back pressure builds up until a breakout channel forms between the mine ceiling and deposited material. Backfill material is then transported along the
*Tractive force TD = -yDS where 'Y = specific weight of water, D = depth of water flowing over the deposit, and S = slope of flowing water surface.

channel and deposited in the pool at the end of the channel until back pressure builds up and forms a new breakout channel.
9. The advancing front of deposited backfill material in a submerged mine cavity takes the slope of the submerged angle of repose of the backfill rnaterial. For the fine Rock Springs sand deposited under water the angle of repose is 30° or a slope of 0.577.
APPLICATION
The results described in this report can be used in planning and executing an effective method of hydraulic backfilling of mine cavities.
INTRODUCTION
Backfilling mine cavities with sand or waste material is a method that has been used to reduce subsidence. Much information is needed to determine the pattern of backfilling deposition for the various fill materials and mine cavity conditions.
The Bureau of Mines requested the Bureau of Reclamation to perform hydraulic model studies to determine the pattern of deposition for various typical mine conditions.
THE MODEL
Model Box-Slurry Sump
A 15-foot-square box 2.5 feet deep was constructed from wood frame and 3/4-inch plywood. The box was made watertight by sealing the plywood joints with rubber strips and sealing compound. A flap gate hinged on the floor of the box was constructed in one corner. The flap gate position could be adjusted to hold the water surface in the box at desired mine water levels. The floor was sloped slightly to the flap gate corner for completely draining the box in a very short time.
Water flowing through the flap gate dropped into a metal slurry sump after passing through a 4-foot-long by 2.&foot-wide sluice channel. The sump was 8 feet long by 2 feet wide by 3.5 feet deep mounted below the floor in a laboratory water-supply channel. Sand backfill material was washed into the slurry sump after being placed on the sluice channel floor. A propeller mixer was mounted vertically to maintain the backfill material in suspension during tests so it would be
2
picked up as a slurry by the 2-1/2-inch Kimball-Krogh sand pump. Power was provided to the Model 100 pump with a 5-horsepower electric motor.
Piping and Measuring System
A 1-.inch standard pipe was used for slurry injection so a velocity similar to the velocity used in the field injection system at Rock Springs, 16 to 18 feet per second, could be obtained in the model pipe. Previous backfilling operation pumped slurry through a 13-3/8-inch-inside-diameter pipe at a maximum rate of 7,800 gpm to give a pipe velocity of 17. 7 feet per second. Because transport velocity of backfill material is the most important parameter when pumping and injecting through a pipeline, the model duplicated prototype transport velocities in the pipeline and in the mine cavity.
Water and slurry discharges were measured using Venturi meters and water and mercury manometers. For Tests 1 through 14, a 3- by 1.45-inch BIF Venturi meter was used. For Tests 16 through 18, a second Venturi meter, 2- by 1-inch throat, was installed in the discharge line.
Model Scales-Mine Pillars
Before designing the model, several maps of actual mine layouts were observed on microfilm in the Bureau of Mines Denver Office. The pillar, cavity, and corridor dimensions varied from mine to mine. From discussions between laboratory engineers and Bureau of Mines engineers, it was decided that a symmetrical layout of pillars should be used in the model with each pillar having dimensions of 40 feet long, 10 feet wide, and representing a mine cavity height of 6 feet.
The mine. should have approximately 60 percent volume extraction of coal leaving a pillar volume of approximately 40 percent. The horizontal layout for a symmetrical pattern of pillars with above requirements was arranged to give approximately 8.5 feet of corridor space between ends of pillars and 11 feet between sides of pillars.
Distorted model scales-Equal transport velocities.-To obtain a horizontal velocity in the model mine cavity equal to the velocity in the prototype, the height of the model mine cavity required was 0. 75 foot. For the above conditions and maintaining a water velocity in the injection pipe and the horizontal water velocity in the mine cavity the same as in a Rock Springs prototype operation, the model geometric scales were: horizontal scale-1m :24P and vertical scale-1m :8P. This gave a vertical distortion of 1 :3. The important

considerations was that water transport velocities were the same in the model and the generalized Rock Springs, Wyoming, prototype mine backfill operation.
Undistorted model scales-Unequal transport velocities.-The tests with a sloping mine cavity were made with both geometrical horizontal and vertical scales undistorted at 1m:24P. Tests were made this way to minimize the problems with different horizontal and vertical scales for a tilted geometric shape. Test 17 was made with a level mine cavity and with equal horizontal and vertical scales of 1 m: 24P. This was done to compare backfill deposit pattern for the earlier level floor tests using a distorted scale with level floor tests and an undistorted scale. Deposit patterns were similar even though water velocity scales were different.
For all tests, prototype backfill material (a natural fine sand deposit obtained from Rock Springs, Wyoming) was used in the model. A distortion existed between prototype and model backfill sand based on the geometrical scale but water velocities and therefore transport and deposit characteristics were the same for a typical prototype (Rock Springs mine) and the model. Deposit patterns dei:>icted by the model should very closely represent backfill deposit patterns in the prototype.
Model and Prototype Backfill Material
At the outset, a decision was made that the most important characteristic to be studied in the model was the transport and deposition of the mine backfill material. Therefore, a prototype fine sand backfill material obtained from Rock Springs, Wyoming, was selected as the model backfill material and the model was scaled for using the fine prototype sand. To do this, prototype pipeline velocities were used in the model pipeline. Prototype mine cavity velocities were used in the model considering radial distances from the centerline of the vertical injection pipe and horizontal distances scaled according to the horizontal scale of 1m :24P.
The median size of the sand material used in the first backfilling operations at Rock Springs, Wyoming, was 0.14 mm. Approximately 6 yards of the fine sand were trucked to Denver. Portions of this sand were used in all of the model tests. In the Appendix, a size analysis is shown on the graph, Figure 1, of the soils test to determine bearing capacity.
THE INVESTIGATION
Tests With Level Floor
Eleven tests were conducted with backfill material pumped into a mine cavity having a level floor. All
3
tests were conducted with the cavity in a submerged condition, except Test 10 which simulated a dry cavity.
Preliminary Tests Without Pillars
Test 1 was made to determine the adequacy of the slurry tank, propeller mixer, sand feed, sand pump, and piping system. Only a small amount of fine sand material (about 1 cubic yard) was fed into the system during the test. About 10 cubic feet of fine sand material reached the model box, Figure 1. The remainder of the sand settled and remained in the slurry tank during the test.
Figure 1. Test 1. Pattern of deposit resulting from initial operation of the slurry mixing and pumping system. Photo P801-D-73839
Test 2 illustrated the deposition pattern for backfill material pumped into a deep submerged mine cavity with no pillars, Figure 2. Slurry was fed at a concentration of approximately 12 percent, by weight. Velocity in the injection pipe was approximately 9 feet per second. The deposit was in a cone shape with a depression in the top of the cone caused by velocity and turbulence of the jet. The angle of repose of the material deposited under water was about 30°. The maximum height of the deposited material was about 3 inches below the water surface when the test was stopped.
Test 3 was similar to Test 2 except a higher velocity of 16 feet per second was maintained in the injection pipe. Figure 3 shows the pattern of deposition in a simulated submerged cavity for this condition. Velocity from the submerged pipe was high enough to keep the floor free of sand material. A strip of sealing tape on the floor caused nonuniform velocity distribution and consequent nonuniform backfill material distribution.

Figure 2. Test 2. Pattern of deposit with a slurry concentration of 12 percent, by weight, and velocity of approximately 9 feet per second in the injection pipe. Photo P801-D-73840
Figure 3. Test 3. Deposit pattern in a submerged mine cavity for backfill material pumped at a concentration of 12 percent, by weight, and 16 feet per second in the injection pipe. Photo P801-D-73841
Test 4 illustrated the deposition pattern as the backfill material deposit reached the water surface in a partially submerged cavity. A rather flat surface (slope 4° to 5°) or shear plane developed at the top of the cone, Figure 4. The depth of flow over this plane was very shallow. The material was transported over the flat, sloping
4
Figure 4. Test 4. Deposit pattern showing shear surface at the top of deposited cone. Water surface was held at the downslope elevation of the shear plane surface. Photo P801-D-73842
plane according to the tractive force of the water flowing over the plane and the size of fill material, and deposited at an angle of repose on the sides of the cone. Again a typical flow velocity of approximately 16 feet per second was used in the injection pipe.
The first four tests were operated at prototype injection velocities to observe the deposit pattern and determine how the fill material acted under the hydraulic conditions imposed. Thus, radial velocities in the mine cavities for the prototype and the model were similar. Transport velocity is the most important parameter when considering transport of backfill material.
Tests With Pillars, Except for Test 7
Test 5 simulated a submerged mine cavity with a roof and pillars confining the flow in the cavity. The fill material deposit in the cavities between the pillars is shown in Figure 5 after the mine roof was removed. Velocity in the injection pipe located at the geometrical center of the pillar arrangement was approximately 16 feet per second and sand concentration was 12 percent, by weight. Pillars 40 feet long by 10 feet wide by 6 feet high were constructed in the model at a horizontal scale of 1m :24P and a vertical scale of 1m :BP giving a vertical distortion of 1 :3.

Figure 5. Test 5. Fine sand backfill material deposits in cavities between the mine pillars. Photo P801-D-73843
This distortion resulted in radial velocities nearly the same as those in the field operation at Rock Springs, Wyoming. The pillars were arranged in a symmetrical pattern to give approximately 60 percent cavity and 40 percent solid pillars in the mine. The test was run until the deposited material nearly reached the ceiling. Back pressure then built up, causing fine sand to break out of the initial ring and deposit outside the pillar area.
Test 6 was similar to Test 5, except four additional pillars (28 total) were installed in four rows, Figure 6. Sand was added to give approximately 17 percent concentration, by weight, and the deposit was similar to Test 5-Compare Figure 7 with Figure 5. Figure 8 shows contours of deposited backfill material of Test 6 in prototype dimensions.
Figure 6. Test 6. Seven rows of four pillars each were arranged in a symmetrical pattern to give 60 percent cavity and 40 percent solid pillars in the mine before Test 6. Photo P801 -D-73844
5
Figure 7. Test 6. Deposit pattern after injection of 16 percent backfill material at a pipe injection velocity of 15 feet per second. Photo P801-D-73845
For Test 7, the pillars were removed and the mine roof was placed at a simulated field position 6 feet above the floor. The test was made with the cavity in a submerged condition. A comparison of the deposited fill material for Test 7 with the previous Tests 1 through 4 in which a confining roof was not in place, shows a different pattern on the outside edge of the deposited ring of material, Figure 9. The material in Test 7 was deposited in a scalloped pattern, compared to a smooth, circular pattern in Tests 1 through 4. In Test 7, fill material deposited until the flow area between the top of the sand deposit and the ceiling was nearly closed off. A back pressure then built up, a channel broke out along the top of the sand deposit, and backfill material was transported in this channel until enough material was deposited to form a delta and closed the channel off. The flow then broke out in another channel depositing another delta. This procedure continued, forming a scalloped pattern around the outside edge of the doughnut-shaped ring of backfill material.
Tests 8 and 9 were made to show how partially or totally blocked openings in the mine corridors would affect the deposited pattern of backfill material. Figures 10, 11, 12, and 13 show where partially and fully blocked openings are located and how the fine sand backfill material flows to fill the cavities. Even a small flow over a considerable time period will transport fine sand around corners and into cavities that seem to be blocked. As a general rule, if water will flow into an area, fine backfill material transported by the water will be carried in to fill cavities or around corners. Velocity in the injection pipe varied from approximately 14 to 4 feet per second for Test 8 and

TEST 6 CONTOURS OF BACKFILL DEPOSIT
AT END OF TEST. PILLARS - 40% OF MINE VOLUME CAVITY - 60% OF MINE VOLUME MINE CAVITY LEVEL AND SUBMERGED.
Wffi1 BACKFILL MATERIAL FILLED - - · - TO ROOF LEVEL.
Figure 8
6

Figure 9. Test 7. Contours simulate 1-foot intervals, 0-6 feet, in prototype mine cavity after injection at 14.5 feet per second with slurry concentration of 16 percent. Photo P801-D-73846
Figure 10. Test 8. Deposition pattern for corridors partially blocked and fully blocked at points indicated. Slurry concentration was about 35 percent, by weight. Corridor block designations are: U 1/2 indicates upper one-half of corridor is blocked; L 1/2 indicates lower one-half of corridor is blocked; full indicates full corridor is blocked. P801 -D-73847
was steady at 14 feet per second for Test 9. Sand concentration for Test 8 was approximately 30 to 35 percent, by weight, and for Test 9 approximately 25 percent, by weight.
In Test 10 a dry mine cavity was simulated with the sides and an end of one corridor blocked before the test, Figure 14. No roof was used and the injection pipe velocity varied from approximately 15 to 8 feet per second with a 20 percent slurry concentration. A slight amount of back pressure caused a reduction of
7
discharge and velocity in the injection pipe; however, no adjustment to the discharge was made after the test was started. The end block allowed a small amount of water to flow through the corridor, Figure 15. The blocked corridor filled with backfill material to about the same depth as the corridors outside of the blocked area. In the dry cavity backfill, material is transported and deposited according to open channel sediment transport laws. The bed slope from the top of the cone around the injection pipe to the outside of the cone was 0.05 in the longitudinal corridor direction and 0.06 in the cross-corridor direction, Figure 16. In a dry cavity a shallow depth of water transports backfill material and the steepness of the resulting bed slope depends on the tractive force required to transport the size of backfill material. Figure 17 shows prototype contours of deposited backfill material at the end of Test 10.
Sloping floor Tests 11, 12, and 13 are discussed in the following sections.
For Test 14 the height of the model pillars was reduced from 0. 75 to 0.25 foot to represent the 6-foot-high prototype pillars without vertical distortion. This test was conducted to compare the pattern of deposition of backfill material in distorted and undistorted models. Test 14 had a simulated wall on two of the four sides. These walls seemed to have very little effect on the initial deposit pattern of backfill material as compared to Test 5 having no walls on the sides. The general distribution of backfill material in Test 5 (distorted vertical dimensions test) is very similar to Test 14 (undistorted vertical dimensions tests). Velocity in the injection pipe, Test 5, was approximately 16 feet per second with a 12 percent concentration and for Test 14 about 10 feet per second with a 10 percent concentration. Proportionately for the depth of cavity, more sand was pumped in Test 14 than in Test 5. Figures 18 and 19 show deposit pattern and prototype contours at the end of Test 14.
Test 15 was conducted with water only to check the water calibration of the Venturi meters.
For Test 16, the vertical height of the model pillars was 0.25 foot (no vertical distortion), and the arrangement of pillars was the same as for previous tests. Distribution of backfill material at 9 percent concentration was very similar to the pattern of deposit in the tests with higher pillars, Figure 20. The velocity of slurry in the injection pipe was approximately 16.5 feet per second. The velocity and turbulence were high enough to clear the floor area below the end of the injection plpe.

-~ 0
II(
TEST 8 CONTOURS OF BACKFILL DEPOSIT
AT END OF TEST. PILLARS -40% OF MINE VOLUME. CAVITY-GO¾ OF MINE VOLUME. MINE CAVITY LEVEL AND SUBMERGED.
BACKFILL MATERIAL FILLED TO ROOF LEVEL.
Figure 11
8

Figure 12. Test 9. Blocks to reduce flow areas by one-half in the corridors were placed at several locations (see arrows). Slurry concentration was approximately 25 percent with velocity in the injection pipe approximately 14 feet per second. Photo P801-D-73848
Tests With Sloping Floor and Pillars
Tests 11, 12, and 13 were made with the mine cavity floor on a 15° slope. The water surface in the mine area was lower than the injection pipe exit for Test 11. Backfill material was pumped into the mine cavity on a dry floor and the slurry flowed laterally and downslope along the corridors into the ponded water table below. Slurry concentration was 24 percent and the injection pipe velocity was about 3 feet per second. Horizontal and vertical scales were 1 :24. The deposit pattern is shown in Figure 21 .
Test 12 was similar to Test 11, except the water table was above the injection pipe exit in the 15° sloping mine cavity. The backfill material was injected at a concentration of about 35 percent with a velocity of approximately 8.5 feet per second. Material flowed radially from the injection pipe, filling the cavity downslope and also upslope to the water surface. Figure 22 shows the pattern of deposition.
Test 13 was a duplicate of Test 12. Comparing pictures of Figures 22'and ~3 shows that the deposit pattern for these two tests was very similar. Figure 24 shows the prototype contours of deposited material at the end of Test 13.
The mine cavity for Test 17 had a solid wall at the downslope end of the corridors. The cavity was submerged, the floor was on a 5° slope, and the velocity of the 8 percent slurry in the injection pipe was about 10 feet per second. The deposition pattern for Test 17 was very similar to the deposition patterns for Tests 5 and 14 made with a level floor and
9
submerged condition, Figure 25. For the initial ring of backfill material that deposited up to the ceiling of the mine cavity, the deposit pattern was very nearly symmetrical. The first breakout and channelization occurred in an upslope direction. The distance from the injection pipe to the initial ring deposit was slightly smaller in an upslope direction than in a downslope direction, allowing the first breakout in an upslope direction. The gravity component, in the 5° slope direction, was very likely a reason for the slightly less deposit downslope than in the upslope direction. Figure 26 shows the prototype contours of deposited backfill material at the ena of Test 17.
Test 18 was made as a duplicate of Test 17 except Test 18 was continued longer (32 minutes as compared to 18 minutes for Test 17 model time). Figures 27 and 28 when compared with Figures 25 and 26 show that there is a more extensive deposit at the end of Test 18 and the deposit to the roof has a wider band.
General
All tests with pillars were performed with the injection pipe geometrically centered in a symmetrical pattern of pillars. As a result the pattern of deposition on the level and near-level floor conditions were very nearly symmetrical about the injection pipe. Transport and deposit of the backfill material depend on the flow of slurry material in the mine cavity. Rock falls which block or partially block corridors will affect the radial flow and deposit patterns.
Deposition of backfill material in a field operation depends on the extent of open corridors which may or may not be symmetrical.
Bearing and Settlement Tests
Information was obtained from the Denver Bureau of Mines Office giving the minimum dry density and maximum dry density of the Rock Springs backfill material as 85 and 102.7 pounds per cubic foot (pcf), respectively. Earth Sciences Branch, USBR, determined these values as 85 and 108.4 pcf, respectively, as shown in the Appendix. The maximum settlement that could occur was calculated for material deposited at minimum dry density being compacted by subsidence above the mine cavity to a maximum dry density. Table 2 and Figure 29 gives the maximum settlement for backfill deposit at minimum dry density of 85 pcf, and subsidence causing vertical compaction to a maximum dry density of 102.7 and 108.4 pcf, up to a mine cavity depth of 6 feet. The above settlement calculations and Figure 29 are based on the assumption that no lateral movement of fill material occurs during compaction.

TEST 9 CONTOURS OF BACKFILL OEPOSIT AT
END OF TEST. PILLARS-40% OF MINE VOLUME CAVITY - 60% OF MINE VOLUME MINE CAVITY LEVEL AND SUBMERGED.
f7777T,I BACKFILL MATERIAL FILLED ~ TO ROOF LEVEL.
Figure 13
10

Figure 14. Test 10. Arrangement of pillars for backfill material pumped into a dry cavity. Blocks in one corridor were placed_ at A, B, and C as shown . Photo P801-D-73849
Figure 15. Test 10. Backfill material pumped into a dry cavity. Note deposit in corridor that is blocked. Slurry concentration was 20 percent. Photo P801-D-73851
Figure 16. Test 10. Deposit at edge of pillar area shows slope of deposited backfill material for a dry cavity. Photo P801-0-73852
11

l,O'
TEST 10 CONTOURS OF BACKFILL DEPOSIT
AT END OF TEST. PILLARS- 40% OF MINE VOLUME CAVITY-60% OF MINE VOLUME. MINE CAVITY LEVEL AND DRY. SURFACE SLOPE OF BACKFILL
DEPOSIT .050 TO .06
NO MATERIAL FILLED TO ROOF LEVEL
,.ci
0 -· I
Figure 17
12
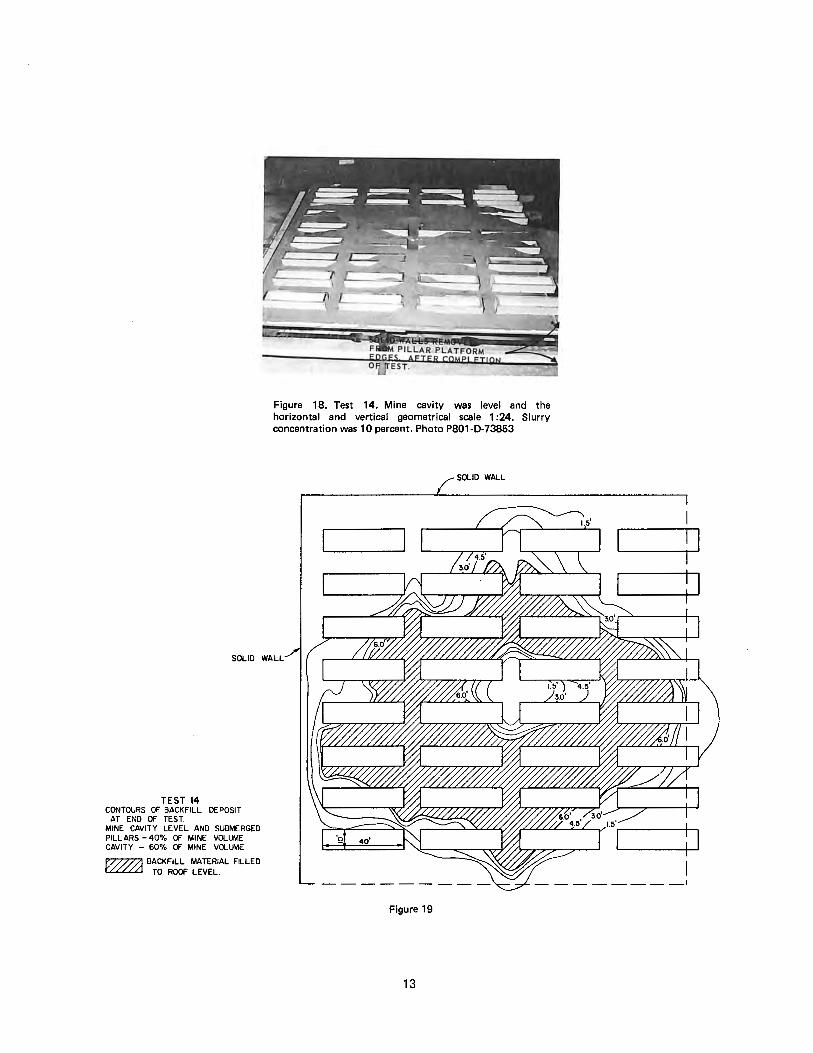
Figure 18. Test 14. Mine cavity was level and the horizontal and vertical geometrical scale 1 :24. Slurry concentration was 10 percent. Photo P801 -D-73853
SOLID WALL
SOLID WALL
TEST 14 CONTOURS Of BACKFILL DEPOSIT
AT END OF TEST. MINE CAVITY LEVEL AND SUBMERGED PILLARS - 40¾ OF MINE VOLUME CAVITY - 60¾ Of MINE VOLi.ME
P777771 BACKFILL MATERIAL FILLED rLLLLLl TO ROOf LEVEL.
Figure 19
13

Figure 20. Test 16. Floor and roof of the mine cavity was level. Slurry concentration was 9 percent and the injection pipe velocity was about 16.5 feet per second. Photo P801-D-73854
Figure 21. Test- 11. Simulated backfilling of a mine cavity on a 15° slope. Water surface in the cavity was lower than the floor position under the injection pipe. Photo P801-D-73855
Figure 22. Test 12. Distribution of material on a 15° slope with the water surface in the cavity higher than the injection pipe exit. Photo PS0t-D-73856
14

TEST 13 CONTOURS OF BACKFILL DEPOSIT
AT END OF TEST. MINE CAVITY SUBMERGED TO
INDICATED WATER LEVEL .
FLOOR
~ BACKFILL MATERAL FILLED TO ROOF LEVEL .
PILLARS -40% OF MINE VOLUME CAVITY -60% OF MINE VOLUME
Figure 23. Test 13. A duplicate to Test 12, Figure 22. Photo P801-D-73857
f W.S. INTERSECTS MINE CAVITY SLOPE WITH MINE FLOOR
PLATFORM~ DOWNWARD -15• - --------------- ---1
:
I I
I 't:::::t:=::====:l ,__---,-----, ...___,____, : I L ___ _ ______________ _ J
figure 24
15
L. .... w.s. INTERSECTS I WITH MINE FLOOR

Figure 25. Test 17. The floor and roof of the mine cavity was sloping 5° from the horizontal. A solid wall was simulated at the downslope end of the pillars. Photo P801-D-73858
MINE CAVITY SLOPE -DOWNWARD 5•
SOLID WALL
TEST 17 CONTOURS OF BACKFILL DEPOSIT AT END OF TEST.
PILLARS-40¾ OF MINE VOLUME CtlVITY-60¾ OF MINE VOLUME . MINE CAVITY SUBMERGED.
177777?1 BACKFILL MATERIAL iULLL.d FILLED TO ROOF -LEVEL
~1 40' I I I I I I I
------------------~ Figure 26
16

TEST 18 CONTOURS OF BACKFILL DEPOSIT AT END OF TEST.
MINE CAVITY SUBMERGED. PILLARS- 40% OF MINE VOLUME CAVITY-60% OF MINE VOLUME
Figure 27. Test 18. Test conditions the same as Test 17 except Test 17 was continued for 18 minutes and Test 18 was continued for 32 minutes. Photo P801-D-73859
W ~ BACKFILL MATERIAL I, 21 FILLED TO ROOF LEVEL t. ::::::t.=:~=::==i
Figure 28
17
MINE CAVITY SLOPE --- DOWNWARD 5°

.. .. .. . ~ >.. iii z ~ . i ::E :, ::E z i
!;; :c ~ 2 .. 0 .. iii 0 ... .. 0
I
) 0
0
I I
V / I V I 102.7 PCF
lY k'.:_il08.4 PCF
I / /
I /
/ I /
I /
V J/
I~
~ Calculations and graph assume no lateral movement of fill material as it is consolidated.
f
.. 1.0 (FEET)
SETTLEMENT BASED ON MAXIMUM DRY DENSITY OF 102. 7 AND 108.4 LBS. PER. CUBIC FOOT
Figure 29. Consolidation of backfill material based on deposit depth and maximum dry density.
In-place Density
, ..
Measurements of in-place density of backfill material were made by taking samples of deposited backfill material after completion of Tests 7, 8, and 9. In-place density of backfill material deposited under water and not drained was measured as 73.6 pcf for approximately 3-inch depth of deposited material. After the material was drained, the in-place density was 93.8 pcf.
A few settlement tests were made on deposited backfill material between the pillars and outside the pillar area. Four-, six-, and twelve-inch-square platforms were loaded with 176.5 pounds and the vertical deformation of the sand was measured after water was drained from the deposited material. Variations in the increase of deformation for increase in load per unit area were apparent. The depth of deposited material was small (3 to 8 inches) in the areas the bearing tests were made, accounting for some of the differences in deformation per unit load. Settlement measured for load tests made between pillars was less than settlement measured for
18
tests made without pillars (Test 7). The pillars provided a limited amount of confinement.
Earth Sciences Laboratory Tests
Because of the small depths of deposited backfill materials in the hydraulic model tests and variations of measurements of the bearing li,ad tests, the Earth Sciences Branch of the Bureau was asked to make standard laboratory tests on a sample of the fine sand backfill material shipped from Rock Springs and used in the hydraulic model tests. Physical properties tests, bearing capacity, and stress-strain characteristics for estimating the .imount of surface subsidence above a mine due to rock pressure loads were made. The results given in a memorandum from the Earth Sciences Branch to the Hydraulics Branch are included as an Appendix to this report.
REFERENCES
Donner, Donald L. and Whaite, Ralph H., "Investigation of Subsidence in Rock Springs, Sweetwater County, Wyoming," U.S. Bureau of Mines, Mineral Resources Evaluation, 1969
The Dow Chemical Company, "Proposal for Hydraulic Backfilling of Mine Voids in a Limited Area Underlying Rock Springs, Wyoming," submitted to U.S. Bureau of Mines, January 19, 1970
Dowell Division, The Dow Chemical Company, "Completion Report, Demonstration Project, Prevention of Surface Subsidence, Rock Springs, Wyoming," 1970
Graf, Walter H., "Hydraulics of Sediment Transport," McGraw Hill Book Company, 1971
Graf, Walter H., "A Modified Venturimeter for Measuring Two-phase Flow or Particle Dynamics and the Venturimeter," Journal of Hydraulic Research, Vol. 5, No. 3, 1967
U.S. Bureau of Reclamation Hydraulics Branch, "Progress Report on Results of Studies on Design of Stable Channels,". Hydraulics Laboratory Report Hyd. 352, June 1952

Approx Test Date cone
number % by wt
1 12-14-72 12
2 12-19-72 12 3 12-21-72 12 4 1-3-73 12
5 1-10-73 12 6 1-12-73 17
7 1-19-73 16
8 1-26-73 35
9 2-1-73 25
10 2-7-73 20
11 2-14-73 24
Table 1
DATA SHEET-BACKFILLING MINE CAVITIES HYDRAULIC MODEL TESTS FOR BUREAU OF MINES
Center cavity Q Vin Sed dep Level Roof
slurry 1" pipe Radius above or slope above cfs slurry inches floor degrees floor
ft/sec inches inches
.049 R, 9 NA 0 L None
.049 R, 9 12-1/4 5-5/8 L None
.086 Re 16 25-1/2 0 L None
.086 Re 16 17-1/2 5-3/4 L None
.086 Re 16 25 5.4 L 9
.072- 13.2- 13 1/2 L 9 .084 16.9
.076- 14.1- 13± ? L 9 .082 15.1
.020 3.67- 18 4 L 9 13.4
.073- 13.6- 21 4 L 9 .078 14.3
.044- 8.07- 14 0 L None .082 15.1
.044 4.72 No cavity 0 15 3 ws below injec-tion pipe
WS in ! Piers box Comment in
above place floor ft #
About 0 1.0 1.0 0 1.0 0 .75 Surface 0
. slope tan= .08 =4.40
1.0 20 1.0 28
.95-.88 0
.98-.86 Pillars 32 partial & full block
.95 Pillar 32 partial blocks
0-Dry 1 corridor 32 blocked
Below 32 pipe

Table 1-Continued
Center cavity Approx Q Vin Sed dep Level Roof WSin Piers
Test Date cone slurry 1" pipe Radius above or slope above box Comment in number %by wt cfs slurry inches floor degrees floor above place
ft/sec inches inches floor ft #
12 2-14-73 35 .047 8.5 13 1/2 15 3 Above 32 pjpe 1.9
13 2-16-73 High .053 10 13 0 15 3 Above 32 pipe 1.9
14 2-23-73 10 .058 10 12 0 L 3 1.20 2 sides 32 blocked solid wall
15 3-8-73 1.58- . 046- No deposit in box-Recirculating-Calibrating Venturi's . 4.72 .092
16 3-8-73 9 .089- 16.2- 17 0 L 3 Above 2 sand 32 .093 16.9 pipe rates
17 3-14-73 8 .051- 9.3- 13 0 5 3 Above 1 side 32 .063 11.4 pipe downslope
blocked solid wall
18 6-5-73 4.3 .05_Q- 9.1- 13 0 5 3 Above Downslope 32 .053 9.6 pipe side and
sloping side blocked

Table 2
SETTLEMENT BASED ON THE ASSUMPTION THAT BACKFILL MATERIAL IS DEPOSITED AT THE
MINIMUM DRY DENSITY AND VERTICAL SETTLEMENT OCCURS (NO LATERAL COMPACTION)
UNTIL MAXIMUM DRY DENSITY IS REACHED
Original deposit depth
ft
6.0 4.0 2.0
6.0 4.0 2.0
For minimum dry density = 85 pcf and maximum dry density= 102.7 pcf
Depth Depth after of
settlement settlement ft ft
4.96 1.04 3.31 0.69 1.65 0.35
For minimum dry density = 85 pcf and maximum dry density = 108.4 pcf
4.71 3.14 1.57
21
1.29 .86 .43
% settlement
17.3 17.3 17.5
21.5 21.5 21.5

!PPEN.DJX
23

APPENDIX
Laboratory Studies on Sand for Mine Backfill, USBM, Rock Springs, Wyoming
Laboratory studies performed by the Earth Sciences Branch on sand for backfilling mines by the U.S. Bureau of Mines of Rock Springs, Wyoming. These results were transmitted by memorandum dated April 4, 1973.
Standard Properties Tests
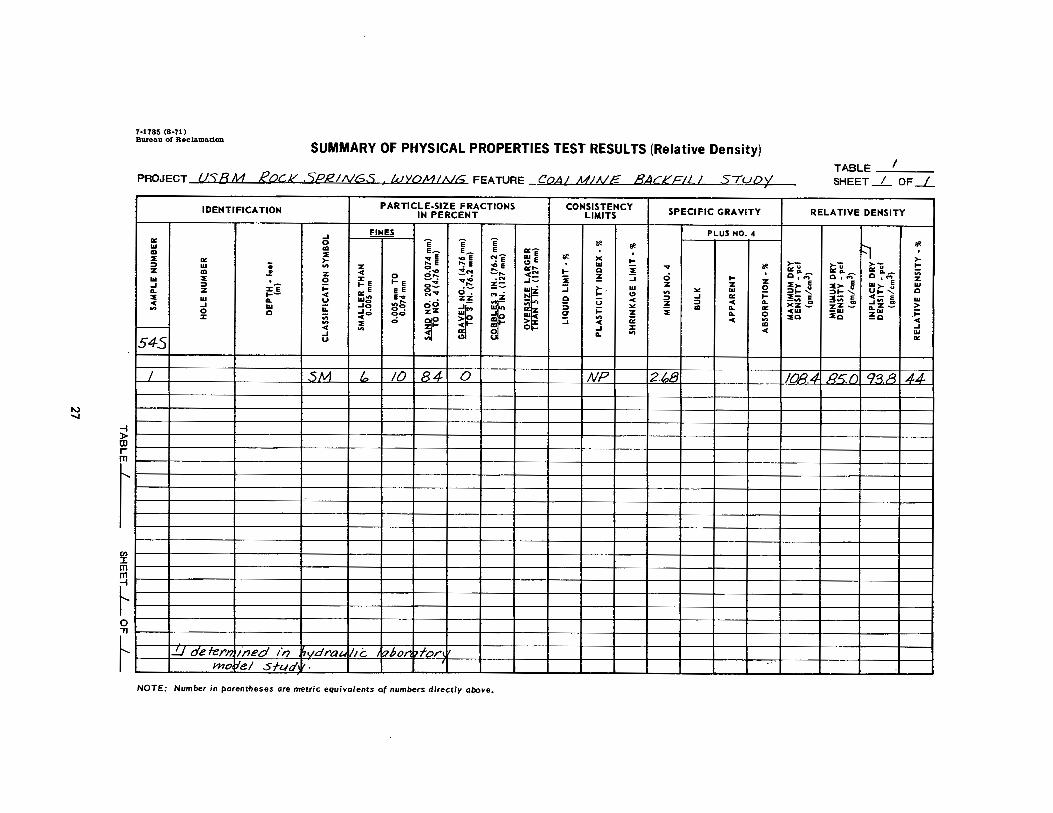
1. The backfill material tested (Sample No. 54S-1) was classified as a silty sand (SM) containing 16 percent nonplastic fines and 84 percent predominantly fine sand (minus No. 50). The sample had a median grain size of 0.140 mm and a coefficient of uniformity of 5 (see Table 1 and Figure 1).
2. The results of the relative density test (Designation E-12, Earth Manual) indicated a minimum dry density of 85.0 pcf and a maximum dry density (dry method) of 108.4 pcf (see Table 1 and Figure 1 ). Based on these test results, the average in-place condition of the hydraulic backfill in the model tests (average dry density = 93.8 pcf) is approximately 44 percent relative density, which corresponds to a medium dense condition (see page 314, Earth Manual).
3. Ko-test-In order to simulate the high compressive ground pressures existing in underground mines, a triaxial shear test with no lateral strain was performed on a specimen (2 inches in diameter and 5 inches in length) to determine the value of "earth pressure-at-rest" (Ko). On an effective stress basis, Ko is defined as the ratio of the developed lateral pressure (<73 ) to the applied axial pressun~ (a1 ) under conditions of zero lateral strain. Other soil parameters determined in the Ko-test include Poisson's ratio (µ) and a modulus of deformation (Ec) which differs from Young's modulus (E) because the specimen is tested in a constrained manner by the application of a lateral pressure during the test and the strain is nonlinear and nonrecoverable.
The test specimen was placed at a dry density of 95.1 pcf, corresponding to 50 percent relative density, and sealed in a rubber membrane. The specimen is then placed in a triaxial pressure chamber which is filled with water to completely surround the sp~cimen. During application of the axial load (ai) to the specimen, the specimen is prevented from straining laterally by adjusting the lateral pressure (oj) on the specimen to maintain zero lateral strain.
The maximum modulus of deformation (Ec) determined in the Ko-test was 14,682 psi and the corresponding value for Poisson's ratio was 0.28. The test results are summarized briefly below and more completely in Table 2 and Figure 2.
A "constrained" modulus, such as the secant modulus (M) or tangent modulus (b.M), computed by dividing the axial stress by the axial strain, can be used to compute the vertical settlement under large loaded areas. The value of the secant modulus (M = ai /e1 ) for the overall range of stress is 11,474 psi while the tangent modulus (b.M = b.o1 /b.e1 ) for the intermediate stress range of the test is 12,069 psi. See Figure 3.
The modulus of deformation is also a function of the effective stress acting on the specimen because the stress-strain is nonlinear and change in strain usually becomes less under higher increments of stress; therefore, the higher the effective stress the greater the value of Ec. In this test, the maximum applied axial stress was limited by the pressure limitations of the triaxial chamber which was 200-psi lateral pressure.
Bureau of Mines Study
A report1 by the Bureau of Mines presents the results of an extensive study performed on mine backfill materials simulating high compressive ground pressures
Test Summary
Initial placement conditions Modulus of Dry density Water content Void deformation (Ec) Ko Poisson's
pcf percent ratio psi ratio
95.1 9.8 0.7588 14,682 0.39 0.38
1 RI 7198 "Earth Pressure at Rest and One-dimensional Compression in Mine Hydraulic Backfills," D. E. Nicholson and R. A. Busch, October 1968.
25

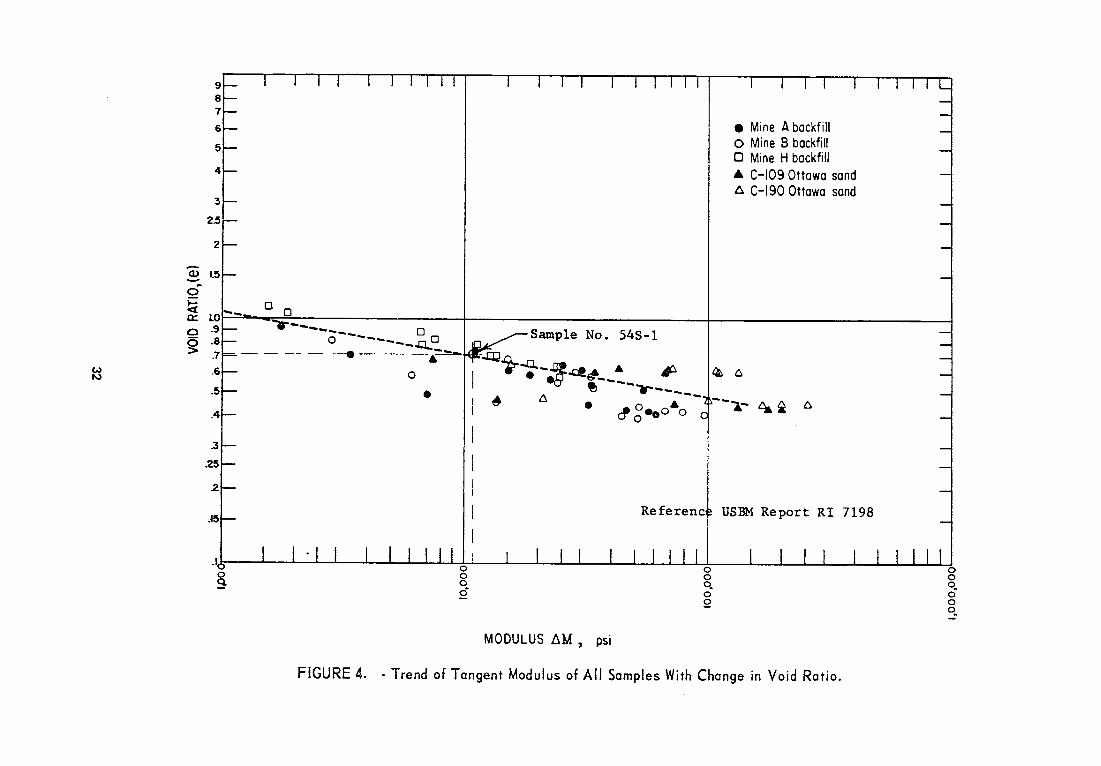
(up to 2,000-psi applied pressure) which resulted in a one-dimensional Earth-Pressure-at-Rest Model. These tests were performed on test specimens using a high-pressure compression chamber which permits no lateral strain to determine values of Ko for several different backfill materials placed at three density levels (loose, medium, and maximum densities). From these tests, the values of the tangent modulus (AM) are plotted against the void ratio (e) on Figure 22 of the referenced report to establish a trend line (see Figure 4). The tangent modulus determined from the Ko-test for Sample No. 54S-1 is also plotted on Figure 4 and it is seen to plot on the trend line indicating that the test results are comparable.
The conclusion made in the Bureau of Mines report (on page 38) is that under equivalent wall pressures a mine using loose backfill can expect an eight-fold increase in yield or compression of the backfill when compared to a mine using a compacted backfill.
Bearing Capacity
1. For a given soil pressure the settlement of a footing on sand depends upon the relative density and position of the water table. During placement of the hydraulic backfill in the mine it is not expected that complete filling will occur and that voids will exist between the top of the backfill (as deposited) and the mine crown. This void may eventually fill in with fallen rock and thus rock pressure may be transmitted to the backfill.
2. The allowable bearing capacity of submerged sand may be estimated by Terzaghi's general bearing-capacity equation for cohesionless soils:
2 Foundation Engineering, Leonards, G. A., pp 542-545.
26
where
q = allowable bearing capacity (psf) -y' = submerged unit weight (pcf) B = width of footing (ft)
N-y = bearing capacity factor
Assumptions: backfill material
a. Density
'Yd= 93.8 pcf W.C. = 29.2 percent (100 percent saturation)
I Therefore 'Y = (93.8 x 1.292) - 62.4
= 58.8 pcf.
b. Friction angle (I/>) for fine sand of medium density= 32° (Leonards, p. 219)
c. Bearing capacity factor N-y (I/> = 32°) = 12 (Leonards, p. 542)2
d. For bearing width of 10 feet or B = 10 feet
Substituting in equation above:
q = 58.8 [ ~o] 12
q = 3,528 psf for 1-inch settlement
Say qa = 4,000 psf or 2 tsf
3. The settlement of the backfill is governed by the stress-deformation characteristics rather than the bearing capacity of the sand. The compressibility of the sand can be determined by the tangent modulus (AM) which increases with increasing relative density. The modulus also increases with an increase of the confining pressure which, in turn, is roughly proportional to the vertical pressure.
I\J ..... -I )> w r
I ~ m
~ 0 "Tl
~
7-1785 (8-71) Bureau of Reclamation
SUMMARY OF PHYSICAL PROPERTIES TEST RESULTS (Relative Density)
PROJECT U5RM ROCK SPRINGS WYOMING FEATURE COAi MINE BACKFILi STUD'-/ I
IDENTIFICATION PARTICLE-SIZE FRACTIONS CONSISTENCY SPECIFIC GRAVITY IN PERCENT LIMITS
..J FINES PLUS NO. 4
"' 0 'i 'i 'i Ill Ill w • E- e_ E ... -• :la wE 111· :la .., E .., E "'!E >< "' >- ,._ E '": E c.:, E w I-::, Ill ; .,, z ~E ... Ill "'?.., :!.~ ......
I- Q :la z • J? :z < -... ,cN c:i :la :r E 0 o ...
•<'< _,::; i z ::i I-Ill . 0 I- E ...... - :z ..J ::, :re j:: I- E 0~ ... z- ::i w z z 0 EE c:i':" --
i ~ .. w ... :z ~ ... " .,,
j:: :la ... - "' ...... e ... :z::z: "":z Q ::, .J "' < w ... u Wo ~~ gg
f , 5 u <( z ::, < ... .J w ii: ..Jo .. • ... "' .,, 0 Q ..J. :z a j:: :z: i ... 0 <o 00 :r ;;; 0 f > ::i
.,, ii: < "' .,, :la < "' - < .,, 0 ..J :r < ..J ... .,,
545 u
I 5M Ir, 10 84 0 NP 2.t:,B
'1 de-fern /ned in ,.;dra1. he '7001"1 1-for,, mo ie/ Sflld• 1 •
-
NOTE: Number in parent·heses are metric equivalents of numbers directly above.
TABLE __ / __
SHEET_/_ OF _L_
RELATIVE DENSITY
ti Ill . >->-- >-- >-- I-"'u "'u "'u ;:;; c"-- a. - 0 "--.... 0 .... .... :z
~~~ 2'>- Ii "'> ! w Ut- '- Q ::,1-'
~;;; Si 2a- E j;:;; I w _.,,"' > ><:Z - :zZ - ,._:z-cw -w :zW j:: 2'0 :lac _Q < .J w "'
IOP.d. Qt:;_() 9.~ . .A LJ_,1_

I\.) CX)
-f )> (l) r m
en I m m
~-0
f
EL~l5B (8-71) Bureau of Reclamation
SUMMARY OF TRIAXIAL SHEAR WITH ZERO LATERAL STRAIN (Ko) TEST RESULTS
PROJECT Bock 5pc/09s) Nyo. FEATURE Coo/ &f;'ne, &cl;-f;J/ '
TABLE __ z __ _ SHEET ___L OF _L
IDENTIFICATION INITIAL
SPECIMEN DATA :c ..J : ., 0 H" ..J~ ... II.
'° >- ... " . cr:1-"' l: ... •Z
0 -c ... IU >- > ... z < - j: WW
"' - 0 0 w< IL"' - IL Di: ILW al u _.,,,.. < o: :Ji "' z < II. j:: Cl"' UW e er: 01-_ :::, cr: I- I- Z1- "' .... IU 0 0 Cl z < <- zcr: " 1-<-o ::>z E z al ,! j: >- - w "' er:·., <l(v, - I- ' v,-
IU :Ji !:! 1-"' I- :::, :c..J f111:: z;;l. zw:..: ..Jo~ :::, < - E a= wcr:: ::,- "' ..J :ce .,. u z I- u< w- o-II. z !:! !!:: z '- 0 < 0 ~ ~ ·;. "'
-::, QI--" z w 1--
IL u w E u .,. WU "' !:!111 o~-< II. 0~ IL > l:- ....... II. 0 IL"' .,. ..J IU "'
w "' :,I- ILW l: cr: 0 IL >- 0 ..Jcr: -CU IL :c 0 "' IU
l:W wa: 0 < "' "' I- w OW OIL IL ..J 0 < IU >> IL u 3 "' IL u w
545 C) w 0 w 0
I .SM 2.(:,8 95./ 9.8 .3d.t:, .758B 0.00 0.0 - - -·-
-750/ o.4~L ~-41.7- -0.24 0.3/ 7127 ---- ~111- Q~qq_ 12.ILL. I) 2/,, n 35 q /?7() --
1.38 !Vo~k /)_ 21,, 0.35 I /,.4,t:?A.. --
.7~//) I.SP, 2,4./ __ .:; Q..._27 I?. ~7 12 JO/,., -~ .7?7Ll.. 1.7B 1?7.R,/.,.. o.ZJ.._ _12.37 17. 35q
.7?&;7 J.8f3 ~.t::;t, LI.. o.za_ 0.3q 14 t.J:l?.
·-- -- .7?--:J,Q /. QP, 35.k,5 __ _Q~.3£)__ ,..Q_.43 /~ 2/_~
.7'2.21 2.0A -:;,,a.A,4- .Q.30 __ Q.42 /~ l.l,,Ll
. 7'2nLL 2.18 IA-'J71 ....a..3_-? . o.41,., /'17, 79.4-
-------··
----
--- -·-
- - ------·
----
NOT£: Numbers in parentheses are metric equivalents of numbers directly above.

7 .17 42 (8-70) Bureau of Reclamation PHYSICAL PROPERTIES SUMMARY PLOT (Relative Density)
HYDROMETER ANALYSIS I SIEVE ANALYSIS
25HR. 7HR. 4!5MIN l!5MIN
100
90
80
70
" z in 60 1/l .. IL ... z
50
~ 40 G:
"' a. 30
20
10
TIME READINGS U.S. STANDARD SERIES CLEAR SQUARE OPENING 60MIN 19MIN 4MIN MN I I. • 200 •100 •!50 •40130 6 0 B s• :,• I 1• •1 ti • •• ... , ... 3 • '6"
I I I
I I I
' I
I I I I I I I I
I I I I ' I
I I I
I I I I I I r I I '
' ' I
I I I I I I
I I I I
' I I I
I I I I I
I ' _,.. I I I I
I I I I I I I I I
8 0
I
20
30 0
"' z 40 4 ,...
"' 50 o: 1-z
60 W 0 G:
"' 70 a..
80
90
I 00
.001 .002 .005 .009 .019 .037 .074 .149 .297 .42 .!590 1.19 2.0 2.38 4.76 9.!52 19.1 38.1 76.2 127 1!52
150
E 1,0 ~
I=
130 ~ §
120 f= ~
t:: I-
110 --::: I-I-I-,. I-
a. 100 -::: --! -
I-
DIAMETER OF PARTICLE IN MILLIMETERS
/ /
/ V
~ 150
= I §
,o
~ ~1
30
~ = I 20
--
-I 10
/: --
Classification Symbol Gradation Summary
Gravel Sand Fines
Atterberg Limits Liquid Limit Plasticity Index Shrinkage Limit
Speci Ii c Gravity Minus No. 4 Plus No. 4 Bulk
oo ~ Apparent = - I ----
::: Absorption !2 Relative Density "' 0
SM
0 %
8.4- %
L'2 %
%
NE?.. %
%
Z..68
___ %
0
t O 90
/ - ,.,/ -----
>.. 90 O
Minimum Density (
85.D PCF /. 3/o gm/cm3)
- / V
I-
v I----
80 ----
----
10 20 30 "' 50 60 70 80
RELATIVE DENSITY•%
----
----
80 ----
----
90
Maximum Density
I ( .:..J In-place Density
(
/QB.4-PcF /. 7 4- gm/cm3)
93 8 PCF /.SO gm/cm3)
-4.il_ Percent Relative Density Permeabi I ity Settlement
Placement Condition __ _ Coet of Permeabil ity ___ lt/yr
( __ cm/sec)
Settlement Under ____ psi Load ____ %
___ kg/cm2) Notes: ___________ _
700
MINIMUM DIHSITY SCALE NOTE: SCALED TO PLOT AS STRAIGHT LINE.
10070
/1\AXIIIUII DEHSITY SCALE
!J qs determined ln ltlborotory model stwty
Sample No. S 45- / Hole No.------ Depth _______ ft ( ______ m)
Figure/
29

EL-615A Bureau of
(12-70) Reclamation
40 TRIAXiAL SHEA~ ,ITH :ZERO LATIERAL STRAIN; (Ko) TEST
1.t,
V •• 35 0
,.,, a.
' .;
0 lb 30 J
: ·; ..... 50
t I/ 'N
!',,
0 I )I, J 0
) V /v
.// / ~ / 0
~ 1/ 0
0
~o 0./; ... -"' w
~: 0.5 : <(
sf::! 1-::,
:~o.4 ~: 02: "'I-E~ os ILw
IL 0
~ o.z 8
0./
0 0
I
/ 1~-
(•i...---
I
Z 3 VOLUME STRAIN - %
1R
~1~ j::]G Ee
/ j ll ~.
.I\ ~ ~µ
~ ~
-;-.
2 3 VOLUME STRAIN - %
Specimen Size 2 ">< 5" in ~ Remolded ( ____ cm) D Undisturbed
0 Q" I 6 cf3 0 cr,- (f ..
4-
4-
Sample No. $4 S - I Hole No. ______ Qepth ___ ft (----ml
/t:,
.; lb
lb
.; lb
lb
14-l I
I'll
I.Z ~ ')(.
z 0
/0 ~ 2
"' 0 u..
8 ~ u.. 0
"' ::,
~ ~ Q 0 2
4
0
I Figure Z
30

!5 22
·-. 2
5
,----.. 1l:,1
I
lb 150 '-.J
Ill Ill
" ~
+-!-t--I I I I
I
I I I ,,n +H-:
I I I I I I I I Ii! ;
I I I I I! I I I I I I
++·· I 1·
-\ I ' I I
I
I I
...L-f--H-I i
h+! I
I
I
! V) \.. /2
51- -t-1-t-
I I I
.f:_ -~ ' > I\)
c::i
-rr-, I I
H+l' iT I
/00 LH-h
I I
I I I
'5 7. I
I I I I !
=t= 5, 0
_j_ I I I
I
--j I
-+ 2
-t7·--511-1 I
' I :..fr,
' '
I
I I
1-1-1 I ' +· 71 I : I I I
I
I I I
I
I I
I
I
I
: I I I
i I
I
I I
i
I I I I I I
I I I
I I I I I I I
I I I
I I/
I/
I I
I "1
/I
~ I I/ I I i/1
; tr-+t ,, I ~ A
/! I ,_.,
l/1 V
+ 11,, , I
I
, ,,,
"' 0 0
I V
I
1--~~~ :::t:t
I I 7
aoo5
J
I
' ; ' I !
I I
+-
I
I I
! I
I
I
- -
' ' I : : i ' I I I I I I I I I
I I I I I I I I I I I I I ' I ' I I I I
i I i I I i I I I
I I I I I I I ' I I I I ' ' I I I I I t/t I
I I li)I !
-t I! I ! /i ·1 I
f+--1 I I 1 - I I I /I I
I. I I I I I I I I I I I I I I
I I ! I I
I I I I ' : I ! I
i I I I/ I I I I I I I
I I I I I I I !
I I I I ' I I I i I I I I I
I I I I I
I I I
' I I
U--L ; I/ I -LLLI- I I IJ I I I · I/ !
I t- I I I
I I i h I
I I I
I -I I ! I I I
I
Ir J_i - I ~ - I
I ,,
I --I I I I
I +---. I I -f+ I I !_ =+ I I I
I I I _l I ,--1-+ t I 7Tif I I
I I I I
! I ' I I I -
J ~-I I I
H-+' I I _J T I - -·
...L I
-4 I
I I I I I i i I I I A "" ~ .
y_ C.
I I I r I I I' I I I I. I I : I I
_J --I L j l
I .i, .. -- J.
I I I ! I
' I I I I 1-1-f--i
+ .. "
- I-... ~ -I I I I I I I
I I I ·,
! I I ' I I I ...L w Io I ,- ....J
=sAM ' I I I I I I I i I I ! I' I
+1-+ __ L_I I i I I I ! I I , I, I ' Ii I . I I
I
=t4~ +\-\-'- =1=t-I I I I I'
'IL nlt I I I I - I I
I R-- I I I I I I
i-# I I I I I I I Ii ! IT I I I I I I I; I I I I
0.010 0.015 0.020 A~ia/ strc,n - in./ in.
31
I ! ' I I I ' I
I I
"' fl
ffl=• "" I I i I
+ I I I I I I I
: I I I
I I' I I I-
I I I 1-1- -H-! ' I I I I I -i I
T I I I I '
I I ----o-+ I I
l--I I ' I -
I I
-~- I I I i
I --H-# I -I .L I I I I I I I I
I
I - I I I I -·I-1-f-
I 1-1-- i-s-+ --1->-- -->-- >-->-
----, I 1.±t±t
I I I r ---7+ I I I I
I I I -1-1-1-1-
--_j_L ===r4- I
-H--I
I --
I 'I I
I I
- I • I-1-1- --I ,--1->-->--1-f--I I 'T1
! I -'.:::t + -- .
i ~ I ----I I I ! I
..u I ~ I I
"i I I I + ,~ I
I I I I
1111 " ON +H- -\---I-. I-I - .I
+i ~
"' JI I I I
I I I I I I I -- I I l - -·-
, __ --T -----_,_ -·----I -b--- -- ---H-, ·- ,- -77--i-
,Y" iffif ~-Wl .. ij9~ . ___ _LL
11-t""i-- -I H-+-- _j
I I I i ' 17 I I ±l:±± ! ' I :++ff
-~
-i l+t+i- ,.. [I Ii I -JI t' H-H- +t-t--T --I ,
0.02.5 Figure 3
-
9 8 7
6
5
4
3
2.5
2
• Mine A backfill o Mine B backfill D Mine H backfill • C-109 Ottawa sand t::. C-190 Ottawa sand
~ 1.5
0 ~ 0::
0
~
Lo-.9 .8
0 0 ..................... D Sample No. 54S-1
.7 0 ----------------JJ...~ - - - - -~ - ---- -.=--~-..Q;J
?-';--:,..a1.£1, __ • IP .6
.5
.4
.3
.25
.2
.15
0
• I ~ ---.-----' ~ ~ . -I • c! g-.o o
I I
Referenc USBM Report RI 7198
-'o!-_.....___.,___.....__....,___..1.---1........L.-1.....L...J~-'---...___---1.._...___.,______._..1.--_.___,___...__._-,!-o---'-----'--'--.....__.___....._....__.__ .......... -::!.o ~ g_ a
O 0 Q 0 o.
MODULUS AM , psi
FIGURE 4. - Trend of Tangent Modulus of All Samples With Change in Void Ratio.

7-1750(3-71) Bureau of Reclamation
CONVERSION FACTORS-BRITISH TO METRIC UNITS OF MEASUREMENT
The following conversion factors adopted by the Bureau of Reclamation are those published by the American Society for Testing and Materials (ASTM Metric Practice Guide, E 380-68) except that additional factors (*)
commonly used in the Bureau have been added, Further discussion of definitions of quantities and units is given in the ASTM Metric Practice Guide.
The metric units and conversion factors adopted by the ASTM are based on the "International System of Units" (designated SI for Systeme International d'Unites), fixed by the International Committee for Weights and Measures; this system is also known as the Giorgi or MKSA (meter-kilogram (mass)-second-ampere) system. This system has been adopted by the International Organization for Standardization in ISO Recommendation R-31.
The metric technical unit of force is the kilogram-force; this is the force which, when applied to a body having a mass of 1 kg, gives it an acceleration of 9.80665 m/sec/sec, the standard acceleration of free fall toward the earth's center for sea level at 45 deg latitude. The metric unit of force in SI units is the newton (N), which is defined as that force which, when applied to a body having a mass of 1 kg, gives it an acceleration of 1 m/sec/'$1!lc. These units must be distinguished from the (inconstant) local weight of a body having a mass of 1 kg, that is, the weight of a body is that force with which a body is attracted to the earth and is equal to the mass of a body multiplied by the acceleration due to gravity. However, because it is general practice to use "pound" rather than the technically correct term "pound-force," the term "kilogram" (or derived mass unit) has been used in this guide instead of "kilogram-force" in expressing the conversion factors for forces. The newton unit of force will find increasing use, and is essential in SI units.
Where approximate or nominal English units are used to express a value or range of values, the converted metric units in parentheses are also approximate or nominal. Where precise English units are used, the converted metric units are expressed as equally significant values.
Multiply
Mil ................ . Inches .............. . Inches . Feet Feet .. Feet .. Yards ....... . Miles (statute) Miles ........ .
Square inches .......... . Square feet . . . . . . . . . . . . Square feet . . . . . . . . . . . . Square yards .......... . Acres ............... . Acres ............... . Acres ............... . Square miles .......... .
Cubic inches .......... . Cubic feet ............ . Cubic yards . . . . . . . . . . . .
Fluid ounces (U.S.) ...... . Fluid ounces (U.S.) ...... . Liquid pints (U.S.) ....... . Liquid pints (U.S.) . Quarts (U.S.) ... . Quarts (U.S.) ... . Gallons (U.S.) ... . Gallons (U.S.) ..•........ Gallons (U.S.) ... . Gallons (U.S.) .......... . Gallons (U.K.) ......... . Gallons (U.K.) ......... . Cubic feet ............ . Cubic yards ........... . Acre-feet ............ . Acre-feet ............ .
Table I
QUANTITIES AND UNITS OF SPACE
By To obtain
LENGTH
25.4 (exactly) . . . . . . . . . . . . . . . . . . . . . . Micron 25.4 (exactly) , . . . . . . . . . . . . . Millimeters
2.54 (exactly)* . . . . . . . . . . . . . Centimeters 30.48 (exactly) . . . . . Centimeters
0.3048 (exactly)• . . . . . . . . . . . . . . Meters 0.0003048 (exactly)• . . . . . . . . . . . . . . Kilometers 0.9144 (exactly) . . . . . . . . . . . . . . . . . . . . Meters
1,609.344 (exactly)• . . . . . . . . . . . . . . . . . . . . Meters 1.609344 (exactly) . . . . . . . . . . . . . . . Kilometers
AREA
6.4516 (exactly) ............. Square centimeters *929.03 . . . . . . . . . . . . . . . . . . . . Square centimeters
0. 092903 . . . . . . . . . . . . . . . . . . . . Square meters 0.836127 .................... Square meters
*0.40469 . . . . . . . . . . . . . . . . . . . . . . . . Hectares • 4,046.9 ........................ Square meters
*0.0040469 . . . . . . . . . . . . . . . . Square kilometers 2.58999 . . . . . . . . . . . . . . . . . . Square kilometers
VOLUME
16.3871 . . . . . . . . . . . . . . . . . . . Cubic centimeters 0.0283168 . . . . . . . . . . . . . . . . . . . Cubic meters 0.764555 . . . . . . . . . . . . . . . . . . . . Cubic meters
CAPACITY
29.573-7 . . . . . . . . . . . . . . . • . . . Cubic centimeters 29.5729 . . . . . . . . . . . . . . . . . . . . . . . . Milliliters
0.473179 .................. Cubic decimeters 0.473166 . . . . . . . . . . . . . . . . . . . . . . . . Liters
*946:358 . . . . . . . . . . Cubic centimeters *0.946331 . . . . . . . . . . . . . . . . . . . . . . . . Liters
*3,785.43 . . . . . . . . . . . . . . . . . . . . Cubic centimeters 3. 78543 . . . . . . . . . . . . . . . . . . . Cubic decimeters 3. 78533 . . . . . . . . . . . . . . . . • . . . . . . . . Liters
* 0.00378543 . . . . . . . . . . . . . . . . . . . Cubic meters 4.54609 . . . . . . . . . . . . . . Cubic decimeters 4.54596 . . . . . . . . . . . . . . . . . Liters
28.3160 . . . . . . . . . . . . . . . . . . . Liters *764.55 . . . . . . . . . . . . . . . . . . . . . . . . . . . Liters
• 1,233.5 . . . . . . . . . . . . . . . • . . . . . . . . Cubic meters *1,233,500 . . . . . . . . . . . . . . . . . . . . . . . . . . . . . Liters

Table II
QUANTITIES AND UNITS OF MECHANICS
Multiply
Grains (1n,ooo lb) ........ . Troy ounces (480 grains) ..... . Ounces (avdp) .•...... : .. . Pounds (avdp) ........... . Short tons (2,000 lb) . . . . . . . • Short tons (2,000 lb) Long tons (2,240 lb) ....... .
Pounds per square inch Pounds per square inch Pounds per square foot Pciunds per square foot
Ounces per cubic inch ....... . Pounds per cubic foot ..... . Pounds per cubic foot ..... . Tons (long) per cubic yard .... .
Ounces per gallon (U.S.) Ounces per gallon (U.K.) Pounds per gallon (U.S.) Pounds per gallon (U.K.)
Inch-pounds . . . . . . . . . . . . . Inch-pounds ......... , .. Foot-pounds ........ . Foot-pounds ............ . Foot-pounds per inch _ . , .... . Ounce-inches ........ .
Feet per second • • . • . . . . . . . Feet per second ......... .. Feet per year •...•........ Miles per hour .••.•....•.. Miles per hour ........... .
Feet per second2 . . . . . . . . . . .
Cubic feet per second (second-feet) .... .
Cubic feet per minute ....... . Gallons (U.S.) per minute .••...
Pounds Pounds Pounds
By To obtain
MASS
64.79891 (exactly) . . . • • . . . . . . . . . . . . . . . . . . . Milligrams 31.1035 . . . . . . . . . . • . . . . . . . ......... Grams 28.3495 . . . . . . . . . . . . . . . . . . . . . . . . . . . Grams
0.45359237 (exactly) . . . . . • • . . . . . . . . . . Kilograms 907, 185 . . . • . . . . . . . . • • • • . . . . . . . . . . . . . . . Kilograms
0.907185 • • . . • . . . . . . . . . • . . . . . . . . . . . . . Metric tons 1,016.05 . . • • . . . . . . . . . . . . • . . . . . . . . . . . . . . . Kilograms
FORCE/AREA
0.070307 .... . 0.689476 .... . 4.88243
. . . . . . . . . Kilograms per square centimeter
. . . . . . . . . . Newtons per square centimeter
. . . . . . . . . . . . Kilograms per square meter 47.8803 ....... . . . . . . . Newtons per square meter
MASS/VOLUME (DENSITY)
1.72999 ......••...••••••... 16.0185 .......•.•..........
Grams per cubic centimeter Kilograms per cubic meter
Grams per cubic centimeter Grams per cubic centimeter
0.0160185 ................. . 1.32894 .•••..•......
MASS/CAPACITY
7.4893 .•.......•.•............... 6.2362 •••....•......•............
119.829 . .' .....•••..•..•........... 99.779 .•.•.••..................
Grams per liter Grams per liter Grams per liter Grams per liter
BENDING MOMENT OR TORQUE
0.011521 ........... . 1.129B5 X 106 ........ , 0.138255 .... . 1.35582 X 10⁷ 5.4431
72.008 ....
VELOCITY
. . . . . . . . . . . Meter-kilograms
........... Centimeter-dynes
. . . . . . . . . . . Meter-kilograms .......... Centimeter-dynes
Centimeter-kilograms per centimeter Gram-centimeters
30.48 (exactly) • . • . • . • • . . . . • . . . . . Centimeters per second 0.3048 (exactly)• . . . . . . . . . . . . . . . . . . . Meters per second
•o.965873 x 10'-6 • . • . . . . . . . . . . . . Centimeters per second 1.609344 (exactly) . . . . . . • . . • • . . . . . . Kilometers per hou_r 0.44704 (exactly) • • • . . . . • . . . . . . Meters per second
ACCELERATION*
•o.3048 . . . . . . . . . . . . . . . . . . . . . . . . . Meters per second2
FLOW
*0.028317 ..................... Cubic meters per second 0.4719 . . . . . . . . . . . . . . . . . . . . Liters per second 0.06309 . . . . . . . . . . . . . . . . . . . . . . . Liters per second
FORCE•
•0.453592 . . . . . • • . . . • • . . . . . . . . . . . . . . . . . Kilograms "4.4482 . . . . . . . . . . . . . . . . . . . . . . . . . . . . . Newtons ·4.4482 x 10⁵ • • .. . • . • . . . . . . . . . . . . . . . . . . . . Dynes
Multiply
British thermal units (Btu) .... . British thermal units (Btu) .... . Btu per pound ........... . Foot-pounds ........ : ... .
Horsepower . . . . . . . . . . . . . . Btu per hour ............ . Foot-pounds per second .•....
Btu in./hr tt2 degree F (k, thermal conductivity) ..
Btu in./hr tt2 degree F (k, thermal conductivity) ...... .
Btu ft/hr tt2 degree F ....... . Btu/hr tt2 degree F (C,
thermal conductance) Btu/hr tt2 degree F (C,
thermal conductance) Degree F hr tt2/Btu (R,
thermal resistance) . . . . . . . . Btu/lb degree F (c. heat capacity) . Btu/lb degree F .......... . Ft2/hr (thermal diffusivity) ... . Ft2/hr (thermal diffusivity) ... .
Grains/hr tt2 (water vapor) transmission) ......... .
Perms (permeance) ........ . Perm-inches (permeability) .... .
Multiply
Table I I-Continued
By To obtain
WORK AND ENERGY•
•o.252 . . . . . . • • . . . . . . . . . . . . . . . . . . . Kilogram calories 1,055.06 . . . • • . . . . . . • . . . . . . . . . . . . . . . . . . . . . . Joules
2.326 (exactly) . . . . . • . . . . . . . . . . . . . . . . . Joules per gram • 1.35582 . . . . . . • . . . . . . . . . . . . . . . . . . . . . . . . . Joules
POWER
745. 700 •....•..........................•. Watts 0.293071 ...••......................••••. Watts 1.35582 . . . . .............•.•........ Watts
HEAT TRANSFER
1.442 ..
0.1240 ·1.4880
Milliwatts/cm degree C
. . . . . . . . . . . . . . Kg cal/hr m degree C
. . . . . . . . . . . Kg cal m/hr m2 degree C
0.568 ••.....•..•............ Milliwatts/cm2 degree C
4.882 . . . . . . . . . . . • . . . . . . . . . . . . Kg cal/hr m2 degree C
1.761 •..•.....•............. Degree C cm2/milliwatt 4.1868 .........••.................. J/g degree C
• 1.000 . . . . . . • . . . . . . . . . . . . . . . . . . . Cal/gram degree C 0.2581 . . • . . . • . . . . . . . . . . . . . . . . . . . . . . • . cm2/sec
*0.09290 . . . . . . . . . . . . . . . . . . . . . . . . . . . . . . . . M2/hr
WATER VAPOR TRANSMISSION
16.7 ..... . . . . . • . . . . . . . . . . . . . Grams/24 hr m2 0.659 . ....... , . . . . . . . . . Metric perms 1.67 ..... , ....... , .. Metric perm-centimeters
Table Ill
OTHER QUANTITIES AND UNITS
By To obtain
Cubic feet per square foot per day (seepage) Pound-seconds per square foot (viscosity) ..
*304.8 . . . . . Liters per square meter per day {t 4.8824 . . . . . . . Kilogram second per square meter *0.092903 . . . . . . . . . . . Square meters per second 5/9 exactly . . . . Celsius or Kelvin degrees (change)• 0.03937 . . . . . . . . . . . . Kilovolts per millimeter
10.764 . . . . • . . . . . . . . Lumens persquare meter 0.001662 . . . . . . Ohm-square millimeters per meter
Square feet per second (viscosity) ..... . Fahrenheit degrees (change)* ...... . Volts per mil ..•...•........... Lumens per square foot (foot-candles) .. Ohm-circular mils per foot ....... . Millicuries per cubic foot ........ . Milliamps per square foot ........ . Gallons per square yard ....... . Pounds per inch ...............•..•..
*35.3147 . . . . . . . . . . . Millicuries per cubic meter *10.7639 . . . . . . . . . . . Milliamps per square meter
*4.527219 . . . . . . . . . Liters per square meter *0.17858 . . . . . . . . . . . Kilograms per centimeter

············································································:············································································ . ABSTRACT
Hydraulic models of an idealized coal mine were tested to demonstrate the pattern of deposition of sand material by pumping a slurry of fine sand and water into the mine cavity. A distorted geometrical scale with the horizontal scale 1m:24P (model to prototype) and vertical scale 1 m:aP was used first to give transport velocities in the model equal to transport velocities in the prototype. An undistorted model with a scale 1m:24P, was also tested in which transport velocities were not equal in the model and prototype. Prototype sand, 0.14 mm mean diameter, was used for backfill material in all model tests. Tests were made to simulate the following mine cavity conditions: (1) level floor with cavity submerged; (21 level floor with cavity dry; (3) sloping floor with bottom of injection hole submerged; (4) sloping floor with bottom of injection hole above the water surface; (5) corridor between pillars partially blocked and totally blocked; (6) solid walls on one and two adjacent sides of a rectangular section of pillars surrounding the injection hole. Approximate bearing strengths of backfill material were determined by soils mechanics tests. Model tests showed that transport and deposit of backfill material depend on the flow of slurry in the mine cavity. Roof falls which block or partially block corridors affect the radial flow and deposit patterns of backfill material.
. ABSTRACT
Hydraulic models of an idealized coal mine were tested to demonstrate the pattern of deposition of sand material by pumping a slurry of fine sand and water into the mine cavity. A distorted geometrical scale with the horizontal scale 1 m:24P (model to prototype) and vertical scale 1 m:aP was used first to give transport velocities in the model equal to transport velocities in the prototype. An undistorted model with a scale 1 m:24P, was also tested in which transport velocities were not equal in the model and prototype. Prototype sand, 0.14 mm mean diameter, was used for backfill material in all model tests. Tests were made to simulate the following mine cavity conditions: (1) level floor with cavity submerged; (2) level floor with cavity dry; (3) sloping floor with bottom of injection hole submerged; (4) sloping floor with bottom of injection hole above the water surface; (5) corridor between pillars partially blocked and totally blocked; (6) solid walls on one and two adjacent sides of a rectangular section of pillars surrounding the injection hole. Approximate bearing strengths of backfill material were determined by soils mechanics tests. Model tests showed that transport and deposit of backfill material depend on the flow of slurry in the mine cavity. Roof falls which block or partially block corridors affect the radial flow and deposit patterns of backfi II material.
. ················································~········································································································· .
ABSTRACT
Hydraulic models of an idealized coal mine were tested to demonstrate the pattern of deposition of sand material by pumping a slurry of fine sand and water into the mine cavity. A distorted geometrical scale with the horizontal scale 1 m:24P (model to prototype) and vertical scale 1 m:aP was used first to give transport velocities in the model equal to transport velocities in the prototype. An undistorted model with a scale 1 m:24P, was also tested in which transport velocities were not equal in the model and prototype. Prototype sand, 0.14 mm mean diameter. was used for backfill material in all model tests. Tests were made to simulate the following mine cavity conditions: (1) level floor with cavity submerged; (2) level floor with cavity dry; (3) sloping floor with bottom of injection hole submerged; (4) sloping floor with bottom of injection hole above the water surface; (5) corridor between pillars partially blocked and totally blocked; (6) solid walls on one and two adjacent sides of a rectangular section of pillars surrounding the injection hole. Approximate bearing strengths of backfill material were determined by soils mechanics tests. Model tests showed that transport and deposit of backfill material depend on the flow of slurry in the mine cavity. Roof falls which block or partially block corridors affect the radial flow and deposit patterns of backfi II material.
. ABSTRACT
Hydraulic models of an idealized coal mine were tested to demonstrate the pattern of deposition of sand material by pumping a slurry of fine sand and water into the mine cavity. A distorted geometrical scale with the horizontal scale 1 m:24P (model to prototype) and vertical scale 1 m:aP was used first to give transport velocities in the model equal to transport velocities in the prototype. An undistorted model with a scale 1m:24P, was also tested in which transport velocities were not equal in the model and prototype. Prototype sand, 0.14 mm mean diameter, was used for backfill material in all model tests. Tests were made to simulate the following mine cavity conditions: (1) level floor with cavity submerged; (2) level floor with cavity dry; (3) sloping floor with bottom of injection hole submerged; (4) sloping floor with bottom of injection hole above the water surface; (5) corridor between pillars partially blocked and totally blocked; (6) solid walls on one and two adjacent sides of a rectangular section of pillars surrounding the injection hole. Approximate bearing strengths of backfill material were determined by soils mechanics tests. Model tests showed that transport and deposit of backfill material depend on the flow of slurry in the mine cavity. Roof falls which block or partially block corridors affect the radial flow and deposit patterns of backfill material.

REC-ERC-73-19 CARLSON,E J HYDRAULIC MODEL STUDIES FOR BACKFILLING MINE CAVITIES Bur Reclam Rep REC-ERC-73-19, Div Gen Res, Oct 1973. Bureau of Reclamation, Denver, 32 p, 33 fig, 4 tab, 6 ref, append
DESCRIPTORS-/ hydraulic models/ *backfills/ *mines/ *hydraulic mine-filling/ cavities/ underground openings/ scale (ratio)/ models/ sands/ fines/ velocity/ pressure/ injection/ injectors/ *slurries/ back pressure/ bearing strength/ hydraulic pressure/ deposition/ hydraulic transportation IDENTIFIERS-/ Bureau of Mines/ mine openings
REC-ERC-73-19 CARLSON, E J HYDRAULIC MODEL STUDIES FOR BACKFILLING MINE CAVITIES Bur Reclam Rep REC-ERC-73-19, Div Gen Res, Oct 1973. Bureau of Reclamation, Denver, 32 p, 33 fig, 4 tab, 6 ref, append
DESCRIPTORS-/ hydraulic models/ *backfills/ *mines/ *hydraulic mine-filling/ cavities/ underground openings/ scale (ratio)/ models/ sands/ fines/ velocity/ pressure/ injection/ injectors/ *slurries/ back pressure/ bearing strength/ hydraulic pressure/ deposition/ hydraulic transportation IDENTIFIERS-/ Bureau of Mines/ mine openings
