report no. rec-erc-84-15, 'mix design investigation … · mix design investigation - roller...
TRANSCRIPT

June 1984
Engineering and Research Center
U. S. Department of the Interior " vmau of Reclamation

Bureau of ~ec lamat ion
Mix Design Investigation - Roller Compacted Concrete Construction, Upper Stillwater Dam, Utah 0-1510
I
9 . PERFORMING ORGANIZATION NAME AND ADDRESS 10. WORK U N I T NO.
7 . AUTHOR(S)
R. D. Crow, T. P. Dolen, J. E. Oliverson, and C. D. Prusia
8. PERFORMING ORGANIZATION REPORT NO.
REC-ERC-84-15
14. SPONSORING AGENCY CODE
DlBR 15. SUPPLEMENTARY NOTES
Bureau of Reclamation Engineering and Research Center Denver, Colorado 80225
12. SPONSORING AGENCY NAME AND ADDRESS
Same
Microfiche and/or hard copy available at the Engineering and Research Center, Denver, Colorado.
Editor: JMT
16. ABSTRACT
11 . CONTRACT OR G R A N T NO.
13. T Y P E O F REPORT AND PERIOD COVERED
RCC (roller compacted concrete) is concrete with zero slump consistency, which is placed in horizontal lifts and consolidated in place with vibratory rollers. It has the same properties as conventional concrete. The research in RCC for Upper Stillwater Dam involved two phases: a laboratory mix program to evaluate differdnt RCC mixes and a test placement at the jobsite followed by an extensive coring program. frhe laboratory mix design program was initiated to develop and fully evaluate three mixes \/vhich were used at the test placement. The three mixes evaluated differed primarily in the percentage of minus 200 material in the sand. Properties studied included compressive and tensile strength, elastic properties, shear strength, thermal properties, permeability, shrinkage, and durability. The test placement evaluated field performance of the mixes and the use of slip-form paving machines with laser control to extrude curbing for the upstream and downstream faces of the dam.
17. K E Y WORDS AND DOCUMENT ANALYSIS
a. DEsCR IPTORS-- /coarse aggregates/ compressive strength/ concrete additives/pozzolans/ concrete dams/ concrete placing/ concrete technology/ construction equipment/ creep/ curing/ dam/ dam design/ dam foundation/ density/ fine aggregates/ fly ash/ heat of hydration/ mass concrete/ modulus of elasticity/ no- slump concrete/ permeability/ physical properties/ Poisson ratio/ portland cement/ shear strength/ slip forms/ slump/ spillway/ tensile strength/ thermal properties/ water-cement ratio/ workability/
b. IDENTIFIERS-- /Upper Stillwater Dam/ Central Utah Project/ Utah/ UC Region
c. COSA T l F ie ld/Group 13C COWRR:1303.1,1313.1 SRIM: 50C 18. D ISTRIBUTION STATEMENT
Avai lab le from t h e Nat ional Technical Information Service. Operations D iv is ion , 5285 Port Roya l Road. Springfield. Virginia 22161.
(Microfiche and/or hard copy available from NTIS.)
19. SECURITY CLASS ( T H I S REPORT)
UNCLASS,FIED 20. SECURITY CLASS
(THIS PAGE)
UNCLASSIFIED
'21. NO. OF PAGE
7 2 22. PR ICE

MIX DESIGN INVESTIGATION - ROLLER COMPACTED CONCRETE CONSTRUCTION, UPPER STILLWATER DAM, UTAH
Roselle 0. Crow Timothy P. Dolen James E. Oliverson Charles D. Prusia
June 1984
Concrete and Structural Branch Division of Research and Laboratory Sewices Engineering and Research Center Denver, Colorado
U.S. DEPARTMENT OF THE INTERIOR * BUREAU OF RECLAMATION

ACKNOWLEDGMENTS
Acknowledgment is given to Alan T. Richardson, Concrete Dams Branch, for his valuable contribution ofthe "Design Concepts" portion ofthe report. The assistance of personnel from the Uinta Basin ConstructionOffice of the Upper Colorado Region is greatly appreciated for their contributions during the constructionand coring of the Upper Stillwater Dam test placement.
The assistance of personnel in the Concrete Section of the Concrete and Structural Branch is also gratefullyacknowledged for performance of the many tasks involved in the specimen preparation and testing.
As the Nation's principal conservation agency, the Department of theInterior has responsibility for most of our nationally owned publiclands and natural resources. This includes fostering the wisest use ofour land and water resources, protecting our fish and wildlife, preserv-ing the environmental and cultural values of our national parks andhistorical places, and providing for the enjoyment of life through out-door recreation. The Department assesses our energy and mineralresources and works to assure that their development is in the bestinterests of all our people. The Department also has a major respon-sibility for American Indian reservation communities and for peoplewho live in Island Territories under U.S. Administration.
The information contained in this report regarding commercial prod-ucts or firms may not be used for advertising or promotional purposesand is not to be construed as an endorsement of any product or firmby the Bureau of Reclamation.
ii

Nr-.C
X)
0CX
)
9.-0CX
)a..
.&;
(Q
:>E(Q0~ro~<
i5~c.c.
:>Oco.E.
Q)
ucOu(/)
'1ii.;;~
IQ)
uQ)
.5.(/).;;COLt

-

CONTENTS
PageAcknowledgments. ... . .. . . ... . .
"". "'"
""". . . . . ,..
"""'". . . . . . . . . . . . . . . ii
Introduction """"""'"
Design concepts - Upper Stillwater Dam......................................................................................Selecting the type of dam for Upper Stillwater...........................................................................Foundation... ... . "" . . ... ""'" . ,
""'". ,. ... .. . , . . .
"". . . .
Foundation treatment...............................................................................................................Spillway """""
Outlet works ..Dam
""""""""""""""""""""""""""", """"""""""""'"
Concepts of RCC mix design........................................................................................................
Conclusions.. ... .""
. ...""
. ..."'"
. ,""'"
. , . ,. . .., . . . . """ .""
. .
Materials investigations................................................................................................................
Preliminary mix design and mortar studies.....................................................................................
Final mix design studies...............................................................................................................Development of laboratory mix designs.....................................................................................Mixing and testing procedures..................................................................................................Fresh concrete ...Hardened concrete...................................................................................................................
Results of laboratory mix designs 12Compressive strength 12Modulus of elasticity and Poisson' s ratio in compression 14Tensile strength . 16Modulus of elasticity and Poisson' s ratio in tension 17Creep.. . .,. ... . "'" ,
"'" "'".""""'" """ """""'"
. .""'" """'"
."'"
. . ."""
. . .""
17Cohesion and coefficient of internal friction 17Coefficient of thermal expansion 18Adiabatic temperature rise 18Density. .... .... .
""'"."""'"
.. ..."'"
."'" """
...,... . .""""
. .., ."'"
.... .... 19Permeability .... ,
"""'" """"". """
"""""'"."""
."""
.. . . ,."""'"
. ,.. ...... . . 19Diffusivity
""""""""""""""""""""""""""""""""""""""""""",""""""""""""""""""'".. 20
Drying shrinkage 20
Upper Stillwater Dam - RCC test placement 21Concrete mix designs 21Coring program 25Core test program 27Tests of hardened concrete cores 28Core test program results 30Facing concrete 36
Test section - field test program 36
Bibliography 52
Appendix A - Upper Stillwater Dam - RCC test placement - construction"""""""""""""""""""
53
Appendix B - Upper Stillwater Dam - laboratory mix program - additional studies 65
v
1111222
2
3
4
4
5566
11

Table
Figure
CONTENTS - Continued
TABLES
123
Laboratory mix program - coarse aggregate physical properties - RCC ,....Laboratory mix program - fine aggregate physical properties - RCC..................................Upper Stillwater Dam concrete test placement - coarse aggregate physical properties -
individual grading (percent retained) .. ...,.. ..,... ..,.. ,. ..., , ........Upper Stillwater Dam concrete test placement - fine aggregate physical properties -
individual grading (percent retained) .. ...,... ..,... ., .,... .,... ..,.. ...,.. ,. ... .,.. ... .....Laboratory mix program - physical and chemical properties of cement and
pozzolan - RCC"""'
,..........Upper Stillwater Dam concrete test placement - physical and chemical properties of
cement and pozzolan ,.....Laboratory mix program - mix design summaries - mortar mixes - RCC ,..........Laboratory mix program - tests performed - RCC............................................................Laboratory mix program - mix design summaries - RCC...................................................Laboratory mix program - properties of fresh concrete - RCC ..........................................Laboratory mix program - average strength and elastic properties summary - RCC............Laboratory mix program - creep function parameters - RCC
"'"''''''''''''''''''''''''''''''''''''''''Laboratory mix program - shear and sliding friction summary - RCC ,.....Laboratory mix program - thermal expansion summary - RCC "..........................Upper Stillwater Dam concrete test placement core program - thermal expansion
summary .Laboratory mix program - adiabatic temperature rise summary - RCC ,..........Laboratory mix program - permeability summary - RCC ...................................................Laboratory mix program - diffusivity summary - RCC.......................................................Laboratory mix prog(am - length change summary - RCC ................................................Upper Stillwater Dam concrete test placement - length change summary - RCC ,.....Upper Stillwater Dam concrete test placement - RCC mix design summaries......................Upper Stillwater Dam concrete test placement - RCC mix designs - facing concrete..........Upper Stillwater Dam concrete test placement core program - average strength and
elastic properties summary - RCC ,.....Upper Stillwater Dam concrete test placement core program - compressive
strength summary - RCC"""""""""''''''''''''''''''''''''''''''''''''''''''''''''''''''''''''''''''''''''''Upper Stillwater Dam concrete test placement core program - tensile
strength summary - RCC"""''''''''''''''''''''''''''''''''''''''''''''''''''''''''''''''''''''''''''''''''''''''
Upper Stillwater Dam concrete test placement core program - construction joint tensilestrength summary - RCC
"""""''''''''''''''''''''''''''''''''''''''''''''''''''''''''''''''''''''''''''''''''''Upper Stillwater Dam concrete test placement core program - construction joint bondingsummary - RCC "....
Upper Stillwater Dam concrete test placement core program - shear and sliding frictionsummary by construction joint - RCC ,.....
Upper Stillwater Dam concrete test placement core program (horizontally drilled cores) -compressive strength summary - RCC.........................................................................
Upper Stillwater Dam concrete test placement core program (horizontally drilled cores) -tensile strength summary - RCC..................................................................................
Upper Stillwater Dam concrete test placement core program - compressivestrength summary - facing concrete............................................................................
Upper Stillwater Dam concrete test placement core program - tensile strength summary -facing concrete...........................................................................................................
Upper Stillwater Dam concrete test placement - average strength and elastic propertiessummary - field cylinder test program.........................................................................
4
5
6
789
101112131415
161718197.0212223
24
25
26
27
28
29
30
31
32
33
FIGURES
12
Laboratory mix program, compressive strength of mortar, RCC"'"''''''''''''''''''''''''''''''''''''Laboratory mix program, compressive strength development. RCC....................................
VI
Page
45
6
7
8
89
10101213142124
2525282934343939
41
42
44
45
47
48
48
49
49
50
51
913

Figure
CONTENTS - ContinuedPage
3456789
101112131415161718192021
222324252627282930313233343536
Laboratory mix program, elastic properties of concrete versus compressive strength, RCC.. 15Laboratory mix program, typical stress versus strain curves, RCC 16Laboratory mix program, tensile strength development, RCC 17Laboratory mix program, creep of mix L-1, RCC """""""",,,,,,,,,,,,,,,,,,,,,,,,,,,,,,,,,,,,,,,,,,,,,,, 18Laboratory mix program, creep of mix L-2, RCC , 19Laboratory mix program, creep of mix L-3, RCC , 20Laboratory mix program, direct shear test mix L-1, 28 days, RCC 22Laboratory mix program, direct shear test mix L-1, 90 days, RCC 22Laboratory mix program, direct shear test mix L-1, 365 days, RCC 22Laboratory mix program, direct shear test mix L-2, 28 days, RCC 22Laboratory mix program, direct shear test mix L-2, 90 days, RCC 23Laboratory mix program, direct shear test mix L-2, 180 days, RCC 23Laboratory mix program, direct shear test mix L-2, 365 days, RCC 23Laboratory mix program, direct shear test mix L-3, 28 days, RCC 23Laboratory mix program, direct shear test mix L-3, 90 days, RCC 24Laboratory mix program, direct shear test mix L-3, 180 days, RCC 24Laboratory mix program, direct shear test mix L-3, 365 days, RCC 24Laboratory mix program, adiabatic temperature rise, mixes L-1, L-2, and L-3, RCC 26Laboratory mix program, adiabatic temperature rise, mix L-3 with and
without set retarder, RCC 26Laboratory mix program, adiabatic temperature rise, mix L-5, RCC 27Laboratory mix program, adiabatic temperature rise, mix FE-1, RCC 28Laboratory mix program, cementitious materials content versus permeability, RCC 29Laboratory mix program, diffusivity mix L-1, RCC 30Laboratory mix program, diffusivity mix L-2, RCC """"""""",,,,,,,,,,,,,,,,,,,,,,,,,,,,,,,,,,,,,,,,,,, 31Laboratory mix program, diffusivity mix L-3, RCC 32Laboratory mix program, length change mix L-1, RCC 33Laboratory mix program, length change mix L-2, RCC 33Laboratory mix program, length change mix L-3, RCC
.""""""""""""""""""""""""""" 35Test placement length change mix T-1, RCC 35Test placement length change mix T-2, RCC 36Test placement length change mix T-3, RCC 37View of Upper Stillwater Dam, roller compacted concrete test placement 37Concrete test placement and drill hole locations 38Typical concrete cores extracted from Upper Stillwater Dam, RCC test placement 40
vii


INTRODUCTION
Upper Stillwater Dam will be the first concrete damconstructed by the Bureau of Reclamation utilizingthe RCC (roller compacted concrete) constructiontechnique. RCC is concrete with zero slump consist-ency, which is deposited in horizontal lifts and con-solidated in place by a smooth drum vibrating roller.This method of construction was first proposed inthe early 1970' s [1, 2, 3]* and was demonstratedsuccessfully in emergency spillway repairs at TarbelaDam, Pakistan [3], in the construction of ShimajigawaDam, Japan, and Willow Creek Dam, Oregon.
An extensive RCC mix design investigation was be-gun in 1980. This report summarizes the mix designprogram conducted in the laboratories of the Con-crete and Structural Branch at the E&R (Engineeringand Research) Center and discusses the field RCCtest placement constructed at the Upper Stillwaterdamsite in 1981.
DESIGN CONCEPTS -UPPER STILLWATER DAM
Upper Stillwater Dam will be a gravity dam containing1.4 million yd3 of RCC, located approximately 120miles southeast of Salt Lake City, Utah, in the UintaMountains at an elevation of 8000 feet. The dam willbe approximately 275 feet high with a 2,600-footcrest and a vertical upstream face; the downstreamface will have a 0.6: 1.0 slope. Storage capacity ofthe reservoir will be 30,000 acre-feet, and the damwill have a spillway capacity of 15,000 ft3/S.
Selecting the Type of Dam for Upper Stillwater
The Upper Stillwater site was first investigated as apotential damsite in the late 1940's. Since that time,the site has been considered for various types ofdams including an earth embankment. a concrete-faced rockfill, and three concrete dams - a straightconcrete gravity dam, a massive head buttress dam,and a straight RCC gravity dam. Feasibility studies,completed in late 1979, compared the rockfill withthe RCC alternative and showed the RCC dam to bethe lower cost alternative.
Foundation
Upper Stillwater damsite is located on Rock Creekwhich flows southward down the south flank of theUinta Mountains. Rock Creek and glacial action havecreated a wide, flat valley with steep abutments. Thedam will be founded on medium- to massive-beddedquartzose sandstone in the valley floor. Foundation.Numbers in brackets refer to entries in the Bibliography.
rock in both abutments consists of sandstone, ar-gillite, and siltstone. Surficial deposits covering thefoundation rock consist of alluvial fan, talus, and gla-cial deposits. These surficial deposits range in thick-ness from 10 to over 100 feet. Several steeplydipping narrow faults cross the foundation running ina north-south direction.
Foundation Treatment
Foundation preparation for placing the concrete damwill require removal of the 1,000,000 yd3 surficialdeposits and excavation of 300,000 yd3 of the sand-stone foundation. Consolidation grouting will be usedover much of the foundation to close numerous smalljoints and tighten up the foundation. Larger shearzones will be excavated and backfilled with dentaltreatment concrete.
A seepage cutoff curtain will be constructed the fulllength of the dam by grouting a line of holes fromthe foundation gallery. Foundation uplift pressureswill be relieved by a line of drainage holes drilleddownstream from the grout curtain. These drainageholes will also be drilled from the gallery.
Leveling concrete, which consists of internally con-solidated low slump concrete, will be placed be-tween the RCC and the foundation rock. Thisconcrete serves several functions, the most impor-tant of which is to provide bond between the RCCand the irregular rock foundation, thus controllingseepage and providing sliding stability. Leveling con-crete also serves to facilitate placement of the firstRCC lifts. In the lowest point of the foundation, re-ferred to as the trough, leveling concrete 15 feet thickwill be placed to provide a 100-foot minimum RCClift length parallel to the dam axis. In this way, placinglifts perpendicular to the dam axis will be avoidedwhich could contribute to seepage through the dam.On nearly level areas of the foundation, leveling con-crete will be placed in 50- by 50- by 2-foot-thickblocks. These blocks will initiate the horizontal RCClifts across the slope and will be repeated on eachsucceeding RCClift to eliminate any need for taperingor featheredging lifts.
Both the upstream and downstream faces will beconstructed by extruding concrete using a conven-tional slip-form paver and a side-hung mold. Eachpass of the paver will add 2 feet of facing. Followingthe placement of the facing elements, two succes-sive 1-foot lifts of RCCwill be placed as interior con-crete and against the facing. It is estimated that thisprocess will add approximately 2 feet of height tothe dam per day. RCC will be mixed by either con-ventional weigh batching or by a continuous mixingoperation. Transportation will be by truck or con-veyor, and in-place rolling of the 1-foot lifts will be

with conventional smooth drum vibratory rollers.This process will be repeated until the dam is com-pleted.
Extruded slip-formed faces provide a form systemand a durable concrete face to resist freeze-thaw ac-tion. They will not function as a water barrier. Asthermal adjustments take place within the dam,cracks will develop in the faces. Therefore, the RCCis designed to be impervious, and the faces will beallowed to crack.
Spillway
A spillway crest length of 600 feet and a design headof 3.5 feet were selected to take advantage of theRCC extruded facing construction method. The longcrest length eliminated the need for gates and re-quired only 3.5 feet of surcharge to pass the 15,000ft3/s peak of the inflow design flood. Steps added tothe extruded facing elements in the spillway chutedissipate 70 percent of the hydraulic energy and. re-quire a spillway basin only 30 feet long, or one-sixthof that originally proposed. Spillway chute steps alsoeliminated possible problems with cavitation com-mon with high-velocity flow.
Outlet Works
The outlet works will release water at a rate of 285ft3Is into Stillwater tunnel or up to 220 ft3Is into RockCreek. An intake tower in the reservoir is connectedto the control valves by a 6-foot-diameter conduitset in the foundation beneath the dam. The entiresystem is separated from the dam to minimize in-terference with placement of the RCC. Rock Creekdischarges will be released from a submerged 14-inch-diameter jet-flow valve discharging up to30 ft3/s into an enclosed compact stilling basin.
Dam
The original design of the dam featured a 15-foot topwidth and a 0.6: 1.0 downstream slope, minimizingexcavation and concrete volume. The top width wasincreased to 30 feet to facilitate construction accessof the upper portion; however, the downstreamslope was not changed. The dam was analyzed fornormalstatic and dynamic loads using current Bureaucriteria for conventional concrete gravity dams. In ad-dition, extensive analyses were conducted to modelthe construction problems unique to RCC construc-tion. A computer model was developed to computethe thermal gradients produced by heat generationof the RCC and ambient temperatures. These gra-dients compared well with the 1 year of temperaturedata obtained from the test section. Stresses withinthe dam were determined for the thermal gradientsfor various times up to 5 years. Extensive two- and
three-dimensional finite element studies were usedto determine stresses.
CONCEPTS OF RCC MIX DESIGN
RCC mixes have been developed using three mix de-sign philosophies, largely determined by specificconditions existing at each damsite. These mix de-sign concepts include:
.The use of "as-dug" aggregate with minimal tono processing, blended with cement, such asthat used at Tarbela Dam [5]
.Lean concrete (a dry, lean concrete with low ce-ment content), such as that used at ShimajigawaDam in Japan and Willow Creek in Oregon
.High fly ash content concrete, such as that pro-posed for Upper Stillwater Dam in Utah and theMilton Brook Dam in the United Kingdom.
For the above structures, the MSA (maximum-sizedaggregate) ranged from 3~-inch to 9 inches, and thecementitious material content ranged from 88pounds of cement up to 420 pounds of cement andfly ash. Fly-ash contents ranged from 0 to 75 percentof cementitious materials by volume.
Processing of aggregates used in RCC has rangedfrom minimal or no processing to a fully processedASTM graded aggregate. The excavated materialused at Tarbella, for instance, was a pit-run skip-graded material mixed by rock ladders. Aggregatesfor Willow Creek Dam were reasonably well-gradedmaterial with minus No. 200 sieve-size material vary-ing from 4 to 10 percent of the total materials. Pro-posed coarse aggregate for Upper Stillwater Dam willbe reasonably well-graded from 2-inch to No.4 ma-terial.
In the mix design for an RCC dam, several require-ments must be taken into consideration: (1) durabilityof the material, (2) compressive and tensile strengthrequirementsof the concrete, and (3) required work-ability. Also, both foundation and seismic safety con-siderations must be satisfied. Requirements for RCCin Upper Stillwater Dam include the following:
1. Full consolidation of the RCC must be main-tained to prevent seepage.
2. Bond between the lifts must be achieved.
3. Concrete must be able to withstand early andlong-term thermal movement without jeopardizingthe structural stability of the dam.
2

4. Concrete must have good workability so max-imum density can be achieved with vibratory roll-ers.
5. Concrete must not segregate.
6. The design of the dam must accommodate thepoor freeze-thaw durability of RCC by either pro-viding protective air-entrained facing concrete orby overbuilding dam faces to provide sacrificialconcrete in anticipation of raveling due to freeze-thaw damage.
RCCis much the same as conventional concrete, anddesign of RCC dams must be approached the sameas any other concrete dam. The properties requiredfor a particular structure govern the mix design: forinstance, the purpose of the reservoir (storage, floodcontrol, or both) or the existence of freeze-thaw con-ditions.
A two-phase program was developed for the eval-uation of materials for Upper Stillwater Dam usingRCC:(1) a complete mix design study was performedin the laboratory, and (2) a test placement was madeusing the concepts of construction with RCC andlaser guided slip-form pavers. The laboratory mixprogram evaluated three differently proportionedmixes. The strength development properties inves-tigated were compressive, direct tensile, and shearstrength; other properties included thermal expan-sion, adiabatic temperature rise, diffusivity, creep,drying shrinkage, and permeability.
Upon completion of the test placement, cores wereextracted at 28, 90, 180, and 360 days. The testdata from the cores were compared to specimenscast in the laboratory mix program.
CONCLUSIONS
1. Concrete from RCC mixes L-1, L-2, and L-3 allmet a compressive strength requirement of 3,000Ib/in2 and tensile strength requirement of 180 Ib/in2at 1year's age.
2. The use of pit-run materials with a high silt con-tent in the RCCtest placement resulted in a reductionin strength and increase in drying shrinkage due to aprobable increase in water content. Though accept-able concrete properties can be obtained using par-tial replacement with pit-run materials, the variationsin silt content of available materials preclude their usefor Upper Stillwater Dam.
3. Mix L-3 meets all the requirements set forth inthe design criteria with the fewest problems in quality
control. Mix L-3 also showed greater tensile strengthpotential than either mix L-1 or L-2, whose strengthsapparently were reduced by clumps of silt and clayin the pit-run sand.
4. Creep and thermal property results were as ex-pected, generally in the range of ordinary concreteusing a quartzose sandstone for coarse aggregate.
5. Temperature rise is lower than for ordinary con-crete and is due to the high fly-ash content and lowinitial placing temperature of approximately50T
6. Test results of bonding of the joints of the testsection were not as good as anticipated; however,bonding of the horizontal joints can be obtained bycontrol of lift thickness to :t 1 inch, adequate com-paction, and adjustment of the mortar content forvariation in voids of the coarse aggregate. Testingfor the voids ratio in accordance with ASTM Des-ignation: C-29 should be a part of the quality controlprogram. Finally, horizontal joints must be clean andmaintained in a moist condition.
7. The use of slip-form pavers using laser control ofboth horizontal and vertical alinement for construct-ing the upstream and downstream facing elementsof the dam is acceptable.
8. The low modulus in the RCC mixes may be at-tributed to the high mortar content of the 1Y2-inchMSA as compared to a 4-inch MSA mass concrete,the low modulus of the coarse aggregates influencedby either the bedding planes of the aggregate (quart-zose sandstone), or microcracking at the interface ofthe mortar and coarse aggregate.
9. Additional research is needed in several areas:
a. Methods to entrain air to increase the durabilityof RCC under freeze-thaw conditions
b. Methods of accelerated strength testing forquality control of high fly-ash concretes
c. Methods to detect voids at horizontal lift linesin construction
d. Investigation of factors influencing tempera-ture rise of high fly-ash concretes, in particular atearly ages (1 to 3 days)
e. Factors influencing joint bond potential Includ-ing time, temperature, and paste content
3

12 356 5221 3911 40 2
2.54 2.541.67 1.67
38.35 38.35
MATERIALS INVESTIGATIONS
The materials investigations were based on two dif-fering philosophies for the mix design of RCC:(1) unprocessed, "pit-run" materials from the foun-dation excavation, and (2) processed graded mate-rials produced the same as for conventional concrete.Three mix designs were developed, the first con-taining 100 percent unprocessed materials, the sec-ond, a combination of both processed and pit-runsand, and the third, incorporating 100 percent clean,graded sand.
The coarse aggregate for the laboratory testing pro-gram was a crushed sandstone obtained from talusslopes at the jobsite. The sandstone is marginal inquality with specific gravity ranging from 2.49 to2.54, absorption of 1.7 percent, and LA abrasionloss (at 500 revolutions) of 65.1 percent. Pertinentdata on the sandstone coarse aggregate are given intable 1.
Three sand sources were used for the laboratorytesting program; pit-run sand from the damsite,crusher fines generated from the aggregate crushingoperation, and clean processed sand obtained froma local Denver aggregate source. Pertinent data onthese sands are given in table 2.
For the test placement, the coarse aggregate wasobtained by crushing talus material at the jobsite. Theproperties of the coarse aggregate used for RCCandfacing concrete are given in table 3. This coarse ag-gregate is very similar in physical properties to theaggregate used in the laboratory mix program, withthe exception of the grading. A high percentage ofaggregate in the 3/a-to 3A-inch size caused a 3 to 4
Table 1. - Laboratory mix program - coarse aggregate physicalproperties - RCC.
Sieve designation 1Coarse aggregate grading
(individual percentretained)
Mix L-1 Mix L-2, L-3
1Y2 in% in3fs inNO.4Pan
Specific gravityAbsorptionVoids content
1 U.S.A. Alternate Sieve Designations ASTM: E-ll
percent increase in the voids ratio content of the ag-gregate. This led to an increase in segregation anda decrease in the compactability of the RCC, partic-ularly in mixes T-2 and T-3. The voids content ofaggregate used in RCC should be monitored closelyto ensure that there is sufficient mortar in the mix.
Three sand sources were also used in the test place-ment mixes. Pit-run sand was similar in quality to thesand used in the laboratory test program. Talus sandwas obtained from the aggregate crushing operation;however, the processing did not remove the consid-erable amount of overburden which led to contami-nation with silty fines. The clean, graded sand wasobtained from a commercial source near Salt LakeCity. Pertinent data on these sands are given in table4.
Because of variations in the quality of the availablepit-run sand, a clean, graded sand was required. Thisled to the use of higher fly-ash contents in the mixdesign to supply the necessary fines for adequateconsolidation and reduction in segregation of theRCC.
Laboratory standard cement and fly ash were usedfor the three laboratory mix designs. Physical andchemical properties of cement and fly ash are givenin table 5. For the test placement, type II, low-alkalicement was obtained from a commercial producer.Class F pozzolan (fly ash) was supplied from a pow-erplant located in western Wyoming. Physical andchemical properties of cement and fly ash are givenin table 6.
PRELIMINARY MIX DESIGNAND MORTAR STUDIES
The initial RCC mix design trials were begun in April1980. Preliminary mix design investigations wereperformed in accordance with procedures outlined inACI (American Concrete Institute) Committee 207report on RCC. These mix designs generally provedunacceptable because of the poor workability of themixes.
In an effort to reduce the time for preliminary tests,a series of mortar tests was conducted to establishbasic strength and workability parameters of mortar.After developing an "optimal mortar" design, thepercentage of coarse aggregate for RCCdesigns wasoptimized for the most workable mix.
Six series of mortar mixes were tested to investigatethe following mix design parameters:
. Ft ratio (fly ash:cement)
4

Fine aggregate grading (individual percent retained)
Sieve Individual grading Combined grading
desig- PRS' TS2 CC3 Mix L-1 Mix L-2 Mix L-3nation 40 percent PRS 25 percent PRS 100 percent CC
No. 60 percent TS 75 percent CC
4 3.0 9.0 2.0 6.6 2.3 2.08 6.7 12.0 2.0 9.9 3.2 2.0
16 12.3 6.0 12.0 8.5 12.1 12.030 14.3 10.0 31.0 11.7 26.8 31.050 18.5 35.0 34.0 28.4 30.0 34.0
100 17.3 23.0 14.0 20.7 14.8 14.0200 6.8 3.8 5.0 5.0 5.5 5.0
-200 21.1 1.2 - 9.2 5.3 -
Specificgravity 2.40 2.62 2.65
Absorption 5.78 0.81 0.84
Voidscontent 35.97 35.25 32.69
Table 2. - Laboratory mix program - fine aggregate physical properties - RCC.
1 PRS - Pit-run sand - Upper Stillwater damsite.2 TS - Crushed talus sand - Upper Stillwater damsite.3 CC - Clear Creek sand - Denver laboratory standard.
w.C + FA
ratio (water:cement plus fly ash)
C + FA. sand ratio (cement plus fly ash:sand)
. Sand content (various blends of processedsand, pit-run sand, and crusher fines)
Flow of mortar and compressive strength testing of2-inch cubes were performed in accordance withASTM: C 109-80 (Compressive Strength of Hy-draulic Cement Mortars). The results of these testsare shown in table 7 and on figure 1. Five trial mixeswere made with a class F fly ash, and one trial wasconducted using a class C fly ash. The concept ofthese mortar mixes was to develop a stiff mortar (ascompared to conventional mortar) with the requiredstrength parameters, while utilizing as high a per-centage of fly ash as possible in an effort to minimizeheat generation.
Mortar design mix No. 52, which used a pit-run sandcontent of 40 percent plus 60 percent crusher finesand fly ash to cement ratio of 60:40, was selectedfor development of laboratory mix No. L-1 . Followingthe construction of the test placement, additionalmortar tests were conducted using a clean proc-
essed sand (mixes No. 53 to 58) which was used inlaboratory mix No. L-3.
Upon completing the mortar studies, a series of trialmixes was conducted to evaluate the strength andworkability of RCC mixes at varying percentages ofNo.4 to 1¥2-inch MSA. The 1¥2-inch MSA was anearly decision based upon the problems of segre-gation as reported by others and has since beenchanged to 2-inch MSA. In addition, test proceduresfor mixing and testing RCG and methods of castingtest specimens were evaluated. The surchargeweight for the Vebe test was increased to 5\'pounds. Test cylinders were cast on the Vebe tablE.in three lifts with a 20-pound surcharge. Based onworkability, compression, and tension tests, acoarse aggregate content of 55 percent (by volume)was established as the optimal aggregate percent-age. This mix design was then selected for completephysical properties testing as mix L-1.
FINAL MIX DESIGN STUDIES
Development of Laboratory Mix Designs
Three mix designs were developed for completephysical properties testing in the laboratory. Tests
5

Sieve Mix T-1 Mix T-2 Mix T-3designation (Lifts 1-3) (Lifts 4-7) (Lifts 8-11)
(individualpercent retained)
13;4 inch 0.0 0.0 0.01 Y2 inch 2.3 1.5 1.23;4 inch 49.9 40.1 41.43/8 inch 33.9 43.5 43.8No.4 9.7 8.9 11.8Pan 3.7 6.0 1.8
Table 3. - Upper Stillwater Dam concrete test placement -coarse aggregate physical properties - individual grading(percent retained).
RCC
Specific gravityAbsorption
2.492.8 percent
Facing concrete
Sievedesignation
Mix T-4 and T-5
(individual percent retained)
1 inchYz inchNO.4No.8Pan
0.063.733.1
1.91.3
Specific gravityAbsorption
2.492.8
and test ages are shown in table 8. Though therewere some adjustments in these mix designs due tovariations in aggregate gradations and workability re-quirements, the primary mix design parameters wereheld constant. The three mix designs used in thelaboratory studies are shown in table 9.
As discussed in the section "Preliminary Mix Designand Mortar Studies," mix L-l was developed from aseries of mortar studies conducted earlier in the test-ing program. The state-of-the-art with respect toRCC mix design suggested that pit-run or "as-dug"materials could be utilized in the RCC mixes. MixL-1 incorporated the use of pit-run sand, combinedwith "crusher fines" generated by the processing ofcoarse aggregate. The quantity of coarse aggregatewas determined by substituting different percent-ages of aggregate with mortar until a workable mixwas found.
MixL-2was developed to reduce the total heat gen-erated by the RCC.The adiabatic temperature rise ofmix design L-l was considered too high for thermaldesign considerations. In this mix design, approxi-mately 60 pounds of cement were replaced with flyash, which increased the FAC ratio to 75:25. Thisreduced the total amount of heat evolved and therate of heat evolution. Because of variations in thequality of pit-run sand used at the dam site, a changein sand source was required. Mix L-2 incorporated75 percent clean, processed sand and only 25 per-cent unprocessed, pit-run sand. The 25 percent pit-run sand provided the fines required for optimal com-paction.
Mix L-3 is based upon the mix design proceduresdeveloped during the Milton Brook Dam studies inthe United Kingdom. This mix design was basedupon the use of 100 percent clean sand with the finesrequired for optimal compaction supplied by the ad-dition of fly ash. This mix design was deemed nec-essary because of the wide variation in quality of pit-run sand in mixes used at the Upper Stillwater Damsite. Though it is possible to design an RCCmix withpit-run materials, the variation in quality as well asthe percentage of fines in this material would makequality control extremely difficult.
Two additional mix designs were investigated to alimited extent in the laboratory. Mixes L-4 and L-5were designed with a higher paste content to provideadditional joint bonding capabilities if the need arisesduring a construction delay or shutdown. These mixdesigns are shown in table 9.
Mixing and Testing Procedures
The RCCwas mixed in the laboratory in a 9-ft3 drummixer. For mix L-l, aggregates and 75 percent of thewater were added and mixed for 1 minute. This wasnecessary to break up lumps of pit-run sand. Follow-ing this mixing, cementitious materials and the re-maining water were added and mixed for 4 additionalminutes. Mixing procedures were altered for mixesL-2 and L-3 with the addition of all materials andenough water to bring the workability to a range of35 to 45 seconds as determined by the Vebe test.
Fresh Concrete
Workability and density of the fresh concrete weredetermined with the Vebe vibrating table apparatus.Tests were conducted to determine workability, ex-pressed as the time required to consolidate 28pounds of RCCin a cylinder clamped to the vibratingtable. Tests were performed with and without a 50-pound surcharge weight. The Vebe time was ex-pressed as the time required for paste to migrate
6

Pit-run sand Talus sand Clean sandSieve
Fine Coarse Average Fine Coarse Average Fine Coarse AveragedesignationNo.
(individual percent retained)
4 0.0 22.7 9.6 9.0 37.2 19.5 4.6 5.0 4.88 4.1 5.0 6.0 7.2 17.3 10.0 9.7 10.8 10.2
16 14.1 13.0 16.2 2.9 7.7 6.8 8.0 10.8 9.430 15.0 24.3 18.7 16.3 3.8 7.1 17.5 15.7 16.650 15.8 18.6 17.2 7.1 4.4 15.9 31.2 31.4 31.3
100 16.2 11.0 16.1 25.2 22.0 25.2 21.9 22.1 22.0200 6.4 2.9 5.3 9.6 3.7 6.3 5.2 2.3 3.8
-200 28.4 2.5 10.9 22.7 3.9 9.2 1.9 1.9 1.9
FM 1.70 3.34 2.54 1.90 3.83 2.73 2.45 2.59 2.52
Specificgravity - - 2.44 - - 2.63 - - 2.58
Absorption - - 5.70 - - 2.30 - - 0.80
Mix 1 Mix 2 Mix 3Sieve 40 percent PRS1 25 percent TS 100 percent CS
designation 60 percent TS2 75 percent CS3No.
(individual percent retained)
4 15.5 8.5 4.88 8.4 10.2 10.2
16 10.6 8.8 9.430 11.7 14.2 16.6
16.4 27.4 31.3100 21.6 22.8 22.0200 5.9 4.4 3.8
-100 15.8 8.1 .c5.7. .'. ~-., -.- .
-200 9.9 3.7 \ 1~QAfr'fc.-'~' 'd
Table 4. - Upper Stillwater Dam concrete test placement - fine aggregate physical properties - individual grading (percent retained).
Combined grading
1 PRS - Pitrun sand2 TS - Talus sand3 CS - Clean sand
f
t,;
I
i ,i1 ~I
~L ' .L .2i)[l1 I
ij
,. ,
I fI L.It.. ..;~:;T~tiOO--.J
!
surcharge weight. Becau~e tb~m!fttfb:tit~~ ~~_Jestimation as to when the paste fills all the voidsunder the surcharge or around the rim of the cylinder,the variation in Vebe time is relatively high (standarddeviation of 5 to 20 seconds). The presence of smallrock pockets within the sample further complicatesthe test. Research needs to be performed on test
completely around the surcharge or around the pe-riphery of the cylinder (similar to the Cannon test).[3 (pg. 17-18)] The drier mix L-1 had a Vebe time ofapproximately 50 to 60 seconds with the surchargeweight. The wetter mixes L-2 and L-3 had Vebe timesof approximately 25 to 35 seconds with the sur-charge weight and 35 to 45 seconds without the
7

1.3 Silica Si02 21.6392 Alumina AI203 4.83.16 Iron Fe203 3.9
Calcium CaO 62.32,340 Magnesium MgO 3.03,700 Total sulfates S03 2.73:30 Sodium Na20 .35:25 Potassium K20 .4
Insoluble residue .8
0.8 Silica Si02 22.1420 Alumina AI203 3.73.20 Iron Fe203 3.0
Calcium CaO 63.43,660 Magnesium MgO 2.64,710 Total sulfates S03 2.93:20 Sodium Na2O .35:05 Potassium K20 .4
Insoluble residue .4
Table 5. - Laboratory mix program - physical and chemical properties of cement and pozzolan - RCC.
Physical properties PercentChemical analysis
Type /I, LA cement - M-7120
Loss on ignition (percent)Specific surface (m2jkg)Specific gravityCompressive strength:
3 days (lbjin2)7 days (lbjin2)
Initial set (h:min)Final set (h:min)
Class F - POllolan - M-6498
Loss on ignition (percent)Fineness (percent retained
on No. 325 sieve)Specific gravityAutoclave expansion (percent)Water requirement (percent)Compressive strength:
28 days with cement (percent)7 -day lime pOlzolan (lbjin2)
2.0
2.44-0.004
96
82960
SilicaAluminaIronMagnesiumTotal sulfatesMoisture content
Si02AI203Fe203MgOS03
46.119.018.6
1.31.6
.03
Table 6. - Upper Stillwater Dam concrete test placement - physical and chemical properties of cement and pozzolan.
Physical properties PercentChemical analysis
Type /I, LA cement
Loss on ignition (percent)Specific surface (m2jkg)Specific gravityCompressive strength:
3 days (lbjin2)7 days (lbjin2)
Initial set (h:min)Final set (h:min)
Class F - POllolan
Loss on ignition (percent)Fineness (percent retained
on No. 325 sieve)Specific gravityAutoclave expansion (percent)Water requirement (percent)Compressive strength:
28 days with cement (percent)7-day lime pOllolan (lbjin2)
0.3252.34-2.41-0.0291
931,250
SilicaAluminaIronMagnesiumTotal sulfatesMoisture content
Si02
}AI203Fe203MgO
S03
84.0
2.9.6.0
8

Cementj Cement Fly ash Cement- Sand Flow, Compressive strength, Ibjin2Mix pozzolan weight, weight, W pozzolanj weight, mm- 7- 28- 90- 180- 365-ratio g g C+P sand ratio g
day day day day day
51 40:60 289 335 0.47 1:275 1677 60 1218 2010 314852 40:60 289 335 .47 1:275 1687 82 1276 2118 330753 30:70 150* 259 .47 1:275 1186 105 1059 1982 3191 4371 561554 30:70 150* 259 .43 1:275 1186 84 1395 2565 3977 4617 621955 25:75 125* 278 .47 1:275 1168 129 921 1666 2881 3694 522256 25:75 125* 278 .43 1:275 1168 113 1100 1975 3142 4069 546857 20:80 100* 298 .47 1:275 1153 128 586 1145 2095 3134 385158 20:80 100* 298 .43 1:275 1153 112 767 1314 2530 3394 4442
1--- --- - -00 - .'-- ..'
.... ...."~Ij31 ~- .....00 . .0.._..0
--_ ...D~"".""""
00~ljlj~..........
~,~,...' -'." 0 _.-,~,_. -'-
"---.. -,-'\1j1).-'- -"-.I00 '-'~ ...0.. ..c:r-~-"";'
~,0' !--,-' >-' FLY AS H CONTENT"
MIX NO.
W ("to BY VOLUME)
...IY...-,-' 52 60
00
g. ""'" 53 70
0" "",-"55 75
~......... 57 80
w/c= 0.4700
II? /:(f
.j'
0 I
Table7. - Laboratorymixprogram- mix design summaries - mortar mixes - RCC.
.Clear Creek sand, 112batches
Note: Mix 51 made with a blend of 60 percent pit-run sand and 40 percent crushed talus sand.- Mix 52 made with a blend of 40 percent pit-run sand and 60 percent crushed talus sand.
The density of fresh concrete was determined usingthe weight of the vibrated sample and its calculatedvolume. The volume of the sample vibrated was de-termined by filling the Vebe cylinder above the sam-ple with water and subtracting the volume of t~ewater from the known volume of the cylinder. Whenthe surcharge weight was used with the Vebe test,
the density of fresh concrete was determined im-mediately after completion of the test. When theVebe test was used without the surcharge, the sam-ple was vibrated following the initial test up to a totaltime of 2 minutes prior to determining the density.A summary of the properties of fresh concrete isshown in table 10.
methods for RCC to reduce the visual error and sub-jectivity of this test.
Laboratory test specimens (6 by 12 inches) werecast on the Vebe table. Steel cylinder molds were
7000
60
07 28 90 180
T I ME (days)
365
NC
".0 50
J:I-~Z 40Wa:I-en
~ 30
enCJ)wg: 20::;;0u
10
Figure 1. - Laboratory mix program, compressive strength of mortar, RGG.
9
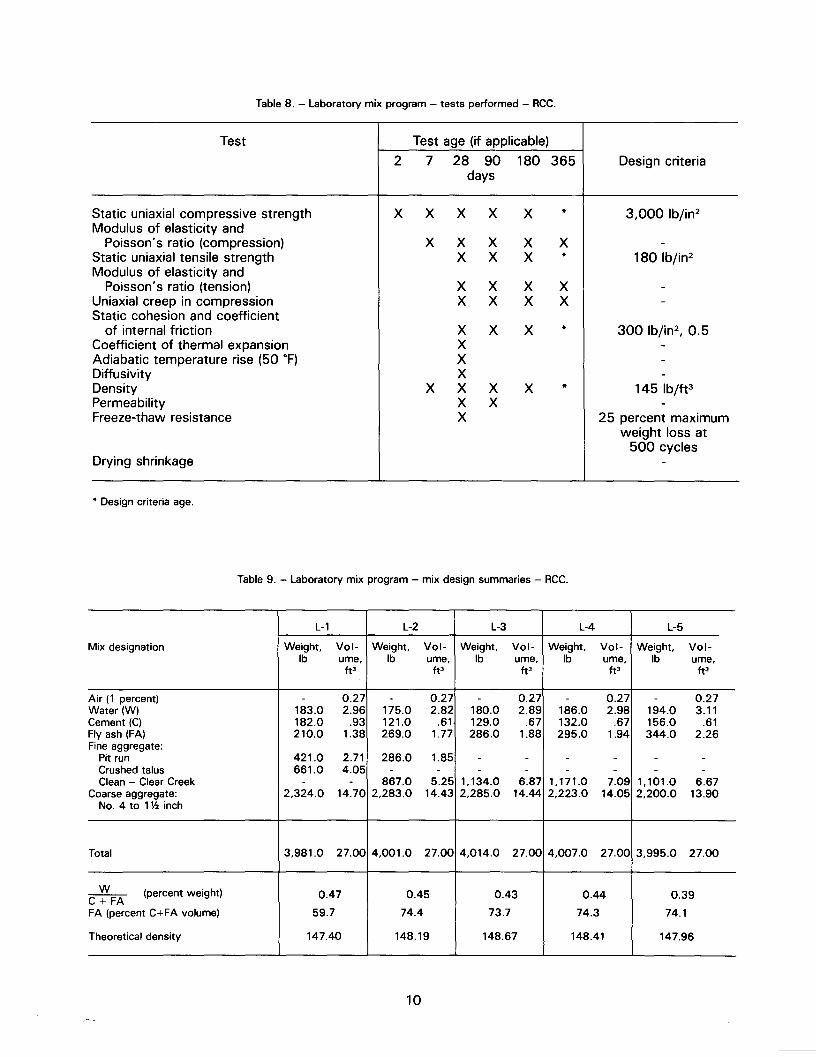
Test Test age (if applicable)2 7 28 90 180 365 Design criteria
days
Static uniaxial compressive strength X X X X X * 3,0001bjin2Modulus of elasticity and
Poisson's ratio (compression) X X X X X -Static uniaxial tensile strength X X X * 180 Ibjin2Modulus of elasticity and
Poisson's ratio (tension) X X X X -Uniaxial creep in compression X X X X -Static cohesion and coefficient
of internal friction X X X * 300 Ibjin2, 0.5Coefficient of thermal expansion X -Adiabatic temperature rise (50 OF) X -Diffusivity X -Density X X X X * 145 Ibjft3Permeability X X -Freeze-thaw resistance X 25 percent maximum
weight loss at500 cycles
Drying shrinkage -
L-1 L-2 L-3 L-4 L-5
Mix designation Weight, Vol- Weight, Vol- Weight, Vol- Weight, Vol- Weight, Vol-Ib ume, Ib ume, Ib ume, Ib ume, Ib ume,
ft3 ft3 ft3 ft3 ft3
Air (1 percent) - 0.27 - 0.27 - 0.27 - 0.27 - 0.27Water (W) 183.0 2.96 175.0 2.82 180.0 2.89 186.0 2.98 194.0 3.11Cement (C) 182.0 .93 121.0 .61 129.0 .67 132.0 .67 156.0 .61Fly ash (FA) 210.0 1.38 269.0 1.77 286.0 1.88 295.0 1.94 344.0 2.26Fine aggregate:
Pit run 421.0 2.71 286.0 1.85 - - - - - -Crushed talus 661.0 4.05 - - - - - - - -Clean - Clear Creek - - 867.0 5.25 1,134.0 6.87 1,171.0 7.09 1,101.0 6.67
Coarse aggregate: 2,324.0 14.70 2,283.0 14.43 2,285.0 14.44 2,223.0 14.05 2,200.0 13.90No.4 to 1Y2inch
Total 3,981.0 27.00 4,001.0 27.00 4,014.0 27.00 4,007.0 27.00 3,995.0 27.00
W (percent weight) 0.47 0.45 0.43 0.44 0.39C + FAFA (percent C+FA volume) 59.7 74.4 73.7 74.3 74.1
Theoretical density 147.40 148.19 148.67 148.41 147.96
Table 8. - Laboratory mix program - tests performed - RCC.
.Design criteria age.
Table 9. - Laboratory mix program - mix design summaries - RCC.
10

rigidly clamped to the vibrating table. Test cylinderswere cast in three equal lifts under a 20-pound sur-charge weight. Paste filled around the edge of thesurcharge before the next lift was placed. Jointedtest specimens were fabricated by placing and com-pacting one-half of the cylinder, and placing the tophalf following a specified cure (generally 24 hours).,After the test program, a new method of casting 6-by 12-inch cylinders was developed. A standard 6-by 12-inch plastic mold was set inside the steel cyl-inder and clamped tightly, but without deforming theplastic mold. The RCC was then vibrated in place asbefore, and the entire specimen in the mold was re-moved. This method is advantageous over castingin the steel molds because of the time savings in-volved.
Hardened Concrete
A summary of tests performed on RCC is shown intable 8. Unless otherwise noted, tests were per-formed on specimens fog-cured at 73 of.
Compressive strength testing was performed on 6-by 12-inch cylinders in accordance with ASTM Des-ignation: C 39-80 (Compressive Strength of Cylin-drical Concrete Specimens). Modulus of elasticityand Poisson's ratio in compression were initially de-termined with an extensometer-compressometerframe at early ages (28 days or less). Automation oftesting apparatus made it possible to test stress ver-sus strain to failure with epoxied strain gages. Duringthe process of epoxying strain gages, test speci-mens were kept moist by wrapping them in plastic.The modulus of elasticity was determined in a stressrange between 100 and 1,000 Ibjin2 unless exces-sive strain was experienced (generally early agetests), in which case the upper value was reduced to600 Ibjin2. Direct tensile strength testing was per-formed on 6- by 12-inch cylinders epoxied to steelend plates. Tests were performed on both jointedand unjointed specimens. Only one failure was at-tributed to failure across the joint; thus, joint effi-ciency would be considered close to 100 percent. Insome cases, bond failure occurred in the epoxy atthe end plate. These failures, when not occurring inthe test specimen, are not included in average tensilestrength values reported herein. The modulus of elas-ticity and Poisson's ratio in tension were computedfrom stress versus strain readings recorded fromepoxied strain gages. These values were calculatedover a stress range from 50 to 150 Ibjin2 unlessexcessive strain was recorded, in which case the up-per stress limit was reduced to 100 Ibjin2.
Creep parameters were determined from tests ofsealed concrete specimens under constant com-pressive load. Test specimens were cast in ~oppersleeves, with gage point inserts embedded in the
concrete. Specimens were fog-cured, lapped plane,and sealed prior to testing. Two specimens wereloaded at each test age, with one companion spec-imen retained without load under the same test con-ditions. Axial strain measurements were taken atthird points around the circumference of the cylindersprior to loading, immediately after loading, and atregular intervals thereafter. Measurements weretaken with a fulcrum plate strain gage. The appliedload was less than 20 percent of the ultimatestrength of the concrete at each test age. The mag-nitudes of the creep parameters 1j E and F(K) arebased upon the empirical logarithmic function
e: = 1jE + F(K)ln(t+1)
where:
e: = elastic plus creep strain per Ibjin2E = modulus of elasticity at loading age
K, Ibjin2F(K) = creep parameter, a constant for any
particular loading age KIn(t+ 1) = natural logarithm of the time after
loading plus one.
These values can be determined from a semiloga-rithmic plot of time plus one as the abscissa andelastic plus creep strain as the ordinate on the linearscale. The intersection of this line with the coordinate(t+ 1) = 1 gives the value of 1j E, and the F(K) is de-rived from the slope of the straight line curve.
Static cohesion and coefficient of internal frictionwere determined from shear break-bond and slidingfriction tests of jointed concrete specimens. The in-tact specimen was subjected to a biaxial stress untilshear failure occurred across the horizontal joint. Thefailure plane across the joint is predetermined bycasting the hardened concrete specimen into sepa-rate holding rings approximately one-fourth of an inchapart. Normal loads are applied to the specimen atstresses varying from 50 to 100 Ibjin2, and the shearload is applied to the lower ring until failure occursacross the joint. Following the break-bond test, slid-ing friction tests are performed on the open joint atnormal stresses varying from 50 to 300 Ibjin2. Cohe-sion and coefficient of internal friction are determinedby plotting the normal and shear stresses for indi-vidual break-bond tests. Similar values are deter-mined for the results of sliding friction tests.
Diffusivity of RCC was determin~d from time-tem-perature readings of 6- by 12-inch specimensbrought to a constant temperature and then im-mersed into a high-temperature water bath. The dif-ference between the interior and exterior surface ofthe test specimen is plotted on a logarithmic scaleversus time on a linear scale, and the diffusivity is
11

Vebe test
With surcharge Without surcharge
Mix No. Time, Unit weight, No. of Time, Unit weight, No. ofs Ibjh3 tests s Ibjh3 tests
L-1 61.0 147.1 22 - - -*0 18.8 .6 - - -
**CV(percent) 30.6 .4 - - -
L-2 33.0 146.6 13 36.2 147.1 90 5.3 .7 11.1 1.4CV (percent) 16.1 .5 30.5 .9
L-3 32.4 147.6 15 40.7 147.7 150 5.9 .7 13.9 .6CV (percent) 18.2 .5 34.3 .4
Table 10.- Laboratory mix program - properties of fresh concrete - RCC.
00 - Standard deviation
00 CV - Coefficient of variation
computed when the rate of change of temperatureis constant with time. The interior temper.cHure wasdetermined with a thermocouple embedded in thecenter of the cylinder.
The temperature rise of mass concrete was deter-mined over a 28-day period in an adiabatic calorim-eter room on 650-pound specimens sealed in a 21.5-by 21.5-inch metal container in accordance withUSBR standard laboratory procedures. Throughoutthe test, the room temperature was maintained atthe same temperature of the concrete to ensure theadiabatic condition. The initial temperature of theconcrete was determined immediately aher mixing.Generally, a 2 to 4 of increase in temperature wasrecorded between mixing and final sealing of the testcontainer due to initialhydration and energy impartedto the concrete during consolidation. The initial plac-ing temperature ranged from 45 to 58 of.
Coefficient of thermal expansion of hardened con-crete was determined by direct measurement of aseries of prisms over a temperature range from 35to 90 OF.Test specimens were saw cut from cylindersinto 2- by 2- by 4-inch lengths. The cumulative lengthchange of three prisms was recorded to avoid theerror incorporated with the small measurements.Tests were conducted in the saturated moisture con-dition for all mixes and in the oven-dry and 75 percentmoisture condition for mix L-1. Because the localDenver area sand was used for mixes L-2 and L-3,the values are lower than mix L-1 and lower than
what would be expected for the dam. This was con-firmed by tests of RCC when project sand was usedin mix L-3.
The density of hardened concrete in the saturated,surface-dry moisture condition was determined fromits weight and displaced volume when immersed inwater.
Permeability of hardened concrete was determinedfrom samples of RCCsubjected to a hydrostatic pres-sure of 400 Ibjin2. The rate of flow through the spec-imen was measured over a 1-month period.
Freeze-thaw resistance was determined on 3- by 6-inch cylinders of RCC wet-screened to ~-inch MSA.Following a 28-day fog cure, samples were subjectedto alternating cycles of freezing and thawing until a25-percent weight loss was recorded.
Drying shrinkage was determined from length changemeasurements of RCC fog cured specimens whichwere then placed in laboratory air maintained at73 OFand 50 percent humidity.
RESULTS OF LABORATORYMIX DESIGNS
Compressive Strength
The results of compressive strength are given in table11. As shown on figure 2, the strength and rate of
12

Mix Age Compressive Modulus of Poisson's Tensile strength, Modulus of Poisson'sNo.1 days strength, elasticity, ratio, elasticity, ratio,
Ib/in2 No. ofIb/in2 x 106 in/in Ib/in2 No. of
Ib/in2 x 106 in/in
tests tests
L-1 2 520 3 - - - - - -L-1 7 1,360 25 - - - - - -L-1 28 2,130 26 1.03 0.13 110 5 - -L-1 90 3,510 8 1.32 .14 150 5 - -L-1 180 4,720 3 1.58 .15 - - - I -L-1 365 5,220 7 1.71 .17 205 5 1.10 0.13
L-2 2 220 3 - - - - - -L-2 7 770 10 - - 50 4 - -L-2 28 1,220 14 .82 .13 80 4 - -L-2 90 2,150 18 - - 130 5 - -L-2 180 3,240 6 1.26 .17 135 5 1.28 .08L-2 365 4,780 6 1.59 .20 200 3 1.43 .14
L-3 2 350 3 - - - - - -L-3 7 1,110 8 - - 55 4 - -L-3 28 1,620 15 .92 .13 110 4 - -L-3 228 2,030 3 1.49 .13 - - - -L-3 90 2,770 17 - - 130 5 - -L-3 180 4,025 4 1.69 .17 185 3 1.19 .13L-3 365 4,960 6 1.76 .18 220 5 1.60 .19
I
I. I
MIX L~=-"M.!.:0:.l.. -- -_7 .A
---- oIJ" -- M\~V~ -- 1----- -- -- --- - I~- --- i.-- -/ - -
V --- --- !---............",. 0--- i/' --- ---/" ~~---
/ -.,/'/-JY""-
...--
(;'" -r/ _ ...- I
~".4J1l""
<1"I
I 251 50 75 I 100 125 150 175 200 225 250 275 300 325 350
Table 11. - Laboratory mix program - average strength and elastic properties summary - RCC.
, All mixes using a set-retarding WRA.2 Usinga nonset-retardingWRAand differentsand source.
7000
1000
6000
..c:"-..0 5000
:rl-e>Z 4000wa:I-en
w 3000>enenw
~ 2000::!;0u
002 7 28 90 180
TIM E (days)365
Figure 2. - Laboratory mix program, compressive strength development, RCC.
13

-
Refer to creep curves 1
Mix Age at Compressive Modulus of 1jE, Modulus ofNo. load strength2 , elasticity, 10-6j(lbjin2) F(K) elasticity3,
days Ibjin2 Ibjin2 x 106 Ibjin2 x 106
L-1 28 2,150 41.03 1.05 0.106 0.95L-1 90 3,410 41.32 .84 .057 1.19L-1 180 4,120 41.58 .67 .032 1.49L-1 365 4,990 21.75 .57 .018 1.75
L-2 180 3,220 1.26 .62 .019 1.61L-2 365 4,870 21.63 .57 .013 1.75
L-3 28 52,030 51.49 .66 .044 1.52L-3 180 4,170 1.69 .57 .013 1.75L-3 365 5,140 21.82 .53 .021 1.89
strength development are influenced by the FA:C ra-tio and the W:C+FA ratio. Through 1 year's age, theeffect of the FA:C ratio outweighs the effect of theW:C+FA ratio. Mix L-1, with a water-cement ratiogreater than both mixes L-2 and L-3 (0.47 versus0.45 and 0.43, respectively), has a higher compres-sive strength through 1 year. This can be attributedto the higher percentage of cement in mix L-1 thanin mixes L-2 and L-3 (40 percent by volume versus25 percent). It is anticipated that the compressivestrength of mixes L-2 and L-3 may exceed thestrength of mix L-1 at ages beyond 1 year's age. MixL-2 has a higher rate of strength gain after 180 days'age than mix L-3, which was not anticipated withequal FA:C ratios; however, this may be attributedto within batch variations of individual mix designs.
The strength development of all mix designs beyond28 days' age is greater than expected, with 2S-daystrengths varying from 25 to 40 percent of the1-year strengths. This is directly related to the highpercentages of fly ash and may pose a problem forthe early age quality control testing of field cylindersat the damsite.
An accelerated strength test method needs to bedeveloped to provide a quicker means of determiningthe ultimate strength potential of the mixes. The
strength development at early ages may be influ-enced by the use of a set-retarding WRA (water re-ducing admixture) in the mix, particularly during thefirst 3 days. When combined with the fly-ash con-tents, the strength development at early ages can beretarded. This may be advantageous for better jointstrength development; however, the disadvantagewould be the trapping of heat in the mass which mayhave been able to escape prior to the placement ofthe next lift of RCC.
Modulus of Elasticity and Poisson's Ratio inCompression
Perhaps the most significant deviation from proper-ties of conventional concrete lies with the elasticproperties of Upper Stillwater RCC mixes. As shownin table 12, the modulus of elasticity in compressionis significantly lower than that of conventional con-crete at equal strength levels. Figure 3 shows thevariation in compressive strength and modulus ofelasticity for other Bureau mass concrete dams. TheRCC test results indicate moduli ranging from 25 to40 percent of the modulus of conventional concreteat equal strengths. There are three possible expla-nations for this phenomenon: lower modulus of theaggregate, lower modulus of the mortar (or paste),
Table 12. - Laboratory mix program - creep function parameters - RCC.
1 Creepequatione= 1IE + F(K) In (t + 1)
e = elastic + creep strain in millionths inches per inch per Ib/in2E = modulus of elasticity at loading age KK = age of concrete when load is initially applied
F(K)= a constant for any loading age representing the rate of creep deformation with time
t = age in days after loading.2 Valuescomputed by companion6- x 12-in cylinder.3 Values from creep specimens.4 Values taken from average of all cylinders of mix at that age.S Different sand source used in mix.
14

+.
+. ++.+ + +.
+. +.
+++
++
8
+. EXIST ING USSR MASS CONCRETE DAMS
7 E = 57000 'Vfd - AC!-
-0-- UPPER STILLWATER R,C,C,
N
.~ 6......£!
<I)Q~
++.
+.
>-I-
5
u+
++
I- 4en«...Jw
++
++ ++ + +++.
t 3
en:J...J:Jg 2::i:
-- 0-00 P --0-.--.--
+. +
+
++ +++ +.+
+ + +.++ +
+ +++++. ++
++'++
+
0
-- -0----0 --C£10--- 0
--.-d""D 0I1D
08000
COMPRESS I VE STRENGTH (lb/in2)
Figure 3. - Laboratory mix program. elastic properties of concrete versus compressive strength, RCC.
or microcracking in the paste aggregate interface.According to Neville [6]:
"The two components of concrete, cementpaste and aggregate, when individually sub-jected to stress, exhibit a sensibly linear stress-strain relation. The reason for the curved rela-tion in the composite material - concrete liesin the presence of interfaces between the ce-ment paste and the aggregate and in the de-velopment of microcracking at thoseinterfaces.'
,
As shown on figure 4, the typical stress - strainrelationship of RCC in compression shows higherstrain values at equal stress than for conventionalconcrete. As stated before, three possible causesare the aggregate, paste, or their interface. Since theaggregate used in the mixes is in itself a "cemented"material, being a quartzose sandstone, there is a pos-sibility that the aggregate may experience higherstrain and thus have a lower modulus of elasticity.This could, therefore, induce higher strain in the RCC
stress - strain relationship or lower its modulus ofelasticity or both.
The effect of bedding planes in the coarse aggregatecould also contribute to lowering the elastic modulus.
Figure 4 shows two tests of cores of foundationsandstone similar in physical properties to the coarseaggregate. When the load was applied perpendicular(90.) to the bedding planes, the strength of the sand-stone exceeded 20,000 Ib/in2. When load was ap-plied at a 60. angle from the bedding plane, thestrength was reduced to less than 7,000 Ib/in2, andthe specimen exhibited more than triple the strain.Though this type of bedding plane would not nor-mally be found in a crushed coarse aggregate, theremay be some influence of the bedding of the sand-stone in aggregate particles which could lower themodulus of the concrete.
The high fly-ash content of the paste could be re-sponsible for the high strain and lower modulus. Thelow strength of the paste could also result in a low
15

modulus, which would be in turn lower the RCCmod-ulus. Studies are not available which show the influ-ence of high fly-ash contents on modulus of eitherpaste or concrete. The paste-aggregate interfacemay also be responsible for the lower modulus ofelasticity and high strain of the stress - strain rela-tionship. Following Neville's hypothesis [6], micro-cracl<ing at the paste-aggregate interface causeslocal stress intensity, increasing the magnitude of thestrain, thus causing strain to increase faster than theapplied stress resulting in the stress-strain "curve."The sandstone used for these mix designs containedindividual sand grains which could be "rubbed off"the aggregate surface. This "rubbing off" could alsobe occurring during the application of stress, causingmicrocracking.
The low modulus of the aggregate will probably berevealed as the factor influencing the low modulus ofthe RCC. This is not considered detrimental to theRCC. Rather, high-strength, low-modulus concretewould probably be considered a benefit for this struc-ture, which is subjected to significant differential tem-perature stresses during and after the cooling of thedam.
7000
Poisson's ratio in compression compares with con-ventional concrete in the established range of 0.10to 0.20 in/in, as shown in table 6. This should beexpected, as the ratio of strain should not differ sig-nificantly with respect to lateral versus longitudinaldeformation.
Tensile Strength
The results of tensile strength testing are shown intable 11 and on figure 5. As with compressivestrength, the rate of tensile strength developmentafter 28 days' age is significant, again attributed tothe high percentages of fly ash. All these mix designsexceed the 180-lb/in2 tensile strength design require-ment, but not to the same degree as the compressivestrength. Mix L-3 has the highest tensile strength at1 year's age; however, mix L-1 and L-2 pit-run sandcontained some small clumps of silt and clay whichwere evident in most breaks. This may be respon-sible for the fact that mix L-1 had a lower tensilestrength expressed as a percent of the compressivestrength. There was only one occurrence of jointbond failure throughout the test program, indicatingthat with a clean joint and proper consolidation ad-equate joint bonding can be achieved.
Upper st i IIwater Sandstone 90. from bedd ing pi a ne
6000
5000
N
.~ 4000......
.a
U)U)
w
~ 3000U)
2000
1000
00
Upper St i II water Sandstone 60. from bedd ing plane
I
1000 2000 3000 4000 5000
STRAIN (x106 in/in)
80006000 7000
Figure 4. - Laboratory mix program, typical stress versus strain curves, RCC.
16

-o-MixL-1~MixL-2 _./:r----D.-MixL-3 --- ---- --i.~- ---
~-'" - --- ---~---------~------~e.---~/' --'""
.....j..-
/".- -~..'" ..""'p- 0
V / ""/
;'
~/'"/ /
~/
~/,,'I
II
01 25\ 50 75 I 100 125 150 17~ 200 225 250 275 300 325 350 I 375 40
Modulus of Elasticity and Poisson's Ratio inTension
Test results for modulus of elasticity and Poisson'sratio in tension are given in table 11. Though thenumber of tests is limited, the results do indicate thatthe modulus of elasticity is lower than what is nor-mally found with conventional concrete. Again, aswith compression, the stress-strain relationship in-dicates higher strain than is normally found in con-ventional concrete.
Creep
The creep test results are given in table 12. Asshown on figures 6 through 8, the instantaneous de-formation, 1/E (elastic plus creep strain), is higherthan that of conventional concrete. This difference isrelated to the low modulus of elasticity of RCC. Therate of creep deformation, F(I<),is similar to that ofconventional concrete at equal strength levels. Re-
300
250
~ 200
'"c,..c
:I:f-l!)Z 150wa::f-(f)
W...J(f)
~ 100
f-
50
0
7 28 90
ferring to figures 6 and 8, mix L-3 has a lower in-stantaneous deformation than mix L-1 at 28 days'age, which can be attributed to a higher modulus ofelasticity for this particular mix (with Moon and Whitesand source). There is some inconsistency associ-ated with the creep lines generated for mix L-3 at180 and 365 days' loading age. This apparently isdue to the inaccuracy of measurements of defor-mation. The test specimens loaded at 180 days hadsmaller deflections after loading and should be con-sidered less accurate than the recorded values at 1year, which shows excellent correlation of datapoints.
Cohesion and Coefficient of Internal Friction
Test results for cohesion and coefficient of internalfriction are given in table 13 and on figures 9 through19. All three mix designs exceed the design require-ment of 300 Ib/in2 and 0.5 for cohesion and coeffi-cient of internal friction, respectively.
0180 365
Figure 5. - Laboratory mix program, tensile strength development, RCC.
AGE (days)
17

2
1.8
Nc, 1.6:e..''52
1.4>Cc,c- 1.2
z<ta:t;0..ILlILl .8a:u+u .6
I-(/)<t-J .4ILl
"w
.2
0
~--'"-- ---~~----"""'"i-
-- ----- -
-~i-"~---- -- .----- -.---- ---
~-f-'..' -' ---. .,I-fo'.-.- --......---- .-" .-- '
f---'-".-.- -...-.-'.- -. !-'"fo- ""I-
~'- '- - - - - .- 1-1-- - - -MIXL-(
( =1.05+.I06Ln(t+l)28 DAYS
--------- 90 DAYSE -0.84+.0571n(t + I)
-----. 180DAYSE "0.67+.032Ln(t + I)
- - - - 365 DAYSt "0. 57+.OI81n(t+ I) ,
--
N""
... It)ID"" 00<7>0 0
N00N
g g g 8 g 88... It) ID ,... 00 <7>0
0 0 0 0000... It) ID ,... CD <7>0
00
""
0
""(t + I), days
Figure 6. - Laboratory mix program, creep of mix L-1, RCC.
Coefficient of Thermal Expansion
Values for coefficient of thermal expansion are listedin table 14. Initial testing of mixes L-2 and L-3 wasperformed with concrete specimens which containeda local Denver area sand and which had lower coef-ficients of thermal expansion than was expected.When mix L-3 was retested with a project quartz-sand, the value increased from 3.20 to 4.96 x 10⁻⁶OF.These values are similar to mix L-1 and within therange of quartzitic aggregates which have an aboveaverage thermal coefficient of expansion. Valuesagree with test results from samples obtained fromthe test section as shown in table 15.
Adiabatic Temperature Rise
Results of adiabatic temperature rise tests are shownin table 16 and on figures 20 through 23. These re-sults indicate a substantial delay in heat generationduring the 24 to 36 hours following placing. Thereare three probable causes for this delay or retarda-tion: (1) the use of a set-retarding WRA, (2) the low
initial placing temperature, and (3) the high percent-age of fly ash. Tests were performed with and with-out the set-retarding WRA on laboratory mix L-3, asshown on figure 21 . The delay in heat generation wasreduced by approximately 12 hours; however, littletemperature rise occurred during the first 24 hours.In pre.vious temperature rise studies, it was foundthat when higher percentages of fly ash were com-bined with low placing temperatures and retarders,the total delay in setting time was greater than thesum of the delay attributed to each of the three com-ponents individually.This also appears to be the caseoccurring with the RCC. The total temperature riseat 28 days reflects the percentage of fly ash as wellas the total cementitious materials content with mixL-1 having the highest total temperature rise, fol-lowed by mixes L-3 and L-2. This is because mix L-1 had approximately 50 pounds more cement thanmix L-3. The temperature rise of mix L-1 at 45.5 ofin 28 days is relatively high for a mass concrete dam;however, with 1¥2-inch MSA, the total cementitiousmaterials content must be increased above that fora conventional 3-inch MSA concrete. Temperature
18

2
1.8
Nc:, I 6
..c
ISJ'
'0
><1.4
c:,c:
~1.2
z:;;:(
a:tii
~UJUJ .8a:u
+u .6
I-(.f)«-.J .4LU
"..,
.2
0
rise for mixes L-2 and L-3 is low even for a massconcrete dam with a lower cementitious materialscontent.
Two additional temperature rise tests were per-formed, one on mix L-5, a richer mix proposed foruse when delays in construction exceed 2 days, andone on the facing element mix design (FE-1). Theseresults are shown in table 16 and on figures 22 and23. These test results are consistent with resultsfrom earlier mixes with the exception of the facingelement mix after 14 days. Here, a decrease in con-crete temperature occurred rather than a continuingincrease. The cause for this occurrence has not beendetermined.
Density
The results of density testing are given in tables 10and 11. All mix designs meet the design density re-quirement of 145 Ib/ft3, which is somewhat lowerthan conventional, non-air-entrained concrete. This
I ..1
I ---
------
t u-t--.
I
N, . U"') <D
"'-
(()(J)O
can be attributed to the low specific gravities of thecoarse aggregate (2.54) and fly ash when comparedto average specific gravities of aggregate and ce-ment, respectively. The density of fresh concrete,determined by the Vebe test, compares favorablywith the theoretical density, but is lower than thedensity of cast hardened concrete cylinder speci-mens. It appears that the densities of test cylindersexceed what would be achieved in the Vebe test,due to a possible over vibration of the sample.
Permeability
The results of permeability tests are given in table17. These values are equal to or lower than thoseassociated with conventional mass concrete. Thiscan be attributed to the high fines content suppliedby the fly ash and the low water to cementitiousmaterials ratio. Failure of sealant material preventedthe measurement of permeability for mix L-3. How-ever, similar mixes were tested, and value of 4.0 x10.4 ft/yr can be estimated. The standard test pro-
.-- ---
MIXL-2
180DAYSe -O.62+.019Ln(h'l)
- e -O.57+.013ln(t+l) 365 DAYS
1.- ~l 1--- --L., . ,
0 0 0 0000 0 0 0 0 00000..,.
'"<&>r-OO<T>O 0 0 0000000
N"""
1.t')~"".CXi~"O
0
'"0 ,
Figure 7. - Laboratory mix program, creep of mix L-2, RCC.
(t + I), days
19

Nc:
2 ,I
t-I: I II I il
1.8 --+ +-I :
.'I
.'Itt----,
,'
; 1 I
1
;I
I 6 - - -1 m+--t-+~-+" +~- -
I.
i I Ii! i
.
I.
1.4 ---+-+-~++JJi I Ii,!::! I " Iii!!
12 u ~. _
1
' )++.
~:
I \ I
I
I
i
'!
-t- ,i
ttl 1__-
I Iii, i
---f-_ui- -~-~~JliL--
........J:)
~.......
'0
><
~.......
c:
z<{crl-(/)
a..UJUJcru
+
8
i Il-.~~--:-1+- "t
~ -t- + . ~
u .6
I-l-
~,<{..J<.wII
4 -+
.2
. ,, I~ -+- t -+ -+
0 L l-'. . -1 L~Ll~ J('\"j
rr; -.;!-1.1"' I.D
"-rt)J'lO 0
N
--
I,
tt
'
JI
'.:,I
.11-.. :n-L-l
MIX L-328 DAYS *1
E -0.66+D44Ln(t+l)
* Moon & white sand
/80 DAYSE =0.057+.013Ln(t + I)- - - 365 DAYSE =0.53+.021 Ln(t + I)
--, L-. U,~,-L--,--->--
0 0 0 0 000000 0 0 0 00000N "".1,1)\0""'«>0')0
0r<'>
0 0 0 0000"lit 1.0 \D , co (7)0
Figure 8. - Laboratory mix program, creep of mix L-3, RCC.
(t + I), days
cedure for permeability involves correcting values toa standard test age of 60 days of curing. This wasnot useful because these procedures assume a higherdegree of hydration of cementitious materials at thatage than is achieved with RCC. The permeability ofmix L-1, which was tested at 28 days' age, wouldprobably be 25 to 50 percent lower if tested at alater age. Mixes L-2, L-4, and L-5 were tested whentheir compressive strengths were approximately4,000 Ibjin2. These tests reflect a decrease in perme-ability at equal strengths with an increase in cemen-titicl.ls materials content, as shown on figure 24.
Diffusivity
The results of testing for diffusivity are shown in table18 and on figures 25 through 27. These test resultsfall within the normal ranges of conventional con-crete, with the values primarily governed by the ag-gregates. Mixes L-2 and L-3 incorporated the use oflocal Denver sand. Mix L-3 was retested with sandobtained from the Moon and White sand source.
Drying Shrinkage
Drying-shrinkage results are given in tables 19 and20 and on figures 28 through 33. The average dryingshrinkage values for laboratory mix designs L-1 ,L-2, and L-3 are higher than for conventional massconcrete which generally has a shrinkage of approx-imately 0.00500 inch after 1 year of drying. How-ever, this should be expected with only 1%-inch MSAand relatively high mortar content. In addition, an ag-gregate with a low modulus of elasticity, such as thesandstone used at Upper Stillwater, offers less re-straint to the potential shrinkage of the paste andalso contributes to increased drying shrinkage.Drying shrinkage results from the test placementspecimens are considerably different than from thelaboratory specimens. Drying shrinkage from lift 3(mix T-1)* is much higher than from mix L-1. This isprobably due to a much higher water requirement
.For mix designation description, see "Concrete Mix Designs"section which follows.
20

Break bond summary'.2 Sliding friction summary 1.3
Mix. Age, tPa tan tPa Ca, tPs tan tPs Cs,No. days Ib/in2 Ib/in2
L-1 28 46.6 1.06 219.6 42.0 0.90 44.1L-1 90 49.1 1.15 376.3 47.4 1.09 44.0L-1 365 46.8 1.06 497.2 47.9 1.11 48.1
L-2 28 46.5 1.05 136.3 38.8 .80 38.1L-2 90 58.0 1.60 240.6
'
45.0
I
1.00 38.5L-2 180 54.9 1.42 350.1 43.9 .96 39.2L-2 365 71.1 2.92 354.7 40.5 .85 31.9
L-3 28 42.1 .90 234.7 45.9 1.03 58.1L-3 90 59.3 1.68 281.1 45.0 1.00 38.5L-3 180 63.9 2.04 310.1 43.2 .94 44.9L-3 365 45.6 1.02 575.4 42.9 .93 40.9
Table 13. - Laboratory mix program - shear and sliding friction summary - RCC.
1 General equation for shear: T = C + tantP (0')2
a denotes break bond tests3 s denotes sliding friction tests
'a = shear strength (lb/in2)'s = shear resistance (lb/in2)C = cohesion (lb/in2)tP = friction angle n
tan tP = coefficient of internal friction0' = normal stress (lb/in2)
associated with 100 percent unprocessed pit-runsand for mix T-1 instead of 40 percent unprocessedpit-run sand which was in mix L-1 (see section "Ma-terials Investigations"). Test reports indicate that thesilt content of pit-run sand was as high as 34 percentminus No. 200 material. Lower strengths in field cyl-inders for mix T-1 support this conclusion. Dryingshrinkages for lifts 6 and 8 (mixes T-2 and T-3, re-spectively) are lower than for laboratory mixes L-2and L-3. This is probably the result of a lower watercontent, which is indicated in some batch scaleweight readings and supported by higher strengthsin field test cylinders. Most of the test specimensshowed higher expansion after the continuous fogcure than what would be expected with conventionalmass concrete. This could be due the result of thehighly absorptive coarse aggregate and the higherpaste and mortar content associated with the smallerMSA.
UPPER STILLWATERDAM -RCC TEST PLACEMENT
In August 1981, the RCC test placement was con-structed at the proposed Upper Stillwater Dam site(see app. A). The 100-foot-long placement had a
cross section similar to the upper 11 feet of the dam,with the downstream face similar to the spillway por-tion of the dam. The test placement was constructedto evaluate the construction procedures proposed forthe dam, including the laser-guided slip forming offacing concrete and compaction of concrete by vi-bratory rollers (fig. 34). A coring program followedconstruction to determine additional properties ofthe RCC. Test cylinders were cast at the jobsite foradditional testing.
The test placement (fig. 35) consisted of 11 lifts ofRCC, 5 upstream and 5 downstream facing ele-ments. The lifts of RCC are numbered 1 through 11,with 1 beginning at the lowest lift. Odd-numberedfacing elements are upstream, and even-numberedones are downstream.
Concrete Mix Designs
The three RCC mix designs used in the test place-ment, designated T-1 through T-3, are given in table21. Though similar to the corresponding laboratorymix designs, two significant differences in the ma-terial properties were the high silt content of the sandthat was obtained from the coarse aggregate crush-ing operation and an increase in voids content of the
21

500
400'---
,,
j //'
- -i- //l1,/'
I
, I
~
/>r'T-
""" """ .,,"m1/' IA,
,,' I
Nco
"--'"
f..300(f)
(f)wQ:f-(f)
Q:<[w:r: 200(f)
100
r-219.6 + I.06(er)
COHESION = 2J9.6lb/inz
+=46.0° r2= 0.9718,/
/X
"
LEGEND SLIDING FRICT ION RESUL TSO-BREAK BONO RESULTSX-SLIDING FRICTION RESULTS T=44.1 + 0.90(0')
COHESION:: 44.1 Jb/in2
.:42.0° r2=o.9539
0 100 200 300
NORMAL STRESS. a- (lb/in2)
Figure 9. - Laboratory mix program, direct shear test mixL-1, 28 days, RCC.
800
II
/I
/
I,I
I/
700
600N
co.:::
-'"
//
II
II
f.. 500(f)(f)wQ:
t; 400
Q:<[w:r:(f)
300x
xx
// x,
II
II,,
II
,I, X,,
BREAK BOND RESULTS
T:497.2 + 1.07(0")
COHESION = 497.2 Ib/inz
.-46.8 rZ"O.9891
LEGENDQ-BREAK BOND RESUL TSX-SL IDING FRICTION RESULTS
SLIDING FRICTION RESULTST =48.1 T 1.11 (CT)
COHESION'" 48,1 Ib/in2
$::47.9° r2=O.9362
300 400 500
NORMAL STRESS-a- (lb/in2)
600100
Figure 11. - Laboratory mix program, direct shear test mixL-1, 365 days, RCC.
400
700
,,,,,,,,,,,,,,
,,,,,,,
BREAK BOND RESULTS
T"'376.3 + I 15(0')COHESION = 376.31b/in2
.=49.10 r2a 0.9746
SLIDING FRICTION RESULTS
t""44.0+ 1.09(0')
COHESION;; 44.0 tb/in2
."47.4° rZ"'O.9002
500
Figure 10. - Laboratory mix program, direct shear test mixL-1, 90 days, RCC.
,x/
,,/1
////x
I ",.","
/1,,' x
,,,,,,,,
"f'/,,,,,
//,/x
600
500N
co
"-E
f..(f)
V>WQ:
l-V>Q:<lW:r:V>
x
400
300
,;(
//1
x
BREAK BOND RESULTS,.-136.3 .'.05(u)
COHESION. 136.3 Ib/in 2
"-46.5° rZ=o.956J
SLIDING FRICTION RESULTST=38.1 + 0.80(0')
COHESION = 38.1 Ib/inz
$"'38.8° rZ"O.9648
200 300
Figure 12. - Laboratory mix program, direct shear test mixL-2, 28 days, RCC.
22
200
100 ,,,, LEGENDo-BREAK BONO RESUL TSX-SLIDING FRICTION RESULTS
I0 100 200 300 400
NORMAL STRESS. (T (lb/in2)
400
- 300
'".s"-.Q
f..
V>(f)
wQ:
:n 200Q:<[wI(f)
100
LEGENDO-BREAK BONO RESUL TSX-SLIDING FRICTION RESULTS
0 100
NORMAL STRESS. a- (Ibl in2)

600
500
,,,' \
,//,,
Nc::
"-DC 400
,/,
,,,,/
...(j)(j)
WCt:f-(j)
300Ct:<:!wI(j)
,"'~,,,,X '
,,
BREAK BOND RESULTS
1'"""240.6 + 1.60 (0")
COHESION'" 240.6 Ib/in2
."58.0° rZ"O.9968
Figure 13. - Laboratory mix program, direct shear test mixL-2, 90 days, RCC.
700
c".Q
J3I
I'B II
II
I BI
400I
600
500
....
vi
~.....(f) xa: 300<IW::J:(f)
~*/l1/1*/ !
vi<xx
BREAK BOND RESULTS
T
""
575.4 + 1.02 (cr)
COHESION -575.4 Ib/in2<P-45.6" COR CDEF=O.3946
SLIDING FRICTION RESULTST =40.9+0.93{u}
COHESION"" 40.9 !b/inz
4> = 42.9' COR COEF.09522
200
100
00
I200 300 400 500
NORMAL STRESS, (J" (Ibl in2)
600100
Figure 15. - Laboratory mix program, direct shear test mixL-2, 365 days, RCC.
700
700
N<=
"-.a
B
I'1
11
500~,/1
r
l /BBI
40)II
x
600
..
vi(f)wa:.....(f)
a:<Iw::J:(f)
300
x1r
200
BREAK BOND RESULTS
T= 350.5 + 1.43(u}COHESION: 350.51b/in2
4>~ 55.10 COR COEF=0.9820
I
I100
-A"l-B-BREAK ~~E~~UES--
0 ~~~L'::F::C~':N- ~~:S I--
0 I00 200 300 400
NORMAL STRESS, o-(lb/in2)
SLIDING FRICTION RESULT
T=39.8 + 0.97 (u)
COHESION = 39.8 Ib/in2
4>~44.00 COR COEF'0.9601
..L_L...L-500 600 700
Figure 14. - Laboratory mix program, direct shear test mixL-2, 180 days, RCC.
500
400
N
.~
"D
,,,/
/,,,/
X'J/
./~/
/,/
//
300
T- 234.7 + O.9O(a-)
COHESION = 234.7 Iblin2
."42.1° r2=o.9406
...(j)(j)
WCt:
f-(j)
Ct:<:!wI(j)
200
BREAK BOND RESULTS
100 //
//
/ SLIDING FRICTION RESULTS
T = 58.1 + 1.03 (0')
COHESION = 58.llb/jn2LEGEND
Q-BREAK BOND RESULTSX-SLI DI NG FRICTION RESULTS
,,=45.9° r2:"'O.9912
0 100 200 300
NORMAL STRESS, (J (lb/in2)
Figure 16. - Laboratory mix program, direct shear test mixL-3, 28 days, RCC.
23

Mix Fine Moisture Coefficient No. ofNo. aggregate condition of thermal tests
source1 (percent expansion2,saturation in/in x 10-6
OF
L-1 40% PRS 75 5.18 660% TS 100 4.88 6
L-2 75% CC 100 3.97 1225% PRS
L-3 100% CC 100 3.20 12
L-3 100% PFA 100 4.92 6
N
'='-.c
700
600
500 .~l-----
. f..(j)
~ 400
cr:f-(j)
cr:<!W 300I(j)
,,,,
J,'/''I<,,,,
,,' X
200
,,,
100
,,,
x ,
,','k'
100 200 300 400
NORMAL STRESS, u Ilb/in2)
,,
,'",'/
/1
/,",',
BREAK BOND RESUl T5
r=281 1+ L66{0')OHESION = 261 IIbtio2
~=S9.3° rZ=o.9904
SliDING FRICTION RESULTS
r=43.1 + 0.92 (0")
COHESION = 43.1 fb/in2
.=42.6° r2=O.9605
500
Figure 17. - Laboratory mix program, direct shear test mixL-3, 90 days, RCC.
7008
//
/;;- 600c:
......
.c
f.- 500
(/)(/)I.&.Jcr:f- 400(/)
cr:<!I.&.JIU1 300
200
100
00 200 300100
NORMAL STRESS, (J (lb/in2)
BREAK BOND REsuLTS
r=354.7 + 2.92 (CT)
COHESION =354.7 Ib/in2
q:, =710 COR COEF=Q.8120
SLIDING FRICTION RESULTS
T=
31.9 .. 0.85 (a-I
COHESION=
31.9 Ib/in2q:,
=40 50 COR COEf=O.958
400 500 600
Figure 19. - Laboratory mix program, direct shear test mixL-3,365 days, RCC.
800
700
//
/600
Nc:
"~I- 500
8 //
II
I/
//
/s/
/
I
u)(/)wcr:t:; 400
cr:«wI(f)
x
200
/
/;/ i BREAKBONDRESULTS
+~~-~--r =310.0 + 2.04 (,CT ;
/~
'[COHESION ~310 IMn'cp
=640 COR COEF =0.9429
/ I'SLIDING FRICTION RESULTS
I T = 44.8 +0.94(0-)x x
- --.I
-~- -- COHESION=
45 Ibfln2
I ~ I LEGEND II
<I> ~43° COR COEF ~O.9111
V",
B=
BREAK BONO VALUES- -
I
I
I
X~SI'O'NG FRICrON VALUESi
I I
x300
100
0 200 300 400 500
NORMAL STRESS, (J (lb/in2)100 600
Figure 18. - Laboratory mix program, direct shear test mixL-3, 180 days, RCC.
Table 14. - Laboratory mix program - thermal expansionsummary - RCC.
1 All test mixes included project coarse aggregate (quartzose sand-stone). Fine aggregate designations:
PRS - project pit-run sand (quartzitic sand, silt)TS - crushed talus sand (quartzitic)DFA - Denver area fine aggregate (granitic)PFA - project area processed fine aggregate (quartzitic)
2 Average of tests performed on 2- x 2- x 4-inch prisms.
24

Mix Coefficient of thermal No. ofNo. expansion, tests2
in/in x 1O-6(F
T-1 4.82 6T-2 4.87 6T-3 4.74 6Facing
concrete 4.56 6
Mix Initial Adiabatic temperature rise,designa- placement of
tion temperature,6h 12 h 24 h 36 hNo. of 3 d 7 d 14 d 21 d 28 d
'L-1 59.8 0.5 1.0 2.5 6.9 25.0 33.7 40.7 44.5 45.5'L-2 46.5 3.7 4.0 4.7 5.5 15.3 25.5 29.3 30.7 32.5'L-3 44.5 1.8 2.0 2.5 2.9 3.8 20.0 29.5 31.7 34.32L-3 49.0 2.9 3.3 3.9 6.2 15.9 27.8 32.5 35.2 37.32L-5 53.5 4.4 4.8 6.4 11.8 24.3 36.3 43.5 46.7 48.3
2.3FE-1 60.5 3.6 4.5 18.7 37.3 56.0 67.7 69.5 69.0 67.9
Mix. Cement, Fly ash, C/FA ratioNo. Iblvd3 Ib/yd3 by volume
L~1 180.4 208.3 40/60L-2 121.0 269.0 25/75L-3 129.0 286.0 25/75L-5 156.0 344.0 26/74FE-1 352.9 272.1 50/50
25
coarse aggregate. Silt and organic materials, whichwere deposited throughout the talus source, werenot removed prior to crushing and contaminated thesand which was generated during this process.Though the average percentage of minus No. 200fines was similar to that used in the laboratory mixdesigns L-1 and L-2, variations of up to 22 percentminus No. 200 in the crushed talus sand and 34 per-cent minus No. 200 in the pit-run sand were com-mon. This significantly affected the workability,water content, and strength of mixes T-1 and T-2,particularly mix T-1, which utilized 100 percent ofthis material. Mix T-2 was not as seriously affected
Table 15. - Upper Stillwater Dam concrete test placement coreprogram - thermal expansion summary'.
,Test specimens were vacuum saturated to assure 100 per-
cent saturation.2 Test specimenswere 2- x 2- x 4-inch prisms.
since pit-run sand comprised only 25 percent of thetotal sand content.
An increase in the voids content of the coarse ag-gregate was caused by a high percentage of aggre-gate in the 3/B-to %-inch size range. Dry-rodded unitweight studies have shown that an increase in theNO.4 to 3/B-inch size fraction is necessary to producea lower voids ratio, possibly due to the bedding char-acteristics of the sandstone. The increase in voidswas not accounted for the test placement mix de-signs, resulting in a net decrease in the available freemortar (above minimum voids). This significantly re-duced the compactibility of the in-place lifts of RCC,resulting in voids at the bottom of many lifts, partic-ularly mix T-3, causing reduced bond at the construc-tion joints.
The two mix designs used for facing element con-crete, designated T-4 and T-5, are given in table 22.These mixes differed primarily in the amount of ce-ment replaced with fly ash. The primary mix designon which the bulk of tests was performed utilized 50percent replacement of cement by volume. Two fac-ing elements (FE-5 and -6) were constructed with mixT-5 which utilized 60 percent replacement by vol-ume. This mix was deemed unacceptable and wasdiscontinued.
Coring Program
The coring program was designed to provide infor-mation on bonding between lifts and compressive
Table 16. - Laboratory mix program - adiabatic temperature rise summary - RCC.
,ASTM type D WRA (water reducing admixture) used for mix.
2 ASTM type A WRA used for mix.3 1-inch MSA aggregate represents similar proportions to facing element mixes used in Upper Stillwater Dam test placement.

501T~I I I I
4' 1 I
~ l_t---1~
- 1- I...~I ~x \1>\'1..""'--
I
x~l///~
V/':
rj//x/x?' I
- -0- .A>
- 30~
'""'ii:
25
'"'""ga. 20§
lJ...0
w(f)
0::
w 200:::::>f-<I0::
~ 15~wf-
100
- ~
Mix No.L-IL- 2L- 3
ementIb/yd'180.4121.0128.0
Iy Ash- Placing~ Temp. (OF)
208.3 59.8269.0 46.5286.0 44.5
Mill.L-I .Mix L-2 xMj):.
L-3 0
21 28 30
ELAPSED TIME -paY,ls
Figure 20. - Laboratory mix program, adiabatic tempera~ure rise, mixes L-1, L-2, and L-3, RCC.
35
30
-.-''--''--'~.
./"'".
,~.
//
I'/'
I/
j..-1'
. :;...-
25
10
LAB MI X 3(I NIT IAL TEMp: 46 OF)
LAB M I X 3/ RETARDED -'-'-( I NIT I AL T EMP : 44. 4 oF)
5
00 4 6 7 8 92 3
Figure 21. - Laboratory mix program, adiabatic temperature rise, mix L-3 with and without set retarder, RCC.
26

- \-----I.----~.....---
../v
.//1/
7/
//
/1/
I
I Mix No. L-5
/ Cement content -156.0 Ib/ydT
/Fly ash content -344.0 Ib/ydT-Placing temperature- 53.5°F
)/'"
47.5
45.0
42.5
40.0
37.5
35.0
32.5
~ 30.0
w 27.5(/)
cr25.0
w
~ 22.5f--<tcr 20.0w0-
~ 17.5f--
15.0
12.5
10.0
7.5
5.0
2.5
0.00 2 4 6 8 10 12 14 16
ELAPSED TIME (days)
18 26 2620 22 24
Figure 22. - Laboratory mix program, adiabatic temperature rise, mix L-5, RCC.
and tensile strength at various ages of the concretetest placement. Cores were extracted at approxi-mately 28, 90, 180, and 365 days, sealed in boxeswith moist sawdust, and shipped to the laboratoryin Denver for testing. When received, the cores wereunboxed, logged and photographed, marked, andprepared for testing. Figure 36 shows typical con-crete cores extracted from the test placement. Ex-cept for the 28- and 9O-day cores, specimens werekept moist by covering with damp rags and plasticsheets until cutting, after which they were stored ina 100 percent humidity room until testing. Somedrying occurred in the 28- and 9O-day cores betweenunboxing and cutting. It was necessary, in somecases, to surface dry the specimens in preparationfor testing since the epoxy used for attaching straingages had to be applied to a dry surface. A differentepoxy used for the 180- and 365-day cores elimi-nated the necessity of surface drying test specimens.
Seven cores with a diameter of 5.75 inches werevertically drilled at 28 days' age, labeled 1-8 and 2through 7. At 90 days' age, 11 cores were extracted:cores 8 through 15 and 17 were drilled vertically;
core 16 was drilled horizontally; and core 18 wasdrilled at a 31. angle from the vertical. The diametersof these cores ranged between 5.8 and 5.9 inches.Cores 19 through 28 and 29 through 38, with di-ameters of 5.75 to 5.81 inches, were vertically andhorizontally drilled at 180 days' age. Lastly, the 365-day cores included eight vertically drilled cores, 39through 46, and four horizontally drilled cores, 47through 50, with an average diameter of 5.8 inches.
All test specimens were saw cut, v/ith cut lengthsvarying from 7 to 12 inches. Only 1° specimens hada length less than 8 inches.
Core Test Program
Tests performed on cores from the test placementincluded compressive strength and elastic proper-ties, tensile strength and elastic properties, unitweight, thermal expansion, cohesion and coefficientof internal friction, and drying shrinkage (see "Mixingand Testing Procedures" section).
Tests were performed on both vertical and horizontalcores, from RCC and facing element concrete, and
27

70.0
65.0
60.0
55.0
50.0
IL 45.00
w40.0(I)
crw 35.0Ir::>~<[
30.0Irwn.:<: 25.0w
~20.0
15.0
10.0
5.0
II --i/
/1/
1/
/I
I
Mix No. FE-ICement content - 352.9 Ib/yd3Fly osh content -272.1 Ib/yd3Placing temperature- 60.5°F
JV
Mix Cementitious materials Permeability,No. content, Ib/yd3 10-4 ft/yr
Cement Fly ash
L-1 182 210 14.51L-1 182 210 9.0L-2 121 269 18.8L-2 121 269 13.5
2L-3 129
I
286 4.03L-4 132 295 3.13L-5 156 344 1.5
0.00 4 8 10 12 14 16
ELAPSED TIME (Cloys)
282 6 18 20 22 24 26
Figure 23. - Laboratory mix program, adiabatic temperature rise, mix FE-1, ACC.
results reported separately. Tensile tests were per-formed on both jointed and unjointed material, andare also reported separately.
Table 17. - Laboratory mix program - permeabilitysummary - RCe.
1 Estimated value at 4,OO0-lb/in2 compressive strength.2 Estimated value - see figure 24.3 Mix designs developed as joint bonding mixes.
Test of Hardened Concrete Cores
Compressive strength tests were performed on corespecimens in accordance with ASTM Designation:C 39-80 (Compressive Strength of Cylindrical Con-crete Specimens). Many of the core specimenstested exceeded the scheduled test ages of 28, 90,180, and 365 days due to delays in shipping and inspecimen preparation. The ages listed in tables areactual test ages. Compressive strength results arecorrected for cores with an L/D (length to diameter)ratio other than 2. Elastic properties testing (modulusof elasticity and Poisson's ratio) in compression werenot performed at early ages due to low strength lev-els. An extensometer-compressometer frame wasused to obtain 90-day core elastic properties, andepoxied strain gages were used for 180- and 365-day cores.
Direct tension tests were performed on specimenswith and without construction joints using epoxiedsteel end plates, as in the laboratory mix program.Elastic properties testing was performed on un-jointed specimens drilled at 180 and 365 days usingepoxied strain gages.
28

182 C + 210 FA121 C + 26 9 FA 182C+210FA 121 C + 269 FA
X 0 X
3800 2 4 6 8 10 12 14 16 18 20
PERMEABILITY (K x 10-4 ft/yr)
Mix Average temperature, Diffusivity,No. of ft2/h
L-1 71 0.060L-1 86 .064L-1 120 .061L-1 193 .049
L-2 70 .059L-2 87 .056L-2 120 .057L-2 195 .047
L-3 73 .067L-3 93 .067L-3 118 .057L-3 189 .048
'L-3 95 .059'L-3 186 .048
500 156 C + 344 FA
480
'".0
I-~ 460I-z0U::I:
~ 440
>-...Jl1..
+I- 420zLU:::i:wu
-t 129 C + 286 FA
400
0 Lab Mix I (as tested}=14.5 X 10⁻⁴ ft/yr.@ Lab Mix 1 (estimated @ 4000 Ib/in2)=9.0 X 10-4 ft/yrX Lab Mix 2 (as tested @ 4000 Ib/in2) =18.8 X 10⁻⁴ ft/yr
Lab Mix 2 (as tested @ 4000 Ib/in2) =13.5 X 10⁻⁴ ft/yr
+ Lab Mix 3 (estimated @ 4000 Ib/in2}=4.0 X 10-4 ft/yr0 Lab Mix 4 (as tested @ 4000 Ib/in2}=3.06 X 10-4ft/yr0 Lab Mix 5 (as tested @ 4000 Ib/in2}=1.47 X 10-4 ft/yr
Figure 24. - Laboratory mix program, cementitious materials content versus permeability, RCC.
Table 18. - Laboratory mix program - diffusivity summary - RCC.
1 Laboratory mix with sand from Moon and White aggregatesource.
Compression and tension tests were performed sim-ilarly for horizontally drilled cores of facing concreteand RCC and are reported separately.
Static cohesion and coefficient of internal frictionwere determined for intact construction joints fromshear break bond tests; sliding friction tests werethen conducted on sheared joints. Test procedureswere identical to those used for laboratory test spec-imens. A general equation for shear was determinedfor joints at specific ages where three or more breakbond tests were performed; otherwise, a sliding fric-tion equation was determined. Tests were performedon joints from both horizontally and vertically drilledcores. Test specimens were obtained from horizon-tally drilled cores by drilling 3-inch-diameter coresperpendicular to the construction joints.
Coefficient of thermal expansion was determined us-ing 2- by 2- by 4-inch specimens saw cut from coresand saturated prior to testing. Test procedures areidentical to those in the laboratory mix program.
The unit weight of hardened concrete specimens wasdetermined by immersion in water to calculate thedisplaced volume.
29

.07
.068
.066
.064 0
.062
.r:;
N'+'I-
.06 0
>-~ .~
rn::>t: .0~60"CI
.0~4
.~2
.~
.048
.046150 90 110
T=AVERAGE TEMPERATURE (OF)
70
0
130 I~O 170 190 210
Figure 25. - Laboratory mix program, diffusivity mix L-l, RCC.
Compression, tension, unit weight, and thermal ex-pansion tests were performed on 180- and 365-dayhorizontally drilled cores of facing concrete. The pri-mary mix design, utilizing 50 percent fly ash by vol-ume of cementitious materials, was used for thefacing concrete and represents the majority of thetest specimens. Two facing elements were con-structed using a mix design with 60 percent fly ashby volume of cementitious material, but these ele-ments were not selected for testing because of thedecision that the mix was not suitable for the dam.
Core Test Program Results
Results of compressive strength testing are sum-marized in table 23. Individual test results are givenin tables 24 and 25. The number of tests listed inthe tables refers to compressive strength tests only;both the modulus of elasticity and Poisson's ratio arebased on fewer tests. The average compressivestrength of mix T-3 is higher than mixes T-1and T-2 at all ages. This agrees with data from fieldcontrol cylinders cast during construction of the test
placement and is attributed to the use of 100 percentclean sand in the mix, as opposed to mixes T-1 andT-2, which used silty sands. Since mixes T-1 throughT-3 were based upon laboratory mixes L-1 throughL-3, similar strength relationships between mixesshould have been expected. However, this was notthe case. Mix T-1 showed significantly lowerstrengths than would have been expected from ear-lier laboratory studies. This is attributed to the useof crusher fines which were contaminated with silt.In the laboratory mix program, 60 percent cleancrusher fines were blended with the pit-run sand. Thestrength of the 28-day cores from all three mixes(tested at approximately 50 to 55 days) is higher thananticipated when compared with results from laterages. This is not in agreement with laboratory or fieldcontrol cylinder test results; however, the RCCin thetest placement was initially cured at a higher tem-perature, followed by much cooler temperatures dur-ing the winter months, whereas the laboratory andfield cylinders were cured at 73 OF.No precautionswere taken to prevent the test placement from freez-ing during the winter, and the strength development
30

.01
.068
.066
.064
.082
~"i'+ .06.....
>-~.OM
:>iii:;)
~.0&41 0~0
"a.~4
.082
.~
.048
.04800 10 90
during that period was reduced if not completelystopped.
Correlations between W/C+FA (water to cementplus fly-ash ratio) and strength in both compressionand tension cannot be developed because of the in-accuracy of readings of scale weights at the batchplant. It appears that the water content of mix T-1was increased by the high silt content of the sandand decreased in mix T-3 by the use of clean sand.This conclusion is supported by a decrease instrength of field control cylinders and an increase indrying shrinkage for mix T-1, while the opposite istrue for mix T-3 when each is compared to laboratorytest results.
Test results of modulus of elasticity and Poisson'sratio in compression are given in tables 23 and 24.As with the laboratory mix program, the modulus ofelasticity in compression is lower than what is nor-mally found in conventional concrete. Again, this ismost likely due to the lower modulus of the coarseaggregate. Results of Poisson's ratio fall within the
110
T=AVERAGE TEMPERATURE (OF)
normal ranges of conventional concrete and agreewith laboratory results.
Tensile strength and elastic properties of cores aresummarized in table 23. Individual test results of un-jointed specimens are given in table 25 and jointedspecimens in table 26. The results indicate that mixT-3 has the highest tensile strength which agreeswith laboratory and field specimens. The lack of ten-sile strength development between the 90- and 365-day cores can be at least partially attributed to thelow curing temperature during the winter months.Other factors contributing to poor tensile strengthinclude poor consolidation with inconsistent lift thick-ness and rock pockets due to segregation. Some ofthe horizontal cores drilled parallel to the joints verifythe existence of these conditions. lifts 8 through 11(mix T-3) were particularly deficient in this area. Lateranalysis revealed that this was caused by an increasein the voids content of the coarse aggregate, result-ing in an insufficient volume of mortar in the mix de-sign. Test results of elastic properties in tension arelimited; however, they compare favorably with lab-
0
I~ Ito150 110 210
Figure 26. - Laboratory mix program, diffusivity mix L-2, RCC.
31

.062
.c",'.. .06...
.07
.068
0
.066
.064
" ~............
............
>-t: .058>Cf)::>it .0560
"C!
'T
.054
.052
.05
.048
.04650 90 110
T=AVERAGE TEMPERATURE (OF)
70
0::. Mix 3A Clear Creek sand
+ =Mix 38 Moon White sand
............
" ~
"
130 150 170 190 210
Figure 27. - Laboratory mix program, diffusivity mix L-3, RCC.
oratory results in both modulus of elasticity and Pois-son's ratio.
The results of tensile strength testing of constructionjoints are given in table 26. These results are widelyscattered and show no conclusive trends in bondstrength development of the three mixes used in thetest placement. Almost all of the joints that testedat strengths less than 50 Ibjin2 either were visiblydirty or had poor consolidation at the joint. A fewspecimens broke outside the joint area through rockpockets or areas of poor consolidation. Commentson tests of construction joints are given in table 26.
Table 27 summarizes the percentage of intact jointsat each drillingage. The table includes the estimatedtime between the placement of each lift. Joints whichwere exposed only a few hours before the next liftwas placed are considered fresh or "plastic" joints.Although the results are not consistent, the bondingof all these joints (1-2,3-4,5-6,7-8, and 9-10) ex-ceed 50 percent at 180 days, and each of these jointshad at least one drilling age with a minimum of 70
percent of the joints bonded. The percentage of in-tact joints where the lift exposure was overnight orgreater varies considerably. Two construction joints,4-5 and 10-11, showed virtually no bond. Construc-tion records indicate that considerable vehicle trafficoccurred on lift 4 while it was fresh, thereby dis-turbing the surface. Cleanup operations did not ad-equately remove the debris generated, and the poorsurface condition could account for the lack of bond-ing. Rain occurred during the placing of lifts 10 and11, saturating the surface of lift 10 and bringing anexcess layer of paste to the surface. In addition, inalmostall cores, voids were visible in the bottomquarter of lift 11, possibly due to poor consolidationand the fact that the specified 12-inch lift thicknesswas exceeded. These conditions all contributed tothe lack of bond development.
The results of tension tests reveal a number of con-ditions which significantly affect the bond potentialof RCC. These include:
1. Cleanliness of the joint
32

u+- --- --- - -- r----- -_.~
L- f-
I--I I/- 50"
RH@
3 days
-- - -- -- -- --- -- --- --- - -- -- - I---
t
MIX L-j
--- -- - 1--PROJECT Central Utah
--- FEATURE Upper Stillwater Dam
- - -- ---SPECIMEN SIZE 4 X 4 X 30
-\---- TYPE OF CURE 3-day fog/50% RH Dry
- I-- - f--- -- -- -- -- -- t-
9-~n--t--\
- -- -- ---
=~I_.. ...-..= =~--'0, I
- '- -::..:- --- --.--- -- 1--- 1-- --- - ----f---. r-°-- 0- -0 0 0 0
- ---- -- -- --c--
- - 1- u- - 1---- -- ,----- +--- -- - - 1---
--- I-n- 1-- -- ---
_nI-- ----" ,-.-- --- - -
- 1--- - f--- ,- ,-- 1--- -- ---- - -- -- --In - --- -- I---
I./
_50 RH @ 120 days M2-117
-- -
"--
f---JI
""'- -- ,::? i1--- - -- 1--- -- -
501. RH@28days \ MI X L- 2
----- -- c-- -- --- -- 1--- --
PROJECT Centro I Utah---r-
\"2-115/116 1 --- FEATUREUpper Stillwater Dam
--SPECIMEN SIZE
~f----,---
\ '"TYPE OF CURE Fog/50 RH
iI
-- t--- - -- -- -- - --j-- -- r----- -T
I I X " II i_I-t-
'"-..
-+~ "--.... -- - - -,-
------ i
-----I-- --
I t----x--- I--- --I I,
I I--
--
2. Mortar content of the mix design
3. The time expired between lift placements
4. Precipitation during placement and rolling
5. Lift thickness
6. The degree of compaction achieved by theroller
In all cases, cleanliness of the joint is required forjoint bonding. The other conditions are interrelatedin their contribution to joint bond potential. The mor-tar content of the RCC mix should be sufficient to fillthe voids in the coarse aggregate and to migrate
,~ 200
0
- 300
w~
~ 400
ir~ ~O:)
~Z ~OO
~'00
down to the lower construction joint. This requiresa mortar content greater than the minimum voidscontent of the aggregate. Test results indicate thatthe shortest time interval between the placement oflifts' of RCC produces the best joint, provided thatthe exposed joint is not heavily disturbed by vehiculartraffic. If the time interval exceeds the plastic con-dition, an increase in the mortar or paste content willbe required to achieve bonding. If significant precip-itation occurs during placement of a lift of RCC, workshould be suspended. The vibrating roller causespaste to migrate to the surface which combines withthe excess water, producing a weakened plane oflaitance. This is probably the only situation wherelaitance will occur in RCC. Test results indicate thata lift thickness in excess of 12 inches should beavoided. The compactive effort of vibrating rollers is
20 40 60 80 100 120 140 160 180 200 2202"0 260 280 300 320 340 360 380 400 420 440 4.0 .80 '00 ~20 ~40 ~.o S80 600 620 6.0 .'0
AGE (days)
LENGTH CHANGE TESTS
Figure 28. - Laboratory mix program, length change mix L-', RCC.
'00
~ 200
'0~ 300
w~~
~ ~oo
~~ 500~z
~600
700
.00
20 40 60 10 100 120 ."0160 180 200 220 240 280 280 300 320 340 3&0 310 400 420
"",0 48°480 500 520 540 5'0 510 600 620 840 ..0
AGE (days) OR DAYS DRYINGLENGTH CHANGE TESTS
Figure 29. - Laboratory mix program, length change mix L-2, RCC.
33

Age in daysLength change, inches x 10-6
or daysMixes'
drying 3L-1-3 3L-2-0 L-2-28 L-2-121 4L-3-0 L-3-28 L-3-111
7 -230 +10 -45 -85 +50 -70 -8014 -325 +20 -95 -185 +85 -160 -15528 -425 +10 -250 -295 +75 -280 -26060 -515 +5 -500 -445 +105 -395 -39090 -540 +35 -560 -530 +150 -450 -460
120 -550 +55 -580 -595 +170 -480 -505180 -560 +55 -600 -665 +185 -530 -555240 -570 +55 -615 -705 +200 -550 -570270 -570 +65 -625 -715 +200 -555 -565365 -575 +65 -655 -735 +200 -555 -565455 -580 +70 -655 -745 +200 -560 -565
Age in daysLength change, inches x 10-6
or daysMixes'
drying 2T-1-0 T-1-14 T-1-92 3T-2-0 T-2-14 T-2-90 4T-3-0 T-3-14 T-3-90
7 0 -340 -95 0 -135 -60 0 -130 -9514 0 -510 -255 0 -270 -120 -10 -230 -14528 -15 -815 -525 -5 '-400 -190 -40 -320 -19060 +10 -960 -800 -35 -475 -270 -60 -410 -25090 +20 -995 -905 -40 -495 -295 -60 -440 -270
120 +50 -1005 -965 -55 -500 -310 -75 -460 -280180 +65 -1020 -1005 -65 -510 -320 -100 -470 -295240 +100 -1030 -1005 -50 -515 -330 -50 -480 -300270 +110 -1030 -1065 -50 -515 - -60 -480 -365 - - - - - - - - -
Table 19. - Laboratory mix program - length change summary - RCC.
Specimen designation:1 Last number in mix designation refers to age that specimen was removed from fog room and placed at 50 percent relative humidity.
Zero signifies continuously fog-cured specimen.2 L-1 - laboratory mix 13 L-2 - laboratory mix 24 L-3 - laboratory mix 3
Table 20. - Upper Stillwater Dam concrete test placement - length change summary - RCC.
Specimen designations:1 Last number in mix designation refers to age that specimen was removed from fog room and placed at 50 percent relative humidity.
Zero signifies continuously fog-cured specimen.2 T-1 mix 1 - lift 33 T-2 mix 2 - lift 64 T-3 mix 3 - lift 8
34

(Fog (100%)'.
I I I
-+--50% RH Room @ 112do 5
--L \.-1-..r '\" - 50% RH Room i
\@
28 doys'- \
..--
..MIX L-3
- .-.- -PROJECT Centro I Uta h 1-
\ ~FEATUREUpper Stillwater Mi~ Pgm.
...-
"'.... .. .. .-
SPECIMEN SIZE 4 X 4 X 30"---
\"---
TYPE 01" CURE Fog/50o~
-- -- -- " - - """"", t ...-
Tll--.--'
'-.... '-- r--- -- -- --- . j~_..--- -- ..--
-. .. ..
'"-I
-.
I
--.-
_.. ..
n.- - -
-f-- .---..
-
I I I I/50% RH @ 92 days / 100 'Yo RH - -
1/ , ~--l~ ~-......
~\ MIX T-I(
50 % RH @ 92 days PROJECT Central Utah
( FEATUREUpper Sti Ilwater DamSPECIMENSIZE 4 X 4 X 30
~TYPEOF CURE Fog /50 % R H
\~50
% RH after \14 days ,\
\ \\~" " ""'-0.
')
'x ~'''''''...x-~0
20 40 60 80 100 120 140 I~. 180 X~ZZo-24~6~80-300l8l-3Z0 340 36
~ 600
:.::: 200
.~~ 300w
"~ 400
~
~ 500
"Z
100 120 140 160 180 200 220 240 260 210 300 320 340 360 380 400 420 440 480 410 '00 520 '40540 580 600 620 640 660
AGE (days) OR DAYS DRYINGLENGTH CHANGE TESTS
Figure 30. - Laboratory mix program, length change mix L-3, RCC.
200
0
0
100
100
":.::::.<:: 200
4l>0
><~ 300
W<9
~ 400
Z
CI::
Vi 500
<9Z;: 600CI::0
700
800
AGE (days) OR DAYS DRYING
LENGTH CHANGE TESTS
Figure 31. - Test placement length change mix T-1, Ree.
35

-I
I I
,/ Fog (100% RH)
I 1,90 Days Fo'g Cure~J, ~I~ /50% RHafter 90 days MIX T-2
r ~~IContinuous Fog ure (100%RH) -- -~50% RH after ~"'r
.PROJECTCentral Utah
14 days ~FEATUREUpper Stillwater RCC~SPECIMENSJZE 4 X 4 X 30 -
\ " ~TYPE OF C'UR£ Fog /50 %
""'"--
\I.....
~""'X- .V '>iV
X - - -
200
100
0
100
c:
"200
.!::
'"0~300w<.:>
~ 400ZQ:::I:<J) 500
<9z
~ 6000
700
800
0 60 80 14012010020 40 160 180 220 360260 280 300200 240 320 340
AGE (days) OR DAYS DRYING
LENGTH CHANGE TESTS
Figure32. - Test placement length change mix T-2, RCC.
difficult to estimate because it will be different forRCC mixes with different ranges of workability. How-ever, it is essential that full consolidation be achievedto assure bond and prevent seepage between lifts.
A considerable amount of research is still needed toevaluate the parameters which govern the degree ofcompaction achieved and the ability to develop bondbetween lifts of RCC.Grouting following constructionmay fillvoids in a dam and decrease the permeabilityof the structure, but it is doubtful that it would restorebond.
A summary of shear and sliding friction tests for thecore program is given in table 28. As with the tensilestrength of RCC, the shear strength can also be in-fluenced by the condition and treatment of the jointand degree of compaction achieved. Though surfaceroughness contributes to shear strength, it is prob-ably not a significant factor for the higher strengthlevels required. A clean joint, with fully consolidatedRCC, is still essential.
Smooth, clean laboratory specimens show almostdouble the shear strength of core specimens at equalages under the same normal loads.
Compressive and tensile strength tests also wereperformed on horizontally drilled cores. The resultsof these tests are given in tables 29 and 30, re-spectively.
Facing Concrete
The mix designs for facing concrete used at the testsection are given in table 22. The primary mix designutilized a fly ash percentage of 50 percent by volumeof cementitious materials. A second mix, utilizing 60percent fly ash by volume of cementitious materials,was evaluated but found to be unacceptable. Theresults of compressive and tensile strength testingof the facing concrete from horizontally drilled coresare given in tables 31 and 32.
TEST SECTION-FIELD TEST PROGRAM
Tests were performed on both fresh and hardenedconcrete samples obtained from the RCC test sec-tion. Fresh concrete tests included unit weight, aircontent and slump for facing concrete, and Vebe time(for workability) and unit weight for RCC. Concrete
36

Figure 33 Test placement length change mix T -3, RCC.
Figure 34. -View of Upper Stillwater Dam RCC test placement. Sequence of RCC construction showing concrete beingdumped by an end dump truck, spread by a dozer, and compacted by a vibratory roller. P801-D-80873
37

-<18
-=t"" foelngelemeflts (See Note I) ':=:."~t~/=-;~
I
~,~----~~".~-'==_E
~.~ R\t: - .'CO
"'f
F-I "0_. 0L~~-
r-;-7~!.. -c-~;D
'"
--~- (-1'0
-'"
,0
~ /.. 71D,-
--~_<J Stortil1'1black
"':'
,',,,
-"'~~~~IOb
,
":'II I'
I i! !{1
L-t]' ,
.1- In!
"3; - 37 49'0 38
'
::028d69
lJ.1;-iilSI OZ~
613/~ 61~ r
O~6 -J~g"l! I;:Roller comacted c08crete
-- OJO~, "lalC./ It I I I
.D'~~: ,6" ~'~6:'[' ,~q ",,:;g,~!" :
~~,:~8,~~,~~-=-===-~"~";:':X~:_==--I
=~W J.-<J8
PLANSECTION B-B
wex> I
, ,I
~ ;::Ace", Nm"NOTES
I HonllJntol dnll hO/H,drilled thr'Jughthe downstreamface, ore srown in the downstream faCing element5 of
ttoeplonvlelll2. HOff/ontol drill holes. drilled thrMgh the upstream face.
Qrl! ShOwn In Section A-A
It,88YS TIlth. SAfETV'-Sine slOb 5tortmg block
OEP./fT",CNT OFrHI'
''''':RIO''BuflCAUOFRCCLAiIIATION
CENTRAL UTAH PROJCCTBONNCV/~LC UNIT - UTAH
SECTION A -A UPPER STILLWATER DAMCONCRETE TEST PLACEMENT AND
DRILL HOLE LOCATIONS
_'CCMN'CAc'P"'"O",L---_'i"t1<;~__'U8"''''O_-
CMC<OCO n
Figure 35. - Concrete test placement and drill hole locations-

Mix No. T-1 T-2 T-3Lift No. 1-3 4-7 8-11
Weight, Volume. Weight, Volume. Weight. Volume,Ib ft3 Ib ft3 Ib ft3
-Air 1.0% 0.27 1.0% 0.27 1.0% 0.27Water (W) 182 2.92 159 2.55 157 2.52Cement (C) 182 .91 111 .56 118 .59Fly ash (FA) 204 1.36 258 1.73 275 1.84Fine aggregate:
Pit run 432 2.84 - - - -Crushed talus 654 3.99 333 2.03 - -ASTM: C 33 - - 833 5.18 1.132 7.04
Coarse aggregate: 2,282 14.71 2,279 14.69 2,287 14.74No.4 - 1112inch - - -
Total 3,936 27.00 3.973 27.00 3,969 27.00
W (percent weight) 0.47 0.43 0.40C + FA
FA (percent C+FA volume)60 75 76
Theoretical density (lb/ft3)145.78 147.14 147.0
Mix T-4 Mix T-5
Weight, Volume. Weight. Volume,Ib ft3 Ib ft3
Air 3.6% 0.97 1.6% 0.44Water (W) 212 3.40 272 3.57Cement (C) 369 1.85 317 1.59Fly ash (FA) 277 1.85 357 2.38Fine aggregate 1.398 8.70 1.433 8.92Coarse aggregate 1,585 10.23 1.568 10.10
- -
Total 3,841 27.00 3.947 27.00
W (percent weight) 0.33 0.40C + FA
FA (percent C+FA volume) 50 60
Density (lb/ft3) 142.25 148.60
C+FA (lb) 646 674
Slump (in) 112 3/8
Table 21. - Upper Stillwater Dam concrete test placement - RCC mix design summaries.
Table 22. - Upper Stillwater Dam concrete test placement - RCC mix designs - facing concrete.
39

a. Photo PSO1-D-SOS74.
b. Photo PBO1-D-BOB75.
Figure 36.. -Typical concrete cores extracted from Upper Stillwater Dam, RCC test place-ment.
40

c. Photo P801-D-80876
Figure 36. -Typical concrete cores extracted from Upper Sti/1water Dam, RCC test placement-Continued.
Table 23. -Upper Stillwater Dam concrete test placement core program -average strength and elastic properties summary -RCC
Age atdrilling.days
Compressivestrength,
Ib/in2
Averageage at
I test, I
days I
No.
of
tests
Modulus of
elasticity,Ib/iw x 106
Poisson'
ratio.
in/in
Averageage at
test,
days
Tensile
strength,Ib/in2
No.
of
tests
Modulus of
elasticity,Ib/in2 x 106
Poisson's
ratio,
in/in
64155274457
9899
142148
6154
0.14.23.16
89178173138
5325
.10
.171.741.79
213199224234
2359
3.21
2.94
.19
.12
41
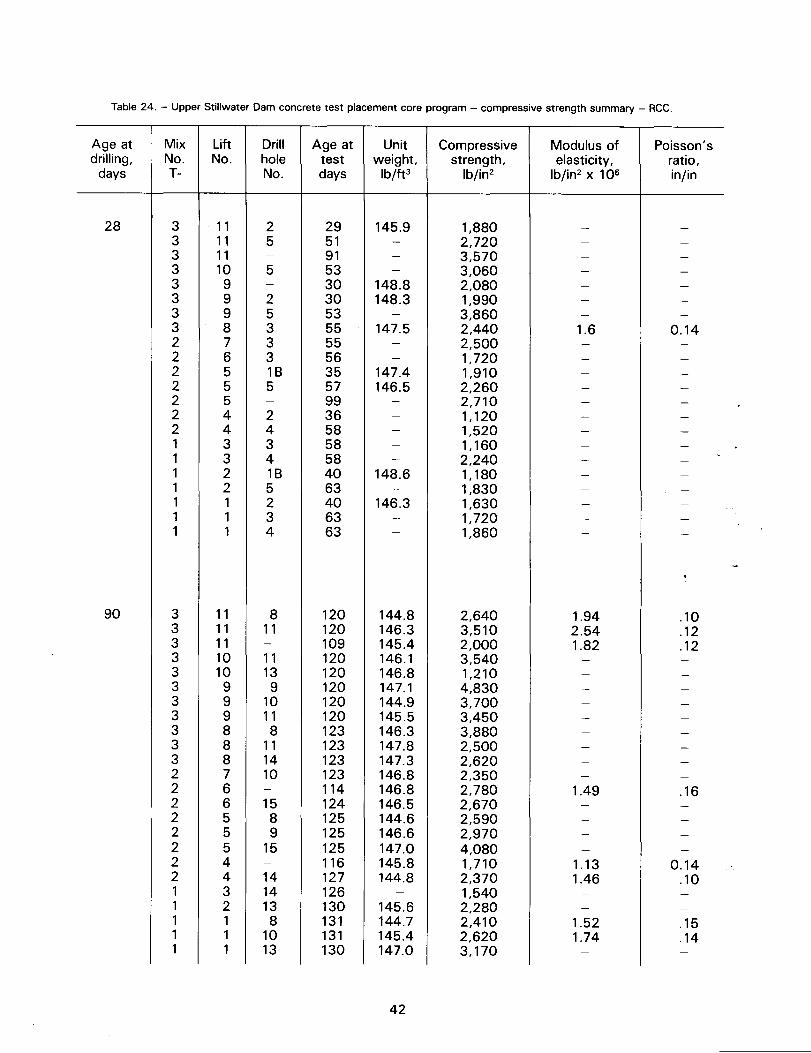
Age at Mix Lift Drill Age at Unit Compressive Modulus of Poisson'sdrilling, No. No. hole test weight, strength, elasticity, ratio,
days T- No. days Ib/ft3 Ib/in2 Ib/in2 x 106 in/in
28 3 11 2 29 145.9 1,880 - -3 11 5 51 - 2,720 - -3 11 - 91 - 3,570 - -3 10 5 53 - 3,060 - -3 9 - 30 148.8 2,080 - -3 9 2 30 148.3 1,990 - -3 9 5 53 - 3,860 - -3 8 3 55 147.5 2.440 1.6 0.142 7 3 55 - 2,500 - -2 6 3 56 - 1,720 - -2 5 18 35 147.4 1,910 - -2 5 5 57 146.5 2,260 - -2 5 - 99 - 2,710 - -2 4 2 36 - 1,120 - -2 4 4 58 - 1,520 - -1 3 3 58 - 1,160 - -1 3 4 58 2,240 -- - -1 2 18 40 148.6 1,180 - -1 2 5 63 - 1,830 - -1 1 2 40 146.3 1,630 - -1 1 3 63 - 1,720 - -1 1 4 63 - 1,860 - -
.
90 3 11 8 120 144.8 2,640 1.94 .103 11 11 120 146.3 3,510 2.54 .123 11 - 109 145.4 2,000 1.82 .123 10 11 120 146.1 3,540 - -3 10 13 120 146.8 1,210 - -3 9 9 120 147.1 4,830 - -3 9 10 120 144.9 3,700 - -3 9 11 120 145.5 3.450 - -3 8 8 123 146.3 3,880 - -3 8 11 123 147.8 2,500 - -3 8 14 123 147.3 2,620 - -2 7 10 123 146.8 2,350 - -2 6 - 114 146.8 2,780 1.49 .162 6 15 124 146.5 2,670 - -2 5 8 125 144.6 2,590 - -2 5 9 125 146.6 2,970 - -2 5 15 125 147.0 4,080 - -2 4 - 116 145.8 1,710 1.13 0.142 4 14 127 144.8 2,370 1.46 .101 3 14 126 - 1,540 - -1 2 13 130 145.6 2,280 - -1 1 8 131 144.7 2.410 1.52 .151 1 10 131 145.4 2,620 1.74 .141 1 13 130 147.0 3,170 - -
Table 24. - Upper Stillwater Dam concrete test placement core program - compressive strength summary - RGG.
42

Age at Mix Lift Drill Age at Unit Compressive Modulus of Poisson'sdrilling, No. No. hole test weight, strength, elasticity, ratio,
days T- No. days Ib/ft3 Ib/in2 Ib/in2 x 106 in/in
180 3 11 23 232 - 2.490 1.98 -3 11 19 232 - 3,690 - -3 11 27 239 147.7 4,070 2.72 .113 10 23 234 - 3,650 - -3 10 24 240 144.0 1,900 - -3 8 25 246 149.2 2,870 - -3 8 22 243 144.9 3,200 - -2 6 28 269 148.4 3,130 - -2 5 19 245 144.8 3,110 - -2 4 26 271 147.0 2,220 1.28 .122 4 28 271 145.4 2,570 1.60 .062 4 20 261 150.1 3,580 - -1 2 19 272 145.3 3,050 3.68 .331 1 20 262 147.0 2.460 1.39 .181 1 19 262 146.1 2,610 4.08 .251 1 26 215 146.0 2,880 1.95 .17
365 3 11 46 438 146.7 4,670 2.45 .153 11 45 435 146.7 4,240 2.43 .143 11 42 438 146.22 4,270 2.17 .153 11 39 435 145.8 2,870 2.04 .193 10 43 436 140.6 3,040 - -3 8 44 442 149.5 2,740 1.54 .272 5 39 441 144.8 3,100 1.44 .182 4 44 451 147.4 2,810 1.42 .132 4 40 451 147.0 3,340 1.48 .151 3 41 457 146.6 2,630 1.27 .161 1 43 460 147.7 3,250 - -1 1 40 455 146.7 2,850 1.27 .16
I
Table 24. - Upper Stillwater Dam concrete test placement core program - compressive strength summary - RCC -Continued.
test cylinders were cast for strength and elastic prop-erties. Drying-shrinkage bars were also cast withRCC, and the results are given in the drying shrinkagesection.
The test results of specimens can only be consideredan estimate of actual RCC properties because of thevariations in the batching, mixing, and handling of theRCCand facing concrete. The variations primarily re-sulted from the use of equipment which did not meetspecified tolerances and accuracy. The results werefurther complicated because test batches for eachmix were taken from different lifts for testing at dif-ferent ages, which was necessary because of thedifficulty and time required to cast a large number ofthe cylinders from one batch. Batch-to-batch con-sistency was not sufficient to establish acceptablestrength development relationships for each mix.
Tests were performed on the cylinders from the testsection to determine the compressive strength, ten-sile strength, and elastic properties of RCC. The testcylinders were cast in the same manner as in thelaboratory program.
Results of field cylinders tests of RCC are given intable 33. Values of modulus of elasticity and Pois-son's ratios are computed from stress-strain curvesand are based on an average of two or three tests.All of the 180-day field test cylinders experiencedsome drying during transportation to the Denver lab-oratories. These tests are between 5 and 20 percenthigher than saturated tests would yield, particularlymix T-3, which experienced the most drying.
The results of strength tests from the test placementfield cylinder program agree with the core test re-sults, but again differ from the laboratory program.
43

Table 25. -Upper Stillwater Dam concrete test placement core program -tensile strength summary -RCC.
MixNo.T-
Lift
No.
DrillholeNo.
Age attestdays
Unit
weight,Ib/ft3
Compressivestrength,
Ib/iw
Modulus ofelasticity,
Ib/in2 x 106
Poisson'sratio,in/in
Age atdrilling,
days
28 33322222111111
1111
876554322111
56996060345960606340674064
110
165260
884842
1131081341361095397
11779
145.0
144.5
146.2
~
90 3332221111
14161415171215131515
24,
20
14
18
19,
15
9
12
4
7
~~
986543111
~
-
33333322211111
111111
99854433211
288235239243
246245271258261295265275275
146142
148147146147146146146146144145145
216274244292
94
171175188
*88.185155
94
4.342.592.71
1.701.77
2.021.91
0.19
.08
.11
.14
.08
333333333
435435438439436439442439442
146.6145.7
146.2148.6148.1148.7147.6148.2
267204260274264322144167200
3.21
3.40
3.64
2.382.682.30
0.1311111010
99888
.09
18
.06
.17
.11
.Failure occurred between testing plate and specimen.
44
86O31953O9
O994459987
.8
.0
.4
.3
.4
.1
.12
.8
.32
.1
.7
.6
.6

Modulus ofelasticity,
Ib/iw x 106
Poisson'sratio,in/in
Age attestdays
.10
20
450441450456451451460460455
154.6146.4146.5150.4147.0
5
18
18
10
16
12
16
17
12
1.70
1.88
1.80
2.10
2.56
2.20
.20
.14148.5148.4146.2
.15
20
RCC,Table 26. -Upper Stillwater Dam concrete test placement core program -construction joint tensile strength summary
Drill
hole
No.
Tensile
strength,Ib/in2
Comments on break
12352746176
111020
41184514
Partly on jointc;joor consolidation at breakI F
On joint
Broken in lift 3
90 10-910-910-9
8-78-78-77-67-66-56-54-33-23-23-2
1912072061631698175
132844895795623
On joint
2-12-1
11
*4660
45
55253O587
B
B
6O7897539O2

Age at Mix Construction Drill Age at Unit Tensiledrilling, No. joint hole test, weight, strength, Comments on break
days T- No. No. days Ibjft3 Ibjin2
180 3 10-9 25 243 147.5 1653 10-9 22 - 145.8 -3 10-9 20 - 146.9 -3 9-8 24 236 147.8 51 Dirty joint3 9-8 23 236 148.3 22 Poorly consolidated joint3-2 8-7 23 237 - 1333-2 8-7 19 232 - 109 Fifty percent broken aggregate
voids at break3-2 8-7 21 232 - 126 Some broken aggregate3-2 8-7 24 - 147.2 -3-2 8-7 27 - 147.6 -2 7-6 22 255 148.2 182 7-6 24 239 147.1 79 Clumps of dirt - wood on joint2 7-6 19 232 - 121 Poor consolidation - dirty joint2 7-6 25 258 147.6 852 6-5 21 238 - 1152 6-5 22 256 - 752 6-5 23 238 147.6 30 Voids at joint - dirty joint2 6-5 27 240 149.6 39 Loose sand on joint2 6-5 20 259 - 752-1 4-3 19 268 146.1 832-1 4-3 22 258 146.1 1272-1 4-3 21 268 144.8 1021 3-2 26 271 145.9 1271 3-2 28 271 146.8 941 2-1 21 272 - 1191 2-1 22 262 145.9 66
365 3 10-9 46 439 147.4 2533-2 8-7 39 439 149.0 124 On joint3-2 8-7 45 439 148.2 117 Dirty joint2 7-6 41 439 147.6 12 Very poor consolidation2 6-5 40 450 145.6 83 Ten to 15 percent broken
aggregate - poor consolidation2 6-5 44 450 146.8 43 Twenty percent broken aggregate
- poor consolidation2 6-5 45 441 147.1 70 Dirty joint2-1 4-3 42 451 146.2 65 Broken in lift 3 - poor consolidation2-1 4-3 45 456 146.7 97 Twenty-five percent through joint1 3-2 40 451 146.1 98 Poor consolidation1 3-2 44 451 145.1 110 Seventy-five percent broken
aggregate1 3-2 45 456 147.2 132 In lift 31 2-1 41 460 147.4 102 Through joint1 2-1 46 455 145.6 115 Ten percent broken aggregate
Table 26. - Upper Stillwater Dam concrete test placement core program - construction joint tensile strength summary - RCC -Continued.
. Shock-loaded.
46
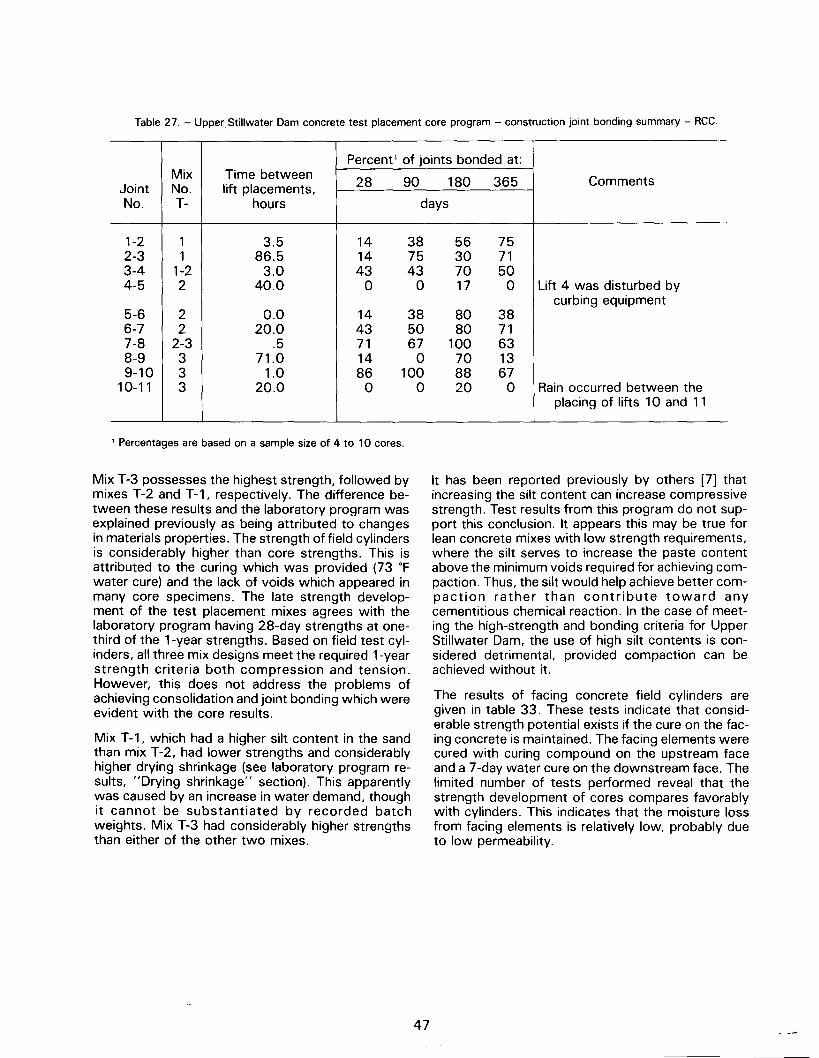
Percent' of joints bonded at:Mix Time between 28 90 180 365 CommentsJoint No. lift placements,
No. T- hours days
1-2 1 3.5 14 38 56 752-3 1 86.5 14 75 30 713-4 1-2 3.0 43 43 70 504-5 2 40.0 0 0 17 0 Lift 4 was disturbed by
curbing equipment5-6 2 0.0 14 38 80 386-7 2 20.0 43 50 80 717-8 2-3 .5 71 67 100 638-9 3 71.0 14 0 70 139-10 3 1.0 86 100 88 67
10-11 3 20.0 0 0 20 0 Rain occurred between theplacing of lifts 10 and 11
Table 27. - UpperStiliwater Dam concrete test placement core program - construction joint bonding summary - RCC.
1 Percentages are based on a sample size of 4 to 10 cores.
Mix T-3 possesses the highest strength, followed bymixes T-2 and T-1, respectively. The difference be-tween these results and the laboratory program wasexplained previously as being attributed to changesin materials properties. The strength of field cylindersis considerably higher than core strengths. This isattributed to the curing which was provided (73 ofwater cure) and the lack of voids which appeared inmany core specimens. The late strength develop-ment of the test placement mixes agrees with thelaboratory program having 28-day strengths at one-third of the 1-year strengths. Based on field test cyl-inders, all three mix designs meet the required 1-yearstrength criteria both compression and tension.However, this does not address the problems ofachieving consolidation and joint bonding which wereevident with the core results.
Mix T-1, which had a higher silt content in the sandthan mix T-2, had lower strengths and considerablyhigher drying shrinkage (see laboratory program re-sults, "Drying shrinkage" section). This apparentlywas caused by an increase in water demand, thoughit cannot be substantiated by recorded batchweights. Mix T-3 had considerably higher strengthsthan either of the other two mixes.
It has been reported previously by others [7] thatincreasing the silt content can increase compressivestrength. Test results from this program do not sup-port this conclusion. It appears this may be true forlean concrete mixes with low strength requirements,where the silt serves to increase the paste contentabove the minimum voids required for achieving com-paction. Thus, the silt would help achieve better com-paction rather than contribute toward anycementitious chemical reaction. In the case of meet-ing the high-strength and bonding criteria for UpperStillwater Dam, the use of high silt contents is con-sidered detrimental, provided compaction can beachieved without it.
The results of facing concrete field cylinders aregiven in table 33. These tests indicate that consid-erable strength potential exists if the cure on the fac-ing concrete is maintained. The facing elements werecured with curing compound on the upstream faceand a 7-day water cure on the downstream face. Thelimited number of tests performed reveal that thestrength development of cores compares favorablywith cylinders. This indicates that the moisture lossfrom facing elements is relatively low, probably dueto low permeability.
47
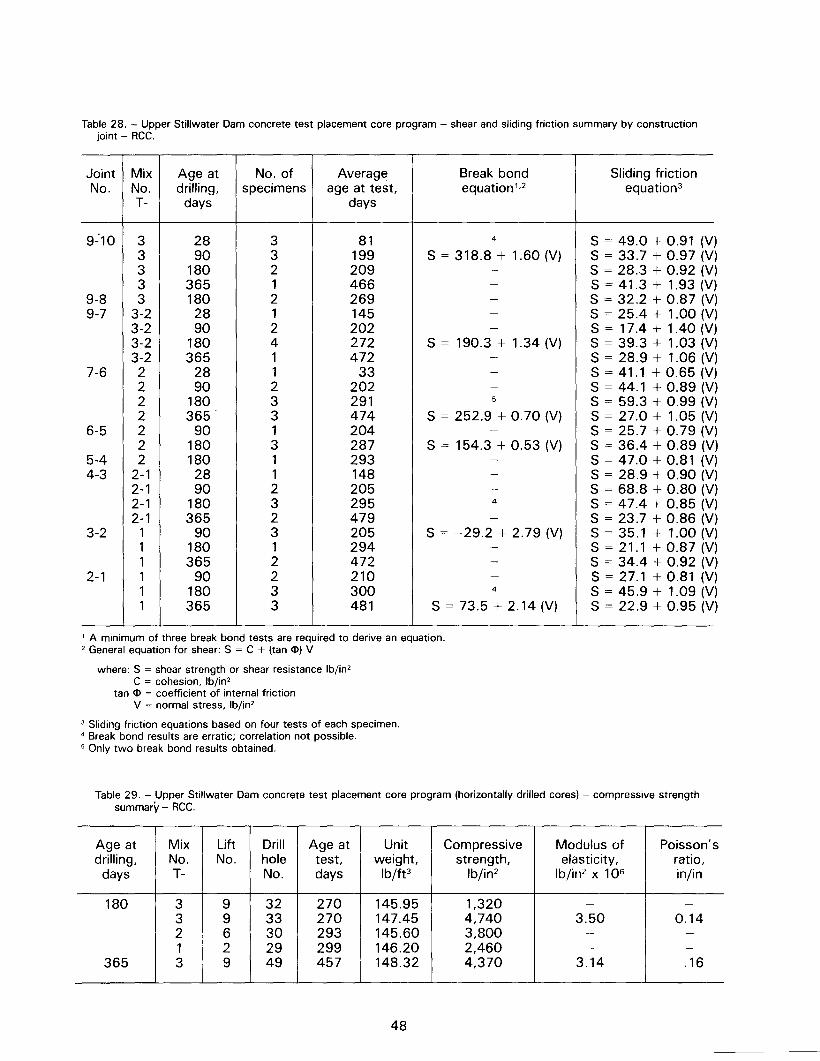
Joint Mix Age at No. of Average Break bond Sliding frictionNo. No. drilling, specimens age at test, equation 1.2 equation3
T- days days
9-'10 3 28 3 81 4 S = 49.0 + 0.91 (V3 90 3 199 S = 318.8 + 1.60 (V) S = 33.7 + 0.97 (V3 180 2 209 - S = 28.3 + 0.92 (V3 365 1 466 - S = 41.3 + 1.93 (V
9-8 3 180 2 269 - S = 32.2 + 0.87 (V9-7 3-2 28 1 145 - S = 25.4 + 1.00 (V
3-2 90 2 202 - S = 17.4 + 1.40 (V3-2 180 4 272 S = 190.3 + 1.34 (V) S = 39.3 + 1.03 (V3-2 365 1 472 - S = 28.9 + 1.06 (V
7-6 2 28 1 33 - S = 41.1 + 0.65 (V2 90 2 202 - S = 44.1 + 0.89 (V2 180 3 291 5 S = 59.3 + 0.99 (V2 365 3 474 S = 252.9 + 0.70 (V) S = 27.0 + 1.05 (V
6-5 2 90 1 204 - S = 25.7 + 0.79 (V2 180 3 287 S = 154.3 + 0.53 (V) S = 36.4 + 0.89 (V
5-4 2 180 1 293 - S = 47.0 + 0.81 (V4-3 2-1 28 1 148 - S = 28.9 + 0.90 (V
2-1 90 2 205 - S = 68.8 + 0.80 (V2-1 180 3 295 4 S = 47.4 + 0.85 (V2-1 365 2 479 - S = 23.7 + 0.86 (V
3-2 1 90 3 205 S = -29.2 + 2.79 (V) S = 35. 1 + 1.00 (V1 180 1 294 - S = 21. 1 + 0.87 (V1 365 2 472 - S = 34.4 + 0.92 (V
2-1 1 90 2 210 - S = 27.1 + 0.81 (V1 180 3 300 4 S = 45.9 + 1.09 (V1 365 3 481 S = 73.5 + 2.14 (V) S = 22.9 + 0.95 (V
Age at Mix Lift Drill Age at Unit Compressive Modulus of Poisson'sdrilling, No. No. hole test, weight strength, elasticity, ratio,
days T- No. days Ib/ft3 Ib/in2 Ib/in2 x 106 in/in
180 3 9 32 270 145.95 1,320 - -3 9 33 270 147.45 4,740 3.50 0.142 6 30 293 145.60 3,800 - -
1 2 29 299 146.20 2,460 - -365 3 9 49 457 148.32 4,370 3.14 .16
Table 28. - Upper Stillwater Dam concrete test placement core program - shear and sliding friction summary by constructionjoint - RCC.
))))))))))))))))))))))))))
1 A minimum of three break bond tests are required to derive an equation.2 General equation for shear: S = C + (tan <1»V
where: S = shear strength or shear resistance Ib/in2C = cohesion, Ib/in2
tan <1>= coefficient of internal frictionV = normal stress, Ib/in2
3 Sliding friction equations based on four tests of each specimen.4 Break bond results are erratic; correlation not possible.5 Only two break bond results obtained.
Table 29. - Upper Stillwater Dam concrete test placement core program (horizontally drilled cores) - compressive strengthsummary - RCC.
48

Age at Mix Lift Drill Age at Unit Tensile Modulus of Poisson'sdrilling, No. No. hole test, weight, strength, elasticity, ratio,
days T- No. days Ib/ft3 Ib/in2 Ib/in2 x 106 in/in
180 3 11-10 35 269 146.11 233 - -3 10-9 34 270 144.36 236 - -3 9 32 270 145.99 128 - -3 9 33 270 147.98 371 - -3 9 37 270 146.08 177 - -2 6 30 293 144.80 225 - -
365 3 9 49 457 147.99 352 3.72 0.143 9 48 457 146.58 333 3.71 .14
Age at Element Drill Age at Unit Compressive Modulus of Poisson'sdrilling, No.' hole test, weight, strength, elasticity, ratio,
days No. days Ib/ft3 Ib/in2 Ib/in2 x 106 in/in
90 21-u.s. 17 132 144.50 6,430 - -
180 5-u.s. 30 - 147.00 - - -10-d.s. 37 280 141.95 6.710 3.24 -
48-d.s. 36 281 142.01 5,330 3.17 -
8-d.s. 38 281 145.25 6,700 - -365 9-u.s. 48 461 146.92 8,810 - -
7-u.s. 48 461 142.27 57,290 3.60 0.1810-d.s. 49 462 143.28 6,920 - -
Table 30. - Upper Stillwater Day concrete test placement core program (horizontally drilled cores) - tensile strengthsummary - RCC.
Table 31. - Upper Stillwater Dam concrete test placement core program - compressive strength summary - facing concrete.
1 Elements No.5 and 6 contain 40:60 cement to fly-ash ratio; all others contain a 50:50 ratio.2 u.s. = upstream.3 Sample is taken from a diagonal drill hole; all others are horizontal drill holes.4 d.s. = downstream.5 Sample was vacuum saturated prior to testing.
49

Age at Element Drill Age at Unit Tensile Modulus of Poisson'sdrilling, No.' hole test, weight, strength, elasticity, ratio,
days No. days Ib/ft3 Ib/in2 Ib/in2 x 106 in/in
180 29 -u.s. 34 273 148.02 501 4.86 0.179 -u.s. 35 273 147.72 504 4.57 .157 -u.s. 32 274 142.26 433 4.17 .167 -u.s. 31 274 147.24 436 4.81 .175 -u.s. 30 - 144.90 - - -3 -u.s. 29 296 145.20 504 4.64 -
310 -d.s. 38 280 145.50 416 4.69 -10-8 -d.s. 33 273 145.05 395 4.59 .17
8 -d.s. 37 281 140.92 361 3.98 -8 -d.s. 38 281 144.16 372 5.12 -
365 7 -u.s. 47 461 143.02 4467 4.13 .1710 -d.s. 49 462 143.93 510 4.21 .13
8 -d.s. 49 462 140.17 488 - -8 -d.s. 49 462 141.62 4450 4.30 .17
Table 32. - Upper Stillwater Dam concrete test placement core program - tensile strength summary - facing concrete.
1 Elements No.5 and 6 contain a 40:60 cement to fly ash ratio; all others contain a 50:50 ratio.2 u.s. = upstream.3 d.s. = downstream.4 Sample was vacuum saturated prior to testing.
50

Mix Average Compressive No. Modulus of Poisson's Tensile No. Modulus of Poisson'sNo. age at strength, of elasticity, ratio, strength, of elasticity, ratio,T- test, days Ib/in2 tests Ib/in2 x 106 in/in Ib/in2 tests Ib/in2 x 106 in/in
1 28 1,590 8 - - 155 3 - -1 90 2,240 6 - - - - - -1 180 '3,940 3 1.72 0.13 210 3 1.88 -1 365 4,350 2 1.59 .16 215 3 2.05 0.112 28 1,370 9 - - 105 2 - -2 90 2,170 6 - - - - - -2 188 '4,120 3 1.50 .17 220 3 1.45 -2 365 4,490 3 1.62 - 215 2 - -3 28 2,210 8 - - 130 3 - -3 90 3,780 6 2.10 .15 270 2 2.87 .153 210 '7,430 4 2.45 - 350 3 4.14 -3 365 7,005 2 3.23 .16 400 2 3.80 .13
4 1 520 64 2 1,170 34 7 3,010 74 28 4,430 164 90 6,500 24 180 7,700 14 365 6,200 15 1 350 25 2 905 25 7 - 25 28 3,860 5
Table 33. - Upper Stillwater Dam concrete test placement - average strength and elastic properties summary - field cylindertest program.
Roller compacted concrete
Facing concrete
1 Test specimens experienced drying during transportation.
51

BIBLIOGRAPHY[1] Raphael, Jerome M., "The Optimum Gravity
Dam," In Rapid Construction of Concrete Dams,Proceedings, Engineering Research Conference,March 1-5,1970, ASCE, New York, NY, pp. 221-247,1971.
[2] Cannon, R. W.. "Compaction of Mass ConcreteWith Vibratory Roller," Journal ACI, Proceedingsvol. 71, No. 10, pp. 506-513, October 1974.
[3] Dunstan, M.R.H., "Rolled Concrete for Dams,"CIRA(Concrete Industry Research and InformationAssociation), Report 90, Technical Note 105 and106, 1981.
[4] Schrader, E. K., "The First Concrete Gravity DamDesigned and Builtfor RollerCompacted Concrete
Construction Methods," Concrete International:Concrete & Construction, vol. 4, No. 10, pp. 15-24, ACI, Detroit, Michigan, October 1982.
[5] Johnson, H. A., and P. C. Chao, "RollercreteUsage at Tarbella Dam," Concrete International:Design & Construction, vol. 1, No. 11, pp. 20-33,ACt Detroit, Michigan,November 1979.
[6] Neville, A. M., Properties of Concrete, 3d ed.,pp. 363-364, Pitman Publishing Inc., Massachu-setts, 1981.
[7] Schrader, E. K., "Concrete Report - WillowCreek Dam," U.S. Army Corps of Engineers, WallaWalla District, Washington, p. 37, July 1983.
52

APPENDIX A
UPPER STILLWATER DAM
RCC TEST PLACEMENT - CONSTRUCTION
53


APPENDIX A
UPPER STILLWATER DAM
RCC TEST PLACEMENT - CONSTRUCTION
The Upper Stillwater Dam RCC test placement was constructed in August of 1981. The purpose of thetest placement was to evaluate construction methods and equipment proposed for the dam and to gatheradditional information on mix designs for facing concrete and RCC. The 100-foot long, 11-foot high testplacement was constructed with a cross section equivalent to the upper 11 feet of the dam in the spillwaysection. This 15-foot wide cross section will be widened to 30 feet in the dam to facilitate access forconstruction equipment. The test placement, shown on figure 35*, consists of five vertical upstream facingelements, five "stairstepped" downstream facing elements placed on a 0.6 to 1.0 slope, and 11 lifts ofRCC. The test placement was constructed on an RCC leveling slab or "base slab" which was placed onbedrock and varied in thickness from 1 to 5 feet. One of the major objectives of the test placement wasthe evaluation of the laser-controlled, slipform paving machine used to construct the upstream and down-stream facing elements of the dam. Of particular concern were (1) how well the laser could control alinement,(2) could the facing elements be placed on top of each other, and (3) could bond between elements beachieved? Cracking of the elements was not a concern at this time, as this problem could be handled bycontrolling where the crackipg could occur, or by allowing the cracking to take place and grouting whererequired.
Construction of the test placement consisted of slipforming the upstream and downstream facing elementsfollowed by two 1-foot-thick lifts of RCC. This sequence of placing was followed to completion. Thefacingelements were placed with a laser guided slipform paver supplied with concrete from a transit mixer. TheRCCwas mixed by a small pugmill at the batch plant. Placement of the RCCwas accomplished by transportingthe concrete in end dump trucks, dumping and spreading initially by a dozer and then a motor grader, andcompaction by a smooth drum vibratory roller. Due to the size of the test placement, use of the motorgrader was eliminated, and leveling of RCC was accomplished with a small dozer equipped with lasers tocontrol lift thickness. The test placement was instrumented with thermocouples for the measurement oftemperature rise of RCC for 1 year. The construction of the test placement is described on figures 1Athrough 17A.
Quality control procedures at the test placement consisted of monitoring batch weights of materials, ob-servation of the number of roller passes made by the roller, control of lift thickness and alinement of facingelements, performing unit-weight and consistency tests of fresh concrete, and casting the test specimensfor hardened concrete testing.
Equipment and Procedures Used in Test Placement
The equipment used for the construction of the test placement was typical of that which might be foundon a highway construction project.
Concrete aggregate was manufactured from sandstone talus material removed from the left abutment ofthe dam. Selective borrow from the talus deposit was accomplished by using a Caterpillar 988C rubber-tired front-end loader to move the oversize boulders aside and haul the usable material to the crusher. Thisloader worked very well for the short haul distance between the deposit and the crusher. However, thesolid bucket created a problem in that it picked up and transported a large amount of fine material, silt,clay, and organic substance, which contaminated the crusher fines which were to be used for sand. Thisproblem could have been alleviated by the use of a slotted rock bucket which would have allowed thedeleterious material to pass through the bucket and be left in place. A 42- by 32-inch Cedar Rapids jawcrusher was used as the primary crusher. The secondary crusher was a Symons cone which reduced all ofthe rock to a size smaller than 1fa-inches. This crushing operation generated approximately 0.2 ton of sandper ton of talus rock handled. A vibrating screen was used to separate the coarse aggregate from the sand.Conveyors transported the materials from the screen to the stockpiles.
.Figure 35 is located with the main text of this report.
55

A rubber-tired front-end loader was used to transport sand and coarse aggregate from the stockpiles tothe RCC batcher bins mounted above the batch plant. The RCC batch plant was a 10 yd3 capacity Ross"Rustler" portable batcher. A swivel chute at the end of the discharge conveyor allowed dry concreteingredients to be directed to the transit mixers for conventional concrete or to the pugmill for RCC.
Conventional concrete for the upstream and downstream facing concrete was mixed in two 8 yd3 Challengemixers. Even though the mixers were new and the mixing and discharging bins were clean, these mixerswere not capable of discharging the low slump concrete (% to 1-inch slump) required by the slipform facingelement machine. The very slow delivery of concrete from the transit mixer to the slipform machine causedconsiderable repair and undesirable hand finishing of the facing elements.
The upstream and downstream facing elements were placed using a Gomaco Commander IIISlipform CurbingMachine. The forms for the upstream and downstream facing were designed by the Bureau and built bythe Gomaco Corporation. These forms were quite large containing approximately 6 ft3 per linear foot oftravel in the downstream face and 4 ft3 per linear foot in the upstream face. It appears that these formsshould be moving continuously to reduce tearing of the concrete surface. Each form had four 3-inch diameterimmersion vibrators fastened inside the forms. Each vibrator was separately controlled for vibration fre-quency. Location of these vibrators is critical to the density of the concrete and surface finish.
When RCC was mixed, the swivel chute on the batch plant was directed to a conveyor belt which fed theRCC mixer. This mixer was a Model S-60 Heatherington-Burner 180 ton per hour, 8,000-pound capacitypugmill. The pugmill was a horizontal tub, twin paddle, with a sliding bottom dump gate. The mechanicalcondition of the pugmill would allow only 1.75 yd3 of RCC to be mixed. This batch size was effectivelymixed in the pugmill mixer. This batch weight was approximately 7,000 Ib, 1,000 Ib less than the mixercapacity. The pugmill was evidently designed to mix asphaltic concrete.
The RCC was transported from the mixer to the test placement in two 10 yd3 capacity end dump trucks.These trucks handled the RCC with only minor segregation when dumped. However, the trucks were notcapable of spreading the RCC as it was deposited. The truck driver was inexperienced, making it difficultto ascertain whether the dumping difficulties were caused by the driver, the dump box, or the consistencyof the mix. ".
The RCCwas deposited in one large pile and spread to the desired thickness. The first spreader used wasa Caterpillar 14E, rubber-tired motor grader. In addition to being too large for the small section, the rubbertires compacted the RCC causing the roller to bridge, restricting the ability to consolidate the RCC betweenthe tire tracks.
The second spreader used was a Caterpillar 06 track-mounted dozer. This piece of equipment worked quitewell but was much too large. Finally,the contractor furnished a Caterpillar 03 track-mounted dozer to spreadthe RCC. This piece of equipment worked quite well.
Lineand grade of facing elements were controlled with a Blount Instrument's class IIIBlaser-guidance system.Two of these instruments were used, one for line and one for grade.
Two laser receivers were mounted on each end of the dozer blade to control the lift thickness of the RCC.Over and under indicators were mounted in view of the operator, and he controlled the blade height manually.This system was quite effective after the dozer operator became confident in the use of equipment.
Four laser receivers were mounted on the slipform machine, two for line and two for grade. The electric-hydraulic hookup offered complete laser control of the machine. The operator was only required to ensurethat a steady supply of concrete was available in the form. Again, after the operator gained confidence inthe use of the lasers, the equipment worked quite well.
A 10-ton Raygo 404B smooth drum vibrating roller was used to compact the RCC. This was a single drumroller with rubber tires for guidance. This type of roller was probably capable of adequately compacting theRCCmixture used in the test section. However, due to operator difficulties. it was not possible to completelyevaluate the roller, because we were unable to determine the number of roller passes required to compactthe RCC. No definite pattern was ever established for rolling the RCC. Indication of inadequate compactionand thick lifts were noted in the core samples taken from the test section.
No concerted effort was made to clean construction joints, and only an occasional attempt was made athigh-pressure water blasting some joints. A model 002815729 Giant/Bosch water blaster was used inthese attempts.
56

Figure 1 A. -Laser transmitter used for line and grade Icontrol of slipform paving machine for upstream anddownstream facing elements. PBO1-D-BOB77
Figure 2A. -Laser receivers mounted on slipform paverfor line and grade control of the facing elements.P801-D-80878
Figure 3A. -Vertical upstream facing element beingplaced by laser controlled slipform paving machine.Note laser receivers for line .and grade controlmounted on slipform paver. PSO1-D-SOS79
Figure 4A. -Completed vertical upstream facing ele-ment placed by laser controlled slipform paving ma-chine. P801-D-80880
57

Figure 5A. -Downstream facing element being placed by laser controlled slipform paving machine. P801-D-80881
Figure 6A. -Three-foot-high upstream and downstream facing elements in place prior to placing two l-foot-thick liftsof RCC. Facing elements serve as forms for RCC. P801-D-80882
58

Figure 7 A. -Pugmill mixing and depositing RCC into end dump truck. P801-D-80883
Figure SA. -RCC being deposited by end dump truck. Dozer is spreading RCC;note laser control on dozer. PSO1-D-SOSS4
59

:igure 9A Dozer initially used for spreading RCC. P801-D-80885
Figure 1 OA. -Motor grader with laser controls initially used for spreading RCC to final lift thickness. This was discontinueddue to the size of the work area and precompaction of loose RCC by tires of grader. P801-D-80886
60

Figure 11 A. -Dozer used for spreading RCC to final grade prior to compaction.Note laser receivers mounted on blade to control lift thickness. P801-D-80887
Figure 12A. -Laser controls installed on dozer to control lift thickness of RCC. P801-D-8088~
61

Figure 13A. -Smooth drum vibrating roller used for compaction of RCC. Note that roller is capable of operating adjacentto facing elements. PBO1-D-BOBB9
Figure 14A. -Smooth drum vibrating roller making second pass over RCC. P801-D-80890
62

Figure 15A. -First lift of RCC after compaction by vibrating roller. P801-D-80891
Figure 16A. -Vertical upstream face of test placement. Slipform paver is placing the final upstream facing element.P801-D-80892
63

Figure 17 A. -Stairstepped downstream face of test placement. The stairstep design will be used in the dam spillwaysection for energy dissipation. P801-D-80893
64

APPENDIX B
UPPER STILLWATER DAM
LABORATORY MIX PROGRAM
ADDITIONAL STUDIES
65

.'

APPENDIX B
UPPER STILLWATER DAM
LABORATORY MIX PROGRAM
ADDITIONAL STUDIES
Early Strength Studies
As discussed in the laboratory mix design program, the adiabatic temperature rise tests indicate that verylittle heat is generated during the initial 24 to 36 hours after mixing. In an effort to evaluate the early strengthgaining potential of RCC under different ambient conditions, a study was conducted to determine thecompressive strength under 50 of, 73 of, and adiabatic curing temperatures. Test specimens from mix L-3, cast in plastic molds, were sealed and placed in temperature-controlled calorimeter rooms. Two roomswere maintained at 50 of and 73 of, respectively, while a third room began at 50 of (the specified placingtemperature for the dam) and was adjusted up to 87 of in accordance with adiabatic curve established formix L-3 with an ASTM type A WRA (fig. 21 )*. Tests were performed at 2, 3, 7, 14, and 28 days' age.The results of this test program are shown in table 1B and on figure 1B. No tests could be performed at1 day due to the low strength of the RCC.
The 73 OFcure produces the highest early strengths, followed by the adiabatic and 50 of cure. The adiabaticcure produces the higher strengths, beginning at an age of 5 to 6 days. The 50 of cure produces a veryslow strength gain through 28 days, amounting to only 30 percent of adiabatic 28-day strength. It is verydifficult to establish what temperature cycle the RCC will be subjected to, depending on the work scheduleproposed by the contractor for the dam. It is expected that during spring and fall, the RCCmay be subjectedto ambient temperatures less than 50 of until the lift is insulated by lifts placed above it. Following thisperiod, the adiabatic condition will be maintained. If an exposed lift of fresh RCC is cooled overnight. thereexists the potential to actually begin the adiabatic condition at a lower starting temperature which wouldfurther lower the early strength. This may not be considered detrimental to the RCC due to the possiblereduction in thermal cracking in the dam.
Preliminary Studies - Accelerated Strength Testing of RCC with High Replacement of Fly Ash
One major concern of quality control of RCC is the larger volume of concrete placed during the time it takesto perform standard 28-day strength tests of concrete. It is estimated that as much as 300,000 cubic yardsof RCC could be in place before the first 28-day cylinder is tested. In order to estimate the strength gaining
Table 1B. - Laboratory mix L-3 - effect of curing temperatureon compressive strength development - Upper StillwaterDam - RCC.
Temperaturecondition
Compressive strength, Ibjin2
Age (days)7 143 282
Adiabatic73 OF
50 of
73 OF
280 445 960 1,705 3,095825 1,160 ' 1.785
100 250 525 820 1,080350 1,110 21,620
1 Actual test mix2 Laboratory mix program
.Figure 21 is located with the main text of this report.
67

Age, Compressive 1-day accelerated strength, 2-day accelerated strength, 3-day accelerated strength,Batch days strength, percent of percent of percent of
Ib/in2'7-day 28-day 90-day 7-day 28-day 90 day 7 -day 28-day 9O-day
strength strength strength strength strength strength strength strength strength
21 1 620 66.0 36.7 18.92 1420 151.1 84.0 43.33 1975 210.1 116.9 60.2
7 94028 169090 3280
32 1 560 56.6 29.0 12.82 1760 177.8 91.2 40.33 2820 284.8 146.1 64.5
7 99028 193090 4370
33 1 460 57.5 27.4 12.52 1510 188.8 89.9 41.13 2325 290.6 138.4 63.4
7 80028 168090 3670
Aver-age 60.0 31.0 14.7 172.6 88.4 41.6 261.8 133.8 62.7
potential of RCC and make quicker batching adjustment, accelerated strength curing of concrete is required.Three such methods have been proposed: (1) warm water curing (95 OF)for 24 hours, (2) boiling watercuring for 3% hours, and (3) autogenous curing for 48 hours. These three methods do not readily apply forthe mix designs developed for Upper Stillwater Dam because of the high percentages of fly ash. Preliminarytests with mortar cubes indicated that sufficient strength gain did not develop under a 95 of warm watercure. This would also apply for an autogenous curing, especially with the 50 of placing temperatures. Therehas been concern expressed over the use of boiled water curing with fly ash, due to high temperaturescausing additional chemical reactions to occur which would not normally occur in the expected curingconditions at the dam.
In an effort to determine the minimum curing temperatures required for accelerated curing, additional testingwas performed at 130 of temperatures. Concrete specimens were cast in plastic molds according to standardprocedures developed in the mix program and sealed prior to curing. Specimens were tested at 1, 2, and3 days under the 130 of cure and at 7, 28, and 90 days under a standard fog-cure. Tests were performedon mix L-3 with laboratory standard fly ash M-6498 and a sample of fly ash from the source used at concretetest placement. The results are summarized in table 2B.
Based on these test results, the compressive strength of accelerated-cured specimens equals the com-pressive strength of 28-day fog-cured specimens at an average age of 54 hours. Though this would besufficient for standard concrete placements with 28-day design strengths, it would probably not be sufficientfor mass concrete placements with 1-year strengths that are approximately three times greater than the28-day strength. If accelerated curing is to be used as a quality control test method, either the curing
Table2B. - Additional studies - accelerated compressive strength testing - Upper Stillwater Dam - RCC.
,Strength based on standard fog cure
2 Mix L-3 - Laboratory standard fly ash - M-64983 Mix L-3 - Western Wyoming fly ash
68

No. of Average Standardreadings wet deviation,
Test density, Ib/ft3Ib/ft3
All tests 26 142.5 2.0Backscatter 9 140.9 2.25
Probe:2-inch depth 1 144.7 -4-inch depth 4 143.6 2.36-inch depth 2 144.3 -8-inch depth 10 142.8 0.8
temperature will haveto be increasedor the age of testing lengthened. A 72-hour cure at 130 of would beconsidered the minimal length of cure. Testing should be performed at temperatures greater than 130 ofto determine if higher strengths can be achieved without affecting the chemical composition of concrete.Additional testing should also be performed to determine the effect of initial placing temperature on theaccelerated strength.
Density of Fresh Concrete - Nuclear Densometer Versus Sand Cone Density
Two possible methods have been proposed to measure the in-place density of RCC: the conventional sandcone density and the nuclear density gage. A small scale test placement was constructed to evaluate thein-place density of RCC using these two test methods. A 4- by 5- by 1-ft RCC slab was constructed in twolifts using a plate vibrator to consolidate the fresh concrete. The fresh concrete density of 144.4 Ib/ft3 wascomputed using the Vebe test. The in-place density was measured at four locations with the nuclear densitygage and in one location with the sand cone (figs. 3B to 6B). Density measurements of drilled cores wereperformed after 28 days' age. The results of nuclear gage tests of this test placement are given in table3B. These results were not adjusted for chemical composition effect, which, due to the silicious compositionof concrete materials, would increase the readings by approximately 2 Ib/ft3.
The sand cone density was found to be in excess of the theoretical maximum density of the RCC. This wascaused by the RCC squeezing into the hole after it was dug causing the volume occupied by the removedconcrete to be reduced. This same problem occurred in sand cone density tests attempted at the UpperStillwater test placement. The average density by nuclear gage tests of the 8-inch depth of 142.8 Ib/ft3was 98.9 percent of Vebe density, 97.3 percent of the theoretical density, and 97.6 percent of the densityof saturated, drilled cores. These results should also be adjusted to account for the differences in densityarising from chemical composition effects of the materials. In the case of the silicious materials used forthe RCC, the nuclear density should be increased 1 to 2 Ib/ft3, thus bringing the density closer to thetheoretical maximum density. The density of the cores is probably slightly higher than the actual densitybecause small voids, which occupy concrete volume, do not show up as volume when the density ismeasured by weight and displaced volume in water. The in-place density of the RCC would probably bebetween 145 and 145.5 Ib/ft3 which would put the density by nuclear gage within 2 percent of the actualdensity. It does not appear that the sand core density is a viable alternative for in-place density, with theexception of a lift which is more than 12 to 18 hours old, when the squeezing will not occur. This, however,would not fit into the construction schedule, nor would it allow the RCC to be further compacted if it didnot meet specification limits. The nuclear gage appears to be the only alternative at this point.
Table 38. - Additional laboratory studies - nuclear densitygage. block No.1 Upper Stillwater Dam - RCC.
69
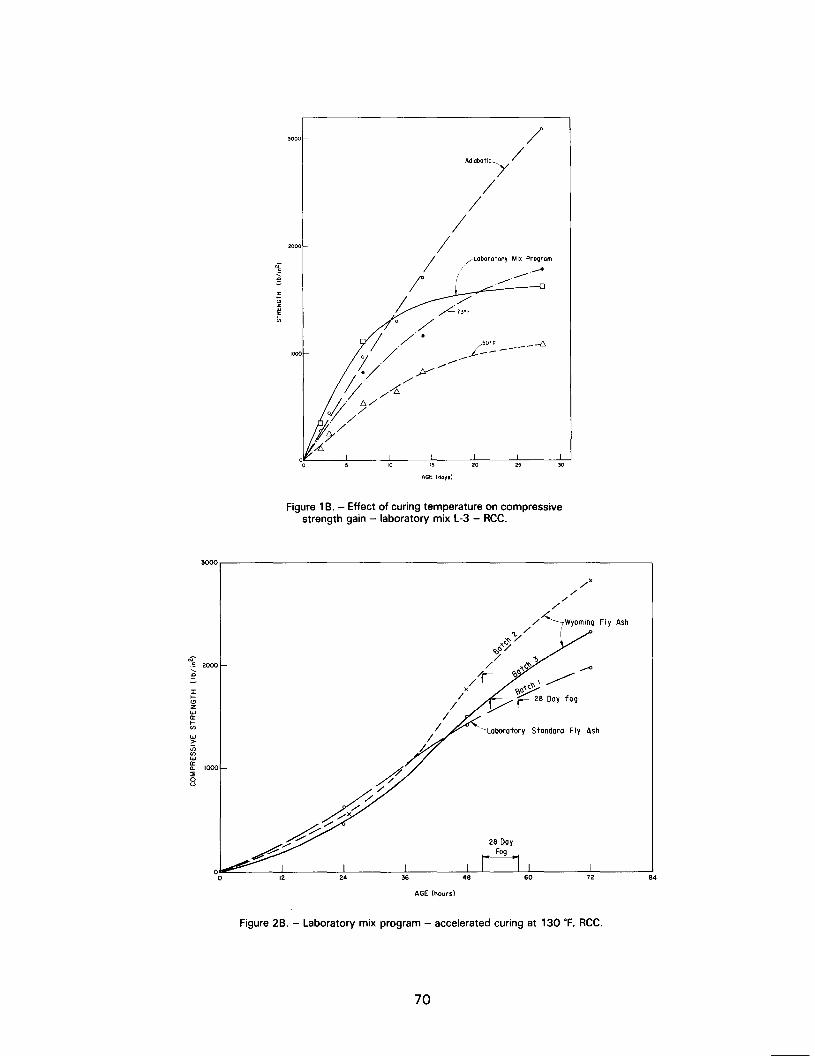
zooo
~~"
to
~~1000
N
~ 2000.0
r....
'"Z
'"a:....VI
'">VIVI
'"g: 1000::E0u
3000
3000 /Ad;'b't;cy /
//
//
//°
~
/Laborotory Mix ProgramI
----( ---..-.
/"~13°'
/'j/ .
/500' <::,7/ ~- --./ pr~
~. /-£,/
~f }/
If;//A':
00
"20 20
'"10
AGE (days)
Figure 1 B. - Effect of curing temperature on compressivestrength gain - laboratory mix L-3 - RCC.
/,X/
//'
/~wYOming.. / i
iJ"/.
",,;/~ ">
/ \~~/""
/r ,<>" ./"'/ ",\./"'x ~
// Vr28DOYf09
//
/L.
~Loborotory Stondord Fly Ash
~/~/
/--:;x~/
~0
0 12 24 36
AGE (hours)
Figure 2B. - Laboratory mix program - accelerated curing at 130 of, RCC.
70
Fly Ash
84

Figure 38. -In-place density measurement of RCC. Guideplate and hole forming device used to drive hole for nucleargage probe. P801-D-80894
Figure 48. -In-place density measurement of RCC. Density reading being taken with the nucleardensity gage. PSO1-D-SOS95
71

Figure 58. -In-place density measurement of RCC.Hole being dug for sand cone density. P801-D-80896
Figure 68. -In-place density measurement of RCC.Density of RCC being measured by sand conemethods. PSO1-D-SOS97
72 *us GOVERNMENT PRINTING OFACE 1991-835-409

Mission of the Bureau of Reclamation
The Bureau of Reclamation of the U.S. Department of the Interior I, responsible for the development and conservation of the Nation 3 water resources in the Western United States.
The Bureau% original purpose "to prorme for the reclamation of arid and semiarid lands in the West" today covers a wide range of interre- lated functions. These include providing municipal and industrial water supplies; hydroelectric power genera tion; irrigation water for agricul- ture; water quality improvement; flood control; river navigation; river regulation and control; fish and wildlife enhancement; outdoor recrea- tion; and research on water-related design, construction, materials, atmospheric management, and wind and solar power.
Bureau programs most frequently are the result of close cooperation with the U.S. Congress, other Federal agencies, States, local govern- ments, academic institutions, water-user organizations, and other concerned groups.
A free pamphlet is available from the Bureau entitled "Publications for Sale." It describes some of the technical publications currently available, their cost, and how to order them. The pamphlet can be obtained upon request from the Bureau of Reclamation, Attn 0-922, P 0 Box 25007, Denver Federal Center, Denver CO 80225-0007.