real-timetoolkit.globus.org/alliance/publications/papers/siamcmt99.pdf · real-time analysis,...
TRANSCRIPT
Real-Time Analysis, Visualization, and Steering of
Microtomography Experiments at Photon Sources
Gregor von Laszewski� Joseph A. Insley� Ian Foster� John Bresnahan�
Carl Kesselmany Mei Suy Marcus Thiebauxy Mark L. Riversz
Steve Wang x Brian Tiemanz Ian McNultyz
Abstract
A new generation of specialized scienti�c instruments called synchrotron lightsources allow the imaging of materials at very �ne scales. However, in contrast toa traditional microscope, interactive use has not previously been possible becauseof the large amounts of data generated and the considerable computation requiredtranslating this data into a useful image. We describe a new software architecturethat uses high-speed networks and supercomputers to enable quasi-real-time and henceinteractive analysis of synchrotron light source data. This architecture uses technologiesprovided by the Globus \computational grid" toolkit to allow dynamic creation of areconstruction pipeline that transfers data from a synchrotron source beamline to apreprocessing station, next to a parallel reconstruction system, and then to multiplevisualization stations. Collaborative analysis tools allow multiple users to control datavisualization. As a result, local and remote scientists can see and discuss preliminaryresults just minutes after data collection starts. The implications for more e�cient useof this scarce resource and for more e�ective science appear tremendous.
1 Introduction
The use of x-rays as a nondestructive tool for investigating the internal structure of materialsat the micron length scale has grown rapidly over the past decade as a result of the advent ofsynchrotron radiation sources. In a typical computed microtomography (CMT) experiment,a sample is illuminated by a colliminated beam of x-rays, and data is collected for multiplesample orientations by using a charge-coupled device (CCD).
A time-consuming reconstruction process is then used to obtain a three-dimensional(3-D) raw data with spatial resolution of as little as 1 �m. The three-dimensional imagecontains quantitative information on the x-ray attenuation coe�cient at a particular x-rayenergy.
The many orders of magnitude increase in brilliance now available at third-generationsources such as the Advanced Photon Source (APS) allows dramatic improvements intemporal resolution and makes it feasible to record fully 3-D, high-resolution tomographicdata on time scales of less than a second per image. This new capability of synchrotronsmakes it possible to perform quasi-real-time 3-D imaging.
�MCS, Argonne National Laboratory, Argonne, IL, http://www.mcs.anl.gov/xrayyUSC/Information Sciences Institute, Marina del Rey, CAzConsortium for Advanced Radiation Sources, The University of Chicago, ILxAPS, Argonne National Laboratory , Argonne, IL
1
2
However, the e�ective use of these capabilities requires the ability to archive, analyze,and visualize the collected data at orders of magnitude more than is currently possible.
This paper describes the innovations in methods, algorithms, and software that allowthis data to be utilized fully by scientists.
The data rates and compute power required to address this Grand Challenge problemare prodigious, easily reaching one gigabit per second and a tera op per second. Weillustrate this statement with a scenario. A 3-D raw data set generated by a typical detectorwill comprise 1000 1024 � 1500 two-byte slices (3 GB); detectors with signi�cantly higherresolutions will soon be available. If we assume current reconstruction techniques andmake fairly optimistic scaling assumptions, reconstruction of this dataset requires about1013 oating-point operations (10 T ops). On a 100 M op/sec workstation, this translatesto 32 hours; on a 1 T op/sec computer, it would take 10 seconds. With current detectortechnologies, this dataset might take 1500 seconds to acquire; however, new detectors willimprove readout times considerably.
We have developed a high-performance parallel implementation of reconstructionalgorithms for microtomographic datasets, based on the �ltered backprojection techniquescurrently used for reconstruction. Filtered backprojection techniques parallelize nicely, inthat each slice in a dataset can be processed independently. Hence, the principal challengeis to develop e�cient techniques for moving data between detector, secondary storage,and computer and for visualizing the results. A general framework has been developedto map the high-performance parallel application in a portable fashion on a grid-enabledenvironment.
The paper is structured as follows: First, we analyze the speci�c requirements of x-raymicrotomography experiments. This includes an exemplary walk-through of an experimentconducted at a beamline. Then, we describe a general framework for processing datagathered during such experiments. The unique characteristics of the experimentationenvironment make it necessary to use distributed and remote resources, as available incomputational grids. We explain the concept of the computational grid and describe howwe implemented our framework with the help of the Globus metacomputing toolkit. Thecapabilities of the resulting analysis environment enable new acquisition and reconstructionstrategies, as introduced next. The details of the collaborative tomography environmentare described in the next section. Finally, we conclude the paper by summarizing ourcontributions to the research community.
2 X-Ray Microtomography Requirements
The design of the computational environment is shaped by an analysis based on therequirements of the x-ray microtomography experiments.
There is a long history of imaging with x-rays. Three-dimensional x-ray imaging(CAT scan) was developed in radiology in the 1960s and 1970s. With the introductionof synchrotron x-ray sources, microtomography is now routinely performed by using hardx-rays at a few �m resolution, while nanotomography has been developed with soft x-raysfor imaging biological[12, 15] and microfabricated objects[10] at 10-100 nm resolution.
A typical computed microtomography (CMT) experiment is structured as follows:
1. Conduct the experiment planning.
2. Prepare the samples and the tomography hardware at the beamline.
3. Perform the data acquisition.
3
4. Choose parameters for the reconstruction.
5. Perform a reconstruction.
(a) Select a reconstruction algorithm.
(b) Perform a preprocessing step, which does normalization and prepares so-calledsinograms[12]
(c) Perform the actual reconstruction.
6. Visualize the reconstructed data.
7. Go to step 4, or, if no parameters can be found, repeat the experiment and go tostep 3.
The traditional usage model to perform these steps features hands-on use and batchprocessing. A major di�culty with current practice is the turnaround time between thedata acquisition and the reconstruction, often due to lack of available computing power.This is especially problematic for synchrotron-based experiments because only a limitedamount of beam time is available for a user. The use of supercomputing power can reducethis turnaround time to a few hours or minutes, as demonstrated at the SC'98 conferencein Florida, allowing the users to view the results in quasi-real time gives the opportunitiesto alter experiment conditions on the y. This capability greatly improves the capabilitiesof a synchrotron radiation facility.
To characterize the experiment requirements more precisely, we identi�ed two operationmodes: (1) the use of an online operation mode as described above and (2) the use of a post-processing mode, which reconstructs the dataset with a varying parameter set. If enoughcomputational power is available, recalculation can also be performed during an experiment.To enable fast processing, the data must be shipped from the acquisition hardware to thecomputer doing the reconstruction, preferably on storage media with fast access. At thesame time it is important to enable an archival service for the experimentalist in order toallow for data recovery in the case of data loss. As pointed out previously, beam time islimited, and the goal for an experimentalist is to achieve the most in this limited time. Afast reconstruction algorithm can be used to help decide whether the current experimenthas to be interrupted prematurely because of an error in the setup. This will allow for anincrease in the number of experiments to be conducted per hour. In order to handle thecomplicated and diverse supercomputing environments, it is essential to provide a simpleinterface giving the beamline experimentalist control over the parameter set, as well as thepossibility to terminate the current calculation at any time.
Besides the requirements driven by the computational aspect of the application,organizational aspects bene�t from the framework introduced in this paper. Because ofthe hazardous and often unpleasant environment, remote operation is desirable. Withremote operation, the facility can maintain a small but well-trained team of beamline sta�experimentalists. This approach o�ers several bene�ts. It reduces the operational and user-speci�c cost and minimizes travel cost to the unique facility. It allows new user groups togain access to a unique facility such as the APS. Furthermore, it increases the access time tothe beamline while minimizing the e�ort required by trained experts to set up experiments.
With the availability of a collaborative and remote steering environment, new user com-munities in commercial and educational facilities are likely to utilize the supercomputing-enhanced light sources in remote fashion. Multiple users at geographically disperse locations
4
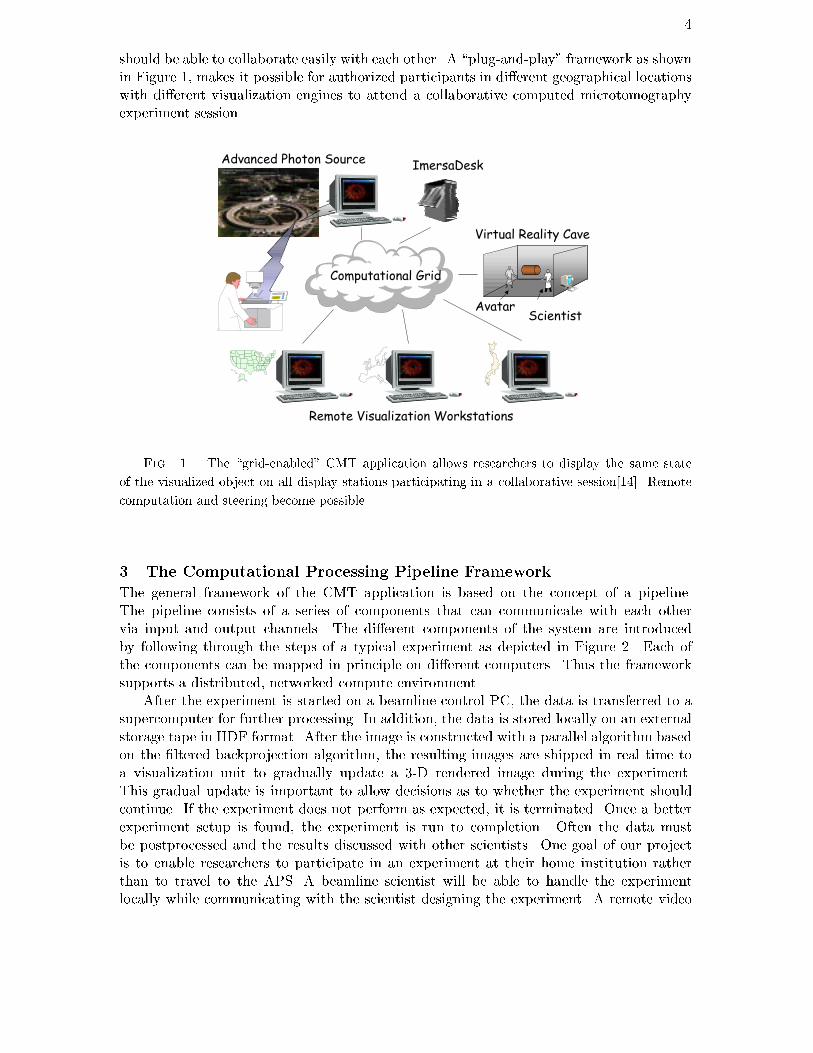
should be able to collaborate easily with each other. A \plug-and-play" framework as shownin Figure 1, makes it possible for authorized participants in di�erent geographical locationswith di�erent visualization engines to attend a collaborative computed microtomographyexperiment session.
&RPSXWDWLRQDO�*ULG
$GYDQFHG�3KRWRQ�6RXUFH ,PHUVD'HVN
5HPRWH�9LVXDOL]DWLRQ�:RUNVWDWLRQV
$YDWDU
9LUWXDO�5HDOLW\�&DYH
6FLHQWLVW
Fig. 1. The \grid-enabled" CMT application allows researchers to display the same state
of the visualized object on all display stations participating in a collaborative session[14]. Remote
computation and steering become possible.
3 The Computational Processing Pipeline Framework
The general framework of the CMT application is based on the concept of a pipeline.The pipeline consists of a series of components that can communicate with each othervia input and output channels. The di�erent components of the system are introducedby following through the steps of a typical experiment as depicted in Figure 2. Each ofthe components can be mapped in principle on di�erent computers. Thus the frameworksupports a distributed, networked compute environment.
After the experiment is started on a beamline control PC, the data is transferred to asupercomputer for further processing. In addition, the data is stored locally on an externalstorage tape in HDF format. After the image is constructed with a parallel algorithm basedon the �ltered backprojection algorithm, the resulting images are shipped in real time toa visualization unit to gradually update a 3-D rendered image during the experiment.This gradual update is important to allow decisions as to whether the experiment shouldcontinue. If the experiment does not perform as expected, it is terminated. Once a betterexperiment setup is found, the experiment is run to completion. Often the data mustbe postprocessed and the results discussed with other scientists. One goal of our projectis to enable researchers to participate in an experiment at their home institution ratherthan to travel to the APS. A beamline scientist will be able to handle the experimentlocally while communicating with the scientist designing the experiment. A remote video

5
conferencing tool allows such collaboration. In addition, the 3-D image analysis toolcontains a control component that enables collaborative visualization on a variety of outputdevices including graphics workstations, ImmersaDesks, and CAVEs, which are describedin a later section. The same capability can be used to achieve real-time computationalsteering of the experiment.
0&6
$36([S�)LOH
,PJ�)LOH,PJ�)LOH,PJ�)LOH
+')�UHDGHU
3UHSURFHVVRU
3WRPR
5HFRQVWUXFWHG'DWD�ILOH
([S�)LOH
,PJ�)LOH,PJ�)LOH,PJ�)LOH
$FTXLVLWLRQ3URJUDP
&RQWURO3URJUDP
&RS\3URJUDP
&RQWURO&RPSXWHU
$FTXLVLWLRQ&RPSXWHU
&07YL]9L]�,GHVN
9L]�:RUNVWDWLRQ
6QDSVKRWWR�:HE
9LGHR6WUHDP
:HE%URZVHU
9L]�:RUNVWDWLRQ
Fig. 2. The details of the processing pipline as used in the SC'98 experiment setup.
The details of this infrastructure will be hidden from the end user, the microtomographyscientist, who will be aware only of the environment as depicted in Figure 1. For this user itis irrelevant where and how the result is achieved, as long as time and accuracy requirementsare met.
In summary, the current selected environment contains the acquisition hardware, a largecompute server to perform the reconstruction in real time, a storage robot for storing thedata for postprocessing, graphic workstations, and an ImmersaDesk (Idesk) or CAVE fordata visualization. The data ow between these compute resources is coordinated via theGlobus metacomputing toolkit. In initial work, the primary compute server for obtainingthe reconstructed images is an Origin2000 with 128 nodes. Nevertheless, we plan to useother compute resources, since the code is portable over a variety of resources. We plan toutilize a computing resource broker to decide which compute resource should be used forexecuting the reconstruction.
4 Grid-Enabled Computing
In the previous section we described a typical experiment needing a lot of resources toenable real-time analysis. Unfortunately, resources, such as
6
� supercomputers, to ful�ll the need for fast compute power,
� storage robots, to ful�l the need for large and persistent storage, and
� high speed networks, to connect the distributed resources
motivate the development of a grid enabled application as described next.The requirements of the CMT applications can be ful�lled with the infrastructure
provided by a computational grid[9]. The term \grid" is chosen in analogy with the electricpower grid, which provides pervasive access to power and, like the computer and a smallnumber of other advances, had a dramatic impact on human capabilities. By providingpervasive, dependable, and consistent access to advanced computational capabilities, theapplication of supercomputing-enhanced CMT algorithms allows the real-time operationmode during a CMT experiment while using nonlocal computational resources to allow fora certain level of quality of service.
17�6HUYHU
'LVN
$FTXLVLWLRQ
7DVN�)DUP
0DWUL[�9ROXPH5HSUHVHQWDWLRQ
���
���
���
&RQWURO3DQHO
9ROXPH�5HQGHULQJ
7LPH�/LQH
:KDW�H[SHULPHQW":KDW�SDUDPHWHUV"
,QIUDVWUXFWXUH4XHVWLRQV
$FWLRQV�DQG�6HUYLFHV
5HWXUQV�D�GHVFULSWLRQRI�WKH�([SHULPHQW�LQ�+')�IRUPDW��
�6HOHFW�WKH�FRPSXWHU�DQG�DQHWZRUN��&UHDWH�PDSSLQJ�EHWZHHQ�WDVNVDQG�SURFHVVHV��3HUIRUP�WKH�FDOFXODWLRQ�IRU�HDFKWDVN�6HOHFW�WKH�WUDQVSRVLWLRQ�DOJ��6WRUH�WKH�UHVXOW�LQ�D�PDWUL[�
:KLFK�FRPSXWH�UHVRXUFHV":KLFK�QHWZRUN�UHVRXUFHV"+RZ�PXFK�PHPRU\"+RZ�PXFK�GLVN�VSDFH":KDW�DOJRULWKPV"
:KDW�SDUDPHWHUV":KDW�GLVSOD\�KDUGZDUH"
'LVSOD\�WKH�YROXPH
3UHSURFHVVLQJ�ZLWKQRUPDOL]DWLRQ�DQG�VLQRJUDP�FUHDWLRQ
:KHUH�WR�GLVSODO\":KHUH�WR�EDFNXS"
5HFRQVWUXFWLRQ 6WRUDJH 9LVXDOL]DWLRQ
&RS\�GDWD�WR�EDFNXSPHGLD
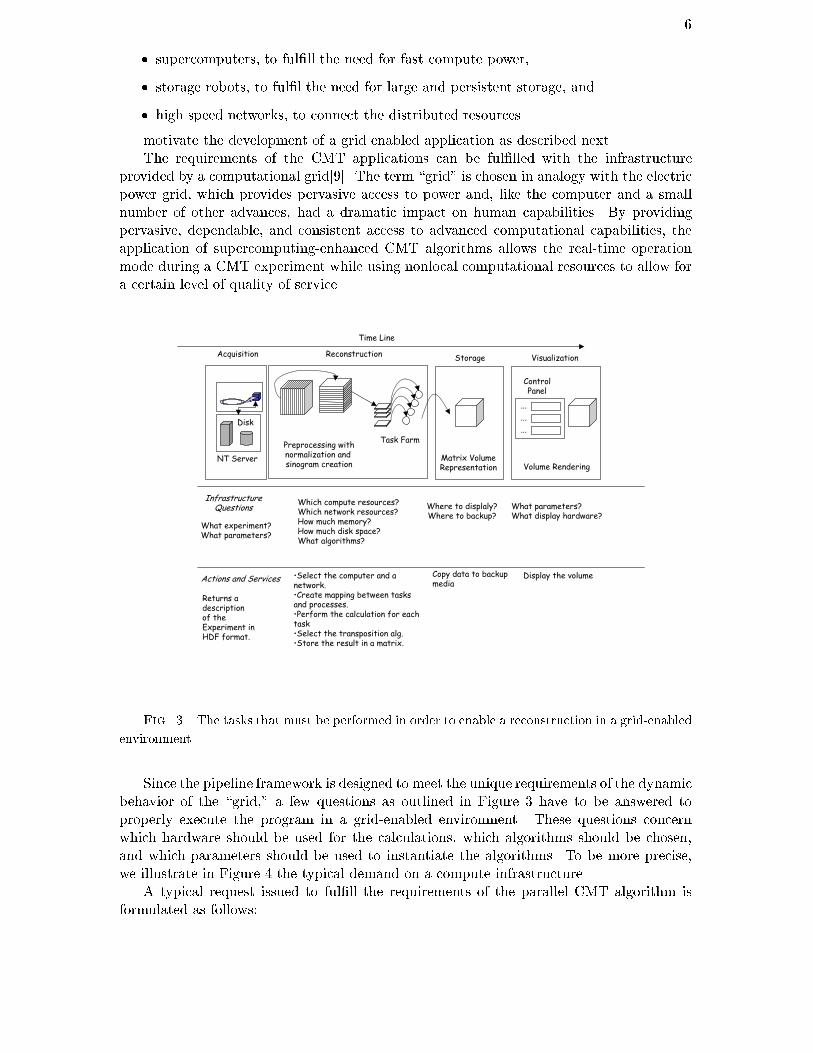
Fig. 3. The tasks that must be performed in order to enable a reconstruction in a grid-enabled
environment.
Since the pipeline framework is designed to meet the unique requirements of the dynamicbehavior of the \grid," a few questions as outlined in Figure 3 have to be answered toproperly execute the program in a grid-enabled environment. These questions concernwhich hardware should be used for the calculations, which algorithms should be chosen,and which parameters should be used to instantiate the algorithms. To be more precise,we illustrate in Figure 4 the typical demand on a compute infrastructure.
A typical request issued to ful�ll the requirements of the parallel CMT algorithm isformulated as follows:

7
´���*IORS�VHF������0E�VHF������PLQXWHV���UHQGHULQJ������*%�VWRUDJHµ
$36EHDPOLQH
DW�$UJRQQH
5HVRXUFH�ORFDWLRQ
5HVRXUFH�DOORFDWLRQ
&RQILJXUDWLRQ
3DUDOOHO�FRPSXWDWLRQ
5HPRWH�,�2
Fig. 4. A selection process of resources to ful�ll the real-time requirements of the parallel
x-ray microtomography program.
To conduct the calculation, I need a compute environment that can perform 10G ops/sec; my data can be sent over a network link that utilizes 20 Mb/sec.The total time to reserve a specialized rendering pipe is 10 minutes for therendering process. I also need 10 GB of storage to store the �nal result.
The Globus metacompiting toolkit provides components or allows for the constructionof components that address the issues typically found in a grid-enabled application, suchas the CMT Grand Challenge: resource location, allocation, resource con�guration, andthe parallel computation and use of remote I/O operations (see left side of Figure 4). Inparticular, the Globus toolkit provides a uniform communication layer, an informationinfrastructure that describes the state of the computational grid environment to supportresource reservation and scheduling, as well as the program submission, �le staging, anduniform program execution. For the CMT application we used the Globus componentslisted in Table 1 and describe their role in the pipeline framework.
Table 1
Globus components used in the CMT application
Component Usage
GRAM Component startupGSI Uniform access to instrument and processing machinesNexus Communication between pipeline componentsGASS Access to remote archived data, storage of processed dataNexus Pipeline controlGASS Executable stagingHBM Monitoring of pipeline status

8
At present, we have not exploited all the features that the processing pipeline allows.These include issues related to the dynamic behavior of the environment, fault tolerance,and process migration.
5 New Acquisition and Reconstruction Strategies
The immediate access to a large amount of compute power allows the use of new acquisitionand reconstruction strategies. Traditionally, data is collected at microtomographicbeamlines at constant angle o�sets: for example, 0, 1, 2, ... degrees if 360 samples are to betaken. In an interactive environment such as we describe here, it becomes attractive insteadto use an interleaved angle list. For example, we may �rst gather images at 60-degree o�sets(0, 60, 120, 180, 240, 300), then collect additional images to provide a 30-degree sampling,and so on until a complete 1- degree dataset is obtained. The advantage of this strategy isthat the reconstruction algorithm can be run repeatedly, once for each more detailed set ofdata; hence, the scientist obtains a series of more re�ned images and may be able to detecta awed experimental setup early in the data collection process.
Another interesting direction that is enabled by the availability of supercomputerresources is the following. In principle, reconstruction quality can be improved byperforming multiple reconstructions with di�erent algorithms and parameter settings. Weare hopeful that the enhanced compute power made accessible by grid environmentswill initiate a new area in the development of reconstruction algorithms for computedmicrotomography and other disciplines.
6 Visualization and Collaborative Tomography Environment
To support the requirements driven by the CMT community, we decided to integrate athree-dimensional visualization tool into the collaboration environment for the structuresreconstructed by the parallel microtomography algorithm. The tool provides fast visual-ization and high resolution, thereby enabling researchers to interact with large datasets inreal time. Moreover, the tool is portable on a variety of display stations and operatingsystems, and its exposed interface is easily used by nonexpert programmers. The resultantgeneral visualization framework can be reused by scientists from di�erent disciplines withsimilar visualization requirements (e.g., computed microtomography, electron microscopy,and astrophysics), as demonstrated at the SC98 Conference in Florida[4].
The tool uses a hardware-optimized volume-rendering [8] library from Silicon Graphicscalled Volumizer. Volumizer takes advantage of hardware-accelerated texture mapping [5],which enables the visualization to be fast enough to allow for real-time interaction. Thisreliance on SGI-speci�c hardware for the rendering does limit the application's portabilitysomewhat, but as we explain later, its usability can be extended beyond the SGI platform.
One of the ways that this tool gives valuable qualitative information about the datasetsthat it renders is by providing insight about the inner structure of the volume. Whiletwo-dimensional tools also allow the user to see the inner structure of the data, they cando so only one slice at a time. Our 3-D tool, on the other hand, allows the user to take across section of the volume and see the inner makeup as it relates to the rest of the overallstructure. Parts of the volume can also be stripped away by isolating only those valuesthat fall within a particular range, making the rest of the volume transparent. In addition,one can also zoom in on a selected range of values to get �ner detail.
As previously mentioned, the size of the datasets generated in these experiments can bequite large. A typical dataset can be on the order of 5123 oating- point values. Currently,
9
even the accelerated graphics hardware used by our application has trouble keeping up withvolumes of this size, and the dataset needs to be subsampled down to 2563 oating-pointvalues in order to maintain its frame rates allowing interactive usage.
The tool can be used in a variety of environments. The one that provides the mostpowerful viewing capability is the immersive, three-dimensional virtual environment knownas the CAVE[6, 7]. The CAVE is a 10 � 10 � 10 foot room with computer-generatedimages projected onto three of the walls and the oor. It uses a stereoscopic, user-centeredperspective to enable the user to see the images in three dimensions. The software can alsobe displayed on a smaller, single-screen display device known as ImmersaDesk. A motion-sensible three-dimensional user interface device, called a wand, allows the user to interactwith and manipulate the data in the CAVE or Idesk. The CAVE and Idesk both rely an SGIworkstation to perform their rendering. Nevertheless, a CAVE simulator, which can be rundirectly on any SGI workstation, eliminates the need for these high-end display devices. Inthe CAVE a control panel equipped with buttons and sliders and other high-level widgetsis used to manipulate the parameters for controlling the volume rendering.
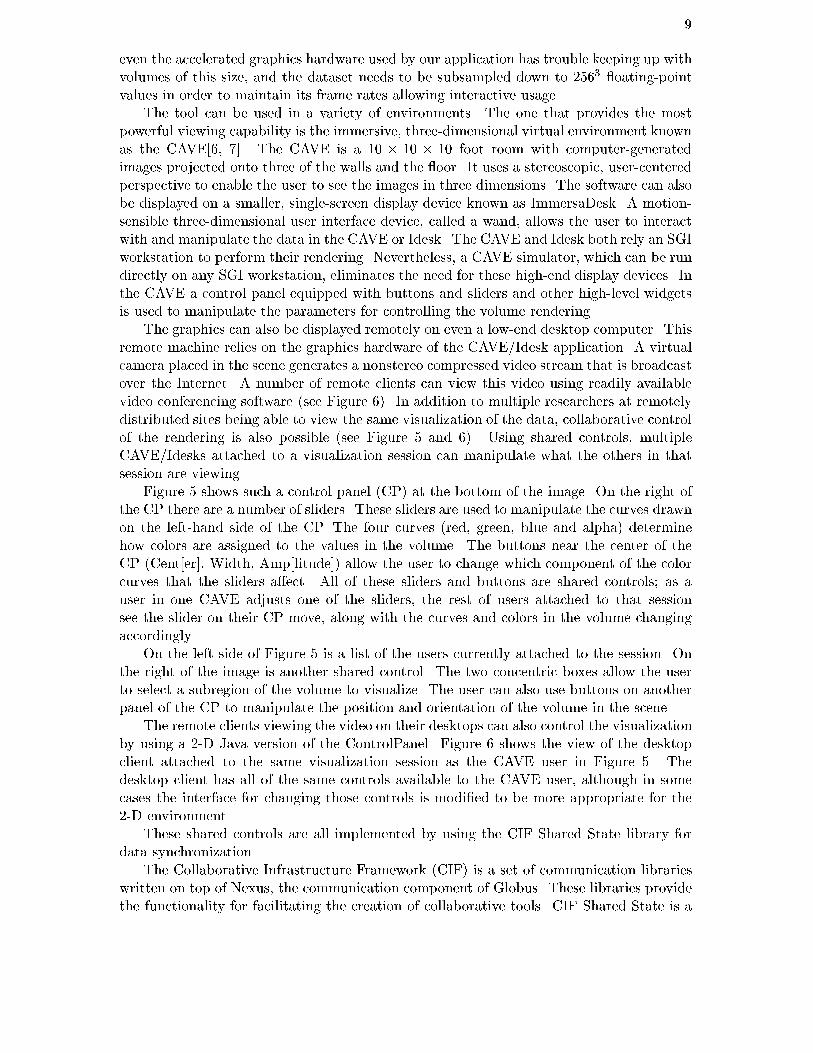
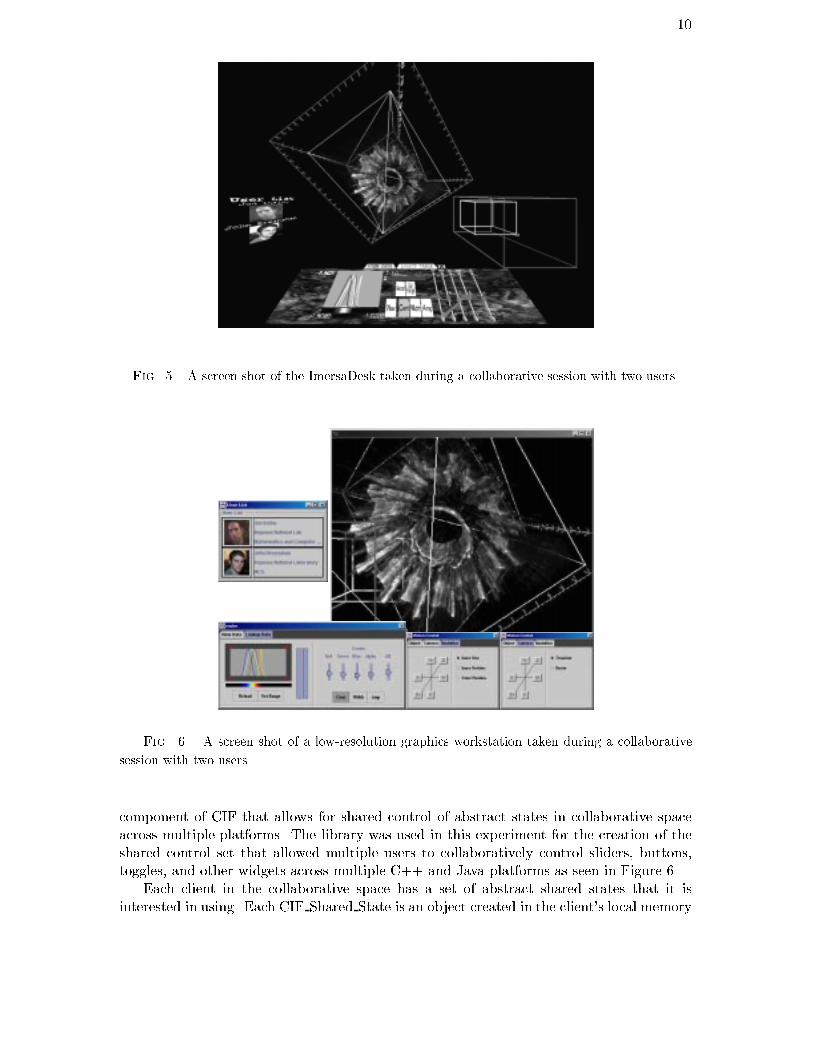
The graphics can also be displayed remotely on even a low-end desktop computer. Thisremote machine relies on the graphics hardware of the CAVE/Idesk application. A virtualcamera placed in the scene generates a nonstereo compressed video stream that is broadcastover the Internet. A number of remote clients can view this video using readily availablevideo conferencing software (see Figure 6). In addition to multiple researchers at remotelydistributed sites being able to view the same visualization of the data, collaborative controlof the rendering is also possible (see Figure 5 and 6). Using shared controls, multipleCAVE/Idesks attached to a visualization session can manipulate what the others in thatsession are viewing.
Figure 5 shows such a control panel (CP) at the bottom of the image. On the right ofthe CP there are a number of sliders. These sliders are used to manipulate the curves drawnon the left-hand side of the CP. The four curves (red, green, blue and alpha) determinehow colors are assigned to the values in the volume. The buttons near the center of theCP (Cent[er], Width, Amp[litude]) allow the user to change which component of the colorcurves that the sliders a�ect. All of these sliders and buttons are shared controls; as auser in one CAVE adjusts one of the sliders, the rest of users attached to that sessionsee the slider on their CP move, along with the curves and colors in the volume changingaccordingly.
On the left side of Figure 5 is a list of the users currently attached to the session. Onthe right of the image is another shared control. The two concentric boxes allow the userto select a subregion of the volume to visualize. The user can also use buttons on anotherpanel of the CP to manipulate the position and orientation of the volume in the scene.
The remote clients viewing the video on their desktops can also control the visualizationby using a 2-D Java version of the ControlPanel. Figure 6 shows the view of the desktopclient attached to the same visualization session as the CAVE user in Figure 5. Thedesktop client has all of the same controls available to the CAVE user, although in somecases the interface for changing those controls is modi�ed to be more appropriate for the2-D environment.
These shared controls are all implemented by using the CIF Shared State library fordata synchronization.
The Collaborative Infrastructure Framework (CIF) is a set of communication librarieswritten on top of Nexus, the communication component of Globus. These libraries providethe functionality for facilitating the creation of collaborative tools. CIF Shared State is a
10
Fig. 5. A screen shot of the ImersaDesk taken during a collaborative session with two users.
Fig. 6. A screen shot of a low-resolution graphics workstation taken during a collaborative
session with two users.
component of CIF that allows for shared control of abstract states in collaborative spaceacross multiple platforms. The library was used in this experiment for the creation of theshared control set that allowed multiple users to collaboratively control sliders, buttons,toggles, and other widgets across multiple C++ and Java platforms as seen in Figure 6.
Each client in the collaborative space has a set of abstract shared states that it isinterested in using. Each CIF Shared State is an object created in the client's local memory
11
space. When one client changes the value of a CIF Shared State, the CIF Shared State Setassociated with it handles all the messaging necessary to ensure state synchronization intotal order. Therefore, when one state changes its value in the client's local memory, theShared State library guarantees that every Set with that CIF Shared State in it updatesits value.
The CIF Shared State object is an abstract class. Implementations of this class mustprovide a method to pack its value into an array of bytes (the library provides functionalityto easily accomplish this), as well as a method to unpack its value. Each set identi�esindividual CIF Shared States by a character string unique to that state. So when astate of a given name is changed, its value is packed, via the pack method, and sent toall CIF Shared State Sets in the message space. If a CIF Shared State Set has a stateidenti�ed by the same character string, that state's unpack method is called.
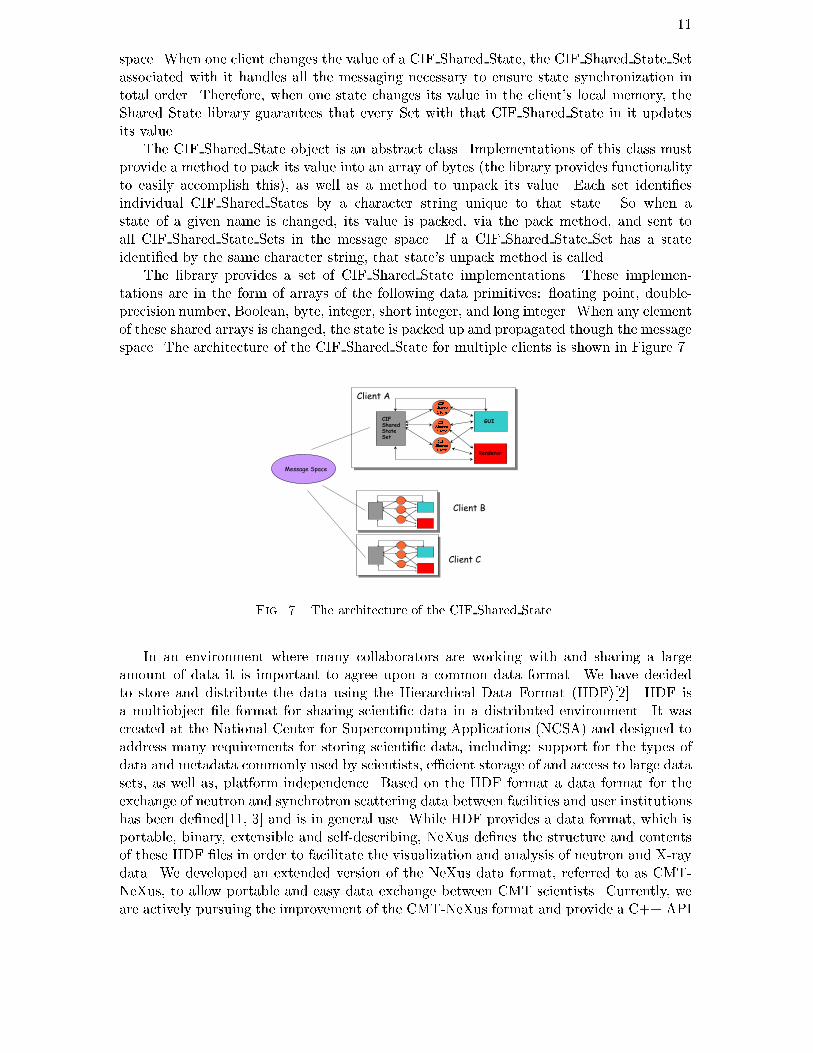
The library provides a set of CIF Shared State implementations. These implemen-tations are in the form of arrays of the following data primitives: oating point, double-precision number, Boolean, byte, integer, short integer, and long integer. When any elementof these shared arrays is changed, the state is packed up and propagated though the messagespace. The architecture of the CIF Shared State for multiple clients is shown in Figure 7.
0HVVDJH�6SDFH
&,)
6KDUHG
6WDWH
&,)
6KDUHG
6WDWH
6HW
*8,
5HQGHUHU
&,)
6KDUHG
6WDWH
&,)
6KDUHG
6WDWH
&OLHQW�$
&OLHQW�%
&OLHQW�&
Fig. 7. The architecture of the CIF Shared State.
In an environment where many collaborators are working with and sharing a largeamount of data it is important to agree upon a common data format. We have decidedto store and distribute the data using the Hierarchical Data Format (HDF)[2]. HDF isa multiobject �le format for sharing scienti�c data in a distributed environment. It wascreated at the National Center for Supercomputing Applications (NCSA) and designed toaddress many requirements for storing scienti�c data, including: support for the types ofdata and metadata commonly used by scientists, e�cient storage of and access to large datasets, as well as, platform independence. Based on the HDF format a data format for theexchange of neutron and synchrotron scattering data between facilities and user institutionshas been de�ned[11, 3] and is in general use. While HDF provides a data format, which isportable, binary, extensible and self-describing, NeXus de�nes the structure and contentsof these HDF �les in order to facilitate the visualization and analysis of neutron and X-raydata. We developed an extended version of the NeXus data format, referred to as CMT-NeXus, to allow portable and easy data exchange between CMT scientists. Currently, weare actively pursuing the improvement of the CMT-NeXus format and provide a C++ API
12
that enables access to data stored in this format conveniently. In addition, we includedin this API function calls that allow sending and receiving of the objects represented bythe data format via the Globus communications module to and from remote computers.This library is already a defacto standard between the groups participating in the GrandChallenge and their collaborators. This standard will be implemented on at least threebeamlines at the APS during the next year. The visualization environment as described inthis section is able to utilize this data format.
7 Conclusion
In this paper we have demonstrated a grid-enabled real-time analysis, visualization, andsteering environment for microtomography experiments. Speci�cally, we have provided aportable parallel framework that allows di�erent reconstruction algorithms to be ported ona distributed networked supercomputing environment. A standard format based on HDFis de�ned to distribute the data among scientists in a meaningful way. This format will beimplemented at several beamlines at the Advanced Photon Source during the next year.
The real-time visualization environment developed ful�lls the basic needs of themicrotomography scientists as well as scientists from other �elds. Moreover, withthe availability of this environment, we anticipate that scientists will make algorithmimprovements, for example, including a priori knowledge of a previous reconstruction inorder to increase the quality of the image.
The next phase of the project will focus on the use of new modalities in real-timereconstruction for interactive use and will explore the collaborative analysis of results. Inaddition, we will emphasize improvements to the usage of dynamic scheduling of computers,high-speed networking, and collaboration technologies.
8 Acknowledgments
This work was supported by the Mathematical, Information, and Computational SciencesDivision subprogram of the O�ce of Computational and Technology Research, U.S. De-partment of Energy, under Contract W-31-109-Eng-38. Globus research and developmentis supported by DARPA, DOE, and NSF.
We based the grid enabled version of the code from the code provided by Mark Ellismanand Steve Young from the National Center for Microscopy and Imaging Research at SanDiego Supercomputing Center[13, 16, 1]. We are especially grateful for their continuos helpthroughout the project. We like to thank Derrick C. Mancini, and Francesco DeCarlo forconducting the experiments at the beamline. This truly interdisciplinary project would nothave been possible without the countless hours of work performed by the Globus team: JoeBester, Steve Fitzgeral, Brian Toonen, Steve Tuecke, Karl Czajkowski, Jean Tedesco, andall the others who have helped us throughout the years. We thank Mary Westbrook, theMCS and APS sta� for helping us in issues related to setting up the network connectionbetween MCS and the beamline oor.
We also thank Gail Pieper for her valuable comments and editorial input.
References
[1] National center for microscopy and imaging research. http://www-ncmir.ucsd.edu/CMDA/.[2] The ncsa hdf home page, information, support, and software from the hierarchical data format
(hdf) group of ncsa. http://hdf.ncsa.uiuc.edu/, 1998.
13
[3] Neutron and x-ray data format www site. http://www.neutron.anl.gov/NeXus/, 1998.[4] Werner Benger, Ian Foster, Edward Seidel, John Shalf, Warren Smith, and
Paul Walker, Numerical relativity in a distributed environment, in 9th SIAM Conference onPArallel Processing for Scienti�c Computing, April 1999.
[5] B. Cabral, N. Cam, and J. Foran, Accelerated volume rendering and tomographicreconstruction using texture mapping hardware, in Proceedings of the IEEE 1994 Symposiumon Volume Visualization, October 1994, pp. 91{94.
[6] C. Cruz-Neira, D.J. Sandin, T.A. DeFanti, R.V. Kenyon, and J.C. Hart, Thecave: Audio visual experience automatic virtual environment, Communications of the ACM,35 (1992), pp. 65{72.
[7] C. Cruz-Neira, D. J. Sandin, and T.A. DeFanti, Surround-screen projection-based virtualreality: The design and implementation of the cave, in Proceedings of SIGGRAPH '93, August1993, pp. 135{142.
[8] R. Drebin, L. Carpenter, and P. Hanrahan, Volume rendering, in Proceedings ofSIGGRAPH '88, August 1988, pp. 65{74.
[9] Ian Foster and Carl Kesselman, eds., The Grid: Blueprint for a New ComputingInfrastructure, Morgan Kaufman, July 1998.
[10] W. S. Haddad, I. McNulty, J. E. Trebes, E. H. Anderson, R. A. Levesque, and
L. Yang, Ultra high resolution x-ray tomography, Science, 266 (1994), pp. 1213{1215.[11] P. Klosowski, M. Koennecke, J. Z. Tischler, and R. Osborn, Nexus: A common
format for the exchange of neutron and synchrotron data, in Physica B 241-243, 1998, pp. 151{153.
[12] J. Lehr, 3D x-ray microscopy: tomographic imaging of mineral sheaths of bacteria Leptothrixochracea with the G�ottingen x-ray microscope at BESSY, Optik, 104 (1997), pp. 166{170.
[13] P. J. Mercurio, T. T. Elvins, S.J. Young, P. S. Cohen, K.R. Fall, and M. H.
Ellisman, The distributed laboratory: An interactive visualization environment for electronmicroscopy and three-dimensional imaging, Comm. Assoc. Comp. Mach., 35 (1992), pp. 54{63.
[14] Gregor von Laszewski, Mary Westbrook, Ian Foster, Edwin Westbrook, and
Craig Barnes, Using computational grid capabilities to enhance the cability of an x-ray sourcefor structural biology, to be published, (1999).
[15] Y. Wang, Three-dimensional imaging in soft x-ray microscopy, PhD thesis, Department ofPhysics & Astronomy, State University of New York at Stony Brook, 1998.
[16] S.J. Young, G.Y. Fan, D. Hessler, S. Lamont, T.T. Elvins, M. Hadida,
G. Hanyzewski, J. W. Durkin, P. Hubbard, G. Kindalman, E. Wong, D. Green-
berg, S. Karin, and M. H. Ellisman, Implementing a collaboratory for digital microscopy,2/3 (1996), pp. 170{181.