read chapter 13 read three articles on web site –j. agribusiness including risk in economic...
Post on 22-Dec-2015
214 views
TRANSCRIPT

• Read Chapter 13• Read three articles on web site
– J. Agribusiness Including Risk in Economic Feasibility Analysis: The Case of Ethanol Production in Texas
– IAMA Journal Article on economic feasibility of Bio-ethanol Production for Wheat in South Africa
– SJAE Use of Probabilistic Cash Flows• Lecture 18 Project Feasibility.xls• Lecture 18 Ethanol Feasibility.xls• Lecture 18 Growth Functions.xls
Materials for Lecture 18

• Ice Plant article by Richardson and Mapp, Southern Journal of Agricultural Economics (SJAE),1976 – used risk for feasibility analysis– Demonstrated methodology for risk based
feasibility studies– Probability of Economic Success– Probabilistic Cash Flows to meet cash needs– Recent Feasibility Studies on Class Website
• Including Risk in Economic Feasibility Analysis using corn base ethanol model
Project Feasibility Analysis

Project Feasibility Analysis• In business most feasibility studies use
Excel spreadsheet models– This trend by business started in mid-90s
• Feasibility studies generally ignore risk – many do a “What if …” study for the Best Case and Worst Case scenarios
• Some analysts think they considered risk by including a 10 year “average” price
• Excel feasibility models are easily converted to stochastic simulation models– Just make the forecasted variables
stochastic using the residuals from the forecast models

Project Feasibility Analysis• Risks to consider for a feasibility
analysis are:– Price of raw inputs, as fuel and labor – Price of the product or output– Production risk– Black Swan events– Competition and market share over the life
of investment– Cost of the plant and product development– Cost of production for the finished product
• Project feasibility is where we put it all together in an analysis of Time, Money, and Economic Viability

Project Feasibility Analysis• Project Feasibility: consider the Time, Money
(Cost), and Economic Viability of the finished business
• Simulate the Time to complete the plant• Simulate the Cost of developing the plant
incorporating risk into the plant’s development costs
• Simulate the Economic Viability of the completed plant (business)
Project Management
BidAnalysis
ProjectFeasibility
Rate of Return
Cost (money)
Time
P(T)
P(C)
P( )
Project Management
Analysis
ProjectFeasibility
Rate of Return
Cost (money)
Time
P(T)
P(C)
P( )

Project Feasibility Analysis• Proposed business with a new product• Tasks and duration/costsTasks Description Time (mo.) Costs
($1,000)1 Plant Modification 3-5 300-3252 Product Development 1-3 200-3003 Distribution System 2-3 50-1004 Marketing Program 3-4 100-150
• Finance 100% of project costs @ 9%• Marginal cost of production/unit Uniform(10,15), a scenario
variable• Fixed Costs/year $200,000• Inflation Uniform(0.04, 0.05) percent per year• Demand ProjectionsYears Price/Unit Quantity Sold/Year1-3 U(13.5,14) U(500K, 600K)4-5 U(13,13.5) U(400K, 500K)6-10 U(12.5,13) U(300K, 400K)

Project Feasibility Analysis• Setting the proposed project up in a
Project Management setting yields the following cost and time to complete the project
• If these answers are acceptable to management the next questions is – – Will the business be economically viable?

Project Feasibility Analysis• The stochastic final cost of building the plant
becomes input into the project analysis phase of the analysis

Project Feasibility Analysis• 10 Year analysis gives way to lots of
reports– Annual rate of return to assets– Things look bad after 6th year
CDF of Annual Rate of Return to Assets
0
0.2
0.4
0.6
0.8
1
-0.4 -0.2 0 0.2 0.4 0.6 0.8 1
Pro
b
ROR2007 ROR2008 ROR2009 ROR2010 ROR2011
ROR2012 ROR2013 ROR2014 ROR2015 ROR2016

Project Feasibility Analysis• 10 Year analysis gives way to lots of
reports– Annual net cash income– Things look bad after 6th year
CDF of Annual Net Cash Income
0
0.2
0.4
0.6
0.8
1
-500000 0 500000 1000000 1500000 2000000 2500000 3000000
NCI2007 NCI2008 NCI2009 NCI2010 NCI2011
NCI2012 NCI2013 NCI2014 NCI2015 NCI2016
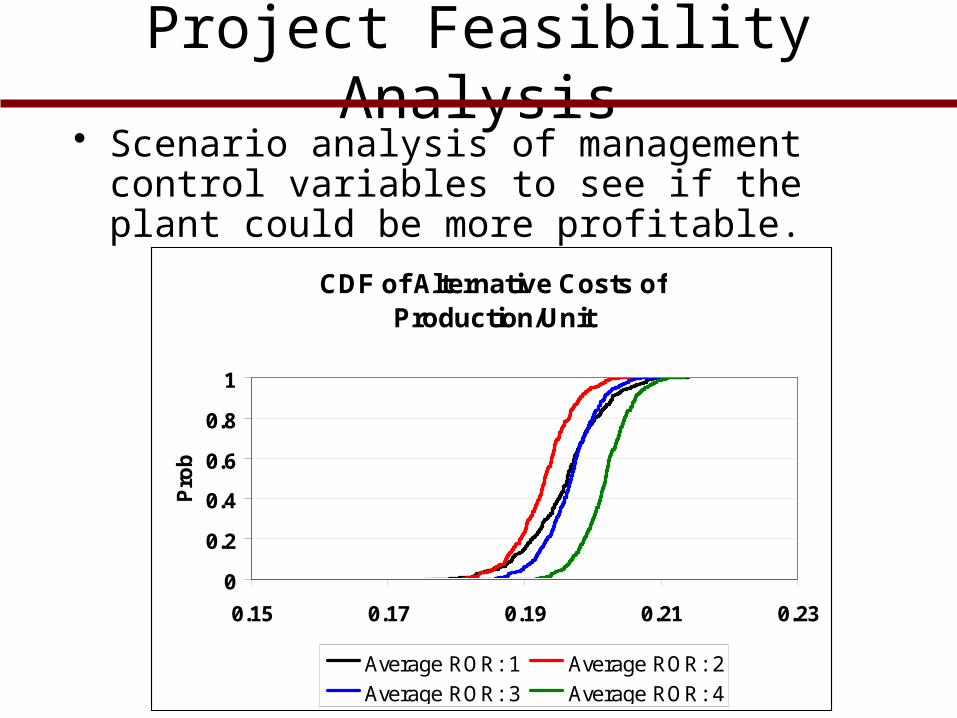
Project Feasibility Analysis• Scenario analysis of management control
variables to see if the plant could be more profitable.
CDF of Alternative Costs of Production/Unit
0
0.2
0.4
0.6
0.8
1
0.15 0.17 0.19 0.21 0.23
Pro
b
Average ROR: 1 Average ROR: 2
Average ROR: 3 Average ROR: 4
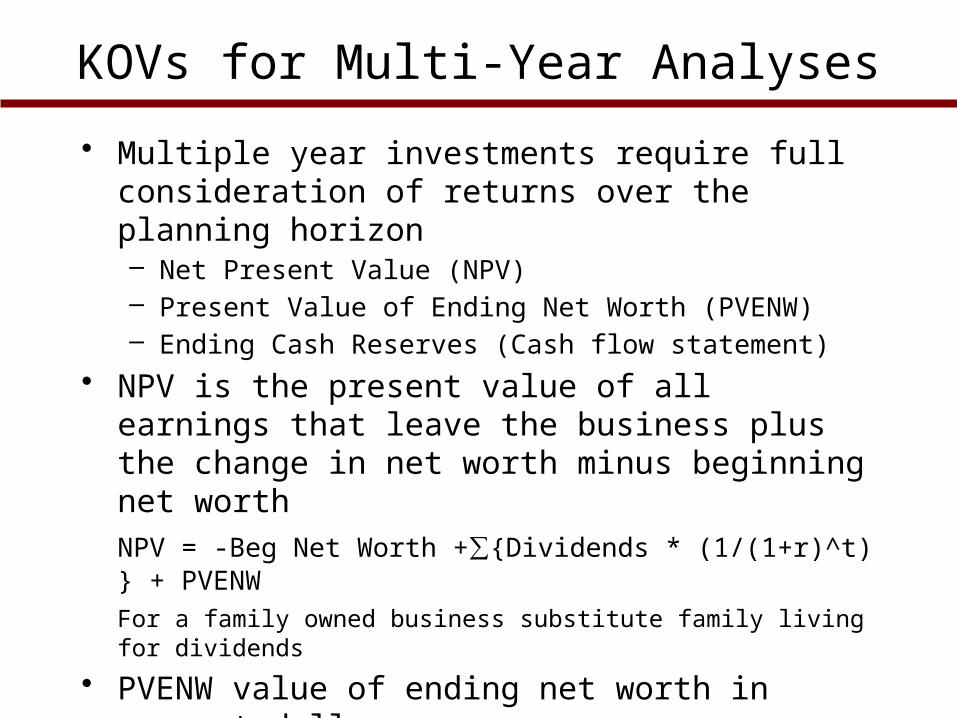
KOVs for Multi-Year Analyses
• Multiple year investments require full consideration of returns over the planning horizon– Net Present Value (NPV)– Present Value of Ending Net Worth (PVENW)– Ending Cash Reserves (Cash flow statement)
• NPV is the present value of all earnings that leave the business plus the change in net worth minus beginning net worthNPV = -Beg Net Worth +∑{Dividends * (1/(1+r)^t) } + PVENWFor a family owned business substitute family living for dividends
• PVENW value of ending net worth in current dollarsPVENW = Ending Net Worth * (1/(1+r)^T)Where T is the number of years simulated, eg. 10

Project Feasibility – Ethanol Plants in Texas
• Ethanol production is dependent on– Inputs could be: corn, sorghum, wheat, potatoes, etc– Fuel requirements are: natural gas and electricity– Sale of co-product of DDGS– Sale of ethanol
• Local communities want a plant because it hires 35 to 50 people year around, farmers have dependable market for grain, and given a $2.25/gallon construction cost, it generate jobs (at least for 9-12 months)

• Develop a Feasibility Model for an Ethanol plant in Texas
• Location: High Plains due to feedlots and local corn/sorghum supplies
• Rail transportation facilities available to import corn and ship ethanol
• KOVs– Net Present Value– Annual cash flows– Probability of cash flow deficits– Probability investors get their money back
or the P(Increase Real Net Worth)
Project Feasibility – Ethanol Plants in Texas
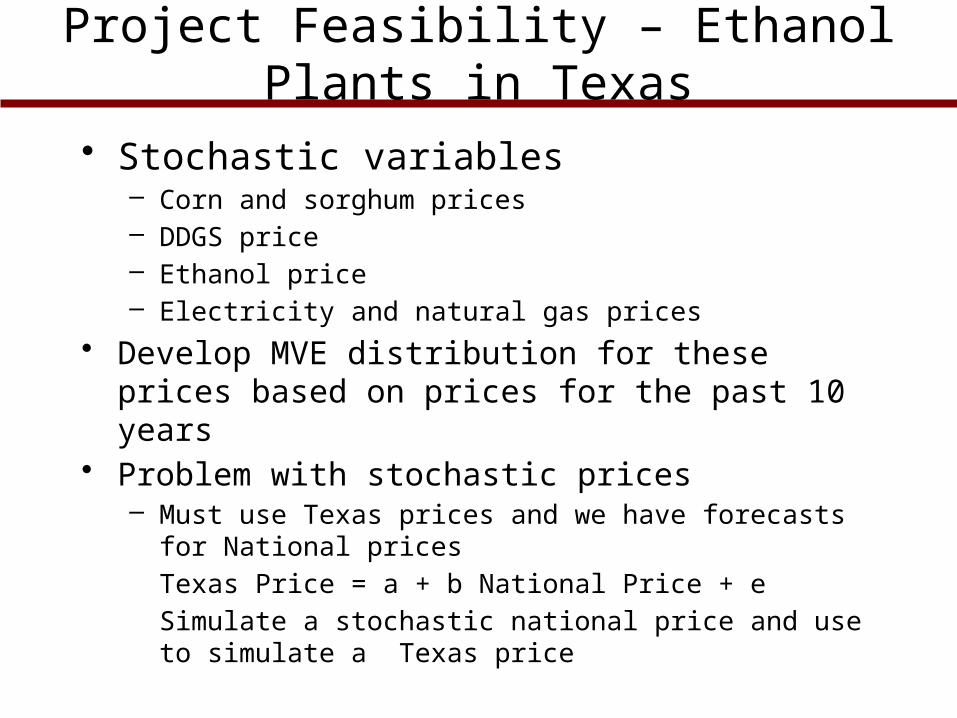
• Stochastic variables– Corn and sorghum prices– DDGS price– Ethanol price– Electricity and natural gas prices
• Develop MVE distribution for these prices based on prices for the past 10 years
• Problem with stochastic prices– Must use Texas prices and we have forecasts for
National pricesTexas Price = a + b National Price + eSimulate a stochastic national price and use to simulate a Texas price
Project Feasibility – Ethanol Plants in Texas

• Develop a Financial Simulation Model : Income Statement, Cash Flow, and Balance Sheet
• Simulate 10 years using corn as the feed stock, repeat process using sorghum
• Assume a learning curve for management to bring the plant up to its full capacity
• Validation exercises– 4 Ps – Touring test with other economists– Present results to local investors – Present results to politicians
Project Feasibility – Ethanol Plants in Texas
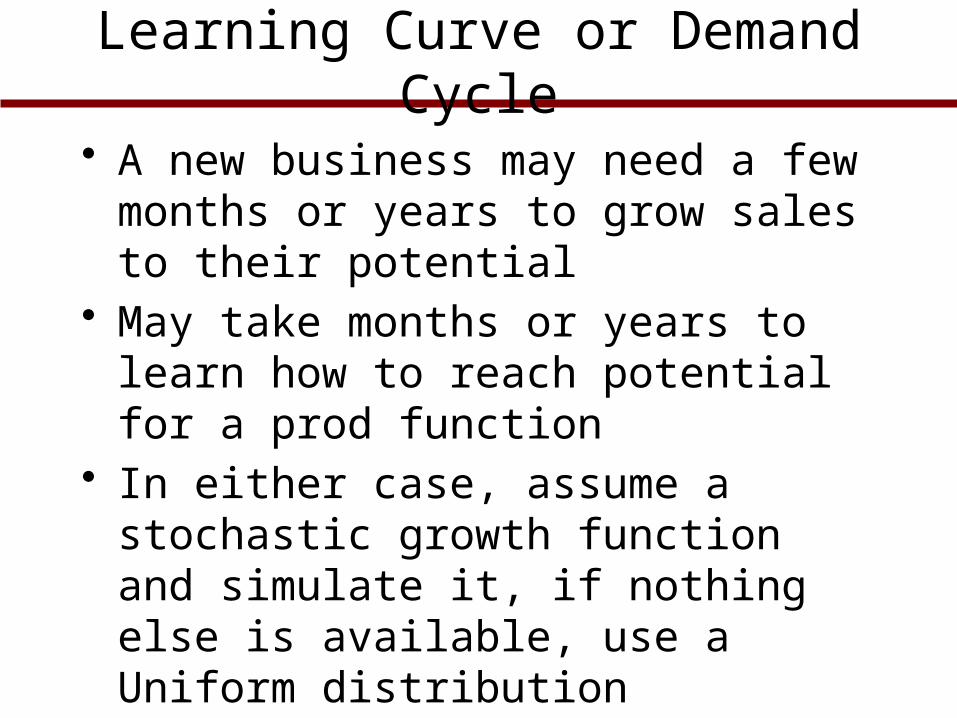
• A new business may need a few months or years to grow sales to their potential
• May take months or years to learn how to reach potential for a prod function
• In either case, assume a stochastic growth function and simulate it, if nothing else is available, use a Uniform distribution
• Example of a growth function for 8 years
Learning Curve or Demand Cycle

Fan Graph for Realized Sales over 10 Years
-
50,000
100,000
150,000
200,000
250,000
Sales1 Sales3 Sales5 Sales7 Sales9Average 5th Percentile 25th Percentile
75th Percentile 95th Percentile
Learning Curve or Demand Cycle

• A new concept in project feasibility analysis
• Explicitly consider externalities– Such as cleanup costs at end of
business• Strip mining reclamation• Removal of underground fuel tanks• Removal of above ground assets • Restoration of site
– Prevention of future environmental hazards• Removal of waste materials• 100 year liners for ponds
Life Cycle Costing

• Steps to Life Cycle Costing Analysis– Identify the potential externalities – Determine costs of these externalities– Assign probabilities to the chance of
experiencing each potential cost• Assume distributions with GRKS or
Bernoulli– Simulate costs given the probabilities– Incorporate costs of cleanup and
prevention into the project feasibility– These terminal costs may have big
Black Swans so prepare the investor
Life Cycle Costing

• Bottom line is that LCC will increase the costs of a project and reduce its feasibility
• Affects the downside risk on returns • Does nothing to increase the positive
returns• Need to consider the FULL costs of a
proposed project to make the correct decision
• J. Emblemsvag – Life Cycle-Costing: Using Activity-Based Costing and Monte Carlo Simulation to
manage Future Costs and Risks John Wiley & Sons Inc. 2003
Life Cycle Costing

• LCA is a tool for determining the impact of a new process or project on the environment and climate change
• LCAs are concerned with quantifying– Energy Use and CO2 Balance– Green House Gases (GHGs)– Water use and indirect Land use– Nutrient (N,P,K) use and other factors
• Thus far these are deterministic analyses – This will soon change
Life Cycle Analysis

• May 5 in this room and Blocker 448• Open book, notes and computer programs• Need half of you to bring your own computers,
you will be in Room 448• Two parts to the exam – Part A is short, do it first• Print each part as you finish it. • DO NOT wait until the end to print Part A!!!!• You SHALL prepare a PDF of your output and give
the PDF file to Alex to print.– DO NOT WAIT TO THE END TO PRINT!!!!!
• Pizza will be provided at noon. Take a short break.• The type of problem for Part B will be familiar to
you• Practice advice: Redo all Labs on simulation
What to Expect on Lab Exam

• Questions on all aspects of the material covered in class since the last exam
• Short answer essay questions– You should not need more space than what is
provided for a complete answer– DO NOT repeat the question as part of your
answer• It wastes time for you and the grader
• A few calculator questions• A One Page Cheat Sheet is permitted
What to Expect on Final Exam