the evolving economics of ethanol, and the outlook for policy change and industry investment dermot...
Post on 21-Dec-2015
215 views
TRANSCRIPT

The Evolving Economics of Ethanol, and the Outlook for Policy Change and Industry Investment
Dermot Hayes
Pioneer Hi-Bred Chair in Agribusiness
Iowa State University
Informa Economics
December 13th Roundtable Meeting

Outline
Based on the CARD studies “Emerging Biofuels: Outlook of Effects on U.S. Grain, Oilseed, and Livestock Markets” and Implied Objectives of Biofuels Subsidies: What are we trying to accomplish?
http://www.card.iastate.edu/publications/synopsis.aspx?id=1050
The objective was to estimate: how large the biofuels sector in the U.S. could become the impact of the biofuels sector on crops markets, trade, and on
livestock markets the response of world agricultural markets What the current level of subsidies suggests about our goals How we should subsidize to achieve our goals

Outline of the first study
After establishing a baseline, we ran a number of scenarios including: high crude oil price with no bottleneck high crude oil price with bottleneck drought with an ethanol mandate removal of CRP land for ethanol production removal of tax credit and import tariff

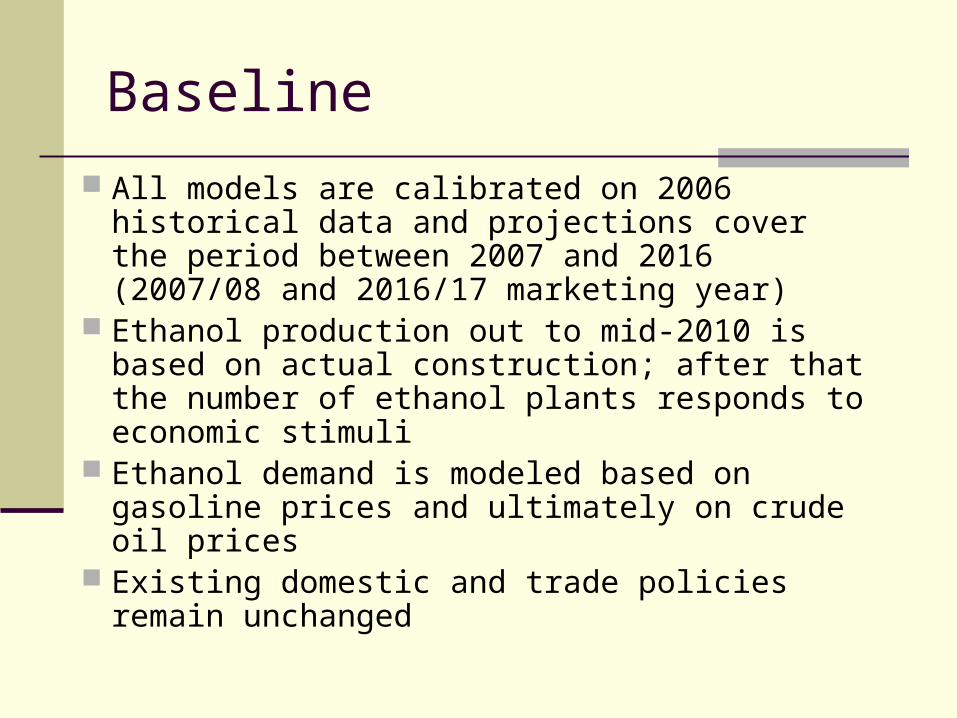
Baseline
All models are calibrated on 2006 historical data and projections cover the period between 2007 and 2016 (2007/08 and 2016/17 marketing year)
Ethanol production out to mid-2010 is based on actual construction; after that the number of ethanol plants responds to economic stimuli
Ethanol demand is modeled based on gasoline prices and ultimately on crude oil prices
Existing domestic and trade policies remain unchanged

Crude Prices are Critical
We used approximately $65 crude in the baseline and $75 crude in the high oil scenario
As of October 16th the NYMEX light sweet crude was almost exactly at the $75 for 2015 delivery
We had anticipated the current ethanol bottleneck and expect retail ethanol to sell at or below its 0.66 energy value for the projection period

Baseline Wholesale Gasoline and Ethanol Prices
1.00
1.25
1.50
1.75
2.00
2.25
2.50
2.75
3.00
2006 2008 2010 2012 2014 2016
US$/gallon
Unleaded Gasoline Ethanol
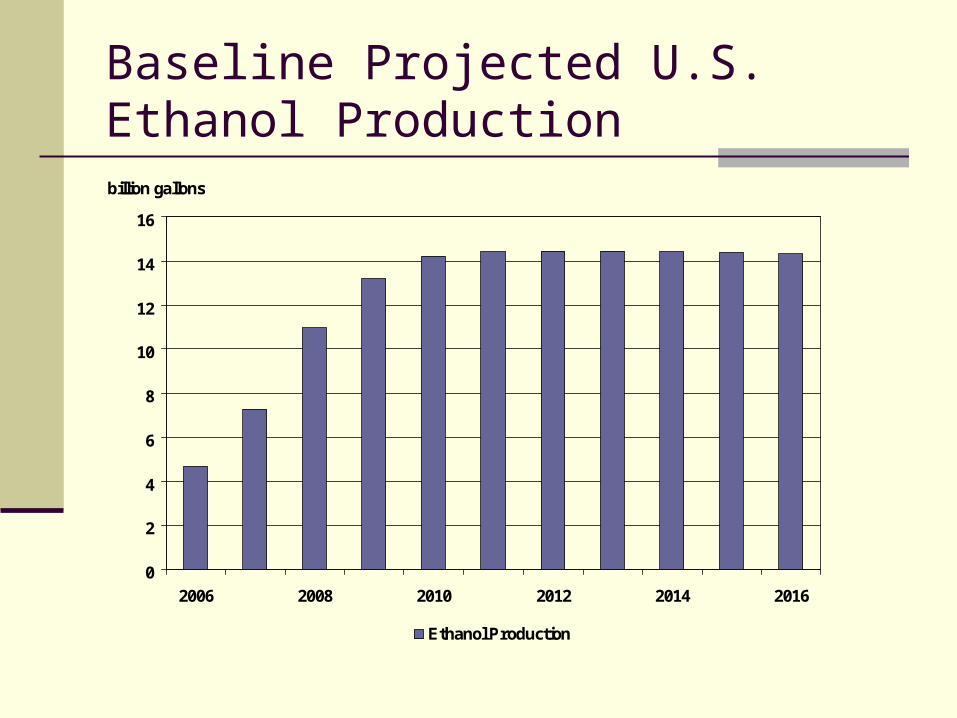
Baseline Projected U.S. Ethanol Production
0
2
4
6
8
10
12
14
16
2006 2008 2010 2012 2014 2016
billion gallons
Ethanol Production

Baseline Projected U.S. Corn Planted Area
70
75
80
85
90
95
2006 2008 2010 2012 2014 2016
million acres
Corn Planted Area

Baseline Projected Utilization of Corn
0
1000
2000
3000
4000
5000
6000
7000
2006 2007 2008 2009 2010 2016
million bushels
Feed Fuel HFCS Seed Food, Other Exports
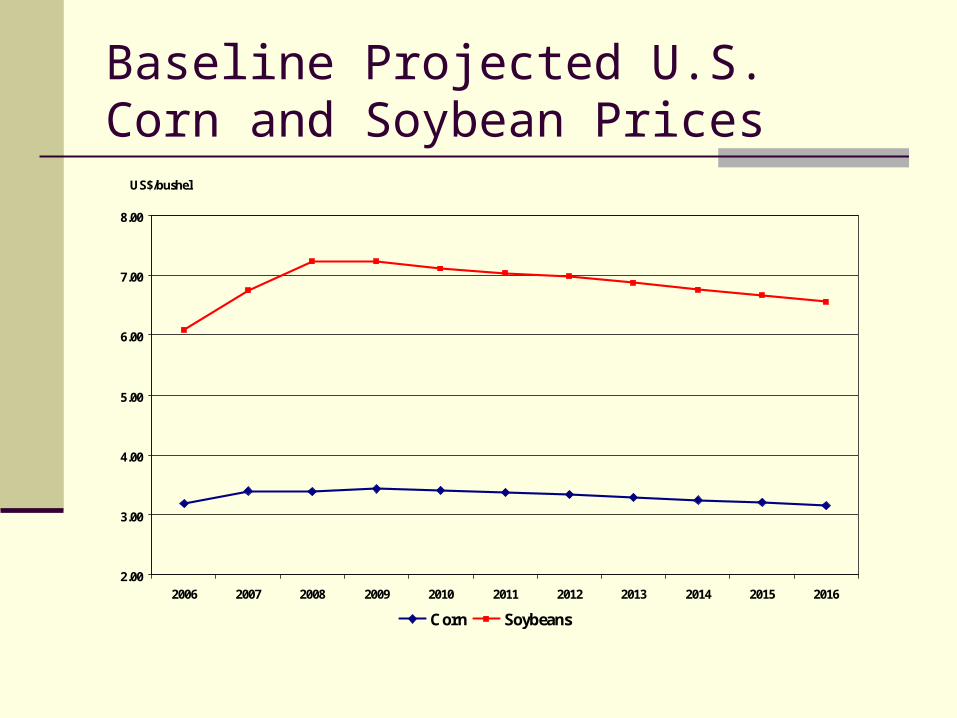
Baseline Projected U.S. Corn and Soybean Prices
2.00
3.00
4.00
5.00
6.00
7.00
8.00
2006 2007 2008 2009 2010 2011 2012 2013 2014 2015 2016
US$/bushel
Corn Soybeans

Baseline Brazilian and Argentine Soybean Planted Area
50.00
60.00
70.00
80.00
90.00
100.00
110.00
120.00
130.00
2006 2007 2008 2009 2010 2011 2012 2013 2014 2015 2016
million acres
Soybean Area

Impact of Higher Crude Oil Price
Increased crude oil price by $10/barrel over the projection Margins on ethanol plants increase New incentive to invest in added capacity for ethanol
production Eventually, a new equilibrium reached where there is no
incentive to invest in or exit the ethanol industry Will demand for ethanol be enough?
E-10 market will saturate around 15 billion gallons Drop in ethanol price will eventually encourage increase in
demand for the flex-fuel cars

Corn Market
Baseline (2016) Long-Run Percentage Change
Corn Price
($/bushel)
3.16 4.43 40.2%
Corn Area
(million acres)
92.5 112.3 21.4%
Corn Production
(million bushels)
14,750 18,038 22.3%
Corn Use in Ethanol (million bushels)
5,046 10,765 113.3%
Corn Feed Use
(million bushels)
5,746 4,914 -14.5%
Corn Exports
(million bushels)
2,451 911 -62.8%

Ethanol and Distillers Grains Markets
Baseline (2016) Long-Run Percentage Change
Ethanol Production from Corn (million gallons)
14,568 29,063 99.5%
Ethanol Consumption
(million gallons)
15,244 29,934 96.4%
Ethanol Wholesale Price (US$/gallon)
1.57 1.91 21.7%
Ethanol Net Imports
(million gallons)
314 337 7.3%
Distillers Grains Production
(thousand tons)
39,758 87,614 120.4
Distillers Grains Price
(US$/ton)
105.81 143.94 36.0%
Distillers Grains Domestic Use (thousand tons)
37,280 63,658 70.8%

Livestock Market
Baseline (2016) Long-Run Percentage Change
Beef Retail Price
(US$/pound)
4.52 4.71 4.2%
Pork Retail Price
(US$/pound)
3.30 3.44 4.2%
Broiler Retail Price
(US¢/pound)
196.07 205.32 4.7%
Turkey Retail Price
(US¢/pound)
126.28 136.96 8.5%
Egg Retail Price
(US¢/dozen)
162.98 177.07 8.6%
Milk Retail Price
(US$/cwt)
14.65 15.44 5.4%

Impact of Short Crop Scenario
Drought in 2012 similar to 1988 Regional yields of corn, soybeans and wheat
changed from trend levels Yields fell by 25% for corn, 18% for soybeans,
11% for wheat Ethanol mandate for 2012 assumed to be 14.7
billion gallons

Corn, Soybean and Ethanol Markets
Corn price increases by 42% above baseline levels Soybean price rises by 22% Corn exports and stock levels decline by more
than 60% Corn exports from South America, China, etc. fill
part of the gap from decline in U.S. corn exports The southern hemisphere gets the “message” in
late July and produces enough to get the world through to the following year
Corn feed use declines by 15%

Other Biofuels
Cellulosic ethanol is not competitive under current policy incentives
The costs associated with baling and hauling stover make it uncompetitive so long as corn is less that $4.80 per bushel
Switchgrass has an additional problem in that an acre of crop ground must be used, the higher the energy price the greater the value of this acre
Biodiesel does not make economic sense under current policy

Why does corn ethanol dominate?
Table 7. Assumptions to obtain the amount of biofuels produced by acre of land and
the payments that would result under the current scheme.
Yields Biofuel production
gal/acre
Current Subsidy*
$/acre
Corn (bu/acre) 153 428 218.5
Soybean (bu/acre) 45 63.1 63.1
Corn Stover (kg/acre) 1600 112 57.1
Switchgrass (kg/acre) 5,000 350 178.5

Well to Wheels petroleum energy use of various fuels in Btus per million btus of fuel produced and used, and associated reduction in fossil energy consumption relative to
gasoline or diesel.
Fuel Technology/ Feedstock
WTP PTW WTW Reduction
Btu/mbtu Btu/mbtu Btu/mbtu
vs. gas./diesel
Gasoline Current 110,000 1,000,000 1,110,000 -
Future 110,000 1,000,000 1,110,000 -
Avg. EtoH Current 100,000 0 100,000 91.0%
Future 90,000 0 90,000 91.9%
New EtoH NG-DDGS 85,000 0 85,000 92.3%
NG-WDGS 85,000 0 85,000 92.3%
Coal-DDGS 90,000 0 90,000 91.9%
Coal-WDGS 90,000 0 90,000 91.9%
Cellulosic EtoH Switchgrass 70,000 0 70,000 93.7%
Corn Stover* 66,600 0 66,600 94.0%
Diesel** 112,196 1,000,000 1,112,196 -
Biodiesel Soybean oil** 129,377 0 129,377 88.4%
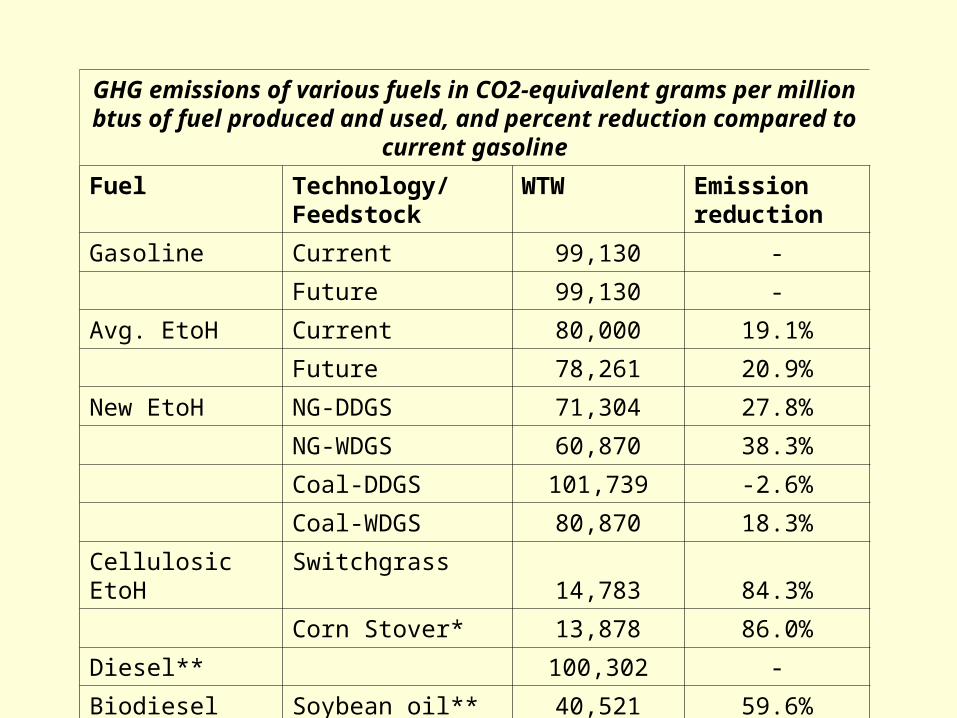
GHG emissions of various fuels in CO2-equivalent grams per million btus of fuel produced and used, and percent reduction compared to current gasoline
Fuel Technology/ Feedstock
WTW Emission reduction
Gasoline Current 99,130 -
Future 99,130 -
Avg. EtoH Current 80,000 19.1%
Future 78,261 20.9%
New EtoH NG-DDGS 71,304 27.8%
NG-WDGS 60,870 38.3%
Coal-DDGS 101,739 -2.6%
Coal-WDGS 80,870 18.3%
Cellulosic EtoH Switchgrass 14,783 84.3%
Corn Stover* 13,878 86.0%
Diesel** 100,302 -
Biodiesel Soybean oil** 40,521 59.6%

Per gallon compensation needed to provide equivalent subsidies relative to current for based ethanol
FuelTechnology/ feedstock
Fossil Energy
Petroleum Energy
GHG
Avg. EtoH Current 1.000 1.000 1.000
Coal-DDGS 0.865 1.010 -0.136
Cellulosic EtoH Switchgrass 2.461 1.030 4.409
Corn Stover 2.444 1.033 4.456
Sugarcane EtoH Sugarcane** 2.347 1.007 3.697
Biodiesel Soybean oil 2.473 1.588 5.099

Current subsidies for the externalities provided by biofuelsFuel Technology/
FeedstockFossil Energy Reduction
Petroleum Energy Reduction
GHG Emission Reduction
$/mbtu $/mbtu $/ton
Avg. EtoH Current 14.7 6.6 350.8
Future14.5 6.6 321.5
New EtoH NG-DDGS 13.5 6.5 241.2
NG-WDGS 10.4 6.5 175.4
Coal-DDGS 17.0 6.6 -*
Coal-WDGS 11.4 6.6 367.5
Cellulosic EtoH
Switchgrass6.0 6.5 79.6
Corn Stover 6.0 6.4 78.7
Biodiesel Soybean oil 11.7 8.2 134.9

Bottom Line
Crude oil prices will drive ethanol production and ethanol production will drive corn and soybean prices
If crude stays strong, ethanol will continue to grow and will continue to displace animal feed and exports
Whenever corn falls below a breakeven price we will build ethanol facilities to drive it back to that price
We do not expect to see cheap DDGs over the long run Cellulosic ethanol is not ready for commercialization Biodiesel is an industry that is waiting for high crude oil
prices and cheap soybean oil prices this will not happen so long as farmers can chose between corn and soybean production
The current subsidy structure appears designed to foster corn based ethanol

Thank You