ras laffan c extension med evaporators design … 2 x 22,700 m³/d gor 8.4 med-tvc 2008 fujairah ii...
TRANSCRIPT
General Presentation
Slide 2General Presentation – December 2011
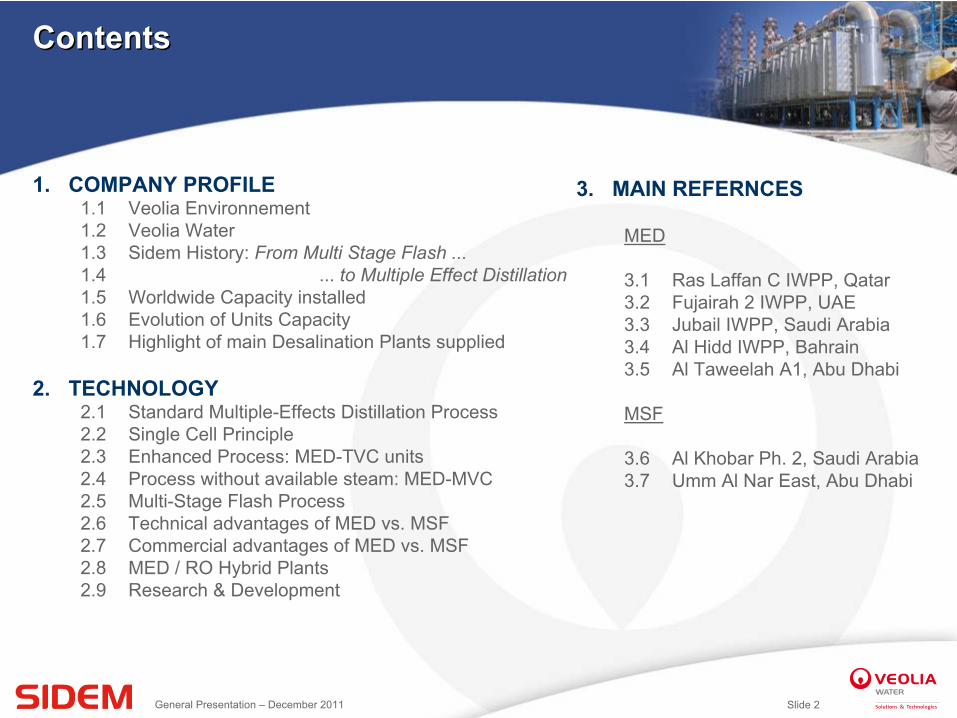
ContentsContents
1.
COMPANY PROFILE1.1
Veolia Environnement1.2
Veolia Water1.3
Sidem History: From Multi Stage Flash ...1.4
... to Multiple Effect Distillation1.5
Worldwide Capacity installed1.6
Evolution of Units Capacity1.7
Highlight of main Desalination Plants supplied
2.
TECHNOLOGY2.1
Standard Multiple-Effects Distillation Process2.2
Single Cell Principle2.3
Enhanced Process: MED-TVC units2.4
Process without available steam: MED-MVC2.5
Multi-Stage Flash Process2.6
Technical advantages of MED vs. MSF2.7
Commercial advantages of MED vs. MSF2.8
MED / RO Hybrid Plants2.9
Research & Development
3.
MAIN REFERNCES
MED
3.1
Ras Laffan C IWPP, Qatar3.2
Fujairah 2 IWPP, UAE3.3
Jubail IWPP, Saudi Arabia3.4
Al Hidd IWPP, Bahrain3.5
Al Taweelah A1, Abu Dhabi
MSF
3.6
Al Khobar Ph. 2, Saudi Arabia3.7
Umm Al Nar East, Abu Dhabi

Slide 3General Presentation – December 2011
1.1
Veolia Environnement1.1
Veolia Environnement
World leader in Environmental Services315,000 employees in more than 100 countries
4 business segments, 1 focus: Environment
€
12.1
Billion €
7.5 Billion €
8 Billion €
9.3 Billion
ВОДА
World
Leader
€
34.8
Billion
ЭНЕРГИЯ ТРАНСПОРТ ОБРАБОТКА
ОТХОДОВ
World
Leader
European
Leader
European
Leader
ENVIRONMENTAL SERVICES
WATER ENERGY TRANSPORT WASTE
MANAGEMENT

Slide 4General Presentation – December 2011
1.2
Sidem within Veolia Water1.2
Sidem within Veolia Water
Veolia: World Leader in Water Services through 2 Subdivisions
Operation of water and wastewater systems on behalf of public authorities and companies
Design of water solutions and technologies,
engineering and construction of water and wastewater treatment plants
Turnover: €12.6 billion –
90,000
employees
9.8 bn m³
of water distributed –
7.3 bn m³
of wastewater collected
Turnover: €2.2
billion –
9,600 employees (incl. 60% engineers)
57
countries / 135
businesses / over 250 proprietarytechnologies
Design, engineering and construction of thermal and hybrid seawater desalination plants for industrial and municipal needs
Turnover: €250 m –
290 employees –
HQ’s in Paris with regional offices in
Abu Dhabi, Saudi Arabia, Qatar, Libya and St Marteen Caribbean
Within Veolia, the expertise in thermal desalination is from Sidem and its subsidiary Entropie
Slide 5General Presentation – December 2011
1.3
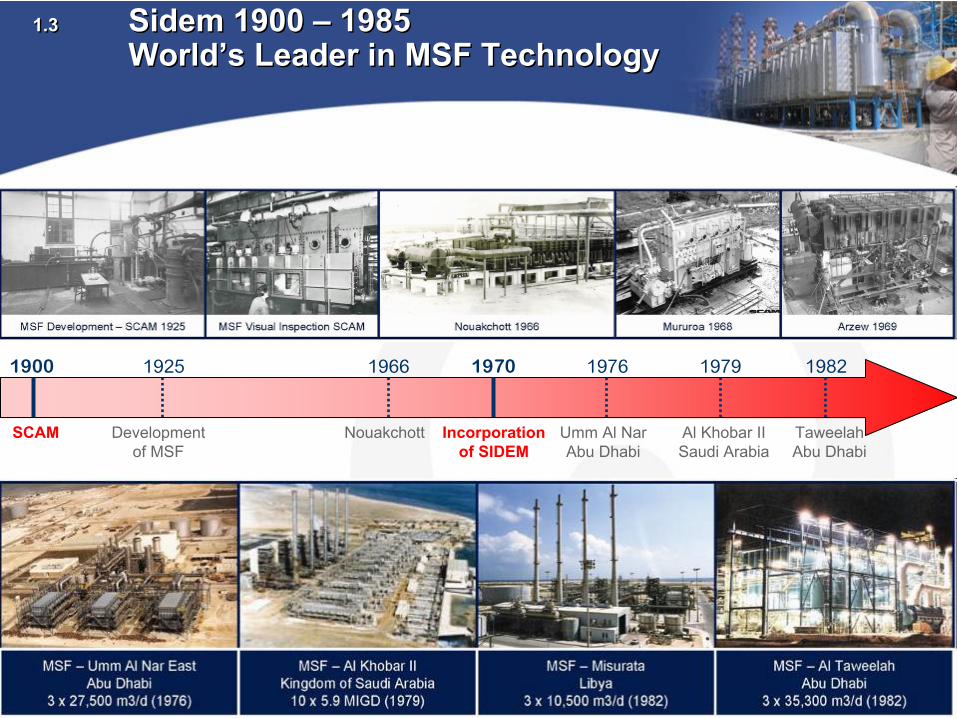
Sidem 1900 –
1985 World’s Leader in MSF Technology
1.3
Sidem 1900 –
1985 World’s Leader in MSF Technology
1970
Incorporation
of SIDEM
SCAM
1900 1925
Development of MSF
1966
Nouakchott Umm Al Nar
Abu Dhabi
1976 1979 1982
Al Khobar II
Saudi Arabia
Taweelah
Abu Dhabi
Slide 6General Presentation – December 2011
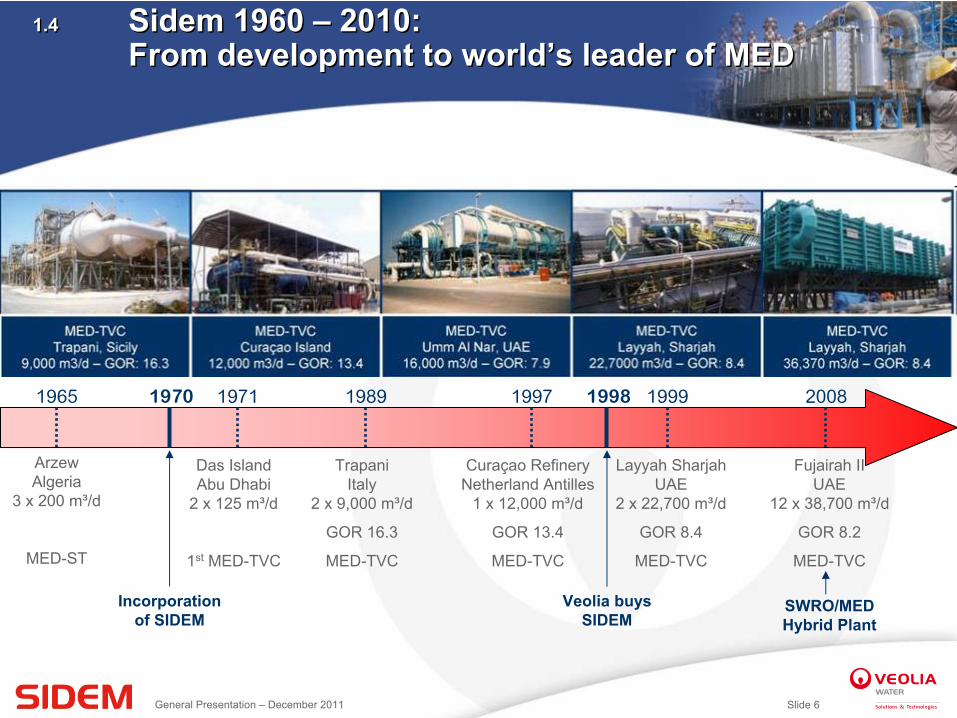
1.4 Sidem 1960 –
2010: From development to world’s leader of MED
1.4 Sidem 1960 –
2010: From development to world’s leader of MED
1970
Incorporation
of SIDEM
1965
Arzew
Algeria
3 x 200 m³/d
MED-ST
1971
Das Island
Abu Dhabi
2 x 125 m³/d
1st
MED-TVC
1989
Trapani
Italy
2 x 9,000 m³/d
GOR 16.3
MED-TVC
1997
Curaçao Refinery
Netherland Antilles
1 x 12,000 m³/d
GOR 13.4
MED-TVC
1999
Layyah Sharjah
UAE
2 x 22,700 m³/d
GOR 8.4
MED-TVC
2008
Fujairah II
UAE
12 x 38,700 m³/d
GOR 8.2
MED-TVC
Veolia buys
SIDEM
1998
SWRO/MED
Hybrid
Plant
Slide 7General Presentation – December 2011
-
500,000
1,000,000
1,500,000
2,000,000
2,500,000
3,000,000
3,500,000
4,000,000
4,500,000
1965 1970 1975 1980 1985 1990 1995 2000 2005 2010
Cum
ulat
ed c
ontr
acte
d ca
paci
ty in
m³/d
ay
MSF MED
1.5
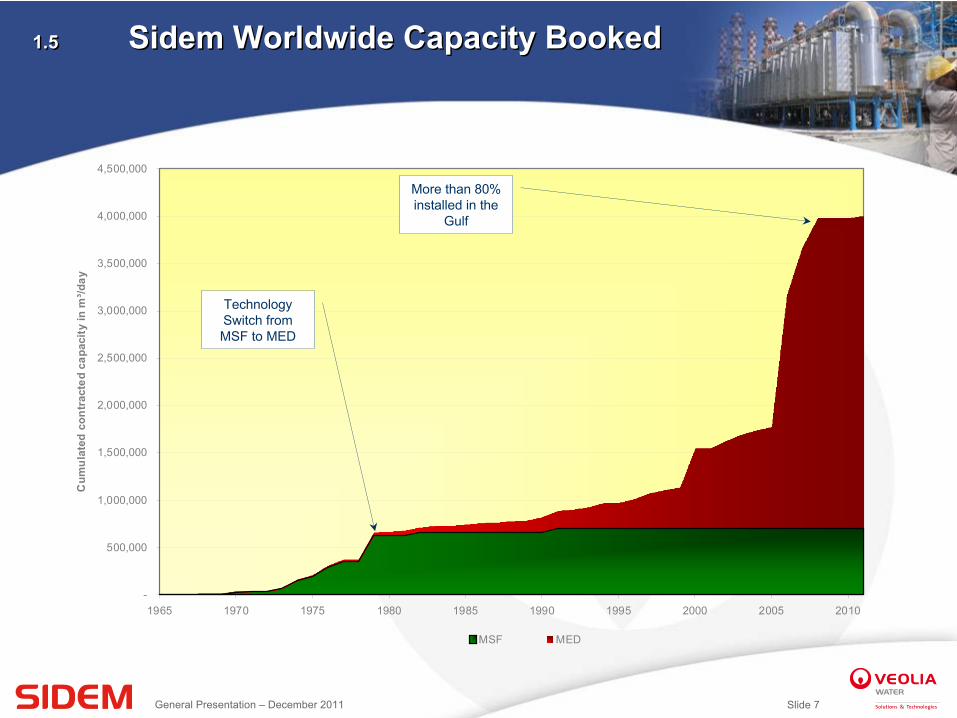
Sidem Worldwide Capacity Booked1.5
Sidem Worldwide Capacity Booked
Technology Switch from MSF to MED
More than 80% installed in the
Gulf

Slide 8General Presentation – December 2011
-
2.00
4.00
6.00
8.00
10.00
12.00
1990 1995 2000 2005 2010
MIG
D
Umm Al Nar, UAE• Unit Cap.: 3.5 MIGD
• GOR: 7.9
Umm Al Nar, UAE• Unit Cap.: 3.5 MIGD
• GOR: 7.9
Layyah, Sharjah• Unit Cap.: 5 MIGD
• GOR: 8.4
Layyah, Sharjah• Unit Cap.: 5 MIGD
• GOR: 8.4
Curaçao Island• Unit Cap.: 2.6 MIGD
• GOR: 13.4
Curaçao Island• Unit Cap.: 2.6 MIGD
• GOR: 13.4
Curaçao Island• Unit Cap.: 2.6 MIGD
• GOR: 13.4
Al Hidd, BahrainUnit Cap.: 6.00 MIGD
GOR: 9.07
Marafiq Jubail, KSA• Unit Cap.: 6.59 MIGD
• GOR: 9.85
Marafiq Jubail, KSA• Unit Cap.: 6.59 MIGD
• GOR: 9.85
Marafiq Jubail, KSA• Unit Cap.: 6.59 MIGD
• GOR: 9.85
1.6
Evolution of MED Units Capacity1.6
Evolution of MED Units Capacity
Ras Laffan C, Qatar• Unit Cap.: 6.3 MIGD
• GOR: 11.1
Ras Laffan C, Qatar• Unit Cap.: 6.3 MIGD
• GOR: 10.9
Fujairah II, UAE• Unit Cap.: 8.5 MIGD
• GOR: 8.2
Fujairah II, UAE• Unit Cap.: 8.5 MIGD
• GOR: 8.2
Fujairah II, UAE• Unit Cap.: 8.5 MIGD
• GOR: 10.3
Trapani, Sicily• Unit Cap.: 2.0 MIGD
• GOR: 16.3
Trapani, Sicily• Unit Cap.: 2.0 MIGD
• GOR: 16.
Qualified
New design
areaLayyah, Sharjah• Unit Cap.: 22,700 m3/d
• GOR: 8.4
Layyah, Sharjah• Unit Cap.: 8 MIGD
• GOR: 8.4

Slide 9General Presentation – December 2011
Iran
Saoudi
Arabia UAE
Qatar
Bahrain
Iraq
Kuwait
Oman
1.7
Main
References in the Gulf Countries
MED -
Layyah
Sharjah
2 x 5 MIGD (1999-2001)
MED -
Layyah
Sharjah
2 x 8 MIGD (2005-2006)
MED –
Taweelah
Abu Dhabi
14 x 3.8 MIGD (2000-2002)
MED –
Ras Laffan
C Qatar
10 x 6.3 MIGD (2007-2010)
MED -
Marafiq
Saudi Arabia
27 x 6.55 MIGD (2007-2010)
MSF –
Al Khobar
II KSA
10 x 5.9 MIGD (1979-1982)
Hybrid MED / RO –
Fujairah II
MED: 12 x 8.5 MIGD
SWRO: 30 MIGD (2007-2010)
MED –
Al Hidd
Bahrain
10 x 6 MIGD (2006-2008)
Slide 10General Presentation – December 2011
2.1
Standard MED Process2.1
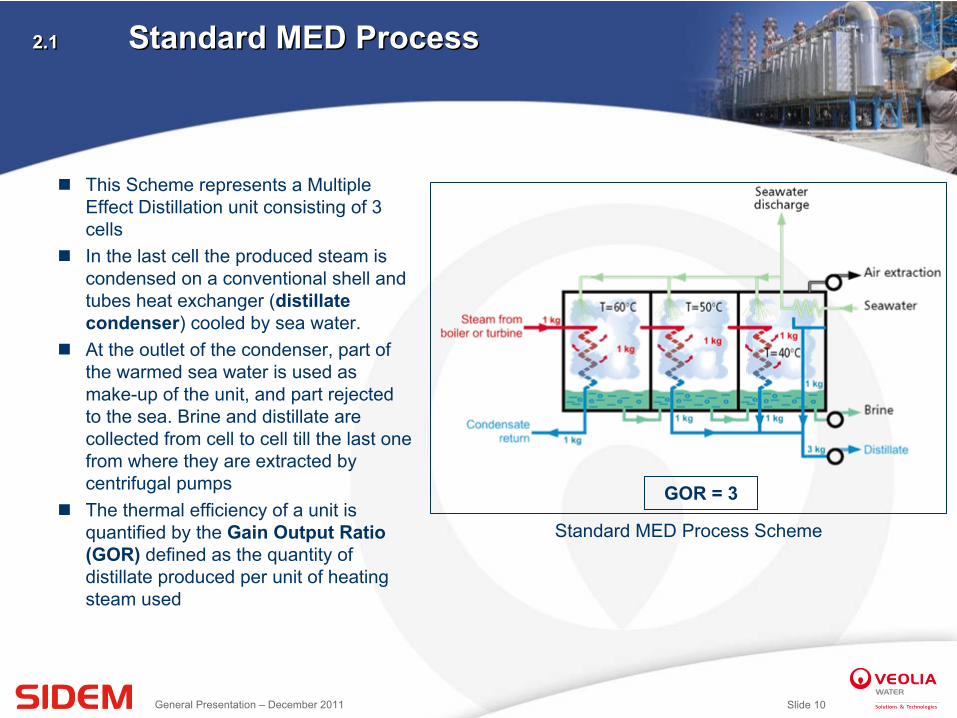
Standard MED Process
GOR = 3
This Scheme
represents
a Multiple Effect
Distillation unit consisting
of 3 cells
In the last cell
the produced
steam
is
condensed
on a conventional
shell
and tubes heat
exchanger
(distillate
condenser) cooled
by sea
water.
At
the outlet
of the condenser, part of the warmed
sea
water is
used
as make-up of the unit, and part rejected
to the sea. Brine
and distillate
are collected
from
cell
to cell
till the last one from
where
they
are extracted
by centrifugal
pumps
The thermal efficiency
of a unit is
quantified
by the Gain Output Ratio (GOR) defined as the quantity of distillate produced per unit of heating steam used
Standard MED Process Scheme
Slide 11General Presentation – December 2011
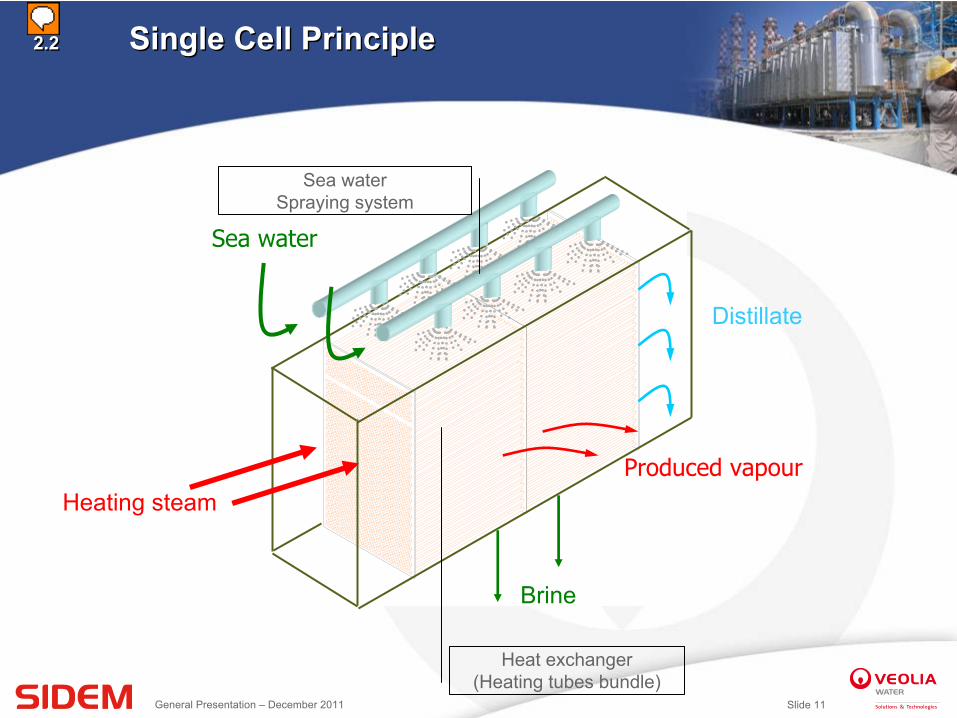
Sea water
Heating steam
Brine
Produced vapour
Distillate
2.2
Single Cell Principle2.2
Single Cell Principle
Heat exchanger(Heating tubes bundle)
Sea water
Spraying system
Slide 12General Presentation – December 2011
GOR = 6
2.3
Enhanced Process with Thermal Vapour Compressor (MED –
TVC)
2.3
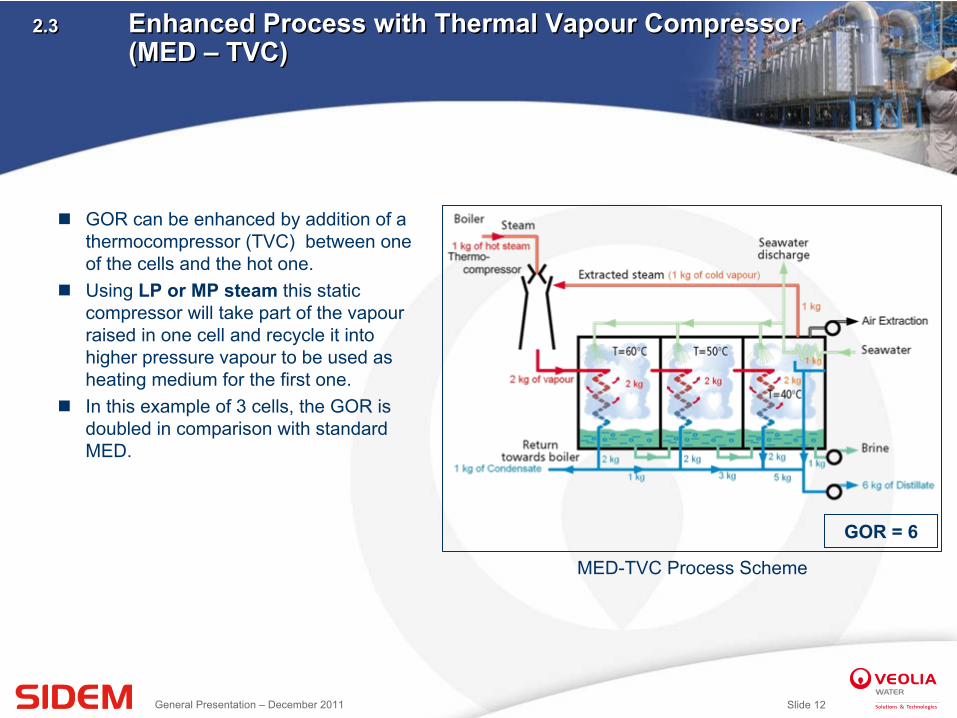
Enhanced Process with Thermal Vapour Compressor (MED –
TVC)
GOR can
be
enhanced
by addition of a thermocompressor
(TVC) between
one of the cells
and the hot one.
Using
LP or MP steam
this
static
compressor
will
take
part of the vapour
raised
in one cell
and recycle it
into
higher
pressure vapour
to be
used
as heating
medium for the first one.
In this example of 3 cells, the GOR is doubled in comparison with standard MED.
MED-TVC Process Scheme
Slide 13General Presentation – December 2011
2.4
Desalination
without
available
steam (MED
–MVC)
2.4
Desalination
without
available
steam (MED
–MVC)
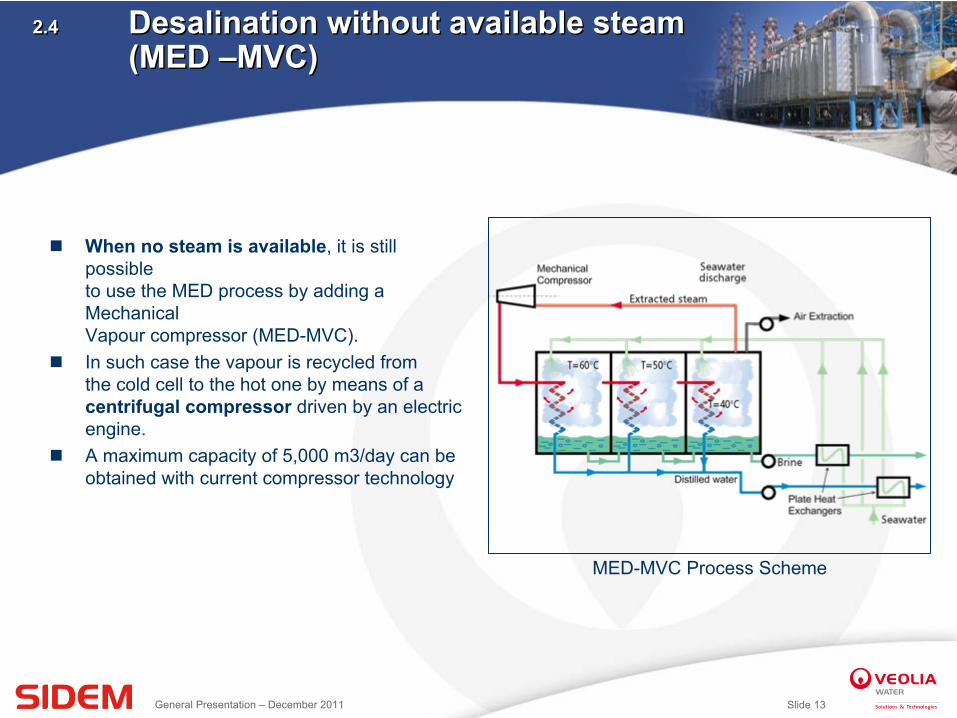
When
no steam
is
available, it
is
still
possible
to use the MED process
by adding
a Mechanical
Vapour
compressor
(MED-MVC).
In such
case the vapour
is
recycled
from
the cold cell
to the hot one by means
of a
centrifugal
compressor
driven
by an electric
engine.
A maximum capacity
of 5,000 m3/day
can
be
obtained
with
current
compressor
technology
MED-MVC Process Scheme

Slide 14General Presentation – December 2011
2.5
MSF with Brine Recirculation2.5
MSF with Brine Recirculation
Within MSF-BR, huge quantities of water are circulated through large recycling pumps of very high electrical consumption
MSF-BR Process Scheme
Slide 15General Presentation – December 2011
2.6
Comparison between MED & MSF2.6
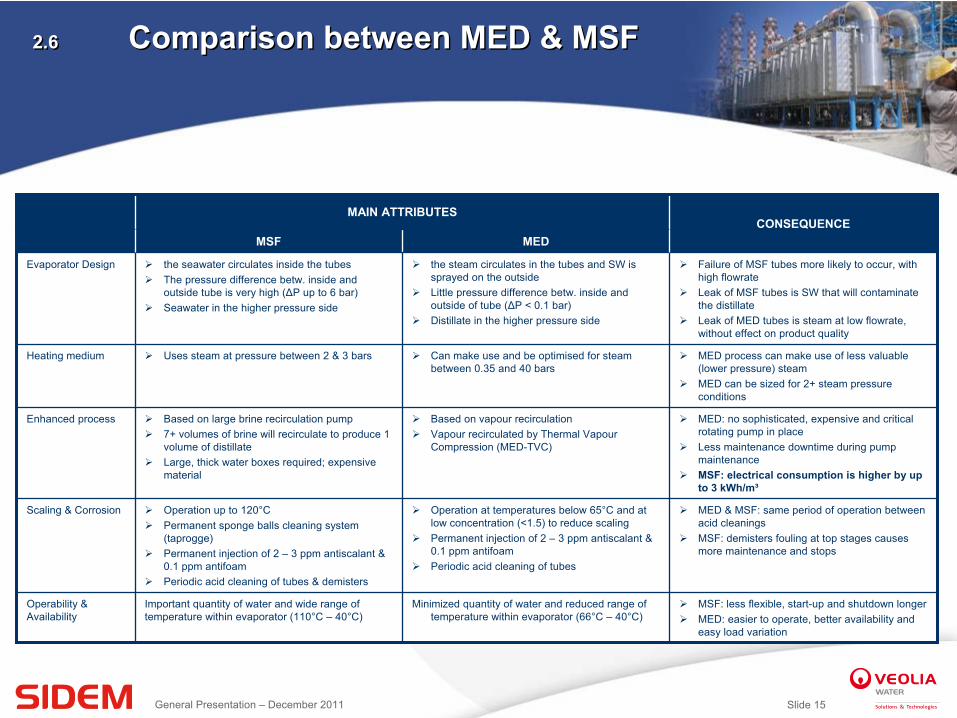
Comparison between MED & MSF
MAIN ATTRIBUTESCONSEQUENCE
MSF MED
Evaporator Design
the seawater circulates inside the tubes
The pressure difference betw. inside and outside tube is very high (ΔP up to 6 bar)
Seawater in the higher pressure side
the steam circulates in the tubes and SW is sprayed on the outside
Little pressure difference betw. inside and outside of tube (ΔP < 0.1 bar)
Distillate in the higher pressure side
Failure of MSF tubes more likely to occur, with high flowrate
Leak of MSF tubes is SW that will contaminate the distillate
Leak of MED tubes is steam at low flowrate, without effect on product quality
Heating medium
Uses steam at pressure between 2 & 3 bars
Can make use and be optimised for steam between 0.35 and 40 bars
MED process can make use of less valuable (lower pressure) steam
MED can be sized for 2+ steam pressure conditions
Enhanced process
Based on large brine recirculation pump
7+ volumes of brine will recirculate to produce 1 volume of distillate
Large, thick water boxes required; expensive material
Based on vapour recirculation
Vapour recirculated by Thermal Vapour Compression (MED-TVC)
MED: no sophisticated, expensive and critical rotating pump in place
Less maintenance downtime during pump maintenance
MSF: electrical consumption is higher by up to 3 kWh/m³
Scaling & Corrosion
Operation up to 120°C
Permanent sponge balls cleaning system (taprogge)
Permanent injection of 2 –
3 ppm antiscalant & 0.1 ppm antifoam
Periodic acid cleaning of tubes & demisters
Operation at temperatures below 65°C and at low concentration (<1.5) to reduce scaling
Permanent injection of 2 –
3 ppm antiscalant & 0.1 ppm antifoam
Periodic acid cleaning of tubes
MED & MSF: same period of operation between acid cleanings
MSF: demisters fouling at top stages causes more maintenance and stops
Operability & Availability
Important quantity of water and wide range of temperature within evaporator (110°C –
40°C)Minimized quantity of water and reduced range of
temperature within evaporator (66°C –
40°C)
MSF: less flexible, start-up and shutdown longer
MED: easier to operate, better availability and easy load variation
Slide 16General Presentation – December 2011
2.7
Economic Advantages of MED vs. MSF 2.7
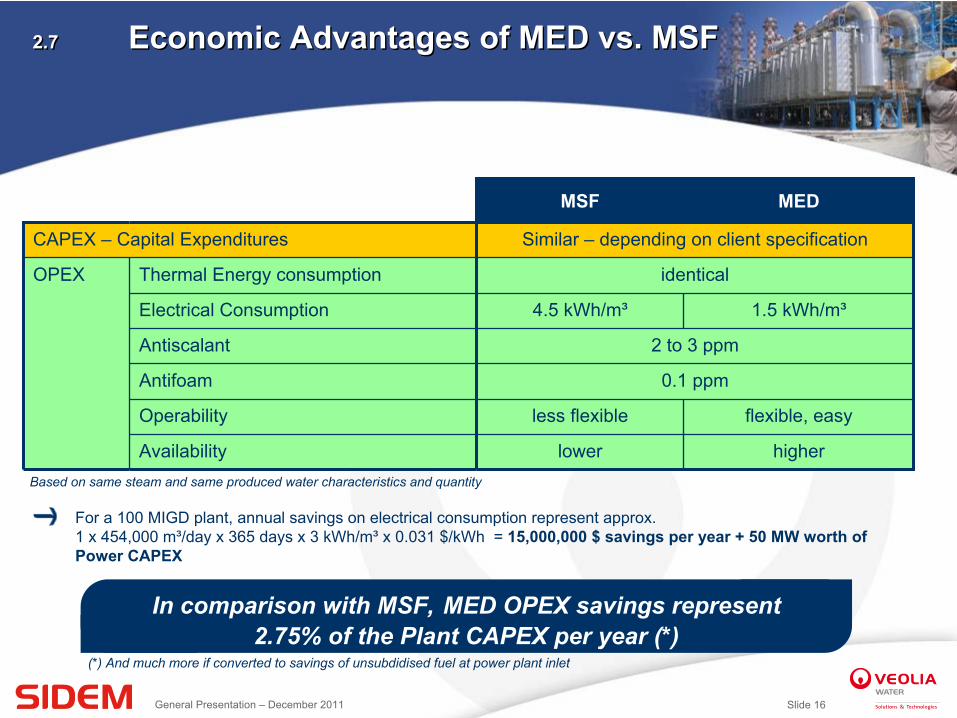
Economic Advantages of MED vs. MSF
MSF MED
CAPEX –
Capital Expenditures Similar –
depending on client specification
OPEX Thermal Energy consumption identical
Electrical Consumption 4.5 kWh/m³ 1.5 kWh/m³
Antiscalant 2 to 3 ppm
Antifoam 0.1 ppm
Operability less flexible flexible, easy
Availability lower higherBased on same steam and same produced water characteristics and quantity
For a 100 MIGD plant, annual savings on electrical consumption represent approx.
1 x 454,000 m³/day x 365 days x 3 kWh/m³
x 0.031 $/kWh = 15,000,000 $ savings per year + 50 MW worth of Power CAPEX
In comparison with MSF,
MED OPEX savings represent 2.75% of the Plant CAPEX per year (*)
(*) And much more if converted to savings of unsubdidised fuel at power plant inlet
Slide 17General Presentation – December 2011
2.8
MED / RO Hybrid Plants2.8
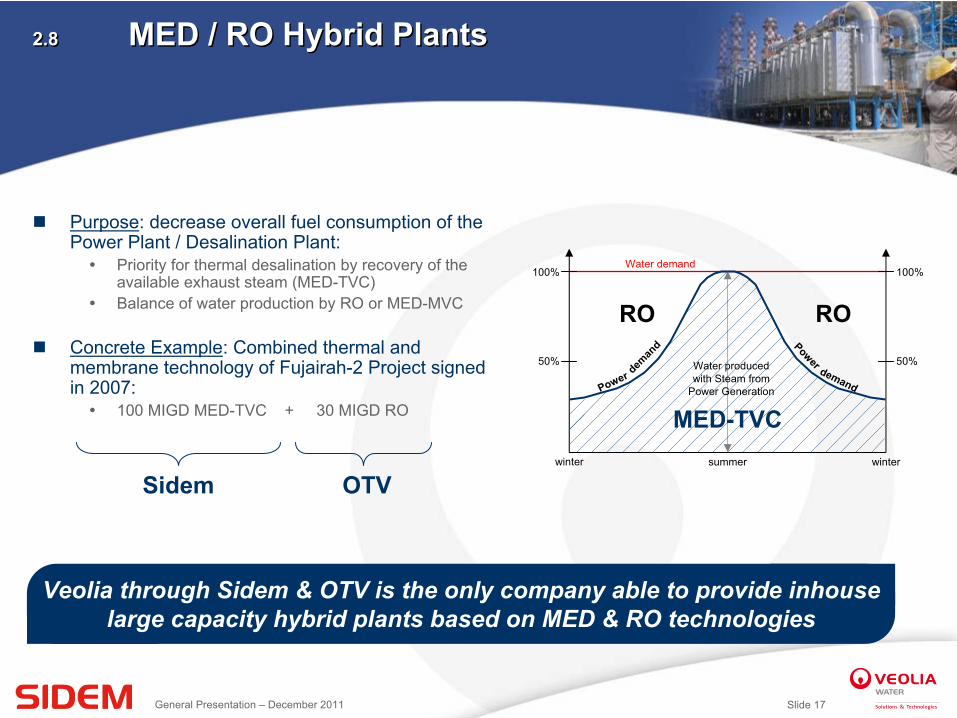
MED / RO Hybrid Plants
Purpose: decrease overall fuel consumption of the Power Plant / Desalination Plant:
Priority for thermal desalination by recovery of the available exhaust steam (MED-TVC)
Balance of water production by RO or MED-MVC
Concrete Example: Combined thermal and membrane technology of Fujairah-2 Project signed in 2007:
100 MIGD MED-TVC + 30 MIGD RO
Water demand100%
50%
100%
50%
RO
winter wintersummer
Power deman
d Power demand
Water produced with Steam from
Power Generation
MED-TVC
RO
Sidem OTV
Veolia through Sidem & OTV is the only company able to provide inhouse large capacity hybrid plants based on MED & RO technologies
Slide 18General Presentation – December 2011
2.9
Research
& Development2.9
Research
& Development
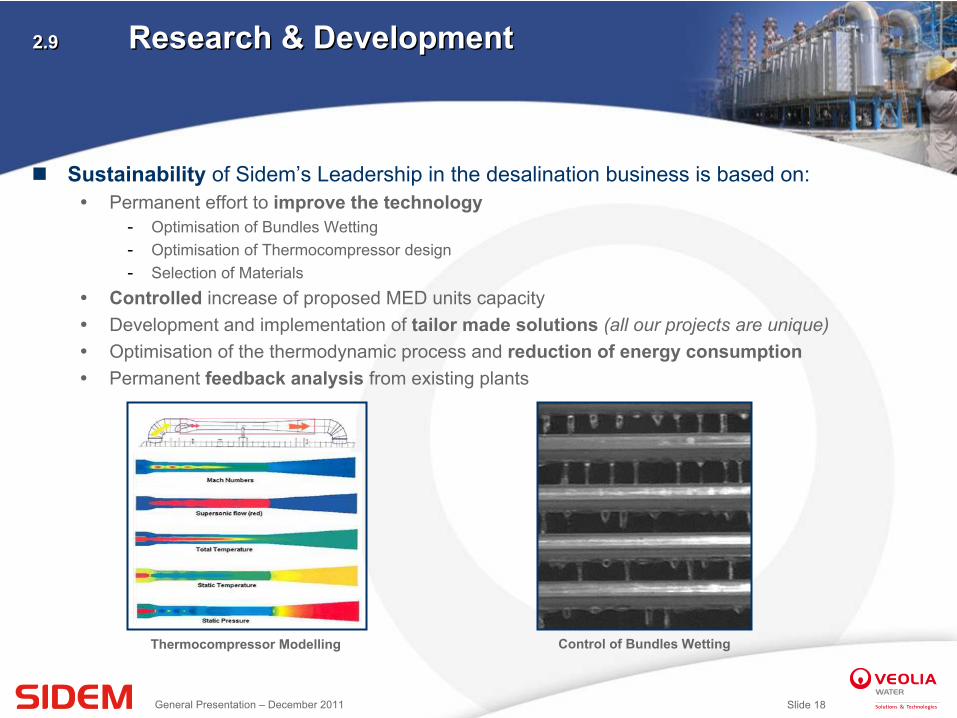
Sustainability
of Sidem’s Leadership in the desalination
business is
based
on:
Permanent effort to improve
the technology-
Optimisation of Bundles Wetting-
Optimisation of Thermocompressor
design-
Selection
of Materials
Controlled
increase
of proposed
MED units
capacity
Development
and implementation
of tailor
made solutions
(all our
projects
are unique)
Optimisation of the thermodynamic
process
and reduction
of energy
consumption
Permanent feedback analysis
from
existing
plants
Thermocompressor
Modelling Control of Bundles Wetting
Slide 19General Presentation – December 2011
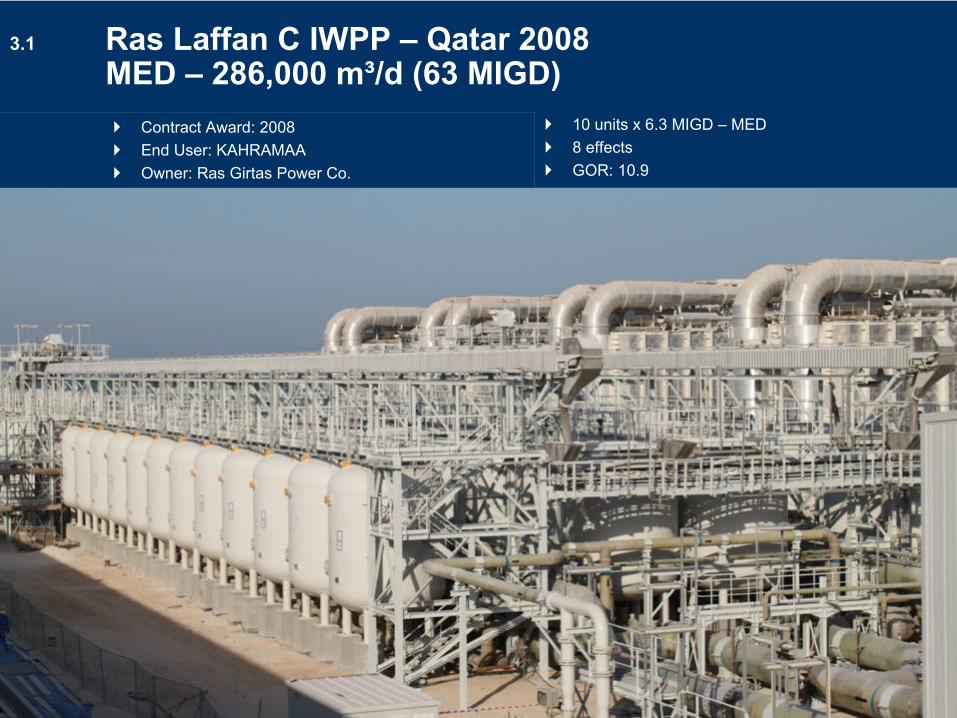
10 units x 6.3 MIGD –
MED
8 effects
GOR: 10.9
Contract Award: 2008
End User: KAHRAMAA
Owner: Ras Girtas Power Co.
3.1
Ras Laffan C IWPP –
Qatar 2008 MED –
286,000 m³/d (63 MIGD)
Slide 20General Presentation – December 2011
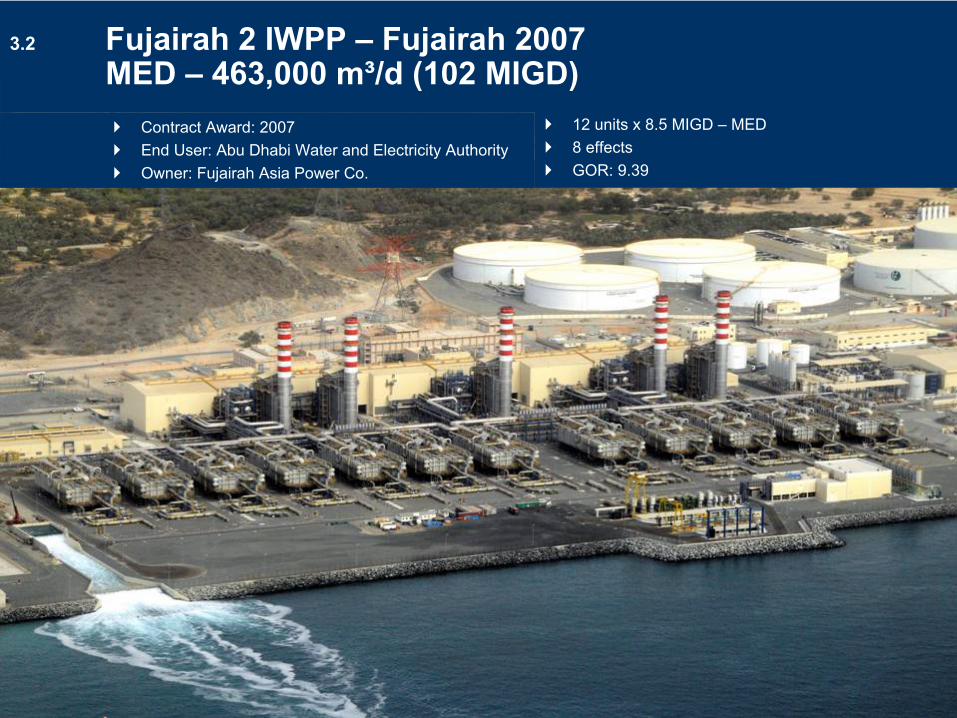
12 units x 8.5 MIGD –
MED
8 effects
GOR: 9.39
Contract Award: 2007
End User: Abu Dhabi Water and Electricity Authority
Owner: Fujairah Asia
Power Co.
3.2
Fujairah 2 IWPP –
Fujairah 2007 MED –
463,000 m³/d (102 MIGD)
Slide 21General Presentation – December 2011
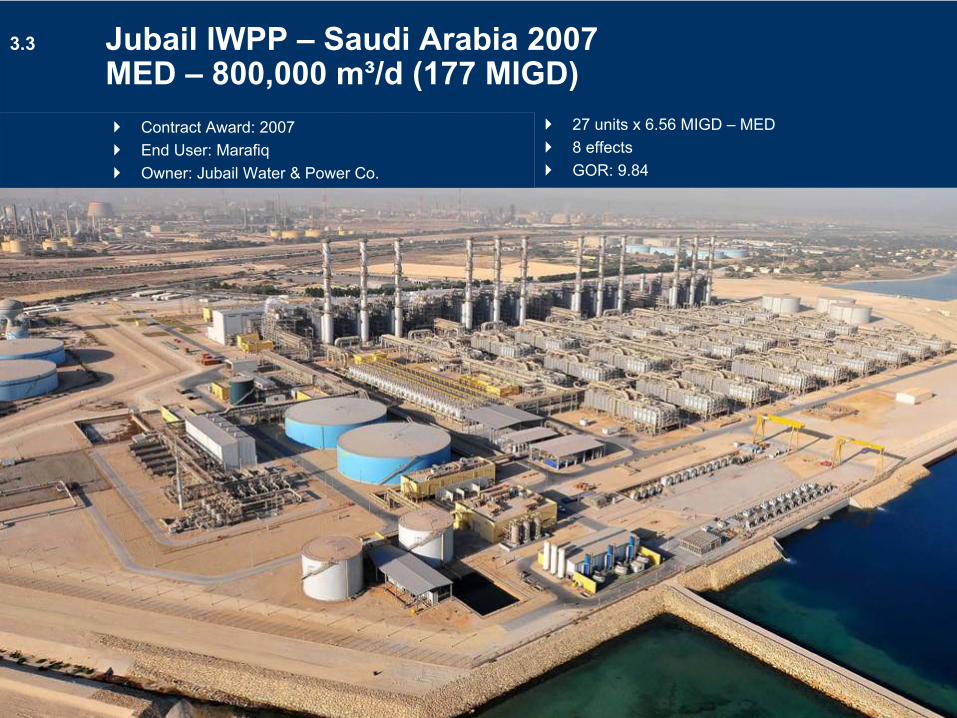
27 units x 6.56 MIGD –
MED
8 effects
GOR: 9.84
Contract Award: 2007
End User: Marafiq
Owner: Jubail Water & Power Co.
3.3
Jubail IWPP –
Saudi Arabia 2007 MED –
800,000 m³/d (177 MIGD)
Slide 22General Presentation – December 2011
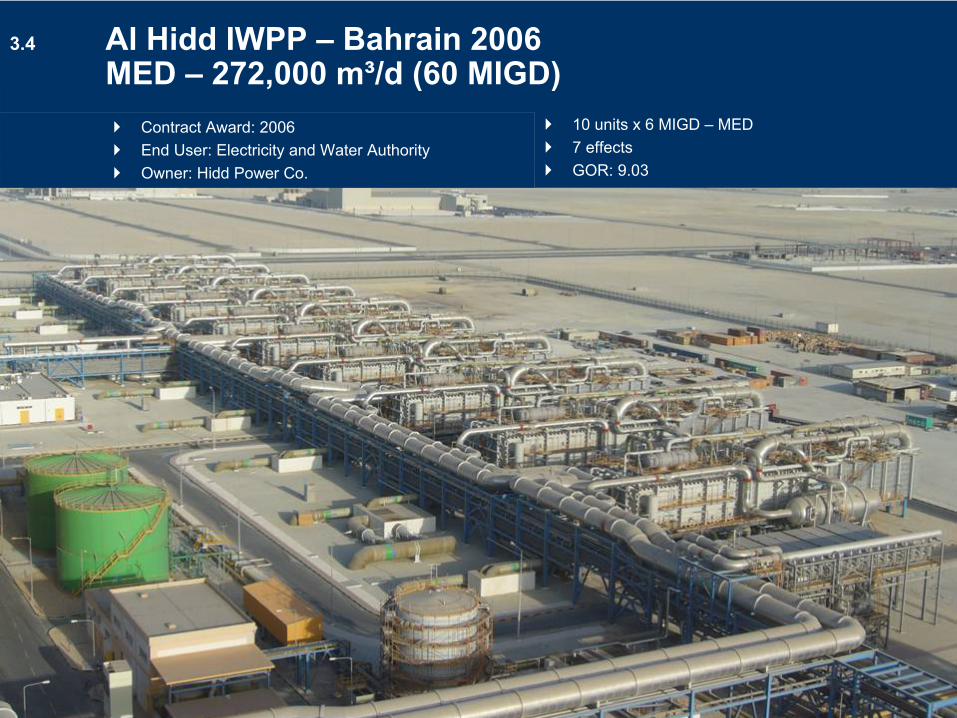
10 units x 6 MIGD –
MED
7 effects
GOR: 9.03
Contract Award: 2006
End User: Electricity and Water Authority
Owner: Hidd
Power Co.
3.4
Al Hidd IWPP –
Bahrain 2006 MED –
272,000 m³/d (60 MIGD)

Slide 23General Presentation – December 2011
14 units x 3.77 MIGD –
MED
6 effects
GOR: 8.04
Contract Award: 2000
End User: Abu Dhabi Water & Electricity Authority
Owner: Gulf Total Tractebel
Power Co.
3.5
Al Taweelah A1 IWPP –
Abu Dhabi 2006 MED –
240,000 m³/d (53 MIGD)

Slide 24General Presentation – December 2011
Al KhobarAl Khobar3.6
Al Khobar Phase II –
Saudi Arabia 1979 MSF –
267,000 m³/d (59 MIGD)
Slide 25General Presentation – December 2011
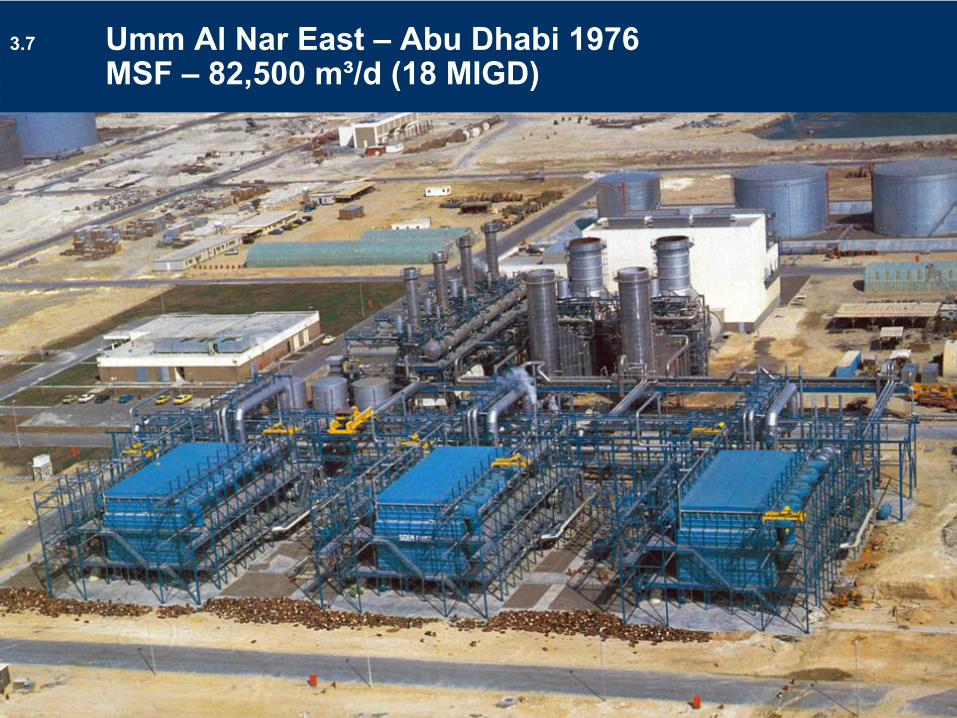
Umm Al Nar EastUmm Al Nar East3.7
Umm Al Nar East –
Abu Dhabi 1976 MSF –
82,500 m³/d (18 MIGD)