radascan operator’s guide - wartsila.com
TRANSCRIPT
www.guidance.eu.comwww.marine.direct
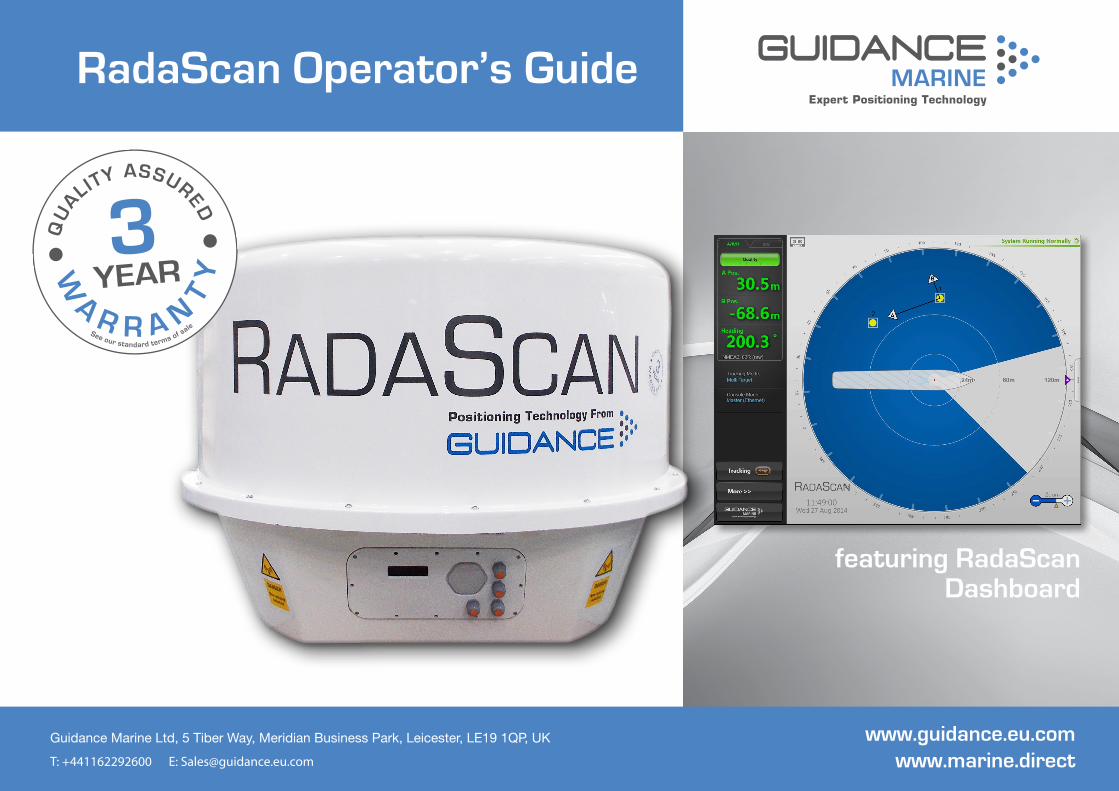
RadaScan Operator’s Guide
W
A R R A N
TY
See our standard terms of sale
QU
ALITY ASSURED3YEAR
featuring RadaScan Dashboard
Guidance Marine Ltd, 5 Tiber Way, Meridian Business Park, Leicester, LE19 1QP, UKT: +441162292600 E: [email protected]
0191
VYMRADASCAN
Guidance Marine Ltd,5 Tiber WayMeridian Business ParkLeicesterLE19 1QPUK
Tel: +44 116 229 2600 Tel (Customer Services): +44 116 229 2665 Email: www.guidance.eu.com/customer-support Web: www.guidance.eu.com
Copyright © Guidance Marine Limited. All Rights Reserved.Copyright in the whole and every part of this document belongs to Guidance Marine Limited (the “Owner”) and may not be used, sold, transferred, copied or reproduced in whole or in part in any manner or form or in or on any media to any person other than in accordance with the terms of the Owner’s Agreement or otherwise without the prior written consent of the Owner. “RadaScan” is a registered trademark of Guidance Marine Ltd. ”Windows” is a trademark of Microsoft Corporation. All other brand or product names are trademarks or registered trademarks of their respective companies or organisations.
Serial No:
Date of Shipment from UK:
Sensor Software Version: Dashboard Software Version:
RadaScan (Dashboard) Operator’s GuideIssue Date: 29/03/2017Document No: 94-0393-4-C
ll 3
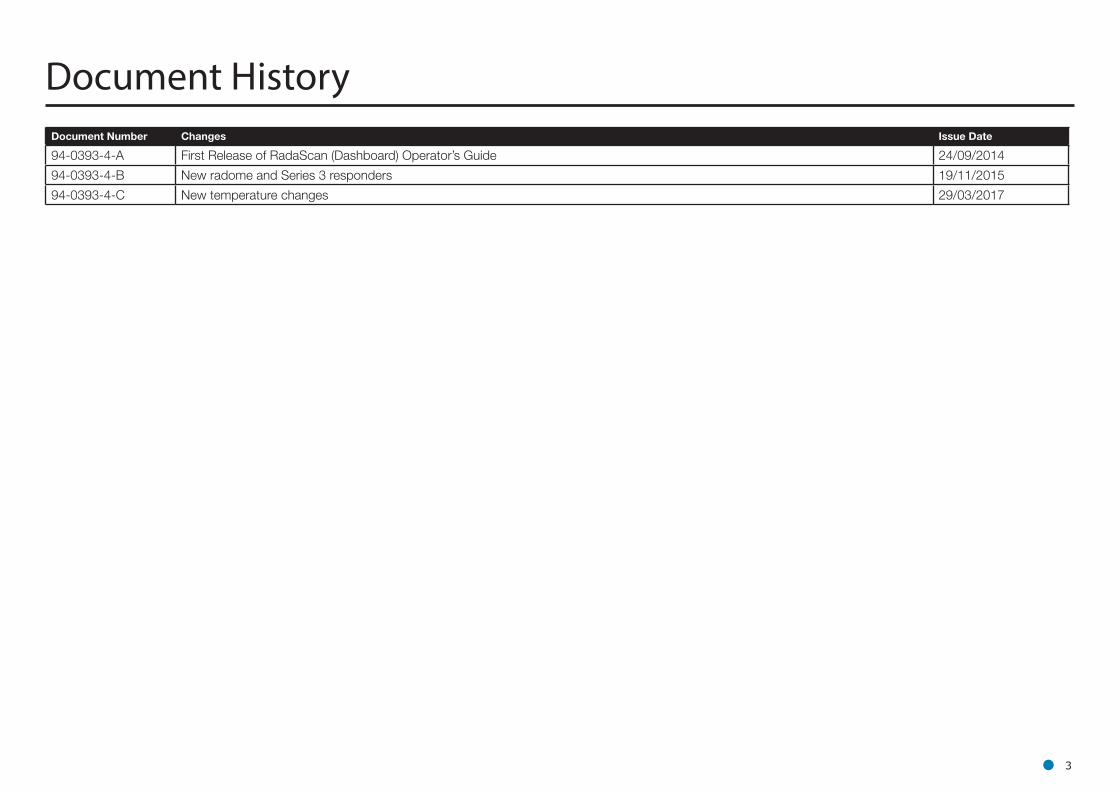
Document HistoryDocument Number Changes Issue Date
94-0393-4-A First Release of RadaScan (Dashboard) Operator’s Guide 24/09/2014
94-0393-4-B New radome and Series 3 responders 19/11/2015
94-0393-4-C New temperature changes 29/03/2017
ll 4
IntroductionWelcome ................................................................................................................... 6System Overview ...................................................................................................... 7
Getting StartedStart Up and Shut Down .......................................................................................... 9
Start Up.............................................................................................................................................. 9Shut Down ......................................................................................................................................... 9
Screen Layout ........................................................................................................ 10Main Screen and Bird's Eye View (BEV) .......................................................................................... 11Side Bar ........................................................................................................................................... 13Hotkey Buttons ................................................................................................................................ 14Menu Pane ....................................................................................................................................... 15
Tracking Information Quality ................................................................................... 16Display Views ......................................................................................................... 17
Animation ......................................................................................................................................... 18Vessel Orientation ................................................................................................... 19
Readiness for TrackingBlanking Zones ....................................................................................................... 21Working with Reflections ........................................................................................ 22
Detecting Responders ..................................................................................................................... 22Reflections Pane .............................................................................................................................. 23Extended Information Pane ............................................................................................................. 24Reset ................................................................................................................................................ 24
Single and Multi-Target TrackingIntroduction to Single and Multi-Target Tracking ................................................... 26
Single and Multi-Target Modes ....................................................................................................... 26Positional Display Modes ....................................................................................... 28Selecting Targets for Multi-Target Groups .............................................................. 30
Target Selection Order ..................................................................................................................... 30Target Selection Order and Coordinate Axes Direction ................................................................... 31Vessel Heading ................................................................................................................................ 32
Rotational Offsets ................................................................................................... 33Axis Orientation and Vessel Heading Examples ............................................................................... 34Axis Orientation and A Pos and B Pos Coordinates ........................................................................ 36Aligning a Multi-Target Group to a Given Vessel Heading ............................................................... 37
Multi - Dashboard RadaScan SystemsRadaScan Dashboard - Master Mode ................................................................... 39RadaScan Dashboard - Slave Mode ...................................................................... 40
Support InformationSerial Numbers and Software Versions .................................................................. 42
Product Labels ................................................................................................................................. 42Software Version Information ........................................................................................................... 42To Display the About System Pane .................................................................................................. 42
DP Feed .................................................................................................................. 43Entering Service Access Mode .............................................................................. 44Data Logging .......................................................................................................... 45
Extended Logging Mode ................................................................................................................. 45Starting and Stopping Manual Logging ........................................................................................... 45To start manual logging: ................................................................................................................... 45Taking Screenshots .......................................................................................................................... 46
AppendicesSetting the Date and Time ...................................................................................... 48Using the On-Screen Keyboard ............................................................................. 49Working with Alarms ............................................................................................... 50International Standards Compliance ...................................................................... 52
RadaScan Transceiver ..................................................................................................................... 52RadaScan Responders .................................................................................................................... 52
System Specifications ............................................................................................ 53Low Temperature Start Up ..................................................................................... 54Index ....................................................................................................................... 55
Table of Contents
ll 5
This section provides an introduction and overview of the RadaScan system. It contains the following pages:
• Welcome (Page 6)
• System Overview (Page 7)
Introduction
ll 6
Welcome to the RadaScan (Dashboard) Operator’s Guide. It explains how to use the RadaScan system once it has been fully installed. For instructions on how to install the system onto a vessel, please see the RadaScan (Dashboard) Installer’s Guide (Doc No 94-0394-4).
The System Overview on page 7 describes the different components of the system and how they work together.
The Getting Started section on page 8 explains how to get the system up and running and how to shut it down again. It also details what you will see on the Dashboard screen when the system is running, and how to interpret the information.
The Readiness for Tracking section on page 20 deals with the state of the RadaScan system prior to commencing a tracking operation.
The Single and Multi-Target Tracking section on page 25 explains the concepts involved in single and multi-target tracking. Please ensure that you understand the material in this section before attempting to use the RadaScan system for multi-target tracking.
Further useful information is included in the Support Information section on page 41, and in the Appendices on page 47.
Welcome
ll 7
The RadaScan position reference system combines the accuracy of a laser-based system with the all-weather capabilities of radar. It provides precise positional data to DP (dynamic positioning) vessel control systems, which can be used to enable automated approach and station keeping relative to a structure or other vessel.
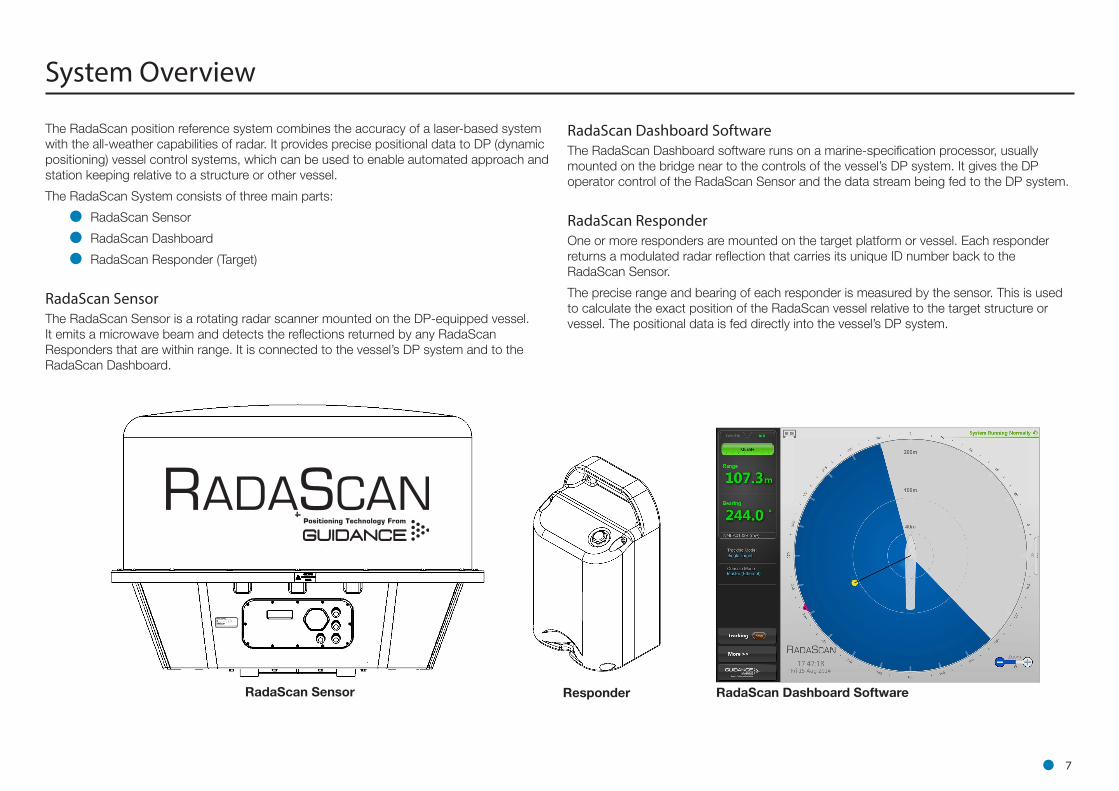
The RadaScan System consists of three main parts:
• RadaScan Sensor
• RadaScan Dashboard
• RadaScan Responder (Target)
RadaScan SensorThe RadaScan Sensor is a rotating radar scanner mounted on the DP-equipped vessel. It emits a microwave beam and detects the reflections returned by any RadaScan Responders that are within range. It is connected to the vessel’s DP system and to the RadaScan Dashboard.
System Overview
RadaScan Dashboard SoftwareThe RadaScan Dashboard software runs on a marine-specification processor, usually mounted on the bridge near to the controls of the vessel’s DP system. It gives the DP operator control of the RadaScan Sensor and the data stream being fed to the DP system.
RadaScan ResponderOne or more responders are mounted on the target platform or vessel. Each responder returns a modulated radar reflection that carries its unique ID number back to the RadaScan Sensor.
The precise range and bearing of each responder is measured by the sensor. This is used to calculate the exact position of the RadaScan vessel relative to the target structure or vessel. The positional data is fed directly into the vessel’s DP system.
RadaScan Sensor RadaScan Dashboard SoftwareResponder
ll 8
Getting StartedThis section covers the basics of using the RadaScan system. It contains the following pages:
• Start Up and Shut Down (Page 9)
• Screen Layout (Page 10)
• Tracking Information Quality (Page 16)
ll 9
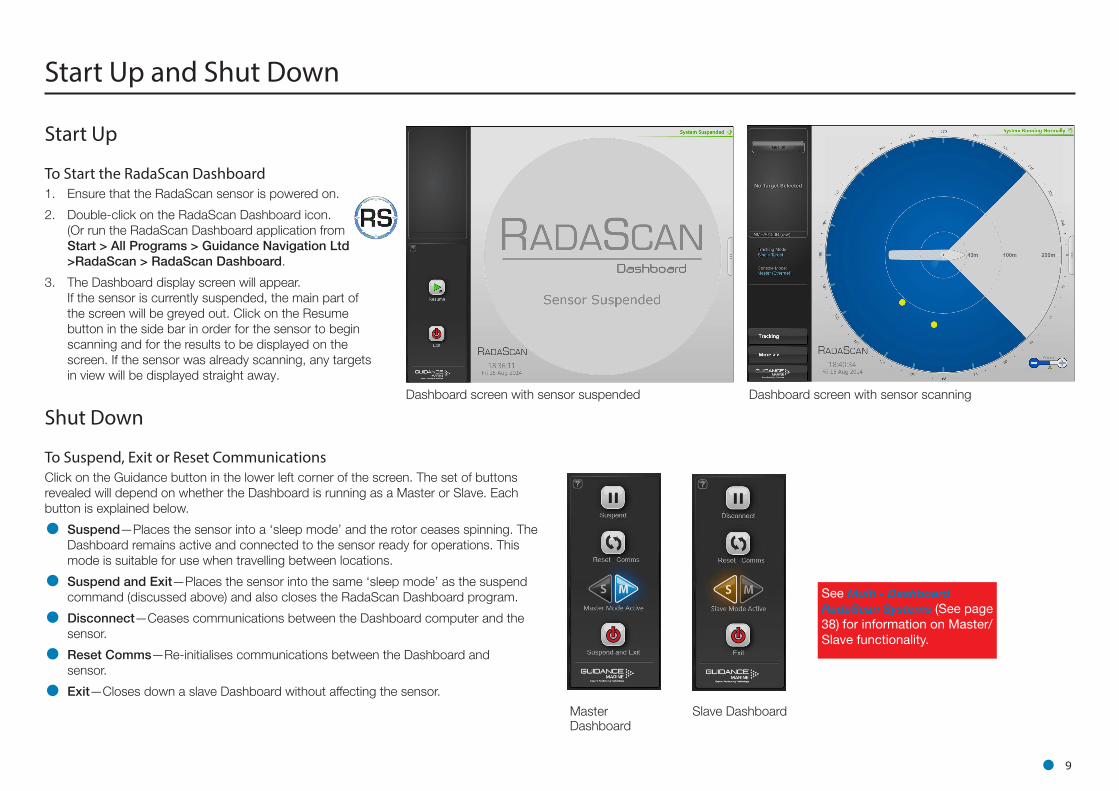
Dashboard screen with sensor suspended Dashboard screen with sensor scanning
Master Dashboard
Slave Dashboard
Start Up and Shut Down
Start Up
To Start the RadaScan Dashboard1. Ensure that the RadaScan sensor is powered on.
2. Double-click on the RadaScan Dashboard icon. (Or run the RadaScan Dashboard application from Start > All Programs > Guidance Navigation Ltd >RadaScan > RadaScan Dashboard.
3. The Dashboard display screen will appear. If the sensor is currently suspended, the main part of the screen will be greyed out. Click on the Resume button in the side bar in order for the sensor to begin scanning and for the results to be displayed on the screen. If the sensor was already scanning, any targets in view will be displayed straight away.
Shut Down
To Suspend, Exit or Reset CommunicationsClick on the Guidance button in the lower left corner of the screen. The set of buttons revealed will depend on whether the Dashboard is running as a Master or Slave. Each button is explained below.
• Suspend—Places the sensor into a ‘sleep mode’ and the rotor ceases spinning. The Dashboard remains active and connected to the sensor ready for operations. This mode is suitable for use when travelling between locations.
• Suspend and Exit—Places the sensor into the same ‘sleep mode’ as the suspend command (discussed above) and also closes the RadaScan Dashboard program.
• Disconnect—Ceases communications between the Dashboard computer and the sensor.
• Reset Comms—Re-initialises communications between the Dashboard and sensor.
• Exit—Closes down a slave Dashboard without affecting the sensor.
See Multi - Dashboard RadaScan Systems (See page 38) for information on Master/Slave functionality.
ll 10
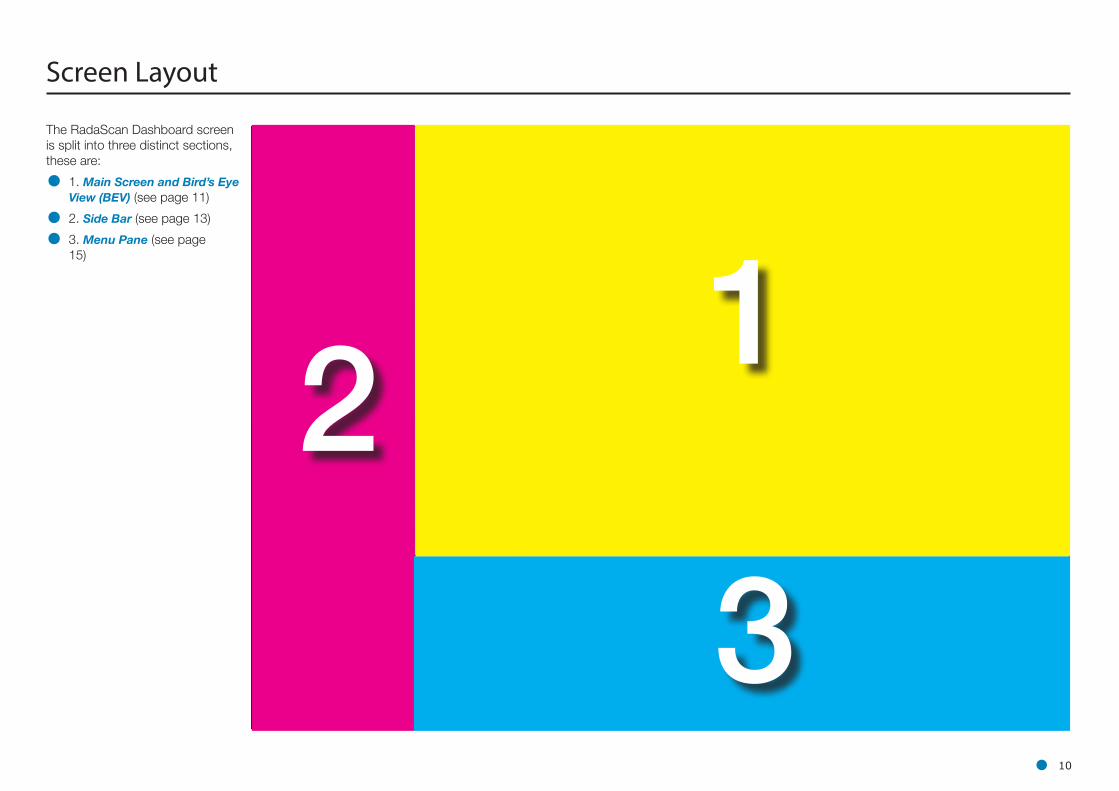
Screen Layout
The RadaScan Dashboard screen is split into three distinct sections, these are:
• 1. Main Screen and Bird’s Eye View (BEV) (see page 11)
• 2. Side Bar (see page 13)
• 3. Menu Pane (see page 15)
12
3
ll 11
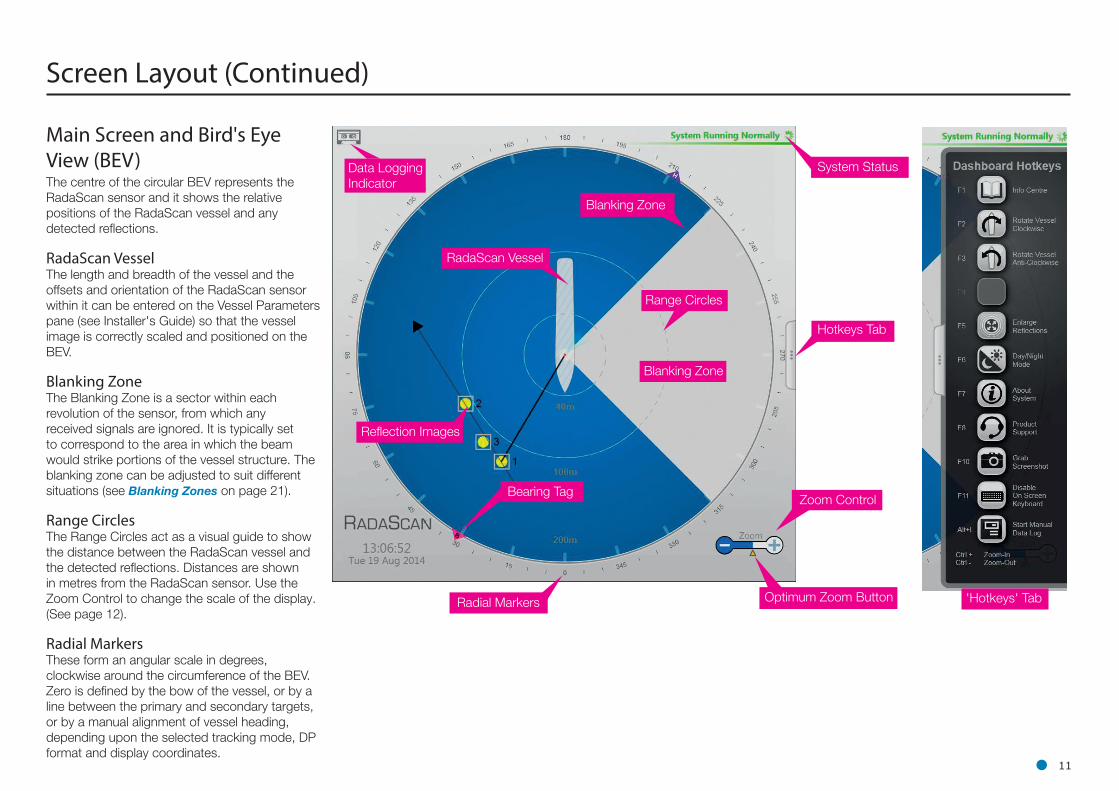
Main Screen and Bird's Eye View (BEV)The centre of the circular BEV represents the RadaScan sensor and it shows the relative positions of the RadaScan vessel and any detected reflections.
RadaScan VesselThe length and breadth of the vessel and the offsets and orientation of the RadaScan sensor within it can be entered on the Vessel Parameters pane (see Installer's Guide) so that the vessel image is correctly scaled and positioned on the BEV.
Blanking ZoneThe Blanking Zone is a sector within each revolution of the sensor, from which any received signals are ignored. It is typically set to correspond to the area in which the beam would strike portions of the vessel structure. The blanking zone can be adjusted to suit different situations (see Blanking Zones on page 21).
Range CirclesThe Range Circles act as a visual guide to show the distance between the RadaScan vessel and the detected reflections. Distances are shown in metres from the RadaScan sensor. Use the Zoom Control to change the scale of the display. (See page 12).
Radial MarkersThese form an angular scale in degrees, clockwise around the circumference of the BEV. Zero is defined by the bow of the vessel, or by a line between the primary and secondary targets, or by a manual alignment of vessel heading, depending upon the selected tracking mode, DP format and display coordinates.
Screen Layout (Continued)
Blanking Zone
RadaScan Vessel
Range Circles
Blanking Zone
Reflection Images
Bearing TagZoom Control
Hotkeys Tab
System Status
Radial Markers Optimum Zoom Button 'Hotkeys' Tab
Data LoggingIndicator
ll 12
Screen Layout (Continued)
Reflection ImagesReflections received by the sensor are displayed as yellow circles. For tracking you must select the reflection(s) that correspond to the physical target(s) to be used. During multi-target tracking, grey boxes are drawn around the selected reflections to indicate a strong association with the target (i.e. the system is receiving good data and is confident of the target position). A red box appears around a selected reflection during tracking if the system has lost sight of the target, or there is insufficient data being received to use it for tracking.
Bearing and Heading TagsThese are displayed on the Radial Marker when the system is in tracking mode, to indicate the bearing of the primary (or only) target and the vessel's heading. The visibility of these two elements depends on the DP format selected and which coordinate system is being used to display the positional information (see Positional Display Modes on page 28).
Data Logging IndicatorThis symbol is displayed when data is being logged to disk. During a tracking operation the symbol is steady and when manual logging is in progress it flashes.
Zoom ControlClick on the left-hand side of the control (marked '-') to zoom out of the display and on the right-hand side ('+') to zoom in. Click on the yellow triangular Optimum Zoom button to ensure appropriate scaling of the BEV for the longest range reflection.
System StatusThis consists of two fields:
Primary
The primary part of the status display is in the upper-right corner of the Main Pane. It indicates the current status of the system (running, suspended or error).
Secondary
The secondary status display is located in the lower right corner of the Main Pane (beneath the zoom function) and is normally hidden. It displays a flashing message for a number of seconds in order to confirm an action taken by the user, e.g. starting manual data logging or activating a server access code. It can also display a persistent, static message if there is a communications problem.
ll 13
Screen Layout (Continued)
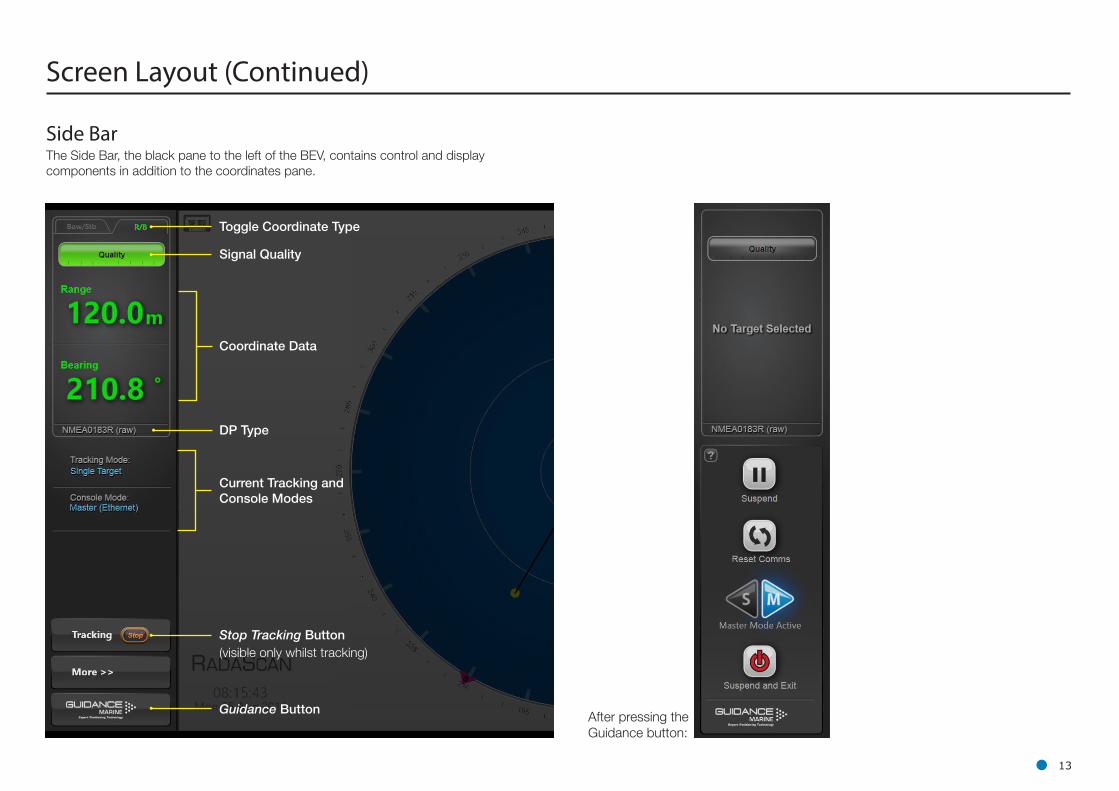
Side BarThe Side Bar, the black pane to the left of the BEV, contains control and display components in addition to the coordinates pane.
Toggle Coordinate Type
Signal Quality
Coordinate Data
DP Type
Current Tracking and Console Modes
Stop Tracking Button(visible only whilst tracking)
Guidance Button After pressing the Guidance button:
ll 14
Hotkeys Tab
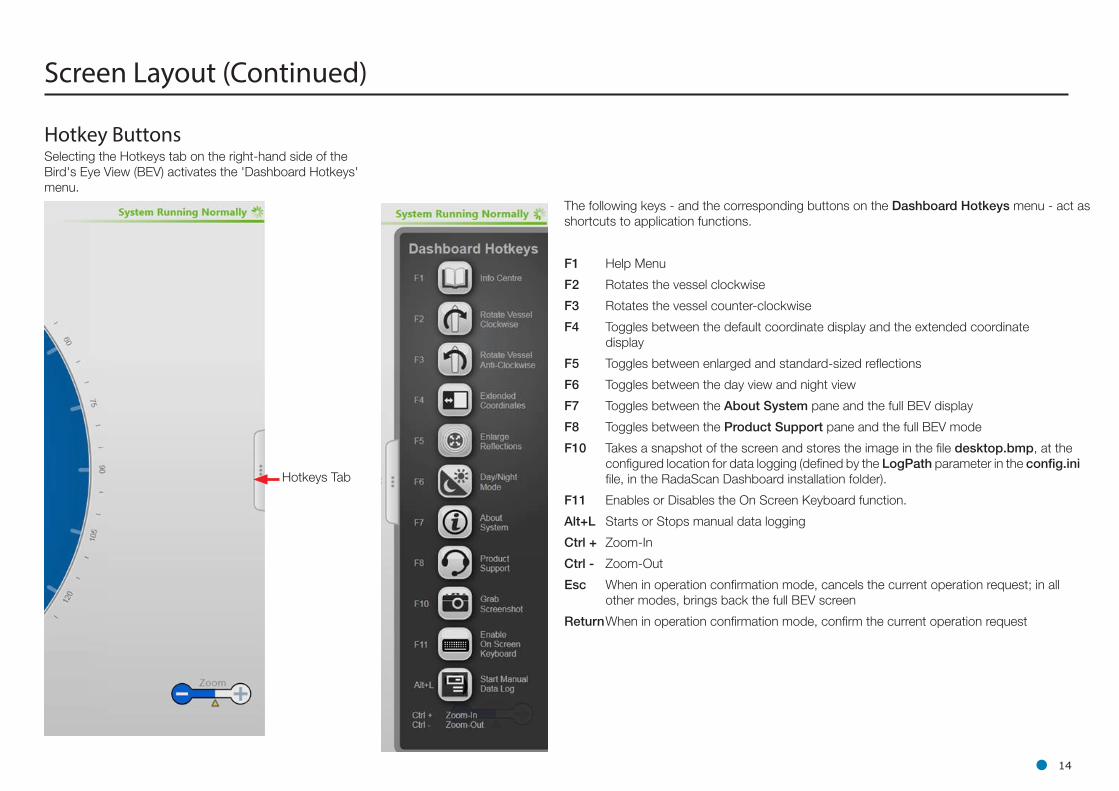
Hotkey ButtonsSelecting the Hotkeys tab on the right-hand side of the Bird's Eye View (BEV) activates the 'Dashboard Hotkeys' menu.
Screen Layout (Continued)
The following keys - and the corresponding buttons on the Dashboard Hotkeys menu - act as shortcuts to application functions.
F1 Help Menu
F2 Rotates the vessel clockwise
F3 Rotates the vessel counter-clockwise
F4 Toggles between the default coordinate display and the extended coordinate display
F5 Toggles between enlarged and standard-sized reflections
F6 Toggles between the day view and night view
F7 Toggles between the About System pane and the full BEV display
F8 Toggles between the Product Support pane and the full BEV mode
F10 Takes a snapshot of the screen and stores the image in the file desktop.bmp, at the configured location for data logging (defined by the LogPath parameter in the config.ini file, in the RadaScan Dashboard installation folder).
F11 Enables or Disables the On Screen Keyboard function.
Alt+L Starts or Stops manual data logging
Ctrl + Zoom-In
Ctrl - Zoom-Out
Esc When in operation confirmation mode, cancels the current operation request; in all other modes, brings back the full BEV screen
Return When in operation confirmation mode, confirm the current operation request
ll 15
Screen Layout (Continued)
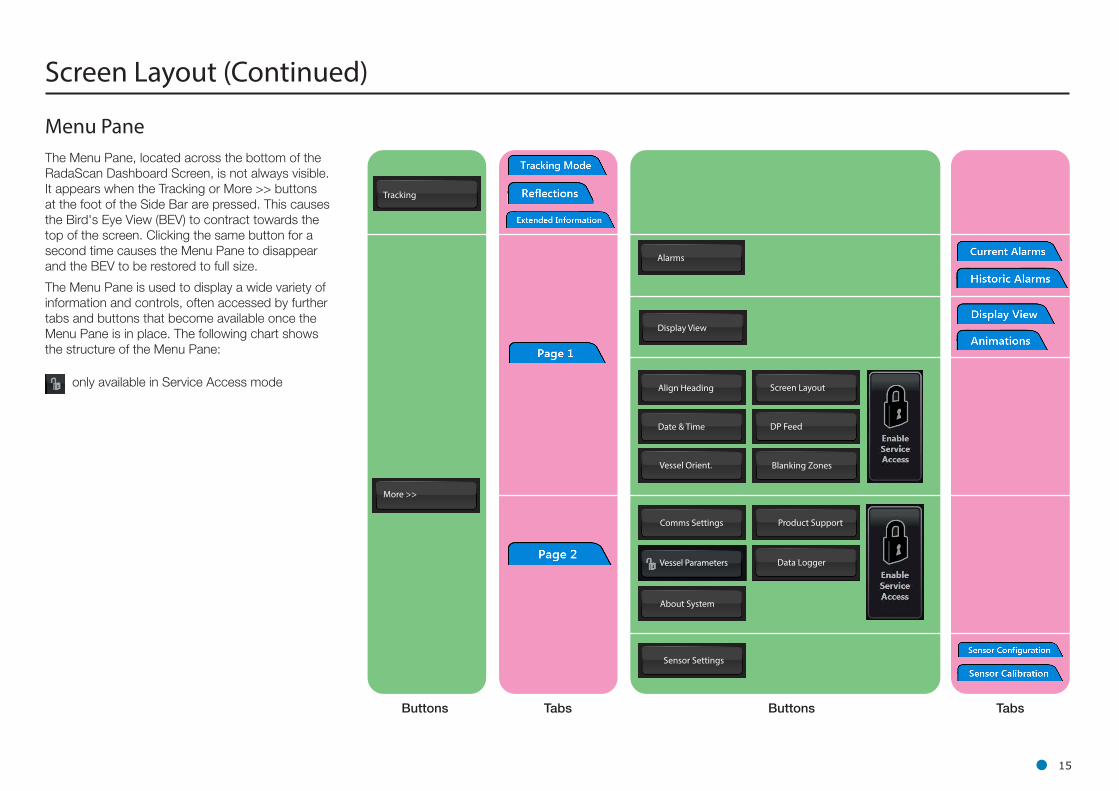
Menu PaneThe Menu Pane, located across the bottom of the RadaScan Dashboard Screen, is not always visible. It appears when the Tracking or More >> buttons at the foot of the Side Bar are pressed. This causes the Bird's Eye View (BEV) to contract towards the top of the screen. Clicking the same button for a second time causes the Menu Pane to disappear and the BEV to be restored to full size.
The Menu Pane is used to display a wide variety of information and controls, often accessed by further tabs and buttons that become available once the Menu Pane is in place. The following chart shows the structure of the Menu Pane:
only available in Service Access mode
Buttons ButtonsTabs Tabs
Alarms
Align Heading
Blanking Zones
Date & Time
Vessel Orient.
DP Feed
Screen Layout
Comms Settings
Vessel Parameters
Product Support
About System
Tracking
More >>
Display View
Sensor Settings
Data Logger
ll 16
Tracking Information Quality
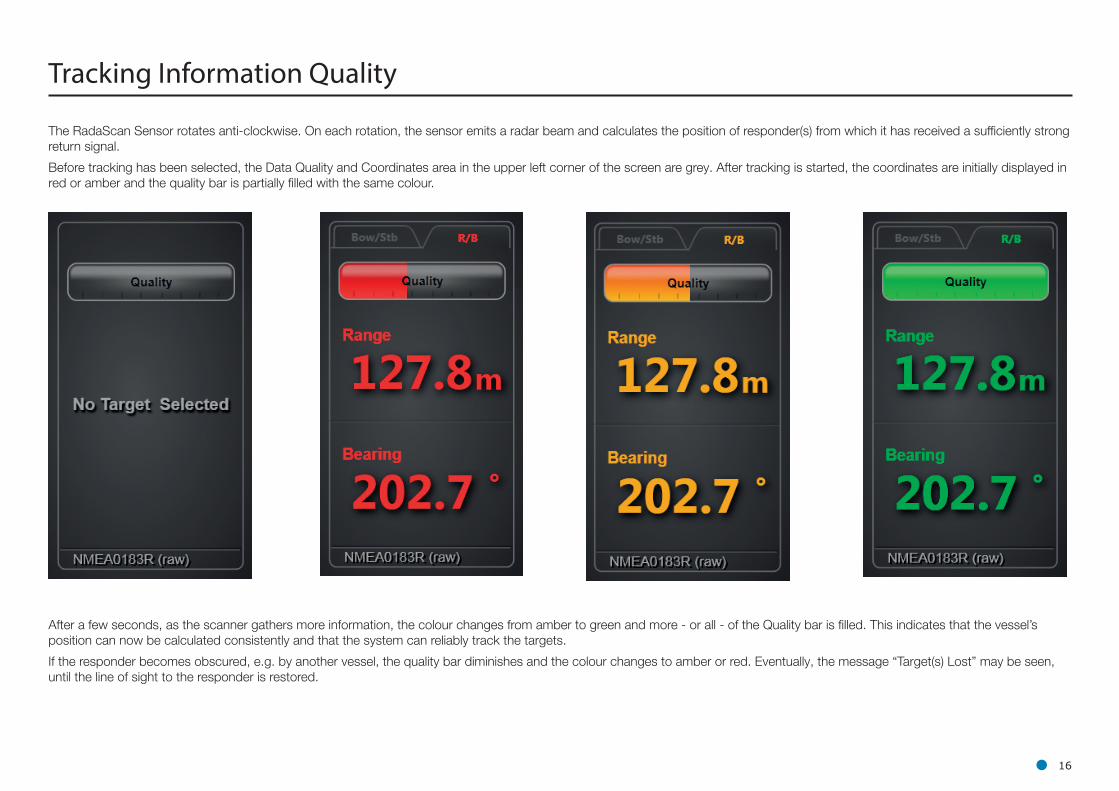
The RadaScan Sensor rotates anti-clockwise. On each rotation, the sensor emits a radar beam and calculates the position of responder(s) from which it has received a sufficiently strong return signal.
Before tracking has been selected, the Data Quality and Coordinates area in the upper left corner of the screen are grey. After tracking is started, the coordinates are initially displayed in red or amber and the quality bar is partially filled with the same colour.
After a few seconds, as the scanner gathers more information, the colour changes from amber to green and more - or all - of the Quality bar is filled. This indicates that the vessel’s position can now be calculated consistently and that the system can reliably track the targets.
If the responder becomes obscured, e.g. by another vessel, the quality bar diminishes and the colour changes to amber or red. Eventually, the message “Target(s) Lost” may be seen, until the line of sight to the responder is restored.
ll 17
Display Views
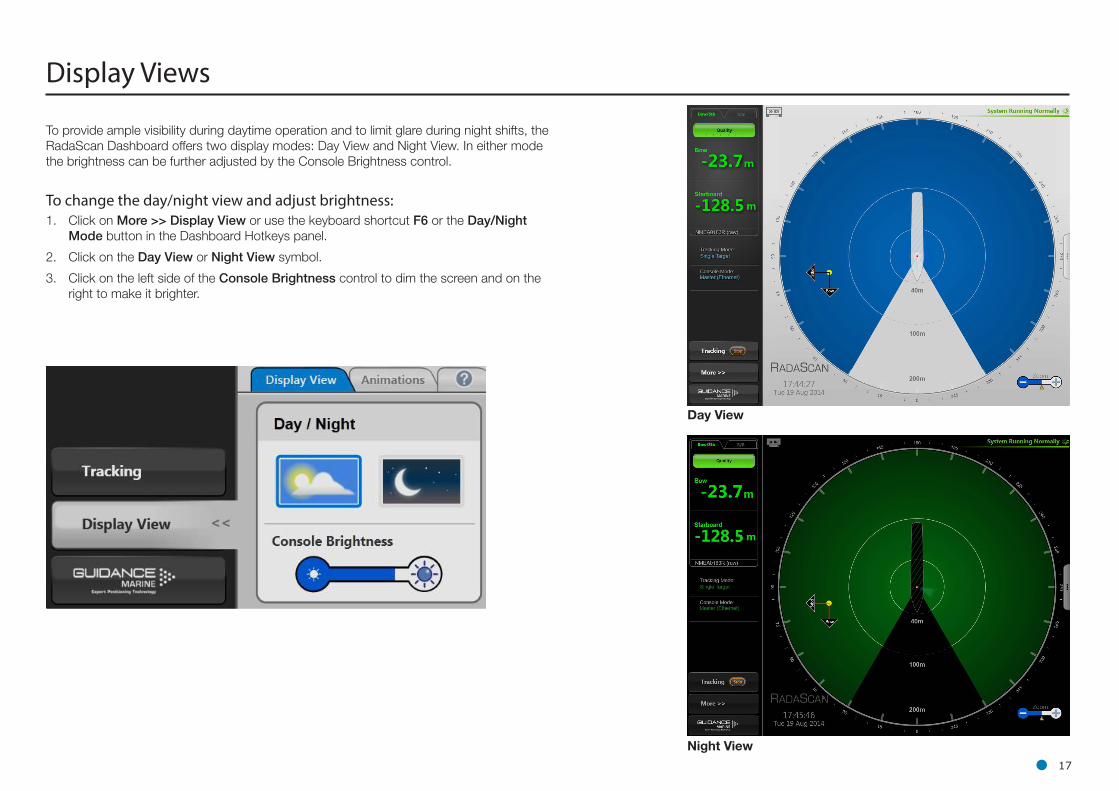
To provide ample visibility during daytime operation and to limit glare during night shifts, the RadaScan Dashboard offers two display modes: Day View and Night View. In either mode the brightness can be further adjusted by the Console Brightness control.
To change the day/night view and adjust brightness:1. Click on More >> Display View or use the keyboard shortcut F6 or the Day/Night
Mode button in the Dashboard Hotkeys panel.
2. Click on the Day View or Night View symbol.
3. Click on the left side of the Console Brightness control to dim the screen and on the right to make it brighter.
Night View
Day View
ll 18
Display Views (Continued)
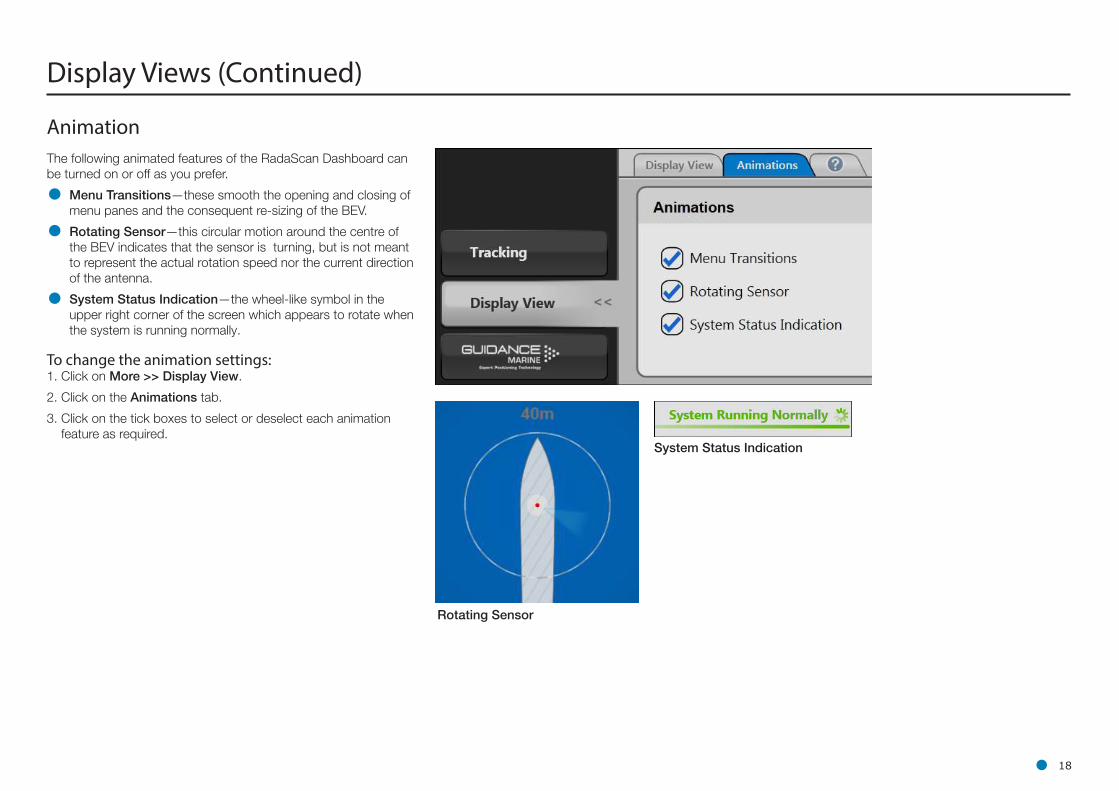
AnimationThe following animated features of the RadaScan Dashboard can be turned on or off as you prefer.
• Menu Transitions—these smooth the opening and closing of menu panes and the consequent re-sizing of the BEV.
• Rotating Sensor—this circular motion around the centre of the BEV indicates that the sensor is turning, but is not meant to represent the actual rotation speed nor the current direction of the antenna.
• System Status Indication—the wheel-like symbol in the upper right corner of the screen which appears to rotate when the system is running normally.
To change the animation settings:1. Click on More >> Display View.
2. Click on the Animations tab.
3. Click on the tick boxes to select or deselect each animation feature as required.
Rotating Sensor
System Status Indication
ll 19
Vessel Orientation
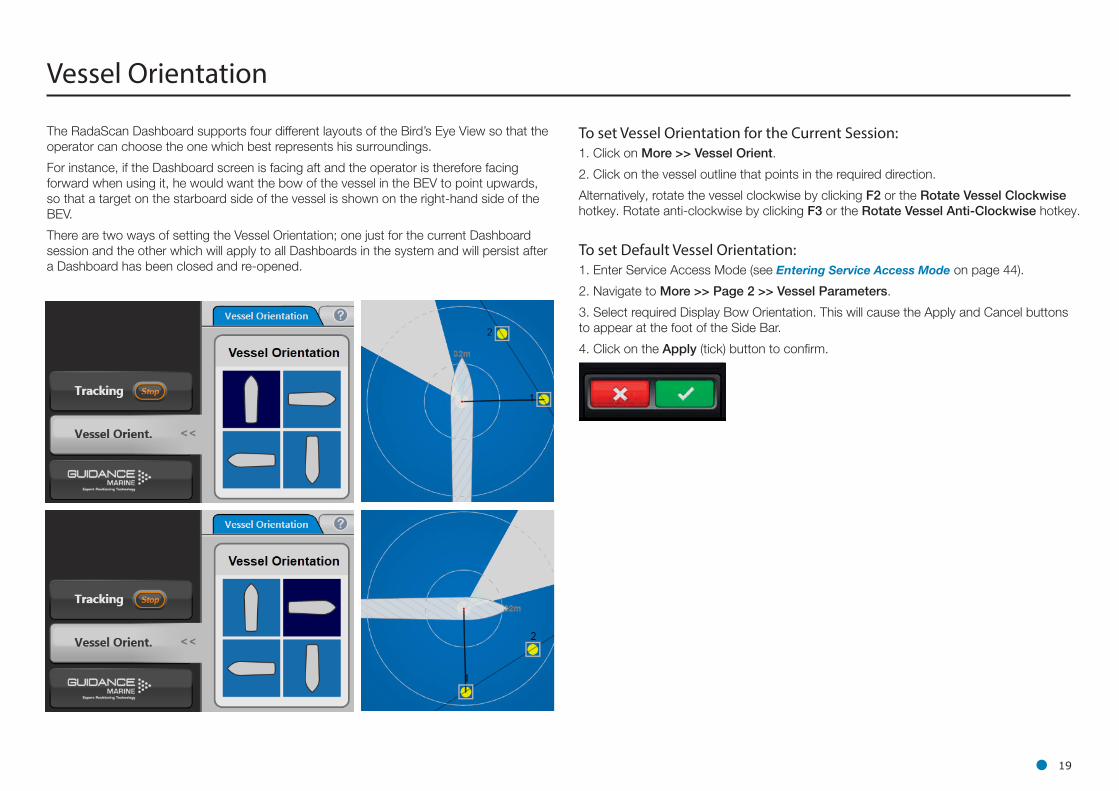
The RadaScan Dashboard supports four different layouts of the Bird’s Eye View so that the operator can choose the one which best represents his surroundings.
For instance, if the Dashboard screen is facing aft and the operator is therefore facing forward when using it, he would want the bow of the vessel in the BEV to point upwards, so that a target on the starboard side of the vessel is shown on the right-hand side of the BEV.
There are two ways of setting the Vessel Orientation; one just for the current Dashboard session and the other which will apply to all Dashboards in the system and will persist after a Dashboard has been closed and re-opened.
To set Default Vessel Orientation:1. Enter Service Access Mode (see Entering Service Access Mode on page 44).
2. Navigate to More >> Page 2 >> Vessel Parameters.
3. Select required Display Bow Orientation. This will cause the Apply and Cancel buttons to appear at the foot of the Side Bar.
4. Click on the Apply (tick) button to confirm.
To set Vessel Orientation for the Current Session:1. Click on More >> Vessel Orient.
2. Click on the vessel outline that points in the required direction.
Alternatively, rotate the vessel clockwise by clicking F2 or the Rotate Vessel Clockwise hotkey. Rotate anti-clockwise by clicking F3 or the Rotate Vessel Anti-Clockwise hotkey.
ll 20
This section deals with preparing the system and interpreting the information that it displays, prior to target tracking.
It contains the following pages:
• Blanking Zones (Page 21)
• Working with Reflections (Page 22)
Readiness for Tracking
ll 21
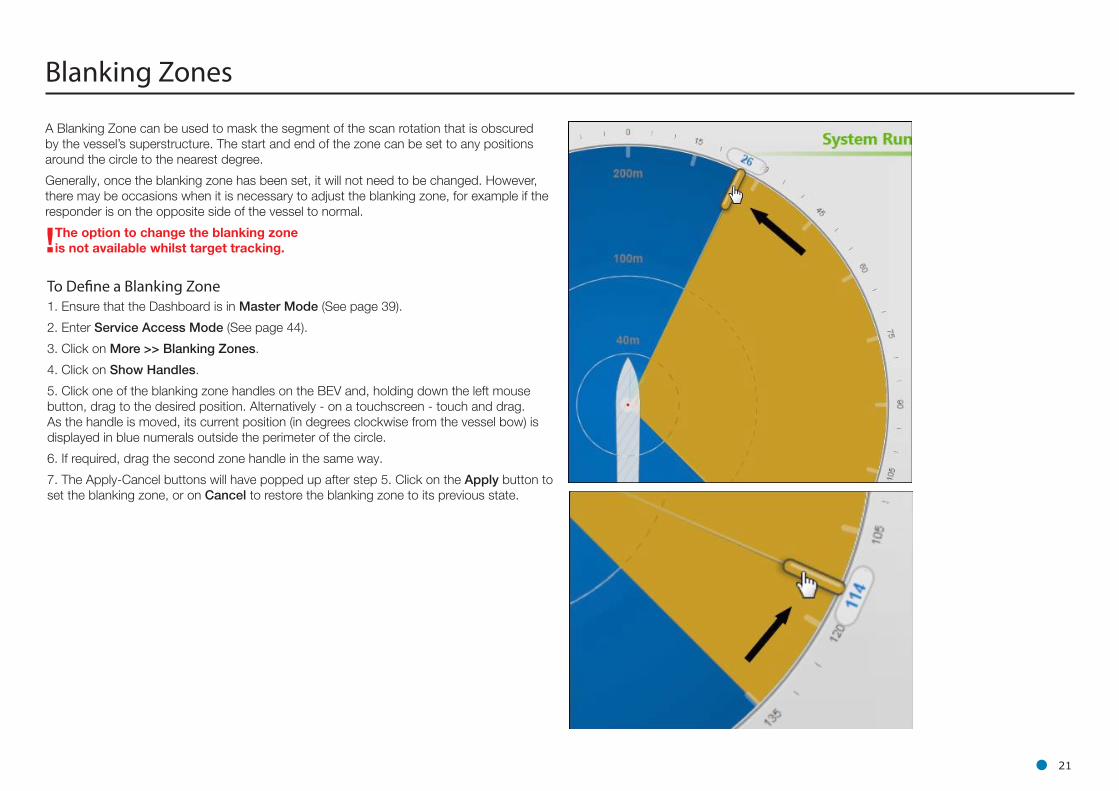
A Blanking Zone can be used to mask the segment of the scan rotation that is obscured by the vessel’s superstructure. The start and end of the zone can be set to any positions around the circle to the nearest degree.
Generally, once the blanking zone has been set, it will not need to be changed. However, there may be occasions when it is necessary to adjust the blanking zone, for example if the responder is on the opposite side of the vessel to normal.
!The option to change the blanking zone is not available whilst target tracking.
Blanking Zones
To Define a Blanking Zone1. Ensure that the Dashboard is in Master Mode (See page 39).
2. Enter Service Access Mode (See page 44).
3. Click on More >> Blanking Zones.
4. Click on Show Handles.
5. Click one of the blanking zone handles on the BEV and, holding down the left mouse button, drag to the desired position. Alternatively - on a touchscreen - touch and drag. As the handle is moved, its current position (in degrees clockwise from the vessel bow) is displayed in blue numerals outside the perimeter of the circle.
6. If required, drag the second zone handle in the same way.
7. The Apply-Cancel buttons will have popped up after step 5. Click on the Apply button to set the blanking zone, or on Cancel to restore the blanking zone to its previous state.
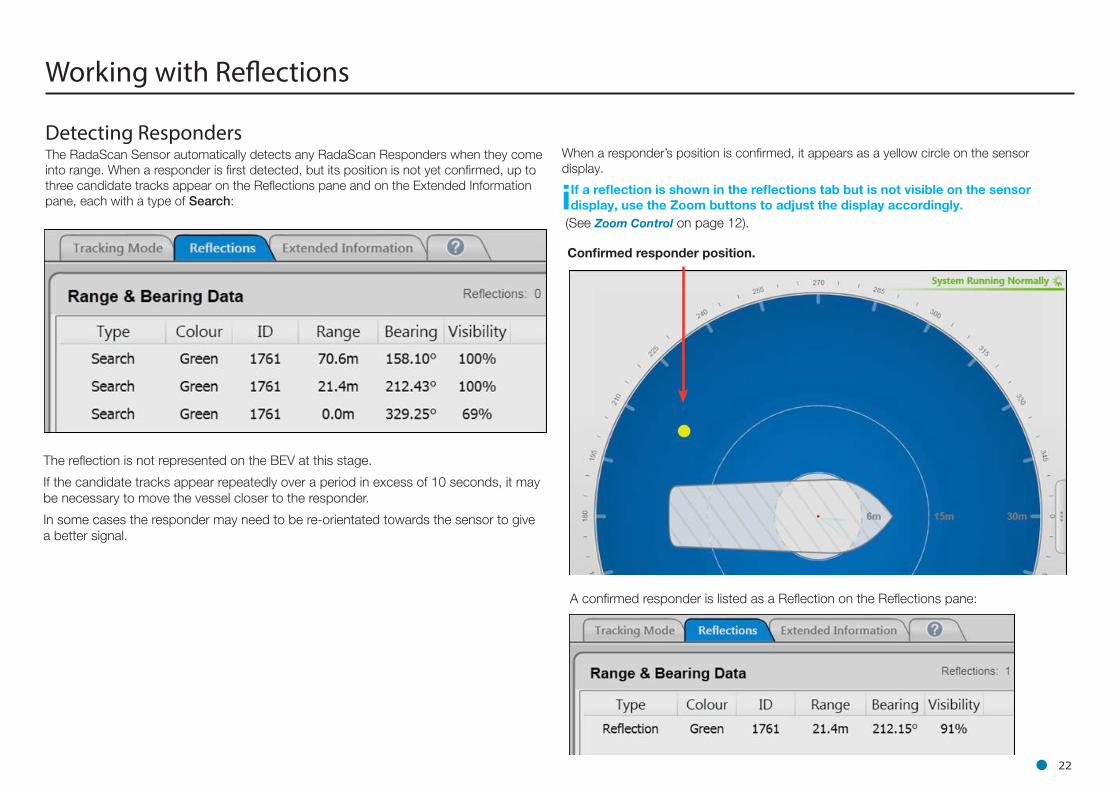
The reflection is not represented on the BEV at this stage.
If the candidate tracks appear repeatedly over a period in excess of 10 seconds, it may be necessary to move the vessel closer to the responder.
In some cases the responder may need to be re-orientated towards the sensor to give a better signal.
ll 22
Working with Reflections
Detecting RespondersThe RadaScan Sensor automatically detects any RadaScan Responders when they come into range. When a responder is first detected, but its position is not yet confirmed, up to three candidate tracks appear on the Reflections pane and on the Extended Information pane, each with a type of Search:
When a responder’s position is confirmed, it appears as a yellow circle on the sensor display.
iIf a reflection is shown in the reflections tab but is not visible on the sensor display, use the Zoom buttons to adjust the display accordingly.
Confirmed responder position.
A confirmed responder is listed as a Reflection on the Reflections pane:
(See Zoom Control on page 12).
ll 23
Working with Reflections (Continued)
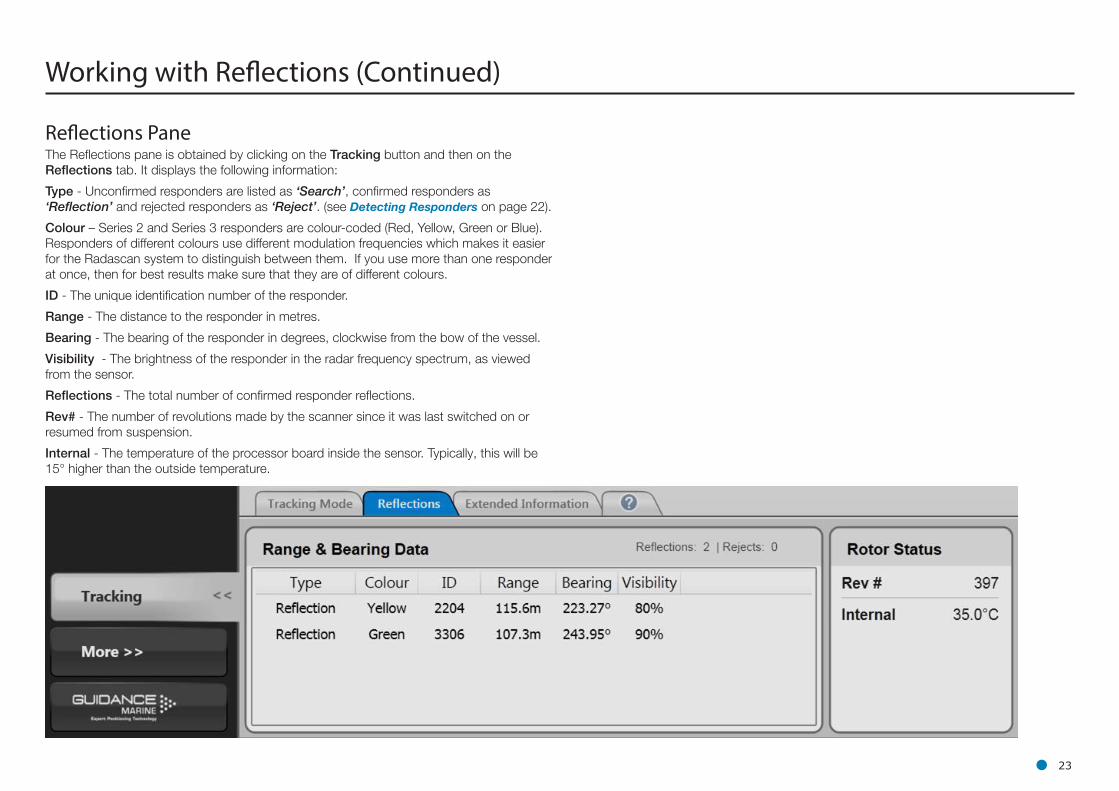
Reflections PaneThe Reflections pane is obtained by clicking on the Tracking button and then on the Reflections tab. It displays the following information:
Type - Unconfirmed responders are listed as ‘Search’, confirmed responders as ‘Reflection’ and rejected responders as ‘Reject’. (see Detecting Responders on page 22).
Colour – Series 2 and Series 3 responders are colour-coded (Red, Yellow, Green or Blue). Responders of different colours use different modulation frequencies which makes it easier for the Radascan system to distinguish between them. If you use more than one responder at once, then for best results make sure that they are of different colours.
ID - The unique identification number of the responder.
Range - The distance to the responder in metres.
Bearing - The bearing of the responder in degrees, clockwise from the bow of the vessel.
Visibility - The brightness of the responder in the radar frequency spectrum, as viewed from the sensor.
Reflections - The total number of confirmed responder reflections.
Rev# - The number of revolutions made by the scanner since it was last switched on or resumed from suspension.
Internal - The temperature of the processor board inside the sensor. Typically, this will be 15° higher than the outside temperature.
ll 24
Working with Reflections (Continued)
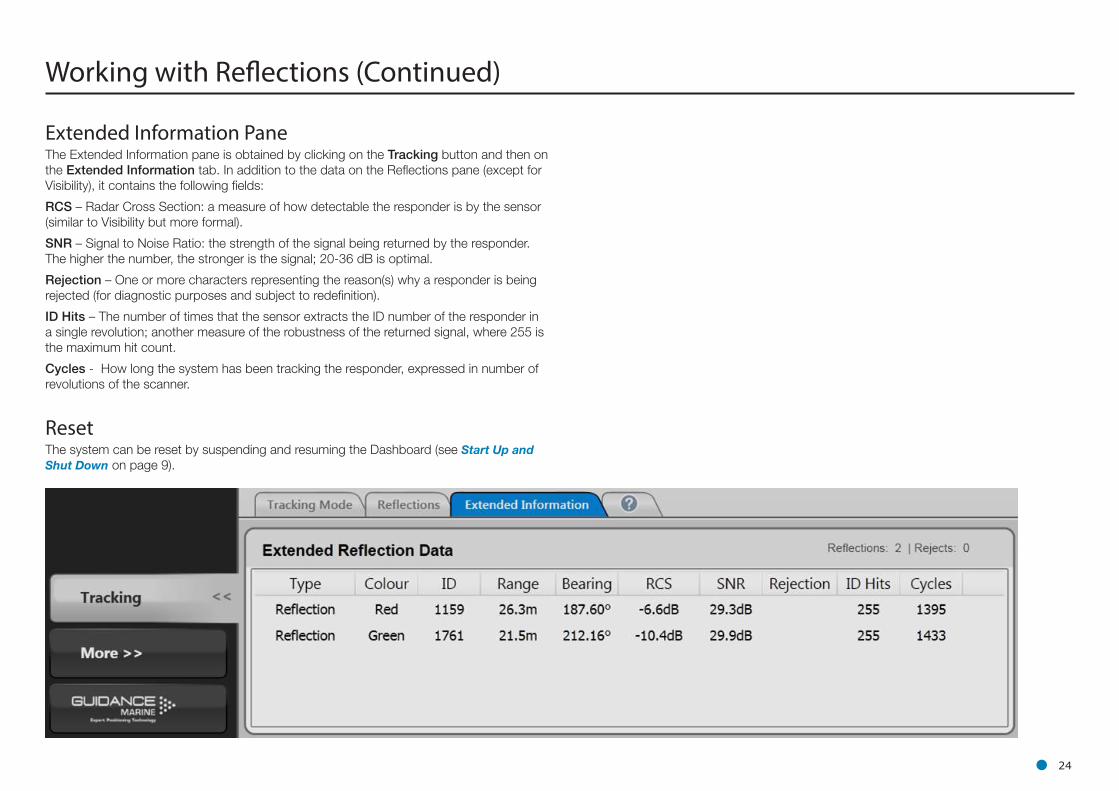
Extended Information PaneThe Extended Information pane is obtained by clicking on the Tracking button and then on the Extended Information tab. In addition to the data on the Reflections pane (except for Visibility), it contains the following fields:
RCS – Radar Cross Section: a measure of how detectable the responder is by the sensor (similar to Visibility but more formal).
SNR – Signal to Noise Ratio: the strength of the signal being returned by the responder. The higher the number, the stronger is the signal; 20-36 dB is optimal.
Rejection – One or more characters representing the reason(s) why a responder is being rejected (for diagnostic purposes and subject to redefinition).
ID Hits – The number of times that the sensor extracts the ID number of the responder in a single revolution; another measure of the robustness of the returned signal, where 255 is the maximum hit count.
Cycles - How long the system has been tracking the responder, expressed in number of revolutions of the scanner.
ResetThe system can be reset by suspending and resuming the Dashboard (see Start Up and Shut Down on page 9).
ll 25
This section describes the two types of target tracking and how to set them up. It is for general guidance only and does not provide an exhaustive explanation of target tracking using the RadaScan system, nor does it form the basis of a contract. Implementation of the material covered in this section will vary according to the type of DP system used in conjunction with the RadaScan system. The use of, or reliance on, anything in this section is therefore entirely at the user’s own risk and should only be undertaken after assessment of its accuracy, completeness and suitability for the proposed use.
This section contains the following pages:
• Introduction to Single and Multi-Target Tracking (Page 26)
• Positional Display Modes (Page 28)
• Selecting Targets for Multi-Target Groups (Page 30)
• Rotational Offsets (Page 33)
Single and Multi-Target Tracking
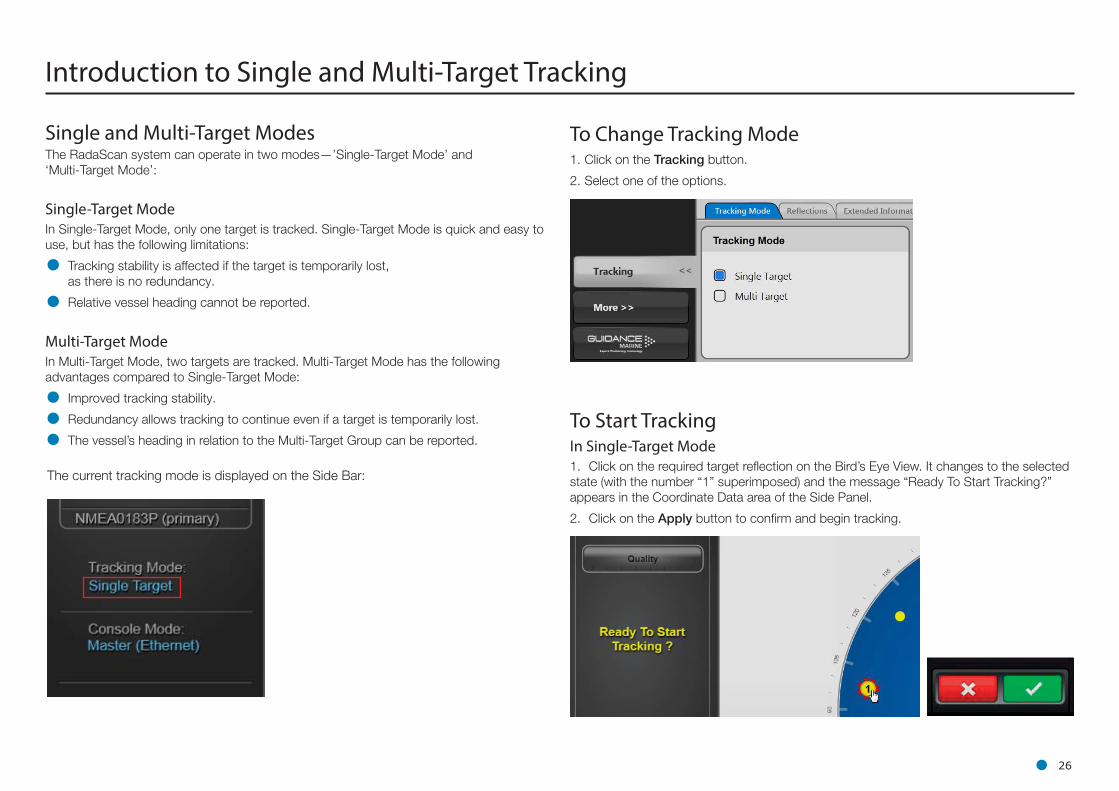
The current tracking mode is displayed on the Side Bar:
To Change Tracking Mode1. Click on the Tracking button.
2. Select one of the options.
To Start TrackingIn Single-Target Mode1. Click on the required target reflection on the Bird’s Eye View. It changes to the selected state (with the number “1” superimposed) and the message “Ready To Start Tracking?” appears in the Coordinate Data area of the Side Panel.
2. Click on the Apply button to confirm and begin tracking.
ll 26
Introduction to Single and Multi-Target Tracking
Single and Multi-Target Modes The RadaScan system can operate in two modes—’Single-Target Mode’ and ‘Multi-Target Mode’:
Single-Target ModeIn Single-Target Mode, only one target is tracked. Single-Target Mode is quick and easy to use, but has the following limitations:
• Tracking stability is affected if the target is temporarily lost, as there is no redundancy.
• Relative vessel heading cannot be reported.
Multi-Target ModeIn Multi-Target Mode, two targets are tracked. Multi-Target Mode has the following advantages compared to Single-Target Mode:
• Improved tracking stability.
• Redundancy allows tracking to continue even if a target is temporarily lost.
• The vessel’s heading in relation to the Multi-Target Group can be reported.
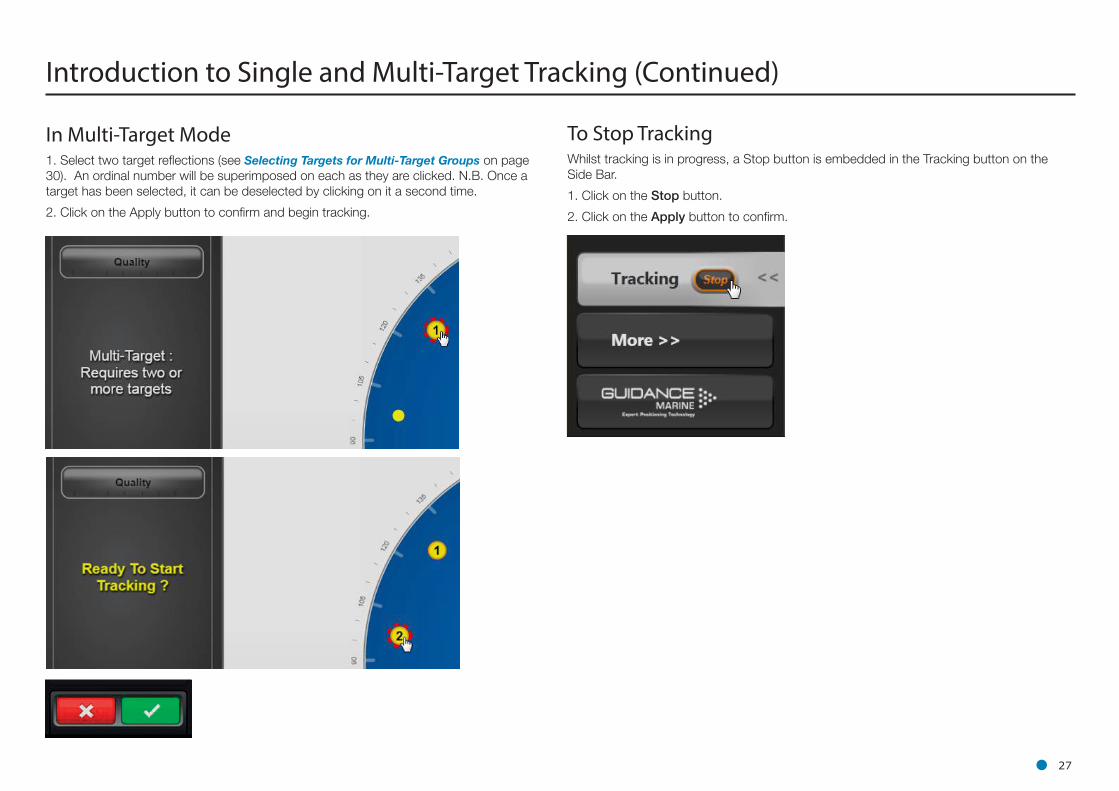
In Multi-Target Mode1. Select two target reflections (see Selecting Targets for Multi-Target Groups on page 30). An ordinal number will be superimposed on each as they are clicked. N.B. Once a target has been selected, it can be deselected by clicking on it a second time.
2. Click on the Apply button to confirm and begin tracking.
To Stop TrackingWhilst tracking is in progress, a Stop button is embedded in the Tracking button on the Side Bar.
1. Click on the Stop button.
2. Click on the Apply button to confirm.
ll 27
Introduction to Single and Multi-Target Tracking (Continued)
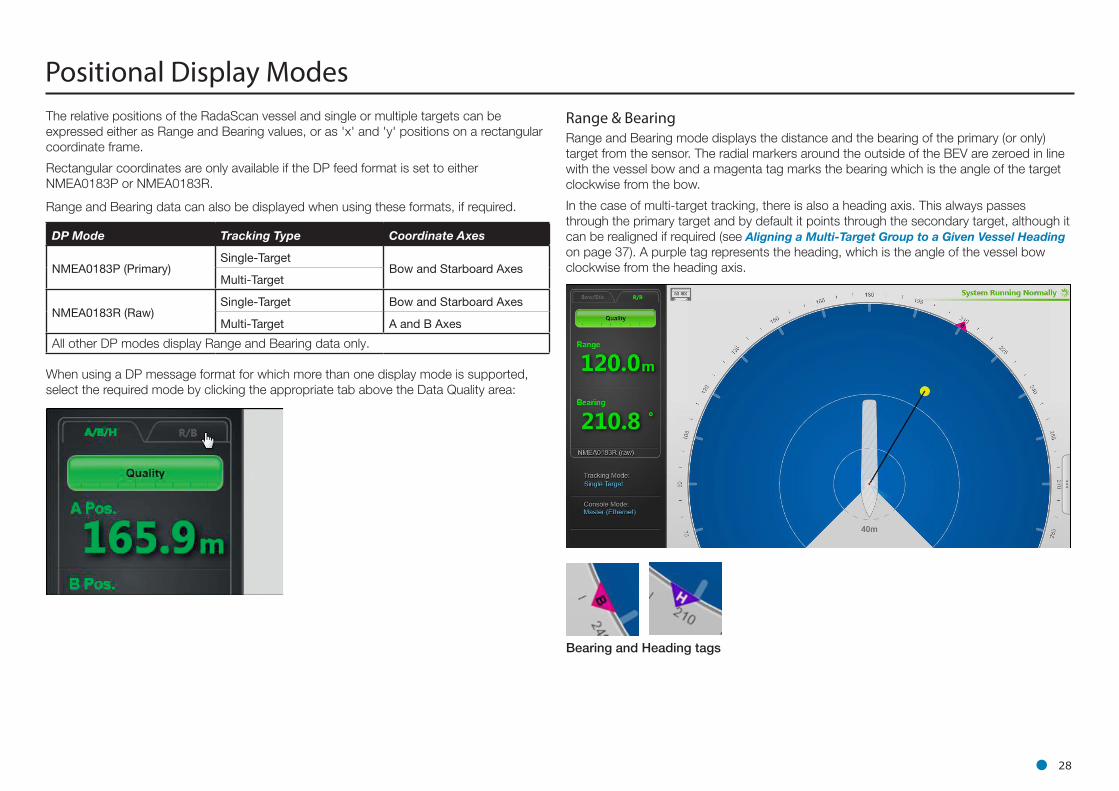
The relative positions of the RadaScan vessel and single or multiple targets can be expressed either as Range and Bearing values, or as 'x' and 'y' positions on a rectangular coordinate frame.
Rectangular coordinates are only available if the DP feed format is set to either NMEA0183P or NMEA0183R.
Range and Bearing data can also be displayed when using these formats, if required.
DP Mode Tracking Type Coordinate Axes
NMEA0183P (Primary)Single-Target
Bow and Starboard AxesMulti-Target
NMEA0183R (Raw)Single-Target Bow and Starboard Axes
Multi-Target A and B AxesAll other DP modes display Range and Bearing data only.
Range & BearingRange and Bearing mode displays the distance and the bearing of the primary (or only) target from the sensor. The radial markers around the outside of the BEV are zeroed in line with the vessel bow and a magenta tag marks the bearing which is the angle of the target clockwise from the bow.
In the case of multi-target tracking, there is also a heading axis. This always passes through the primary target and by default it points through the secondary target, although it can be realigned if required (see Aligning a Multi-Target Group to a Given Vessel Heading on page 37). A purple tag represents the heading, which is the angle of the vessel bow clockwise from the heading axis.
When using a DP message format for which more than one display mode is supported, select the required mode by clicking the appropriate tab above the Data Quality area:
Bearing and Heading tags
ll 28
Positional Display Modes
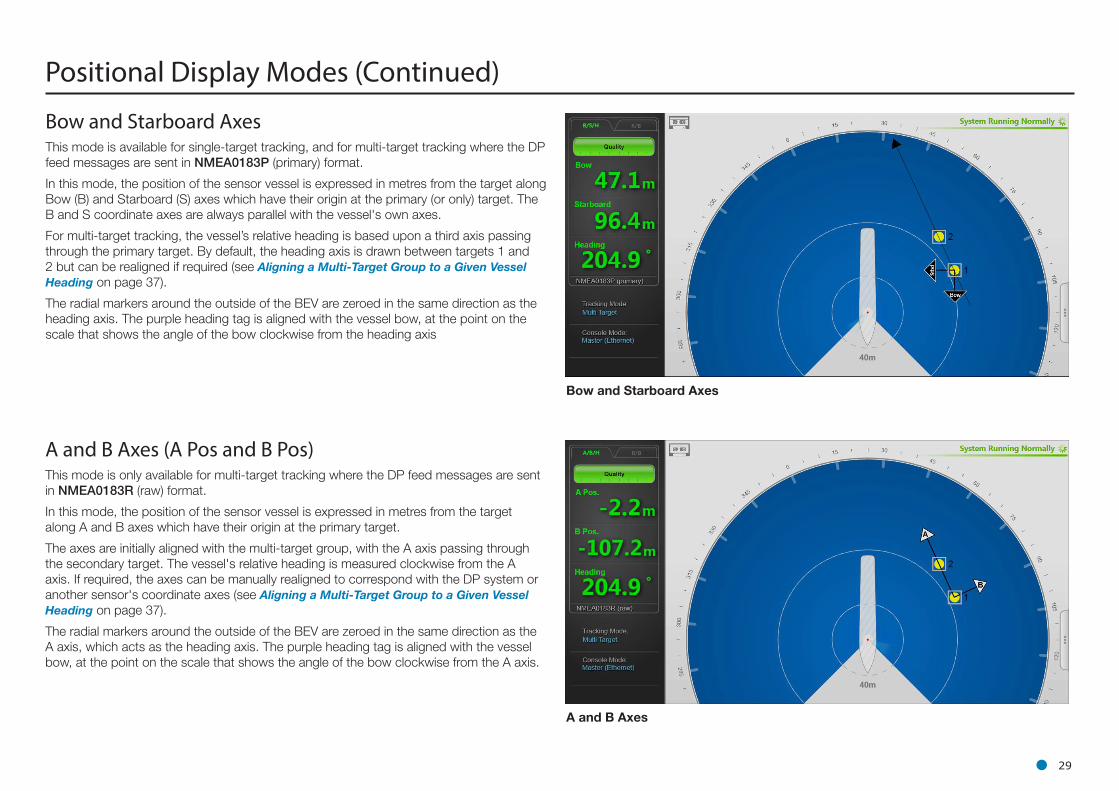
Bow and Starboard AxesThis mode is available for single-target tracking, and for multi-target tracking where the DP feed messages are sent in NMEA0183P (primary) format.
In this mode, the position of the sensor vessel is expressed in metres from the target along Bow (B) and Starboard (S) axes which have their origin at the primary (or only) target. The B and S coordinate axes are always parallel with the vessel's own axes.
For multi-target tracking, the vessel’s relative heading is based upon a third axis passing through the primary target. By default, the heading axis is drawn between targets 1 and 2 but can be realigned if required (see Aligning a Multi-Target Group to a Given Vessel Heading on page 37).
The radial markers around the outside of the BEV are zeroed in the same direction as the heading axis. The purple heading tag is aligned with the vessel bow, at the point on the scale that shows the angle of the bow clockwise from the heading axis
Bow and Starboard Axes
A and B Axes
A and B Axes (A Pos and B Pos)This mode is only available for multi-target tracking where the DP feed messages are sent in NMEA0183R (raw) format.
In this mode, the position of the sensor vessel is expressed in metres from the target along A and B axes which have their origin at the primary target.
The axes are initially aligned with the multi-target group, with the A axis passing through the secondary target. The vessel's relative heading is measured clockwise from the A axis. If required, the axes can be manually realigned to correspond with the DP system or another sensor's coordinate axes (see Aligning a Multi-Target Group to a Given Vessel Heading on page 37).
The radial markers around the outside of the BEV are zeroed in the same direction as the A axis, which acts as the heading axis. The purple heading tag is aligned with the vessel bow, at the point on the scale that shows the angle of the bow clockwise from the A axis.
ll 29
Positional Display Modes (Continued)
ll 30
Selecting Targets for Multi-Target Groups
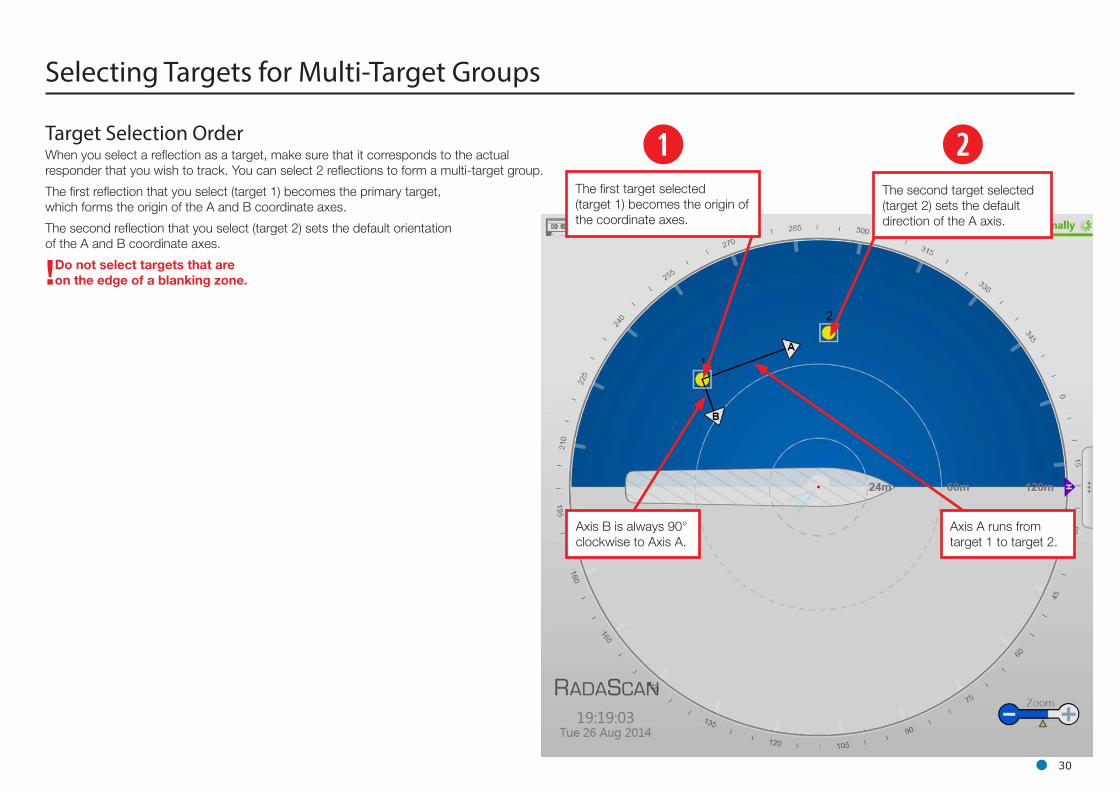
The first target selected (target 1) becomes the origin of the coordinate axes.
The second target selected (target 2) sets the default direction of the A axis.
Axis A runs from target 1 to target 2.
Axis B is always 90° clockwise to Axis A.
q wTarget Selection OrderWhen you select a reflection as a target, make sure that it corresponds to the actual responder that you wish to track. You can select 2 reflections to form a multi-target group.
The first reflection that you select (target 1) becomes the primary target, which forms the origin of the A and B coordinate axes.
The second reflection that you select (target 2) sets the default orientation of the A and B coordinate axes.
!Do not select targets that are on the edge of a blanking zone.
A
B
A
B
Target 1Target 2
Vessel
ll 31
Selecting Targets for Multi-Target Groups (Continued)
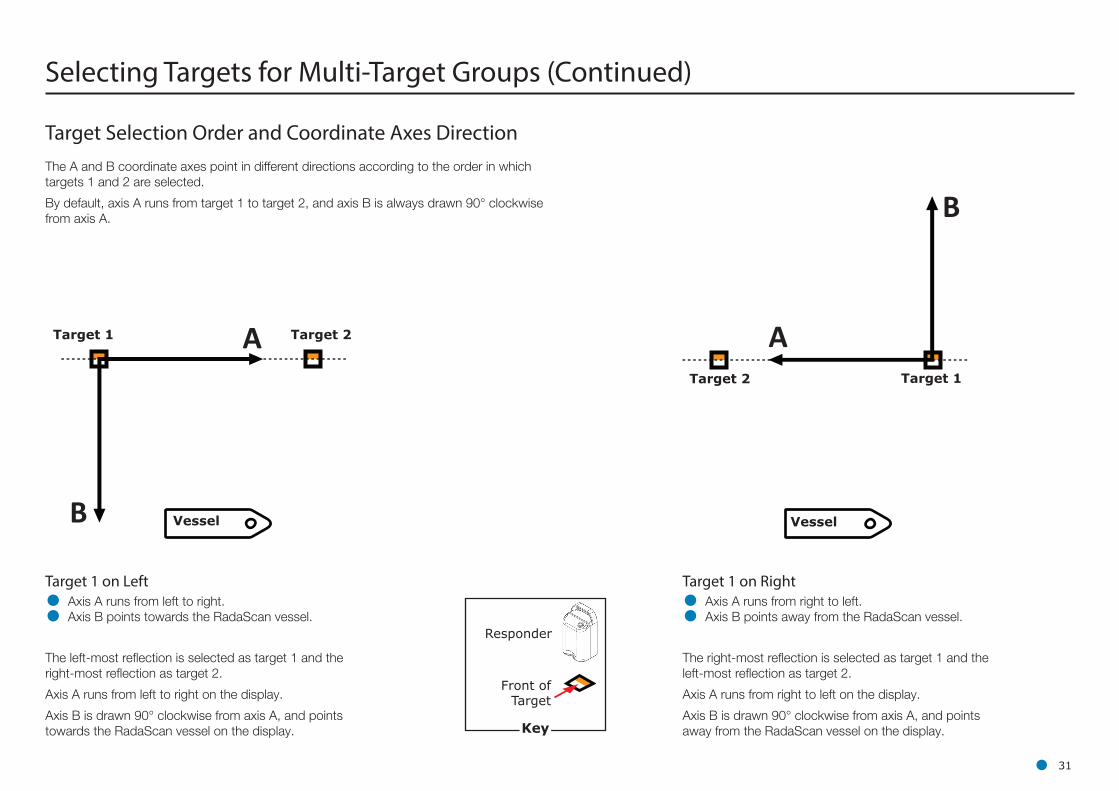
The A and B coordinate axes point in different directions according to the order in which targets 1 and 2 are selected.
By default, axis A runs from target 1 to target 2, and axis B is always drawn 90° clockwise from axis A.
Target Selection Order and Coordinate Axes Direction
Target 1 on Right
• Axis A runs from right to left.
• Axis B points away from the RadaScan vessel.
Vessel
Target 1 Target 2
Target 1 on Left
• Axis A runs from left to right.
• Axis B points towards the RadaScan vessel.
The left-most reflection is selected as target 1 and the right-most reflection as target 2.
Axis A runs from left to right on the display.
Axis B is drawn 90° clockwise from axis A, and points towards the RadaScan vessel on the display.
The right-most reflection is selected as target 1 and the left-most reflection as target 2.
Axis A runs from right to left on the display.
Axis B is drawn 90° clockwise from axis A, and points away from the RadaScan vessel on the display.
Responder
Front of Target
Key
T1T2A
B
270°T1
T2A
B
90°
ll 32
Selecting Targets for Multi-Target Groups (Continued)
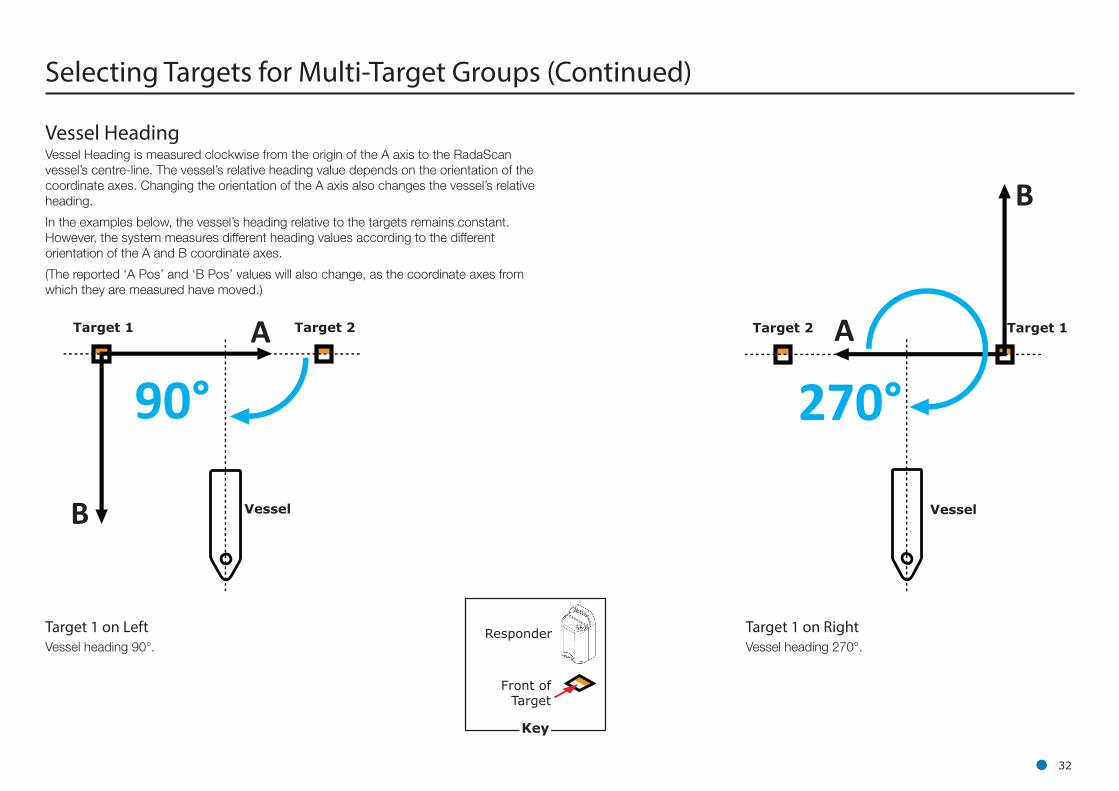
Vessel HeadingVessel Heading is measured clockwise from the origin of the A axis to the RadaScan vessel’s centre-line. The vessel’s relative heading value depends on the orientation of the coordinate axes. Changing the orientation of the A axis also changes the vessel’s relative heading.
In the examples below, the vessel’s heading relative to the targets remains constant. However, the system measures different heading values according to the different orientation of the A and B coordinate axes.
(The reported ‘A Pos’ and ‘B Pos’ values will also change, as the coordinate axes from which they are measured have moved.)
Target 1 Target 1Target 2 Target 2
Target 1 on RightVessel heading 270°.
Target 1 on LeftVessel heading 90°.
VesselVessel
Responder
Front of Target
Key
A
B
90°
AB
ll 33
Rotational Offsets
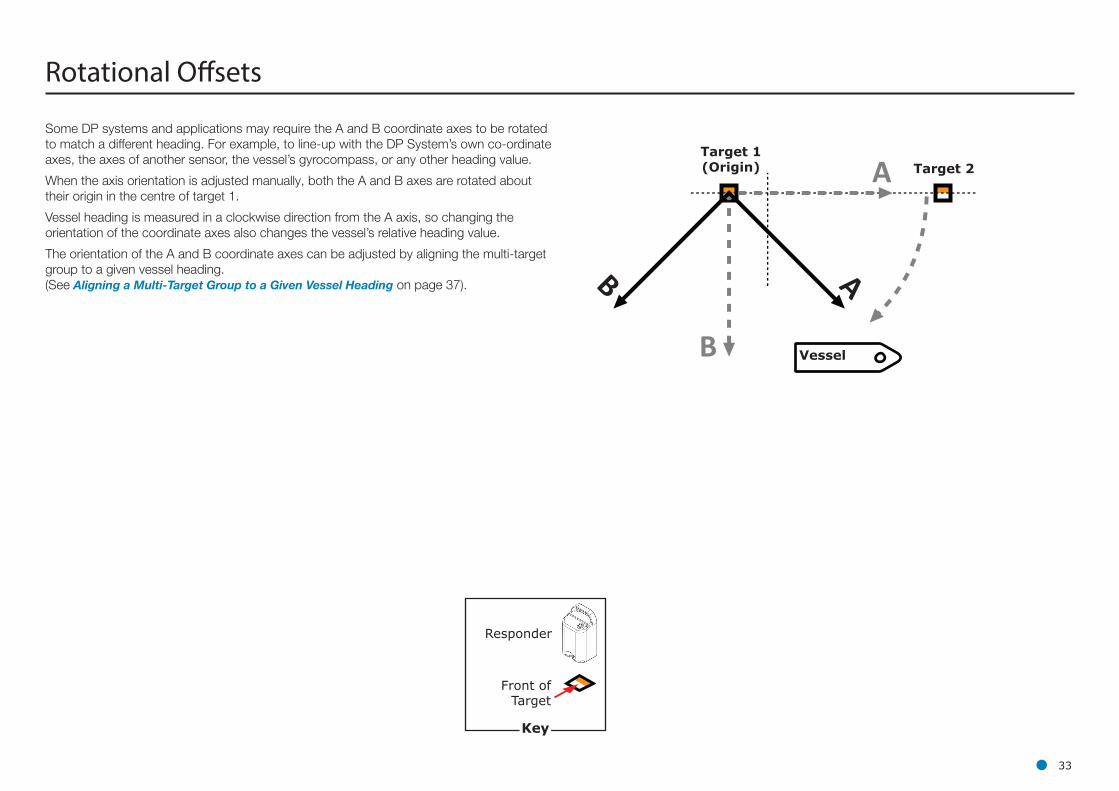
Some DP systems and applications may require the A and B coordinate axes to be rotated to match a different heading. For example, to line-up with the DP System’s own co-ordinate axes, the axes of another sensor, the vessel’s gyrocompass, or any other heading value.
When the axis orientation is adjusted manually, both the A and B axes are rotated about their origin in the centre of target 1.
Vessel heading is measured in a clockwise direction from the A axis, so changing the orientation of the coordinate axes also changes the vessel’s relative heading value.
The orientation of the A and B coordinate axes can be adjusted by aligning the multi-target group to a given vessel heading. (See Aligning a Multi-Target Group to a Given Vessel Heading on page 37).
Target 1 (Origin) Target 2
Vessel
Responder
Front of Target
Key
0°
A
B
270°
A
90°
A
B Target 2
Vessel
Target 1 (Origin)
ll 34
Rotational Offsets (Continued)
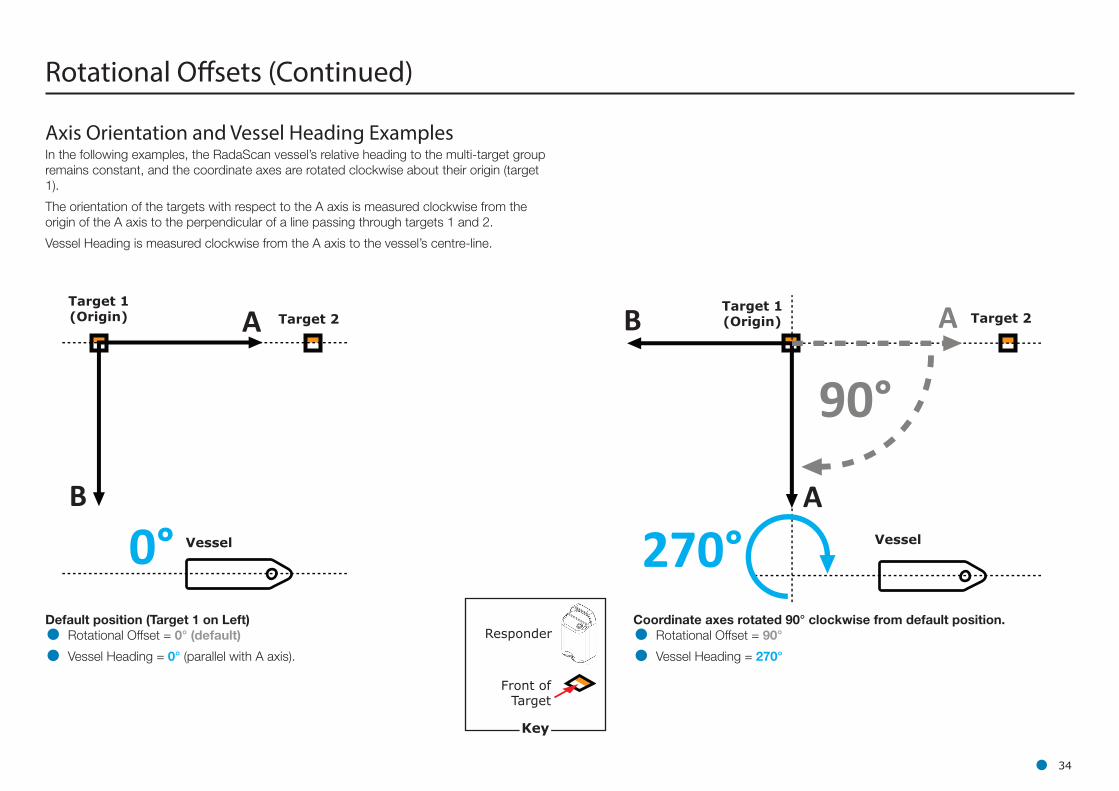
Default position (Target 1 on Left)
• Rotational Offset = 0° (default)
• Vessel Heading = 0° (parallel with A axis).
Coordinate axes rotated 90° clockwise from default position.
• Rotational Offset = 90°
• Vessel Heading = 270°
Axis Orientation and Vessel Heading ExamplesIn the following examples, the RadaScan vessel’s relative heading to the multi-target group remains constant, and the coordinate axes are rotated clockwise about their origin (target 1).
The orientation of the targets with respect to the A axis is measured clockwise from the origin of the A axis to the perpendicular of a line passing through targets 1 and 2.
Vessel Heading is measured clockwise from the A axis to the vessel’s centre-line.
Target 2
Vessel
Target 1 (Origin)
Responder
Front of Target
Key
90°
270°
A
B Target 2
Vessel
Target 1 (Origin)
180°
A
180°
A
B
ll 35
Rotational Offsets (Continued)
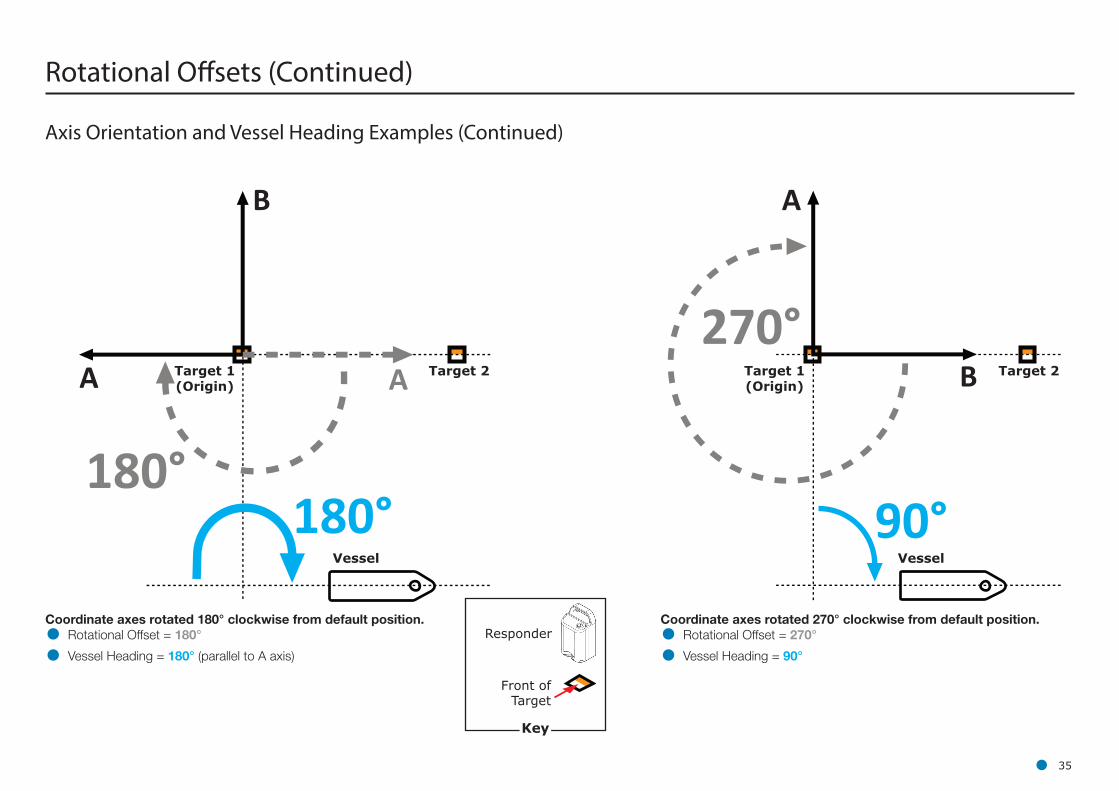
Axis Orientation and Vessel Heading Examples (Continued)
Coordinate axes rotated 180° clockwise from default position.
• Rotational Offset = 180°
• Vessel Heading = 180° (parallel to A axis)
Coordinate axes rotated 270° clockwise from default position.
• Rotational Offset = 270°
• Vessel Heading = 90°
Target 2
Vessel
Target 1 (Origin)
Responder
Front of Target
Key
B
A
B
A
Target 2
Vessel
Target 1
RadaScan Sensor
36.6
136.6
86.6-50
60°
ll 36
Rotational Offsets (Continued)
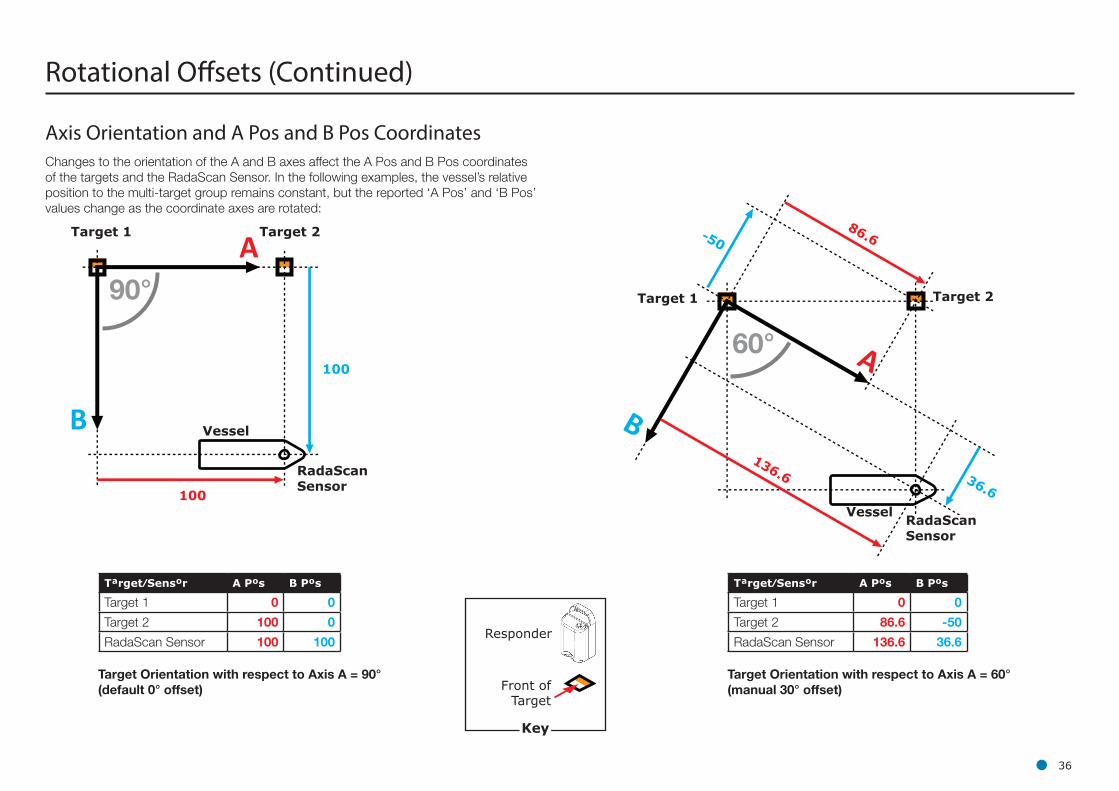
Axis Orientation and A Pos and B Pos CoordinatesChanges to the orientation of the A and B axes affect the A Pos and B Pos coordinates of the targets and the RadaScan Sensor. In the following examples, the vessel’s relative position to the multi-target group remains constant, but the reported ‘A Pos’ and ‘B Pos’ values change as the coordinate axes are rotated:
Target/Sensor A Pos B Pos
Target 1 0 0
Target 2 100 0
RadaScan Sensor 100 100
Target 2
Vessel
Target 1
RadaScan Sensor
100
100
Target/Sensor A Pos B Pos
Target 1 0 0
Target 2 86.6 -50
RadaScan Sensor 136.6 36.6
Target Orientation with respect to Axis A = 90° (default 0° offset)
Target Orientation with respect to Axis A = 60° (manual 30° offset)
90°
Responder
Front of Target
Key
ll 37
Rotational Offsets (Continued)
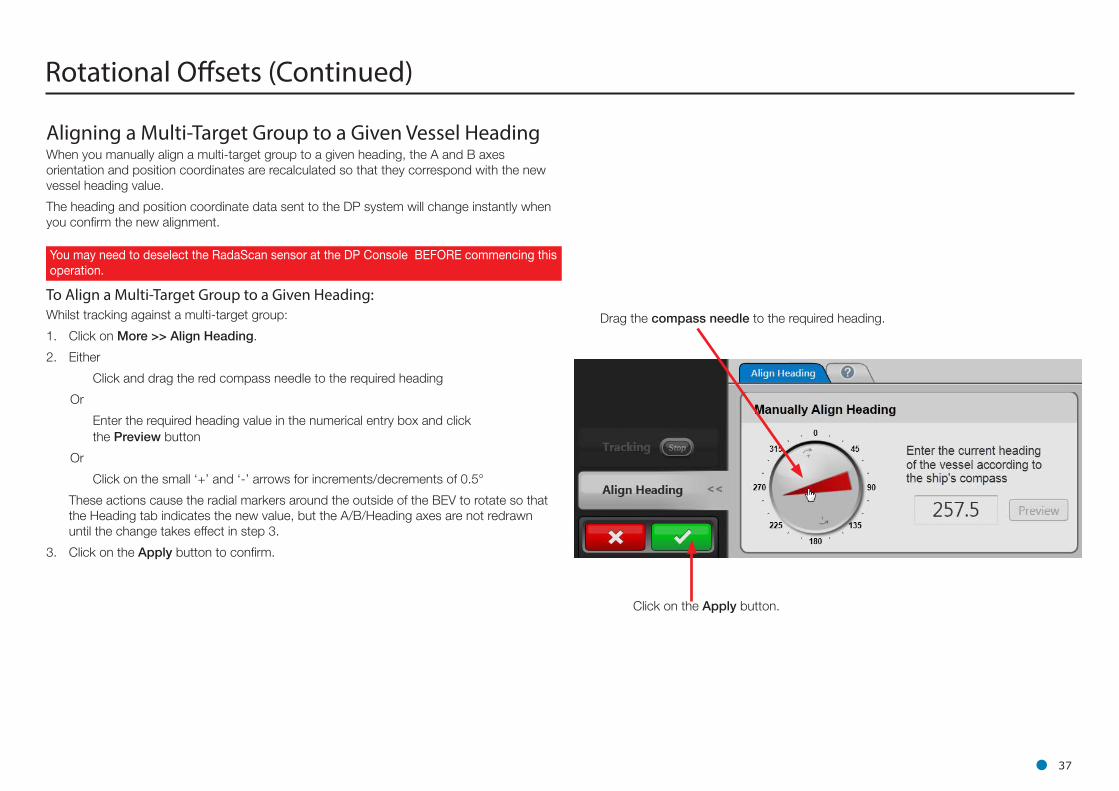
Aligning a Multi-Target Group to a Given Vessel HeadingWhen you manually align a multi-target group to a given heading, the A and B axes orientation and position coordinates are recalculated so that they correspond with the new vessel heading value.
The heading and position coordinate data sent to the DP system will change instantly when you confirm the new alignment.
To Align a Multi-Target Group to a Given Heading:Whilst tracking against a multi-target group:
1. Click on More >> Align Heading.
2. Either
Click and drag the red compass needle to the required heading
Or
Enter the required heading value in the numerical entry box and click the Preview button
Or
Click on the small ‘+’ and ‘-’ arrows for increments/decrements of 0.5°
These actions cause the radial markers around the outside of the BEV to rotate so that the Heading tab indicates the new value, but the A/B/Heading axes are not redrawn until the change takes effect in step 3.
3. Click on the Apply button to confirm.
Drag the compass needle to the required heading.
Click on the Apply button.
You may need to deselect the RadaScan sensor at the DP Console BEFORE commencing this operation.
Multi - Dashboard RadaScan SystemsThis section contains the following pages:
• RadaScan Dashboard - Master Mode (See page 39)
• RadaScan Dashboard - Slave Mode (See page 40)
ll 38
RadaScan Dashboard - Master Mode
The RadaScan Dashboard software supports one master dashboard and multiple slave dashboards running simultaneously on the same system.
All control and configuration functions are available in a master dashboard (Service Access is required for some of these). Any changes made to the tracking or sensor-related settings at the master dashboard will be visible on the screens of the slave dashboards. On the other hand, display options such as dashboard Brightness or Zoom level can be set differently on each individual Dashboard, whether it is a master or a slave.
When the master dashboard is used to suspend the RadaScan sensor a message will appear on the screens of the slave dashboards indicating that the system is suspended.
In this state, clicking the RESUME button on any slave Dashboard will automatically make that Dashboard the master dashboard. Clicking EXIT will close the Dashboard application on that individual dashboard only.
If no master Dashboards are open in a RadaScan system, the next one to be opened will default to master mode. Subsequently, new Dashboards will default to slave mode.
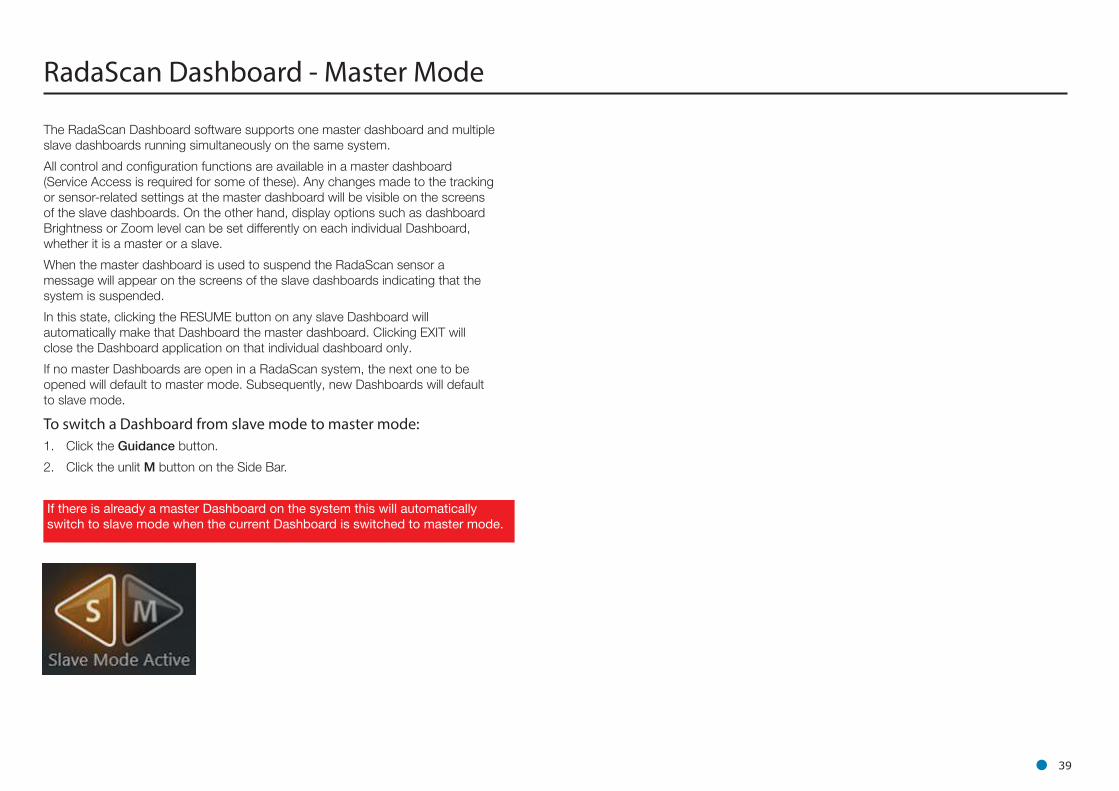
To switch a Dashboard from slave mode to master mode:1. Click the Guidance button.
2. Click the unlit M button on the Side Bar.
If there is already a master Dashboard on the system this will automatically switch to slave mode when the current Dashboard is switched to master mode.
ll 39
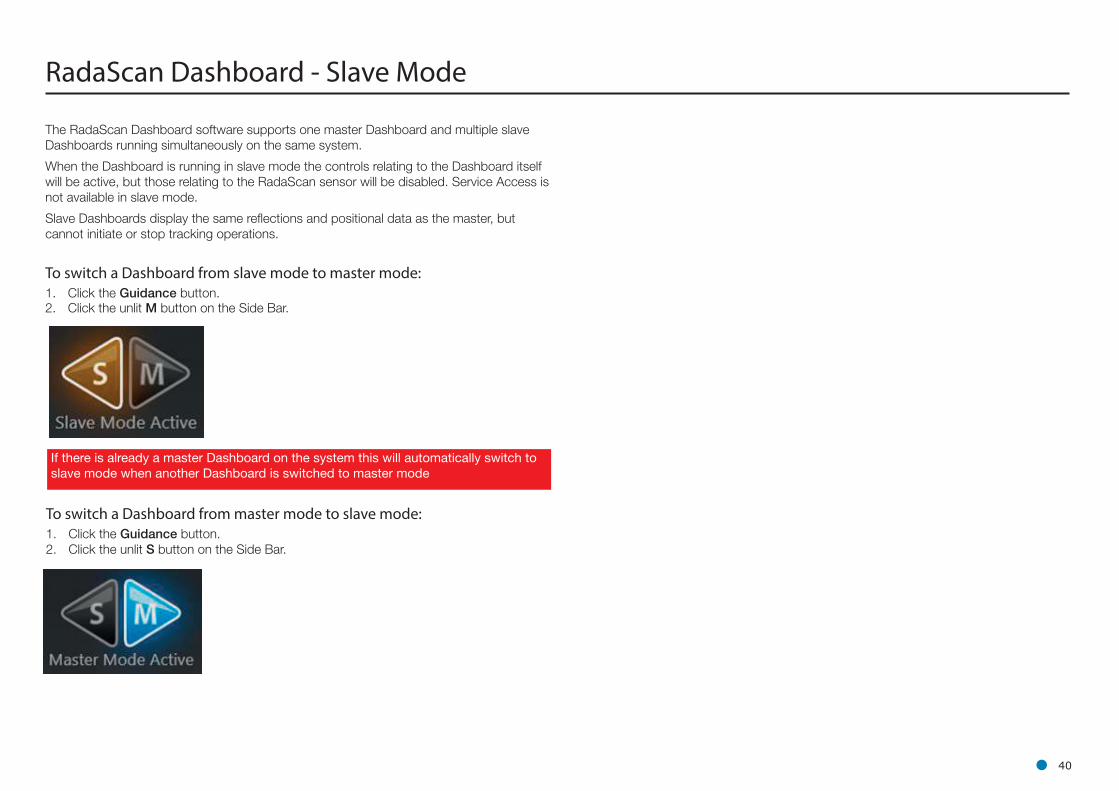
RadaScan Dashboard - Slave Mode
The RadaScan Dashboard software supports one master Dashboard and multiple slave Dashboards running simultaneously on the same system.
When the Dashboard is running in slave mode the controls relating to the Dashboard itself will be active, but those relating to the RadaScan sensor will be disabled. Service Access is not available in slave mode.
Slave Dashboards display the same reflections and positional data as the master, but cannot initiate or stop tracking operations.
To switch a Dashboard from slave mode to master mode:1. Click the Guidance button.2. Click the unlit M button on the Side Bar.
To switch a Dashboard from master mode to slave mode:1. Click the Guidance button.2. Click the unlit S button on the Side Bar.
If there is already a master Dashboard on the system this will automatically switch to slave mode when another Dashboard is switched to master mode
ll 40
ll 41
This section contains the following pages:
• Serial Numbers and Software Versions (Page 42)
• DP Feed (Page 43)
• Entering Service Access Mode (Page 44)
• Data Logging (Page 45)
Support Information
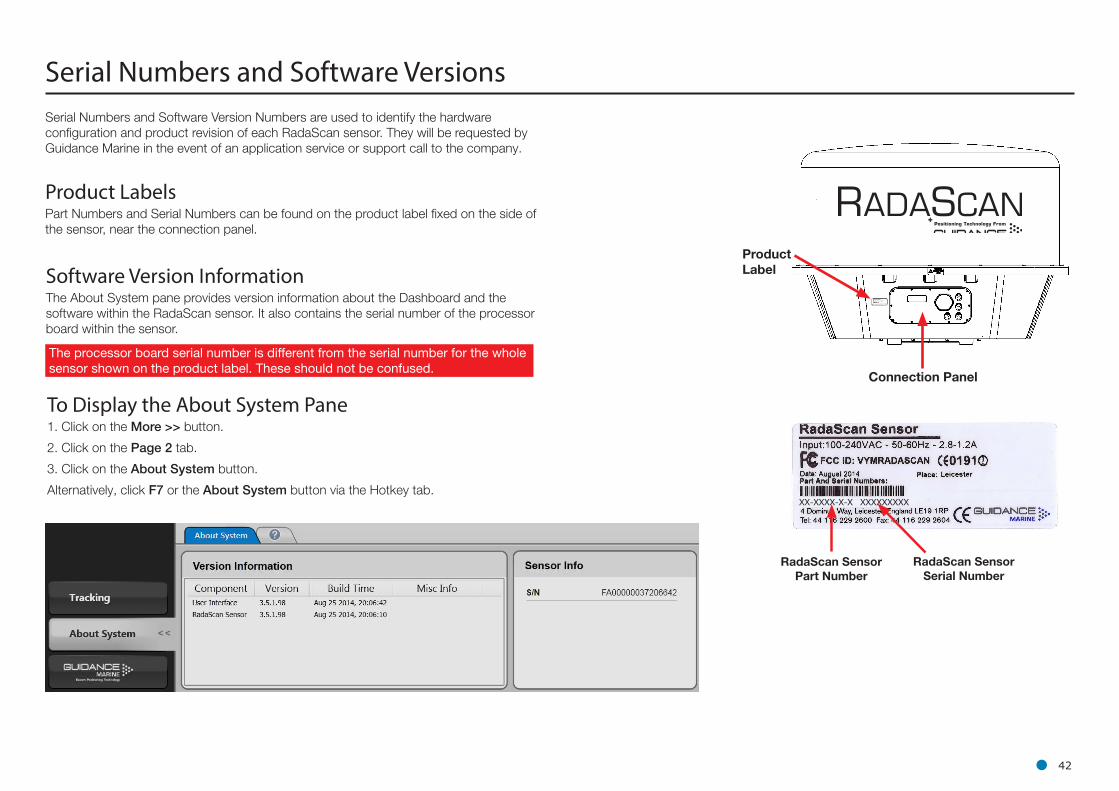
The processor board serial number is different from the serial number for the whole sensor shown on the product label. These should not be confused.
ll 42
XX-XXXX-X-X XXXXXXXXX
Serial Numbers and Software Versions
Software Version InformationThe About System pane provides version information about the Dashboard and the software within the RadaScan sensor. It also contains the serial number of the processor board within the sensor.
Serial Numbers and Software Version Numbers are used to identify the hardware configuration and product revision of each RadaScan sensor. They will be requested by Guidance Marine in the event of an application service or support call to the company.
Product LabelsPart Numbers and Serial Numbers can be found on the product label fixed on the side of the sensor, near the connection panel.
RadaScan SensorPart Number
RadaScan SensorSerial Number
Product Label
Connection Panel
To Display the About System Pane1. Click on the More >> button.
2. Click on the Page 2 tab.
3. Click on the About System button.
Alternatively, click F7 or the About System button via the Hotkey tab.
ll 43
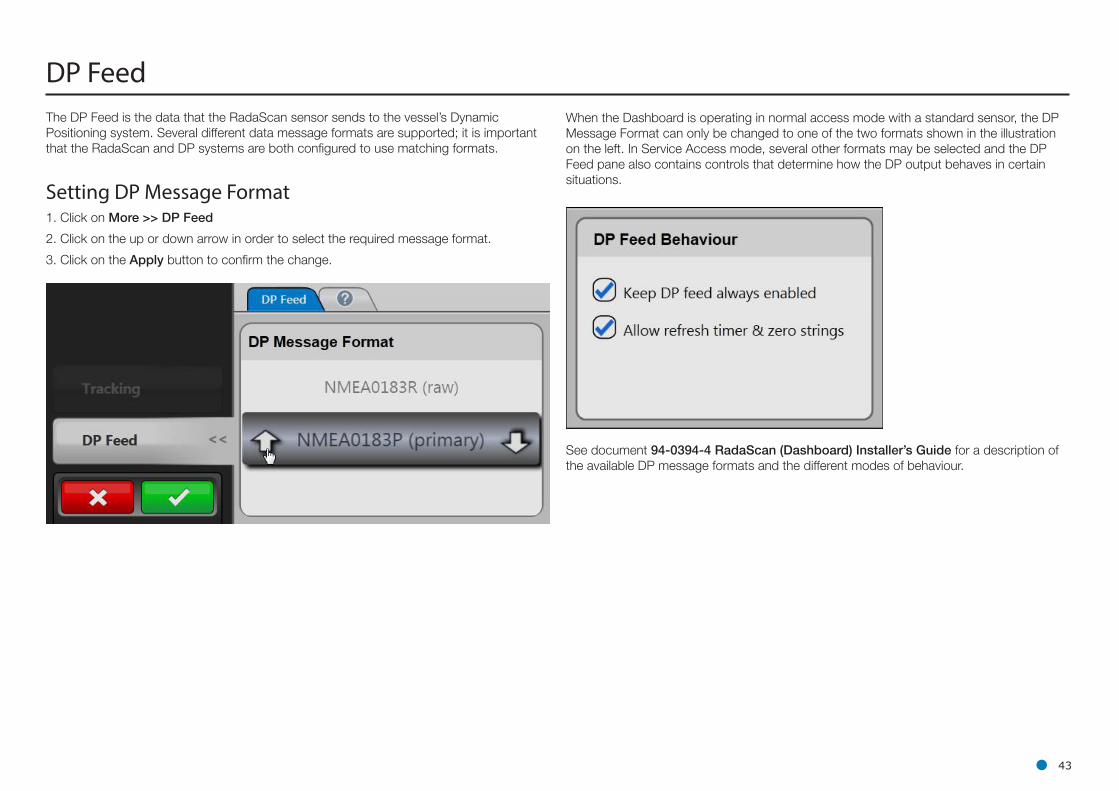
DP FeedThe DP Feed is the data that the RadaScan sensor sends to the vessel’s Dynamic Positioning system. Several different data message formats are supported; it is important that the RadaScan and DP systems are both configured to use matching formats.
Setting DP Message Format1. Click on More >> DP Feed
2. Click on the up or down arrow in order to select the required message format.
3. Click on the Apply button to confirm the change.
When the Dashboard is operating in normal access mode with a standard sensor, the DP Message Format can only be changed to one of the two formats shown in the illustration on the left. In Service Access mode, several other formats may be selected and the DP Feed pane also contains controls that determine how the DP output behaves in certain situations.
See document 94-0394-4 RadaScan (Dashboard) Installer’s Guide for a description of the available DP message formats and the different modes of behaviour.
ll 44
Certain settings within the RadaScan Dashboard can seriously affect system operation if they are incorrectly altered. For this reason they cannot be modified unless you enter Service Access mode.
Service Access mode can be entered either by using a temporary service access code, or by using an engineer USB key.
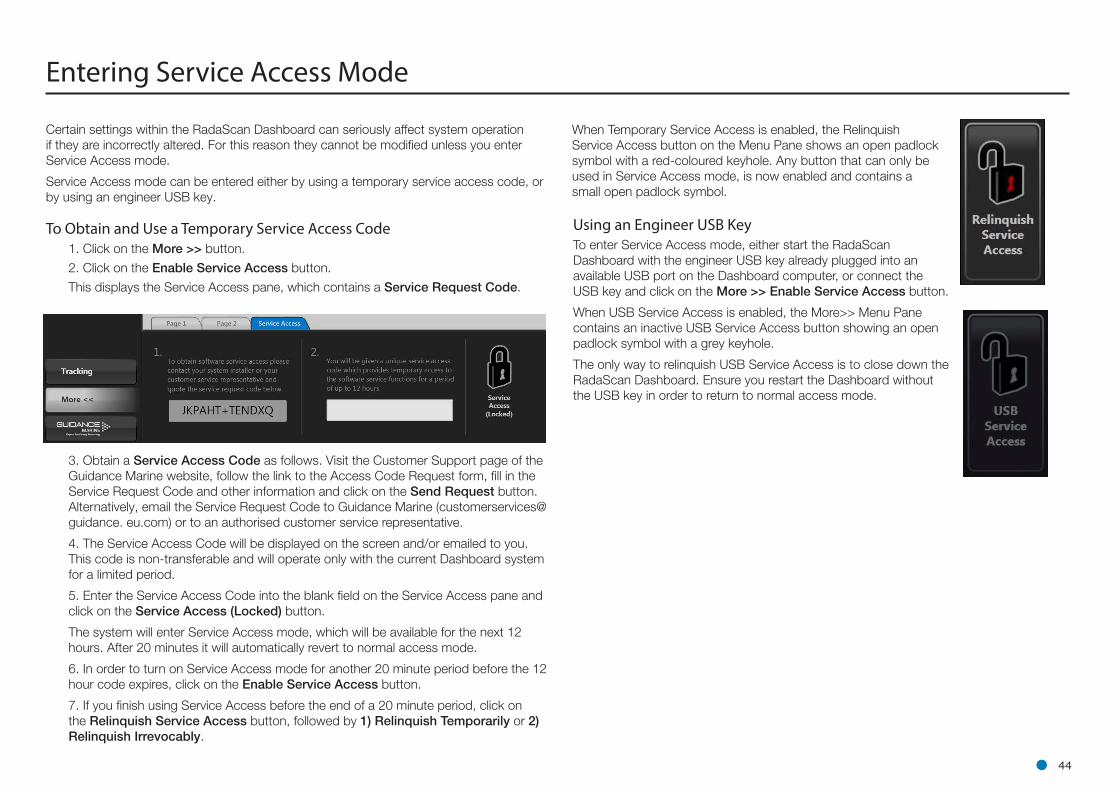
To Obtain and Use a Temporary Service Access Code1. Click on the More >> button.
2. Click on the Enable Service Access button.
This displays the Service Access pane, which contains a Service Request Code.
3. Obtain a Service Access Code as follows. Visit the Customer Support page of the Guidance Marine website, follow the link to the Access Code Request form, fill in the Service Request Code and other information and click on the Send Request button. Alternatively, email the Service Request Code to Guidance Marine (customerservices@guidance. eu.com) or to an authorised customer service representative.
4. The Service Access Code will be displayed on the screen and/or emailed to you. This code is non-transferable and will operate only with the current Dashboard system for a limited period.
5. Enter the Service Access Code into the blank field on the Service Access pane and click on the Service Access (Locked) button.
The system will enter Service Access mode, which will be available for the next 12 hours. After 20 minutes it will automatically revert to normal access mode.
6. In order to turn on Service Access mode for another 20 minute period before the 12 hour code expires, click on the Enable Service Access button.
7. If you finish using Service Access before the end of a 20 minute period, click on the Relinquish Service Access button, followed by 1) Relinquish Temporarily or 2) Relinquish Irrevocably.
Entering Service Access Mode
When Temporary Service Access is enabled, the Relinquish Service Access button on the Menu Pane shows an open padlock symbol with a red-coloured keyhole. Any button that can only be used in Service Access mode, is now enabled and contains a small open padlock symbol.
Using an Engineer USB KeyTo enter Service Access mode, either start the RadaScan Dashboard with the engineer USB key already plugged into an available USB port on the Dashboard computer, or connect the USB key and click on the More >> Enable Service Access button.
When USB Service Access is enabled, the More>> Menu Pane contains an inactive USB Service Access button showing an open padlock symbol with a grey keyhole.
The only way to relinquish USB Service Access is to close down the RadaScan Dashboard. Ensure you restart the Dashboard without the USB key in order to return to normal access mode.
ll 45
Data Logging
During tracking, the system automatically generates a set of operation logs that can be analysed by a service engineer to diagnose any system faults. Logging can also be started manually, when the system is not tracking (see below).
When logging is in progress, the following symbol is displayed in the top left-hand corner of the main pane. In the case of manual logging, the symbol flashes.
By default, logs are written to the C:\Logs\RadaScan directory. Sub-folders within this directory are named according to the time period that they cover.
Logs can be copied manually and e-mailed to Guidance Marine ([email protected]) or your DP supplier in the event of a problem.
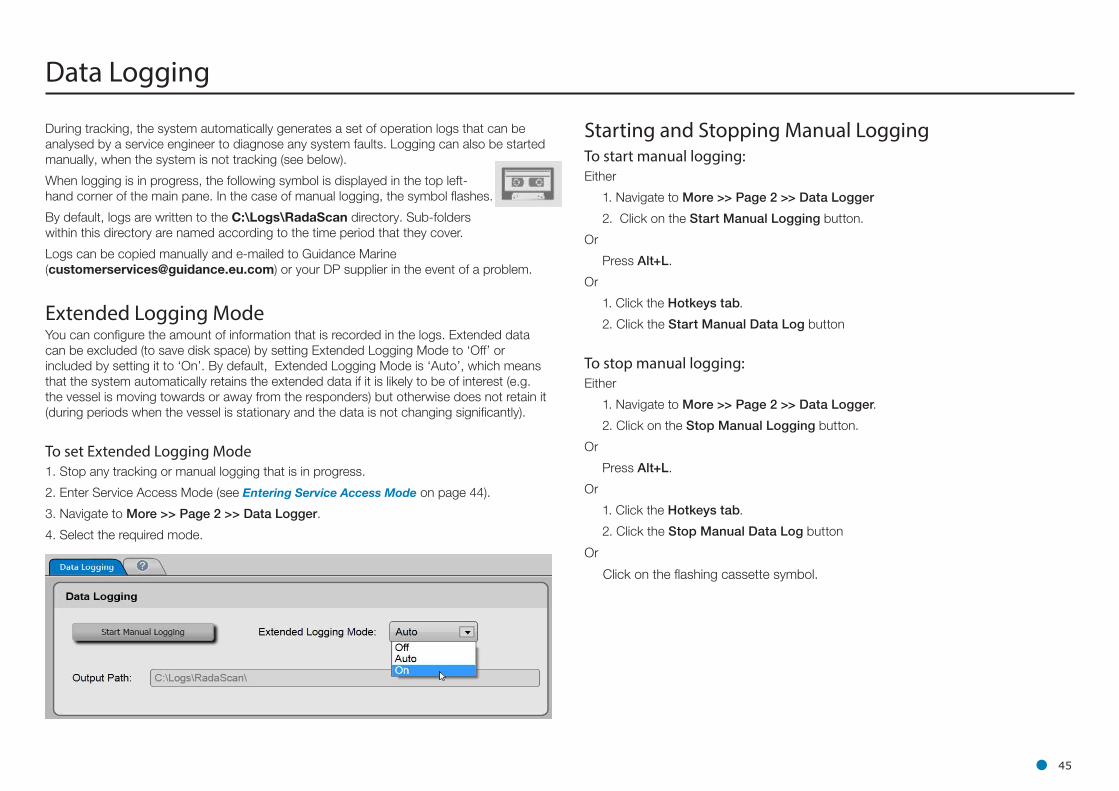
Extended Logging ModeYou can configure the amount of information that is recorded in the logs. Extended data can be excluded (to save disk space) by setting Extended Logging Mode to ‘Off’ or included by setting it to ‘On’. By default, Extended Logging Mode is ‘Auto’, which means that the system automatically retains the extended data if it is likely to be of interest (e.g. the vessel is moving towards or away from the responders) but otherwise does not retain it (during periods when the vessel is stationary and the data is not changing significantly).
To set Extended Logging Mode1. Stop any tracking or manual logging that is in progress.
2. Enter Service Access Mode (see Entering Service Access Mode on page 44).
3. Navigate to More >> Page 2 >> Data Logger.
4. Select the required mode.
Starting and Stopping Manual LoggingTo start manual logging:Either
1. Navigate to More >> Page 2 >> Data Logger
2. Click on the Start Manual Logging button.
Or
Press Alt+L.
Or
1. Click the Hotkeys tab.
2. Click the Start Manual Data Log button
To stop manual logging:Either
1. Navigate to More >> Page 2 >> Data Logger.
2. Click on the Stop Manual Logging button.
Or
Press Alt+L.
Or
1. Click the Hotkeys tab.
2. Click the Stop Manual Data Log button
Or
Click on the flashing cassette symbol.
ll 46
Data Logging (continued)
Taking ScreenshotsThe Screenshot option records every detail of the current screen and stores it as a bitmap image. Screenshots can be analysed by a service engineer or e-mailed to Guidance Marine in the same way as log files.
The screenshot is stored in the file desktop.bmp, in the same directory as the log files. If a desktop.bmp file already exists, it is overwritten.
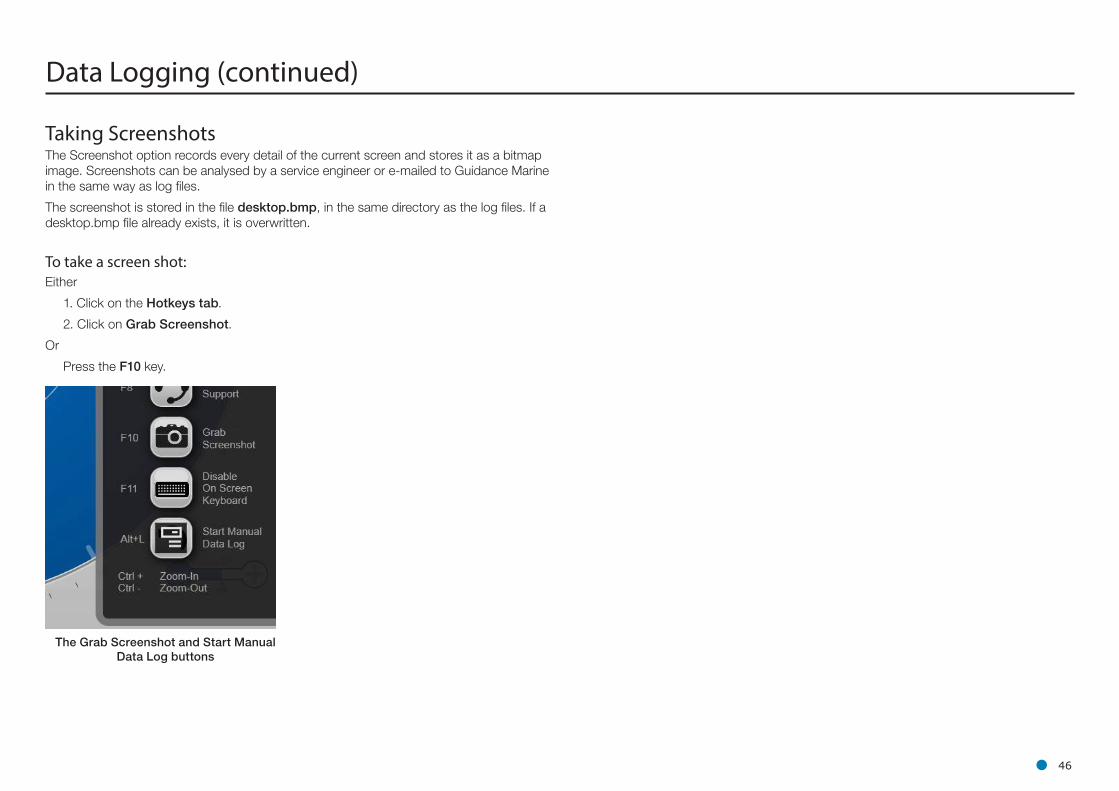
To take a screen shot:Either
1. Click on the Hotkeys tab.
2. Click on Grab Screenshot.
Or
Press the F10 key.
The Grab Screenshot and Start Manual Data Log buttons
ll 47
This section contains the following appendices:
• Setting the Date and Time (Page 48)
• Using the On-Screen Keyboard (Page 49)
• Working with Alarms (Page 50)
• International Standards Compliance (Page 52)
• System Specifications (Page 53)
• Low Temperature Start Up (Page 54)
• Index (Page 55)
Appendices
ll 48
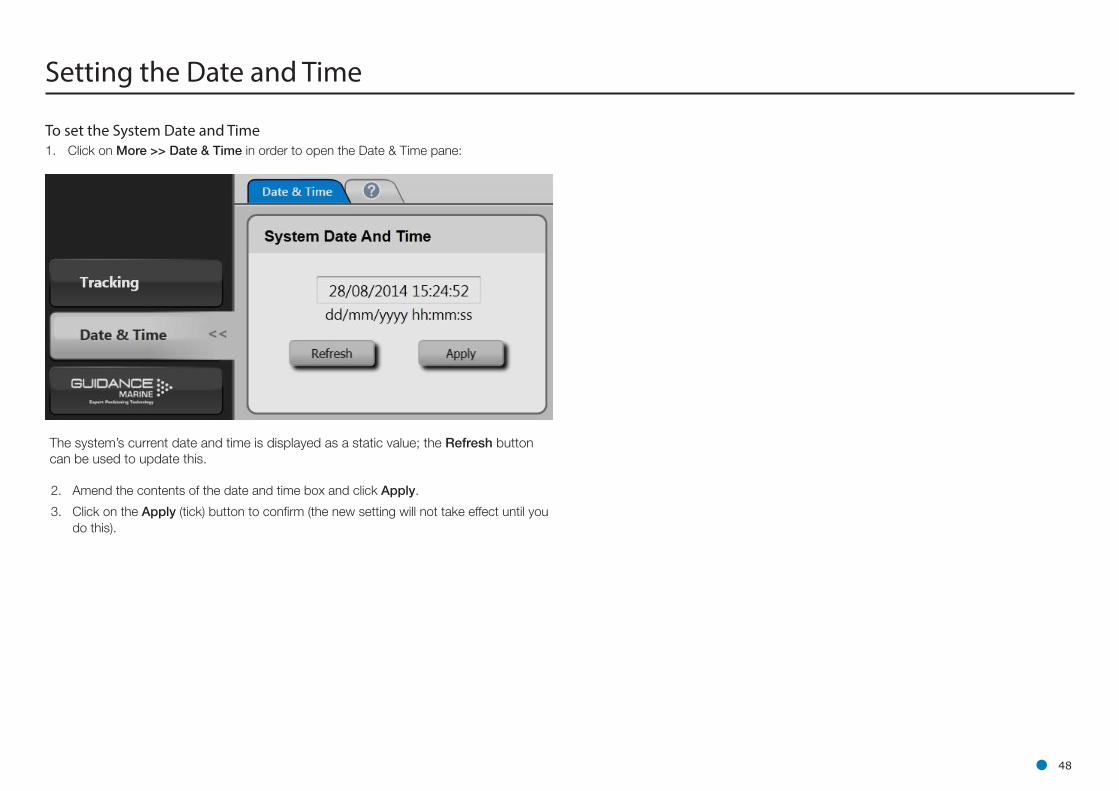
Setting the Date and Time
To set the System Date and Time1. Click on More >> Date & Time in order to open the Date & Time pane:
The system’s current date and time is displayed as a static value; the Refresh button can be used to update this.
2. Amend the contents of the date and time box and click Apply.
3. Click on the Apply (tick) button to confirm (the new setting will not take effect until you do this).
ll 49
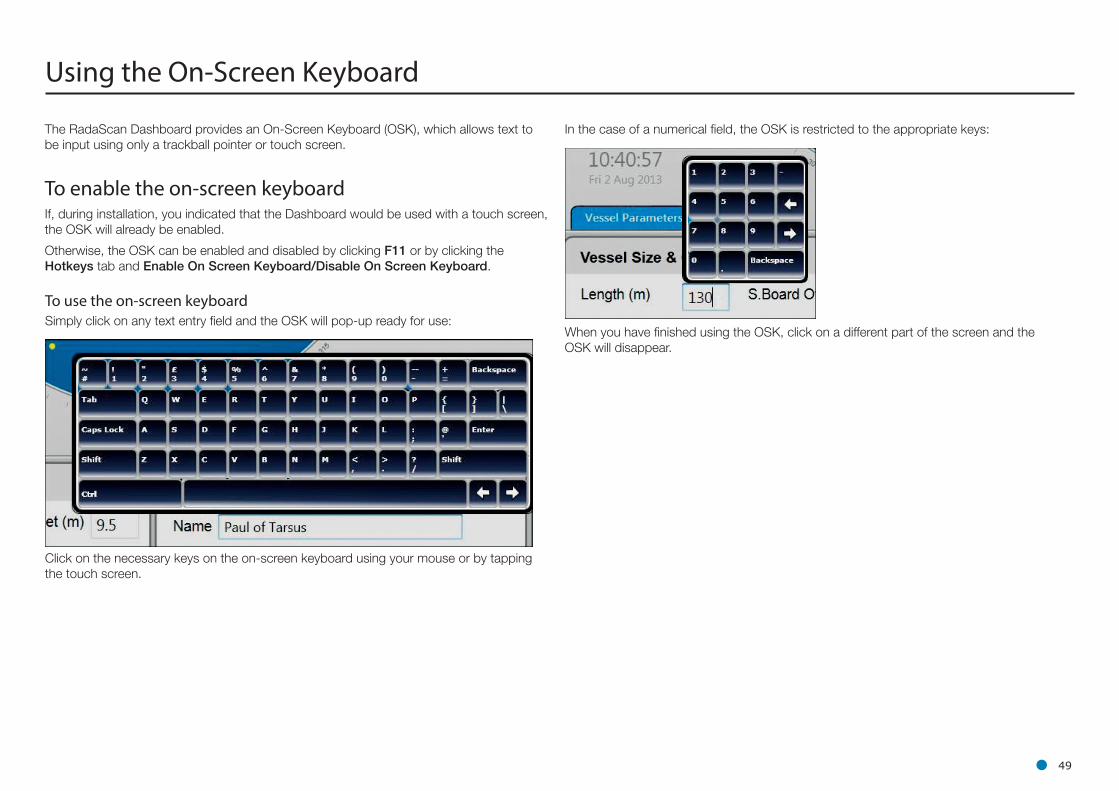
Using the On-Screen Keyboard
The RadaScan Dashboard provides an On-Screen Keyboard (OSK), which allows text to be input using only a trackball pointer or touch screen.
To enable the on-screen keyboardIf, during installation, you indicated that the Dashboard would be used with a touch screen, the OSK will already be enabled.
Otherwise, the OSK can be enabled and disabled by clicking F11 or by clicking the Hotkeys tab and Enable On Screen Keyboard/Disable On Screen Keyboard.
To use the on-screen keyboardSimply click on any text entry field and the OSK will pop-up ready for use:
Click on the necessary keys on the on-screen keyboard using your mouse or by tapping the touch screen.
When you have finished using the OSK, click on a different part of the screen and the OSK will disappear.
In the case of a numerical field, the OSK is restricted to the appropriate keys:
When a Fatal alarm occurs, communications with the sensor are disabled.
In order to return to normal operation, ensure that the fault condition has been cleared, close the Dashboard and re-open. If communications are not re-established, power the sensor off, wait for 20 seconds then power back on.
ll 50
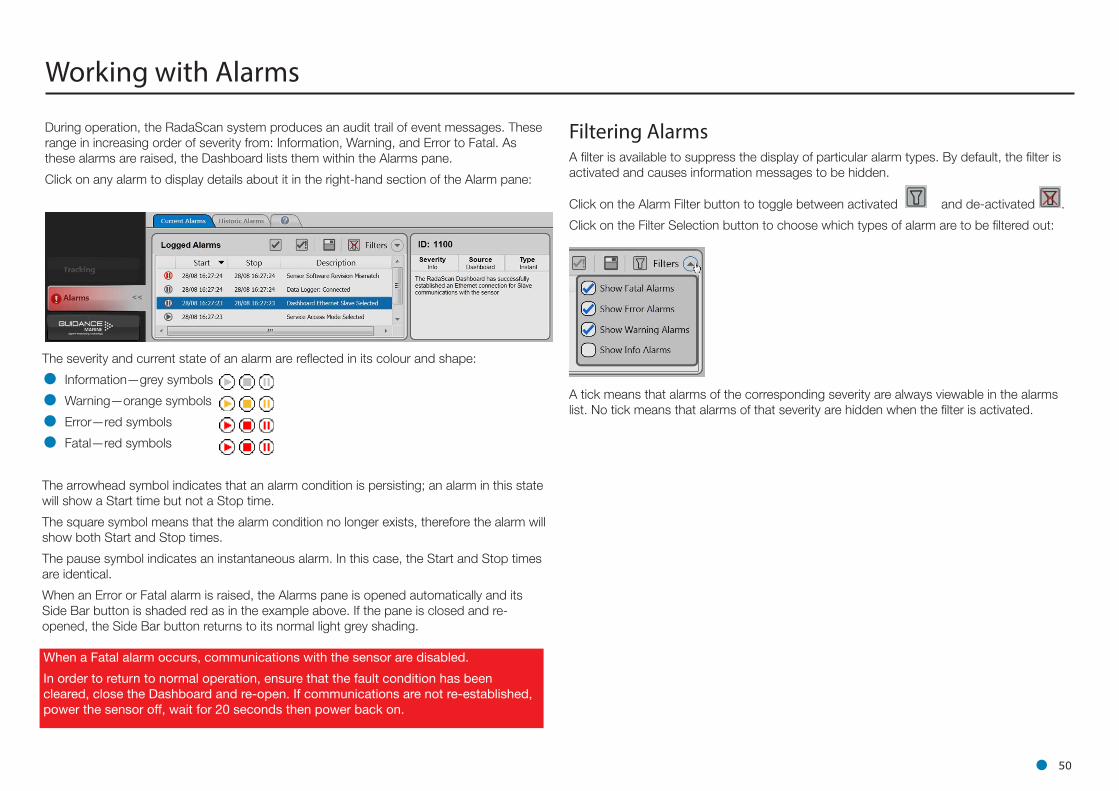
Working with Alarms
During operation, the RadaScan system produces an audit trail of event messages. These range in increasing order of severity from: Information, Warning, and Error to Fatal. As these alarms are raised, the Dashboard lists them within the Alarms pane.
Click on any alarm to display details about it in the right-hand section of the Alarm pane:
Filtering AlarmsA filter is available to suppress the display of particular alarm types. By default, the filter is activated and causes information messages to be hidden.
Click on the Alarm Filter button to toggle between activated and de-activated .
Click on the Filter Selection button to choose which types of alarm are to be filtered out:
A tick means that alarms of the corresponding severity are always viewable in the alarms list. No tick means that alarms of that severity are hidden when the filter is activated.
The severity and current state of an alarm are reflected in its colour and shape:
• Information—grey symbols
• Warning—orange symbols
• Error—red symbols
• Fatal—red symbols
The arrowhead symbol indicates that an alarm condition is persisting; an alarm in this state will show a Start time but not a Stop time.
The square symbol means that the alarm condition no longer exists, therefore the alarm will show both Start and Stop times.
The pause symbol indicates an instantaneous alarm. In this case, the Start and Stop times are identical.
When an Error or Fatal alarm is raised, the Alarms pane is opened automatically and its Side Bar button is shaded red as in the example above. If the pane is closed and re-opened, the Side Bar button returns to its normal light grey shading.
ll 51
Using the Current and Historic Alarms TabsThere are two tabs on the Alarms pane, each containing a list of alarms:
• The Current Alarms tab displays new alarms (raised since the Dashboard was last opened).
• The Historic Alarms tab displays alarms that have been cleared from the Current Alarms tab.
Current alarms are automatically transferred when the Dashboard is closed or when the maximum number of Current Alarms has been reached.
Items on the Current Alarms tab cannot be deleted, they may only be moved to the Historic Alarms tab. Only items on the Historic Alarms tab can be permanently deleted.
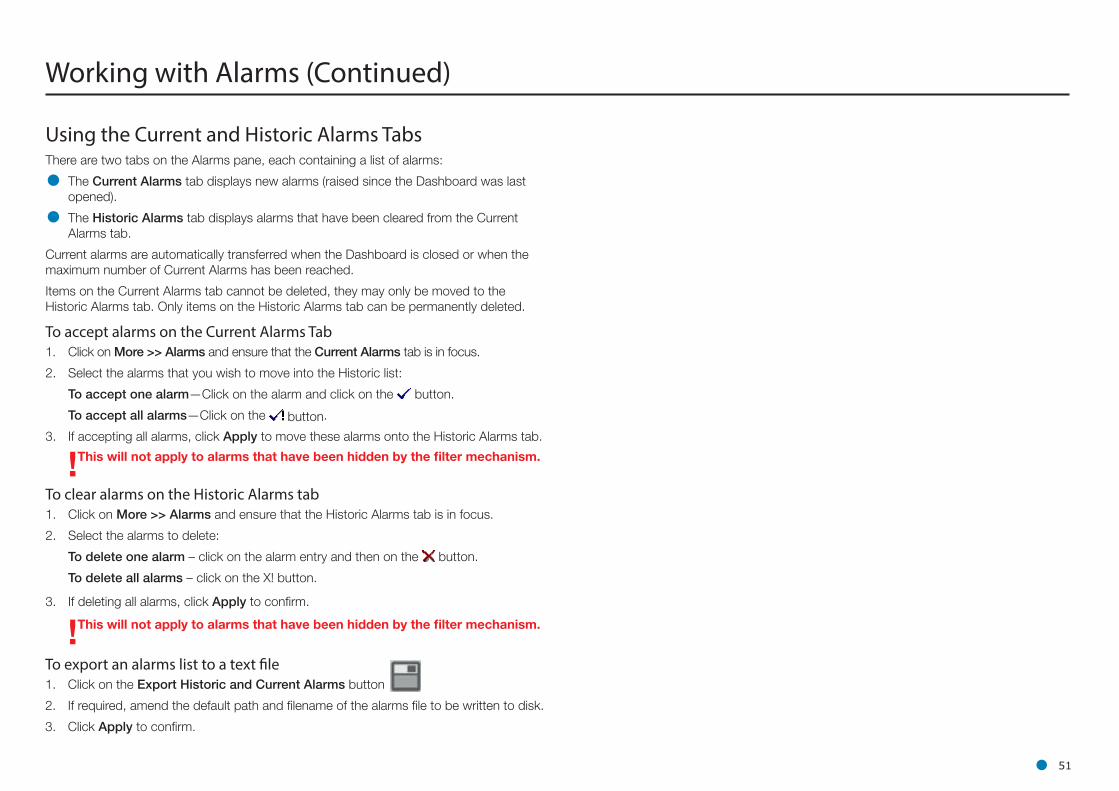
To accept alarms on the Current Alarms Tab1. Click on More >> Alarms and ensure that the Current Alarms tab is in focus.
2. Select the alarms that you wish to move into the Historic list:
To accept one alarm—Click on the alarm and click on the button.
To accept all alarms—Click on the button.
3. If accepting all alarms, click Apply to move these alarms onto the Historic Alarms tab.
To clear alarms on the Historic Alarms tab1. Click on More >> Alarms and ensure that the Historic Alarms tab is in focus.
2. Select the alarms to delete:
To delete one alarm – click on the alarm entry and then on the button.
To delete all alarms – click on the X! button.
3. If deleting all alarms, click Apply to confirm.
Working with Alarms (Continued)
To export an alarms list to a text file1. Click on the Export Historic and Current Alarms button
2. If required, amend the default path and filename of the alarms file to be written to disk.
3. Click Apply to confirm.
!This will not apply to alarms that have been hidden by the filter mechanism.
!This will not apply to alarms that have been hidden by the filter mechanism.
ll 52
International Standards Compliance
RadaScan Transceiver
European UnionThe equipment is permitted to be used in all EU member states without the need for a specific administrative licence.
The RadaScan X-band Transceiver meets the requirements of Directive 2004/108/EC.The equipment complies with EN 60945:2002.
0191
NorwayNote that in Norwegian waters a maritime radio licence is required for the use of the RadaScan Dynamic Positioning Sensor.
Please contact Telenor Maritime Radio to obtain a licence:
Telenor Maritime Radio Radio Licensing Department N-1331 FORNEBU NORWAY
Tel: +47 22 77 43 50 Fax: +47 22 42 70 72 Web: www.maritimradio.no
USAUse of the RadaScan system in the United States of America is authorised by the Federal Communications Commission. FCC ID: VYMRADASCAN.
RadaScan Responders
EU ATEX Directive 94/9/EC, Annex II, 1.06RadaScan responders are certified as intrinsically safe and can be used with flammable gases and vapours belonging to gas group IIB. Series 2 responders can be used in zones 1 and 2 and Series 3 responders can be used in zones 0, 1 and 2.
US
ll 53
System Specifications
Guidance Marine reserves the right to alter or amend this published specification without notice.
SensorEmitter Type: FMCW (9.2 – 9.3GHz maritime radio-location band).
Operating Range: 10 to 1000 metres.
Range Repeatability: 0.25m (1o) up to 600m; 0.5m (1o) up to 1000m.
Angular Repeatability: 0.15° (1o) up to 600m; 0.2° (1o) up to 1000m.
Rotation: Uni-directional, 1Hz.
Beam Shape: Divergent.
Close-range Elevation Angle: +35° at 25m.
Temperature Control: Thermostatic heating circuit.
Vessel InterfacePower Requirement: 90-264V AC 45-65Hz. 80W operation, 120W at power-up.
I/O: Sensor to Dashboard – Ethernet 100Base-T. Sensor to DP – RS422, 9600 baud.
Data Formats: Compatible with common DP systems using standard or customised message types: NMEA0183R, NMEA0183P, MDL Standard, MDL Multi-Target, Kongsberg Standard, MT Custom, Rolls-Royce Custom.
Control & Data DisplayOperating System: Windows 7 Embedded.
Software: Dedicated real-time interactive.
Hardware Options: Type 2 Marine Processor + 15” TFT monitor. Hatteland Type Approved integrated PC/TFT screen.
EnvironmentalOperating Temperature: -50 to +55°C.
Water and Dust Protection: IP66 certified.
EMC: CE and FCC certified.
MechanicalEnclosure: Fibreglass Radome.
Dimensions: 1214mm (Ø), 885mm (h).
Weight: approx 100kg.
Mounting: Securing bolt holes in base.
ResponderType: Active
Environmental Use: CSA responder ATEX certified.
Azimuth Response: 170°.
Elevation Response: +/-35°.
Power: Battery or mains.
Battery Life: 12 months fixed cell, 3 weeks rechargeable cell.
Dimensions: 170 x 305 x 128mm (W x H x D).
Weight: 3.8kg (Rechargable), 3.2kg (Mains/Primary).
ll 54
The RadaScan Sensor will operate at temperatures ranging from -50 to +55°C.
When starting at very low temperatures the sensor may require up to 40 minutes to warm up sufficiently to acquire targets.
Low Temperature Start Up
ll 55
M
Maritime Radio Licence 52Mechanical Specifications 53Mounting 53Multi-Target Mode 26
N
Norway 52Norwegian 52
O
Operating Range 53Operating System 53Operating Temperature 53
P
PositionalInformation Quality 16
Positional Display Modes 28Power Requirement 53Product Label 42
A
A and B Axes 29Access Code 44Alarms
Filtering 50Angular Repeatability 53A Pos 29
Coordinates 36ATEX 52Axis
Orientation Examples 34Azimuth Response 53
B
Battery Life 53Beam Shape 53Bow and Starboard Axes 29B Pos 29
Coordinates 36
C
Close-Range Elevation Angle 53Control & Data Display 53Coordinate Axes 31
D
Dashboard Software 7Data Format 53Detecting Reflections 22Dimensions 53Dust Protection 53
E
Elevation Response 53EMC 53Emitter Type 53Enclosure 53Entering Service Access Mode 44Environmental Specifications 53Ethernet 38European Union 52
F
FCC 52Federal Communications Commission 52Filtering Alarms 50
H
Hardware Options 53
I
International Stds Compliance 52I/O 53
L
Labels 42Licence, Maritime Radio 52Logging
Starting 45, 46Low Temperature Start Up 54
Index
ll 56
R
RadaScanDashboard Software 7Sensor 7
Radio Licence 52Range & Bearing 28Range Repeatability 53Reflections 22
Detecting 22Resetting 24
Resetting Reflections 24Responder 7, 52Rotation 53Rotational Offsets 33
S
Sensor 7Specifications 53
ServiceAccess Code 44Access Mode 44
Single-Target Mode 26Slave 40Software 53Software Version 42Standards 52Starboard Axes 29Start
Manual Logging 45, 46System
Date and Time 48Logging 45Specifications 53
System Overview 7
T
TargetSelection Order 30
Telenor Maritime Radio 52Temperature Control 53Temporary Service Access Code 44
U
USA 52Using the Historic Alarm List 51
V
VesselInterface 53
Vessel Heading 32Align Multi-Target Group to 37
W
Water Protection 53Weight 53Welcome 6Working With
Reflections 22
Index (Continued)