radar: the cassini titan radar mapper - …lasp.colorado.edu/~horanyi/graduate_seminar/radar.pdf ·...
TRANSCRIPT

RADAR: THE CASSINI TITAN RADAR MAPPER
C. ELACHI1,†, M. D. ALLISON2, L. BORGARELLI3, P. ENCRENAZ4, E. IM1,M. A. JANSSEN1, W. T. K. JOHNSON1, R. L. KIRK5, R. D. LORENZ6, J. I. LUNINE6,
D. O. MUHLEMAN7, S. J. OSTRO1, G. PICARDI8, F. POSA9, C. G. RAPLEY10,L. E. ROTH1, R. SEU8, L. A. SODERBLOM5, S. VETRELLA11, S. D. WALL1,!,
C. A. WOOD12 and H. A. ZEBKER13
1Jet Propulsion Laboratory, California Institute of Technology, Pasadena, CA 91109, U.S.A.2Goddard Institute for Space Studies, National Aeronautics and Space Administration, New York,
NY 10025, U.S.A.3Alenia Aerospazio, 00131 Rome, Italy
4Observatoire de Paris, 92195 Meudon, France5U. S. Geological Survey, Flagstaff, AZ 86001, U.S.A.
6Lunar and Planetary Laboratory, University of Arizona, Tucson, AZ 85721, U.S.A.7Division of Geological and Planetary Sciences, California Institute of Technology,
Pasadena, CA 91125, U.S.A.8Universita La Sapienza, 00184 Rome, Italy
9Dip. Interateneo di Fisica, Politecnico di Bari, 70126 Bari, Italy10British Antarctic Survey, CB3 0ET Cambridge, U.K.
11Facolta di Ingegneria, 80125 Naples, Italy12University of North Dakota, Grand Forks, ND 58202, U.S.A.
13Stanford University, Stanford, CA 94305, U.S.A.!(Author for correspondence: E-mail address: [email protected])
†RADAR Team Leader
(Received 23 January 1998; Accepted in final form 3 June 1999)
Abstract. The Cassini RADAR instrument is a multimode 13.8 GHz multiple-beam sensor that canoperate as a synthetic-aperture radar (SAR) imager, altimeter, scatterometer, and radiometer. Theprincipal objective of the RADAR is to map the surface of Titan. This will be done in the imaging,scatterometer, and radiometer modes. The RADAR altimeter data will provide information on relativeelevations in selected areas. Surfaces of the Saturn’s icy satellites will be explored utilizing the RADARradiometer and scatterometer modes. Saturn’s atmosphere and rings will be probed in the radiometermode only. The instrument is a joint development by JPL/NASA and ASI. The RADAR designfeatures significant autonomy and data compression capabilities. It is expected that the instrumentwill detect surfaces with backscatter coefficient as low as "40 dB.
1. Introduction
The Cassini spacecraft, launched on October 15, 1997, carries a multimode Ku-band(13.8 GHz, !2.17-cm) radar instrument (RADAR) designed to probe Titan’s surfaceand other targets in the Saturn system. It is distinguished by a number of novelfeatures which accommodate the large geometric variations in flyby trajectoriesand the wide range of uncertainty in surface properties, and which efficiently utilize
Space Science Reviews 115: 71–110, 2004.C# 2004 Kluwer Academic Publishers. Printed in the Netherlands.
72 C. ELACHI ET AL.
the limited spacecraft resources such as the data rates, the data volumes, and power.This article describes the science objectives, operational modes, and general designof the RADAR; the description given here updates the report published previously(Elachi et al., 1991).
The RADAR will investigate the surface of Titan using all four of its opera-tional modes—imaging, altimetry, scatterometry, and radiometry. The radiometryand scatterometry will also be used to investigate other targets. The utility of radarimaging of solar-system objects, inaccessible to remote sensing at visible wave-lengths has been demonstrated most dramatically by the success of the Magellanradar experiment at Venus (Johnson, 1991; Pettengill et al., 1991; Saunders et al.,1992). It has been known since the early 1960s (e.g. Pettengill et al., 1962) that thecloud-shrouded surface of Venus is solid. The correspondence in the radar cross-sections between Venus and the Moon, Mars, and Mercury (see, e.g. Ostro, 1993)indicated a gross similarity—both compositional and morphological—of Venus’surface to the surfaces of the inner planets. The Arecibo and Goldstone radars hadproduced impressive images of the part of Venus that faces the Earth when thetwo planets are closest and hence when Venus radar echoes are strongest (see, e.g.Campbell et al., 1983). Thus, even prior to the launch of the Magellan mission (andthe Pioneer Venus and Venera 15/16 missions before) the expected return signalwas fairly well understood and the results of the imaging operations anticipated.That situation does not prevail in the case of Titan, though some globally averagedradar reflectivity information exists.
Historically, the telescopic appearance of Titan has been compared to that ofMars and ascribed to the same physical causes. In the words of the discoverer of theatmosphere on Titan (Kuiper, 1944), “the color of Titan is orange, in marked con-trast to Saturn and its other satellites or with Jupiter and its satellites. It seems likelythat the color is due to the action of the atmosphere on the surface itself, analogousto the oxidation supposed to be responsible for the orange color of Mars.” TheVoyager images confirmed that the ball of Titan was indeed orange but the colorhas been attributed to the suspended products of the photo- and radiation-induceddissociation of atmospheric methane. As far-fetched as the idea of Titan made ofiron oxides may seem, it was justified by the density estimates current in Kuiper’stime, which made Titan even denser than the Moon (see Table 2 in Kuiper, 1944).The post-Voyager value of Titan’s density, 1.88 g cm"3 (Tyler et al., 1981; Lindalet al., 1983), allows for a silicate abundance comparable to or less than that of icesand organics together. The suspended aerosol particles represent one end state ofthe photolysis of methane, which also results in the escape of hydrogen from theplanet. Post-Voyager estimates put the loss time of all the atmospheric methane atabout 1% of the age of the solar system. To account for the supply of methane in theatmosphere, a family of models proposed to date require (or admit) the existenceon the Titan’s surface of a massive, perhaps global, methane reservoir, along withethane, propane, and other hydrocarbons (Lunine et al., 1983; Dubouloz et al., 1989;Lunine and Rizk, 1989; Lunine, 1993). But the 1.7 dielectric constant of most light
CASSINI TITAN RADAR MAPPER 73
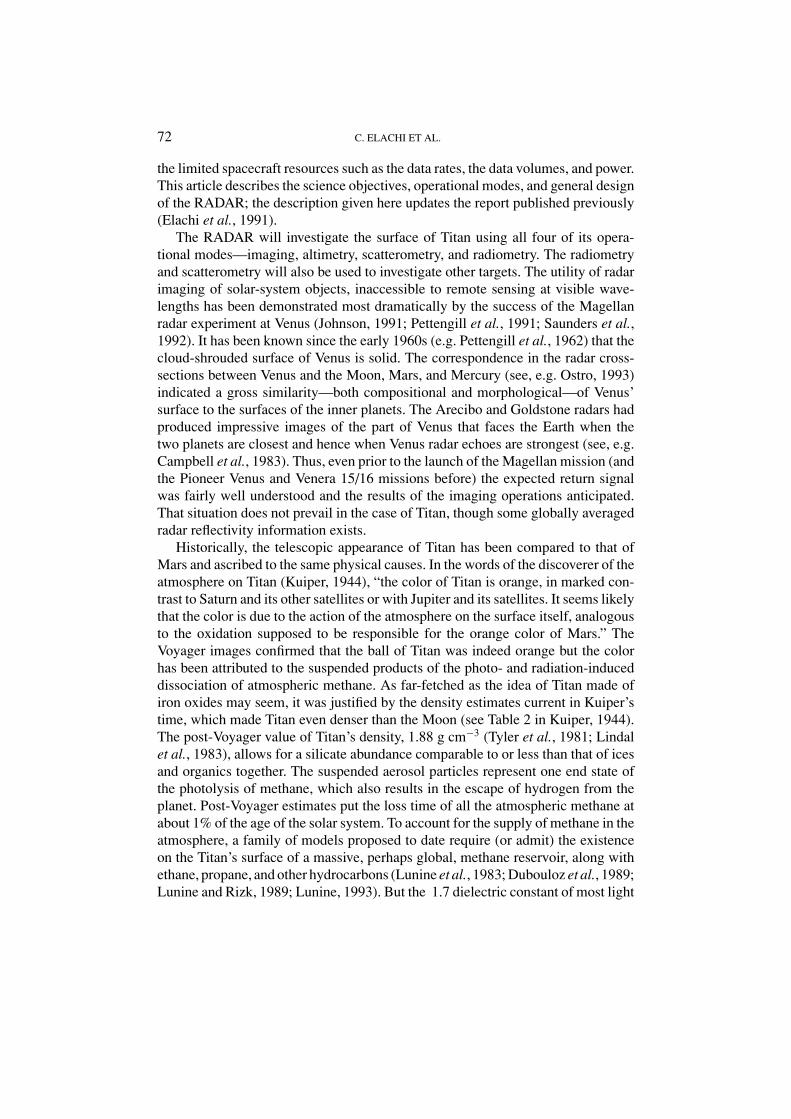
hydrocarbons at 90 K (e.g. Straty and Goodwin, 1973; Sen et al., 1992), implies thatthe reflectivity of an ethane–methane mixture is equal to 0.02. Titan, if it were indeedcovered by a smooth, deep ethane–methane ocean, would generate a weak, specu-lar, longitude-independent radar echo. The results of the !3.5-cm Goldstone/VLATitan radar experiments indicate otherwise: Titan has been found to return a rela-tively strong, diffuse, and longitude-dependent echo (Muhleman et al., 1990, 1992,1993, 1995). On the average, Titan behaves in a manner similar to a Lambertianscatterer, with echoes returned by nearly the entire Earth-facing hemisphere. Theradar cross-section peaks around longitude 90$W (Figure 16 in Muhleman et al.,1995), suggesting that a sizeable segment of the Titan’s leading hemisphere is free ofliquid hydrocarbons. Measurements of the !3.5-cm radio emission from Titan haveyielded emissivity of 0.88 ± 0.03; this corresponds to materials with the dielectricconstant of 2.9 ± 0.6 (Grossman and Muhleman, 1992). Taken alone, the !3.5-cmreflectivity and the angular scattering behavior of Titan are closer to those of Callistothan other radar-studied targets (Figure 17 in Muhleman et al., 1995). When the cir-cular polarization ratio (i.e., the ratio of the same-sense to the opposite-sense circu-larly polarized cross-sections), µc, is also taken into account, the main-belt asteroid4 Vesta, believed to have basaltic crust, emerges as the closest radar analog to Titan(Mitchell et al., 1996; Figure 1). Kuiper erred in assessing the reasons for the opticalappearance of Titan, but he seems to have anticipated Titan’s radar properties—perhaps for wrong reasons also. Contamination by silicates may be responsible forthe Vesta-like radar characteristics of Titan, as might coating by solid photolyticdebris. (For a review of the dielectric properties of higher hydrocarbons, see Thom-son and Squyres, 1990.) As a consequence of the Goldstone/VLA measurements aglobal ocean on Titan should be seen as improbable, but discrete ethane–methanelakes or inland seas are by no means ruled out. Telescopic observations in the 0.9,1.1, 1.3, 1.6, and 2.0 µm methane windows confirm the apparent heterogeneity ofTitan’s surface (Griffith et al., 1991; Griffith, 1993; Lemmon et al., 1993, 1995).Regional albedoes might be consistent with the presence of the water/ammonia iceand of an unspecified dark material—possibly the debris left behind by the methanephotochemistry. The 0.9 and 1.1 µm Hubble Space Telescope maps of Titan (Smithand Lemmon, 1993; Smith et al., 1996) show a feature with an albedo of about 8%above the background, centered at the longitude of 110$W, and covering 107 km2
(i.e. 10% of the total area of Titan). The feature is located on the surface itselfand coincides with the source region of the strong Goldstone/VLA radar echoes(Figure 8 in Smith et al., 1996). The demise of the notion of a global ocean makes thecase for orbital imaging of Titan even more compelling. Given the contrast betweenthe higher-permittivity “bedrock” and the lower-permittivity liquid hydrocarbons,detection of ethane–methane lakes in the RADAR data should be a straightforwardmatter.
The bright IR/radar feature has been referred to as a “continent,” but its actualphysical nature is unknown. Neither an impact-related excavation of cleaner ice nora volcanic resurfacing of the (presumably) tholin-coated bedrock are deemed to be
74 C. ELACHI ET AL.
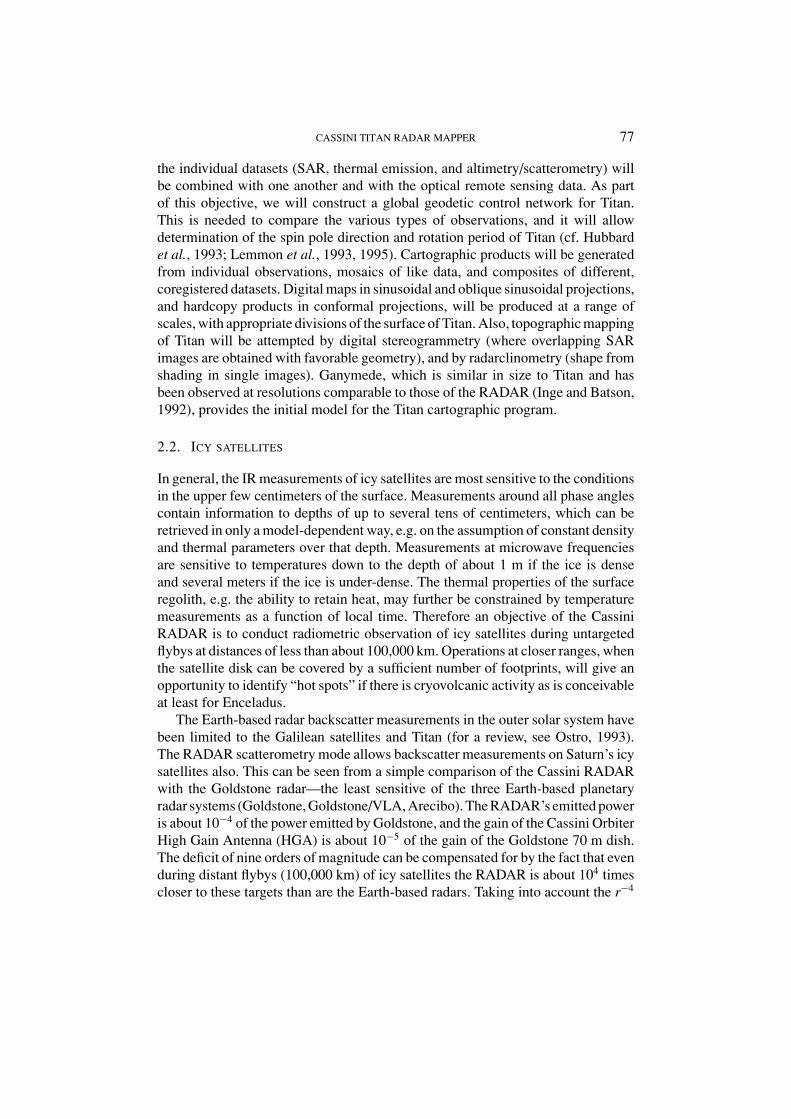
Figure 1. The !3.5-cm opposite-sense radar albedo, " oc, vs. the circular polarization ratio, µc, forthe Moon, Titan, 4 Vesta, Callisto, Europa, and Ganymede. Data sources: The Moon, Table 3 inHarmon and Ostro (1985) and Table 1 in Pettengill (1978); Vesta, Table 7 and Figure 11 in Mitchellet al. (1996); Callisto, Europa and Ganymede, Table 8 in Ostro et al. (1992). The value for the meancross-section of Titan is from Muhleman et al. (1995), p. 369. The error bar on µc for Titan wascomputed from data in Table 1 in Muhleman et al. (1995). Ganymede and Europa are included forcomparison, as the objects with the most extreme radar properties.
the likely generation mechanism of the feature (Smith et al., 1996). Since methaneprecipitation is possible on Titan (Toon et al., 1988), and the associated limitationson the erosion rates are at least qualitatively understood (Lorenz, 1995a; Lorenz andLunine, 1996), the bright feature has tentatively been identified as a topographichigh exposed to the cleansing effect of methane rainfall (Smith et al., 1996). Sincethat cleansing would wash away tholin deposits, the enhanced strength of the radarecho, returned presumably by clean (or cleaner) ice, could then be easily explained.The seasonal hemispheric brightness variability, the other telescopically observedphenomenon on Titan, is probably related to processes taking place well above thesurface (Caldwell et al., 1992; Lorenz et al., 1997), and thus is of no immediateinterest to RADAR.
2. Science Objectives
The overall science objectives of the Cassini mission include five Titan-specificobjectives. Two of these—the determination of the physical state, topography, andcomposition of the Titan’s surface; and the measurement of global temperaturesand general circulation on Titan—constitute the overriding goal of the RADARexperiment. Whenever feasible, the RADAR will also conduct observations ofthe icy satellites, Saturn’s rings, and Saturn itself. The Titan observations, how-ever, constitute the highest scientific priority for the RADAR, and they drive itsdesign.

CASSINI TITAN RADAR MAPPER 75
2.1. TITAN
The general objective of the RADAR experiment is to carry out the first-ordergeological reconnaissance of Titan’s surface and to derive a quantitative charac-terization of the surface. The approach is to use microwave radiation to penetrateopaque atmosphere, map the surface, and, combining RADAR data with the datafrom the Cassini optical remote sensing instruments, obtain a comprehensive un-derstanding of Titan’s physical condition. An important early objective is to acquirecoverage of the Huygen’s landing site. The purpose here is to give regional con-text to the data generated by the probe payload and particularly to the topographymeasurements from the probe’s own (optical) imager and radar altimeter.
A global view of Titan and its geological and climatological history will resultfrom mapping in all four RADAR modes. Special attention will be paid to themoon’s cratering record. The crater size distribution, particularly as a functionof elevation, will provide a constraint on the duration and extent of any episodesof atmospheric collapse (Engel et al., 1995). Crater morphology is an indicator ofsubsurface structure and, by implication, of Titan’s thermal history. The likelihoodof surface liquids suggests that there may be hydroblemes (seabed impact craters)and tsunami deposits. Although only a fraction—about 25%—of Titan’s surfacewill be mapped in the SAR mode, the long, thin coverage swaths are an efficientmeans of establishing the crater distribution—a large impact crater is more likelyto be cut by a long, thin swath than by a square patch of the same area (Lorenz,1995b).
The polar regions of Titan are also important targets for RADAR SAR imaging.The polar climate may have experienced more variability than the global average.The reason for this is that Titan’s obliquity is fractionally larger than the Earth’s,and although its present atmosphere damps out seasonal changes, a thinner pastatmosphere may have allowed the polar temperatures to swing widely. A recentre-analysis of Voyager IR data suggests that the poles may experience more pre-cipitation than the equatorial regions, raising the likelihood of surface liquids anderosional features. The seasonal effects on the polar hazes (Samuelson et al., 1997)may also make these regions more difficult to observe at optical wavelengths.
The RADAR altimetry data will provide information on relative elevations alongportions of the suborbital tracks. The SAR and altimetry data will be examined toseek evidence for the effects of crustal processes such as viscous relaxation andcryovolcanism. Volumes of the cryovolcanic constructs identified in the altimetrydata, may indirectly constrain Titan’s hydrocarbon budget, while morphometry oferosional features may provide information about the rates at which volatiles arerecycled.
The high-resolution (350–720 m) SAR images will permit identification of fea-tures and terrain types that will be observed in varying locations on Titan and indifferent viewing geometries. RADAR scatterometer data will reveal the backscat-ter efficiency versus incidence angle for a large fraction of Titan’ surface, although
76 C. ELACHI ET AL.
the spatial resolution may be coarse (as in the radiometer mode). Nonetheless,scatterometer data will constrain surface slope distribution and the density of theuppermost decimeter of the surface. Scatterometer data will also be most similarto the data taken with the upgraded Arecibo radar during the coming decade andtherefore will allow Titan’s global radar properties to be defined in detail.
In its radiometric mode, RADAR will produce thermal emission (brightnesstemperature) maps of essentially the entire surface of Titan. To this end, the space-craft will be commanded to execute spiral scanning maneuvers. The spiral scanningwill be expanded in targeted areas by rolling the spacecraft about the z-axis. Theemissivity and the integrated reflectivity are complementary (but anti-correlated)quantities. Because the radar backscatter that is measured by the instrument is alsorelated (although weakly) to the integrated reflectivity, the radiometer data maybe expected to provide additional information on the nature of Titan’s surface.The radiometric brightness temperature and its dependence on polarization andangle of incidence will be used to discriminate among surfaces of smooth and bro-ken ice fields, liquid hydrocarbon lakes, and ice coated with organic precipitatesfrom the atmosphere. Specifically, we will augment the interpretation of the active-modes RADAR data by constraining large-scale (10–30 km) surface compositionfrom dielectric properties measured along radar tracks. Emissivity (as well as radarreflectivity) of a given substance is a strong function of the density; thus an emis-sivity map can be interpreted as a surface density map. We hope to discriminatebetween ice and snow or rock and soil in this way. A procedure which is beingdeveloped to interpret the RADAR radiometry data will also be used to modelobservations of comet Wirtanen with the Microwave Instrument for the RosettaOrbiter (MIRO). Finally, taking advantage of the repeated opportunities to collectradiometer data over the entire disk of Titan, we will investigate global circula-tions and thermal transport by determining physical temperature contrasts betweenequator and poles, and between night and day.
The RADAR is a single-polarization instrument, but information about the po-larization state of echoes is often needed to make unambiguous statements aboutphysical properties. Arecibo’s !12.6-cm data will provide a very accurate curve ofTitan’s disk-integrated radar cross-section in two polarizations for subradar tracksnear the equator (as well as nearly global maps with resolutions of order of severalhundreds of kilometers). The availability of Cassini RADAR disk-integrated cross-sections will permit direct, model-independent calibration of Cassini and Arecibodata against each other, and also will define a solid boundary condition on modelsof the backscattering function’s variation over the surface. Titan fills the RADARcenter beam, at about a million kilometers, so disk-integrated measurements shouldbe made no closer than that. At that distance, even a 1 s integration with the scat-terometer will produce an echo much stronger than what Arecibo can obtain on anygiven date.
In order to make the results of the RADAR experiment easily accessible, wewill devise means of placing the data in a consistent spatial framework in which
CASSINI TITAN RADAR MAPPER 77
the individual datasets (SAR, thermal emission, and altimetry/scatterometry) willbe combined with one another and with the optical remote sensing data. As partof this objective, we will construct a global geodetic control network for Titan.This is needed to compare the various types of observations, and it will allowdetermination of the spin pole direction and rotation period of Titan (cf. Hubbardet al., 1993; Lemmon et al., 1993, 1995). Cartographic products will be generatedfrom individual observations, mosaics of like data, and composites of different,coregistered datasets. Digital maps in sinusoidal and oblique sinusoidal projections,and hardcopy products in conformal projections, will be produced at a range ofscales, with appropriate divisions of the surface of Titan. Also, topographic mappingof Titan will be attempted by digital stereogrammetry (where overlapping SARimages are obtained with favorable geometry), and by radarclinometry (shape fromshading in single images). Ganymede, which is similar in size to Titan and hasbeen observed at resolutions comparable to those of the RADAR (Inge and Batson,1992), provides the initial model for the Titan cartographic program.
2.2. ICY SATELLITES
In general, the IR measurements of icy satellites are most sensitive to the conditionsin the upper few centimeters of the surface. Measurements around all phase anglescontain information to depths of up to several tens of centimeters, which can beretrieved in only a model-dependent way, e.g. on the assumption of constant densityand thermal parameters over that depth. Measurements at microwave frequenciesare sensitive to temperatures down to the depth of about 1 m if the ice is denseand several meters if the ice is under-dense. The thermal properties of the surfaceregolith, e.g. the ability to retain heat, may further be constrained by temperaturemeasurements as a function of local time. Therefore an objective of the CassiniRADAR is to conduct radiometric observation of icy satellites during untargetedflybys at distances of less than about 100,000 km. Operations at closer ranges, whenthe satellite disk can be covered by a sufficient number of footprints, will give anopportunity to identify “hot spots” if there is cryovolcanic activity as is conceivableat least for Enceladus.
The Earth-based radar backscatter measurements in the outer solar system havebeen limited to the Galilean satellites and Titan (for a review, see Ostro, 1993).The RADAR scatterometry mode allows backscatter measurements on Saturn’s icysatellites also. This can be seen from a simple comparison of the Cassini RADARwith the Goldstone radar—the least sensitive of the three Earth-based planetaryradar systems (Goldstone, Goldstone/VLA, Arecibo). The RADAR’s emitted poweris about 10"4 of the power emitted by Goldstone, and the gain of the Cassini OrbiterHigh Gain Antenna (HGA) is about 10"5 of the gain of the Goldstone 70 m dish.The deficit of nine orders of magnitude can be compensated for by the fact that evenduring distant flybys (100,000 km) of icy satellites the RADAR is about 104 timescloser to these targets than are the Earth-based radars. Taking into account the r"4
78 C. ELACHI ET AL.
dependence of the received power, the RADAR might thus be about 107 timesmore sensitive than the Goldstone system. As an example, the RADAR scatterom-eter can obtain a signal-to noise ratio equal to 2 (comparable to that obtained by theGoldstone/VLA observations of Titan; see Muhleman et al., 1990) by integratingonly 1400 pulses from 500 km objects (Dione, Tethys) at a range of 300,000 km.Much higher signal-to-noise and spatially resolved measurements can be achievedat shorter ranges. Since radar cross-sections are equivalent to microwave albedoes,these measurements will complement the measurements of the visible and IR albe-does obtained by the Cassini optical remote sensing instruments. Furthermore, theRADAR scatterometer observations of icy satellites may be conducted at rangestoo large to be useful to optical remote sensing. (Tour 18-5 offers 138 flybys oficy satellites at ranges from 100,000 to 300,000 km.) This would contribute to theoptimal utilization of all available tour segments.
2.3. SATURN’S RINGS
Microwave flux due to the thermal emission by the rings particles and to scatteringby the same particles of the emission from the deep atmosphere of Saturn will besensed in the RADAR radiometer mode. Microwave emission from the ring particlesuniquely probes through the mass of the particles because the !2-cm wavelengthpenetration depth is of the order of 1 m. Thus, the RADAR radiometer presentsthe best way to measure the ice-to-dust ratio of the particles, as a function of radialdistance from Saturn. Several radial scans of the ring system will be required duringhigh-inclination Saturn passes.
2.4. SATURN
The deep subcloud region of Saturn is inaccessible to observation by means otherthan the measurement of thermal emission that originates in that region. TheRADAR objective is to map variations in ammonia humidity in the subcloud re-gion, which can be achieved through RADAR radiometer mapping. Ammonia isa tracer of atmospheric motions and provides unique insight into the dynamics ofSaturn’s atmosphere. Also, the radiometer provides a deeper, and hence comple-mentary, weighting function to other Cassini instruments that operate at shorterwavelengths, and makes an essential contribution to the sounding of Saturn’satmosphere.
Microwave imaging of Saturn at centimeter wavelengths from the Very LargeArray (VLA) (Grossman et al., 1989) reveals significant latitudinal structure, plau-sibly interpreted as a decrease in the ammonia vapor abundance at the cloud deckfrom equator to pole (Grossman, 1990). VLA images of Saturn are compromised,however, by the geometrical foreshortening of the polar region as well as the aper-ture synthesis and necessary 3 h integration of zonally smeared observations, and
CASSINI TITAN RADAR MAPPER 79
are limited to a 2% variation in their dynamic range. Polar observations at a near-normal viewing angle by the Cassini RADAR radiometer can resolve the horizontalammonia structure in the region of the Saturn polar hexagon (Allison et al., 1990)and with complementary mapping from low-inclination orbits potentially affordcharacterization of vertical variations apparent at differing emission angles. Thefurther prospects for these observations would include their possible interpreta-tion as tracer-maps of Saturn’s “potential vorticity” distribution (cf. Allison et al.,1995).
High-inclination flybys will be required for polar imaging, low-inclination fly-bys for acquiring a full longitudinal image of the planet. To conduct radiometricobservations, the preferred range of distances to Saturn is anticipated to be betweenabout 5RS and 15RS, where Rs is the equatorial radius of Saturn, roughly 60,000km. It is also the objective of RADAR to obtain synoptic thermal-emission imagesof Saturn’s disk. These images will be used to calibrate the radiometer for the Titanradiometric mapping.
3. Experiment Description
Since the RADAR will operate almost exclusively during close flybys of its targets,altitudes will change rapidly throughout the data collection periods. Under suchconditions, operations in a multiplicity of modes are a necessity. The instrumentwas designed to incorporate four modes: imaging (either high- or low-resolution),altimetry, scatterometry, and radiometry. The basics of operations in these modesare outlined below; the system design considerations are summarized in Sections4 and 5.
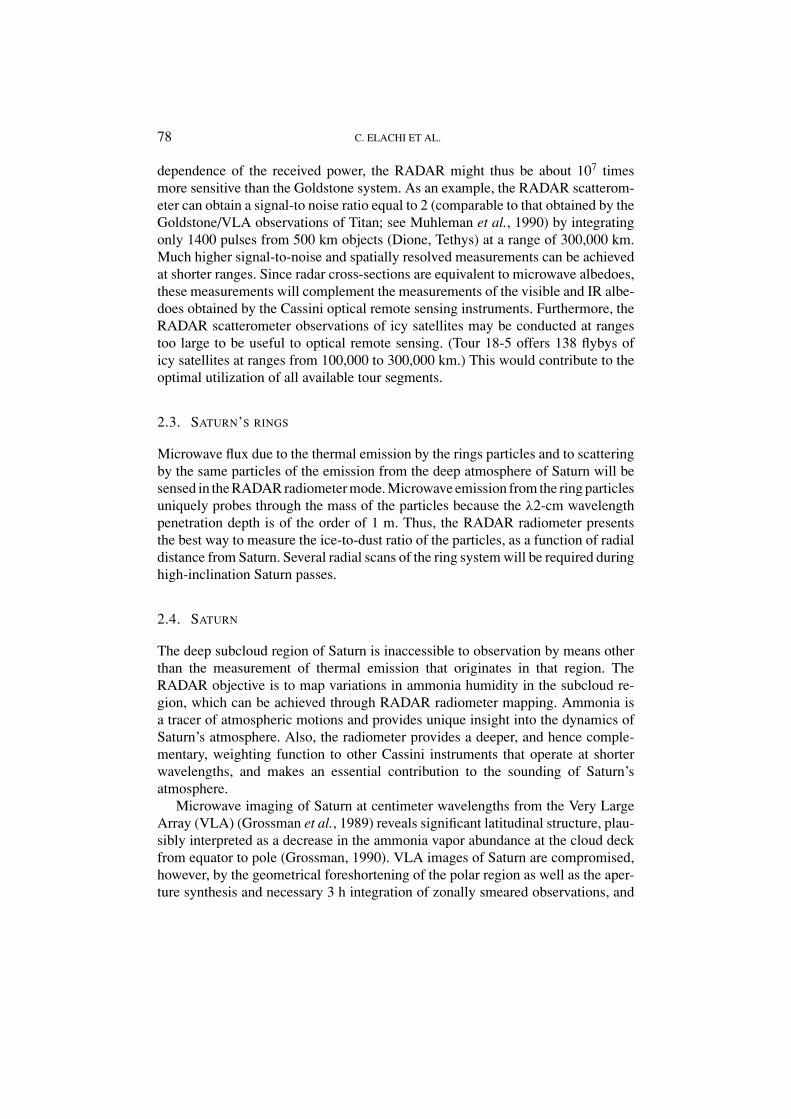
An optimum Titan flyby scenario, in which all RADAR modes are exercisedand a maximum volume of data is collected, calls for about 10 h of uninterruptedoperations. At 5 h away from the closest approach, the spacecraft is about 100,000km from Titan (Figure 2). At that distance the RADAR is used in the radiometer-only mode. As the spacecraft approaches Titan, the remaining modes are activated;first scatterometry, followed by altimetry, and, finally, imaging. Upon receding
Figure 2. Sequence of the RADAR operational modes during a nominal Titan flyby. To the RADAR,the term “nominal” designates a flyby with the closest-approach altitude of 1,000 km.

80 C. ELACHI ET AL.
TAB
LE
IC
assi
niR
AD
AR
Dat
aC
hara
cter
istic
s
Alti
tude
Inci
denc
eR
esol
utio
nN
E"
0N
umbe
rSu
rfac
e(k
m)
angl
e($
)(a
tbor
esig
ht)(
dB)
oflo
oks
cove
rage
(%)
Azi
mut
h(k
m)
Ran
ge(k
m)
Ver
tical
(m)
SAR Hig
hre
solu
tion
1,00
0–1,
600
21–3
00.
35–0
.41
0.48
–0.6
4N
/A"
28to
"21
2–3
%1.
1L
owre
solu
tion
1,60
0–4,
000
15–2
80.
41–0
.72
0.48
–2.7
0N
/A"
25to
"15
2–7
%1.
1A
ltim
eter
4,00
0–9,
000
024
–27
24–2
760
"3
to"
3516
–36
N/A
Scat
tero
met
er9,
000–
22,5
000–
3055
–140
55–1
40N
/A"
4to
"36
N/A
20R
adio
met
er1,
000–
100,
000
0–80
6–60
06–
600
N/A
N/A
N/A
40
N/A
:Not
appl
icab
le.
CASSINI TITAN RADAR MAPPER 81
from Titan, the order of modes is reversed. A detailed description of the RADARobservational strategy is presented in Section 3.5 below.
3.1. IMAGING
The RADAR imaging mode provides low-to-high resolution synthetic aperture(SAR) images. The meaning of the terms “low” and “high” in the present contextis clarified in Table I. Reference to appropriate analogs may be of further help.Thus, when considering the absolute pixel size, the low-resolution RADAR imageswill be comparable to the Venera-15/16 and Arecibo radar images of Venus, andthe high-resolution RADAR images will be similar in resolution to the Mariner-9optical images of Mars.
As the SAR data are being acquired, the spacecraft is pointed to the left or rightof the nadir track. The way in which this off-nadir angle is varied is referred to asthe look-angle profile, where look angle is the angle between boresight and nadir.Look angle is used to calculate the incidence angle—the angle between the antennaboresight and local surface normal. For typical natural surfaces, larger incidenceangles tend to better reveal surface topography. From a mission standpoint, theprofile of incidence (or look) angle used during SAR datataking is unconstrainedexcept for limitations on spacecraft turning rates. One likely algorithm is to keep thelargest incidence angle possible, consistent with a given received signal-to-noiseratio. This rule was followed during the primary mapping phase of the Magellanmission. An alternative philosophy is to maintain constant incidence angle withrespect to the surface; this facilitates comparisons of images from different areas.For more detailed information on the principles of SAR imaging and interpretation,see, e.g. Elachi (1987, 1988) and Johnson (1991).
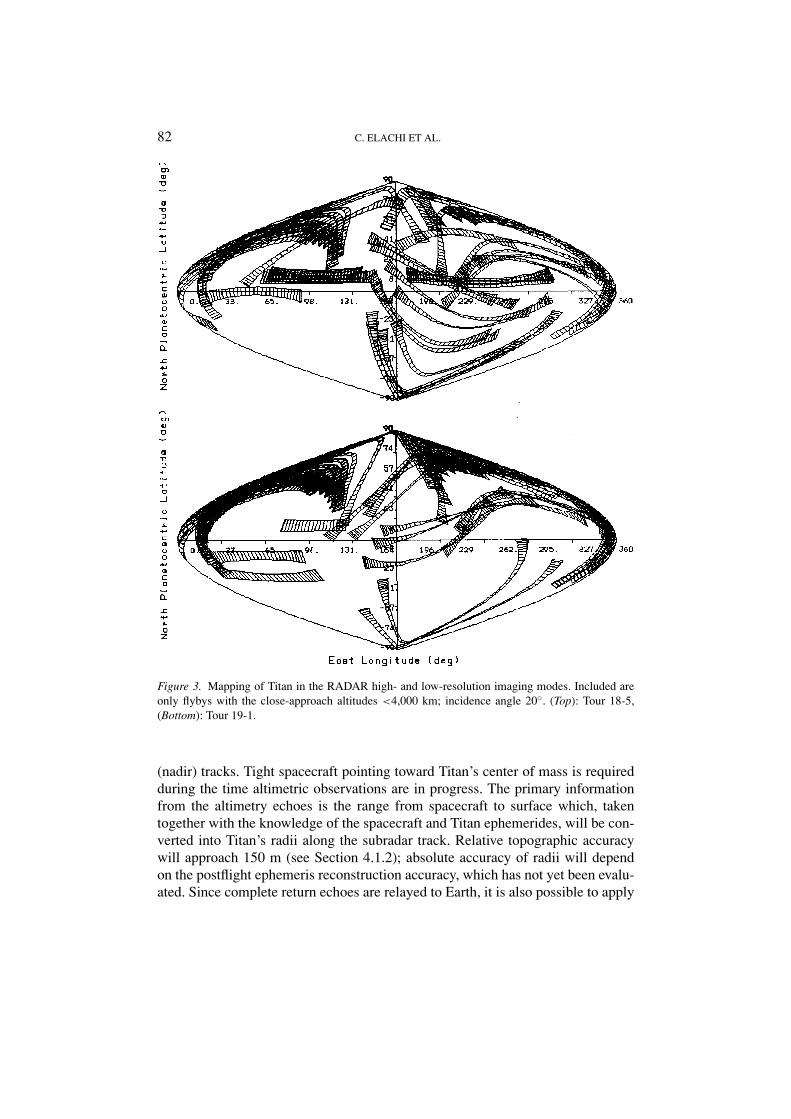
The total width of the RADAR swath is created by combining the five individu-ally illuminated sub-swaths (see Section 5.4) and ranges from 120 to 450 km at thespacecraft altitude, h, of 1,000 to 4,000 km. Each 1,000 km flyby of the RADARwill yield a SAR strip about 5,000 km long. Each such strip will image about 1.1%of Titan’s surface. Over a tour in which, say, 25 close flybys would be availableto the RADAR, at least 25% of Titan’s surface could be imaged. This statement,although true in principle, needs to be qualified. As the example of the tours 18-5and 19-1, introduced in Figure 3, illustrates, the SAR coverage is sensitive to thecharacteristics of a given tour—the segment of Titan repeatedly imaged in onetour may be invisible to the RADAR in another tour. Furthermore, the unavoidableoverlap dictated by orbital dynamics reduces the aggregate SAR coverage in eachtour.
3.2. ALTIMETRY
The altimetry mode will typically employ only the central, narrow antenna beam, tomake time-of-flight measurements of the relative surface elevations along suborbital
82 C. ELACHI ET AL.
Figure 3. Mapping of Titan in the RADAR high- and low-resolution imaging modes. Included areonly flybys with the close-approach altitudes <4,000 km; incidence angle 20$. (Top): Tour 18-5,(Bottom): Tour 19-1.
(nadir) tracks. Tight spacecraft pointing toward Titan’s center of mass is requiredduring the time altimetric observations are in progress. The primary informationfrom the altimetry echoes is the range from spacecraft to surface which, takentogether with the knowledge of the spacecraft and Titan ephemerides, will be con-verted into Titan’s radii along the subradar track. Relative topographic accuracywill approach 150 m (see Section 4.1.2); absolute accuracy of radii will dependon the postflight ephemeris reconstruction accuracy, which has not yet been evalu-ated. Since complete return echoes are relayed to Earth, it is also possible to apply
CASSINI TITAN RADAR MAPPER 83
appropriate scattering models to infer surface microtopography and reflecting prop-erties, as has been done with the Magellan altimetry data (Ford and Pettengill, 1992;Tyler et al., 1992). The full length of a suborbital track for the spacecraft movingfrom the altitude of 10,000 km, through closest approach at 1,000 km, back to10,000 km, is about 6,500 km. That is the maximum length of a topographic profilethat can be obtained, assuming imaging is sacrificed to altimetry. For comparison,the currently available Goldstone altimetry profiles of Mars span no more thanabout 6,000 km (Downs et al., 1975). During a nominal Titan flyby (Figure 2), thetwo topographic profiles collected at the tail ends of imaging runs will each spanabout 750 km.
3.3. SCATTEROMETRY
The RADAR scatterometer mode measures the surface backscatter coefficient, " 0(radar cross-section normalized to the illuminated surface area), as a function ofthe incidence angle. From the instrument standpoint, this mode does not differfrom the altimetry mode except for the reduced resolution; it has in fact often beenreferred to as “low-resolution altimetry.” Since echoes at multiple incidence anglesare desired, the spacecraft is commanded to scan preselected portions of Titan’sdisk between the nadir and limb, as during the RADAR radiometer observations.This mode allows radar echoes to be obtained from anywhere on Titan at a variety ofincidence angles, albeit at resolutions much coarser than in the other active modes.An alternate mode manner of scatterometer operations, in which the RADAR centralbeam illuminates the icy satellites from a considerable distance, has been brieflyoutlined in Section 2.2.
3.4. RADIOMETRY
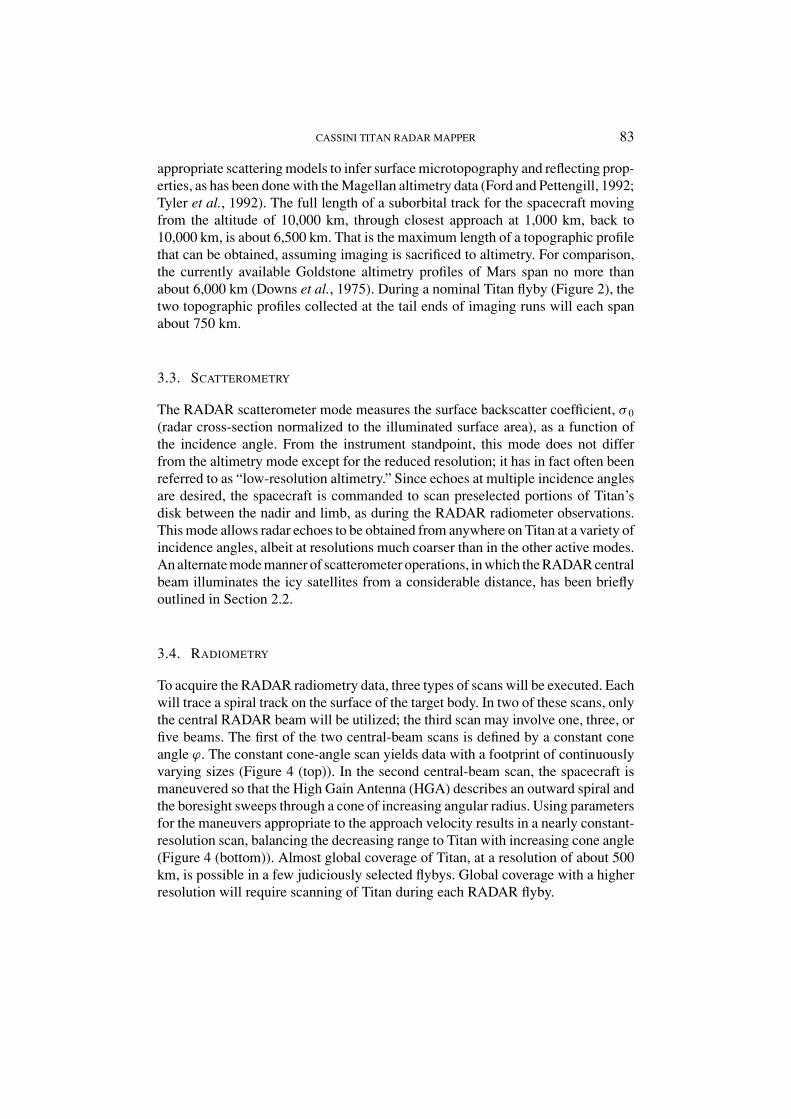
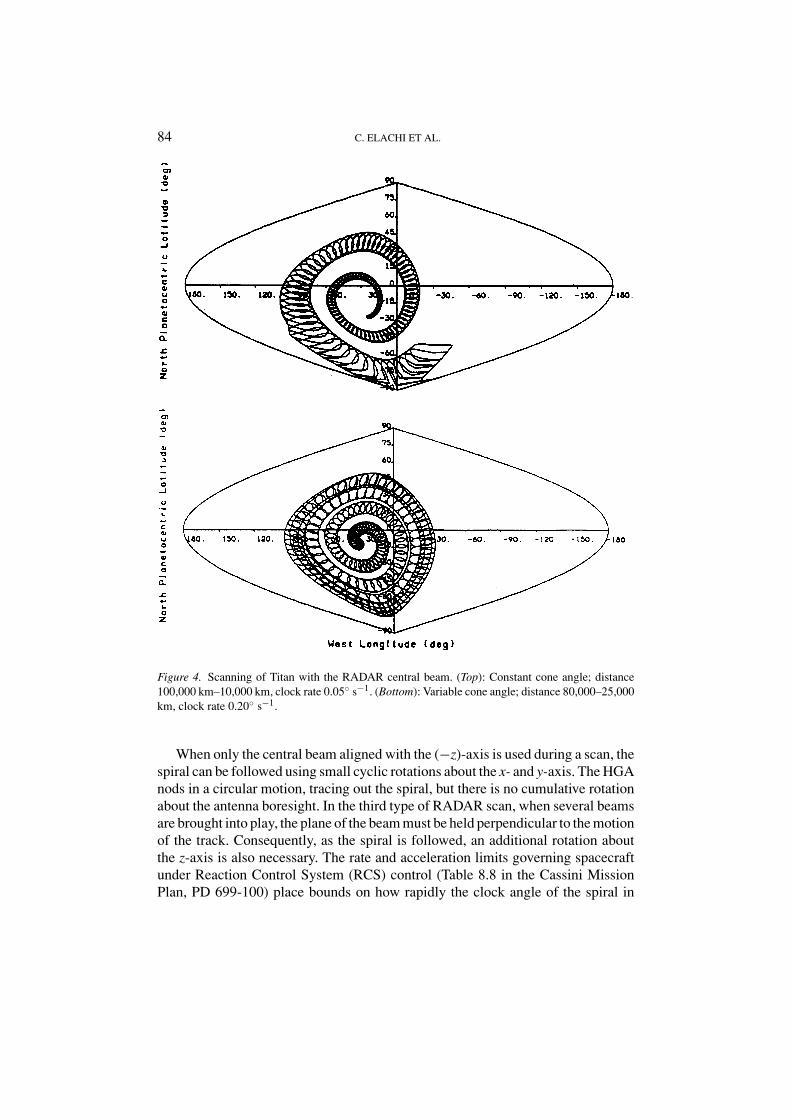
To acquire the RADAR radiometry data, three types of scans will be executed. Eachwill trace a spiral track on the surface of the target body. In two of these scans, onlythe central RADAR beam will be utilized; the third scan may involve one, three, orfive beams. The first of the two central-beam scans is defined by a constant coneangle #. The constant cone-angle scan yields data with a footprint of continuouslyvarying sizes (Figure 4 (top)). In the second central-beam scan, the spacecraft ismaneuvered so that the High Gain Antenna (HGA) describes an outward spiral andthe boresight sweeps through a cone of increasing angular radius. Using parametersfor the maneuvers appropriate to the approach velocity results in a nearly constant-resolution scan, balancing the decreasing range to Titan with increasing cone angle(Figure 4 (bottom)). Almost global coverage of Titan, at a resolution of about 500km, is possible in a few judiciously selected flybys. Global coverage with a higherresolution will require scanning of Titan during each RADAR flyby.
84 C. ELACHI ET AL.
Figure 4. Scanning of Titan with the RADAR central beam. (Top): Constant cone angle; distance100,000 km–10,000 km, clock rate 0.05$ s"1. (Bottom): Variable cone angle; distance 80,000–25,000km, clock rate 0.20$ s"1.
When only the central beam aligned with the ("z)-axis is used during a scan, thespiral can be followed using small cyclic rotations about the x- and y-axis. The HGAnods in a circular motion, tracing out the spiral, but there is no cumulative rotationabout the antenna boresight. In the third type of RADAR scan, when several beamsare brought into play, the plane of the beam must be held perpendicular to the motionof the track. Consequently, as the spiral is followed, an additional rotation aboutthe z-axis is also necessary. The rate and acceleration limits governing spacecraftunder Reaction Control System (RCS) control (Table 8.8 in the Cassini MissionPlan, PD 699-100) place bounds on how rapidly the clock angle of the spiral in
CASSINI TITAN RADAR MAPPER 85
either of the three scans can change. If $ is the clock rate, then $# must be less than0.4$ s"1 and $2# must less than 0.01$ s"2, at all times. Either of the three RADARscans can be commanded by representing the surface track relative to the centerof the target body as a sequence of vector polynomial segments in the Attitudeand Articulation Control Subsystem (AACS) inertial vector table. An additionalconstraint that is imposed by the maximum frequency content of vector representa-tions in AACS limits $ to less than 3.6$ s"1. Radiometry data will also be acquiredduring each of the active modes through the same beam used in the active mode(i.e. when transmitting) for that radar burst. The data will be acquired between thebursts.
3.5. DATA ACQUISITION SCENARIOS
The RADAR will conduct its observations in the mission’s RADAR/INMS opera-tional mode. Because of similar requirements on Titan flyby geometry, the RADARand the Ion and Neutral Mass Spectrometer (INMS) have been combined into a sin-gle mission operational mode; for the definitions of the mission operational modes,see Tables 8.1 and 8.4 in PD 699-100. Use of the RADAR modes depends primarilyon (1) pass assignment; (2) flyby altitude; (3) science objectives; and (4) agreed-upon priorities among the instruments within the RADAR/INMS mode. SharingTitan passes with other investigations may allow optimizing Titan observations forall parties, although these opportunities depend on, for example, the spacecraftbeing able to turn and change operational modes rapidly enough that the cost inoverhead is small compared with the incremental science gain. The final observa-tion strategy will be determined before arrival at Saturn; combined scenarios mayindeed turn out to be attractive in their ability to maximize the amount of sciencedata collected.
Ideally, the RADAR’s full capabilities would be realized in a RADAR-dedicatedTitan pass with a flyby altitude of 1,000 km or lower (Figure 2). In the inter-val between "6 and "5 h relative to the closest approach to Titan, and after theRADAR receiver had sufficiently warmed up, external radiometric calibration isperformed by pointing the HGA at one or more predetermined calibration targets(cold sky, the Sun, the disk of Saturn, or a galactic radio source) and gatheringthermal energy emitted by those targets. About 6 h before the closest approach,radar sequences are loaded. The subsequent operations are autonomous althoughcoordinated with spacecraft maneuvers. At about "5 h (h = 100, 000 km), the in-strument commences observations in the radiometer mode as the spacecraft createsa scan pattern. Reception of thermal emission continues even when the RADARis in active modes, but scanning using the spacecraft becomes less useful as theangular movement relative to Titan increases. At about "78 min (h = 25, 000 km),the instrument begins active scatterometric observations. Depending on availablemaneuver time and desired targeting, either single- or multiple-beam observations
86 C. ELACHI ET AL.
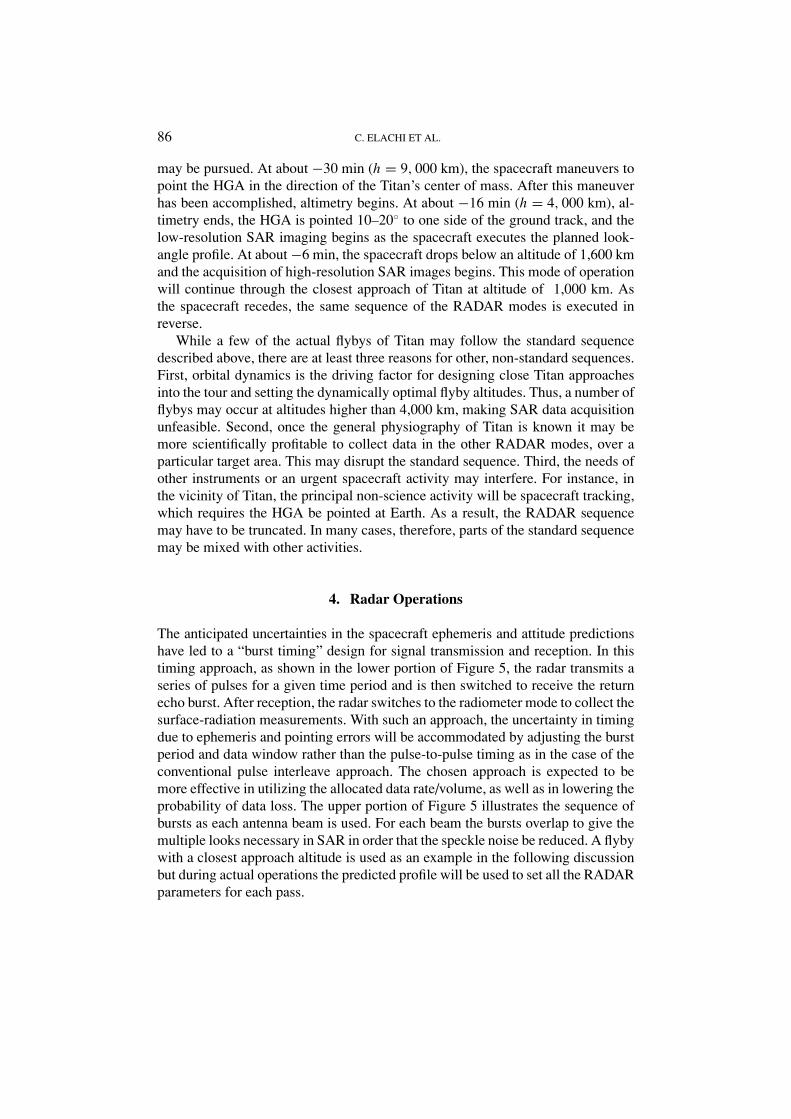
may be pursued. At about "30 min (h = 9, 000 km), the spacecraft maneuvers topoint the HGA in the direction of the Titan’s center of mass. After this maneuverhas been accomplished, altimetry begins. At about "16 min (h = 4, 000 km), al-timetry ends, the HGA is pointed 10–20$ to one side of the ground track, and thelow-resolution SAR imaging begins as the spacecraft executes the planned look-angle profile. At about "6 min, the spacecraft drops below an altitude of 1,600 kmand the acquisition of high-resolution SAR images begins. This mode of operationwill continue through the closest approach of Titan at altitude of 1,000 km. Asthe spacecraft recedes, the same sequence of the RADAR modes is executed inreverse.
While a few of the actual flybys of Titan may follow the standard sequencedescribed above, there are at least three reasons for other, non-standard sequences.First, orbital dynamics is the driving factor for designing close Titan approachesinto the tour and setting the dynamically optimal flyby altitudes. Thus, a number offlybys may occur at altitudes higher than 4,000 km, making SAR data acquisitionunfeasible. Second, once the general physiography of Titan is known it may bemore scientifically profitable to collect data in the other RADAR modes, over aparticular target area. This may disrupt the standard sequence. Third, the needs ofother instruments or an urgent spacecraft activity may interfere. For instance, inthe vicinity of Titan, the principal non-science activity will be spacecraft tracking,which requires the HGA be pointed at Earth. As a result, the RADAR sequencemay have to be truncated. In many cases, therefore, parts of the standard sequencemay be mixed with other activities.
4. Radar Operations
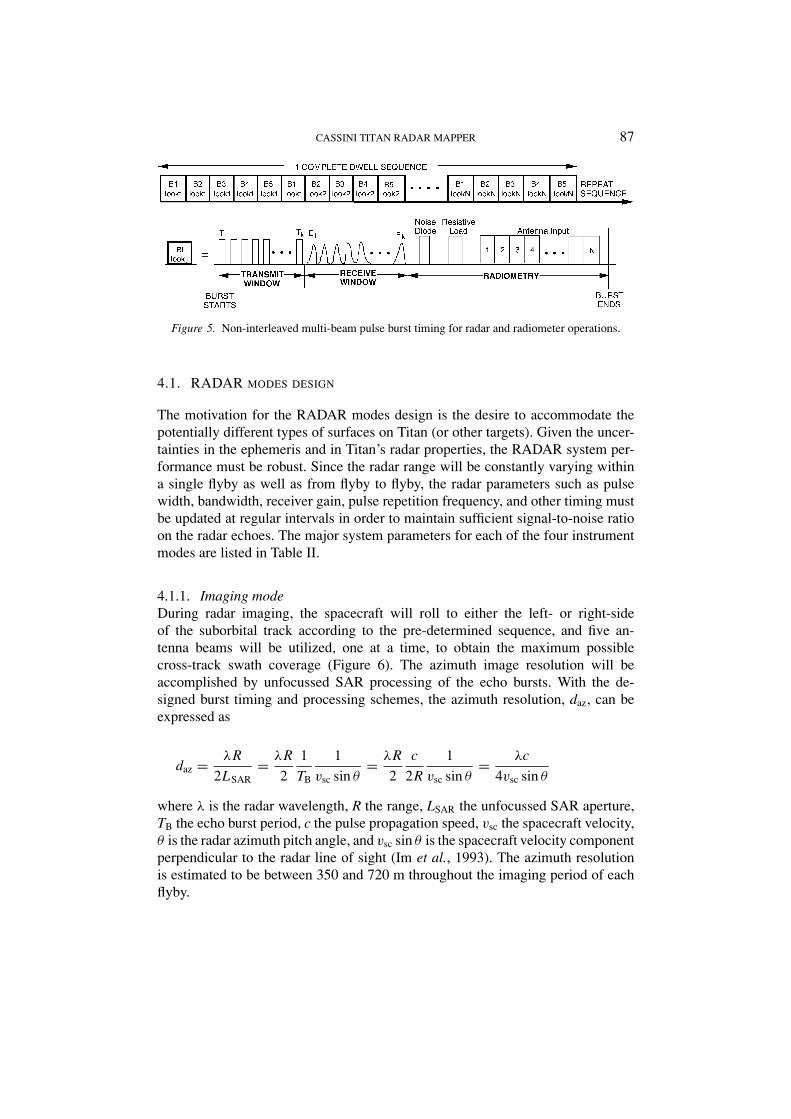
The anticipated uncertainties in the spacecraft ephemeris and attitude predictionshave led to a “burst timing” design for signal transmission and reception. In thistiming approach, as shown in the lower portion of Figure 5, the radar transmits aseries of pulses for a given time period and is then switched to receive the returnecho burst. After reception, the radar switches to the radiometer mode to collect thesurface-radiation measurements. With such an approach, the uncertainty in timingdue to ephemeris and pointing errors will be accommodated by adjusting the burstperiod and data window rather than the pulse-to-pulse timing as in the case of theconventional pulse interleave approach. The chosen approach is expected to bemore effective in utilizing the allocated data rate/volume, as well as in lowering theprobability of data loss. The upper portion of Figure 5 illustrates the sequence ofbursts as each antenna beam is used. For each beam the bursts overlap to give themultiple looks necessary in SAR in order that the speckle noise be reduced. A flybywith a closest approach altitude is used as an example in the following discussionbut during actual operations the predicted profile will be used to set all the RADARparameters for each pass.
CASSINI TITAN RADAR MAPPER 87
Figure 5. Non-interleaved multi-beam pulse burst timing for radar and radiometer operations.
4.1. RADAR MODES DESIGN
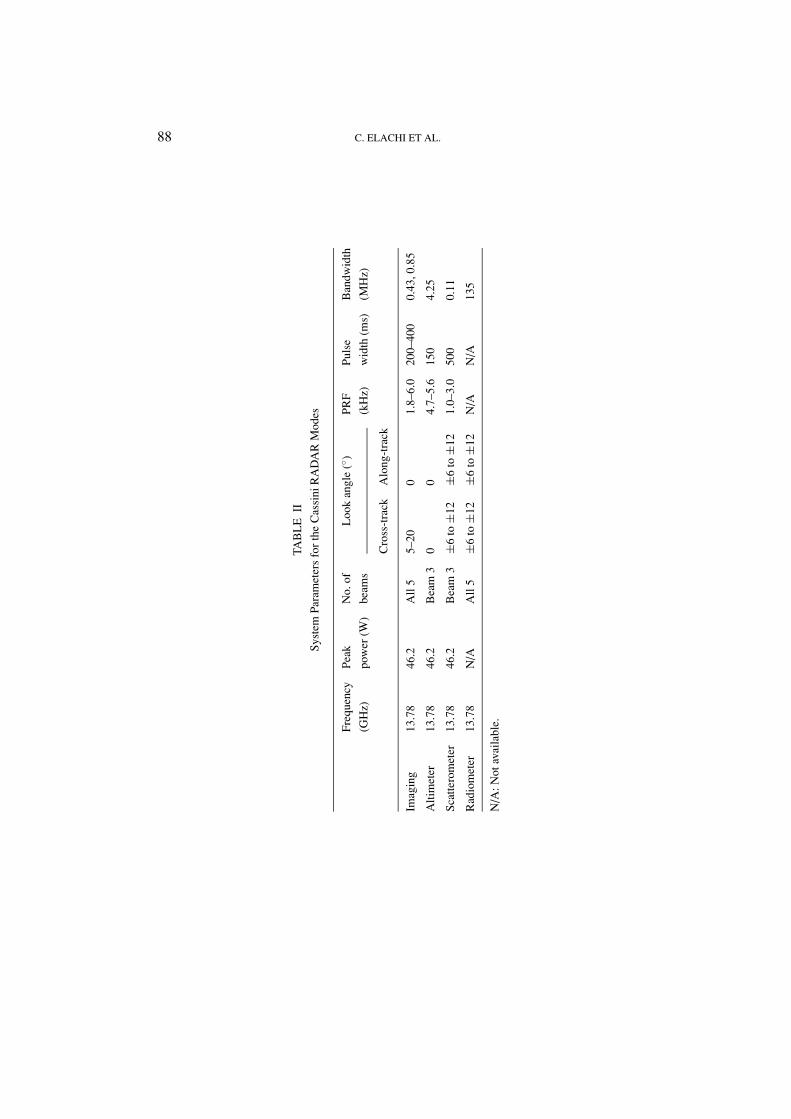
The motivation for the RADAR modes design is the desire to accommodate thepotentially different types of surfaces on Titan (or other targets). Given the uncer-tainties in the ephemeris and in Titan’s radar properties, the RADAR system per-formance must be robust. Since the radar range will be constantly varying withina single flyby as well as from flyby to flyby, the radar parameters such as pulsewidth, bandwidth, receiver gain, pulse repetition frequency, and other timing mustbe updated at regular intervals in order to maintain sufficient signal-to-noise ratioon the radar echoes. The major system parameters for each of the four instrumentmodes are listed in Table II.
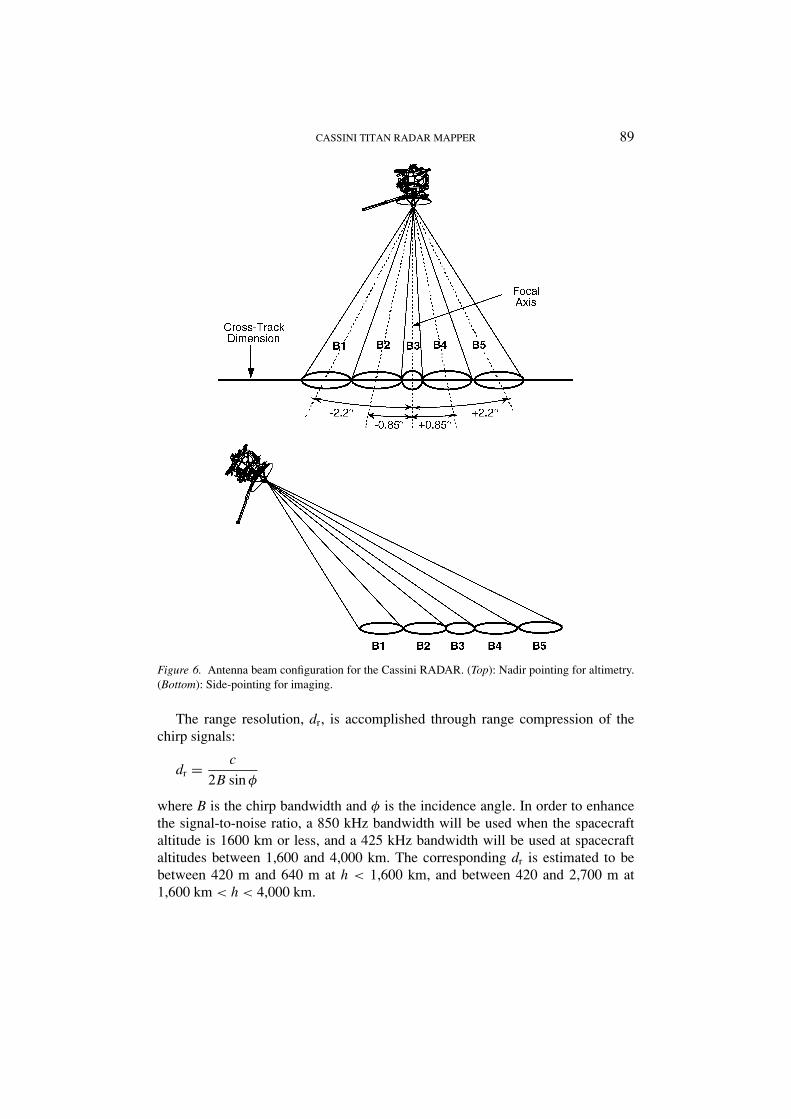
4.1.1. Imaging modeDuring radar imaging, the spacecraft will roll to either the left- or right-sideof the suborbital track according to the pre-determined sequence, and five an-tenna beams will be utilized, one at a time, to obtain the maximum possiblecross-track swath coverage (Figure 6). The azimuth image resolution will beaccomplished by unfocussed SAR processing of the echo bursts. With the de-signed burst timing and processing schemes, the azimuth resolution, daz, can beexpressed as
daz = !R2LSAR
= !R2
1TB
1vsc sin %
= !R2
c2R
1vsc sin %
= !c4vsc sin %
where ! is the radar wavelength, R the range, LSAR the unfocussed SAR aperture,TB the echo burst period, c the pulse propagation speed, vsc the spacecraft velocity,% is the radar azimuth pitch angle, and vsc sin % is the spacecraft velocity componentperpendicular to the radar line of sight (Im et al., 1993). The azimuth resolutionis estimated to be between 350 and 720 m throughout the imaging period of eachflyby.
88 C. ELACHI ET AL.
TAB
LE
IISy
stem
Para
met
ers
fort
heC
assi
niR
AD
AR
Mod
es
Freq
uenc
yPe
akN
o.of
Loo
kan
gle
($)
PRF
Puls
eB
andw
idth
(GH
z)po
wer
(W)
beam
s(k
Hz)
wid
th(m
s)(M
Hz)
Cro
ss-t
rack
Alo
ng-t
rack
Imag
ing
13.7
846
.2A
ll5
5–20
01.
8–6.
020
0–40
00.
43,0
.85
Alti
met
er13
.78
46.2
Bea
m3
00
4.7–
5.6
150
4.25
Scat
tero
met
er13
.78
46.2
Bea
m3
±6
to±
12±
6to
±12
1.0–
3.0
500
0.11
Rad
iom
eter
13.7
8N
/AA
ll5
±6
to±
12±
6to
±12
N/A
N/A
135
N/A
:Not
avai
labl
e.
CASSINI TITAN RADAR MAPPER 89
Figure 6. Antenna beam configuration for the Cassini RADAR. (Top): Nadir pointing for altimetry.(Bottom): Side-pointing for imaging.
The range resolution, dr, is accomplished through range compression of thechirp signals:
dr = c2B sin &
where B is the chirp bandwidth and & is the incidence angle. In order to enhancethe signal-to-noise ratio, a 850 kHz bandwidth will be used when the spacecraftaltitude is 1600 km or less, and a 425 kHz bandwidth will be used at spacecraftaltitudes between 1,600 and 4,000 km. The corresponding dr is estimated to bebetween 420 m and 640 m at h < 1,600 km, and between 420 and 2,700 m at1,600 km < h < 4,000 km.

90 C. ELACHI ET AL.
Figure 7. The " 0 noise equivalent (NE" 0) of the RADAR images during a nominal Titan flyby, withh = 4,000 km at t = ±16 min.
Due to the imperfect knowledge of the surface backscatter characteristics ofTitan, we choose to use the so-called noise-equivalent backscattering coefficient,NE "0, as a measure of the signal detection sensitivity. This quantity is defined asthe normalized surface cross-section which gives rise to a unity single-look thermalsignal-to-noise ratio. That is,
NE"0 = 2(4' )3kT B R3l2atm sin &
PT G2!2ract
where k is the Boltzmann’s constant, T the system noise temperature, l2atm the round-
trip atmospheric loss, PT the radiated peak power, G the antenna gain, ra the 3 dBalong-track beamwidth, and t the pulse duration. Figure 7 shows NE" 0 as a functionof the flyby time for a typical Titan flyby with spacecraft altitude at the closestapproach, h0, equals 1,000 km. Due to the continuous change in both the rangeand Doppler contours as well as the irregular isogain contour of the offset antennabeams, the image ambiguity varies substantially throughout a Titan flyby. The totalsignal-to-ambiguity ratio is estimated to be &15 dB for all images obtained by theCassini RADAR (Hensley and Im, 1993).
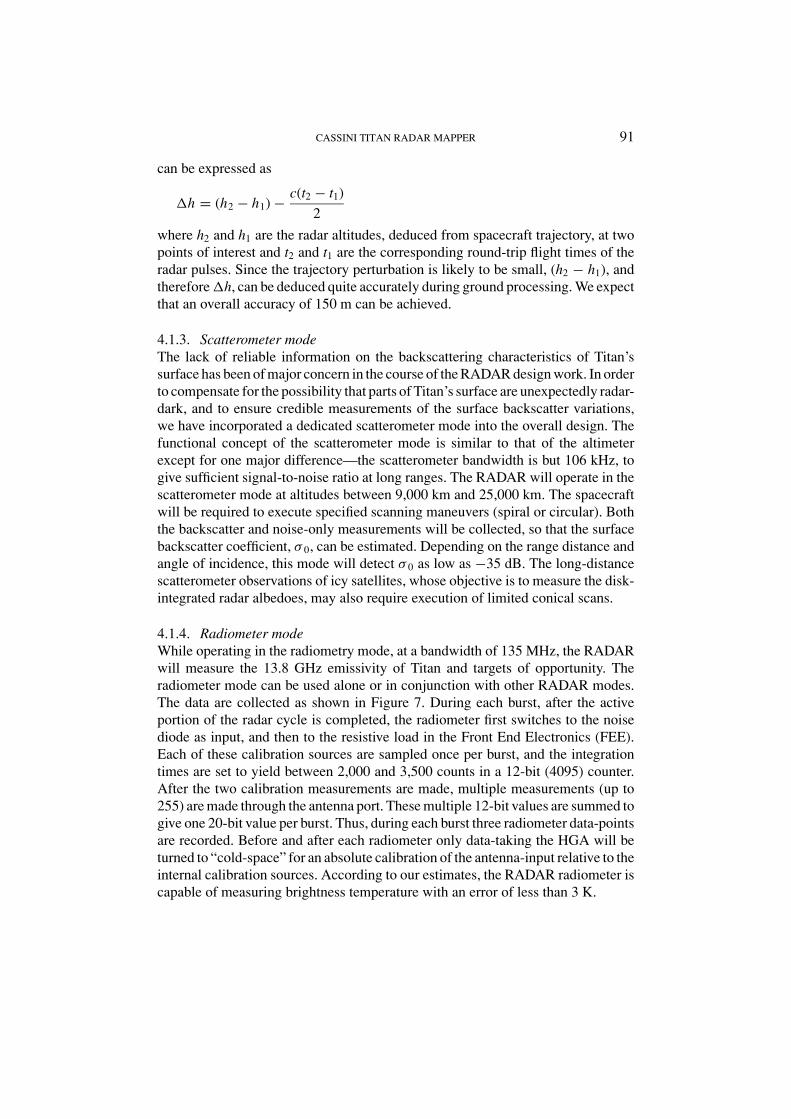
4.1.2. Altimeter modeThis mode will be used to generate relative elevations profile along the Cassinispacecraft sub-orbital track. Operating at spacecraft altitudes between 4,000 km and9,000 km, this mode will utilize the nadir-pointing central antenna beam (Beam3) for transmission and reception of chirp pulse signals at a system bandwidthof 4.25 MHz. The altimetric measurements along the sub-nadir ground track areexpected to have horizontal resolution (pulse-limited radar footprints) ranging be-tween 24 and 27 km and vertical resolution of about 50 m. The relative heightchange, (h, over a surface region illuminated by two successive radar footprints
CASSINI TITAN RADAR MAPPER 91
can be expressed as
(h = (h2 " h1) " c(t2 " t1)2
where h2 and h1 are the radar altitudes, deduced from spacecraft trajectory, at twopoints of interest and t2 and t1 are the corresponding round-trip flight times of theradar pulses. Since the trajectory perturbation is likely to be small, (h2 " h1), andtherefore (h, can be deduced quite accurately during ground processing. We expectthat an overall accuracy of 150 m can be achieved.
4.1.3. Scatterometer modeThe lack of reliable information on the backscattering characteristics of Titan’ssurface has been of major concern in the course of the RADAR design work. In orderto compensate for the possibility that parts of Titan’s surface are unexpectedly radar-dark, and to ensure credible measurements of the surface backscatter variations,we have incorporated a dedicated scatterometer mode into the overall design. Thefunctional concept of the scatterometer mode is similar to that of the altimeterexcept for one major difference—the scatterometer bandwidth is but 106 kHz, togive sufficient signal-to-noise ratio at long ranges. The RADAR will operate in thescatterometer mode at altitudes between 9,000 km and 25,000 km. The spacecraftwill be required to execute specified scanning maneuvers (spiral or circular). Boththe backscatter and noise-only measurements will be collected, so that the surfacebackscatter coefficient, " 0, can be estimated. Depending on the range distance andangle of incidence, this mode will detect " 0 as low as "35 dB. The long-distancescatterometer observations of icy satellites, whose objective is to measure the disk-integrated radar albedoes, may also require execution of limited conical scans.
4.1.4. Radiometer modeWhile operating in the radiometry mode, at a bandwidth of 135 MHz, the RADARwill measure the 13.8 GHz emissivity of Titan and targets of opportunity. Theradiometer mode can be used alone or in conjunction with other RADAR modes.The data are collected as shown in Figure 7. During each burst, after the activeportion of the radar cycle is completed, the radiometer first switches to the noisediode as input, and then to the resistive load in the Front End Electronics (FEE).Each of these calibration sources are sampled once per burst, and the integrationtimes are set to yield between 2,000 and 3,500 counts in a 12-bit (4095) counter.After the two calibration measurements are made, multiple measurements (up to255) are made through the antenna port. These multiple 12-bit values are summed togive one 20-bit value per burst. Thus, during each burst three radiometer data-pointsare recorded. Before and after each radiometer only data-taking the HGA will beturned to “cold-space” for an absolute calibration of the antenna-input relative to theinternal calibration sources. According to our estimates, the RADAR radiometer iscapable of measuring brightness temperature with an error of less than 3 K.
92 C. ELACHI ET AL.
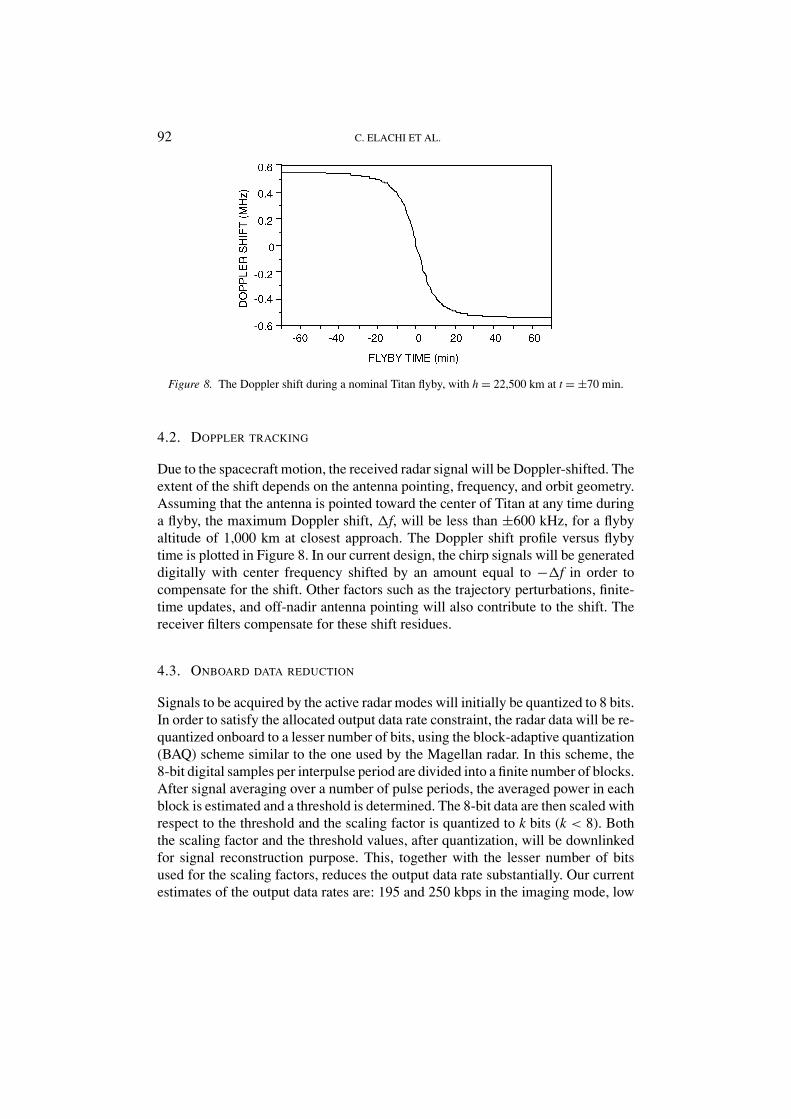
Figure 8. The Doppler shift during a nominal Titan flyby, with h = 22,500 km at t = ±70 min.
4.2. DOPPLER TRACKING
Due to the spacecraft motion, the received radar signal will be Doppler-shifted. Theextent of the shift depends on the antenna pointing, frequency, and orbit geometry.Assuming that the antenna is pointed toward the center of Titan at any time duringa flyby, the maximum Doppler shift, (f, will be less than ±600 kHz, for a flybyaltitude of 1,000 km at closest approach. The Doppler shift profile versus flybytime is plotted in Figure 8. In our current design, the chirp signals will be generateddigitally with center frequency shifted by an amount equal to "(f in order tocompensate for the shift. Other factors such as the trajectory perturbations, finite-time updates, and off-nadir antenna pointing will also contribute to the shift. Thereceiver filters compensate for these shift residues.
4.3. ONBOARD DATA REDUCTION
Signals to be acquired by the active radar modes will initially be quantized to 8 bits.In order to satisfy the allocated output data rate constraint, the radar data will be re-quantized onboard to a lesser number of bits, using the block-adaptive quantization(BAQ) scheme similar to the one used by the Magellan radar. In this scheme, the8-bit digital samples per interpulse period are divided into a finite number of blocks.After signal averaging over a number of pulse periods, the averaged power in eachblock is estimated and a threshold is determined. The 8-bit data are then scaled withrespect to the threshold and the scaling factor is quantized to k bits (k < 8). Boththe scaling factor and the threshold values, after quantization, will be downlinkedfor signal reconstruction purpose. This, together with the lesser number of bitsused for the scaling factors, reduces the output data rate substantially. Our currentestimates of the output data rates are: 195 and 250 kbps in the imaging mode, low

CASSINI TITAN RADAR MAPPER 93
and high resolution, respectively, (8-to-2 reduction), 30 kbps in the altimeter andscatterometer modes (8-to-4 reduction). We use a larger number of bits for altimetryand scatterometry due to the fact that in these modes less data are averaged and theinitial data rates are lower.
4.4. CONTROL INSTRUCTIONS
The timing, gain, antenna port selection, and other setup parameters of the RADARare controlled through a set of instructions which are calculated on the ground anduplinked to the spacecraft prior to a flyby. After the RADAR is turned on andthe FSW loaded and started, the Instruction Execution Block (IEB) is loaded andtriggered. The block contains all the instructions the FSW will execute during aflyby. There are three types of instructions: Power—to control the power states of theRADAR; Telemetry & Command—to set up special modes, including diagnosticinstructions; and Slow and Fast instructions. The last two are combined into onesetup instruction for the RADAR configuration. The reason for the fast and slowtypes was to reduce the number of instructions necessary to uplink by recognizingthat some parameters vary faster than others.
Tables III and IV present a list of the slow and fast instructions and theirmeaning. A much more detailed description of each parameter is in the CassiniRADAR Digital Subsystem High Level Design Document (DSS-HLD). Dur-ing a typical flyby it is expected that each Fast Field will change as often asevery 15 s while each Slow Field will change as often as every 3 min. Theexecution time for each instruction is controlled by the flight software, using the rel-ative time from the initial trigger (TFI) of the RADAR. The combined instruction issent to the Control and Timing Unit (CTU) for its actual control of the RADAR. TheTRIGGER command is the last command the RADAR, received from the space-craft Command and Data System (CDS) prior to RADAR operations and from thatpoint on, until the RADAR is turned off, the RADAR operates autonomously.
4.5. INSTRUMENT DATA MODES
The RADAR sends data to the spacecraft CDS for storage on the Solid StateRecorder (SSR) through two channels. The first, low-rate (10–20 bps), channel iscalled “Housekeeping” and is used whenever the RADAR is on. The Housekeepingchannel carries engineering data only. It becomes active approximately 80 s af-ter the DSS is turned on and continues until the DSS is turned off. During nor-mal operations a complete sample of RADAR engineering data is received every2–4 min. The second channel is the High Rate Science channel with data ratesas high as 365 kbps. All RADAR science data, including the engineering datain the science headers, are sent through this channel. The spacecraft CDS picksup packets from the RADAR at the maximum rate of 365 kbps but only stores
94 C. ELACHI ET AL.
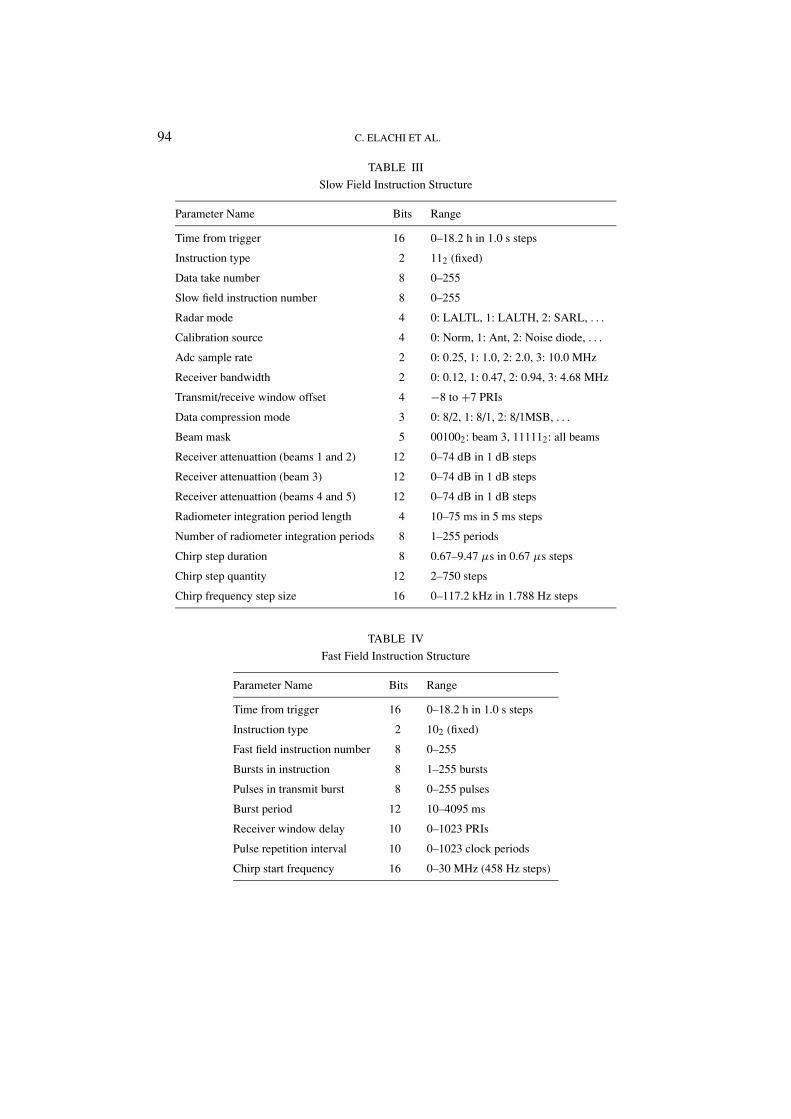
TABLE IIISlow Field Instruction Structure
Parameter Name Bits Range
Time from trigger 16 0–18.2 h in 1.0 s steps
Instruction type 2 112 (fixed)
Data take number 8 0–255
Slow field instruction number 8 0–255
Radar mode 4 0: LALTL, 1: LALTH, 2: SARL, . . .
Calibration source 4 0: Norm, 1: Ant, 2: Noise diode, . . .
Adc sample rate 2 0: 0.25, 1: 1.0, 2: 2.0, 3: 10.0 MHz
Receiver bandwidth 2 0: 0.12, 1: 0.47, 2: 0.94, 3: 4.68 MHz
Transmit/receive window offset 4 "8 to +7 PRIs
Data compression mode 3 0: 8/2, 1: 8/1, 2: 8/1MSB, . . .
Beam mask 5 001002: beam 3, 111112: all beams
Receiver attenuattion (beams 1 and 2) 12 0–74 dB in 1 dB steps
Receiver attenuattion (beam 3) 12 0–74 dB in 1 dB steps
Receiver attenuattion (beams 4 and 5) 12 0–74 dB in 1 dB steps
Radiometer integration period length 4 10–75 ms in 5 ms steps
Number of radiometer integration periods 8 1–255 periods
Chirp step duration 8 0.67–9.47 µs in 0.67 µs steps
Chirp step quantity 12 2–750 steps
Chirp frequency step size 16 0–117.2 kHz in 1.788 Hz steps
TABLE IVFast Field Instruction Structure
Parameter Name Bits Range
Time from trigger 16 0–18.2 h in 1.0 s steps
Instruction type 2 102 (fixed)
Fast field instruction number 8 0–255
Bursts in instruction 8 1–255 bursts
Pulses in transmit burst 8 0–255 pulses
Burst period 12 10–4095 ms
Receiver window delay 10 0–1023 PRIs
Pulse repetition interval 10 0–1023 clock periods
Chirp start frequency 16 0–30 MHz (458 Hz steps)
CASSINI TITAN RADAR MAPPER 95
those packets that have real data included. The other packets are identified as“0-filled” by the RADAR and are discarded. The valid data are produced by theRADAR at variable rates; typically 1 kbps for radiometer only, 30 kbps for scat-terometer and altimeter, and up to 260 kbps for imaging. It is up to the RADARto insure that the total volume of data allocated to the RADAR is not exceededduring the RADAR data collection time. The total volume of data the RADARwould produce in the course of a nominal Titan flyby (i.e. a 1,000 km flyby) isabout 1 GB.
During the cruise period, when only a simple preventive maintenance test isperformed every three months, the only data-type available is housekeeping. Normaloperations of the RADAR will be executed during infrequent special checkoutperiods.
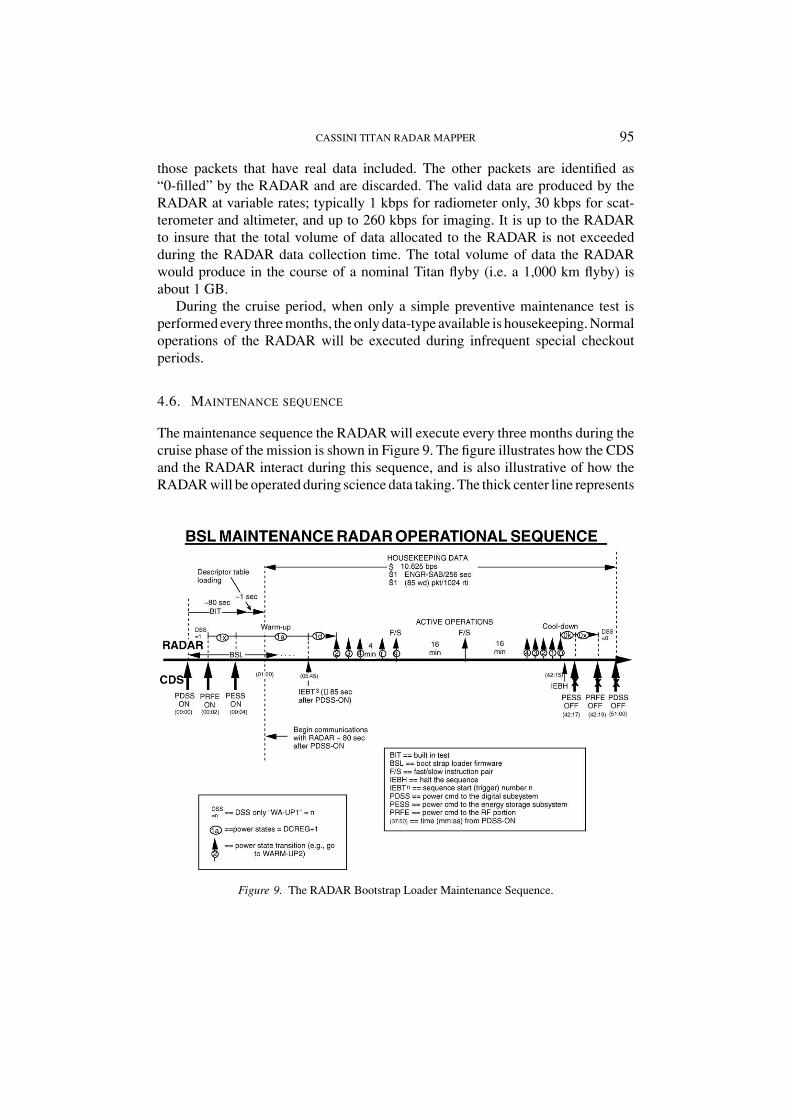
4.6. MAINTENANCE SEQUENCE
The maintenance sequence the RADAR will execute every three months during thecruise phase of the mission is shown in Figure 9. The figure illustrates how the CDSand the RADAR interact during this sequence, and is also illustrative of how theRADAR will be operated during science data taking. The thick center line represents
Figure 9. The RADAR Bootstrap Loader Maintenance Sequence.
96 C. ELACHI ET AL.
a timeline interface between the RADAR and the CDS; the CDS actions are belowthe line, the RADAR actions above. The times after the DSS turn-on are shown witheach command from the CDS. The three RADAR power switches are quickly turnedon to start the RADAR. The RADAR DSS goes through an initialization procedureduring which a sequence of built-in tests is run. After these tests are completed theRADAR loads a descriptor table into the CDS/RADAR interface, and communica-tion with the RADAR can begin. It is at this point that the housekeeping data startto be sent to the CDS. As the maintenance sequence runs from PROM (the Boot-strap Loader), no flight software or an IEB table are necessary to be loaded prior tooperations.
The RADAR comes up in a power state called Warmup-1. This power statehas several substates, depending on which commands have been sent by the CDS.As soon as the RADAR receives a trigger, the PROM sequence of instructionsbegins to run. These are illustrated by the short up-arrows above the time line. Thenumbers embedded in these arrows indicate a transition instruction to that powerstate. These power states are for the RFES portion of the RADAR. The transitionto the Warmup-4 includes a 4 min wait to allow for time to warm up the TravelingWave Tube Amplifier (TWTA). The last power instruction puts the DSS in thestate to sequence the RFES. The first fast/slow (F/S) instruction then commandsthe transmitter to commence transmitting.
In the maintenance sequence there are only two fast/slow field pairs whichoperate for 16 min each. The RADAR transmits and receives, but no science dataare collected. After the end of the second 16 min period the power instructionsreverse the order to put the RADAR in Warmup-0 mode, and make it ready forthe power to be disconnected by the CDS commands to the power subsystem ofthe spacecraft. The housekeeping data transmission ends when the DSS is turnedoff but, in reality, the last housekeeping packet received represents the state of theRADAR several minutes before shutoff.
5. RADAR Design Considerations
The Cassini/Huygens mission is a joint undertaking of the National Aeronau-tics and Space Administration (NASA), European Space Agency (ESA), and theItalian Space Agency (ASI). The RADAR instrument was developed in partnershipbetween NASA and ASI. ASI selected Alenia Aerospazio in Rome as the con-tractor for both the spacecraft High Gain Antenna (HGA) and the RADAR RadioFrequency Electronics Subsystem (RFES). Alenia in turn selected subcontractorssuch as FIAR in Milan and EMS in Atlanta, Georgia, for the component units ofthe RFES. The overall responsibility for the RADAR system design and space-craft interfaces rested with the Jet Propulsion Laboratory (JPL). The complexity ofthe instrument called for a number of special design considerations. We treat herethe following: power, mass, space and location, antenna, pointing and ephemeris
CASSINI TITAN RADAR MAPPER 97
accuracies, target-flyby geometries, instrument control method, data rates andvolumes, and the limited number of Titan flybys.
5.1. POWER
The Cassini spacecraft power system uses radioactive thermal generators (RTGs)for all its electrical power and no batteries for power buffering. The RADAR hashigh (195 W) peak power requirements which could not be accommodated bythe spacecraft power system. Early design of the instrument included an internalbattery which would provide most of the transmitter energy requirements duringa 10 h Titan flyby. Both battery size and long life considerations led to a bat-tery substitute, called the Energy Storage Subsystem (ESS), which is a bank ofcapacitors. The design of the ESS called for energy to be stored for a “transmitburst,” 90–3,000 ms. The transmit portion of the burst lasts no more than about10% of the total burst time, thus, the 90% non-transmit time is used to rechargethe capacitor bank of the ESS. The peak transmitter power requirement was thusreduced from 195 to 30 W by use of the ESS. The RADAR power requirement is86 W.
5.2. MASS
As in all planetary missions, mass has been a severe constraint on the RADARdesign. Conservative design for an 11-year mission and radiation environmentsnear 100 krad dictated the use of low-density components. This resulted in the totalmass of 43.3 kg for the RADAR instrument.
5.3. SPACE AND LOCATION
The spacecraft was designed to have 12 electronic bays. The RADAR occupiesBay 11 and a specially constructed appendage to the main body of the spacecraft,the “penthouse” (Figure 10). The use of the penthouse required a thermal interfacethrough a baseplate to the spacecraft; it further required additional thermal blankets,louvers, and radioactive heating units (RHUs) to control the thermal environmentof the RFES. The DSS and ESS, located in Bay 11, share the thermal design of thespacecraft bays.
5.4. ANTENNA
Tight constraints on mass and volume required that the RADAR share the 4 mtelecommunications antenna (HGA), as did the radar on the Magellan mission. Thesystem design also dictated that a single feed or beam could not meet the per-flybyrequirements of imaging and other modes simultaneously. A five-feed, five-beamdesign was decided upon, in which the center, highest-gain beam would be used in

98 C. ELACHI ET AL.
Figure 10. The locations on the spacecraft of the RADAR RFES (Penthouse) and DSS/ESS(Bay 11).

CASSINI TITAN RADAR MAPPER 99
Figure 11. Cassini RADAR block diagram.
all modes. The additional four beams would be used in the imaging mode, creatinga wide swath. Beam switching would be done inside the RADAR. The five-beamdesign required five waveguides into the HGA, each with a separate feed. Othermethods of beam scanning were considered, such as the phased-array feeds, butwere rejected. The five feeds were accommodated into the four-frequency HGA(Figure 11). The switching of the beams is accomplished in the RFES by the FrontEnd Electronics, which is a compact set of twisted waveguides and circulators. Nomoving parts were used.
5.5. POINTING AND EPHEMERIS
In order to automatically record the echo data the RADAR needs to have availableaccurately predicted ranges to the targets of interest. This is achieved by knowing atany instant the spacecraft position relative to the target and the HGA pointing. Sincethe Cassini spacecraft is in orbit around Saturn, and Titan is the target of interest,the accuracy of the ephemeris is expected to be insufficient by Earth-observing orMagellan radar standards. The same is true for pointing, which is done relative toa star field or a fuzzy limb rather than the center of Titan, and is thus degradedfor radar use. These inaccuracies demanded a design in which the radar echoesare not interleaved with transmissions, as would be required for high-resolutionimaging. Thus, the radar transmits for a set number of pulses and pulse rate until
100 C. ELACHI ET AL.
the prediction indicates the first echo will have returned, and then the receiver isactivated and all echoes received.
5.6. FLYBY GEOMETRY
As described in Section 4.6, the timing of the radar must be set properly to receivethe echo. It is also necessary that the frequency of the echo be within the range ofthe receiver. If the target is moving with respect to the transmitter or the receiver, theecho is Doppler-frequency shifted proportional to the velocity and radar frequency.Normally this shift is only a small fraction of the bandwidth and can be neglected.For the Cassini RADAR, the bandwidth is as low as 0.1 MHz and the Doppler shiftas high as ±0.6 MHz. It is a requirement on the design to take into account thiseffect.
5.7. CONTROL METHOD
The control of the radar can be performed by several means including remotely,based upon predictions, and automatically, based upon actual data. The radar echoesand radiometric settings, it was felt, would be too difficult for an automatic systemto set up and hold to all the system constraints, especially that of the total datavolume. A computer was available on the project list, called the Engineering FlightComputer (EFC), which had most of the capability required for radar operations. Itwas decided that the radar parameters would be table-driven from a time-orderedset of parameters, which would control all the radar parameters such as gain, an-tenna port, pulsewidth, and bandwidth. Each entry in the table is calculated byground software, called the Radar Mapping Sequencing Software (RMSS), whichtakes inputs such as science desires spacecraft pointing, ephemeris, and data rate.The RMSS outputs the Instruction Execution Block (IEB) table. Each RADARobservation (a Titan flyby, an icy-satellite flyby, etc.) has a unique table which istransmitted to the spacecraft as part of the regular uplink process prior to a flyby.
Another aspect of RADAR control is the program, which runs in EFC. Thisprogram is called the Cassini RADAR Operational Control Flight Software(CROCFSW), or Flight Software (FSW) for short. The FSW, to be described later inthis paper, is a major contributor to the functionality and testability of the RADARhardware.
5.8. DATA RATES AND VOLUMES
In addition to mass and power, the data rates and volumes are the most limitingresources planetary missions impose. During each RADAR flyby of Titan about1 Gbit will be recorded on the spacecraft’s Solid State Recorder (SSR) for later play-back. These data include all spacecraft packet formats, radar formats, engineering
CASSINI TITAN RADAR MAPPER 101
telemetry, and science data. The science portion will be approximately 90% of thetotal. In order to pack as much information as possible into these bits the echodata are compressed using a method pioneered on the Magellan mission called theBlock Adaptive Quantizer (BAQ) (Kwok and Johnson, 1989). On Magellan, themethod used was 8-bits-in/2-bits-out (8/2), in a fixed hardware design. In the caseof the Cassini RADAR the hardware method was dropped and a software methodadded to the system. Since the BAQ was implemented in software, it has much moreflexibility than the Magellan hardware method; in fact, other modes are availablesuch as 8/4, 8/1, and 8/0. The 8/4 mode will be used for altimetry and scatterometry,the 8/1 mode could be used for imaging in order to sacrifice amplitude resolutionin return for finer spatial resolution, and the 8/0 mode (which produces no data) isused for test purposes.
5.9. LIMITED NUMBER OF FLYBYS
The RADAR lacks opportunity to acquire processable echoes prior to its first data-collecting flyby of Titan, likely to take place in 2005. Radar-operational flybys ofVenus and Earth would allow the first closed-loop test of the RADAR system. Ashelpful as these tests could be, they would still simulate operations at targets vastlydifferent from Titan. The review in Section 1 showed how little we know aboutthe surface characteristics of Titan. We know even less about the performance ofthe RADAR radiometer and about the thermal effect of a 10 h RADAR flyby ofTitan on the performance of the spacecraft systems. During the Science Cruise(i.e. in the period of 2 years prior to the Saturn Orbit Insertion), we expect torun extensive “dress rehearsal” tests to simulate full Titan flybys. During a Titanflyby the HGA is pointed at Titan, and no data are received at Earth. Thus, there isno opportunity to correct problems during the data collection, and if there indeedare problems, the RADAR flyby will, most likely, be sacrificed and the correctionwill have to wait until the next downlink/uplink cycle is completed. To make thisprocess efficient, the RADAR has been designed to be as autonomous as possibleand monitor and report all aspects of its operation while collecting the sciencedata.
Prior to each flyby the RADAR is powered up, at which time it performs aseries of built-in tests (BITs). The results of the BITs are reported in the low-rate housekeeping data. Next, the FSW is loaded, followed by the IEB tableand by the trigger to start. If any of these processes does not go to comple-tion the RADAR cannot report that fact to the spacecraft and the science-dataflyby will be lost. If a problem occurs after the trigger, the FSW should recog-nize that fact and recovery might be possible, depending upon the nature of theproblem.
In addition to potential hardware (or software) faults the data themselves can beexamined by the FSW to determine if the settings of the radar system parametersare correct. The three areas which were examined for automatic control (onboard

102 C. ELACHI ET AL.
processing) were the timing of the receive window position, receiver gain, andradiometer integration period. It was felt that it would be difficult to set the timingcorrectly in an automatic system in all cases and that the pointing and ephemeriswould be good enough for data capture so automatic timing control was rejected.Receive gain control was examined and determined to be a candidate for automaticcontrol. Consequently, automatic gain (really attenuation) was implemented as wellas automatic radiometer integration-time setting. Each of these software modulesreads the input science data and determines a change in the setting, which will bringthe level closer to the ideal.
6. Hardware Design
The Cassini RADAR consists of four subsystems: the Digital Subsystem (DSS), Ra-dio Frequency Electronics Subsystem (RFES), Energy Storage Subsystem (ESS),and High Gain Antenna (HGA) (Figure 11). The DSS, built at JPL, contains theinterfaces to the spacecraft data bus, the control electronics for all the radar, theanalog-to-digital converters for both science data and engineering telemetry, andthe flight software for all RADAR operations. These operations include data as-sembly and data processing such as gain adjustment and data compression. TheRFES, built by Alenia Aerospazio, contains all the analog RF components of theRADAR as well as the digital chirp generator (DCG) and the Ultra-Stable Oscil-lator (USO)—the timing reference for the whole RADAR. The RFES responds todigital signals from the DSS, to set its operating parameters. The ESS, built at JPL,is a battery substitute for the transmitter of the RFES. The HGA, built by AleniaAerospazio, has four frequency bands (S, X, Ku, and Ka) to provide services forradar science (Ku-band) and radio science and telecommunications operations (theremaining bands).
6.1. DIGITAL SUBSYSTEM
The Digital Subsystem performs all the digital functions of the RADAR, which in-clude accepting commands from the spacecraft Command and Data System (CDS),executing the flight software, operating the entire system as specified in the uplinkedinstruction table, collecting and processing science data, and collecting engineer-ing telemetry data. The DSS is located in a portion of Bay 11, one of the 12 bays,which make up the spacecraft instrument bus. The DSS is made up of five circuitchassis which contain the following: the Flight Computer Unit (FCU), the ScienceAnalog-to-Digital Converter (SADC), the Telemetry Analog-to-Digital Converter(TADC), the Science Data Buffer (SDB), the Control and Timing Unit (CTU), thePower Converter Unit (PCU), and the RFES interfaces. The functions of each ofthese units are explained below.
CASSINI TITAN RADAR MAPPER 103
6.1.1. Flight computer unitThe Flight Computer Unit is made up of the project-supplied Engineering FlightComputer (EFC), the Bus Interface Unit (BIU), and Startup Read Only Memory(SUROM). The function of the FCU is to accept and interpret commands from thespacecraft CDS. The commands include the RADAR flight software and the tablethat contains the time-ordered set of instructions to operate the RADAR. The FCUcontrols both science and engineering telemetry data flow, compresses the sciencedata using a software algorithm known as the Block Adaptive Quantizer (BAQ),and formats the data into RADAR units known as SAR-Altimeter Bursts (SAB)and then into the smaller CDS transport packets.
6.1.2. Science analog-to-digital converterThe Science Analog-to-Digital Converter (SADC) is known as the “Science ADC”to distinguish it from the ADCs for the telemetry subsystem and the radiometer.The Science ADC consists of three parts: an input buffer amplifier, the high-speedADC, and the digital code conversion circuitry and output buffers. The input bufferamplifier receives the video signal from the receiver, amplifies it, and level-shifts it toa value that is compatible with input voltage range of the ADC. The digital circuitryreceives and transmits all control and timing signals required by the Science ADCSubsystem.
6.1.3. Telemetry analog-to-digital converterThe purpose of the Telemetry ADC Subsystem (TADC) is to provide the Engi-neering Flight Computer (EFC) with up-to-the-second data on the performance ofthe Cassini RADAR System. The TADC samples analog voltages from DSS, ESS,RFES, and external waveguides, converting them into digitized equivalents withan analog-to-digital converter, and then it transfers those digitized data into RAMmemory. The TADC also accepts the radiometer DC signals from the RFES andprocesses them for inclusion in the SAB footer.
6.1.4. Science data bufferThe Science Data Buffer (SDB) is a 16K-word, high-speed RAM buffer that acts asa rate buffer for science data from the high-speed A/D converter (SADC) enrouteto the FCU. The SDB appears in the address space of the FCU as a 16K-word (one“word” equals two bytes) block. During the receive-window of a burst, the SDB isfilled with raw, 8-bit, time-domain samples (packed two samples per word) fromthe SADC. When the receive-window closes, the FSW transfers the burst of datafrom the SDB into the local memory of the FCU.
6.1.5. Control and timing unitThe Control and Timing Unit (CTU) sets all the timing functions of the RADAR. Itaccepts a formatted instruction from the software running in the FCU and stores itin a register until the previous instruction runs out. The CTU sets all the high-speed

104 C. ELACHI ET AL.
logic in the RADAR such as when to transmit, when to receive, or when to movedata to the RFES. The CTU runs off a 10 MHz clock that is derived from the30 MHz Ultra-Stable Oscillator (USO) in the RFES.
6.1.6. Power converter unitThe Power Converter Unit (PCU) takes the 30 VDC power from the spacecraftpower bus and converts it to the various voltages used in the DSS: ±5 VDC,±9 VDC, "12 VDC, and ±15 VDC. The power into the PCU comes from the space-craft via a solid-state power switch, one of the three used to control the RADAR.
6.1.7. RFES interfacesThe electrical interfaces to the Radio Frequency Electronics Subsystem (RFES) areall with the DSS, except for the power interfaces to the spacecraft and to the RADAREnergy Storage Subsystem (ESS) and the RF interface with the HGA. There are 22control and timing signals from the DSS-CTU which, among other things, controlthe beam-select and receive-window. In the RFES the signals fan out to the variousunits such as the Front End Electronics for beam-select and Microwave Receiverfor receive-window. A high-speed logic line also controls the waveform generationstart in the Digital Chirp Generator. The DSS accepts analog inputs from the RFESsuch as the downconverted waveform going to the SADC, and the radiometer andengineering telemetry voltages going to the TADC.
6.2. RADIO FREQUENCY ELECTRONICS SUBSYSTEM
The Radio Frequency Electronics Subsystem (RFES) is that portion of the RADARthat converts the chirp waveform data from the DSS into high-powered pulsedwaveforms which, in turn, are sent to the proper antenna port. The echoes arereceived through the same port and captured by the sensitive receiver. The physicallocation of the RFES is in a “penthouse” located above Bay 11 (which houses theDSS), below the backside of the HGA (see Figure 10). The penthouse is attachedthermally to the spacecraft through a baseplate and has additional thermal controlthrough the use of thermal blankets, a louvered outer cover, and five 3 W, radioactiveheating units (RHU) attached to the outer surface of the RFES. The units whichmake up the RFES are the Frequency Generator (FG) (which contains the Ultra-Stable Oscillator), the Digital Chirp Generator (DCG), the Chirp Upconverter andAmplifier (CUCA), the High-Power Amplifier (HPA), the Front End Electronics(FEE), the Microwave Receiver (MR), and the Power Converter. The operation ofthese units will be explained below.
6.2.1. Frequency generatorThe Frequency Generator Unit (FGU) contains the 30-MHz USO that is placed inan oven controlled to 85 $C. The signals from this unit are sent to three destinations.
CASSINI TITAN RADAR MAPPER 105
First, they are sent to the CUCA, to provide upconversion frequencies for construc-tion of the transmit waveform. Second, they are sent to the MR, to downconvert thereceived signal to baseband. Third, they are sent to the DSS for all digital timingsignals control, including the digitization of the science data.
6.2.2. Digital chirp generatorThe Digital Chirp Generator (DCG) is the device that generates the frequency-modulated signal, the “chirp.” The chirp is the pulse expansion necessary in high-performance radar in order to achieve high average power with relatively low peakpower. The inputs to the DCG come from the DSS; they are the parameters ofa pulsed radar chirp—such as the start frequency, number of frequency steps, fre-quency step length, and frequency step size. The last three parameters control thepulse length and bandwidth, while the first controls the frequency offset due to thehigh Doppler frequencies on this mission.
6.2.3. Chirp upconverter and amplifierThe chirp signal coming from the DCG is at baseband frequency and of low level. Inorder to drive the transmitter, the chirp waveform must be upconverted to 13.8 GHzand amplified. The Chirp Upconverter and Amplifier receive the low-level chirpfrom the DCG. It uses the 30 MHz signal and derivatives to arrive at 13.8 GHz, andthen the signal is amplified to the proper level.
6.2.4. High power amplifierThe amplified chirped signal from the CUCA is further amplified by the HighPowered Amplifier (HPA) to approximately 65 W peak power. The HPA uses atraveling wave tube amplifier (TWTA). This tube operates at high voltages (4,000VDC) in order to get sufficient amplification. The high voltages are generated withinthis unit. The output of the HPA is fed through waveguides to reduce losses.
6.2.5. Front end electronicsThe purpose of the FEE is to route the transmitted signal through one of the fiveoutput waveguides and to switch a few milliseconds later to route the echo to thereceiver. The FEE is a complex set of 13 circulators and waveguides, which allowselection of single beams a large number of times without deterioration of function.The FEE also contains the resistive load calibration for the radiometer and therouting circuit for the injection of the noise diode calibration. The noise diode itselfis located in the MR.
6.2.6. Microwave receiverThe most complex unit in the RFES is the Microwave Receiver. This unit containsthe low-noise amplifiers (LNA), downconverter, amplifiers, bandpass and band-width filters, variable attenuators, and the radiometer detection circuit and noisediode calibration source. Because of its extreme sensitivity, a limiter was added

106 C. ELACHI ET AL.
before the LNA to reduce the possibility of catastrophic failure caused by highsignals entering the MR. The LNA were specially designed and mounted in goldfoil to reduce gain changes that might result from the ground-plane motion. To pro-tect the LNAs during normal operations, pin-diode switches block signals exceptwhen reception is desired. A combination of high-gain amplifiers and attenuators,controlled from the DSS, allow for precise control of the signal levels going to theDSS-SADC.
The radiometer detector circuit operates at the full 135 MHz bandwidth of thereceiver. The circuit contains a special noise diode, an integrator, and a reset circuit.Particular consideration was given to all these components to yield a stable system.The noise diode has undergone special gold foil application for grounding to reducegain jumps. The diode is mounted in a kovar frame, and its signal goes to the FEEwhere it joins the input to the MR.
6.2.7. Power converterThe Power Converter Unit (PCU) supplies all the low-voltage application in theRFES except the ESS-supplied 35 VDC which powers the HPA. A separate space-craft solid-state power switch turns on the RFES.
6.3. ENERGY STORAGE SUBSYSTEM
The Energy Storage Subsystem (ESS) is a battery substitute for the HPA of theRFES, used to reduce the peak-power required by the RADAR during transmis-sion. The ESS does this by boosting the 30 VDC, supplied by the spacecraft, toapproximately 80 VDC for storage in a capacitor bank, and then bucks the 80 VDCto 35 VDC for use by the HPA. The boost to 80 VDC is necessary to more effec-tively store the energy and give some “headroom” so that when the energy is drawnfrom the capacitor bank the voltage stays above the 35 VDC required. The input tothe ESS is limited to 34 W, while the output is approximately 200 W. The RADARtransmits at a <75% duty cycle for 10–50 ms and then waits for approximately10 times this interval, until the next transmission occurs. During this “quiet” timethe voltage in the ESS builds back up. A separate spacecraft solid-state switch turnson the ESS.
6.4. HIGH GAIN ANTENNA
Due to volume and mass constraints, the Cassini RADAR uses the spacecraft’s high-gain, 4 m diameter telecommunications antenna. To extend the imaging coverage,a multiple radar feed structure at 13.8 GHz is mounted on the antenna reflector togenerate five beams. The beams are adjacent to one another in the cross-track di-mension, as is shown in Figure 12. The beam configuration is illustrated in Figure 6.In this figure, the central, circular beam (B3) is generated by illuminating the entire
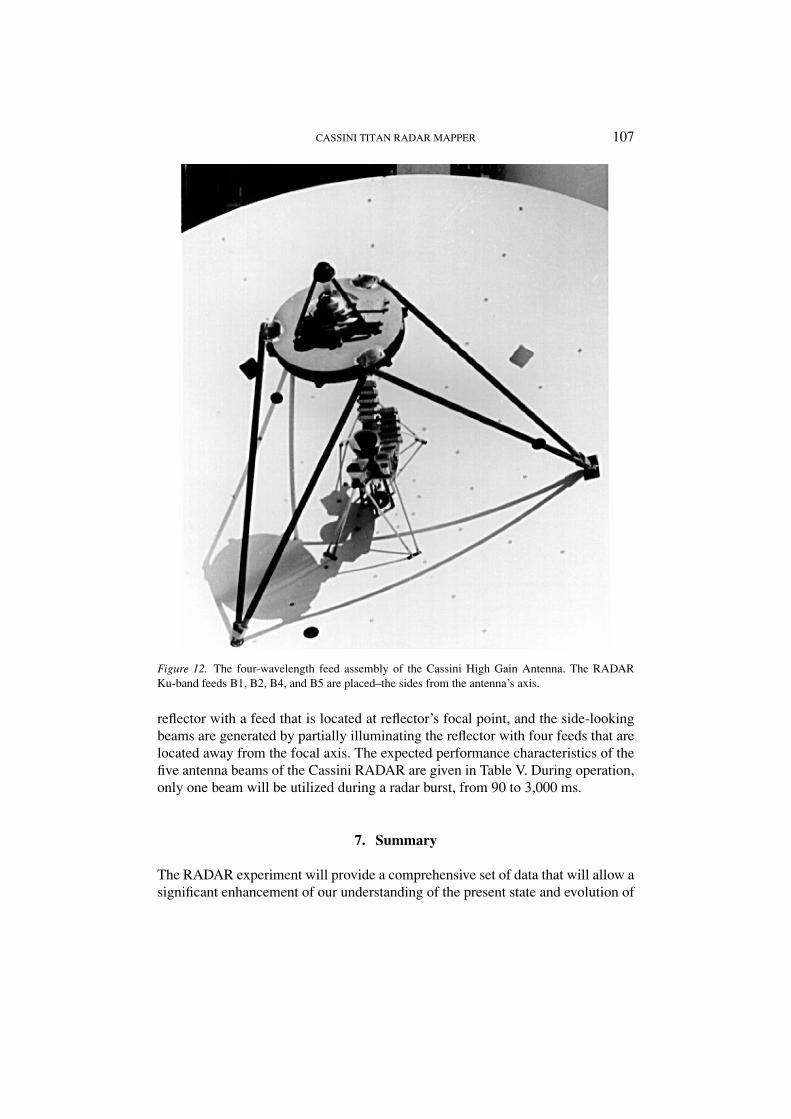
CASSINI TITAN RADAR MAPPER 107
Figure 12. The four-wavelength feed assembly of the Cassini High Gain Antenna. The RADARKu-band feeds B1, B2, B4, and B5 are placed–the sides from the antenna’s axis.
reflector with a feed that is located at reflector’s focal point, and the side-lookingbeams are generated by partially illuminating the reflector with four feeds that arelocated away from the focal axis. The expected performance characteristics of thefive antenna beams of the Cassini RADAR are given in Table V. During operation,only one beam will be utilized during a radar burst, from 90 to 3,000 ms.
7. Summary
The RADAR experiment will provide a comprehensive set of data that will allow asignificant enhancement of our understanding of the present state and evolution of
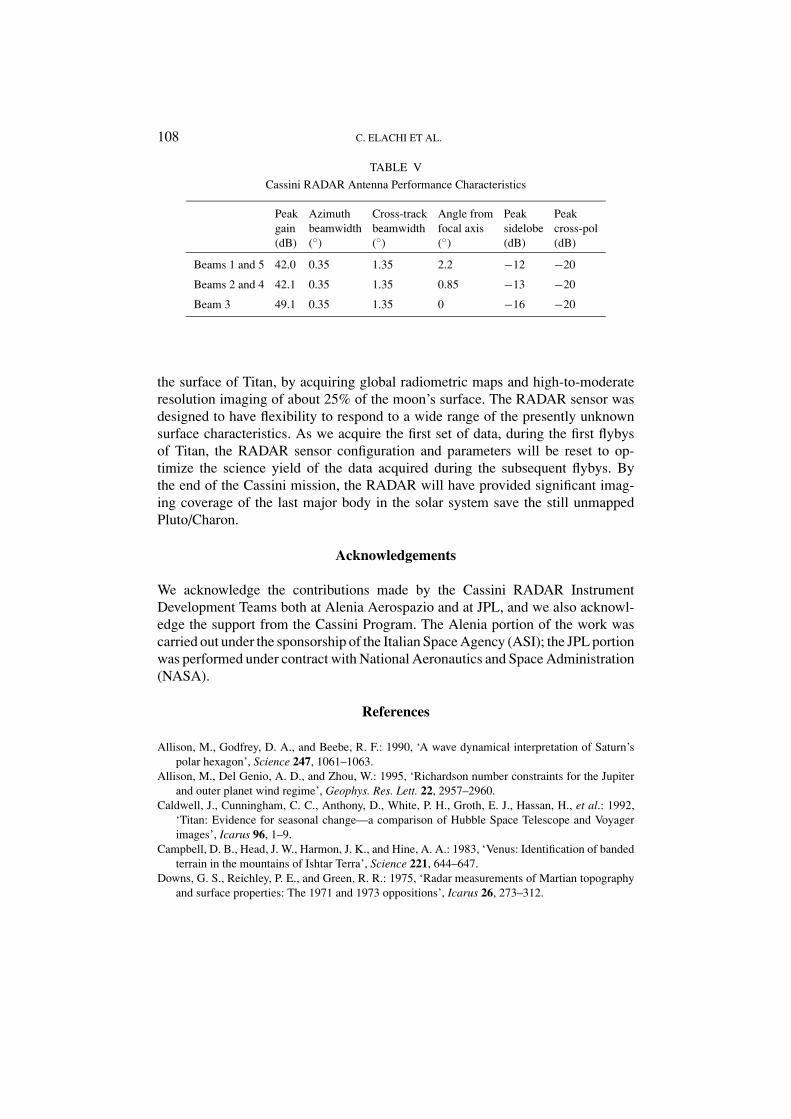
108 C. ELACHI ET AL.
TABLE VCassini RADAR Antenna Performance Characteristics
Peak Azimuth Cross-track Angle from Peak Peakgain beamwidth beamwidth focal axis sidelobe cross-pol(dB) ($) ($) ($) (dB) (dB)
Beams 1 and 5 42.0 0.35 1.35 2.2 "12 "20
Beams 2 and 4 42.1 0.35 1.35 0.85 "13 "20
Beam 3 49.1 0.35 1.35 0 "16 "20
the surface of Titan, by acquiring global radiometric maps and high-to-moderateresolution imaging of about 25% of the moon’s surface. The RADAR sensor wasdesigned to have flexibility to respond to a wide range of the presently unknownsurface characteristics. As we acquire the first set of data, during the first flybysof Titan, the RADAR sensor configuration and parameters will be reset to op-timize the science yield of the data acquired during the subsequent flybys. Bythe end of the Cassini mission, the RADAR will have provided significant imag-ing coverage of the last major body in the solar system save the still unmappedPluto/Charon.
Acknowledgements
We acknowledge the contributions made by the Cassini RADAR InstrumentDevelopment Teams both at Alenia Aerospazio and at JPL, and we also acknowl-edge the support from the Cassini Program. The Alenia portion of the work wascarried out under the sponsorship of the Italian Space Agency (ASI); the JPL portionwas performed under contract with National Aeronautics and Space Administration(NASA).
References
Allison, M., Godfrey, D. A., and Beebe, R. F.: 1990, ‘A wave dynamical interpretation of Saturn’spolar hexagon’, Science 247, 1061–1063.
Allison, M., Del Genio, A. D., and Zhou, W.: 1995, ‘Richardson number constraints for the Jupiterand outer planet wind regime’, Geophys. Res. Lett. 22, 2957–2960.
Caldwell, J., Cunningham, C. C., Anthony, D., White, P. H., Groth, E. J., Hassan, H., et al.: 1992,‘Titan: Evidence for seasonal change—a comparison of Hubble Space Telescope and Voyagerimages’, Icarus 96, 1–9.
Campbell, D. B., Head, J. W., Harmon, J. K., and Hine, A. A.: 1983, ‘Venus: Identification of bandedterrain in the mountains of Ishtar Terra’, Science 221, 644–647.
Downs, G. S., Reichley, P. E., and Green, R. R.: 1975, ‘Radar measurements of Martian topographyand surface properties: The 1971 and 1973 oppositions’, Icarus 26, 273–312.
CASSINI TITAN RADAR MAPPER 109
Dubouloz, N., Raulin, F., Lellouch, E., and Gautier, D.: 1989, ‘Titan’s hypothesized ocean properties:The influence of surface temperature and atmospheric composition uncertainties’, Icarus 82,81–96.
Elachi, C.: 1987, Introduction to the Physics and Techniques of Remote Sensing, New York: Wiley.Elachi, C.: 1988, Spaceborne Radar Remote Sensing: Applications and Techniques, New York: IEEE
Press.Elachi, C., Im, E., Roth, L. E., and Werner, C. L.: 1991, ‘Cassini Titan Radar Mapper’, Proc. IEEE
79, 867–880.Engel, S., Lunine, J. I., and Hartmann, W. K.: 1995, ‘Cratering on Titan and implications for Titan’s
atmospheric history’, Planet. Space Sci. 43, 1059–1066.Ford, P. G., and Pettengill, G. H.: 1992, ‘Venus topography and kilometer-scale slopes’, J. Geophys.
Res. 97, 13,103–13,114.Griffith, C. A.: 1993, ‘Evidence for surface heterogeneity on Titan’, Nature 364, 511–514.Griffith, C. A., Owen, T., and Wagener, R.: 1991, ‘Titan’s surface and troposphere, investigated with
ground-based, near-infrared observation’, Icarus 93, 362–378.Grossman, A. W.: 1990, ‘Microwave imaging of Saturn’s deep atmosphere and rings’, Doctoral
Dissertation, California Institute of Technology.Grossman, A. W., and Muhleman, D. O.: 1992, ‘Observation of Titan’s radio light-curve at 3.5-cm’,
Bull. Am. Astron. Soc. 24, 954.Grossman, A. W., Muhleman, D. O., and Berge, G. L.: 1989, ‘High-resolution microwave imaging
of Saturn’, Science 245, 1211–1215.Harmon, J. K., and Ostro, S.J.: 1985, ‘Mars: Dual-polarization radar observations with extended
coverage’, Icarus 62(1985), 110–128.Hensley, S., and Im, E.: 1993, ‘SAR ambiguity study for the Cassini Radar’, Proceedings of
IGARSS’93.Hubbard, W. B., and 45 others: 1993, ‘The occultation of 28 Sgr by Titan’, Astron. Astrophys. 269,
541–563.Im, E., Johnson, W. T. K., and Hensley, S.: 1993, ‘Cassini Radar for remote sensing of Titan - design
considerations’, Proceedings of IGARSS’93.Inge, J. L., and Batson, R.M.: 1992, ‘Indexes of maps of the planets and satellites’, NASA TM 4395,
96–98.Johnson, W. T. K.: 1991, ‘Magellan imaging radar mission to Venus’, Proc. IEEE 79, 777.Kuiper, G. P.: 1944, ‘Titan: A satellite with an atmosphere’, Astrophys. J. 100, 378–383.Kwok, R., and Johnson, W. T. K.: 1989, ‘Block adaptive quantization of Magellan SAR data’, IEEE
Trans. Geosci. Remote Sens. 27, 375–383.Lemmon, M. T., Karkoscka, E., and Tomasko, M.: 1993, ‘Titan’s rotation: Surface feature observed’,
Icarus 103, 329–332.Lemmon, M. T., Karkoscka, E., and Tomasko, M.: 1995, ‘Titan’s rotational light-curve’, Icarus 113,
27–38.Lindal, G. F., Wood, G. E., Hotz, H. B., Sweetnam, D. N., Eshleman, V. R., and Tyler, G. L.: 1983,
‘The atmosphere of Titan: An analysis of the Voyager 1 radio occultation measurements’, Icarus53, 348–363.
Lorenz, R. D.: 1995a, ‘Raindrops on Titan’, Adv. Space Res. 15, (3)317–(3)320.Lorenz, R. D.: 1995b, ‘Cassini mission: Radar sensing of craters on Titan’, Lunar Planet. Sci. XXVI,
775–776.Lorenz, R. D., and Lunine, J. I.: 1996, ‘Erosion on Titan: Past and present’, Icarus 122, 79–
91.Lorenz, R. D., Smith, P. H., Lemmon, M. T., Karkoschka, E., Lockwood, G. W., and Caldwell, J.:
1997, ‘Titan’s north-south asymmetry from HST and Voyager imaging: Comparison with modelsand ground-based photometry’, Icarus 127, 173–189.
110 C. ELACHI ET AL.
Lunine, J. I.: 1993. ‘Does Titan have an ocean? A review of current understanding of Titan’s surface’,Revs. Geophys. 31, 133–149.
Lunine, J. I., and Rizk, B.: 1989, ‘Thermal evolution of Titan’s atmosphere’, Icarus 80, 370–389.Lunine, J. I., Stevenson, D. J., and Yung, Y. L.: 1983, ‘Ethane ocean on Titan’, Science 222, 1229–1230.Mitchell, D. L., Ostro, S. J., Hudson, R. S., Rosema, K. D., Campbell, D. B., Velez, R., et al.: 1996,
‘Radar observations of asteroids 1 Ceres, 2 Pallas, and 4 Vesta’, Icarus 124, 113–133.Muhleman, D. O., Grossman, A. W., Butler, B. J., and Slade, M. A.: 1990, ‘Radar reflectivity of
Titan’, Science 248, 975–980.Muhleman, D. O., Grossman, A. W., Slade, M. A., and Butler, B. J.: 1992, ‘The surface of Titan and
Titan’s rotation: What is radar telling us?’, Bull. Am. Astron. Soc. 24, 954.Muhleman, D. O., Grossman, A. W., Slade, M. A., and Butler, B. J.: 1993, ‘Titan’s radar reflectivity
and rotation’, Bull. Am. Astron. Soc. 25, 1009.Muhleman, D. O., Grossman, A. W., and Butler, B. J.: 1995, ‘Radar investigation of Mars, Mercury,
and Titan’, Annu. Rev. Earth Planet. Sci. 23, 337–374.Ostro, S. J.: 1993, ‘Planetary Radar Astronomy’, Revs. Mod. Phys. 65, 1235–1279.Ostro, S. J., Campbell, D. B., Simpson, R. A., Hudson, R. S., Chandler, J. F., Rosema, K. D., et
al.: 1992, ‘Europa, Ganymede, and Callisto: New radar results from Arecibo and Goldstone’, J.Geophys. Res. 97, 18,227–18,244.
Pettengill, G. H.: 31978, ‘Physical properties of the planets and satellites from radar observations’,Ann. Rev. Astron. Astrophys. 16, 265–292.
Pettengill, G. H., Briscoe, H. W., Evans, J. V., Gehrels, E., Hyde, G. M., Kraft, L. G., Price, R., andSmith, W. B.: 1962, ‘A radar investigetion of Venus’, Astron. J. 67, 181–190.
Pettengill, G. H., Ford, P. G., Johnson, W. T. K., Raney, K. R., and Soderblom, L. A.: 1991, ‘Magellan:Radar performance and data products’, Science 252, 260–265.
Samuelson, R. E., and Mayo, L. A.: 1997, ‘Steady-state model for methane condensation in Titan’stroposphere’, Planet. Space Sci. 45, 949–958.
Saunders, R. S., and 26 others: 1992, ‘The Magellan Mission summary’, J. Geophys. Res. 97, 13,067–13,090.
Sen, A. D., Anicich, V. G., and Arakelian, T.: 1992, ‘Dielectric constant of liquid alkanes and hydro-carbon mixtures’, J. Phys. D: Appl. Phys. 25, 516–521.
Smith, P. H., and Lemmon, M. T.: 1993, ‘HST images of Titan’, Bull. Am. Astron. Soc. 25, 1105.Smith, P. H., Lemmon, M. T., Lorenz, R. D., Sromovsky, L. A., Caldwell, J. J., and Allison, M. D.:
1996, ‘Titan’s surface, revealed by HST images’, Icarus 119, 336–349.Straty, G. C., and Goodwin, R. D.: 1973, ‘Dielectric constant and polarizability of saturated and
compressed fluid methane’, Cryogenics13, 712–715.Thomson, W. R., and Squyres, S. W.: 1990, 1Titan and other icy satellites: Dielectric properties of
constituent materials and implications for radar sounding’, Icarus 86, 336–354.Toon, O. B., McKay, C. P., Courtin, R., and Ackerman, T. P.: 1988, ‘Methane rain on Titan’, Icarus
75, 255–284.Tyler, G. L., Eshleman, V. R., Anderson, J. D., Levy, G. S., Lindal, G. F., Wood, G. E., et al.: 1981,
‘Radio science investigations of the Saturn system with Voyager 1: Preliminary results’, Science212, 201–206.
Tyler, G. L., Simpson, R. A., Maurer, M. J., and Holman, E.: 1992, ‘Scattering properties of theVenusian surface: Preliminary results from Magellan’, J. Geophys. Res. 97, 13,115–13,139.