radar' - fisheries and oceans canada | pêches et ...radar' canada. fisheries service....
TRANSCRIPT

'RADAR'
Canada. Fisheries Service. Industrial Development Service. PROJECT REPORT
Conducted jointly by the Fisheries Service, Department of Fisheries and Forestry, Ottawa
and the College of Fisheries, Navigation, Marine Engineering
and Electronics, St. John's, Newfoundland
Report Prepared by D.J. Squires, P. Eng. and
D.W. Wall, C.E.T. and J.G. Porter, C.E.T.
for
Industrial Development Branch, Fisheries Service, Department of Fisheries and Forestry,
Ottawa May 1971

This publication is number 41
in the Technical Report Series of the Industrial Development Branch
Ottawa/ Hull 1971 reprint 1974
:2 J..t~f
7~au//-c/¥If/-F- /.() -" r~r,// 'R A DAR'
MARINE ELECTRONICS EVALUATION PROJECT
prepared by
D. J. Squires, P. Eng.
& D. W. Wa II, C. E. T. & J. G. Porter, C. E.T.
for
Vessels and Engineering Division Industrial Development Branch
Fisheries and Marine Service Environment Canada
Project Officer·"
L. W. Proctor
Division Chief
A. H. Shenker
Opinions expressed and conclusions reached by the author are not necessarily endorsed
by the sponsors of this project

., I
).

RADAR EVALUATION
Introduction
The use of radar equipment aboard fishing vessels is accepted as an
essential for safe navigation. Requirements for marine radar equipment have,
unfortunately, never been seriously studied for fishing vessel use although the
British Board of Trade has set some general standards (1968) following recommen
dations made at the 1960 international conference on Safety of Life at Sea
(S.O.L.A.S.). These standards, however, are inclined to be general and
unsuitable for application to fishing vessel requirements.
Perhaps a greater problem is the actual performance of sets purchased.
The operator of a fishing vessel has little opportunity of technically evaluating
a piece of equipment as he has neither the technical training nor facilities.
The purchaser, therefore, has to rely on a sales representative and manufacturers'
brochures; these are designed for selling equipment, not for giving test data.
Preliminary Study
Observations were made on a number of radar sets and the conclusion was
reached that the performance of many left doubts as to fulfilment of the sales
brochure data. Simple tests were made which confirmed these doubts and it became
obvious that an evaluation of the equipment was highly desirable; a project was
decided upon for radar evaluation.
Project
This project was raised in July 1969 and arrangements made with the
College of Fisheries, Navigation, Marine Engineering & Electronics, St. John's,
Nf1d., to carry out this evaluation on behalf of the department. Time restricted
work in 1969 to about four weeks and the project was resumed in June 1970 for ten
weeks. The data obtained from this project forms the main body of this report.
i

The various manufacturers were contacted for loan of new, modern sets
for testing and good co-operation was obtained. Sales and logistics prevented some
sets from being tested, i.e., a sale took precedence over testing, and a
replacement unit for stock has a considerable lead time.
Test Facilities
The College provided a 55 ft. air conditioned trailer with self-contained
power supply regulation equipment; power was obtained from the hydro company
system. Racks were made to mount the equipments and antenna mounts erected to
provide a configuration similar to that found on fishing vessels. Two test rigs
were provided to allow testing of one during insta1lati~n, or removal, of the other.
Test equipment was provided to measure the various parameters including:
a) Power input
b) Transmitted pulse power
c) Receiver sensitivity
d) Frequency
e) Bandwidths
f) V.S.W.R.
The trailer was located at St. Phillips to obtain a view across the bay
toward Bell Island and out to sea through the channel. Bell Island was
approximately 2.5 nm away and a clear passage to sea was available over a sector
o approximately 11 wide.
An 18ft. wooden vessel was used as a target with a radar reflector
fixed atop a wooden mast mounted on the cabin. This reflector was in a similar
position to that normally found on a fishing vessel using such items.
Test Objectives
The prime objective was to determine whether a new set, installed and
tuned by the company personnel, would perform to the parameters provided in the
company brochure. Although it is recognized that one set only was provided, it is
ii
L
considered that any individual purchaser has the right to expect that a new set,
from the factory, should give this performance with minor adjustments only.
A second objective was to determine the range obtainable on a given
target as might be expected in fishing operations. These tests were conducted
under similar environmental conditions for all sets, as far as could be determined t
i.e., no tests were considered under rain conditions for comparison with clear
weather conditions.
Tests were designed to simulate, as far as was practical, operational
usage whilst maintaining control of variables. The effect of varying conditions
can, consequently, be measured, which is not possible aboard a vessel.
Equipment for Testing
Co-operation was obtained from the manufacturers, and units were
offered as they became available. Unfortunately, agency stocks are not maintained
at a high level and if a sale was made, that set could not be replaced wit"hin the
test period.
Test Result Presentation
The results of these tests are presented in the form of technical data
for interpretation by the reader and no comparison is made between sets.
Test Conclusions
From the tests it is evident that units, "when new, are not always
performing to their maximum capability as indicated by published characteristics.
The d"egree of deviation varies from manufacturer to manufacturer and also in the
particular parameter involved.
The testing carried out by the College shows that, in general, sales
brochures were optimistic in transmitter output. Similarly, receiver
iii

sensitivities quoted are generally achieved only after careful component selection.
Tests carried out in Ministry of Transport and Department of National Defence . .
laboratories on sets not covered by the College tests, in addition to some
which were, provided similar results.
Losses are sustained by improper matching between pulse width and
receiver bandpass together with poor bandpass characteristics. The former may,
ho~ever, conceal losses caused by local oscillator drift which would be evident
in a properly matched system.
Mechanical construction was found to be sound and was, perhaps, more
rugged than is required for modern vessels. Accessibility for servicing is, in
general, good although units with transceivers integral with the antenna may pose
problems during winter months, particularly if repairs are necessary at sea.
A common problem is variation of brilliance with change of range and
the relative change of brilliance between range rings and data when changing range.
The change is sufficient to require resetting the display as considerable loss of
targets may occur through simply reducing tube brilliance. An automatic adjustment ~
for these is desirable.
Losses in display are evident by the inability to display sparkling
noise without 'blooming' on strong targets. The losses possible by the present
methods of control for setting the display can degrade range performance and
cause loss of small targets such aa buoys.
The facilities for performance testing are inadequate on many sets.
For determination of performance when servicing, facilities should be provided
for the service technician to measure sensitivity by either Noise Figure (NF) or
Minimum Discernable Signal (MOS) methods in addition to measuring power output.
Mounting design is, in general, insufficiently flexible for arrangement
in a suitable manner in a fishing console; the majority of mounts are for viewing
from a standing position and looking down.
iv

The use of C.R.T. magnifiers is considered to be disadvantageous as
the viewing angle is restricted and creates difficulties for a fishing vessel
captain viewing from his control position. Suitably mounted in a control position
designed on human concepts, the magnifier could be acceptable.
For use in fishing operations the antenna beam width should preferably
o be about 1.2. This would allow reasonable azimuthal resolution particularly at the
shorter ranges where use is most critical.
Standards for radar on fishing vessels should be set, as existing
standards recommended by S.O.L.A.S. are not representative of the fisheries
operational conditions. For example, a 3 cm radar is required to read a G.P.C.
buoy at 2 nm on a 50% Blip/Scan ratio when the antenna is 50 ft. a.s.l. -
Canadian fishing vessels normally fit the antenna 12 to 25 ft. a.s.1.
Future Work
The experience gained in these tests indicates that several areas of
investigation are highly desirable.
The advantages of using radar reflectors, particularly on wooden
vessels, are obvious. It also became clear that the performance of the
reflectors should be examined as the measured equivalent echoing area is
considerably less than the theoretical value.
Due to the wide variation in vessel profiles and reflection
coefficient, e.g., wood versus steel, some assessment of vessel equivalent target
areas should be made. From this, radar requirements for safe detection ranges
can be determined.
Due to varying propagation factors, detection range on a given target
can vary widely although conditions may appear similar. Monitoring of conditions
and preparation of charts showing variations in propagation factors in fishing
vessel operational areas would be very useful; these charts should relate the
atmospheric conditions to propagation factor.
v

Some standard performance specifications for radar sets are an evident
requirement. These should be coupled to type approval certificates which include
operational performance tests carried out under controlled test conditions, e.g.,
a calibrated test range.
Due to the variation in standards set by manufacturers in advertising
their wares, it is evident that a periodic evaluation program is deSirable. To
determine the worth of new, or modified. sets, a project should be undertaken
every two or three years.
Acknowledgements
We wish to commend the College of Fisheries, Navigation, Marine
Engineering and Electronics for the excellent work provided in carrying out this
project. In addition, we wish to acknowledge the considerable support given to
the project by the Ship Electronics group of the Department of Transport and the
Directorate of Maritime Combat Systems, Department of National Defence in supply
of test data, 'equipment and advice. We also wish to thank the various manufacturers
who supplied the sets under test and the service of their technicians,
particularly as the trials had to be conducted during the busiest period for
the companies.
May 1971
L. W. Proctor, P. Eng. Electronics Engineer, Vessels and Engineering Division Industrial Development Branch Fisheries Service Department of Fisheries and Forestry
vi
., A C K NOW LED GEM E N T S
The authors wish to thank Mr. L.W. Proctor, P. Eng.,
Vessels & Engineering Division, Industrial Development
Branch, Department of Fisheries and Forestry of Canada for
his efforts in initiating this project and for negotiating
with the companies who made radar sets available for
test. Their co-operation is also gratefully acknowledged.
We wish to thank as well others who helped by loaning
test equipment for advice offered or for co-operation
extended in many ways.
The efforts of J. Ryan, C.E.T. and Student Technologist
M. Hayward are also acknowledged for their excellent
work during the project.
vii

1 73
n 57
~51 55
54
55
56
56
;6
~9 47 ./
41 41
3
34 " -
i
18
35
29 29
2 35
55
St. Phillips, Newfoundland
Map Of Test Location Showing Unobstructed Test Areas
Scale 1:75.000 Approx. 1" • 1.027 N. Miles
58
54
56
54
"49\ I R ,
52
,- . .J 53
53 S4
6t Ii
59
61
60
, .... -"'" 5~./ 46
5~ .. · ..... 45 S
/ 45 32
. ' 52/ 49
/ 47
37
--1..--. .
47
37 G
26
36
30 /is''' 52, .. ' /45 37 30 2,5 .' "".' R I .~
, :54
44 IR
47/
89
73 S 95
100
62
./ " . ./ 16 . / '.
---/~--~3~4--33--------~2~2--~.'~"_19--·'1'6 --~ ~\'~'~~~~rl:~~nr~~~-~~;-~~~#i~~~ 5~ .. /44 . 22 " ~" .. /
41
29 30
26
34 31
16! 16 RI
29
34 23
30
@ 2,4
23
13 14/ 23 (18 14 \. .'''1
" 12 _ \. 119)
24
_",' _~,' J I" 13' - •••.... ,, ' \. 13, 37
42 I
39
\ , ::..<1 ':: " \ \ / 35 40 \ 13 I :. , .' .106 'ule Bell I.
" I \ . I.~ 31 46 R
I
C) . . 18 ' • . -..;,". 34 " .. . .... 41 :-...: .- ::'~/ 25
43 34 31 ' 28
26 38
45 24 23
41 23
44 31 /20 38 I
" 43 ,
271 12
36 26 I
/13 31 29
,,-,
30 R
40 31
32
27

- 1 -
MARINE ELECTRONICS EVALUATION PROJECT
1. The Project - This report covers a radar evaluation project conducted at the College over the period of approximately March, 1970 to January, 1971. Investigative work was carried O\lt during March - June, p.rimarily on the r.evision of test procedures as indicated by the preliminary project undertaken during the summer of 1969. Major test procedures requiring complete revision were the methods of measuring MOS and range ring accuracy and successful procedures were developed to measure both these items. Radar testing occured during all of July and August and for part of September, during which time preliminary reports were prepared on individual radars except for the sections on general comments and the abstracts. The individual reports were then finalized along with the compiling and writing of the balance of the report during December and January 1971.
2. Radar Evaluation Testing - In all, seven different radars were put through a series of detailed tests which measured the important operating parameters such as PRF, peak power, MOS, antenna VSWR, pulse shape and rise-time, IF bandwidth, noise figure, range ring accuracy and other items. The radars were then tested for operating capa·bility over a ± 30% variation in input supply and PRF, MOS, scan rate and power output were monitored and measurements made at 5% increments of the input supply. Any other operating malfunctions such as changes in the PPI brightness were also noted. Finally field tests were conducted which measured minimum and maximum range, range and azimuth resolution and bearing accuracy. The one major operating characteristic not measured was the antenna pattern and gain. This test requires facilities not available at the College but it would be very desirable to seek verification of the published gain and antenna patterns from a suitably equipped agency for several of the antenna types used.
3. Maximum Range and Propagation - Detailed results are given in individual reports for maximum range, but comments and comparisons were deliberately omitted because of the variations in measured maximum ranges between the different sets, which ar~ not adequately related to the theoretical maximums. This analysis will be carried out ,separate from this report, but cannot be completed until positive
j t· ..
- 2 -
3. Cont'd
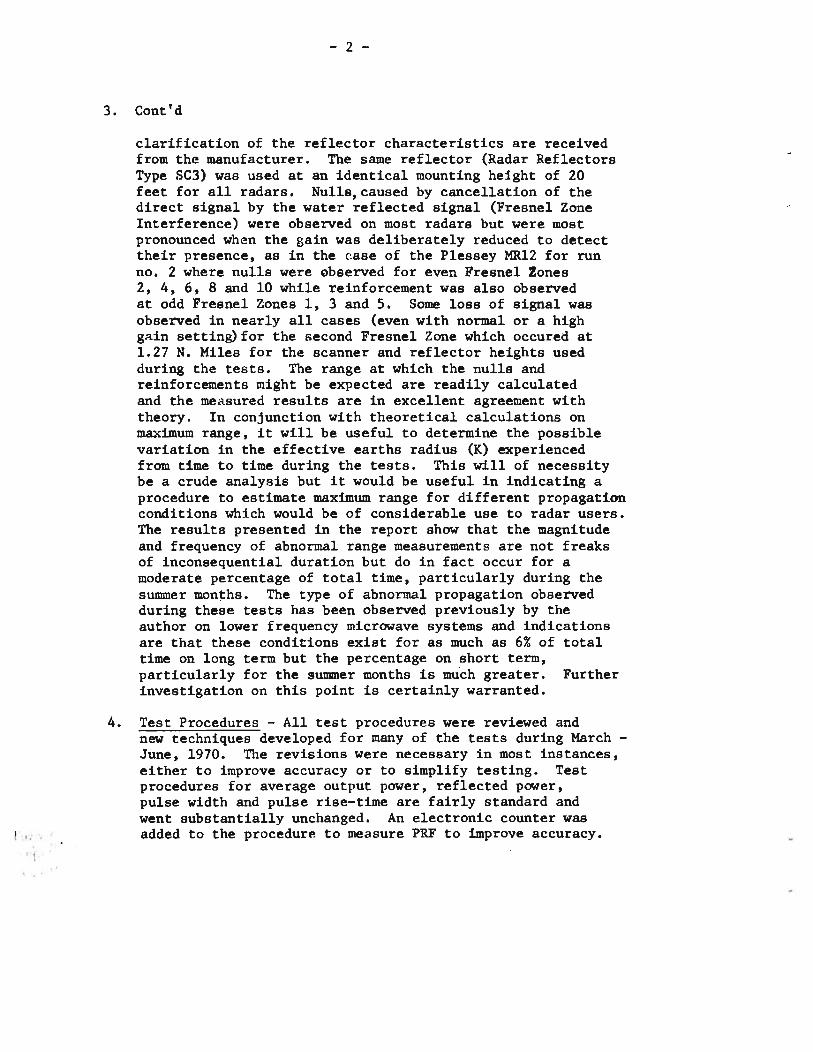
clarification of the reflector characteristics are received from the manufacturer. The same reflector (Radar Reflectors Type SC3) w~s used at an identical mounting height of 20 feet for all radars. Nulls, caused by cancellation of the direct signal by the water reflected signal (Fresnel Zone Interference) were observed on most radars but were most pronounced when the gain was deliberately reduced to detect their presence, "as in the case of the P1essey MRl2 for run no. 2 where nulls w~re observed for even Fresnel Zones 2, 4, 6, 8 and 10 while reinforcement was also observed at odd Fresnel Zones 1, 3 and 5. Some loss of signal was observed in nearly all cases (even with normal or a high gRin settin~for the second Fresnel Zone which occured at 1.27 N. Miles for the scanner and reflector heights used during the tests. The range at which the nulls and reinforcements might be expected are readily calculated and the measured results are in excellent agreement with theory. In conjunction with theoretical calculations on maximum range, it will be useful to determine the possible variation in the effective earths radius (K) experienced from time to time during the tests. This will of necessity be a crude analysis but it would be useful in indicating a procedure to estimate maximum range for different propagation conditions which would be of considerable use to radar users. The results presented in the report show that the magnitude and frequency of abnormal range measurements are not freaks of inconsequential duration but do in fact occur for a moderate percentage of total time, particularly during the summer mon~hs. The type of abnormal propagation observed during these tests has been observed previously by the author on lower frequency microwave systems and indications are that these conditions exist for as much as 6% of total time on long term but the percentage on short term, particularly for the summer months is much greater. Further investigation on this point is certainly warranted.
4. Test Procedures - All test procedures were reviewed and new techniques developed for many of the tests during March -June, 1970. The revisions were necessary in most instances, either to improve accuracy or to simplify testing. Test procedures for average output power, reflected power, pulse width and pulse rise-time are fairly standard and went substantially unchanged. An electronic counter was added to the procedure to measure PRF to improve accuracy.

- 3 -
4. Test Procedures Cont'd
The final method to measure MDS proved to be very flexible but the minimum pulse width for reliable results was 0.5 ~sec. Pulse lengths shorter than this resulted in instability in the radar test set used to feed the receiver. A calibrated echo of any duration and of any delay could be convient1y produced and fed into the receiver. MDS was determined in all cases for 0.5 ~sec pulse length with an echo duration corresponding to a point source. Receiver sensitivity was only measured for those receivers with an I.F. ~~e~uefte~different from our noise figure meter. The procedure to measure I.F. response was modified to include a method to insert the test signal at r.f. frequency, to be used on those radars which did not offer ready access to the I.F. amplifier input. The method to measure video bandwidth is essentially very simple but was complicated by the lack of detailed test information and consequent difficulty in determining a suitable input point and method of signal injection. The limited signal to noise ratio measurement was modified by the addition of a true RMS voltmeter which gave a more reliable noise voltage reading than trying to estimate the noise level from the oscilloscope trace. Power supply measurements were essentially unchanged except that a voltage regulator was used to supply the radar under test as well as all the test equipment. The regulator eliminated the difficulty encountered during the summer of 1969 when poor power line regulation caused so much difficulty. The regulator had a capacity of 30 Amps and was able to maintain line voltage to within ± 1.5% of set point,which was variable from 100 to 120 volts. The sensitivity time constant measurement was quite successful except that the maximum measurable attenuation was about 60 db. The procedure to measure range ring accuracy was greatly improved by the use of a counter which provided an overall accuracy of about ± 0.01%. Bearing accuracy was added to the field tests and the procedure to measure both range and azimuth resolution was modified following testing of the first radar. Initial measurements yielded results for azimuth resolution well in excess of specification but this was found to be caused by the test procedure. We had initially "ran out" a target behind a moving boat,which did not give the operator time to optimize his controls and consequently the targets were well separated at the measurement point. The final procedure adopted consisted of holding a fixed distance between targets for several scans at successively longer distances. This procedure gave the operator sufficient time to make the necessary adjustments and proved very successful.

- 4 -
5. Test Facilities - All tests were conducted from a portable electronics laboratory built into a 55 foot trailer, which was located approximately 50 feet from the waters edge at St. Phillips, about 10 miles from St. John's. The trailer was fitted with two radar mounting platforms which permitted work to proceed on two radars simultaneously.
6. Availability Of Radars For Testing - Delays were encountered in obtaining some radars and considerable time was also required for installation. Our technicians installed five out of the seven radars tested but some installation work was also required on the remaining two. In one instance a radar had to be returned to the agent before we had satisfactorily completed all tests. The cooperation extended by all suppliers was, however, outstanding and they gave willingly of their time and talent, limited only by the availability of manpower. Most suppliers were shorthanded during the summer because of vacations and a heavy regular work load and consequently their technicians were frequently unavailable. As a conservative estimate, if sets could have been made available to optimize our testing schedule we would have been able to install and test an additional three units.
7. Calibration of Test Equipment - All test equipment was calibrated prior to the project and on completion in addition to frequent operating checks which were made during the project to ensure the accuracy of measurements. Where applicable, calibrated values for test devices were used rather than the catalogue or nominal values. The accuracy of test equipment is noted in the test procedures and in the text where it is important to the interpretation of the test results.
8. Radar Specifications - A comparison of measured and specified radar parameters was made in the individual reports but no attempt was made to compare the performance of the different models of radars tested. A few general comments are, however, in order. None of the radars tested met all its specifications, for example only three radars had peak power output equal to or greater than specification, and only four met or exceeded ' the specified regulations without qualification. Range ring accuracy, however, was within specification for ranges greater than three miles but four radars were somewhat below specification on ranges less than three miles. The results clearly indicate that some uniform method of giving specifications ~hould be devised. For example it was found that some manufacturer's specifications were much tighter than others and even though a radar didn't meet a particular specification it could have been as good

- 5 -
8. Radar Specifications Cont'd
or better than a radar which met a lesser specification. Just as important, manufacturers do not give tolerances for many specifications and we believe this should be included. For example, the I.F. bandwidth should be given as 10 MHz ±X MHz between half power points rather than stated simply as 10 MHz.
9. Conclusions and Recommendations - The test results clearly indicate the need for more realistic and uniform method of specification setting by various manufacturers.. The tests did prove that though I the overall performance of the radars tested was somewhat above the level expected prior to the evaluation, serious deficiencies in performance were confirmed, few of which could have, or would have been corrected in an average commercial installation. We seriously recommend that efforts be made by owners to require service companies to carry out performance tests on new installations to ensure adequate performance. However, if this is to be Buccessfu1, a new portable radar test set and performance monitor will have to be developed because existing equipment is far too bulky, cumbersome and expensive for realistic field use. The tests on maximum range demonstrate that further investigative work should be undertaken on propagation, to determine the percentage of time that abnormal propagation conditions may be expected to exist, particularly during the summer months. Tests should also be undertaken to determine antenna characteristics of at least several of the types used during the project.
D.J. Squires D.W. Wall J.G. Porter
/~
January 25, 1971


MARINE ELECTRONICS EVALUATION' PROJECT
- RADAR -
Conducted Jointly
by
CANADA DEPARTMENT OF FISHERIES & FORESTRY
and the
COLLEGE OF FISHERIES, NAVIGATION, MARINE ENGINEERING
. and ELECTRONICS
July - August 1970
Test Results for Canadian Marcon; LN66
.. "---_._------------------------,
. \ I
I I
I I I I
Canadian Marconi LN~6~ ____________ _ \':f1lJ i pnH' n t ~1ncl c' 1
l.
2.
3.
4.
5.
CONTENTS
Abstract ................................... ......................... Unit Serial Numbers
Peak Pulse Power · ......................... . Pulse Width . ............................. . Pulse Rise-time ............................. Average Output Power . ...................... .
6. Average Reflected Power •••••••••••••••••••••
7.
8.
9.
10.
11.
12.
13.
14.
15.
16.
17.
18.
19.
20.0
Standing Wave Ratio ••••••••••••••••••••••• • •
Pulse Repetition · ......................... . Minimum Discernible Signal . ............... . Receiver Sensitivity . ..................... . Noise Figure ............................... 1. f. Bandwidth
Video Bandwidth
............................. ............................
Limited Signal-to-noise Ratio . ............ . Input Supply Line . ........................ . Sensitivity Time Control . ................ . Range Ring Accuracy ••••••••••••••••••••••••
Effect of Input Voltage
Variations on Performance ............... a.c. Power Supply Performance . ............. . Field Tests ................................
• 1 'Hax1mtJ:m Range •••••••••••••••• .••••••••••••••
.2
.3
.4
21.
.............................. Minimum Range
Resolution ................................. .1
.2
Range
Azimuth
.................................. ................................
Bearing Accuracy
General Comments
· ......................... . · ......................... .
Page
ii - iii
1
2
2 .
2.
2
3
3 .
4 .
4_
4
4
4 & 5
4 & 5
6
6
7
8 & 9
10
10 .
11 . & 12 .
11 & 12 .
11
11
11
11
11 .
13 . & 14
Page -L!>f tiL
Canadian Marconi LN66 Equipment Model
Abstract
The Canadian Marconi LN66 is a low priced set with a 10 inch PPI which is large enough for effective viewing without a magnifier. A second set was partly tested because it was necessary to re-test azimuth resolution and results for this set are provided where available. Peak pulse power was below specification on both sets - output measured between a minimum of 8.2 Kw on set #1 on long pulse while set #2 gave the highest output of 9.43 Kw also on long pulse. Pulse repetition frequency was within 3% of specification for both sets, except that the high rate for set #2 was 6% low.
Noise figure was between 1.5 to 4 db short of specification but I.F. bandwidth was exactly on specification. The video amplifier response measured between 0.4 KHz - 1.4 MHz, but no value was specified for comparison. When operated from 36Vdc, the unit required 241 watts which was near the specified value of 234 watts. Power consumption on a.c. was well above specification. The unit required 3.15 amps where-as the specification was only 2.1 amps. Also,it was necessary to operate the power supply from +6% taps on the power transformer to achieve 36 volt output for nominal 115 V.a.c. input. The supply couldn't compensate for line voltage 6% below nominal and it appeared that the transformer turns ratio was incorrect.
The STC control was very effective and,when fully on, attenuation began at 2000 yards, increasing to 61 db at 180 yards. The specified range ring accuracy of ±1% of indicated range or 40 yards - whichever is greater-was met on all ranges. The set did not have a range ring at 24 miles even though it is sold as a 24 mile radar.
The specified regulation of ±20% was met except that at -20% input MDS was reduced by 5db and power output was reduced by 1.1 db. The set continued to operate at -25% input but MDS was reduced by 20db and power output by 7db. The display was inoperative at -30% input. PRF was relatively independant of input voltage and was only slightly reduced at -25% input. The a.c. power supply had excellent regulation as output variations remained within 1% of input variations over the full range of ±30%.
Range resolution was 35' for one radar and 59.6' for the other, whereas the specification was 60'. Minimum range measured at 54', which was 10% better than the specification of 60' for one radar whereas the other measured at 60'. Azimuth resolution for the second
o 0 radar was 1.6 - somewhat better than specification of 1.9. Results for the first radar were unsatisfactory because of the test procedure employed. Bearing accuracy was within specification.
Installation of the LN66 is straight forward, and can be carried out by following the instructions, which are very explicit. The unit tested was wired for 36 volts but the operating voltage may be changed by replacing a plug in adapter and Bne resistor. Operation from a.c.
Page ...;!.;L of ,...iJ...1.

Canadian Marconi LN66 Equipment Model
Abstract
requires a separate rectifier. The T/R and display units were judged to be light weight but sturdy. The scanner unit was of cast construction and very rugged. Servicing was judged to be convenient aa all components were labelled and readily accessible.
The orange phosphor 10 inch CRT provided an excellent radar picture with the viewing hood in place but some light filtered in around the bottom of the hood which was objectionable because it tended to obscure weak signals. The control illumination also interfered with the PPI presentation and the bearing cursor was positioned too far from the bearing scale so that it was difficult to take an accurate bearing.
Page .!!!...,of ~
Canadian Marconi LN66 Equipment ~1odl']
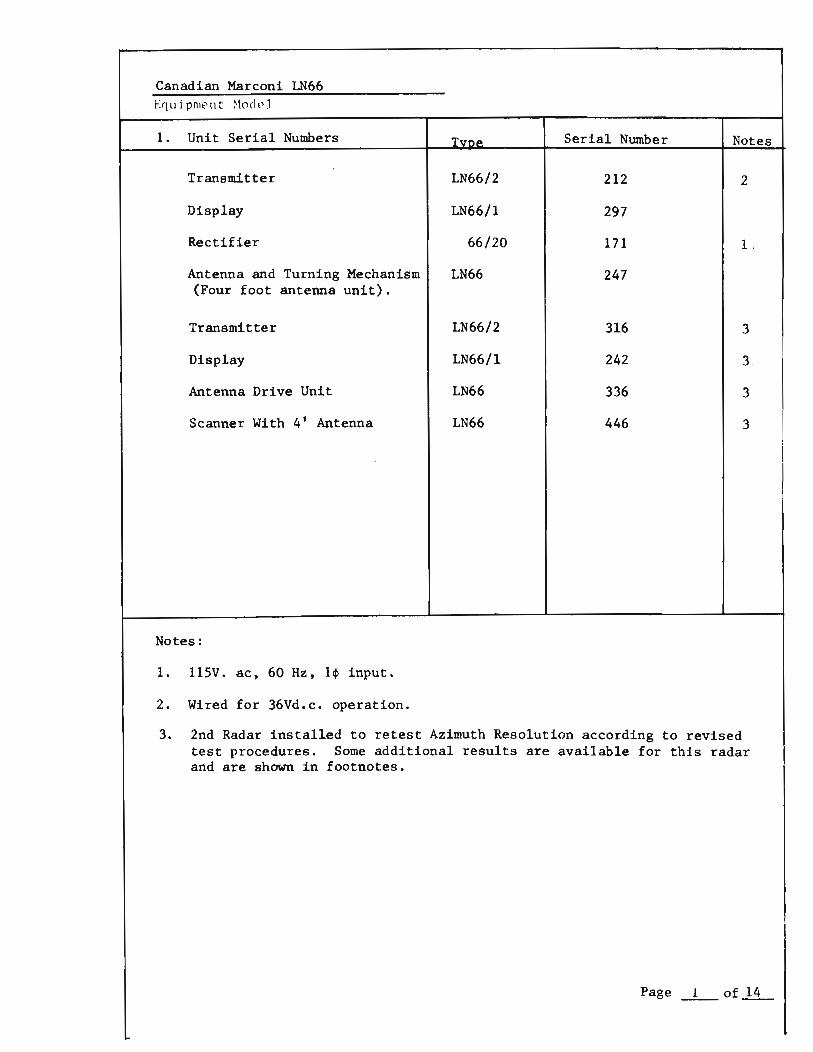
l. Unit Serial Numbers Tvnp Serial Nwnber Notes
Transmitter LN66/2 212 2
Display LN66/1 297
Rectifier 66/20 171 1.
Antenna and Turning Mechanism LN66 247 (Four foot antenna unit).
Transmitter LN66/2 316 3
Display LN66/l 242 3 .
Antenna Drive Unit LN66 336 3
Scanner With 4' Antenna LN66 446 3
Notes:
1. 11SV. ac, 60 Hz, 1~ input.
2. Wired for 36Vd.c. operation.
3. 2nd Radar installed to retest Azimuth Resolution according to revised test procedures. Some additional results are available for this radar and are shown in footnotes.
Page -1-of~

Canig~iD Hit'QDi I..li66 Equipment Model
Measured Spec. Notes
2. Peak Pulse Power, Pt, Kw. 1 ,2
long pulse 8.2 10 3 short pulse 9.26 10 3
3. Pulse Width, T , llSec. p
long pulse 0.535 0.5 3 shnrt pulse 0.045 0.05 3
4. Pulse Rise-time llSec.
long pulse 0.017 N/s 3 short pulse 0.017 N/S 3
5. Average Output Power, Po, Watts.
long pulse (+37.5 dbm) 5.62 N/S 3 short pulse (+30.2 dbm) 1.05 N/s 3
N/s Not St:l'!cified
1. See Appendix A for test procedures. For these tests d.c. supply voltage was maintained at 36.0 Vdc.
2. Calculated from PRF, Pulse width and average output power.
3. 2nd Radar test results are:
Long Pulse 2. 3. 4. 5.
Peak Pulse Power, Pt, Kw Pulse Width, Tp, llsec Pulse Rise-time, llsec
9.43 0.57 0.01
Average output power, Po, Watts Average output power, Po, dbm
6.55 38.15
Short Pulse
9.18 0.065 0.01 1.4
31.45

Canadian Marconi LN66 Equipment Model
Measured Spec. Notes
6. Average Reflected Power, Pro mw
long pulse (+9.45 dbm) 8.81 N/S 1 short pulse (+2.70 dbm) 1.86 N/S
7. Standing~ave Ratio, VSWR. 2
long pulse 1.08: 1 N/S short pulse 1. 09: 1 N/S
NOTES
1. See Appendix .A for test procedure. Reflected power was measured in each case with the scanner stationary and facing the open bay to avoid reflection from nearby land structures.
2. The VSWR is that of the entire antenna sub-system consisting of the following Wave guide Components in addition to the directional couplers.
1 - 10' length rectangular W.G. 1-1' " " " 1 - 24" "of flexible " 1 - 6" 900 bend.

I
Canadian Marconi ~~§§ Eq u i pmen t Mode 1
Measured Spec.
8. Pulse Re2etition Freguenc:l. Fr. PPS 2520 2500 1284 ~250
9. Minimum Discernible Si&2al. MDS. dbm. -89 N/S
10. Sensitivit:l. Pr, dpm
long pulse -90 -91.5 short pulse -87.5 -91.5
U. Noise Figure. N.F •• db.
long pulse 12.5 11 short pulse 15 U
12. I.F. Bandwidth I Bw I MHz. 14 14
13. Video Bandwidth. ± 3db· (Reference 100 KHz) 0.4 KHz to N/S 1. 4 MHz
:mn:s
1. See appendix A for test procedure.
2. 1/2, 1 1/2 and 3 mile ranges.
3. 6, ' 12 and 24 mile ranges.
4. NF shown calculated from measured values of sensitivity and I.F. Bandwidth since N.F. meter available was not equipped to measure with a 45 MHz i.f. NF - 174 - 10 log BW + Pro
5. See page 5 for I.F. response curve.
6. See page 5 for video response curve.
7. 2nd Radar results are:
NotcH
1,2,7 1,3
1
1,8 1,8
4 4
1,5
1,6 I
Pulse Repetition Frequency Ranges ~ 3 miles Ranges ~ 6 mile~
8. Specified Value Calculated From specified values of Bw and N.F.
2354 1219
',Page ~of !i..-

10 T I -1 1 I I , : I I ! I : - I i III! I' I '1 I:' ! , i -, I I TIT . " ! ' . -....!.- 'j '+41 I, ' I ' '. Ii· i : , I ' · v~deol : Baru:h"idt !, ,". .---- --- .-. , ;", -1
-- -- - .~ .1 -: I • 1 - I 'I' !: . -. ! 'I . I ': !. I ' I' I j .... : l.~ ! ; -I I I ' ! I I , - - - ~ i ___ l .. L- - i · l- ' j' iT, ~ ~l .. ·1·-' I --- . .. I ~ -' I·· 11-- -- - ~ , . i I· I r: - ~ : -.. ! . ' .. : I . i \ , :! ... L. .. I .. !... 'i:-"I -.' f-~- ..L~ :"",'" . i'- " i ------l' I' +-i-t+--- --,----.---t--r -t-i~" --. -1-- _m! - I . +rr- . . T .
, I Iii i I : 'I . ; .', I . I ! i: ... ~ - , i ' i -I -- • , ", .. -. -, . ' ' .-' I .. I- - I - .. I -. I 1-,- - - .. 1 I 1 - i . . .' - -,.. 'n - ! j r. ---1-.... ~--'·.1 .. --r _c. -I -, : , . i I /1 -1--- ; i ! .. ~'l I ! I ~· ·1 . :! ,. -l ' - '- :~- --' .- : .. - .. ,- . • - f--' -: .~-.-~ -1'--:+1
a ,I I. I, ,i .-- , .. ~! i : ' I Ii : ' ;,'!! I r", -: ~~ -- - ... ". - i' -...... ; .. \ .. ~~~i:"T ---.I.H,' , I ' · I ·1· .~j .. :.: i i --!- ..... _,. __ t , -- . Ir..... ., ~·--f ,'- l ~-=-;~~-~-~r.tt.:-~:.-:-.:I. "':---i::' ! .. : .\-1- . -~t·~~·~~'i!~~ ... :- "I: L-:-.-J- ~: ·~l:-··::"~- -.i- ~.~ .. ::: ~,~ i.;r~ : .. (: f..-:."""tj V .- i . ; i i- -.... - . . I ' : t' ! f --. - .-.-;-+. . . -~ . ... . t .. : - I. - - - ~-;- -:-: ,,- . i i ,-' :'t-~~"-'· I · - .i : I· i· f ~ -'j . I ~l- .~ ., --: -.. ' I '-'- :~l ~ :" r+: ! .--=-~-'-'-;--'''-!::: :- ''-~ .. ":' _L~~_.~ ~"f'l E~:I - ' "--ot· -.. -i i" ; i:, -- -,·IIf-·-q--1 !. i! I : !t" ~ - l ~- ' .~ .. -: .. :11 ---- - -- ··· .. " .. ·--+-tj--- I--- . , ' " " ''''"-Il~: -' ; ''
-10 '-fl!:' -+ ' I' j - i;. ,- - - i" '" , . ! ' !! . '~ -- ,' ; -- : . .;-" -- -"-l- .,----- . " - -;.. !- "1
-_OJ! ·-1·' :·. I· · !i!---;.-t---·; ; .. !·I: - ll!-!- " ~--- 'i-- ' il~'I' . - 1 ' -' - -'-1"-~- f-j- - - .;:" - I· ·,:·~· '~~f-i' .. ~~-~: .l -t·, i -l d· l.lt! "~~--r .. 1 ·1 j .. ,.1~ -.. , .\. I [=-~~+-. I· 11 - ~~!I ·: , j .... vr: ~:, ::,:; + -"- --,:;:;::s:~: --f" I .. -,~~~ .. r\ I ,-- -- - - --1- " I : - ! -~- ! I- f- -r- ' , ,I ~ ... . - .. -'i-- -1-' .. . - , ! 1 .. -._- ---H'- ,---1-- r-;_ ... f-- ~~ '-' ","; + .. 1\ . . ---......!- i- -i-:-t ~ -+- ------r---r- -'- -.--++t-.o+-'M-t--· , . 1- ,-H -r- H' I " - .. -!·~l-f-:-:--;-. r-' ~ .. ; . I I . I .. I I" _. t - .. : I iii . - I .- . -f· ' ,:- ' 1 !, - ... -.0._. ;-_ --... ;-. .. --- 1" -_.-1- - : . , "I:. - - --l- I .~ -I I f\ I " ---~. _., - '-l "~V' I I -.. --, '1' . ---... 1-" -- - ~ .. - .. 1-- . I ., ... - -.- .. -. ,~ ... -. - I--i" - -I- . .- " .. J, ... ~ - .. riJ .-,...-~--- ~- ':;-"- ' ,' 1 1-- -- r ; i ' !: -. 1'--;--1' " - . i-- '1' j . : .. ..!- '-"-r-~ '-:-- f--r'-: - - I-'- '+--:-~ -i. ,-' .: .. -,1 .. i _20--+--1-; " . -:- i' I-I i .-'''-r-- i ~ l: I' Ili---- j-- .... ·r·l· "I --.. --'---· .. .... -I-f-+ ._ - -- -;-"':"' .Ll \-; -:-:- -j-_ .. , .. ..
I~
100Hz 10Hz
Video Bandwidth
1 KHz .1 KHz
Video input at 1 MHz 18e9DjyRMS
500 mvRMS Output at CRT
10 KHz
1. f. Bandwidth
Centre frequency 45MHz
-3db Bandwidth 14MHz
I.f. input at centre frequency 2.2 UvRMS
output at centre frequency 66 mvRMS
100 KHz 1 MHz Ief. Bandwidth I ,
, _I' .l . .A ;"101. . , !1 ' , IC!t : I '
I ; '-"_I . , 1 , J . IN' -J I . I Ir :' I ' -r I :~
-20 " ; l ·.l I ' '! I, • , .. """Il: • , I JI ' : '
~~ i/ ' , j , i
I I
-60~~J'+++T++~~~~~~Hr-~~~~++++++++~ :u 40 60 80 [( 0
Frequency MHz
... 10M.J.fz
.... .... W N
< H ttj .... . .a (") jl, HI ~ II) !D ..... ::s 0 '0 II)
\)j :3 p,. \)j III (l) .... III ::s ::s § ::s jl, rT jl, t: t: .... 3: ::s:: .... jl, 0 II) ~ r1' jl, 1'1 r1' :J' !D () :J' .... 0 ::s ....
t-' Z 0\ 0\

~1Q§Q1i~ H&,~ggj Ui66 Equipment Model
Measured Spec. Notes
14. Limited Signa1-to-Noise Ratio, (SIN) lim. db 21 N/s
15. Input Supply line
input volts d.c. 36.0 36.0 input amps d.c. 6.7 6.5 input watts 241 234
D.C. SU2211
input volts a.c. 116 115.0 " amps a.c. 3.15 2.1 " watts 288 N/s " VA 366 242 " P. f. 0.79 N/s
output volts d.c. 36.0 36.0 " amps d.c. 6.7 -" watts 241 -
~(rn:s
1. See Appendix A for test procedure l '
2. It was necessary to operate power supply from +6% taps on power transformer to achieve 36 volt output for nominal IISV a.c. input. The supply could not compensate for line voltage 6% below nominal (10SV). It appeared that the transformer turns ratio was incorrect.
1
1,2
The following results were obtained for various tap positions on the a.c. power supply.
I
a.c. in d.c. out taps
115 Vac 31.0 Vdc -6% (7-9)
" 33.5 " 0 (6-10)
" 35.6 " +6% (5-11)
123 Vac 36.0 0 (6-10)
-Page -2.-of ....!i.

Canadian Marconi LN66 Equipment Model
Hi ~pnRi t-ivi t-v Timp< Cant-Tol Measured Spec. Notes
1 Sea clutter control on (fully c.w. )
" Attenuation measured in i.f. Amplifier at the following ranges:
180 yds. >61db N/S 500 " 41db
1000 " isdb 1500 " 5db 2000 " Odb
•
,
NOTES
1. See Appendix A for test procedure.
~Page -L-of 2!...
Canadian Marconi LN66 Eq u i pmt'l1 t ~lodl' 1
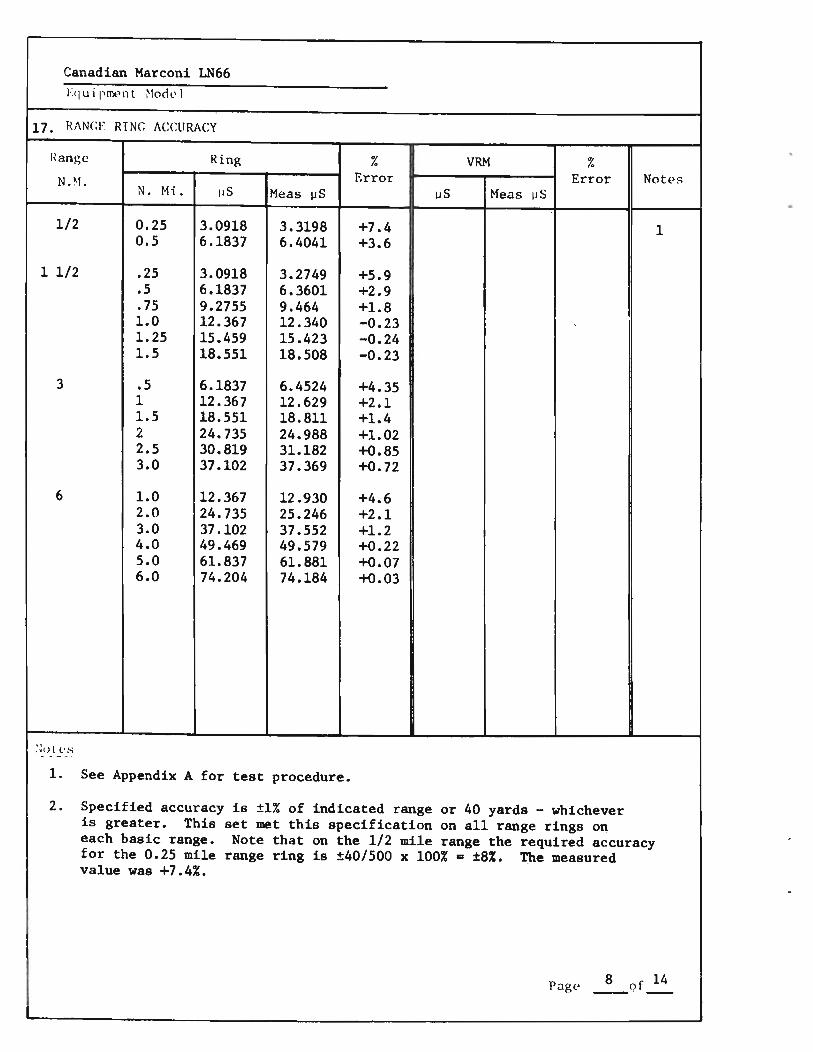
17. RANCE RING ACCURACY
Range Ring % VRM % N .~1. Error Error NotE.'s
N. Hi. pS Meas ~S uS Meas ~S
1/2 0.25 3.0918 3.3198 +7.4 0.5 6.1837 6.4041 +3.6
1 1/2 .25 3.0918 3.2749 +5.9 .5 6.1837 6.3601 +2.9 .75 9.2755 9.464 +1.8 1.0 12.367 12.340 -0.23 1.25 15.459 15.423 -0.24 1.5 18.551 18.508 -0.23
3 .5 6.1837 6.4524 +4.35 1 12.367 12.629 +2.1 1.5 18.551 18.811 +1.4 2 24.735 24.988 +1.02 2.5 30.819 31.182 +0.85 3.0 37.102 37.369 +0.72
6 1.0 12.367 12.930 +4.6 2.0 24.735 25.246 +2.1 3.0 37.102 37.552 +1.2 4.0 49.469 49.579 +0.22 5.0 61. 837 61.881 +0.07 6.0 74.204 74.184 +0.03
1. See Appendix A for test procedure.
2. Specified accuracy is ±1% of indicated range or 40 yards - whichever is greater. This set met this specification on all range rings o~ each basic range. Note that on the 1/2 mile range the required accuracy for the 0.25 mile range ring is ±40/500 x ,100% - ±8%. T:he measured value was +7.4%.
1
8 of 14 -'-
•

Canadian Marconi LN66 Equi 1'l11l'llt Model
17. f{/\NCE RING ACCURACY
I~ang(.) lUng % VRM %
.. N.M. Error Error Notes
N. Mi. liS Meas pS ~J S Meas IJS
12 2 24.735 24.649 -0.35 4 49.469 49.285 -0.37 6 74.204 73.965 -0.32 8 98.939 98.619 -0.32 10 12.367 123.15 -0.42 12 148.41 147.93 -0.32
24 4 49.469 49.554 +.17 8 98.939 98.814 -0.13 12 148.41 148.15 -0.18 16 197.88 197.63 -0.13 20 247.35 247.53 +0.07 24 296.82 - - 3
Not (: s - - --3. This set did not have a range ring for 24 miles.
Pagp 9 of 14 -

18. Effect of Input Voltage Variations on Performance. Canadian Marconi LN66 19. a.c. Power Supply Performance Equipment Model
(Radar J.nput -~a.c.supP~) a.c. Power Supply In~ut out) Radar Parameters
% Val. % Val PRF Po MDS a.c. Vac Aac VA W Pf d.c. Vdc Idc W pps . dbm dbm Note .
input input
-29 82 2.4 197 157 .~ .80 -30 25.2 5.2 131 1271 +22.' -- 4 -24 88 2.61 230 187 .~ .82 -25 27.0 5.8 157 1277 +30. -69 3 -21 94 2.85 271 220 • 81 -20 28.8 6.3 182 1281 +36 • -84 2 . -16 98 3.0 294 235 .80 -15 30.6 6.6 202 1284 +37. -89 -10 104 3. '. 322 255 .79 -10 32.4 ·6.65 216 1284- 37.4 " - 4 111 3.1 344 272.~ • 79 -5 34.2 6.7 229 1284 +37 • "
0 116 3.15 366 288.! .79 0 36.0 6.7 241 1284 " " 5 +5 122 3.18 388 300 .77 +5 37.8 6.7 253 1284 " " +8 125 3.2 400 317 .' .79 +10 39.6 6.8 269 1284 " " +16 134 3.28 439 342.' .78 +15 41.4 6.8 282 1286 " " +20 139 3.31 461 360 .78 +20 43.2 6.82 294 1286 " II
+24 144 3.35 482 315 .78 +25 45.0 6.88 310 1286 " " +31 152 3.42 520 400 .77 +30 46 •. 8 7.0 328 1287 +38.( "
Notes:
1. See Appendix A for test procedure
2. Sweep started ~" from centre of PPI
3. Critical d.c. voltage (27.5v). Slightly over yields Po 3db down but slightly lower Po drops off rapidly to +22.5 dbm at 25.2 Vdc (-30%).
4. Display inoperative.
5. Using +6% taps on power supply and a.c. input adjusted to give 36.0 Vdc output - See note 2 on page 6 for detailed comment.
6. The a. c. power supply did cot introduce any impairment in regulation as output variations conformed almost exactly to input variation (within 1%) hence d.c. output has same % regulation as line regulation.
Page --1n-of }4._ .

Canadian Marconi LN66 Equipment '1odel
20.0 Field Tests
.1 Maximum Range Stern aspect - No reflector Bow aspect - No reflector
Stern aspect with SC3 reflector Bow aspect with SC3 reflector
.2 Minimum Range
20.3 Resolution
.1 Range
.2 Azimuth
.4 Bearing Accuracy
Run 111
2.·7 m1. 3.0 m1.
4.1 mt. 4.3 m1.
54'
59.6'
1.60
Better than :tlo
Run 112 Spec. Notes
3.9 m1. 1,2,6
- 3
12 m1. 4. 5 m1. 5
60' 6,8
60' 6,8
1.90 7
±10 6,7
.
1-------. ___ . _______ -'-____ '--___ --.1. ____ --'-__ ....,
1. Tests were conducted with radar scanner 20' above sea level. Range was measured on an 18' wooden boat with . maximum height 6' above WL except for a temporary wooden mast on which a Radar Reflectors Ltd. type SC3 reflector was mounted 20' above WL as required. The boat was tracked well beyond range of last hit in all cases.
2. See BIS ratio v.s. range on page 12 for details.
3. Bow aspect with no reflector not recorded for run #2.
4. Extreme range on run #2 attributed to ducting.
5. Hits first observed at 5 miles for run 82.
6. See Appendix A for test procedure.
7. Applies to 2nd Radar
8. Values for 2nd. radar
Minimum range 60' Range resolution 35'
.J.Lof ...!.L

a OM ...,
Canadian Marconi LN66 F.C]ui pn1l'llt 'lode 1
20.1 Maximum Range (Cont'd
o
1
o 1
Run No 1 -----
234 Range Nautical Miles
Date July 10/70 time: from 1200
5
to 1500
Temperature 70oF. -~-"-'----
Visibility 25Mi1es Wind Light S. W.
Relative Humidity ______ _ Sea State 2 - Slight
6
Notes: (a) (b)
Stern aspect - no reflector Bow aspect - no reflector
(c) Stern Aspect - with reflect r (d) Bow Aspect - with reflector
~ 0.5 c: <\I (J
(J)
0.. OM .-4 !Xl
o o 2 6 Range Nautical Miles
8 10
Run No 2 ----:;;:...--- Date July 14/70 time: from 1520 to 1800
T 65 0 F. emper a tu re --"-':...---..;. __ Visibility Unlimited Wind Light Breeze S.W.
12
Relative Humidity ______ _ Sea State (1 - Smooth - Slight Swell~
Notes: (a) Stern aspect - no reflector (c) Stern ~spect - with reflector
On return (bow aspect) first echo observed at a range of 5 miles with no hits whatever between 5 and 12 miles. Data not recorded on balance of the run between 5 and 0 miles. Extreme range on outward run attributed to ducting.

Canadian Marconi LN66
Equipment Model
21.0 General Comments
.1 Installation - Installation of the LN66 is straightforward, and can be carried out by any competent technician by following the instructions, which are very explicit. The complete radar is comprised of four units: the display, T/R scanner, and rectifier. The rectifier unit connects to the T/R un-it by a two conductor cable, the T/R and display units are interconnected by means of a 36 conductor cable while the T/R unit connects to the scanner by a waveguide run and a single 12 conductor cable. Operation from 110/220 V a.c. requires the use of the rectifier unit, while the set operates directly from nominal 12 (13.6), 24 (26.4), or 36 V d.c. ±20%, by changing plug-in adaptors and one resistor •
• 2 Mechanical Construction - The display and T/R units are both constructed of medium gauge metal making the units relatively light weight but sturdy. The scanner unit is of cast construction, very rugged and quite heavy. The display unit cover was hinged for easy access, but the T/R unit cover fitted so snugly it was difficult to remove •
. 3 Servicing-
.1 Display Unit - By releasing two pressure clamps th~ front portion of the display unit hinges down which provides easy access to the printed circuit boards and preset controls. The printed circuit boards are of the plug-in type, held in place by 4 screws, and all component parts are clearly labelled with their circuit designations. The boards are well spaced, easily accessible and could be changed quite quickly •
• 2 T/R Unit - This unit's cover removes upon the release of two pressure clamps, whereupon the klystron, crystal, and several test points are accessible. The modulator is further encased in a metal housing which must be removed before servicing. This unit is not as accessible as the display unit for servicing •
• 3 Scanner Unit - Removal of 4 screws in this unit provides access to the antenna drive motor and gear box, the synchro generator and heading marker switch .
• 4 Operator Convenience - The orange phosphor 10" diam~ter difiplay is visible through slightly washed out under lighting conditions in our trailer, but provided an excellent display in semidarkness or with the viewing hood in place.
Some light filtered in around the hottom of the viewing hood, which could obscure weak signals in the presence of strong sunlight.
Page --1.L of-l1L-

~.--------------------------------------------------------~ Canadian Marconi LN66 Equipment Model
21.4 General Comments - Cont'd
The bearing cursor was difficult to use since it was positioned about 3/16 inch from the bearing scale, which made it difficult to take an accurate bearing. The edge lighting of the top panel p1exig1ass for control name illumination partly obscured the PPI image for about 1 1/4 inches in from the edge, which required that the control illumination be kept very low. '
Page ..l,L..Of-li.
•
...
MARINE ELECTRONICS EVALUATION PROJECT
- RADAR -
Conducted Jointly
by
CANADA DEPARTMENT OF FISHERIES & FORESTRY
and the
COLLEGE OF FISHERIES, NAVIGATION, MARINE ENGINEERING
and ELECTRONICS
July - August 1970
Test Results For Plessey Radar Ltd. MR12
flli:aali:~ Badal: I,td :t:m 12 (':CJui pment ~odel
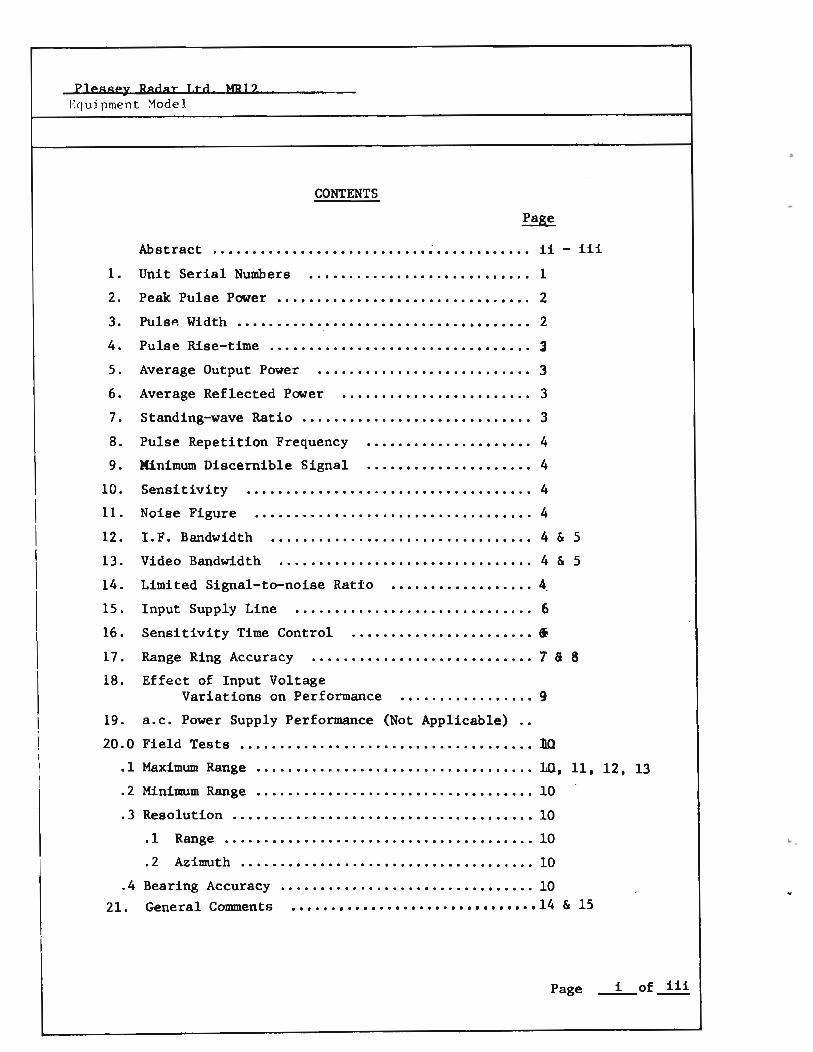
CONTENTS
Page
Abstract . . . . . . . . . . . . · ........... · ..... · ......... ii - iii
1. Unit Serial Numbers · .... · ......... · .. · . · ... · ... 1
2. Peak Pulse Power · ... · .... · .. · ...... · .. · . · ... · ... 2
3. Pulsp. Width · .... · .... · ..... · . · .. · . · .... · ........ 2
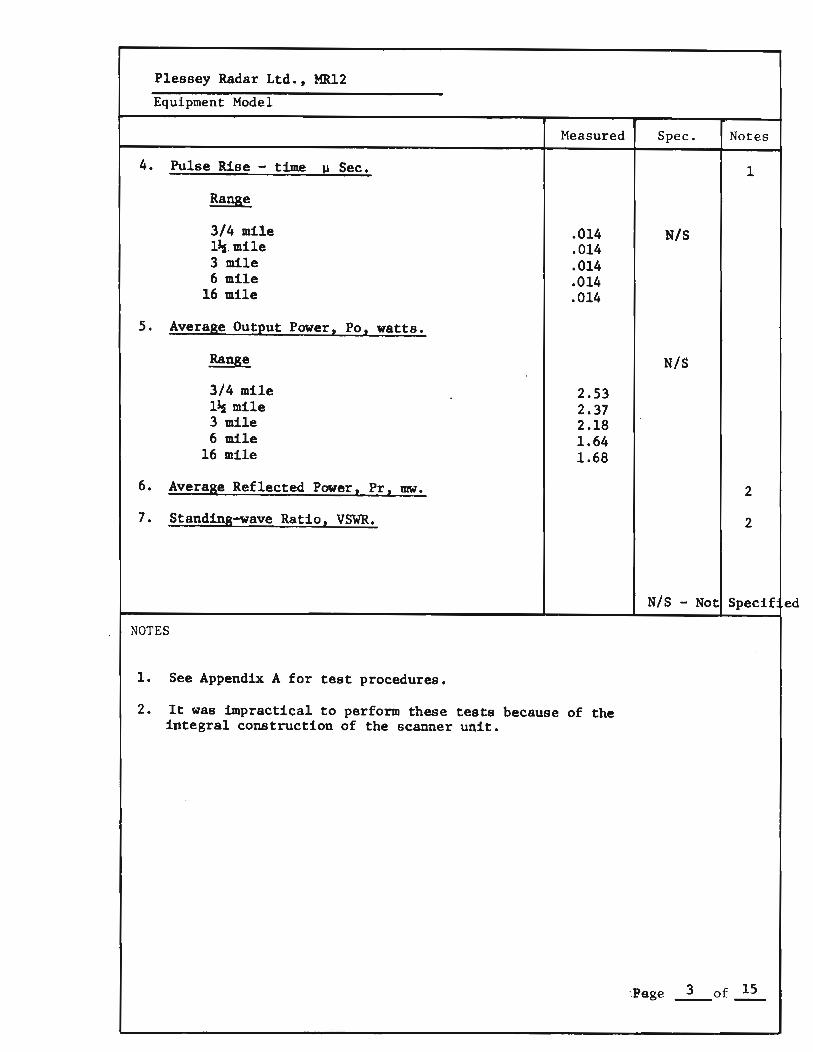
4. Pulse Rise-time · .... · ....... · ..... · ... · . · . · ... · . l 5. Average Output Power · . · .. · . · ..... · . .. · ... · ... · . 3
6. Average Reflected Power . . · .. · .. · . · ....... · . · . · . 3 7. Standing-wave Ratio · ...... · ..... · ........ · ...... 3
8. Pulse Repetition Frequency · .. · . · . · ... · . · . · ..... 4 9. Minimum Discernible Signal · .. · . · . · ... · . · . · ..... 4
10. Sensitivity . . . · ..... · ..... · . · ... · . · . · . · ..... · .. 4
I 11. Noise Figure · . · .... · ...... · . · . · ... · . · .. · ....... 4
I 12. 1. F. Bandwidth · .. · ........ · ....... · ...... · ..... 4 & 5 I 13. Video Bandwidth · .......... · . · ... · . · ... · .. · ..... 4 & 5 I 14. Limited Signal-to-noise Ratio · ... · . . . . . · ....... 4.
I 15. Input Supply Line · ...... · ... · ....... · .. · ....... 6
16. Sensitivity Time Control • I
· ....................... 17. Range Ring Accuracy · .. · ........................ 1 Ii 8
18. Effect of Input Voltage Variations on Performance · .............. · . 9
! 19. a.c. Power Supply Performance (Not Applicable) · . I 20.0 Field Tests · . · .... · ........... · ....... · ... · ... · . JlQ I
! .1 Maximum Range · . · .. · .... · ... · .. · . · . · ... · ... · ..... La, 11, 12, 13 .2 Minimum Range · . · .. · .... · ... · . · ....... · ... · ... · .. 10
.3 Resolution . . . · . · . . . · ... · ... · . · . · . · . · . · ... · ... · .. 10 .1 Range . . · . · . · . . . . . · . · ... · . · . · . · . · ..... · . ..... 10 • 2 Azimuth · . · .. · .. · . · .. ..... · .. · ............... 10
.4 Bearing Accuracy · ............................... 10 21. General Comments . . . . . . • . , • , .......•..• , •.•. , , . , 14 & 15
i
Page --L of 11i -

..
Plessay Radar Ltd. MR12
Equipment Model
Abstract
The MR12 is a low priced set which uses a rectangular CRT with an effective area someitlhat greater than a conyentional 9" CRT. The set was very easy to use, controls were conveniently pla~ed but labels were difficult to read. A bright display was one outstanding feature which was found to be very effective since it was comparatively easy to observe a target while simultaneously performing other tasks because it wasn't necessary for the eyes to readjust at intervals to a darkened radar screen. The electronic bearing marker was a useful innovation which eliminated parallax but unfortunately the bearing marker scale was hard to see
o and only the 10 graduations were easily read. Target "blips" were easily visible and a small wooden boat moving at 6 knots would leave a trail clearly discernible on the shortest range, even under quite high conditions of ambient light. Provision of range rings at 1/8 mile intervals on the shortest range was an excellent feature. Peak output power varied with the range in use giving a minimum of 2.49 Kw on the 16 mile range and a maximum of 3.16 Kw on the 3 mile range whereas the specified value was 3 Kw on all ranges. Pulse width was 36% long on the 3/4 mile range, 18% long on the 1 1/2 mile range but the other values were within 2 1/2% of specification. Pulse repitition frequency was 0.36% high on the 6 and 16 mile range but the error was considerably less on the remaining three ranges.
Noise figure and IF bandwidth weren't measured because it was impractical to gain access to the necessary points in the equipment because of the unit construction of the receiving antenna and the receiver input. Video response was relatively uniform between the -3 db points which occured at 0.26 KHz and 700 KHz but no value was specified for video banclwidth. This set had a logarithmic IF amplifier which eliminates the need for an STC control~as used on other sets. The power required was 245 VA which was very near specification which was 240 VA.
The specified range ring accuracy of ±l% was met on all but the two shortest ranges where the error was + 1.1% on the 1 1/2 mile range and + 4.3% on the 3/4 mile range.
The set performed very well for input voltage variations of ± 30% but it 'iasn't practical to measure MDS, however performance was monitored on an 18 foot wooden boat at a range of 1 mile. There was no observable changes in the echo from the boat or at any other point in the display for the voltage variation of ± 30% except for a slight decrease in PPI intensity when approaching - 30%. Pulse repitition frequency was constant over the full range of input and power output dropped by only 0.2 db at - 30%. The excellent regulation of this radar would make it a good choice for applications where the main supply was of unaVOidably poor regulation.
Page --!L of.....!!!
~------.-----------------------------------------------------------------, Plessey Radar Ltd. Mal2
Equipment Model
Abstract Conttd
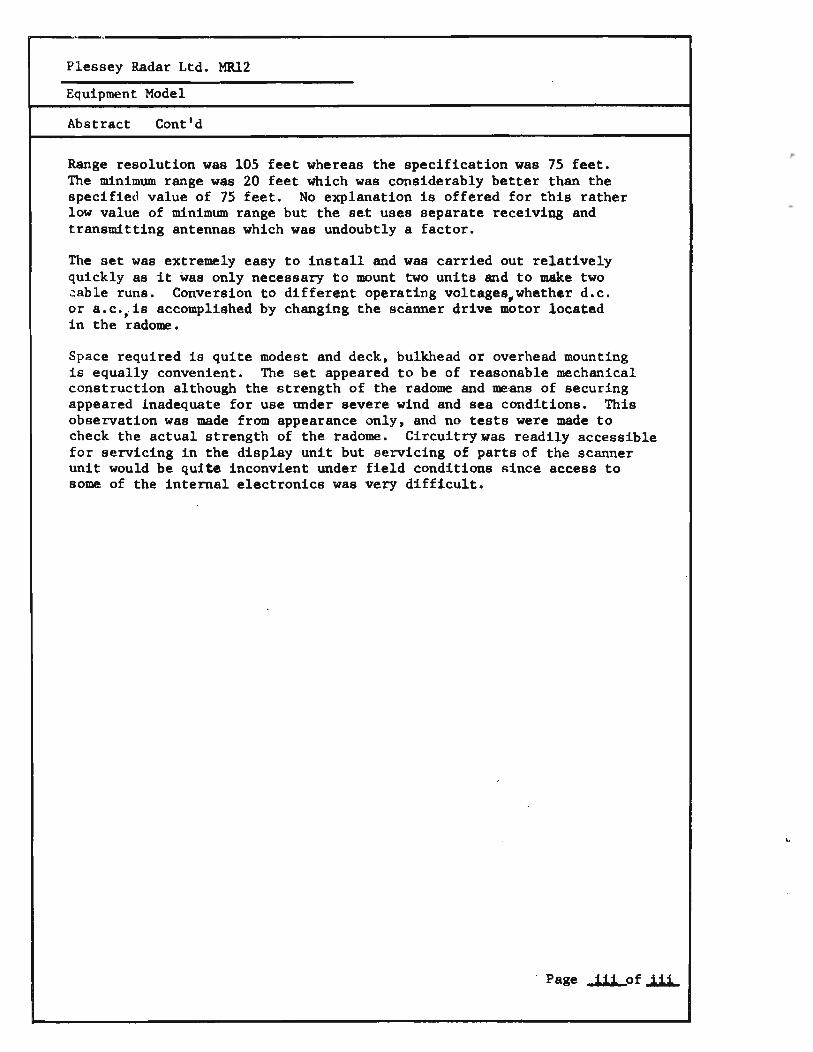
Range resolution was 105 feet whereas the specification was 75 feet. The minimum range was 20 feet which was considerably better than the specified value of 75 feet. No explanation is offered for this rather low value of minimum range but the set uses separate receiving and transmitting antennas which was undoubtly a factor.
The set was extremely easy to install and was carried out relatively quickly as it was only necessary to mount two units and to make two ~able runs. Conversion to different operating voltages_whether d.c. or a.c.,is accomplished by changing the scanner drive motor located in the radome.
Space required is quite modest and deck, bulkhead or overhead mounting is equally convenient. The set appeared to be of reasonable mechanical construction although the strength of the radome and me·ans of securing appeared inadequate for use onder severe wind and sea conditions. This observation was made from appearance only, and no tests were made to check the actual strength of the radome. Circuitry~as readily accessible for servicing in the display unit but servicing of parts of the scanner unit would be quite inconvient under field conditions Rince access to some of the internal electronics was very difficult.
. Page .JJJ...of.JJJ..
,.
P1essey Radar Ltd. MR12
Equ i pment Hodel
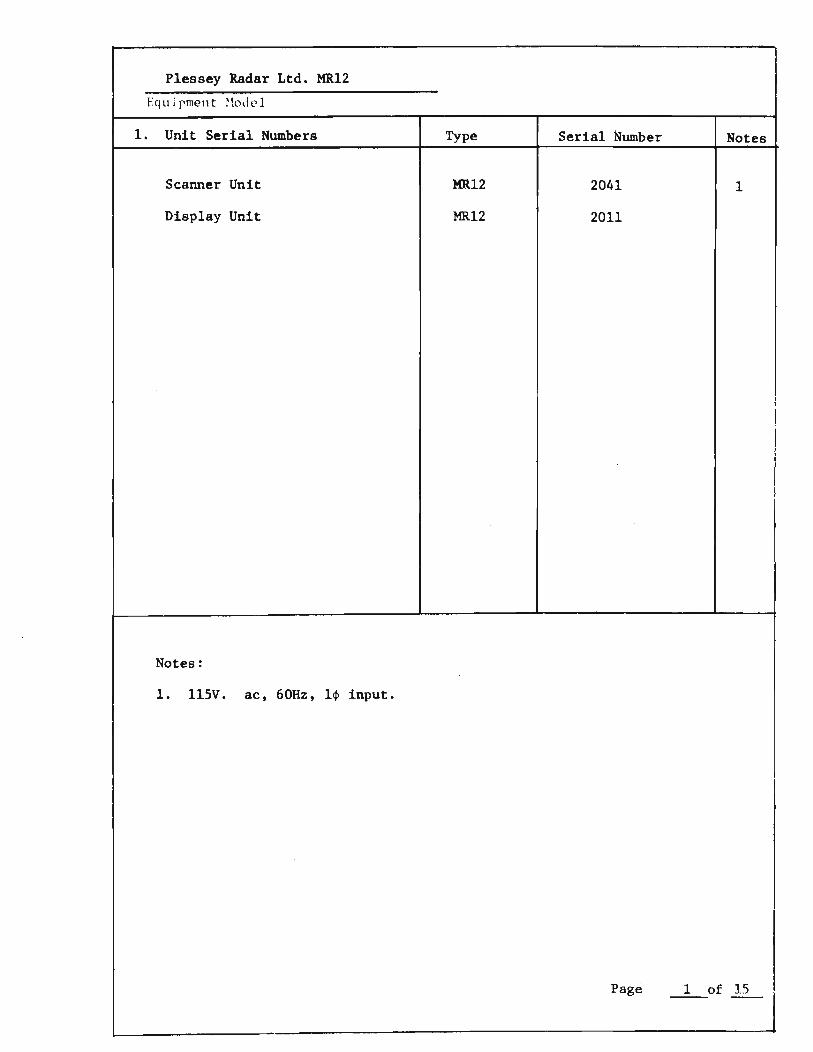
l. Unit Serial Numbers Type Serial Number Notes ,
Scanner Unit MR12 2041 1
Display Unit MR12 2011
I I i
!
Notes:
l. ll5V. ac, 60Hz, 1~ input.
Page 1 - of 15
I
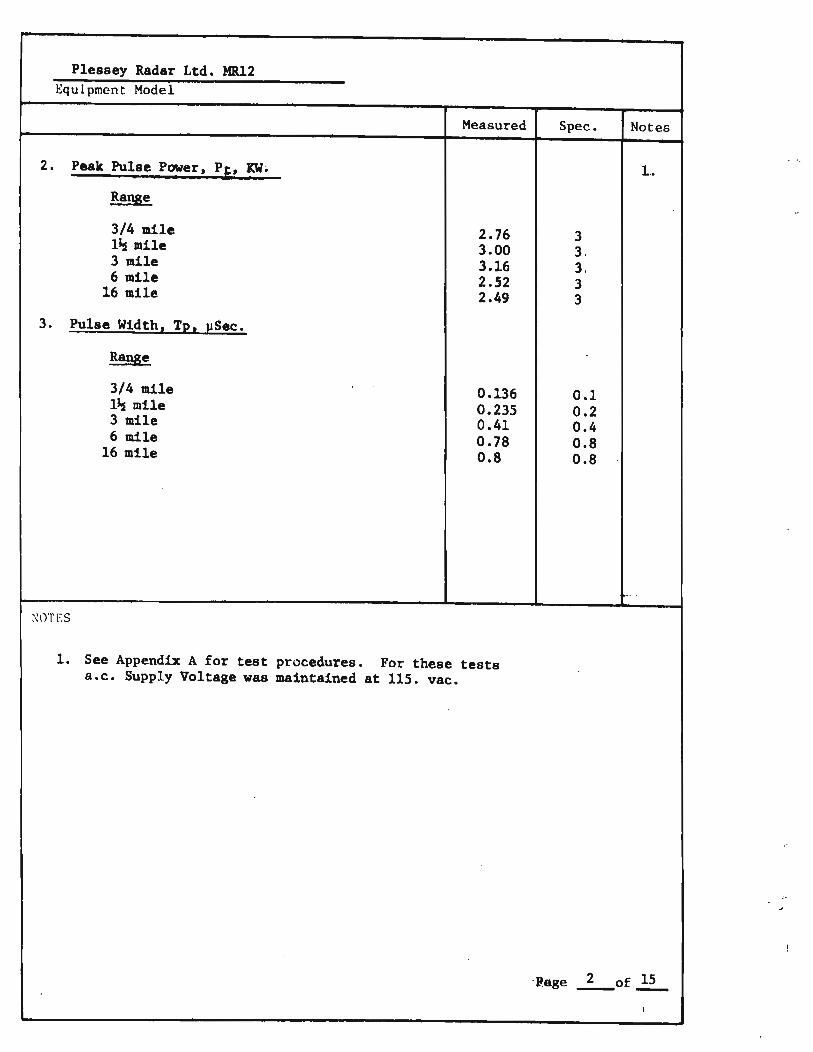
P1essey Radar Ltd. Mil 2 ~:qulpmcnt Model
Measured Spec. Notes
2. Peak Pulse Power, P,&, I(W. 1..
Range
3/4 mile 2.76 3 1~ mile 3.00 3. 3 mile 3.16 3. 6 mile 2.52 3 16 mile 2.49 3
3. Pulse Width, Tp, lJSec.
Range
3/4 mile 0.136 0.1 1~ mile 0.235 0.2 3 mile 0.41 0.4 6 mile 0.78 0.8 16 mile 0.8 0.8
...
~WTES
1. See Appendix A for test procedures. For these tests a.c. Supply Voltage was maintained at 115. vac.
'P.age 2 of 15 --I
Plessey Radar Ltd., MR12
Equipment Model
Measured Spec. Notes
4. Pulse Rise - time II Sec. 1
Range
3/4 mile .014 N/s l~. mile .014 3 mile .014 6 mile .014
16 mile .014
5. Average Output Power, Po, watts.
Range N/S
3/4 mile 2.53 l~ mile 2.37 3 mile 2.18 6 mile 1.64
16 mile 1.68
6. Average Reflected Power, Pr, lDW. 2
7. Standing-wave Ratio, VSWR. 2
N/s - Not Specif ed
NOTES
l. See Appendix A for test procedures.
2. It was impractical to perform these tests because of the integral construction of the scanner unit.
~P8ge 3 of 15 - -

PlesseI Radar Ltd. MiU2 Equipment Model
Measured Spec.
8. Pulse Re2etition FreguencIa Fra PPS.
Range
3/4 mile 6724 6720 1~ mile 3369 3360 3 mile 1685 1680 6 mile -. 843 840
16 mile 843 840
9. Minimum Discernible Signal, MOS, dbm. N/S
10. SensitivitI, Pr, dbm. -94.2
11. Noise Figure, N.F., db. 9 db
12. I.F. Bandwidth. BWI MHz. 12. KHz
13. Video Bandwidth. l3db (100 KHz Reference) 0.26 KHz 700 KHz
14. Limtted Sisna1-to-Noise Ratio l ~S/N~ lim. db. 25.2
NOTES
1. See Appendix A for test procedures.
2. These tests not carried out because it was impractical to attempt to gain access to the necessary points in the equipment.
3. See page 5 for video response curve.
4. Calculated from specified values of Bw and N.F.
Notes
1
2
2, 4
2.
2
1, 3.
1
'Page ,.L..of U-•.
J. , ." .........

"" -'-- - -
~-
I ' ~~. 1-"
I::: '1" I I he . ..
. !
" ' .. I'" j::.: '-- I - I - ,-I-
100Hz
Video Bandwidth
-- 1--1-- . r-=:I. . I . r-
I ' "-,:1 '- 1- .. ., I ·
, I"" 1-'- ,re
r- " -1- . I-
t::-~ r= I I t- ,
. t:: :::: t,: I ~ ; t-~~:: ,
1 KHz
. I
;i
I ! . ! .
I !
...
I -; F ..
:
: I ,
]'- .
! i I . I
I.f. Bandwidth
t::~li' ! + , tJ I·- - i -- I Ii ,
,. : -h
. ~:~ !f[ I :' I . iT! . I L'
, , I " . l .
10 KHz Frequency
, T , .
. , o
Video input at 1 MHz 1.2V pp Centre frequency
Output at CRT 2.4V pp -3db Bandwidth __ _
I.f. input at centre frequency
Output at centre frequency __ _
, . , ,
, .
I :- ..
100 KHz
, ,
,;" .
,. ,
, , ,',
"
, 17i-:, _,C ' l- ----t- · I · :1: '., ,'.
, .
, ,
' .
, .. , " : ' J 1-' 1-.'
"
1 MHz l.f. Bandwidth
0-W
., ... 00
8 '" • " ~ ". 00 go
0-.., ~ · .. · '" • ~ ". 00
" ".
Frequency MHz
lOMHz
~ .. 0-• ". • i • ~
" " '" i!'~ 00' . " 0-,...
" 0. · ili ~
N

P1essey Radar Ltd. MR12
Equipment Model
Measured Spec. Notes
15. Input Supply Line. .
input volts, a.c. 115 115 ± 10% 1,2 input amps, a.c. 2.13 N/S input volt-amps. a.c. 245 240 input watts 183 N/S power factor .75 N/S
16. Sensitivity Time Control N/S 3
IN/s - Not ~ pecifie ~
NOTES
1. See Appendix A for test procedure.
2. Results taken on 6 mile range with scanner disengaged. ,
3. Not applicable to this radar.
-Page 6 of 15 - -
Plessex Radar Ltd. MR12 Equipment Model
17 RANGI-~ RING ACCURACY
Range Ring % VRM % Error Error N() t l>~ N.M.
N. Hi. pS Meas jlS pS Meas ~l S
3/4 1/8 1.5459 1.948 +26 1,2 1/4 3.0918 3.493 +13 3/8 4.6378 5.038 +8.6 1/2 6.1837 6.583 +6.5 5/8 7.7296 8.128 +5.2 3/4 9.2755 9.673 +4.3
1~ 1/4 3.0918 3.298 +6.5 1/2 6.1837 6.3877 +3.3 3/4 9.2755 9.4774 +2.2 1 12.367 12.567 +1.6 1~ 15.459 15.657 +1.3 1~ 18.551 18.747 +1.1
3 1/2 6.1837 6.381 +3.2 t 1 12.367 12.560 +1.6 !
1~ 18.551 18.739 +1.0 2 24.735 24.9l8 +.74 2~ 30.918 31.097 +.58 3 37.102 37.276 +.47
6 1 12.367 12.560 +1.6 2 24.735 24.920 +.75 3 37.102 37.280 +.48 4 49.4·69 49.639 +.34 5 61.837 61.999 +.26 6 74.204 74.359 +.21
Notes . - _._-1. See Appendix A for test procedures.
2. Specified accuracy is ±1% on all ranges. This specification was met on all but the two shortest ranges where the error was +1.1% on the 1~ mile range ring and +4.3% on the 3/4 mile range ring.
Pag(> 7 of~ -

PlesseI Radar Ltd. MR12 Equipment Model
17 RANGE RING ACCURACY
Range Rin~ i. VRM %
N.N. Error Error NotC's N. Hi. uS Meas llS liS Heas uS
16. 2 24.735 24.905 +.69 4 49.469 49.628 +.32 6 74.204 74.351 +.20 8 98.939 99.073 +.14 10 123.67 123.80 +.10 12 148.41 148.52 +.08 14 173.14 173.24 +.06 16 197.88 197.96 +.04
~ : I) l "s - . .
Page 8 of 15 - -

18. Effect of Input Voltage Variations on Performance Plesse~ Radar Ltd. MR12
Equipment. Model
a.c. Power Supply Input Radar Parameters
% Vi!l a.c. PRF Po MIlS input Vac. Aac VA W Pf PPS dbm dbm Note
-30 81 3.15 255 210 .82 843 1+33. t 2,3,~ -25 86 2.70 232 195 .62 843 ~33. -20 92 2.47 227 185 .82 843 1+33. -15 98 2.28 223 183 .82 843 1+33 •• ,
-10 104 2.24 233 180 .77 843 1+33. : -5 109. 2.20 240 180 .75 843 f+33. :
0 11S: 2.13 245 183 .75 843 f+33 •. +5 121 2.15 260 185 .71 843 1+33.
+10 121 2.13 271 186 • 69 843 ~33 • +15 132 2.14 283 189 .66 843 +33. +20 138 2.15 296 190 .64 843 +33 . +25 144 2.20 317 195 . 62 843 +33. +30 150 2.27 341 203 .60 843 +33.4
1. See Appendix A for test procedure.
2. Values measured on 6 mile rS.nge wi th scanner dis-engaged. Tests were repeated with scanner engaged s.nd all readings re-taken except PRF and Po. Since there W8.S no signi.ficant difference between the readings only one set of values are given, (the difference in a.c. current input did not exceed 2~ when SC8.nner engaged).
3. MDS wasn't measured because it was impractical to gain access to the necessary test points, however, performance was monitored on an 18' wooden boat at a range of 1 mile. There was no observable change in the echo from the boat or at any other point on the display for voltage variations between -30% and +30% except for 8 sltght decrease in the display inten~jty when approachir~ -30% line input, (81 Vac.)
4. Drive motor stalled at 77 volts with scanner enga.ged or disenga.ged, however radar conti.nued to operate above this voltage.

PlesseI Radar Ltd. MR1~ '·.Cjuipment ~10del
Run 111 Rnn 112 R,.,.., 111 D •• _ "I. Notes
20.0 Field Tests 1,2
.1 Maximum Range (miles)
Stern aspect-no ref1ec1 or - - 1.8 2.4 ~7 aspect-no reflecto 1.87 2.35
.Stern aspe r t SC) 5.25 4.8 - -reflector Bow aspect with SC3 4.9 4.65 - -reflector
imeasured ~pecificati ~n .2 Minimum range 20' 75'
20.3 Resolution
.1 Range 105 ' 75' @ 0 5 n.mile
.2 Azimuth 2.70 .30 3
20.4 Bearing accuracy Ibetter H O
th81 '.t1° 4
~---------------.----~------~--------~------~--------~--~
1. Tests conducted with radar scanner 20' above sea level. Range was measured on an 18' wooden boat with maximum height 6' above WL except for a temporary wooden mast on which a Radar Reflectors type SC3 reflector was mounted as required. The boat was tracked well beyond range of last hit in all cases.
2. See Bls ratio vs. range on pages 11 - 13 for details.
3. Measurement made at 9/16 mile. Azimuth resolution taken equal to antenna horizontal beamwidth which is specified as 30 (between half power points).
4. Angular separation measured at 1/2 mile and checked by transit.
Pag'L.!.!L. .0f...J.5...

o oM .j..I
111
PJessey Radar limited MRl? Equipm('nt >1odel
20.1 Kax1~um Range (cont'd)
Run No _ ..... 1 __ _ Date July 22170 time: from 1600 to 1800 ~-
Temperature lOoF Visibility 6 miles Wind 10 - 15
Relative Humidity Sea State 3 - Moderate Sky 6/10 overcast
Notes: (a) f (b) Stern aspect with re lector Bow aspect - with reflector.
5 3 F 1 Z 1
1 J I resne one ... I a ,
l'r-f'rFalfl (-. I "n"l -.J. ~ -t
~+ , + .... i: :' i
, ~' I t·· ~ 1 1-11 - .... - t -
. i.j i~· . . . >. . . f ! L-r~: '~~
j - 1···· l ,1 ~~ I: . - j - .. i ' I. " \- I
~' ;, i i r I ~ t - 'j - .. r' . . I I I I 'I --til ' , ~ -- - ,2 ' r l L .,' I I
~ . 1 ~ ~~ -.-I ' I t I , I I - -- .
- , ~ r-- I .\. . : . j -- !b · I J I III J \ ' ' 1 I - ! I \ 1' I r I 1 11 i I ·1-1 jj' d i I·t ; J . 'r' ~ i -. , : , J l:l i :; t i·', : r i I [ r[fff' rl' f
lr·11f v·\ .. -I J I-+- . "j ~ 0.5
~ ()
CI)
C. 'rl .-4 C!l
o
[ f I ! i I f ~: . - ~~
~ I t · . -"-J -, i t'! : I t t r t .! !! I I· i· ~ I.. ']!~' ! .. __ ,! I I ! - -
~ t - " ' -f - : I 1 . t . f I ' , t f 1, • I I I II i i , 'I ': t
~ ~~ ~tff' ' "
i i' Jt t1ai -r ~ ; lf . ~. (lt~ ! jF~~++ £~ - . r-- ~~j . .+ . i I- U -o 1 2 3 Range Nautical Miles
4 5 6
Run No _-=2 __ _ Date July 22/70 time: from 1040 to 1145 --Temperature 63°F Visibility 6 - 8 Mi Wind 10 - 15 SW
Relative Humidity Sea State 3 - Moderate. 'Sky 10/10 Overcast
Notes: (a) Stern aspect - with reflector (b) Bow aspect - with reflector
See Page 12 For Comments
Page -1.L of~
. \
I I
I I I I I ! I I I I
Plessey Radar Limited MR12 I':CJ u i ptne n t :-1od c ]
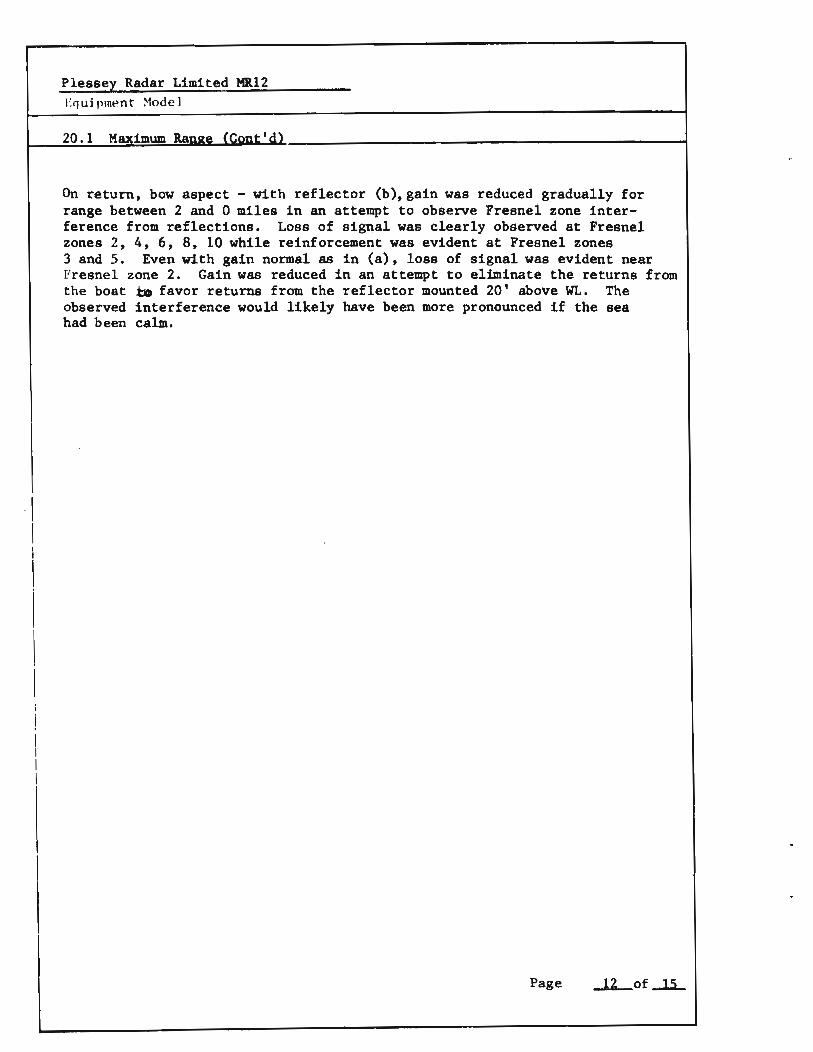
20 • 1 Maximum Ranae (Cont' d)
On return, bow aspect - with reflector (b), gain was reduced gradually for range between 2 and 0 miles in an attempt to observe Fresnel zone interference from reflections. Loss of sig~al was clearly observed at Fresnel zones 2, 4, 6, 8, 10 while reinforcement was evident at Fresnel zones 3 and 5. Even with gain normal as in (a), loss of signal was evident near Fresnel zone 2. Gain was reduced in an attempt to eliminate the returns from the boat to favor returns from the reflector mounted 20' above WL. The observed interference would likely have been more pronounced if the sea had been calm •
Page ...lL.of ...l5-.

o .,-1 ~
,F] esse¥ Radar J.imi ted....MlU.2_ . _____ _ Equipmpnt ~ode]
20.1 Maximum Range (Cont'd.)
1
3 Run No ----- Date July 23/70 time: from 1600 to 1652
Temperature _ ..... 6""'O_oF'"--_ Visibility 2~ Mi. Wind NW 10 - 15
Relative Humidity ------- Sea State 3 - Moderate
Notes: Sky 10/10 Overcast slight mist. (a) Stern aspect - no reflector (b) Bow aspect - no reflector. Rain squall passed over during test which may account for reduced range.
Li l~ .i \ : I -~- 1 : Ill] f lJ--n !~ -1+- t--~-l- -- 't-- --:1-.1 -jl T - - 1-- - 1;- " ~- -t- --:l:\ -.. +L' it ~ -- ft I j~ J~' ! I- 1-11- -l- I ~"I- ,~ if.t ~ . ~t; 1- -" -, -- l f -It t
" -\ I" j b, ~ t . i r 1 - r t I ! I I '-t- .. -, " t- -t t- " I .. -j- j I: t--t- ! I tl : I ,; t ! j t' -l~ i - j1 ~"11, -j - , ~ > - .r , t - t ' , " ---~ ; i' I tt I !! ! ~ ~ \ ~ -t -,t I' - ' ! IJ,1-,_l' ~ -+ , ~ +- , ~'i - - J - I
,11 iii: l J I- I:' "J.~'l~', l l'- t ['I" J l. ~ I!) ' " '-:t,' , ~t(i J +- , I '" 1- 'r' -~ .. ' tl 0.5
~ u til
p,. .,-1 .... ~
o
- L ~ -J-~,I I I l' , ,j r ~ ~I:L' I f j , 1 I' - j , - 1 j 1- " t ;:f l-t',l i ,1[, ( [/I'! r', ,f ,. ~R Jr,,;~' j tt:'j:I'- ~ -r : j+'-:" " jl:~ :' -t - ' -J I ~ ' ,q ~ , I, j I I I ' I . IIfj ! ! " t~- -+ , - " r ' -- -, ' I I : -t : \' i i , I ! !; ; t I f, '! ' \ I' ._, , -!'--' ' j - ' f I 1 t" -' j i i 1 t ! 1- I I !' - r : t i : i " T' -~ t- .. -.. , 't.. i i
[) 1 2 3 4 5 6 Range Nautical Miles
Run No 4 Date July 28/70 time: from 1630 to 1700
750 F. Temperature ____ _ Visibility 5 miles Wind SW 10 - 15
Relative Humidity ______ _ Sea State 3-Moderate
Notes: Sky 10/10 thin haze. (a) Stern aspect - no reflector. (b) Bow aspect - no reflector.
The objective of run #4 was to determine maximum range - hence readings not recorded for range 0-1 mile. Page --1L of-1L

Plessey Radar Ltd. MR12 Equipment Model
21.0 General Comments
.1 Install~ - The MR-12 was extremely simple to install, _ requiring only eight mounting screws for the display unit and 6 bolts for the scanner unit. Conversion for 12, 24, 32, 110, 220 V dc or 115, 230 V ac is carried out simply by changing the drive motor in the radome. -Only two cable runs are required, one from ships supply to the radome and one between radome and display unit. No waveguide installation is required. Space required for the rectangular display unit is quite modest, thus making it simple to install even in the smallest wheelhouse. Deck ,bulkhead , or overhead mounting is equally simple as the display unit is free to pivot on its mounting bracket •
. 2 Mechanical Construction - The basic frame of the display unit is cast light alloy, enclosed in a plastic housing which is easily removed for servicing. The antenn~ unit is constructed of cast light alloy, housed in a plastic radome which may be simply raised for maintenance purposes. The radome was held in place only by a plastic securing ring around the bottom of the radome gnd it appeared to us that this would be inadequate under severe wind and sea conditions. This observation was made from appearance only and no tests were made to check the actual strength of the radome •
. 3 Servicing - The MR12 Scanner Unit contained the modulator, transmitter and IF amplifier in an integral unit. The unit was provided with a switched meter for monitoring - Xtal current, magnetron current, d.c. and a.c. voltages when setting up the system and also contained several test points. Access to the internal electronics however was very difficult and would provide a real problem for the serviceman under field conditions. The antenna turning mechanism was provided with a clutch arrangement so that the scanner could be stopped when necessary for servicing.
The display unit contained 3 plug-in printed circuit boards, held in place with machine screws. The board components were all clearly labelled and several test points were provided as an aid to easy servicing. The boards were completely exposed when the cover was removed,thus exposing all the circuitry for servicing •
. 4 Operator Convenience - The MR12 was very easy to use, and would present no problem even to the relatively inexperienced operator. Controls were conveniently placed but the labels were difficult to read. The PPI display was rectangular in shape with a total viewing area of 70 sq. inches which is somewhat greater than a 9 inch circular CRT. One outstanding feature is the use of a bright display which enables the radar to be viewed in comparatively bright light without requiring a viewing hood. We found this feature to be very effective under the light conditions existing
Page ~of~

Plessey Radar Ltd. MR12
Equipment Model
21.4 Cont'd
for the tests (approximately 30-50 foot candles above the display). It was comparatively easy to track a target with this radar while simultaneously performing other tasks, since the whole operation was carried out under the same light conditions and thus it wasn't necessary for the eyes to readjust at intervals to a darkened radar screen.
The use of an electronic bearing marker was a useful innovation, which eliminates parallax and provides a clear precise bearing. Unfortunately the bearing marker dial was hard to see located as it was in the handle. In fact, only the 100 graduations were visible from a normal viewing position and the operator had to bend down and peer forward at an angle to see the 10
graduations. The target "blips" on the PPI were large and easily visible, and the PPI persistence was long enough that a boat moving at about 6 knots would leave a trail clearly discernible on the shortest range even under quite high conditions of ambient light. Provision of range rings at 1/8 mile intervals on 3/4 mile range was an excellent operating feature.
Page -1.Lof~


MARINE ELECTRONICS EVALUATION PROJECT
- RADAR -
Conducted Jo1nt1y
by
CANADA DEPARTMENT OF FISHERIES & FORESTRY
and the
COLLEGE OF FISHERIES, NAVIGATION, MARINE ENGINEERING
and ELECTRONICS
July - August 1970
Test Results for Kelvin Hughes 17/12
Kelvin Hughes 17/12
1':C'j uj pOlen t ~ode]
1.
2.
3.
4.
5.
6.
7.
8.
9.
10.
11.
12.
13.
14.
15.
16.
17.
18.
19.
20.0
.1
.2
.3
.4 21.
CONTENTS
Abstract .............................................. Unit Serial Numbers ................................... Peak Pulse Power
Pulse Width .....
.......................................
. . . . . . . . . . . . .. . . . . . . . . . . . . . . . . . . . . . . . . . Pulse Rise-time ........................................ Average Output Power .••••.•..••••..••........••.•.....
Average Ref lected Power .•.•.••••.•••..••.••.•••••.••••
Standing-wave Ratio ....•••••••.•.•.•...•.•••...•.•....
Pulse Repetition Frequency •.•.•....••..••.•..•.•.•••..
Minimum Discernible Signal . ..................... . Sens! t 1 vi ty ........................................... .
Noise Figure ............................. 1. F. Bandwidth ••••..•.•. . ............................. . Video Bandwidth . ........................... . Limited Signa1-to-noise Ratio •••..•••.••..•..••.•...••
Input Supply Line .................................... .
Sensitivity Time Control •••••••.•••....•.•••••.•.....•
Range Ring Accuracy .................................. .
Effect of Input Voltage Variations on Performance .••••
Transformer Rectifier Performance .••.•••••.••.••...••.
Field Tests .......................................... .
Maximum Range
Minimum Range
Resolution
.1 Range
.2 Azimuth
Bearing Accuracy
General Comments
.....................
............................... ...................................... ............................. , ..... ".,
Page
ii - iii
1
2
2
2
2
3
3
4
4
4
4
4 & 5
4 & 5
4
6
7
8 & 9
10 & 11
11
12, 13,
12
12
12
12
12
16
14, 15
Page i of iii

Kelvin Hughes 17/12
Equipment Model
Abstract
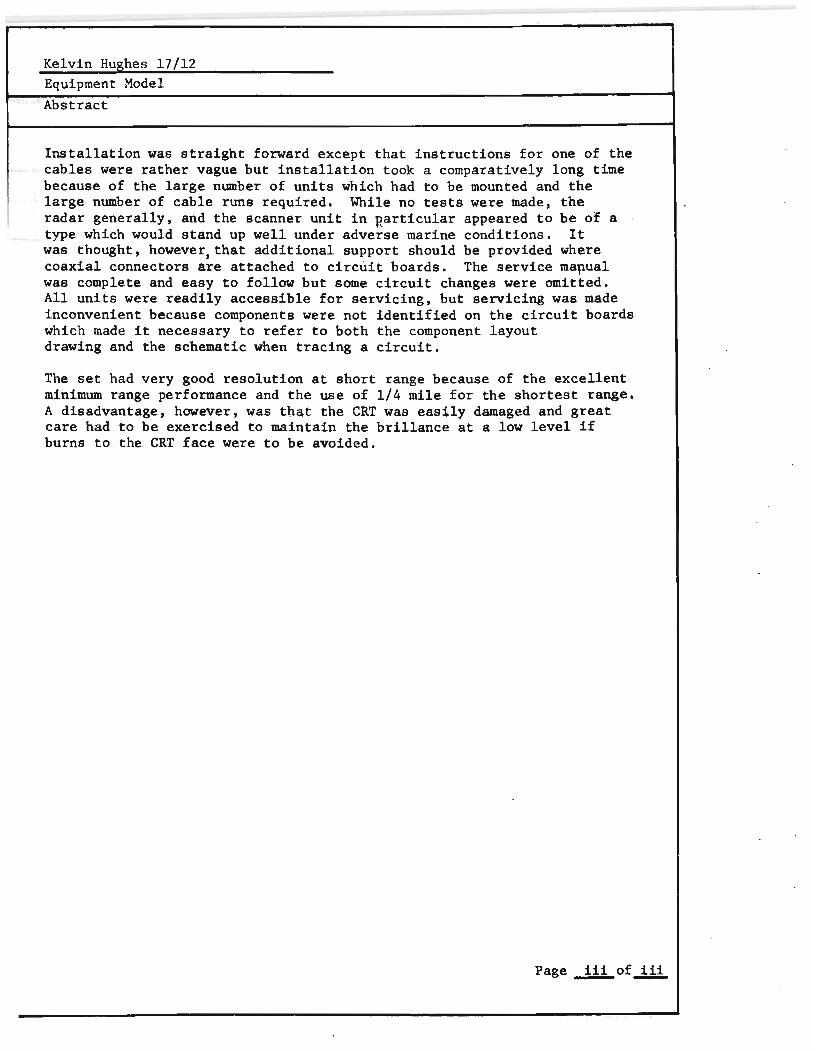
The Kelvin Hughes 17/12 is a medium priced set which had the largest PPI ( "D ' 12 .) of the radars tested. The 12 inch PPI was large enough for easy viewing and provided a very clear and detailed radar presentation. The controls were well placed, permitted full adjustment of the display and the orange phosphor used on the PPI was the least tiring to the eyes. Everything considered, the 17/12 was a very satisfying radar to use. Peak power was well above the 3Kw specified. Output varied from 3.94 Kw on long pulse to 4.21 Kw on short pulse. Pulse width was 10% shorter than specification on both medium and long pulse but was 27% longer on short pulse. Pulse repitition frequency was 1% high on low rate and 1.5% high on high rate, however this was very dependent on line input variations.
Both noise figure and IF bandwidth measured near the specified value -noise figure being 1 db low while IF bandwidth was 1 MHz high. The video amplifier response was poor below 20 KHz and the high frequency -3 db point occured at 7 MHz whereas the specification required 12 MHz, however the choice of reference freq. makes considerable difference in reporting the bandwidth of this particular amplifier.
The STC control was very effective and when fully "On", attenuation began at 9800 yards, rising to 59 db at 190 yards.
The range ring accuracy of ± 1.5% was met on all range rings except for the quarter mile rings on both the 1/4 and 1/2 mile ranges. The error was greatest on the 1/4 mile range where it measured as + 2.7%. The variable range marker, which was judged to be a very effective operating convenience, was within specification on all but the half mile rings on the 1/2 and 3/4 mile ranges. Some backlash was apparent in the VRM scale mechanism when making a reading downscale which introduced appreciable errors. The scale gave consistently good results, however, when approaching a reading up-scale, a practice which was adopted throughout the test period for all range measurements using the VRM.
The set performed very well for input voltage variations of -20% to +30% but other than a reduction in MDS the set continued to perform at -30% input where MDS was reduced by 23 db but the set could be retuned by the front panel tune control to give -92 dbm, which was only 2 db below the nominal value. Power output was reduced only 2 db at -30% input while PRF was very dependent 'on input voltage, dropping 40% at -30% input and increasing by 12% at +30% input. The transformer rectifier, required for operation on a.c., had poor regulation, for example an input voltage drop of 14.5% resulted in an output drop of 20%. The rectifier would, however, be adequate for most installations, because of the excess of actual regulation above specification.
Range resolution was 47 feet whereas the specification was 60 feet. Minimum range was 36 feet which was considerably better than the specified value of 60 feet. Both az~uth resolution and bearing accuracy were slightly better than specification.
Page ...JJ.....of.JJJ..
--, -
Kelvin Hughes 17/12 Equipment Model Abstract
Installation was straight forward except that instructions for one of the cables were rather vague but installation took a comparatively long time because of the large number of units which had to be mounted and the large number of cable runs required. While no tests were made, the radar generally, and the scanner unit in Rarticular appeared to be of a type which would stand up well under adverse marine conditions. It was thought, however, that additional support should be provided where coaxial connectors are attached to circuit boards. The service ma~ual was complete and easy to follow but some circuit changes were omitted. All units were readily accessible for servicing, but servicing was made inconvenient because components were not identified on the circuit boards which made it necessary to refer to both the component layout drawing and the schematic when tracing a circuit.
The set had very good resolution at short range because of the excellent minimum range performance and the use of 1/4 mile for the shortest range. A disadvantage, however, was that the CRT was easily damaged and great care had to be exercised to maintain the brillance at a low level if burns to the CRT face were to be avoided.
Page ...!!!..of..!!!.
. .' • 0 ... ·

Kelvin Hughes 17/12 ECJlI i pmt'n t HodC'l
1. Unit Serial Numbers Tvn~ S~rial Nllmh~r N'nt- ....
Transmitter TX2 X22933
Display D17 172933
Transformer Rectifier SMR-A1024/3 1630 1
Motor Alternator (ll0V de) ZY105~22 3723
Motor Alternator (32V de) Z1398 2894
Antenna and Turning
Mechanism TM4 A652l5
Antenna Motor (110V de) ZY304/l7 CBYS472/28
Antenna Motor (32V de) TENT S0473P
Aerial (7' .,.. 6") 71
Notes:
1. Transformer Rectifier used with 110V de Hotor Alternator.
Page -l...- of...1.§...

Kelvin Hughes 17/12 Equipment Model
Measured Spec. Notes
2. Peak Pulse Power l Pt, Kw
long pulse 3.94 3 1, 2 medium pulse 4.09 3 short pulse 4.21 3
3. Pulse Width l TEz ~sec
long pulse 0.450 0.50 1 medium pulse 0.180 0.20 short pulse 0.076 0.06
4. Pulse Rise-time z l:!sec
long pulse 0.028 N/S 1 medium pulse 0.032 N/S short pulse 0.032 N/S
5. Averase OutEut Power I PO a Watts
long pulse (+33.15 dbm) 2.06 N/S 1 medium pulse (+32.35 dbm) 1.72 N/S short pulse (+28.75 dbm) 0.75 I N/S
N/S Not SI ecified
NOTES
1. See Appendix A for test procedure.
2. Calculated from PRF, Pulse width, Tp and average output power, Po.
-Page 2 of~ -
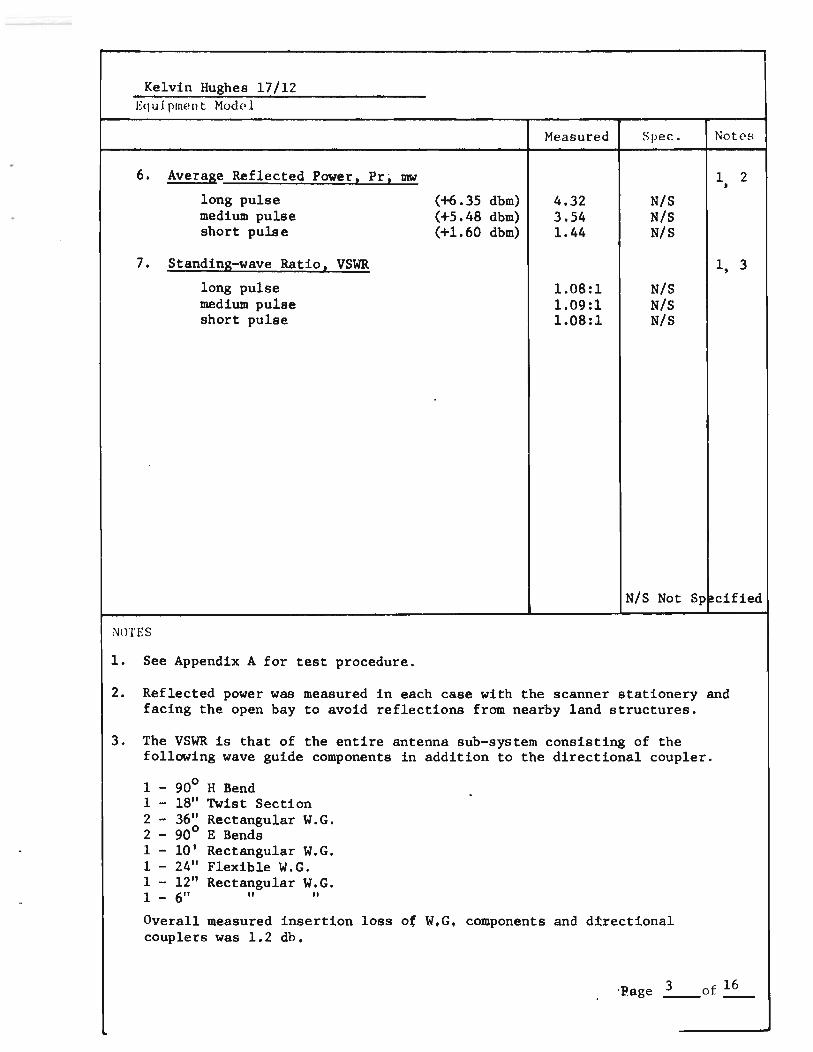
Kelvin Hughes 17/12 Equi pmE'!nt Mod£>l
Measured Spec. Notes
6. Average Reflected Power , Pr; mw 1 2 , long pulse (+6 .35 dbm) 4.32 N/s medium pulse (+5.48 dbm) 3.54 N/s short pulse (+1.60 dbm) 1.44 N/s
7. Standins-wave Ratio z VSWR 1, 3
long pulse 1.08:1 N/S medium pulse 1.09 :1 N/s short pulse 1.08:1 N/s
N/s Not Sp~cified
NOTES
1. See Appendix A for test procedure.
2. Reflected power was measured in each case with the scanner stationery and facing the open bay to avoid reflections from nearby land structures.
3. The VSWR is that of the entire antenna sub-system consisting of the following wave guide components in addition to the directional coupler.
1 - 0 90 H Bend . 1 - 18" Twist Section 2 - 36" Rectangular W.G. 2 - 900 E Bends 1 - 10' Rectangular W.G. 1 - 24" Flexible W.G. 1 - 12" Rectangular W.G. 1 - 6" " " Overall measured insertion loss of W.G. components and dtrectional couplers was 1.2 db.
-Page ~of~

Kelvin Hughes 17/12 Equipment Model
Measured Spec. Notes
8. Pulse Repetition FreguencI 1 Frl PPS 1
3 mile range 2335 2300 12 mile range 1160 1150
9. Minimum Discernible Si~all MDS 1 dbm -94 N/S 1, 2
10. SensitivitI I Pr l dbm -89.4 -90.7 4
ll. Noise Figure, N.Fo 1 db 13.5 <12.5 6
12. 1. F. Bandwidth, BW 1 MHz 13 12 1, 3.
13. Video Bandwidth a ±3 db (Reference 100 KHz) 7.5 KHz 12 1, 5. .to
7 MHz
14. Limited Signal To Noise Ratio - (S/N) lim, db 20.7 N/S 1
N/S Not Sp~cified
NOTES
1. See Appendix A for test procedure.
2. Measured on 6 mile range.
3. See page 5 for I.F. response curve.
4. Calculated from measured and specified values of noise figure and I.F. BW
5. See page 5 for video response curve. Video response was measured by injecting a signal from a nominal constant current generator across the base resistor R97 on receiver unit SMR - A 1046 while simultaneously monitoring output at the CRT Cathode.
6. Measured directly with H.P. Model 340 Noise Figure Meter using X 347A Noise Source
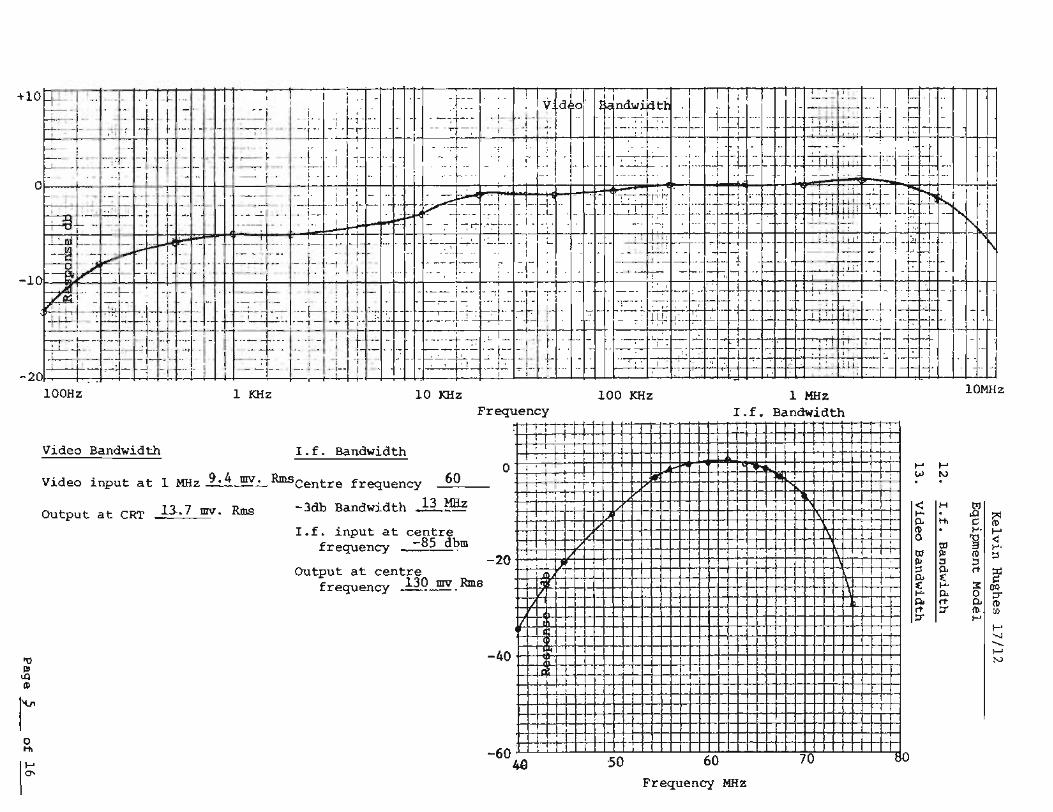
o .. I:;:
100Hz 1 KHz
Video Bandwidth I . f. Bandwidth
•. '::Ih 'c, ~ I i l L '.-~-+ .. " "{ ·l : I .-
... - i - - ..., t - ,-- -: 1" -
.l- l+·I-1 j' ~ , ~.
~' ~.:I' ~ I-. : f i :1-"' ;-tJ-: .. ( : F .t 10 KHz
Frequency
o I' ·
Video input at 1 MHz 9.4.!!!_':.- RmsCentre frequency _6~0i-_
OUtput at CRT 13-. 7 UN. Rms -3db Bandwidth ~~
I.f . input at centre frequency -85 d~m
-20 OUtput at centre
frequency ..!1.CL.!!!!' _ Rms.
-40
-60 4ll
. ,
-,-~- r+r ' , -. - '-:-t-- · ~l ., :- .. - ~ . I ,I . .._ . . ,---------.- : .
- _. '~1 .•. -
100 KHz
50 60
1 , .....
1 MIl. I. f. Bandwidth
, '
70
Frequency MHz
~ w · " ~ 0-
3 .. • • 0-• r ~
'" " 0-
I I I I
lOMHz
~
'" · H JI · ~ .. c · -. "' ~ " .. -. • .. " • • ~ " '" 3: Jl ~ 0- o '" " '" .. 0- .. " ~
"' ~ -"' ~

Kelvin Hughes 17/12 Equipment Model
Measured Spec. Notes
15. InEut SUEE1X Line 1
110ydc Motor Alternator
input volts d.c. 110 110 input amps d.c. 3.48 N/S
. input watts 383 N/S
Transformer Rectifier (Used With l10V de Motor A1ternator~
input volts a.c. 117 115 input amps a.c. 4.10 N/S input watts 430 N/S input VA 480 N/S input Pf 0.9 N/S
output volts d.c. 110 110 output amps d.c. 3.48 N/S output watts 383 N/S
32Y de Motor Alternator
4bp~t volts d.c. 32 32 input amps d.c. 10.2 input watts 326
NOTES
1. See Appendix A for test procedure.
'.Page ~of~

Kelvin Hughes 17/12 Equipment Model
Measured Spec. Notes
16. Sensitivity Time Control 1
Sea Clutter On (Fully c.w.)
Attenuation (db), measured in 1. F. Amplifiel: at the following ranges:
190 yds 59 N/S 500 yds 45 1000 yda 31.5 1500 yds 28.5 2000 yda 26 3000 yds 19 4000 yds 12.5 6000 yds 6 8000 yds 1 9800 yds 0
~WTES
1. See Appendix A for test procedures.
'Page 7 of .!.2.--I

r-- -
Kelvin Hughes 17/12 Equil'mf'llt Model
RANCE RINC ACCURACY
I{ange Ring % VRH 0, 10
N.~. Error Error Notes
N. t1i. wS Meas wS \JS Meas pS
1/4 0.25 3.0918 3.1767 +2.7 3.1308 +1.3
1/2 0.25 3.0918 3.1908 +3.2 3.1308 +1.3 0.50 6.1837 6.1945 +0.2 6.3646 +2.9
3/4 0.25 3.0918 3.1963 +3.4 3.1308 +1.3 0.50 6.1837 6.1945 +0.2 6.3646 +2.9 0.75 9.2755 9.2089 -0.7 9.3885 +1.2
1 1/2 0.25 3.0918 3.2061 +3.7 3.1106 +0.6 0.50 6.1837 6.2046 +0.3 6.3428 +2.6 0.75 9.2755 9.2089· -0.7 9.3649 +1.0 1.0 12.367 12.219 -1.2 12.403 +0.3 1.25 15.459 15.229 -1.5 15.431 -0.2 1.50 18.551 18.267 -1.5 18.490 -0.3
3 0.50 6.1837 6.2486 +1.1 6.3428 +2.6 1.0 12.367 12.316 -0.4 12.403 +0.3 1.5 18.551 18.381 -0.9 18.490 -0.3 2.0 24.735 24.417 -1.3 24.601 -0.5 2.5 30.918 30.494 -1.4 30.712 -0.7 3.0 37.102 36.570 -1.4 36.622 -1.3
6 1 12.367 12.475 +0.9 12.403 +0.3 2 24.735 24.765 +0.1 24.601 -0.5
1. See Appendix A for test procedure.
2. Specified accuracy is ±1.5% of maximum range of scale in use. This specification was met on all rings for 3/4 mile range and above. The 1/4 mile ring on 1/2 mile range and the 1/4 mile ring on the 1/4 mile range did not meet specification. The VRM was within specification on all but two rings; one on 3/4 mile range and one on the 1/2 mile range.
1, 2
Page ....Lof~
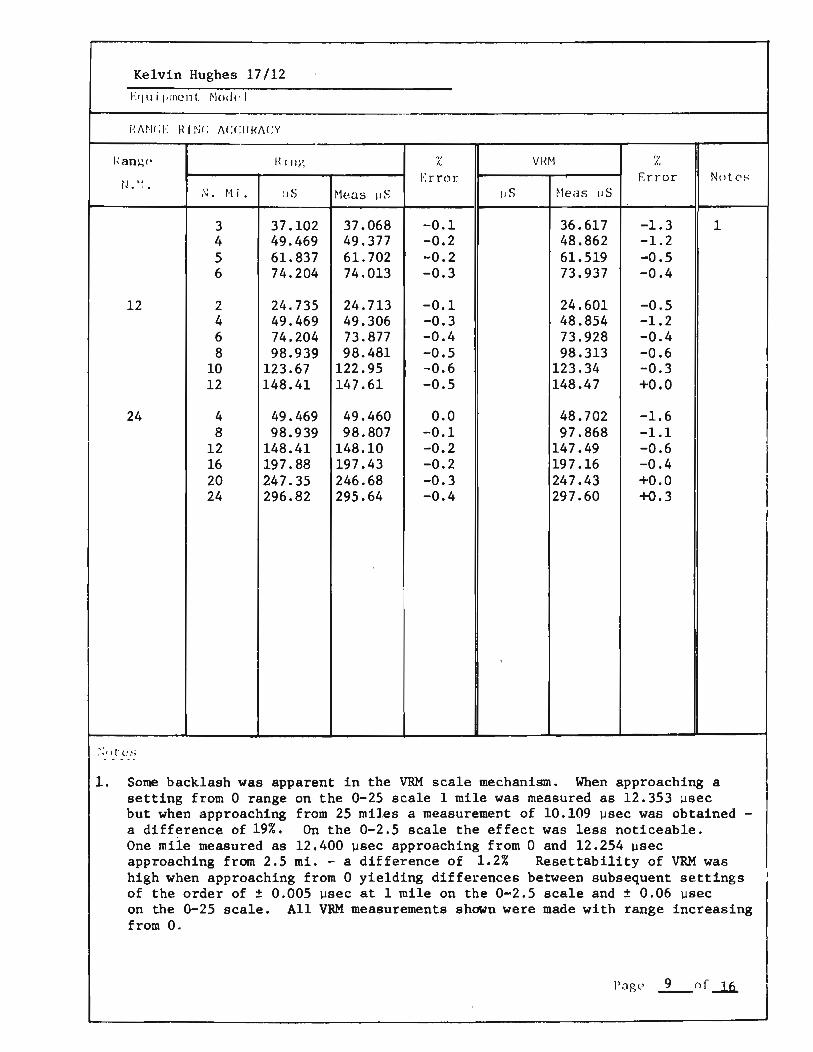
1.
Kelvin Hughes 17/12 Erjl.li I,ment. f'lod(·J
!{i\NCj': R r ~iC; I\C :CII!<I\C;V
I\ang co I{ Illg 'X ,. VH~1 Z
~J. '1. j':rror Error N\lt('~
~. Ni. :JS ~1eos lIS pS Heas tiS
3 37.102 37.068 -0.1 36.617 -1.3 1 4 49.469 49.377 -0.2 48.862 -1.2 5 61.837 61.702 -0.2 61.519 -0.5 6 74.204 74.013 -0.3 73.937 -0.4
12 2 24.735 24.713 -0.1 24.601 -0.5 4 49.469 49.306 -0.3 48.854 -1.2 6 74.204 73.877 -0.4 73.928 -0.4 8 98.939 98.481 -0.5 98.313 -0.6
10 123.67 122.95 -0.6 123.34 -0.3 12 148.41 147.61 -0.5 148.47 +0.0
24 4 49.469 49.460 0.0 48.702 -1.6 8 98.939 98.807 -0.1 97.868 -1.1
12 148.41 148.10 -0.2 147.49 -0.6 16 197.88 197.43 -0.2 197.16 -0.4 20 247.35 246.68 -0.3 247.43 +0.0 24 296.82 295.64 -0.4 297.60 +0.3
Some backlash was apparent in the VRM scale mechanism. When approaching a setting from 0 range on the 0-25 scale 1 mile was measured as 12.353 usee but when approaching from 25 miles a measurement of 10.109 usec was obtained -a difference of 19%. On the 0-2.5 scale the effect was less noticeable. One mile measured as 12.400 usec approaching from 0 and 12.254 usec approaching from 2.5 mi. - a difference of 1.2% Resettabi1ity of VRM was high when approaching from 0 yielding differences between subsequent settings of the order of ± 0.005 usec at 1 mile on the 0-2.5 scale and ± 0.06 usec on the 0-25 scale. All VRM measurements shown were made with range increasing from O.
I
I I
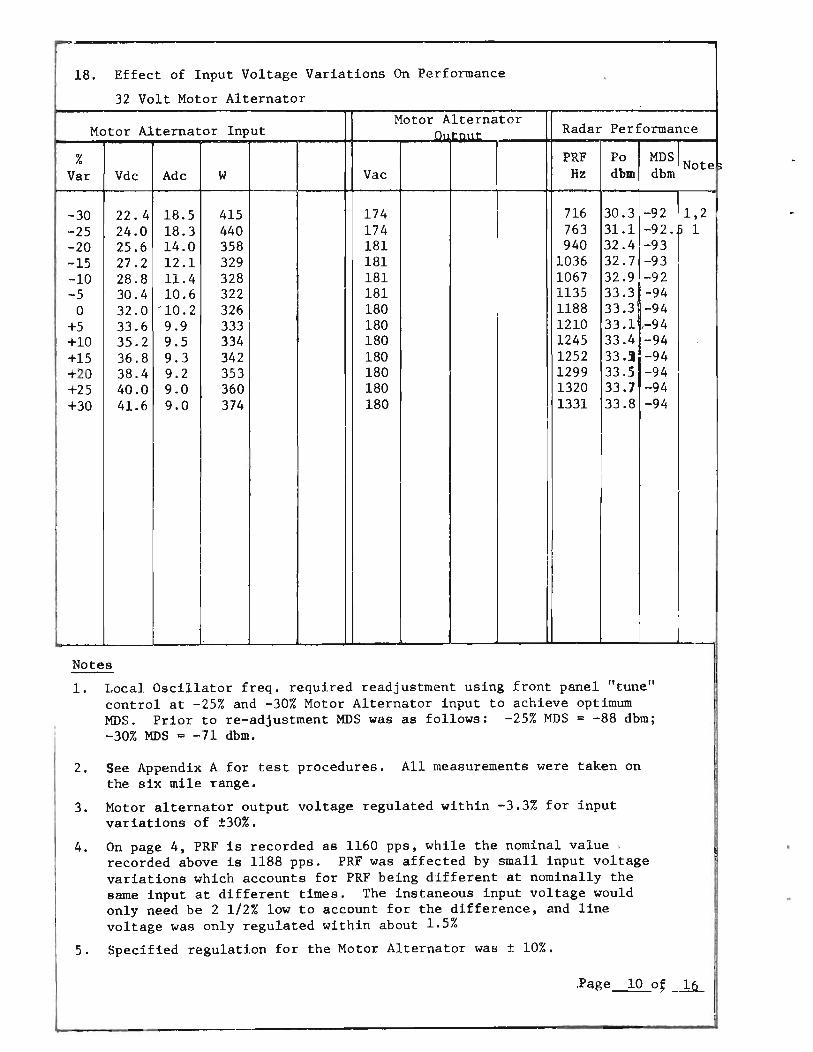
18. Effect of Input Voltage Variations On Performance
32 Volt Motor Alternator Motor Alternator
Motor Alternator Input Oltnnt Radar Performance
% PRF Po MDS Var Vdc Adc W Vac Hz dbm dbm
-30 22.4 18.5 415 174 716 30.3 -92 -25 24.0 18.3 440 174 763 31.1 -92. -20 25.6 14.0 358 181 940 32.4 -93 -15 27.2 12.1 329 181 1036 32.7 -93 -10 28.8 11.4 328 181 1067 32.9 -92 -5 30.4 10.6 322 181 1135 33.3 -94
0 32.0 ' 10.2 326 180 1188 33.3 -94 +5 33.6 9.9 333 180 1210 33.1 ,-94 +10 35.2 9.5 334 180 1245 33.4 -94 +15 36.8 9.3 342 180 1252 33.2 -94 +20 38.4 9.2 353 180 1299 33.5 -94 +25 40.0 9.0 360 180 1320 33.1 -94 +30 41.6 9.0 374 180 1331 33.8 -94
Notes
1. Local Oscillator freq. required readjustment using front panel "tune" control at -25% and -30% Motor Alternator input to achieve optimum MDS. Prior to re-adjustment MDS was as follows: -25% MDS = -88 dbm; -30% MDS ~ -71 dbm.
2. See Appendix A for test procedures. All measurements were taken on the six mile range.
3. Motor alternator output voltage regulated within -3.3% for input variations of ±30%.
4. On page 4, PRF is recorded as 1160 pps, while the nominal value, recorded above is 1188 pps. PRF was affected by small input voltage variations which accounts for PRF being different at nominally the same input at different times. The instaneous input voltage would only need be 2 1/2% low to account for the difference, and line voltage was only regulated within about 1.5%
5. Specified regulation for the Motor Alternator was ± 10%.
Note~
1,2 ~ 1

18. Effect Of Input Voltage Variations On Performance (Cont'd)
19. Transformer Rectifier Performance
Transformer Rectifier Motor Alternator Motor Alternator
Input Tnn1lt- (RQ(' t- 'f';., .... . ... \ n u t'nl . t-
% % Var
Var Vac Aac VA W Pf d.c. Vdc Idc W Vac Input
-24.4 92.5 6.5 600 550 .961 -30 77 5.45 420 185 -19.7 94 5.6 526 475 .903 -25 82.5 4.75 391 184 -14.5 100 5 500 455 .910 -20 88 4.35 382 183 -12.0 103 4.72 486 440 .906 -15 93.5 4.05 379 181.5 -8.5 107 4.45 476 431 .906 -10 99 .- 3.85 381 181 -4.3 112 4.25 476 427.5 .898 -5 104 .. 5 3.65 380 180
0 117 4.10 480 430 .900 0 110 3.48 383 180 +3.4 121 3.97 480 432.5 .900 +5 115.5 3.37 390 180 +6.8 125 3.90 487 435 .899 +10 121 3.27 396 179 +11.1 130 3.80 494 442.5 .89 +15 126.5 3.15 399 179 +14.5 134 3.75 503 450 .89 +20 132 3.10 410 178 +20.5 141 3.70 522 460 .88 +25 137.5 3.03 417 178 +23.9 145 3.65 530 471 .88 +30 143 2.97 425 177
Notes:
1. See Appendix A for test procedure
2. All measurements taken on 6 mile range.
3. The 110V dc motor alternator output was regulated within ±3% for input variations of ±30%, therefore radar performance was not rechecked. See page 10 for typical values of PRF, Po and MDS versus input line variations (32 vol~ motor alternator). The Motor Alternator stalled at 76V d.c.
4. The transformer rectifier had poor regulation. For example, for an input drop of 14.5% the output will be down 20%. T,he full regulation curve may be taken from data in the above table.
,2,~
Page ]1 of ]-~ _

Kelvin Hughes 17/12 f.qui pment '10del
Run # 1 R.un # 2 Run # 3 Notes
20.0 Field Tests
.1 Maximum Range 1, 2. Stern aspect - no reflector 3.55 mi Bow aspect - no reflector 3.30 mi
Stern aspect with SC3 reflector 5.0 mi 8.8 mi 4
Bow aspect with SC3 reflector 5.05 mi 8.8 mi 4
Measured Spec •
• 2 Minimum Range 36' 60' 3, 5
.3 Resolution
.1 Range 47' 60' 3
.2 Azimuth Resolution . 0.90 10 3
. 4 Bearing Accuracy Bettero That ±l tl
O 3
r---------------------.----------------~--------~----------~--------~------~ Notes:
1. Tests were conducted with radar scanner 20' above sea level. Range was measured on an 18' boat for runs 1 & 2 with maximum height 6' above WL except for a temporary wooden mast on which a Radar Reflectors Ltd. type SC3 reflector was mounted 20' above WL as required.
Run~#3 was conducted on a 31'boat with reflector 20' above WL. The cabin I
on this craft did not exceed 7' above WL.
2. See BIS ratio v.s. range on page 13 & 14 for details.
3. See Appendix A for test procedure.
4. Test had to be terminated before maximum range reached because of engine trouble. Under propagation conditions existing at the time of the test, maximum rang~ would likely have been in ex~ess of 12 mile~(run #4).
5. Transmitted pulse formed a circle about 3/8" diameter at the center of the PPI making it difficult to distinguish the target. Company representatives did not regard this as abnormal, but further investigation indicated that this difficulty could have been overcome by adjustment of the "Lock Pulse Delay".
Page --u"of ~

Kelvin Hughes 17/12 Lqui pl11('nt :iocl(> J
o ..... ~ I'll
o
1
~ 0.5 c:: I'll (J
CI)
A. ·M .-I It:l
o
, "J ! I ~ ,- t ~ I I ". ,I , '
, ; -, ,: I 1,1 , I ' ' ~ i i' , "I ,1" 1 .1 , ~ . : I !
; ·1 i . ttl! L~ : ! t : I ; J • , I •. j I • , • I : • • I '
I '1 "'-l ~ £
i "J' , , "I ' t- j - ! ! J I ' I
, 1 1 I I I I , ! I I I I
: J i i : I I " , .
4 6
Run No _---011 __ _ Date July 28/70 , time: from 1300 to 1447
Temperature _~7~4~o~F __ Visibility 5 miles Wind SW 15-20 mph
Relative Humidity __________ ___ Sea State 3 - moderate
Notes: (a) Stern aspect - with reflector (b) Row aspect - with reflector
See Page 15 for Comments
j j II '" Lt· ',· .'" t-,.Tj"lj .. ,, _-.J. ! ':'j'''' fj~ tl f, 1: ~1' I'j ! ", t " l' ''r~ t~ · , "f 1'4' t1 - - + ..... -r . • I,.' Uti" ~ I J.j- ,I .. L ' .1- " ft . . j ~t ,f-:- :~.:: . -. 1 -
-t·; ~T i i , i ~ : r ~ 1 - '~ ;~I . . ~ 'r Itl-:' ;tl 'i ·t' .. _tl·::t'r. _ ~. I-", ~ ',"_. : ll,".: i. ~ I; ; J-.! ~ t.®'! ~'.I III ; : i ; ~t T '
-. : f- : . J t·· , i , I ~ '1' , I .! ! i ' r • _ .. ~ ~ t It I i- I I! r- ,-t ~ : i ,~ L-t. '", .L ~ ~ ~._ . l .. . +- - t1
.. -:il i- -. ~ I.! '.
=- - -- -l -. - . . ~ -
- ·1, -t
- I-
5
Run No ____ ~2~ __ _ Date July 28/70 time: from 1520 to 16-:,:1:,:0::...-_
Temperature __ ~7~4~o~F~_ Visibility 5 miles Wind SW 15-20 mph
Relative Humidity __________ _ Sea State 3 - moderate
Notes: (a) Stern aspect - no reflector (b) Bow aspect - no reflector
The objective of Run #2 was to determine maximum range - hence readings not recorded for range 0-1. 5 mt. Page 13 of 16
6

o or4 .j,J :
Kelvin Hughes 17/12 i
Equipment ~odel
~ - J- =f ~~.-'I-l-
~l. '''-- ~ lfl .., ...
-t ··1-.- ~ . -' I .. , ..
.. ~ .. . .;. +--
IV-.- - . _. r-- ·Pi
. .L-4, .-.~ -l.f· .. ~- . - -- '"
,l .... l ~t ~:~ ~~~- - - ~11 -jt ' - ~"'-f-LTr} Ii! I- - ~. ,-"~ -- - ... ~ j-1=t~· -J .- r .. r ~ --t- -~ :
f--'-r- l · -r i .... +-1-. .- .-. -1.. • -I '1 tl-
. r t --~'r- -1·;-1-- ._; .1--t -H+-l-: '
~l-f .- .. ; -1--!- 'r'" " ~-i:'-r ~t--!-- -,_. __ -I .
~ 0.5
X] fr -}.·i t l ---Hf I ~~t T- .Lt- . j
- j- -I - I -!. i .. -1- 1" -IT ..j .j _. -·1-· j t . • " j" -_. f ..
• ; - i' -1 --i' t . ii i t· ! i-- -I ~'j' t- ' . . j.l _! ~ ! i~ -1'- -, lP-j (J
en Q.
or4 .-I I:Q
-] Iflf ~t .l,+ ... . -- " 1'" f I t I~ ' _. ; _. hi .. ~ · ~·i i '
- /. '1' 1 t' . +. j .. i 1-- ~· - I - t~ .. · 'l _ ·t:~ .. ' ·l · t-,·t t ... ... -I •
f- --l'!'r' .: "1 i ... !. ~. . --ttl! 1 • 1 ! .. , ,··l ,.. ..., ' . ['" .. 4 ! ! l' J ''', 1·1 ; I . . ~ ~ l"~~e • ~!' f+a., I' j i 1 . "!i" ~ I . I .". , ... 1 I • -. ~!. ~ L 1- " 1---\, I ~ -.. U I ~ '.-1'-1 .~ t: ;';j , i' 1- --j-- + ... , I --. .. .... ;- I
12
_ (i~~ --14 'Il' ~ ~i + h -t-j"t·
.... t J I. .1 i .. i 1' ; ·1· IT'j . .. i'ii -jl '· t· ++ . f- . .j I· t· - ! H ; ' ~'i i' I ; ~ .1. i I :
o 0 4 6 8 10
1
Range Nautical Miles
Run No _._3t--__ Date July 31/7,0 time: from 1505 to 1715
Temperature __ ''''''''1000° ... ,_ Visibility 20 + miles Wind calm 0-5 mph. SW
Relative Humidity ___ --__ Sea State 1 - smooth
Notes: (a) Stern aspect - with reflector
See page 15 for additional comments
Ji. . A
~ -to.J_ 1,1 .. ·--1--+--~+4 ++-++,+++-+--++-+-+·+-t-b+-H
-·H-++·H--H-1H+H ,I-II - .. - -L . It - . -- - - .1- .~-H= +, -tI .. _. . . , t-
,:;.- t- .~t - .t : .. : ~ .. -· 1-.
+++-t-+ -+--+++++ +- t ·· l-+4.4-+-++-t--+-~t---t-+-l. ", --. -++'++-+++++!-f-H-+
' " -b - .
--- ~ 't' i- . ' - . ~ - .~.~ .~ . ~
_. . - . l ' .! - ! - - .L -- 'r-'
f- ' .... ; .~ -j .~ . . + f- ~', • __ ... _ . _ . . . . .. - .. h~ --Tll'- . --
o t - 2. 8 4 6 10 12 Range Nautical Miles
Run No _.::...-_3;a..-._ Date July 31/70 time: from 1715 to 2000
Temperature _ ..... 7...:;::2 ... °' ___ _ Visibility 20 + miles Wind 10-12 mph. SW
Relative HUDlidity ____ -_ Sea State 1 - smooth
Notes: (b) Bow aspect - with reflector
See page 15 for additional comments
Page 14 of 16

Kelvin Hughes 17/12
Equipmt!nt ~lndel
Comments On Run II 1 (Stern Aspect)
Gain reduced for stern aspect to detect interference from water reflections. Nulls are clearly indicated at Fresnel Zone Numbers 2 and 4 while reinforcement is indicated for Fresnel Zone 3 Which is in good agreement with theory. Null also evident for curve (b) for 2nd Fresnel Zone but not so pronounced because of the higher gain setting used at the time.
Comments On Run # 3
Run 3 was conducted with minimum gain settings with clutter control on for both stern and bow aspects for range between 0 and 1.5 miles where interference occurs for the geometry af the test conditions. For the stern aspect (a) nulls were difficult to detect - even when the clutter ·control was nearly fully on the target was still giving faint echoes. Nulls at Fresnel Zones 2 and 4 were clearly indicated but nulls for higher fresnel zones went undetected. At this short range the composite echo from boat and target made it impossible to reduce gain sufficiently so that the radar was responding only to the signal from the reflector. This was attributed to the larger test boat used for these tests (31') as o.pposed to the 18' boat used at other times. The results for the bow aspect (b) were similar but the nulls at Fresnel Zones 2 and 4 were more pronounced and reinforcement at Fresnel Zone 3 was clearly indicated. Reinforcement was also indicated for curve (a) at Fresnel Zone 3.
It was thought that ducting was occuring at the time of these tests because of the presence of small boat echoes observed at ranges far in excess of those noted on page 13 and the extra range obtained on the test boat with the SC3 reflector. Unfortunately the run had to be terminated at 8.8 miles because of engine trouble.
Similar conditions were observed on July 14 during range tests on the Marconi LN66 when the target was tracked to 12 miles. It is very likely that the target would have been tracked for about the same distance if conditions had permitted the test to continue.
Page -12-0~..lL
Kelvin Hushes 17/12 Equipment Model
21. General Comments
.1 Installation - The type 17/12 consists basically of four units when operated from d.c. - a motor alternator, display unit, transmitter/ receiver unit and an aerial unit. In addition, a fifth unit was required to operate from a.c. It took a comparatively long time
.2
.3
. 4
to install this radar because of the large number of units to be mounted and the large number of inter-unit cable runs required. Installation was straightforward except that instructions relating to the six core cable from the display to the scanner were rather vague, which complicated the installation.
Mechanical Construction - All units were judged to be rugged and well constructed mechanically. While no tests were made, the radar generally, and the scanner unJt in particular, appeared to be of a type which would stand up well under adverse marine conditions. One exception was the practice of mounting the friction-grip coaxial connectors, (which require considerable force to engage), directly to the circuit boards without support, which could result in unnecessary damage to the boards while servicing the radar. It was felt that additional stiffening should be added to protect the boards from damage from this source.
Servicing - The Instruction Manual accompanying the 17/12 was and easy to follow, however the radar tested had some circuit
complete boards
The of more recent design for which schematics were not provided. manual contained a large, clear, Radiation Hazard Warning note which would be difficult to overlook, a good point indeed, and the warning was repeated in the section sovering the scanner unit. The display unit contained many wired-in printed circuit boards which were easily accessible for test purposes, however the lack of information in the manual on the new boards made testing difficult in a few cases. There were several interconnecting wires between the hinged portion of the display unit and the fixed portion which were not laced or cabled and tended to get jruwmed in the case when closing the unit - this was only a minor nuisance but it could easily be corrected.
Operator Convenience - The 17/12 was a very satisfying radar to use . The twelve inch display was large enough for easy viewing and provided a"very clear and detailed radar picture and the orange phosphor was the least tiring to the eyes. The controls were well placed, providing the most used controls on top whe~e they were illuminated and plainly visible and well separated from the less used controls located on the front of the unit. In all, sixteen controls were used, permitting the adjustment of all the usual parameters, thus giving the operator full control of the display. The variable range marker was a very useful accessary, which along with the low 1/4 mile range and the excellent minimum range performance gave this set excellent resolution at close range. A disadvantage with this radar was that the phosphor on the CRT was easily damaged and great care had to be exercised to maintain the brillance at a low level H burns were to be avoided.
Page 16 of 16 -'-

MARINE ELECTRONICS EVALUATION PROJECT
- RADAR -
Conducted Jointly
by
CANADA DEPARTMENT OF FISHERIES & FORESTRY
and the
COLLEGE OF FISHERIES, NAVIGATION, MARINE ENGINEERING
and ELECTRONICS
July - August 1970
Test Results for Furuno FRA-10
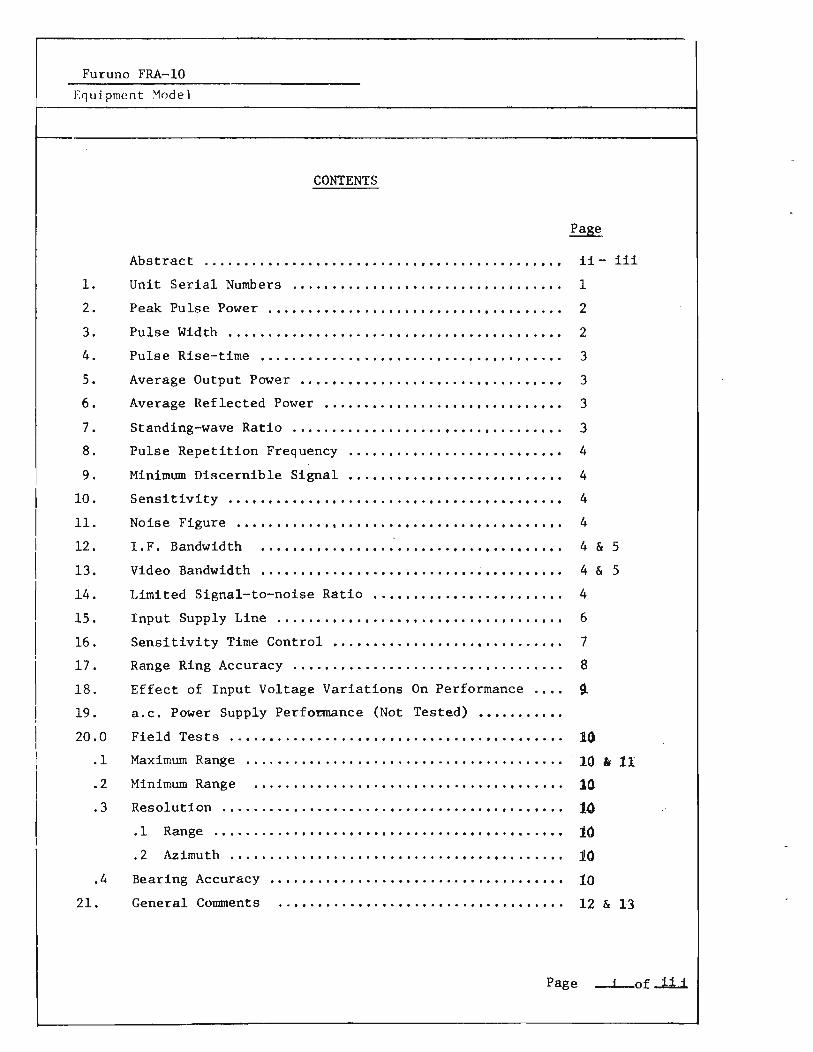
Furuno FRA-lO ECjui pment :1ode 1
-----------------------------------------~----------------------------------------------~
1.
2.
3.
4.
5.
6.
7.
8.
9.
10.
11.
12.
13.
14.
15.
16.
17.
18.
19.
20.0
.1
.2
.3
. 4
21.
Abstract
Unit Serial Numbers
Peak Pulse Power
Pulse Width
Pulse Ri!;>e-time
CONTENTS
....................
.. Average Output Power
Average Reflected Power ............... . . . .... Standing-wave Ratio
Pulse Repetition Frequency
Minimum Discernible Signal
Sensitivity
. . . . " .....
. ...
. . . . Noise Figure
I.F. Bandwidth
Video Bandwidth ....... , ..... . Limited Signal-to-noise Ratio
Input Supply Line ......••••••
Sensitivity Time Control
Range Ring Accuracy
... .. . . .... . .
Effect of Input Voltage Variations On Performance
a.c. Power Supply Perfo~nce (Not Tested)
Field Tests
. .
Maximum Range
Minimum Range
Resolution
...
.1
.2
Range
Azimuth .............................
. ..
Bearing Accuracy
General Connnents . . . . . . . . .....................
Page
ii- iii
1
2
2
3
3
3
3
4
4
4
4
4 & 5
4 & 5
4
6
7
8
9-
14
10 " 11 10
14 10 10 10 12 & 13
Page --i--of ..i1.i
Furuno FRA-IO Equipment Model
Abstract.
The Furuno FRA-IO Marine Radar is a low-priced set with a 7 inch PPI display magnified optically to an effective diameter of twelve inches by the use of a magnifier and viewing hood. The combination when used as supplied is as effective as most larger PPI's, however the display cannot be viewed effectively in even moderate light without the hood and magnifier. The peak pulse power exceeded specification by a small margin while pulse width was slightly below specification. The pulse repetition frequency, while specified as 950 pps actually measured as 755 pps on the shortest ranges and was only slightly different on the other ranges.
The IF amplifier was unexplainably tuned to 47 MHz rather than to the specified frequency of 40 MHz and the bandwidth was almost double the specified '\Talue, however the Noise Figure was within specification. The power consumption was considerably lower than specification - the unit required only 170 watts rather than approximately 250 as specified
The sea clutter control exibited considerable range and when "fully on" began to attenuate , at 5.8 miles and completely attenuated all stgnals between 0 and 1.6 miles.
The range ring accuracy was exceptionally good - the specified accuracy of ±1% was met easily on all ranges.
Radar performance was completely unimpaired for input supply variations of -15% to +30%. At -'-0% PPI brightness was noticahly reduced and the front panel tune control required re-adjustment to optimize MOS. At -25% the brillance was below the level at which MOS could be measured, thus the radar was considered un-serviceable. Power output was maintained however at the lower voltage giving 2.2db down at -25% input and 2.7db down at -30% input. At -30% input the sweep was no longer visible and the scale illumination lights were nearly extinguished.
Minimum range, range resolution, ~zimuth resolution and bearing accuracy were all within specification.
Of the specifications not met, pulse repetition frequency, IF Bandwith, IF centre frequency and Video Bandwidth were considerably different from specification. In our opinion some ' of these difference! could be attributed to design changes not reflected in the manual or errors in production lineup and adjustment.
Installation was straightforward and very convenient since all installation material was supplied by the manufacturer including bolts, tools and other hardware - a most convenient ar~angement when installation is ' to be made at a remote location. The radar operates from either 12,24 or 32 Vdc and although supplied wired
Page ii iii

Furuno FRA-IO
Equipment Model
Abstract
for one of these standard voltages, conversion to another may be carried out by a simple wiring change and by changing the antenna drive motor. Overall mechanical construction was robust and judged well suited for use in areas of severe weather and sea conditions. Servicing is convenient but since the boards are wire-in and few are used, maintenance could be relatively expensive. The display is convenient to use but requires that the hood and magnifier be used at all times except that the display could be used in a darkened room without the magnifier but then the display is too small for easy viewing. The hood itself was judged uncomfortable to use since its shape didnlt conform well to the face, not could it be used alone without the magnifier. The operators handbook was well written and contain6 excellent material on maintenance for the technician but labeling of schematics and some inked changes were unclear.
Operation was convenient but would be improved by the addition of control illumination and extra range rings on the 0.5 mile range and a separate control for range ring intensity as there was no setting of the brillance control which gave optimum brightness for both video and range rings.
Page iii of iii

Furuno FRA-lO
Equirrn('nt ~1(ld!·1
1. Unit Serial Numbers Type Serial Number Notes
Scanner Unit (3') FRA-lO A208S 1
Display Unit FRA-lO A208S
I •
Notes
1. 24V d.c. input.
Page 1 of 13 - -

·
Furuno FRA-lO
Equipment Model
Measured Spec. Notes
2. Peak Pulse Power, Pt, Kw
short pulse 5.34 5 long pulse (8 mile range) 6.28 5 long pulse (20 mile range) 6.26 5
3. Pu1s~ .Width, Tp,_ }.Isec
Range
1/2 0.118 0.1 1 1/2 0.118 0.1 4 0.61 0.6 8 0.61 0.6 20 0.61 0.6
NOTES
1. See Appendix A for test procedures. For these tests supply voltage was maintained at 24V d.c.
2. Calculated from PRF, Pulse width Tp, and average output power Po.
1, 2
1
·Page -2-of..1.l.-
Furuno FRA-lO Equipment Model
Measured Spec. Notes
4. Puls~Rise-timel jJsec 1
Range
1/2 0.01 N/s 1 1/2 0.1)1 4 0.01 8 0.01 20 0.01
5. Average OutEut Power z POI Watts 1
Range
1/2 0.476 N/S 1 1/2 0.476 4 2.92 8 2.92 20 2 92
6. Average Reflected Power, Pr I mw 2
7. Standing-wave Ratio I VSWR 2
N/S Not Sp ~cified
;-.JOTES
1. See Appendix A for test procedure.
2. Because of the difficulty of coupling to the short waveguide section between the transmitter and antenna these tests were not performed.
I I
'Page 3 of 13 - -
NOTES
1. See Appendix A for test procedures.
2. NF calculated from measured values of I.F. B.W. and sensitivity since the NF meter available wasn't equipped to measure with this sets' IF frequency.
3. Measured on the four mile range.
4. See page S for I.F. response curve. The I.F. response was centered on 47 MHz rather than 40 MHz as specified.
S. See page 5 for video response curve. Video response was measured with input supplied to J201 from a nominal son source and output measured at CRT cathode.
6. Specified sensitivity calculated from given values of I.F. B.W. and N.F.
-Page -4.-of 22.....
Iln o HI
It;
100Hz 1 KHz
Video Bandwidth
Output at CRT .775 v. rms
10 KHz
I.f. Bandwidth
-3db Bandwidth 20 MHz I.f. input at centre
frequency -89 dbm
Output at centre frequency 0.775 V
* Specified Centre Frequency 40 MHz
Frequency :~-~I ~. ~~rr~~
~~r-r_'-t-: +-+-+-+--+
, i. !
J
t-- J
t . I •
-30~i~, ~~-~~~~~~~~~~~~~~~~~H
o 20 40 60 80 Frequency MHz

Furuno FRA-10 Equipment Model
Measured Spec. Notes
15. Input Supply Line
input volts d.e. 24.0 24.0 1 input amps d.e. 7.1 input watts 170.4 approx
250
NOTES
1- See Appendix A for test proeedure
-Page 6 of 13 - --

Furuno FRA-lO Equipment ModC'l
16. Sensitivity Time Control
NOTES
Sea Clutter Control On (Full c.w.)
Attenuation (db) measured in i.f. amplifier , at the following ranges:
o - 1.6 mi. 1.66 mt. 2 " 3 " 4 " 4.5 " 5 " 5.8 "
1. See Appendix A for test procedures.
Measured Spec. Notes
1.
>SSdb N/S 2 39db 25db 15db
Sdb Sdb 2db Odb
2. Attenuation was very high for range less than 1.6 miles with sea clutter "fully on" resulting in complete loss of signal in this range.
'Page --1-of .l.L.

Furuno FRA-10 .- -
Equi rment Model
17 RANGE RING ACCURACY
Hange Ring % VRM % Error Error Notc-s N.M.
N. Hi. \..IS Meas \.IS uS Meas \..IS
1/2 0.25 3.0918 3.0721 -0.6 1, 2 0.50 6.1837 6.1755 -0.1
1 1/2 0.25 3.0918 3.0721 -0.6 0.50 6.1837 6.1644 -0.3 0.75 9.2755 9.2703 -0.1 1 12.367 12.366 0.0 1.25 15.459 15.461 0.0 1.50 18.551 18.553 0.0
4 2 24.735 24.437 -1.2 4 49.469 49.416 0.0
8 2 24.735 24.606 -0.5 4 49.469 49.476 0.0 6 74.204 73.936 -0.4 8 98.939 89.808 -0.1
20 5 61.837 61.277 -0.9 10 123.67 122.93 -0.6 15 185.51 185.31 -0.1 -20 247.35 246.43 -0.4
P;otl:S ...... _--1. See Appendix A for test procedures.
2. Specified accuracy is t1% of range in use which was easily met on all range rings.
Page 8 of~ -

18. Effect of Input Voltage Variations on Performance
d.c. Power Supply Input Radar P.arameters
% Var Scan PRF Po }IDS d.c. Vdc Adc W Rate PPS dbm dbm
ITnnnt RPM
-30 16.8 5.4 89.9 14 686 32.0 --25 18.0 5.8 104.4 693 32.6 --20 19.2 6.3 121.C 720 33.3 -93 -15 20.4 6.7 136.7 744 34.2 -93 -10 21.6 7.0 151.( 759 34.7 -93 -5 22.8 7.1 160.7 759 34.7 -93 0 24.0 7.1 170 .~ 19 759 34.7 -93 +5 25.2 7.1 179 .~ 759 34.7 -93 +10 26.4 7.2 188.f 759 34.7 -93 +15 27.6 7.2 197. ~ 759 34.7 -93 +20 28.8 7.2 207 .~ 759 34.7 -93 +25 30.0 7.3 217 • ~ 759 34.7 -93 +30 31.2 7.3 227. f 24 759 34.7 -93
Notes
1. See Appendix A for test procedufe.
2. Specified nominal scan rate = 20 rpm
3. P.P.I. brightness was noticeably reduced.
4. Front panel "tune" control required re-adjustment at this voltage to achieve optimum }IDS.
Not4
1,2,1> 5 3,4
2
2
5. At this voltage it was not possible to adjust brilliance to an acceptable viewing level to measure }IDS.
6. At this voltage the sweep was no longer visible on the P.P.I. and the scale illumination lights were so low as to be almost indiscernab1e.
7. Regulation not specified in the Operator's Manual.
9 Page ____ of..l.3._

Furuno FRA-lO Equipment ~1odel
Run 111 Run 112 Spec. Notes
20 • Field Tests
. 1 Maximum Range 1, 2,3
Stern aspect with SC3 Reflecto Reflector 4 mi. 4 mi. 4
Bow aspect with SC3 Reflector 4 mi. 3 3/4 mi
~easured Sj>ec.
:2 kiiiiDiUm RanKe 63' 75' 3
.3 Resolution
.1 Range 55' 60'
.2 Azimuth 2.70 better tha 2.So
.4 Bearing Accuracy bet ter thall ±lo ±lo 3
1---------.. --.----------------~------------I---oo.o4 Notes:
1. Tests were conducted with radar scanner 20' above sea level. Range was measured on an 18' wooden boat with maximum height 6' above WL except for a temporary wooden mast on which a Radar Reflectors Ltd. type SC3 reflector was mounted 20' above WL.
2. See Bls ratio vs range on page 12 for details.
3. See Appendix A for test procedure.
4. Range tests on the test boat with no reflector were not conducted because the radar had to be returned to the manufacturer's agent before final testing and assembly of this report was completed.

..
o .~
~
1
Furuno FRA-lO Equipm('nt .'lodel
Run No __ ~l __ Date Aug. 6/70 time: from 1015 to 1200
Temp er a ture _--.:..7,:..7o .... F:..-_ Visibility 7-8 mi. Wind 15-20 mph. SW
Relative Humidity ______ _ Sea State 3-moderate
Notes: (a) Stern aspect - with SC3 reflector (b) Bow aspect - with SC3 reflector
~ 0.5
~ () til
0-..... M I:Q
o o 1 2 3 Range Nautical Miles
Run No _....:2=--__ Date Aug. 6/70 time: from 1250 to 1412
Temper a ture _---!7...::5;,..o.:.F_ Visibility 25 mi. Wind 10-15 mph SW
Relative Humidity ______ _ Sea State 3-moderate
Notes: (a) Stern aspect - with SC3 reflector (b) Bow aspect - with SC3 reflector
page ~of...l.3..-

Furuno FRA-10
ECf ui pmen t ~1ode]
21 General Comments
.1 Installation - The Furuno FRA-10 is very simple to install, requiring only four mounting studs for the display unit and an equal number for the scanner unit. Only one cable run is required between the display and scanner and waveguide is not needed. Complete installation material is supplied by the manufacturer including: grounding strip, bolts and other hardware and even wrenches,sockets and screwdrivers required to install and service the radar. Conversion from 12 to 24 or 32V d.c. is quite simple, requiring only the changing df 3 "taps" on the power supply and replacing the antenna drive motor. Operation from other voltages requires a~ additional rectifier or converter •
• 2 Mechanical Construction - Both the display and scanner units are mechanically well built and sturdy without being unduly bulky. The scanner unit is constructed of heavy gauge cast metal, completely water tight and of very neat appearance. The fit of component parts was excellent, each subassembly removed from the unit came apart and went together easily and precisely with little effort and no strain required. The robust mechanical construction would make this radar an excellent choice for service in areas of severe weather and sea conditions •
. 3 Servicing
.1 Display Unit - By loosening 4 captive screws 1/4 turn the interior of the display unit can be exposed for servicing. The circuit board connections are clearly identified for easy location of test points and the whole area is quite readily accessible. The printed circuit boards are wired-in, and ieW€90ards are used -thus it is relatively expensive and time consuming to replace a defective board •
• 2 Scanner Unit - The transmitter, modulator, and I.F. amplifier are mounted in the scanner unit, and can be exposed by removing 3 screws. Test points for the most c9mmonly required voltages are provided, and the whole assembly slides out readily for bench servicing if required. The antenna drive motor can be exposed by removing four studs on the opposite end of the scanner unit, leaving plenty of room to work •
. 4 0Eerator Convenience - The display cannot be viewed in even moderate light without the hood. In a darkened room without the magnifier the 7" display was easily visible but was too small for easy viewing. With the magnifier and hood the display was clear and easily readable. The viewing hood itself is uncomfortable, as the shape of it does not conform well to the face, nor can it be used alone without the magnifier, All field tests were carried out using both the magnifier and hood which are standard items since this was judged to be the optimum operatingclar~aJlgemel1t for this radar.
Page 12 of.l.3-

Furuno FRA-lO Eq u j pmEm t ~1()de 1
21. General Comments (Cont'd)
.4 Cont'd
The lack of a gain control was felt at first, but with practice it was found that the STC/FTC control performs this function quite well and elimination of the gain control means one less for the operator to worry about.
The absence of illumination for controls is a disadvantage to anyone not familiar with the control panel, but again familiarity with the set would overcome this, especially since there are only 3 controls (Brilliance/Markers, STC/FTC, & Tune) and four switches (ON/OFF, Antenna ON/OFF, Transmit ON/OFF, and Heading Marker Autol Manual) to become familiar with. The 1/2 mile range markers are too far apart at 1/4 mile intervals. Range markers every 1/8 mile would be better.
The operators handbook is clearly written, with a good section on maintenance and repair procedures for the technician, however the schematic diagrams are not clearly labelled and some inked corrections are almost illegible.
When the bril1ance control was adjusted for proper radar viewing, the range rings were uncomfortably bright,but when the brillance control w.as adjusted for average range ring intensity all radar signals were lost which could confuse an unexperienced operator. There was no setting of the brilliance control which gave optimum brightness for both the video and range rings.
Page-.l..L of ~
I


MARINE ELECTRONICS EVALUATION PROJECT
- RADAR -
Conducted Jointly
by
CANADA DEPARTMENT OF FISHERIES & FORESTRY
and the
COLLEGE OF FISHERiES, NAVIGATION, MARINE ENGINEERING
and ELECTRONICS
July - August 1970
Test Results for Sperry MK-7

Sperry MK-7 Equipment ~odel
1.
2.
3.
4.
5.
6.
7.
8.
9.
10.
11.
12.
13.
14.
15.
16.
17.
18.
19.
20.0
. 1
.2
. 3
. 4
21.
CONTENTS
Abstract •••..•.••.• " " " " " " " " " " " " " " " " " " " " " " " " " " " " " " " "
Unit Serial Numbers " " " " " " " " " " " " " " " " " " " " " " " " " " " " " " " "
Peak Pulse Power
Pulse Width •.•.
Pulse Rise-time
" " " " " " " " " " " " " " " " " " " " " " " " " " " " " " " " . " "
" " " " " " " " " " " " " " " " " " " " " " " " " " " " " " " " ... " " "
" " " " " " " " " " " " " " " " " " " " " " " " " " " " " " " " " " " "
Average Output Power .••••••••.
Average Reflected Power •..• " " " " " " " " " " " " " " " " " " " " " " " "
Standing-wave Ratio """" .. ,,""""""""""""""""""""""""""
Pulse Repetition Frequency •••••••••••••••••••••••••
Minimum Discernible Signal ..•.••••.•••••••••.•.•••.
Sensitivity """""""""""""""""""""""""""""""""""""""" Noise Figure ..
LF. Bandwidth
Video Bandwidth
" " " " " " " " " " " " " " " " " " " " " " " " " " " " " " " " " " " " "
" " " " " " " " " " " " " " " " " " " " " " " " " " " " " " " " " " " " "
" " " " " " " " " " " " " " " " " " " " " " " " " " " " " " " " " " " "
Limited Signa1-to-noise Ratio " " " " " " " " " " " " " " " " " " " " " "
" " " " " " " " " " " " " " " " " " " " " " " " " " " " " " " " .. Input Supply Line
Sensitivity Time Control •. . ....................... . Range Ring Accuracy ............................... .
Effect of Input Voltage Variations on Performance .•
a.c. Power Supply Performance (Not Applicable) ••.••
Field Tests ....................................... .
Max imum Range .........•••..•••.•.•...••.•.••..•••••
Minimum Range .•.•.....•..••....•.....•••.••.•.••••.
Resolution
.1 Range
• 2 Azimuth
· ................................. . · ................................. . · ................................. .
Bearing Accuracy .................................. .
General Comments · ................................. .
it - iii
1
2
2
2
2
3
3
4
4
4
4
4 & 5
4 & 5
4
6
7
8
9
10, 11 &
10
10
10
10
10
10
13 & 14
12
• I Page ....1.- of..J.,11.
'./ / '.,. I'.,
Sperry MK-7
Equipment Model
Abstract
The Sperry MK-7 is a low-priced set with a 7 inch PPI display magnified optically to an effective diameter of about 12 inches by the use of a magnifier. The magnifier may be used to advantage without the hood in dim light, however, for moderate or bright light the hood is essential for proper viewing. Peak power was somewhat less than specification while pulse width was slightly shorter than specification on long pulse but was slightly longer on short pulse. Pulse repitition frequency was 1050 as opposed to the specified value of 1000.
Noise figure, calculated from the measured values of sensitivity and the greater IF bandwidth, was slightly outside specification, however both IF bandwidths were within specification. Power Consumption was greater than specified, requiring 398 VA whereas the specification required less than 350 VA.
The STC control was very effective, and when fully "on", attenuation began at 7500 yards, rising to 70 db at 1250 yards, however even with . the STC off, considerable attenuation was still present below 4000 yards. It was concluded that this was abnormal, since no explanation was given for it in the manual.
The range ring accuracy of ± 1% was met on all ranges, the maximum error being + 0.7% measured on the 3/4 mile ring.
The set performed exceptionally well for input supply variations of ± 30% which was well in excess of the specified regulation of ± 20%. The only significant changes were a reduction in PRF and scan rate at - 30% but power output only dropped 0.5 db. The scan rate increased significantly at + 30% but PRF changed only slightly, The MDS and display intensity remained essentially constant over the full range of input variation of ± 30%. The exceptional regulation of this radar would make it an excellent choice for applications where the main supply was of unavoidably poor regulation.
Range resolution, azimuth resolution and bearing accuracy were all within specification but minimum range was greater than specification giving 109' whereas the specification required a maximum of 88.7 feet.
Of the specifications not met, no individual item represented a serious departure from the specified value with the possible exception of minimum range, power output, and residual STC action.
Installation was straight forward with few exceptions. Installation and maintenance could be simplified by redesign of the display and modulator mounting arrangements. Overall mechanical construction is
Page ii of iii

Sperry MK-7
Equipment Model
Abstract
rugged and judged well suited for use under adverse weather and sea conditions. The display is convenient to use with the magnifier and hood or without the hood in semi-darkness, however the display is too small for easy viewing without magnification.
Operation was conveni~nt but would be improved with the addition of control illumination and addition of extra range rings on the 0.75 mile range.
, ... ' ,-J
Page.JJJ...,of .w.. -

~hH:I::r:~ W{Z .. /-:r 1'1 j fHII!, 11 I 11()rI,"
l. Unit Serial Numbers Type Serial Number Notes
Antenna (4' ) SC-44 5-1 1753
Display ID-131-1 1151
Motor Generator MG-15-1 4364 1
I I
Notes:
l. 110 Vac. 60 Hz 1$ input.
Page ..-l..- of~
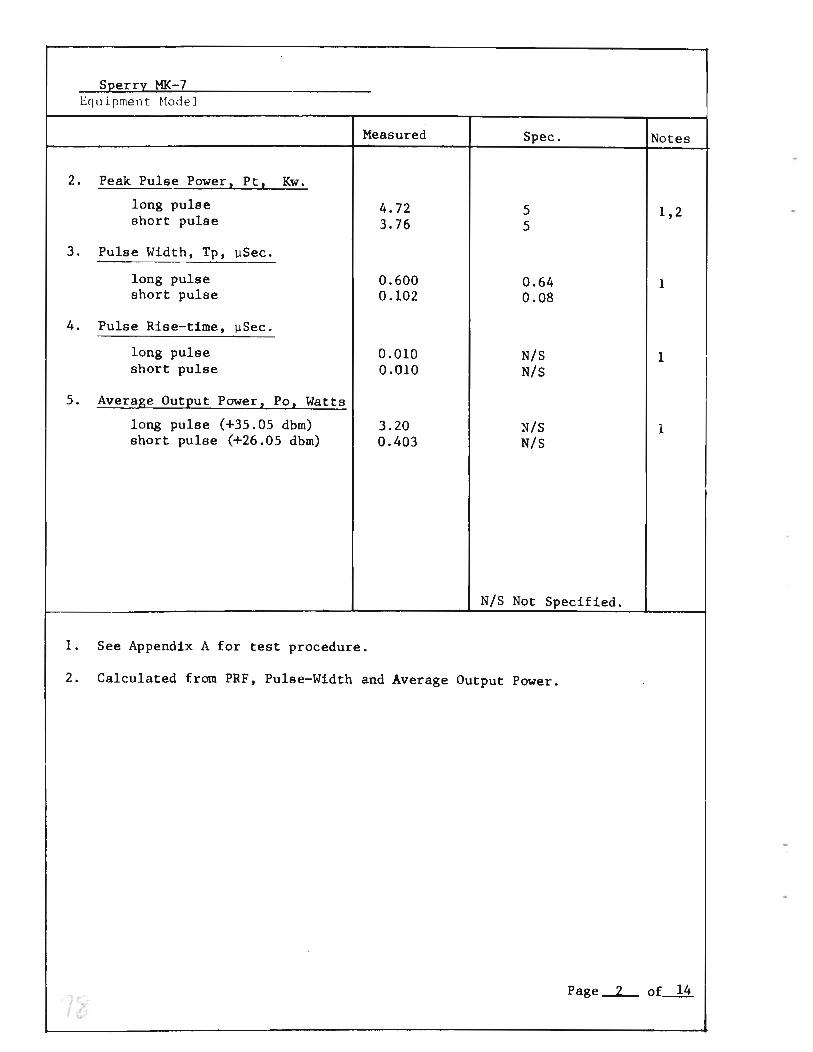
S~errl MK-7 Equipment Hodel
Measured Spec. Notes
2. Peak Pulse Power z Ptl Kw.
long pulse 4.72 5 1,2 short pulse 3.76 5
3. Pulse Width, Tp, llSec.
long pulse 0.600 0.64 1 short pulse 0.102 0.08
4. Pulse Rise-time, llSec.
long pulse 0.010 N/S 1 short pulse 0.010 N/S
5. Average OutEut Power, POI Watts
long pulse (+35.05 dbm) 3.20 N/S 1 short pulse (+26.05 dbm) 0.403 N/S
N/S Not Specified.
1. See Appendix A for test procedure.
2. Calculated from PRF, Pulse-Width and Average Output Power.
Page --2..- of-.li.. "i (' I ,;; ,,,,"

SEerr::t: MK-7 Equ i pment ~1odel
Measured Spec. Notes
6. Average Reflected Power, Pr, m.w. 2
7. Standins-wave Ratio I VSWR. 1.39: 1 N/S 1
1. VSWR measured at input to rotary joint.
2. Not applicable - VSWR measured directly.
';'
Page~ of 14 -

SEern: MK-7 Equipment Model
Measured Spec. Notes
8. Pulse ReEetition Frequency,Fr,pps 1050 1000 1,2
9. Minimum Discernible Signal,MDS,dbn -88 N/S 1,8
10. Sensitivity, Pr, dbm. -91 -91 1,6,8
11. Noise Figure, N.F., db. 13.5 Better than 12.8 4
12. I.F. Bandwidth t BWa MHz short pulse 9 10 3 long pulse 3 3
13. Video Bandwidth z l:3db 30 Hz to 5,7 (100 KHz Reference) 600 KHz.
14. Limited Signal To Noise Ratio (S/N~ lima db. 28.7 N/S 1
1. See Appendix A for test procedure.
2. Measured on 8 mile range.
3. See page 5 for I.F. response curve.
4. Calculated from measured values of sensitivity and I.F. B.W.
5. See page 5 for video response curve.
6. "Specified"value calculated from given values of N.F. and greater I.F. B.W.
7. Video response measured by inserting constant level input signal (from nominal 50 ohm source) to "Video" terminal (pin 8) of Video Circuit Printed Board and measuring output level at "Video Out" terminal with HP 3400 A True RMS VTVM.
8. Measured on 2 mile range.
Page~ of -2!:.
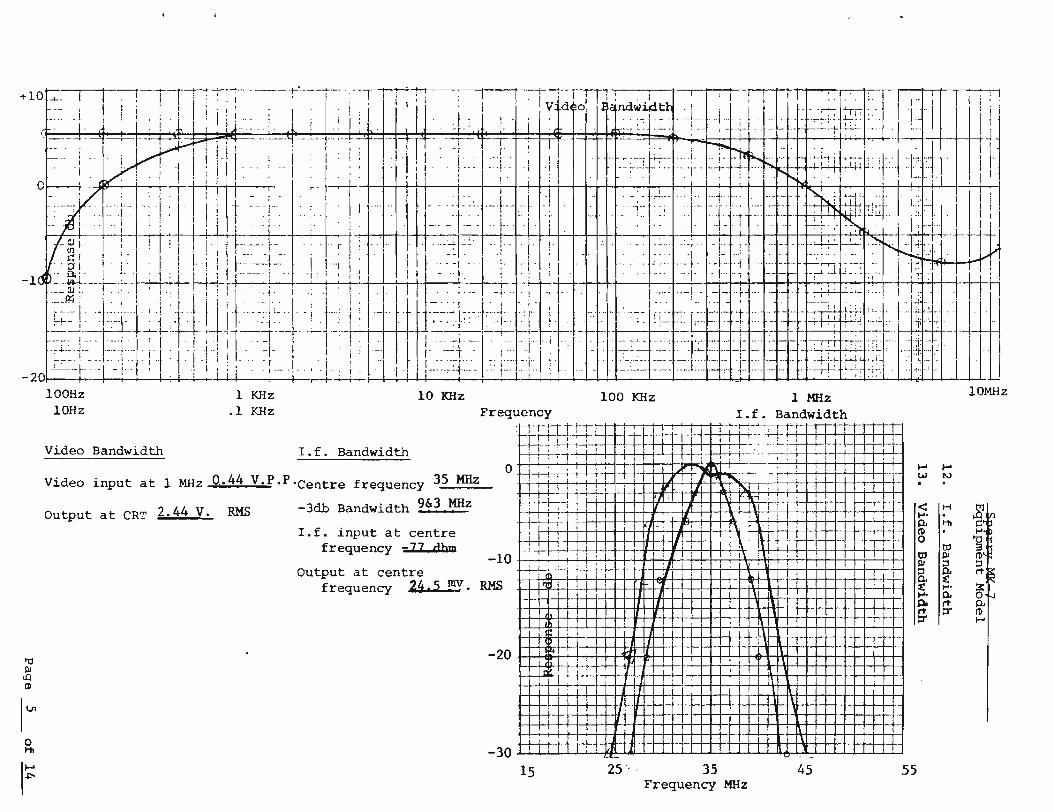
-1"10 -1-. I II " I.' I. II " .,:; :r----r--,-.: ! Ii j111 I: : , ! IV!d' n;tnd·~~_1.. r ' I ! ! I! :'t" " :' ' I! T- I Ii:: .. 1 1 • jl . 'J' ! \' !I i -. :, I . i.' i .:.' I .. ~·I,' . ·.. . ,. i ' . .. ,- 1,- ", ! ... ··1··· · · ... - .,...~~ ' , ~ ~ !: ··I I I' , I ' 0, I'r' w~tI:. ! . I .11 .. - ,......-. tr": .... 1 1··· ·1 ' . 1 j
, . ! ! ' !::.J' .. . . ,I... -r . : . •.•• . •• , ~ :.,. _. ! . .. ,- ' I . . !-.- 1--:-'7 L~ ... 1 I ~ . . ; .-t , I . ! . , -,--.+- _. !. _~
- .---'I~t--~. . -4 . - ..... -.. -'~. IT'l . -..........-~I-I ' I ~!!' I I .U+t! 'I ! . ' I i ll! ' : ' I; : . C; j " I •.• •. I ~I--;..~.. . ... . . " I ' . I I 1-- .. 1 . .. : "1 I j !·r ,... . I : i, : :,: ::' '1
1
:, ' :, i: ". i'i ~ ' : ':::'.', '.: . j .j, I --=~~:fF: :::il<· :::.~·r~~I:··l'~I:", ~; I it:'LiW:-!I:::· ::I:e':::l 1,"1
.;. '!'!. j: 'j j' : ! I ~ . . : .. ' I . . 1 . " . , . " '. ' , i .- - I' I, 0 · ' . , . ,,1 ' ~. I 'I
~iSr,!;\ Iii t -~ i~ :\!I q L~ _:l:~I-- c lf-'~ ~~+r-r .~ .... •.. ~~ "~~! ! ~ -j II! II 1 ' . . ; . .1" I , ' ~ .,H--' -'
(~ ~~. I ;' I! !! I ! ! ' 11F~~-- .: -j-- r ! i" ':l'" I' . ..... -:t ~:.. "J' .!. !. -- : :~~ : "~i " T : ' . ~~ -"':' ' , ', '~ ~ .
. "0' ,. ; .. I I I .. ; ! ! I ' - ' -';"~-' I I"'j I '· ! ~ .... \ _. . ; . ... j- ' I .. " ... ... t.,.-I .... . ,. , ..... - I--""J .-. ,. 1 I-~' ~I"""'! ! I _1 11 "'--0.;' 1 :' i' l:iiil 1r"-- ' j '1';":1 11, -··". ! i I i ~ .. -t · ·,··· ··, -,-' IJ.~:I" 1 11 .:' ,ttHl!,
. __ tIl :! . 1' 1:: : :!! I·· --t-., I ' ! .!·//'I .. i ' -' _.! .... ! ' :-/- • f~''' ''-I' -I- "~ ...... :: . ':"';": ... I I.: . '1
.--~ . t··, , ; , j Ili!I ' ·j··1 I 1 ' \ f' -''' ' t' i . j. ~ , ,,- -, ~:.·.f.- .L'::~I '- ~··· ·· ~-· '-·~·;;ii:; !::· LI:.j·~·l. 'j"'U ~~ llr l..:Lrt: JjL:':~'~_>-l 1 L! ~ !.~ .. .. ' 't' , -:·-:~F ~: ;· =±~LJ. ... · .~ :' . _: .~_~.~ ~. ~~ : : ~ !:::~:. ~ '-l:~ .:: .. ~: =-. -+:-+1: ~~ :~:- .... :1 I'~i" ~ ": .-{-' 'I
. . -:,.\ --- '''1 'I " "1' , .! 11 "' -1 - 1 I 'Iii" 'I' ·'· -;-tl . _ ...... i';!', _ ... ...:...~_ .:_ .. _ .. ~ ...... _, __ .. 1- . .. ~..:..c..I'-:..:. ~,L:,· .... :It: .... . -·::.~~T. __ .,~--:i".= ::'.', ': L I! '! ! '::',- ~~- " , ; ' [ : ! : .-:: 't r--·--=-:.,·_··· : l·::· ~ i· i j '\ I · .:- :.~ .:. .-" -...... _ ...... !-j_ ... _ . .. I--H-t~ . ..i' · ·r~·· · i I
-20 -' -' +- 'H i -!.. . i . I· ·1 I ! i i . t '-1' · '; ','; i: . ! 'i i ,-_.,.,.-+-,- .. 1-' \'" i··j! . . - . 1-.:-'- --- .. -. ... :1-., . ., ...... _ .... --++-' ~: ~,:-: '1"':'" ,.J , , I . . r--+-~
~ III
\,Q CD
I~ 0 111
I~
100Hz 1 KHz 10 KHz 100 KHz 1 MHz 10MHz 10Hz .1 KHz
Video Bandwidth I. f. Bandwidth
Video input at 1 MHz 0..44 V.P.P·Centre frequency 35 MHz
Output at CRT 2.44 v. RMS -3db Bandwidth 9&3 MHz
I.f. input at centre frequency -77 dhm
Output at centre
Frequency l.f. Bandwidth
. -} H-H-4·~i-: +-++-t-+-J.++-+~I-lI+f-: +-1 +. +: .: ':::-'c*-; ++++-t-t-+++---t--1.-j : Ii i . -":-+-++++...j.....j-+-+-+++-iT " _~;_ +' +-.~iH .... +-+++-+-!-I ~T!.
o +~-+, --+-.+.-t+ !.f..-..t-.JI--I---4~+, 1fi~~'~' -;...;... ...... T, +--t-ii--+-+-I-+-t-t-...-I
I ; " i !Ii ~ I :., . T I
, , i 1\1 I i , ' ,
+ frequency 22.5 mv. RMS • I +i-I
I
i I rT "
"
I
-30 15 25 " . 35 45 55
Frequency MHz
~ ~ w to.) . . < H .... . 0- 111 (D 0
tIl tIl III III ::s ::s 0-0- ~ ~ .... .... 0-~ rt rt =r =r
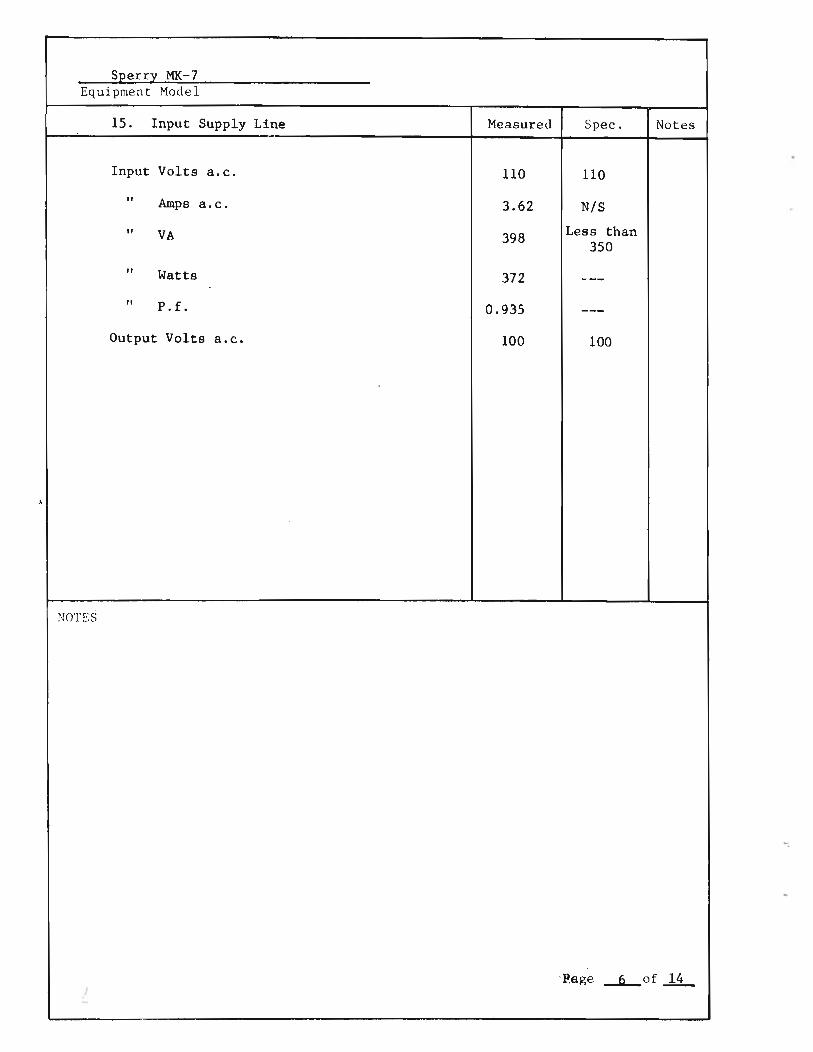
S:eerr;y MK-7 Equipment Model
15. Input Supply Line Measured Spec. Notes -Input Volts a.c. 110 110
" Amps a.c. 3.62 N/S
" VA 398 Less than 350
" Watts 372 ---" P.f. 0.935 ---
Output Volts a.c • 100 100
•
NOTES
I -Page -L.,of ..li..
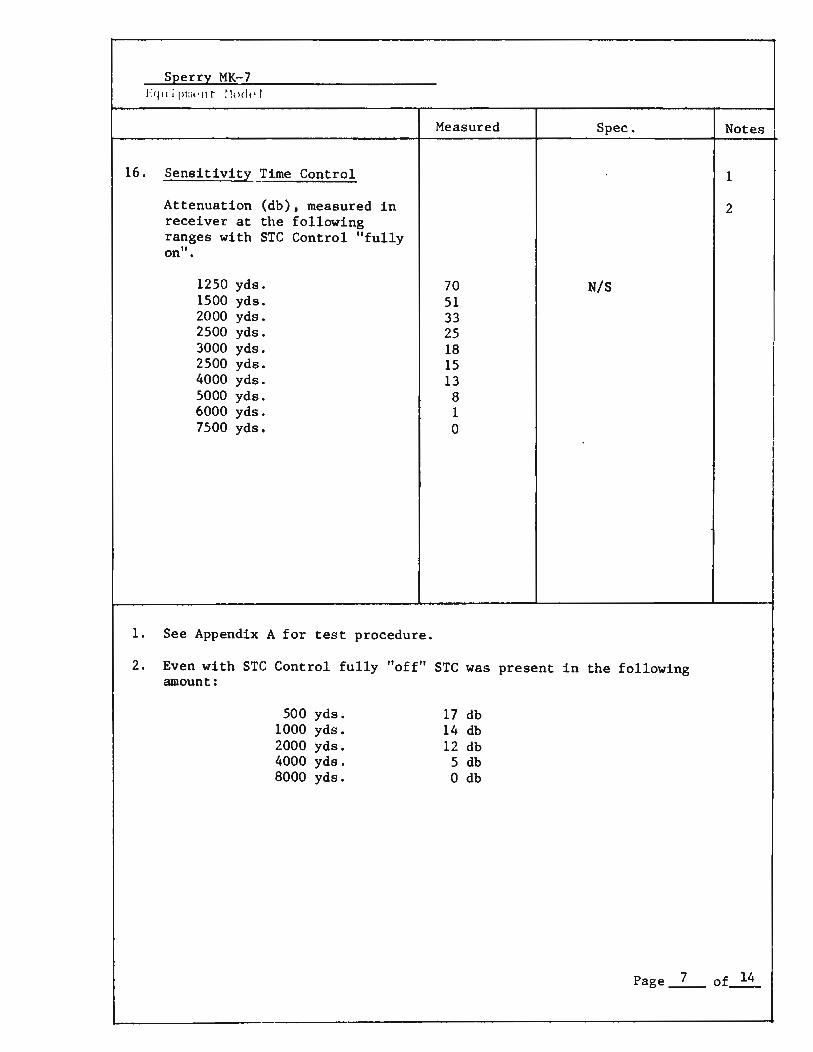
SEerr;t: MK-7 Lqllipllil'llr ~l(ldf'l
Measured Spec.
16. Sensitivity Time Control
Attenuation (db), measured in receiver at the following ranges with STC Control "fully on" •
1250 yds. 70 N/S 1500 yds. 51 2000 yds. 33 2500 yds. 25 3000 yds. 18 2500 yds. 15 4000 yds. 13 5000 yds. 8 6000 yds. 1 7500 yds. 0
1. See Appendix A for test procedure.
2. Even with STC Control fully "off" STC was present in the following amount:
500 yds. 1000 yds. 2000 yds. 4000 yds. 8000 yds.
17 db 14 db 12 db 5 db o db
Notes
1
2
Page_7_ of~
i I

Sperry MK-7 l':'1ui ,. Inl' J) t ~ll'dt' I
17. RANCE RINC ACCURACY
I{ange Ring % VRM % Error Error N.M.
N. Hi. llS Meas \.l S li S Meas ~ I S
3/4 0.5 6.1837 6.2244 +0.7
2 0.5 6.1837 6.2244 +0.7 1.0 12.367 12.380 +0.1 1.5 18.551 18.542 -0.5 2.0 24.735 24.697 -0.2
8 2.0 24.735 24.430 -1.2 4.0 49.469 49.165 -0.6 6.0 74.204 73.916 -0.4 8.0 98.939 98.682 -0.3
16 4.0 49.469 48.751 -1.5 8.0 98.939 97.929 -1.0
12.0 148.41 147.31 -0.7 16.0 197.88 196.73 -0.6
~~I} l . .....
1. See Appendix A for test procedure.
2. Specified accuracy is ~l% of maximum range of scale in use or ~0.03 nautical mile, whichever is greater. This specification was met on all rings.
Notes
1,2
.. ,i .. ' I ,
Page .!-of-4
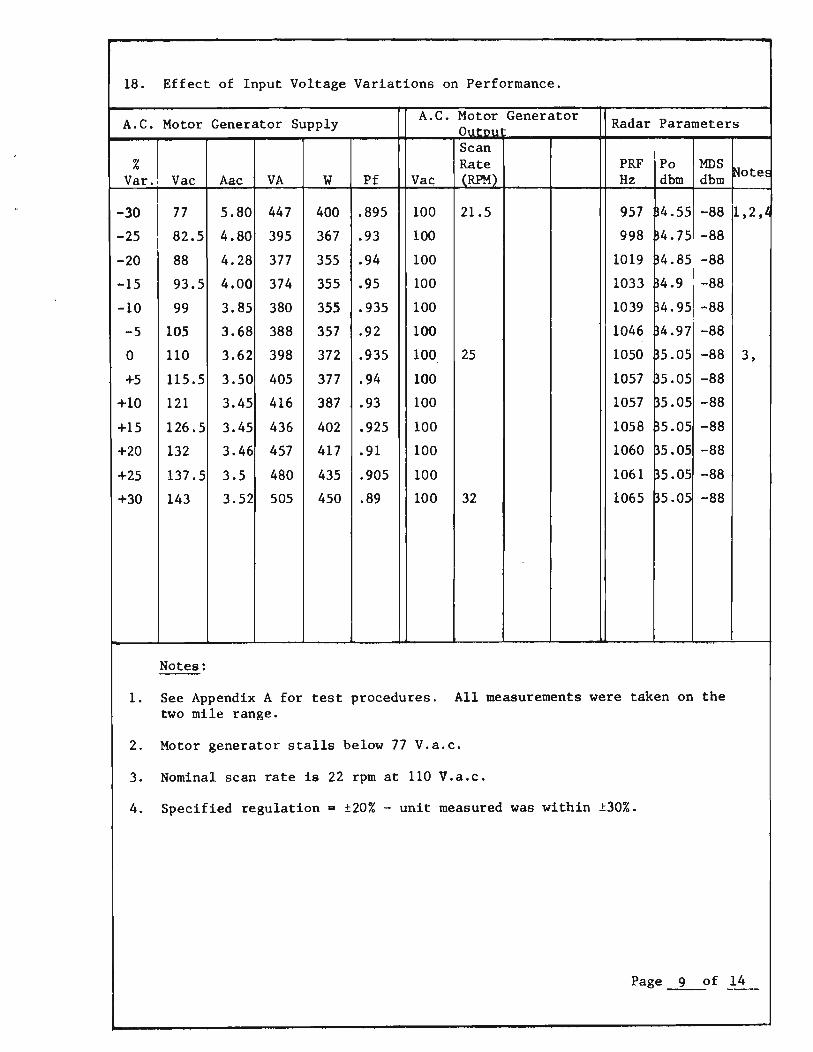
18. Effect of Input Voltage Variations on Performance.
A.C. Motor Generator Supply A.C. Motor Generator Radar Parameters Outou Scan
% Rate PRF Po MDS ~ote~ Var. Vac Aac VA W Pf Vac (RPM) Hz dbm dbm
-30 77 5.80 447 400 .895 100 21.5 957 ~4 .55 -88 1,2 t l
-25 82.5 4.80 395 367 .93 100 998 ~4. 75 -88
-20 88 4.28 377 355 .94 100 1019 ~4 .85 -88
-15 93.5 4.00 374 355 .95 100 1033 1)4.9 -88
-10 99 3.85 380 355 .935 100 1039 ~4.95 -88
-5 105 3.68 388 357 .92 100 1046 ~4.97 -88
0 110 3.62 398 372 .935 100 25 1050 ~5.05 -88 3,
+5 115.5 3.50 405 377 .94 100 1057 ~5.05 -88
+10 121 3.45 416 381 .93 100 1057 ~5.05 -88
+15 126.5 3.45 436 402 .925 100 1058 ~5.05 -88
+20 132 3.46 457 417 .91 100 1060 ~5.05 -88
+25 137.5 3.5 480 435 .905 100 1061 ~5.05 -88
+30 143 3.52 505 450 .89 100 32 1065 ~5.05 -88
Notes:
l. See Appendix A for test procedures. All measurements were taken on the two mile range.
2. Motor generator stalls below 77 V.a.c.
3. Nominal scan rate is 22 rpm at 110 V.a.c.
4. Specified regulation - ±20% - unit measured was within 130%.
Page~f 14
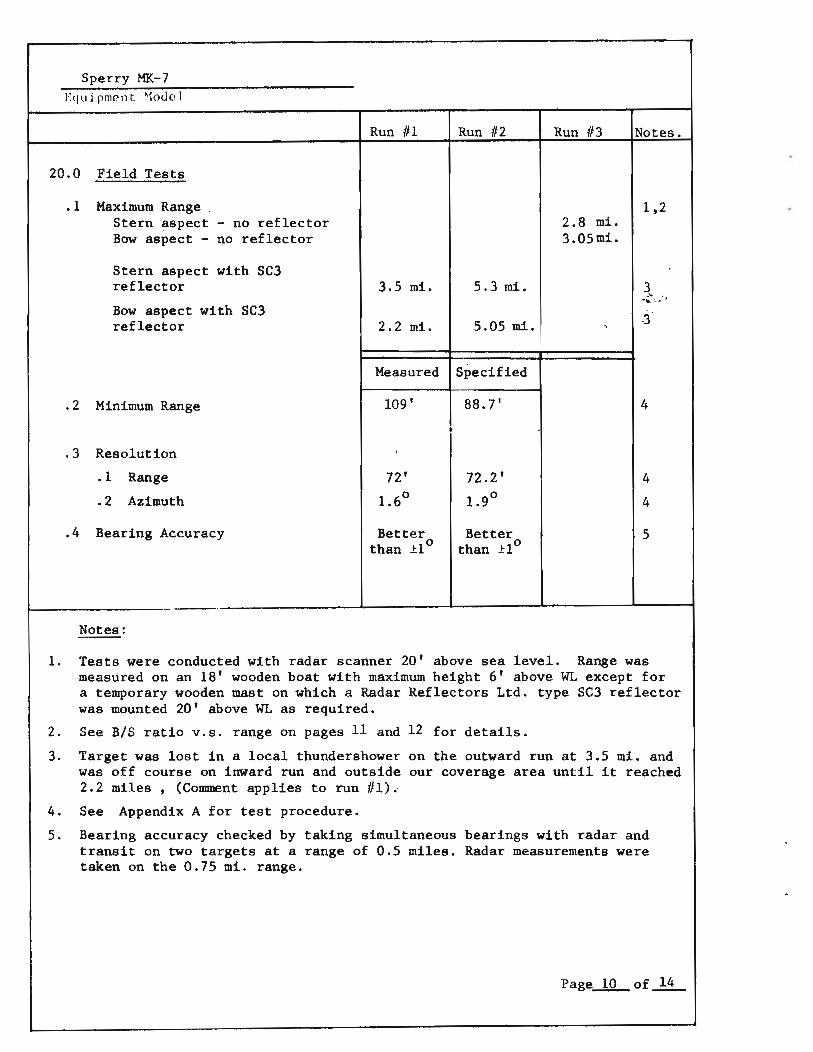
Sperry MK-7 I~quirm(?nt. ~1oc.lel
20.0 Field Tests
.1 Maximum Range Stern ~spect - no reflector Bow aspect - no reflector
Stern aspect with SC3 reflector
Bow aspect with SC3 reflector
.2 Minimum Range
. 3 Resolution
.1 Range
.2 Azimuth
.4 Bearing Accuracy
Notes:
Run III
3.5 mi.
2.2 mi.
Measured
109'
•
72'
1.60
Better than .tl 0
Run 112
5.3 mi.
5.05 mi.
Specified
88.7'
72.2 '
1.90
Better than .tl0
Run 113
2.8 mi. 3.05mi.
",
Notes.
1,2
3 ." . --.:. ',:. . '
-3
4
4
4
5
1. Tests were conducted with radar scanner 20' above sea level. Range was measured on an 18' wooden boat with maximum height 6' above WL except for a temporary wooden mast on which a Radar Reflectors Ltd. type SC3 reflector was mounted 20' above WL as required.
2. See BIS ratio V.s. range on pages 11 and 12 for details.
3. Target was lost in a local thundershower on the outward run at 3.5 mi. and was off course on inward run and outside our coverage area until it reached 2.2 miles, (Comment applies to run Ill)."
4. See Appendix A for test procedure.
5. Bearing accuracy checked by taking simultaneous bearings with radar and transit on two targets at a range of 0.5 miles. Radar measurements were taken on the 0.75 mi. range.
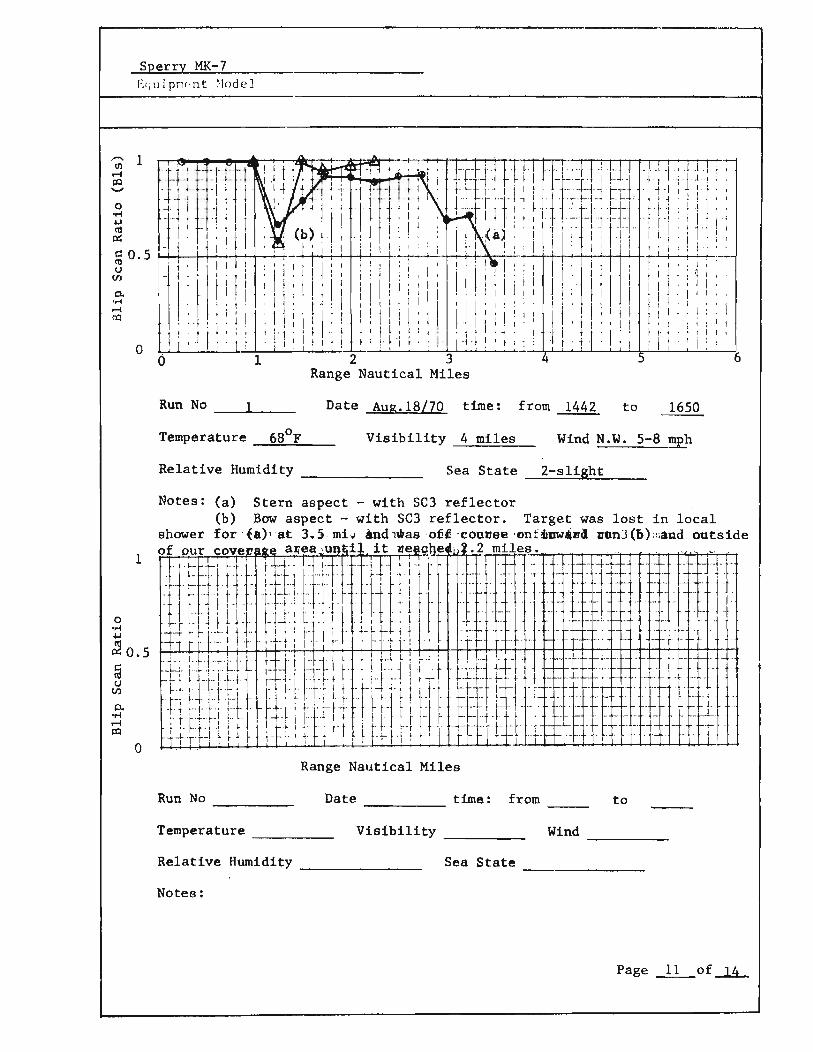
Sperry MK-7 F.qui pnl!'nt ~'Iodel
-1 j' - \ 1 ! o 11 j' ~ ;'" ..-4 .. . ~ ~! I: , ~ 'i II j ,
pc: ,:Jt"" : : i ' 1 ' ! , ;
~ a. 5 H-~++--+-+-'-+--~. -+, ~"""'~.-t-t------+-: ~ '; () : " i : ill : : i" : i , I .
CIl 1 i,! I' , I j I; I I" 1 ! I 0. ' , i : . ,i I 1 I 1 , I I 'M . I 1 : It. , I I, 1 J I I I I j J ' i 1 ~ ; . ~ , 1 ! 1 I I I j f I!! 1 j I : i I \. I ; i : ~ I
; i,t 1 't .: i ,I I 1 , J I : . I I '1 ' 1 , , i : 't l! 1; ttl f. :! ' -t'!!, I :~~ a ~~~~~~~-----~~~ 2 3 '~~~~~~~~-L~~6
Range Nautical Miles
Run No __ 1"--__ Date Aug.lS/7a time: from 1442 to 1650
Temperature 6SoF Visibility 4 miles Wind N.W. 5-S mph
Relative Humidity ______ _ Sea State 2-slight
Notes: (a) Stern aspect - with SC3 reflector (b) .Bow aspect - with SC3 reflector. Target was lost in local
shower for ·ta)"at 3 .. 3 . rob 4nd,was ,' ofii 'conne8 'ont!hnw4ar4 Z!llnJ(b)::.al1d outside
o ·M ..,
of our coverafle aJ;'ea ,un il it ue@gljel l )~ .2 mt et;l. - - '- " 1
1 lu=!t'tlJ rti-; HJ~ ~ , - -q ·l·r · t ' ~ : f t ,- I '-, '+1 ' I~ ~' t- : 1 - {Hi-f :liqhn: tlh IJljJ:ll'[~' ! l"'l ~,:: ~ ',' :t'1,l-' ' I ~ .... . '1~ -,' -' , -_ .. ,' t 'I' .. tI- 1 , '1 J I' 1 tiL' : I'j I I " : 1, t . ' ' '-:- ,! : ' ._ -_ =' ' ~ "j , r "t ~ ~.. -' . --\" 1't' \-' .' I ' : ! " U 1" I It: " I 'I' +-~ +- t J , - - .' i ' - , - , , , - , , 1"1 ~ ; t:: I .~:. t ,q ; I'"" 1;_ : H ,. i ' ! , ' , -. T - 1--' . -
~ 0.5 ," -; H--H+ t, t ~-- t" '+tl 1-_ i l ' ~~. l r .r-l- 1 . -, .. I-
i+1 , - ", r,!:" ' ~ j' - f--', -
_LJ. t,,,,,,, . , ~ 1- --\-! "1- t ,\ ~ I Itt.!1 ,t t r- l' 1 _U ~j-'I'-I,t'H ' r- -4'I ,d ,! ,-;-t +r ~ , +, .. - 'q t - 't " , t'~ -t' ~'f ,. " ,~.. !,l !-!' '-1-'; I t 't-l'~" t· L t --r 11 -1-- - r-' ' ... ' j'-.t-'t,·;,,!L-Lr .. t,: .. Lil.t- .,' ,!·t.lttJ~ -t" ~- 1 t-·_- .- , .. , t H - ,
,t,+ ;"q'j h j' ~~~ ~ : tj:rtt f rl r r IJ t -~l-L±lt±j -- I' ,- -' , -' - -tf--l-'~' ' ~: 1'. t·T!:'! r.- L 1 H I ~+ ~ T' \ i H ;,-f + T' '-t- -t- t- 'r'+- ,- -t - -, - ' ,..j. t +'t-! t ~ J r It l' : t· r· 1 r t-t , T-t i "-I ' j- r - r --+-- rt 11- - , - r '
o Range Nautical Miles
Run No ----- Date _____ time: from __ to
Temperature ____ _ Visibility ____ _ Wind -----Relative Humidity ______ _ Sea State -------Notes:
Page -11-of...l!!...
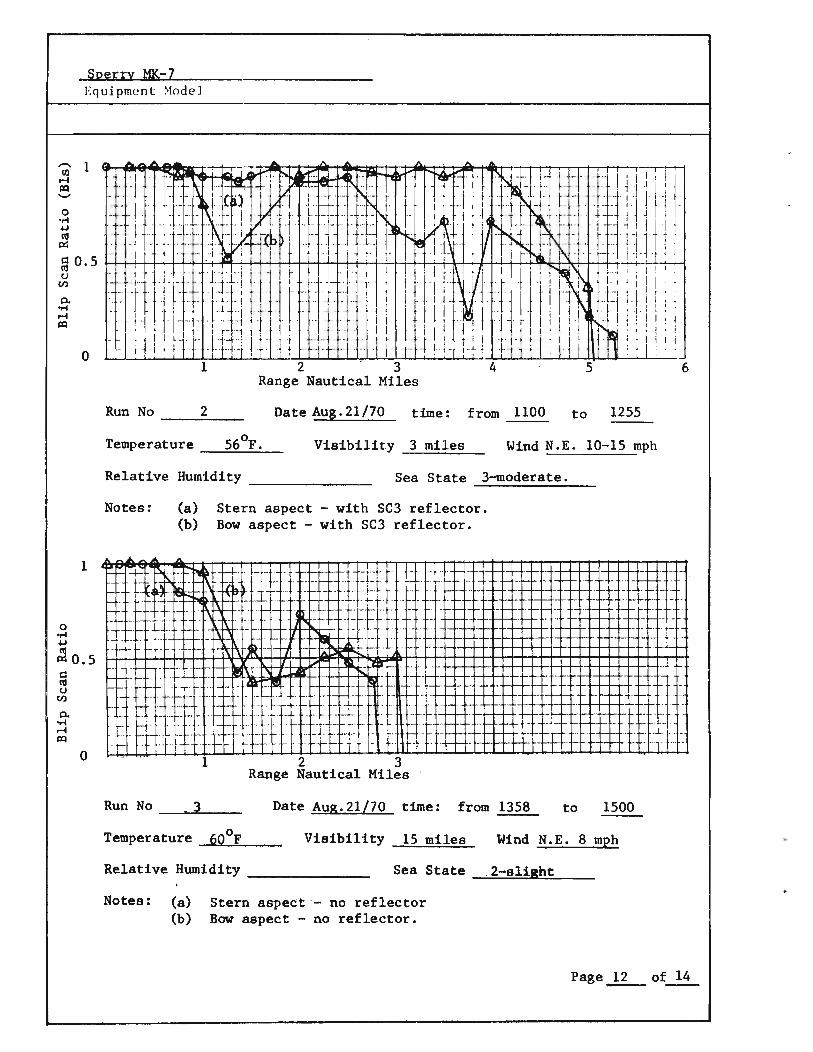
o ..... ~ C\I
p::
Sperry MK-Z E'1 ui pmen t ~l()de]
~ 0.5 CJ til
Po ..... r-I ~
o
1
o
1 2 3 4 5 Range Nautical Miles
Run No __ ..;;2:.-_ Date Aug.21nO time: from 1lO0 to 1255
Temperature _...;5:;..;6;...o..,;:;F....:.._ Visibility 3 miles Wind N.E. 10-15 mph
Relative Humidity Sea State 3~oderate.
Notes:
-------(a) Stern aspect - with SC3 reflector. (b) Bow aspect - with SC3 reflector.
+ ~ .. . p.~1 .. f- ·· · . t 1-1.-- ~- .. - ... t 11 k~ IH t· t - - . - _. -I --'1 . -.
. • I ~.~ .~ ~ I" K~ 1_ . .. ~" • : ~ ~ - t·. .... . : . _ · t- .
. ... - 1-
t--t~- t ~.- .. ~~ .. -t.: .t:. -"'t~ - f-_. ~-. ~.+: . '++-++'H-r- .-1-. J. - I\-~ I- - . - - - . r .- .. '+-++-+-H-++t-++ _. . . -
. -' - ~ . '(.. .. - . . t+1-+-+ ++-H-H t- . . Hi) · rJ ' 1-. t- I +++-++-++-+-H-+i...,-1:-Hr-t-t-r·t-t--ri-
123 Range Nautical Miles
Run No _ ..... ""'30<.-__ Date Aug.21!70 time: from 1358 to 1500
Temperature 600 F Visibility 15 miles Wind N.E. 8 mph
Relative Humidity ______ _ Sea State .2-slight
Notes: (a) Stern aspe~t · - no reflector (b) Bow aspect - no reflector.
r-
6

Sperry MK-7 l'.qll i prnl'lll '·1nrlf'1
~-----------------------------------------------------------------------------~ 21.0 General Comments
.1 Installation - The Sperry Mark-7 consists of three units - a motor-generator, a display unit and an aerial unit which also contains a major portion of the electronics in a waterproof housing. Units are interconnected with multi-conductor cables. Waveguide is not required as the modulator is located in the Aerial Unit. Installation was straight forward except some difficulty was encountered in the color coding - for example it was difficult to distinguish "leafgreen" from "green" and "sky-blue" from "blue". Some difficulty was encountered in the manual as a result of the way some of the notes were translated. The display unit is supplied specifically for either table top or bulkhead or overhead mounting and this is somewhat inconvenient, as it isn't always possible to determine the exact mounting position until the time of installation. Our unit was supplied for table mounting and although the pedestal could be relocated for bulkhead mounting, the cover would not quite fit. A slight re-design of the mounting arrangement would certainly make the set more versatile .
. 2 Mechanical Construction - Overall mechanical construction was judged to be reasonably rugged and of a type well suited for marine use under adverse weather and sea conditions •
. 3 Servicing - The interior of the display unit is readily accessible upon removal of the cover, which is held in place by 10 screws. The printed circuit boards are well labelled and component parts are identified on the boards by circuit number, or, in the case of a preset control, by the control name. The main I.F. and video circuit boards are readily accessible, but the others are stacked and test equipment cannot be connected to them while they are plugged in without the use of a printed circuit board extender, which was not supplied. Seven boards are used, of which 5 are plug-in and two are wired in. All boards are secured by screws to overcome loosening by vibration.
The modulator, I.F. preamp and H.V. supply are housed on a single subassembly mounted in the aerial unit. The assembly mounts on 4 studs, 3 of which are readily accessible, however to get at the 4th stud requires first removing nine 6-32 screws and taking off the H.V. and modulator cover. Removal of these additional screws, while not exceptionally difficult on the bench, becomes awkward under adverse weather conditions, especially when the aerial unit is mounted on a mast or other relatively inaccessible location. This could probably be corrected by slight modifications to the cover or redesign the modulator mounting arrangements. The aerial drive motor is housed in a fiberglass cover at the opposite end of the unit and is easily accessible for maintenance.
Page ..!Lof ..!S.-

Sperry MK-7
Equipment ~odel
21.0 General Comments
.3 Servicing (Cont'd)
The manual has a section covering the theory of operation at an elementary level, which is inadequate for the service technicians but might be of some value to the technically oriented owner. Sections of some schematics were almost illegible, being either blurred or too light. TP40l, while shOwn on schematics, and identified on the equipment, was not referred to in the lineup or testing procedure •
. 4 Operator Convenience - With the hood removed and with the lights* on in the test trailer, the display was just visible but not' adequate for normal viewing. The 7" display is too small for easy viewing, even with the room darkened, however with the optical magnifier, the display was clear and detailed. The viewing hood is very flexible, conforms well to the shape of the face, and is comfortable to use, even when wearing eyeglasses.
This set has more operator controls than most small radars, and they are quite conveniently arranged. However, the lack of panel illumination for the controls is a distinct handicap when operating in a darkened area.
The 0.75 mile range has only one range ring where three would have been preferred.
* Light level above PPI approximately 30 foot-candles
Page 14 of 14

MARINE ELECTRONICS EVALUATION PROJECT
- RADAR -
Conducted Jointly
by
CANADA DEPARTMENT OF FISHERIES & FORESTRY
and the
COLLEGE OF FISHEREIS, NAVIGATION, MARINE ENGINEERING
and ELECTRONICS
July - August 1970
Test Results for Kelvin Hughes Type 17

Kelvin Hughes Type 17
Equipment Model
CONTENTS
Page
Abstract . . . " " " ..... . . . · .. · .... " .......... · ........... 11 - iii
1. Unit Serial Numbers . . . · · . · .. · .. · ... · .. · .. · .. · . · . · .... 1
2. Peak Pulse Power · ... · . · .... · ..... · ..... · . · .. · ... · .. " . 2
3. ·Pulse Width " " " " " " · .. · .. · .. " · . · . " " " " · .. · .. · . " " . " · . " " " . 2
4. Pulse Rise-time · .. · . " " " " . · .. · . . .. · .. · . · . · . · , " " " " · , · . , 2
5. Average Output Power · .. · . · , . · .. · . · , , . · . · . " " " " " ... · . · . 2
6. Average Reflected Power · , . , . , . , · .. · .. · .. · . · .. " " " . · . · . 3
7. Standing-wave Ratio " . " . " . " " · . · . · . · . · .. · , . " " " . · " .. · .. 3
8. Pulse Repetition Frequency · .. " " " · . · . · ... , . · .. · .. " " " " . 3
9. Minimum Discernible Signal , , · . , . · . · .. · . " .. · .. · .. " , ... 3
1'), Sensit~vity . . , " . " " " · . · , , · . · . · . · . · , , . · . · . " . · , · . , . , , , , 3
11. Noise Figure " " " " " " " . " " " . · , · . · . · , · . · " .. · . · . · .. · . · . , , , 3
12. I.F. Bandwidth . . . · .. · , · . , , , , · . · , · . , . , . · , · , • • · , , . · . · , . 4 & 5
13. Video Bandwidth · . , · . · . " ... · . · , , . · . · , , . , , · . · , · , , . · . , , . 4 & 5
14. Limited Signal-to-noise Ratio · .. · . " " .. · . · . · . · . · . · .. 4
15. Input Supply Line , " " " ... " " " , · . · . · .. " .. " · .. , . " ... " . " . 6
16. Sensitivity Time Control · . " " " " " · . , · .. " . " " " . " . , · . " . ' .. " 7
17. Range Ring Accuracy " " " ... " " " " " " . · , · .. " " .... " " " · . " . " . " 8 & 9
18. Effect of Input Voltage Variations on Performanc~ , .. " 10
19. Transformer Rectifier Performance ... · . · . · , · . · . · . · .. 10
20,0 Field Tests · . . , . · . · .. " " " " " · . , .. · . · . · . · . , · , , . , . · .. , , . , , 11
.1 Maximum Range .. . · .. · . · , , , · . · . · . · . · . , , , . · . , , · . """ . , , · . 11
,2 Minimum Range , . · . · . · . · . · . , . · . • • · . · . · . " . • • · " .. " · .. , . · . 11
. 3 Resolution · " " . · . · , " . " . " · . , · , . · .. · . · . · . , . · . " ... " .... · . 11
.1 Range .. · , . " " " " " " " " " " . · . , . " " " " , . · . · . · . · , · .. " " , . , , , 11
.2 Azimuth " " " " , · .. · , " " . " " , , . , . " . " . " . , . , . , . · ... . . · , · , 11
.4 Bearing Accuracy " " . " · . " " " . · .. , . , · . · .. · , , , . " " " " " . , , . , . 11
2L General Connnents · " " " ... " . " .. " .. " . " " " " " " " ... " . " ..... " . 13 & 14
Page i of 11i - -. .

Kelvin Hughes Type 17
Equipment Model
Abstract
The Kelvin Hughes Type 17 ~s a low priced set with a 9 inch PPI which is large enough for effective viewing without the use of an optical magnifier but one could be used depending on oper~tor preference. Peak power was well in excess of specification - the lowest output being 4.35 Kw which was well above the 3 Kw specified. Pulse width was 31% longer than specification on short pulse, 10% shorter on medium pulse but was within 4% on long pulse. Pulse repitition frequency was just over 10% high on both low and high rate.
Noise figure was just 0.2 db short of specification but the IF bandwidth was considerably greater - measuring at 15 ',MHz as opposed to the specified value of 10 MHz. The specified centre frequency was 45 MHz but the IF amplifier was tuned to 60 MHz - a change which wasn't noted in the manual. The video amplifier had very poor low frequency response and the high frequency -3 db point occured at 5.5 MHz rather than at 7 MHz as specified.
The STC control was very effective, and when fully "on", attenuation began at 8000 yards, rising to 73 db at 600 yards. Attenuation was greater than 73 db below 600 yards but no measurements were made because of ' test equipment limitations.
The range ring accuracy of ± 1% was easily met on all rings above 3 mi., but several ranges below 3 miles were out of specification. The error was greatest on the 1/4 mile range where it reached + 5.8%.
The set performed very well for input voltage variations of - 27% to +30%, which was well in excess of the specified value of ±10%. At - 25% input, MDS was reduced by only 1 db while power output was reduced only 0.6 db. PRF however dropped from 1208 pps at nominal supply input to 1044 pps at - 25% input. The exceptional regulation of this radar when operated from d.c. would make it an excellent choice for applications where the main supply was of unavoidably poor regulation. The transformer rectifier however has poor regulation but because of the excess in actual regulation above specification it was judged adequate for most applications.
Range resolution measured at 40 feet which was considerably better than the specification of 60 feet. Minimum range was specified as 60 feet but the initial measurement was 128' which reduced to 74 feet following the installation of a new modulator. Both azimuth resolution and bearing accuracy were better than specification.
Page ii of iii --

Kelvin Hughes Type 17
Equipment Model
Installation was straight forward except for difficulties encountered in determining the terminating point for one of the cables on the time base circuit because of a circuit change which wasn't described in the manual. Installation time was well above average for a set of this size because of the number of individual units, (4 on d.c., 5 on a.c.) which had to be mounted and the large number of inter-unit cable runs required. All units were judged to be well constructed and well suited for service in the marine environment. It was felt however that additional support should be provided the coaxial connectors where they mount on circuit boards. All units were readily accessible for servicing but servicing is made inconvenient because components are not identified on the circuit boards and reference must therefore be made to both the component layout drawing and the schematic when tracing a circuit. The manual was very complete and well written except that schematics were omitted for the new time base circuit as noted above.
The orange-phosphorous, 9 inch CRT gave a good radar picture and the display was judged convenient to use. Controls were well laid out with the frequently used controls on top and the lesser used controls on the front. Numerous options were available but none of these were tested as they wern't fitted on the radar supplied.
Page -111.. of ...1.1J..
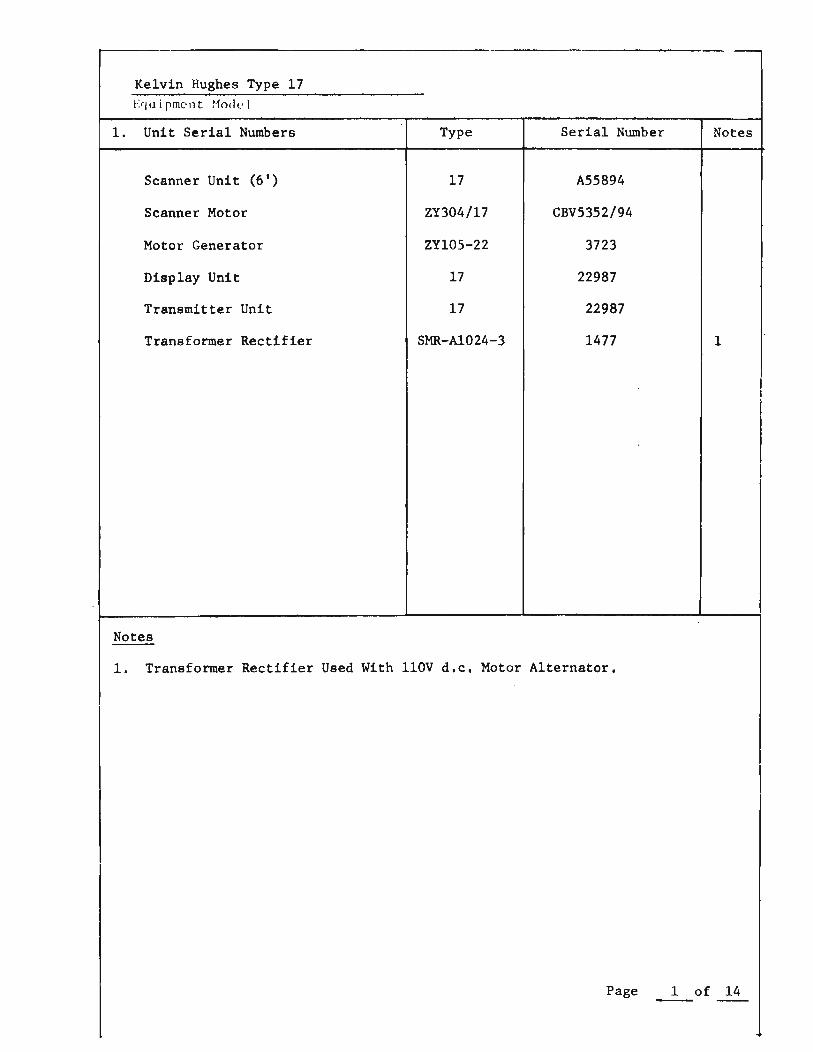
-Kelvin Hughes Type 17 /-:rjuipmc'nt ~1odl'1
1. Unit Serial Numbers Type Serial Number Notes
Scanner Unit (6') 17 A55894
Scanner Motor ZY304/17 CBV5352/94
Motor Generator ZY10S-22 3723
Display Unit 17 22987
Transmitter Unit 17 22987
Transformer Rectifier SMR-AlO24-3 1477 1
I I
I
Notes
1. Transformer Rectifier Used With 110V d.c. Motor Alternator.
I
Page 1 of 14 -- --
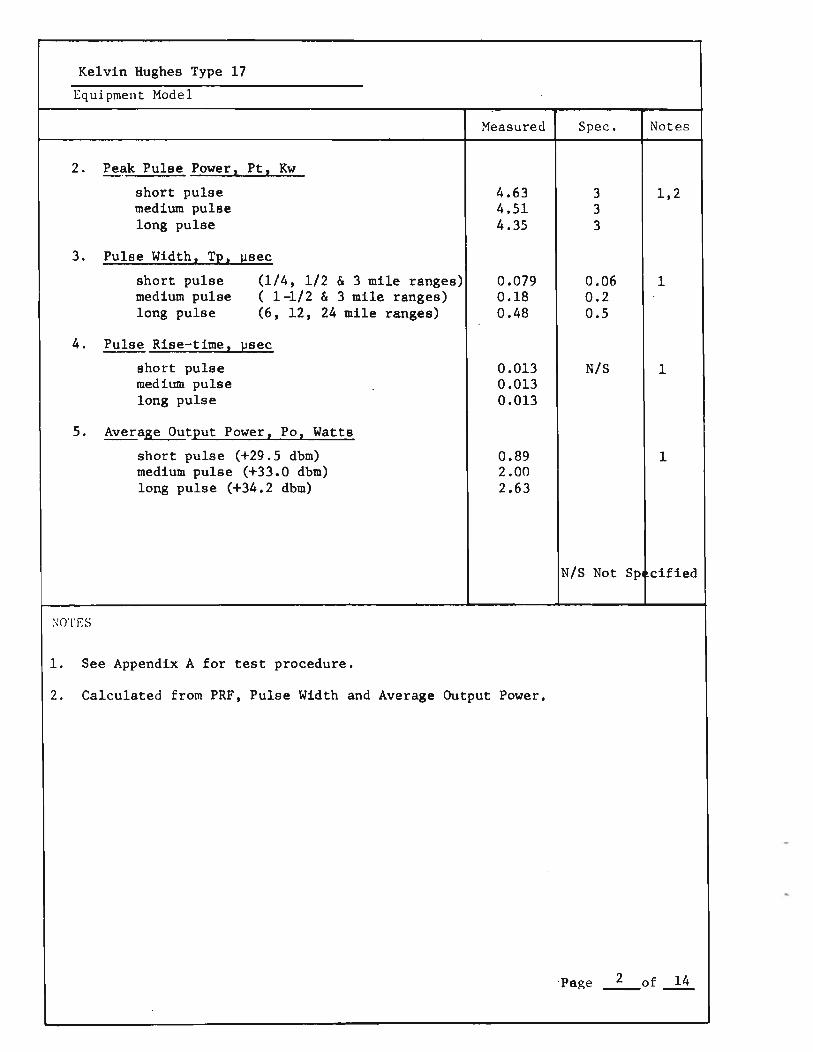
Kelvin Hughes .Type 17
Equipment Model
Measured Spec. Notes
2. ~ak Pulse Power, Pta Kw
short pulse 4.63 3 1,2 medium pulse 4.51 3 long pulse 4.35 3
3. Pulse Width. T2. lJsec
short pulse (1/4, 1/2 & 3 mile ranges) 0.079 0.06 1 medium pulse ( 1-1/2 & 3 mile ranges) 0.18 0.2 long pulse (6 J 12, 24 mile ranges) 0.48 0.5
4. Pulse Rise-time. I:!sec
short pulse 0.013 N/S 1 medium pulse 0.013 long pulse 0.013
5. Average Output Power z Po, Watts
short pulse (+29.5 dbm) 0.89 1 medium pulse (+33.0 dbm) 2.00 long pulse (+34.2 dbm) 2.63
N/S Not Sp cified
:mTES
I. See Appendix A for test procedure.
2. Calculated from PRF, Pulse Width and Average Output Power.
'Page ~of...li.
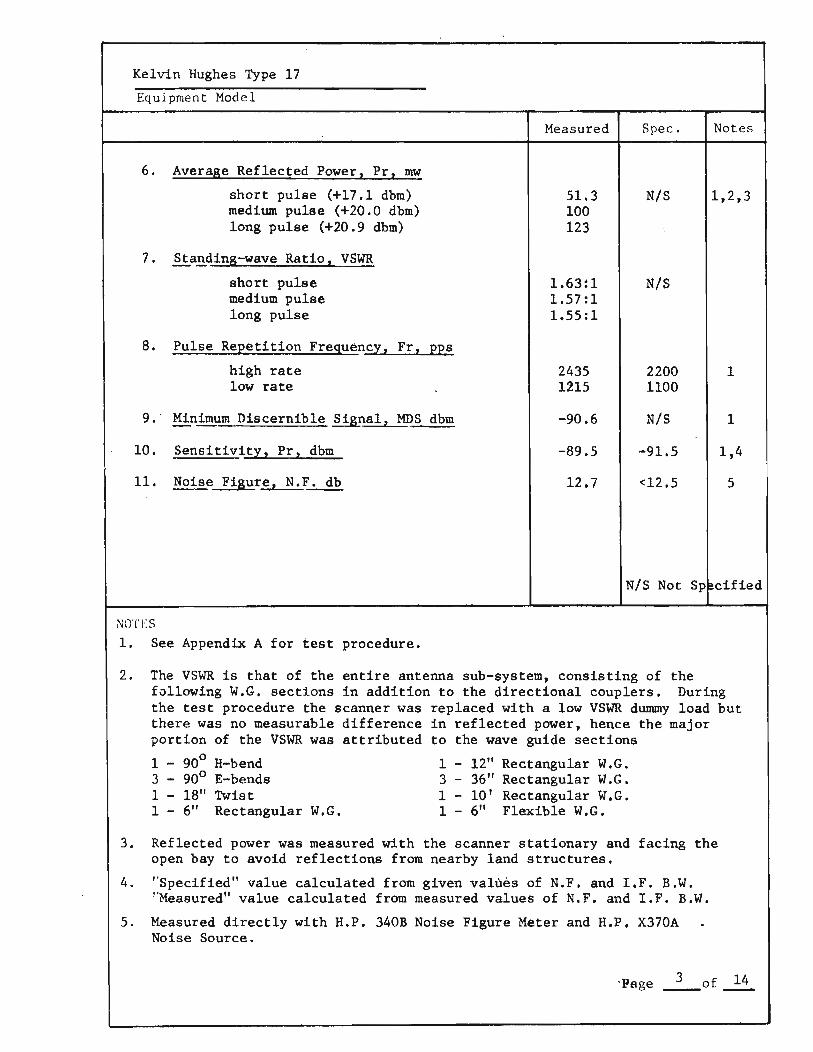
Kelvin Hughes Type 17
Equipment Model
Measured Spec. Notes
6. Averase Reflected Power a Pr z mw
short pulse (+17.1 dbm) 51.3 N/S 1,2,3 medium pulse (+20.0 dbm) 100 long pulse (+20.9 dbm) 123
7. ~andins-wave Ratio z VSWR
short pulse 1.63:1 N/S medium pulse 1.57:1 long pulse 1.55:1
8. Pulse ReEetition FreguencIz Fr z EEs high rate 2435 2200 1 low rate 1215 1100
9. Min~m Discernible Sisna1 z MDS dbm -90.6 N/S 1
10. Sensitivity. Pr, dbm -89.5 -91.5 1;4
11. ~e Fi8ure, N.F. db 12.7 <12.5 5
N/S Not Sp~cified
NOTES 1. See Appendix A for test procedure.
2. The VSWR is that of the entire antenna sub-system, consisting of the following W.G. sections in addition to the directional couplers. During the test procedure the scanner was replaced with a low VSWR dummy load but there was no measurable difference in reflected power, hence the major portion of the VSWR was attributed to the wave guide sections
1 - 900 H-bend 1 - 12" Rectangular W.G. 3 - 900 E-bends 3 - 36" Rectangular W.G. 1 - 18" Twist 1 - 10' Rectangular W.G. 1 - 6" Rectangular W.G. 1 - 6" Flexible W.G.
3. Reflected power was measured with the scanner stationary and facing the open bay to avoid reflections from nearby land structures.
4. "Specified" value calculated from given value's of N.F. and leF. B.W. "Measured" value calculated from measured values of N.F. and leF. B.W.
5. Measured directly with H.P. 340B Noise Figure Meter and H.P. X370A Noise Source.

Kelvin Hughes Type 17
Equipm('nt Hodl'l
Measured Spec. Notes
12. I.F. Bandwidth, B.W. MHz 15 10 1,2
13. Video Bandwidth, ± 3 db 9.6 KHz 7 3
(Reference 100 KHz) to 5.5 MHz
14. 1imited Sisna1-to-Noise Ratio 23.1 N/S 1 ~S/N2 lim db
N/S Not Sp !cified
iWTES
1. See Appendix A for test procedure.
2. Specified I.F. center frequency was 45 MHz, measured center frequency was 60 MHz. See page 5 for I.F. response curve.
3. See page 5 for Video Response curve. Video response was measured by injecting a signal from a nominal constant current source across base resistor R97 on the video amplifier while monitoring the output at the CRT cathode.
-Page ~of~

I' I' I'· /. I I II' . ! . I , !!J I ! I' ! I I' . ,. I !! ! I +lO'~_ . . \ ' j!i : I : IJ'Jl j'" , : !! 11
'1' !.I :-i: !~~d:O: 1~'ndw4Ith .. ' I i ~ i' ··~H-;~:~· ·I: j - - . , . ~~ . ~ ... ··ll-. ::'~ :"·1 ':- .. ' +1 l-.~:: i- ~~Lll'-.. : i ~ ..... :,-1' I: ~ r ; I r II: r= :::::j:~+ IT~-': -::-,fiS ;l·it·'Wl I ++ I I I' .. -1-. ! : : ! I I . ~.-- ; :: .. . _. .. . " !.. 1 ii' "
f-,- _. '. . .4:- . ~, --f · .: !'~ ' I :~,,~. i. 1"" 1 : .. .~. " ~' .. . : I; . i ., --. '-;---;-:~-;-. i. . ~ - -I ....... '- - - - +,i-f-!~ -:--j-··I-I.,-,. Ii' t-!-.-J , , 1----.... 1 ....... i, · ~!< .. ,. " _=1. 2 .. .. I" . ! ""' /·1 · ---~ ... +---.l-... ~ , ..... " +41 f--: ._ ... _!- ,,, , " -- ' - :1" " : ' : . i I -. ;. ;! . .,. " . _ . . -r'" : " i - . . _. - .. ! i :- 'j" . Ii: : ,
01 . . . I : , '. • . _, , . " . il.. ~ !. ' ,
I ,-' .. ~..:~ ·-t ..:l f--r ~: . :: I .. · - t-_~i:.~ : .. :l-.1 ~ -i' .( .:. ... ~ = " ~ ~..:~q--. . ! .. , -; .-. ~...c~~ ~ :~~t~~=r- ~,t· ~: ~:- . ;; ;. :;:;;: --: l. ·::I_~. ~~N" 'II I.'
r-.Q-!'.'- ·· .. t· .... ·, i I '1' .. .. :.+1 ...... ,' '' ' ;. , ..... . ~V"~+- .. '--r" " i ' ;' .. ._._-.. ~-. "' i- : -"t++- .. - . I. ~,
I~ o HI
I~
f--4:j-;--:-' ... : .... , r···· . i \ .. -..... _. -; . ' i l .... - ... ~ .. -~- -- ; 1""7:-7 ";-''''' "i' .. ...... --;-.. ' '" ...... :.- ! . .. ~:-:- ~~ . '. " : ... , " • t '! . ' ! I' I : ' I ' 1 I I
100Hz 10Hz
Video Bandwidth
1 KHz .1 KHz
Video input at 1 MHz 630mVpp
O t t t C 0.8 V rms u pu a RT
10'KHz
I. f. Bandwidth
Centre frequency *60MHz
-3db Bandwidth lSMHz
I.f. input at centre frequency -~8dbm
Output at centre frequency 0.77SV.RMS
*Specified centre frequency 4SMHz
t .
,.J!) , I lOCI I , I
20
100 KHz 1 MHz I.f. Bandwidth
40
l\ ,I
60 Frequency MHz
1\
1\

Kelvin Hughes Type 17
Equipment Hodel
Measured Spec. Notes
15. InEut SUEE1X Line 1 110V dc Motor Alternator
input volts dc 110 110 input amps dc 2.9 N/S input watts 319 N/S
Transformer Rectifier (used with 110V dc -Motor A1ternator2
input volts a.c. 118 input amps a.c. 3.5 N/S input watts 360 N/S input VA 413 N/S input pf 0.871 N/S
output volts d.c. 110 110 output amps d.c. 2.9 N/S output watts 319 N/S
IN/S Not SPI cified
NOTES
1. See Appendix A for test procedure.
'Page 6 of ....!.1. -
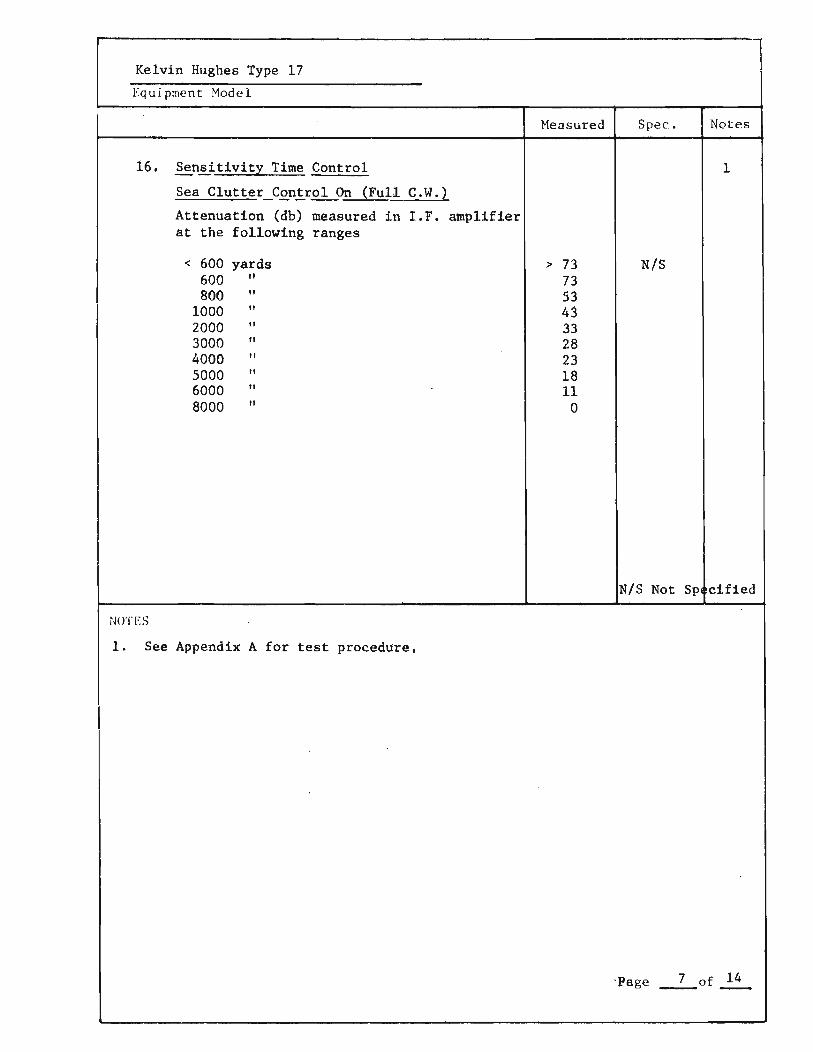
Kelvin Hughes Type 17 1 Equipment Model
Measured Spec. Notes
16. ~nsitivity Time Control 1
Sea Clutter Control On (Fu1! C. W . ) ----Attenuation (db) measured in I.F. amplifier at the following ranges
< 600 yards > 73 N/S 600 " 73 800 " 53
1000 " 43 2000 33 3000 28 4000 23 5000 18 6000 11 8000 0
N/S Not Spl cified
NOTES
1. See Appendix A for test procedure,
-Page 7 of 14 - -

Kelvin Hughes Type 17 E'luil'me nt Model
17. RANCE RI!'lC ACCURACY
I~ange Ring % VRM %
N. ~f. Error Error Notes N. r·1i. liS Heas llS lIS Heas liS
1/4 0.25 3.0918 3.2711 +5.8 1,2
1/2 0.25 3.0918 3.2711 +5.8 0.50 6.1837 6.3075 +2.0
3/4 0.25 3.0918 3.2711 +5.8 0.50 6.1837 6.3075 +2.0 0.75 9.2755 9.3421 +0.7
1 1/2 0.25 3.0918 3.2711 +5.8 0.50 6.1837 6.3075 +2.0 0.75 9.2755 9.3421 +0.7 1.0 12.367 12.378 +0.1 1.25 15.459 15.404 -0.4 1.50 18.551 18.437 -0.6
I 3 0.50 6.1837 6.3273 +2.3 1.0 12.367 12.391 +0.2 I 1.5 18.551 18.455 -0.5 2.0 24.735 24.520 -0.9 2.5 30.918 30.606 -1.0 3.0 37.102 36.674 -1.2 I
I 6. 1.0 12.367 12.493 +1.0 2.0 24.735 24.814 +0.3 I
I 3.0 37.102 37.143 +0.1 4.0 49.469 49.466 0.0 5.0 61.837 61. 808 0.0 6.0 74.204 74.144 -0.1
: ~ I) t l':~
1. See Appendix A for test procedure. I 2. Specified accuracy was ± 1% of the range in use. This specification was I
not met on the 1/4 and 1/2 mile ranges, and on the 1/4 & 1/2 mile rings on the 3/4 mile range. All other rings were within specifications. The error appeared to be caused by a fixed delay of approximately 0.2 ~sec which occurred between the arrival of the "lock pulse" and the generation of the range marker pulse train. There was no adjustment that we could discover to adjust this, and it appeared as though the range marker prf. had been adjusted to compensate for this error on the longer ranges.
8 ()f 14

Kelvin Hughes Type 17 Eq 11 i !,men t Mode l
17. HANCE RT :i(; ACCURACY
l{ange Rin?, % VRN % Error Error Notes
~J. ~1. N. t" i . lIS Meas )IS LIS Meas liS
12 2.0 24.735 24.728 0.0 4.0 49.469 49.441 -0.1 6.0 74.204 74.103 -0.1 8.0 98.939 98.700 -0.2
10.0 123.67 123.45 -0'.2 12.0 148.41 148.01 -0.3
24 4.0 49.469 49.325 -0.3 8.0 98.939 98.528 -0.4
12.0 148.41 147.74 -0.5 16.0 197.88 196.95 -0.5 20.0 247.35 246.45 -0.4 24.0 296.82 295.40 -0.5
: ~ I ) t, .: :.; -
Page ' 9 o f 14 - -
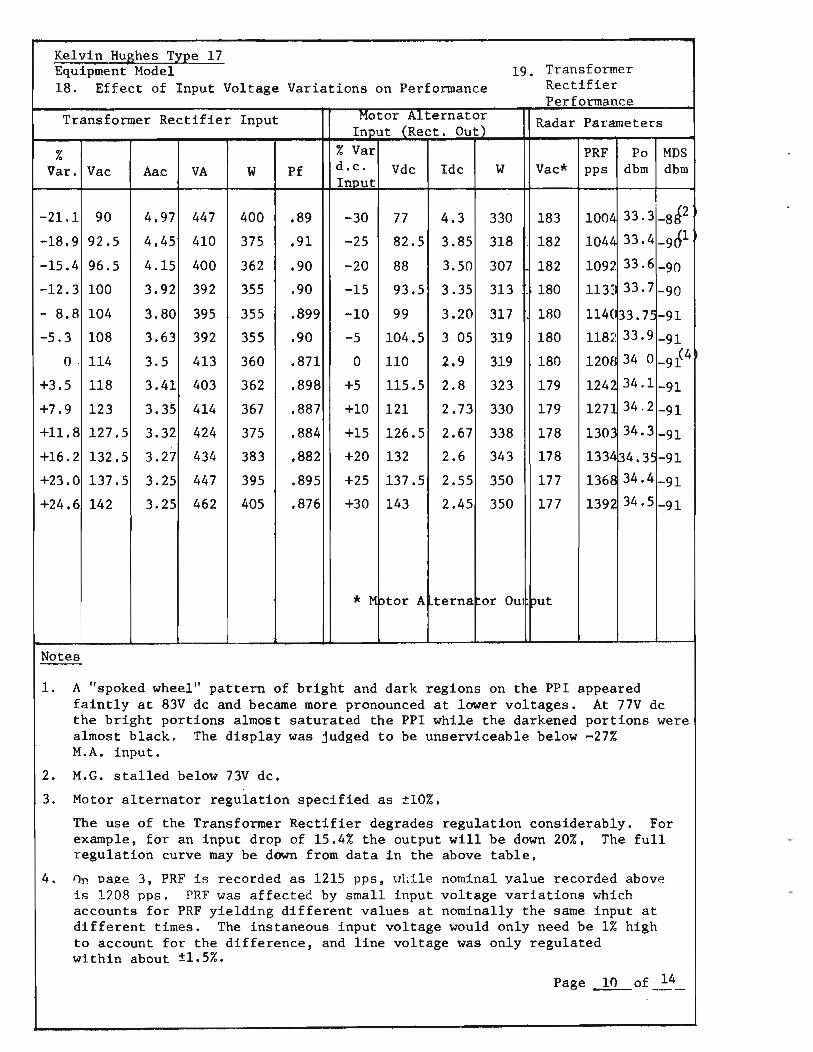
Kelvin Hushes T~Ee 17 Transformer Equipment Model 19.
18. Effect of Input Voltage Variations on Performance Rectifier Performance
Transformer Rectifier Input Motor Alternator Radar Parameters Input (Rect. Out)
% % Var PRF Po MDS Var. Vac Aa.c VA W Pf d.c. Vdc Idc W Vac* pps dbm dbm
Inout
-21.1 90 4.97 447 400 .89 -30 77 4.3 330 183 1004 ' J2 33.3 -8
-18.9 92.5 4.45 410 375 .91 -25 82.5 3.85 318 182 1044 33.4 -961
-15.4 96.5 4.15 400 362 .90 -20 88 3.50 307 182 1092 33.6 -90 -12.3 100 3.92 392 355 .90 -15 93.5 3.35 313 180 1133 33.7 -90
- 8.8 104 3.80 395 355 .899 -10 99 3.20 317 180 114C 33.7~ -91 -5.3 108 3.63 392 355 .90 -5 104.5 3 05 319 180 1182 33.9 -91
o · 114 3.5 413 360 .871 0 110 2.9 319 180 1208 34 0 _9£4
+3.5 118 3.41 403 362 .898 +5 115.5 2.8 323 179 1242 34.1 -91
+7.9 123 3.35 414 367 .887 +10 121 2.73 330 179 1271 34 . 2 -91
+11.8 127.5 3.32 424 375 .884 +15 126.5 2.67 338 178 1303 34.3 -91 +16.2 132.5 3.27 434 383 .882 +20 132 2.6 343 178 1334 ~4.3~ -91
+23.0 137.5 3.25 447 395 .895 +25 137.5 2.55 350 177 1368 34.4 -91
+24.6 142 3.25 462 405 .876 +30 143 2.45 350 177 1392 34.5 -91
* Motor A terna or Ou put
Notes
1. A "spoked wheel" pattern of bright and dark regions on the PPI appeared faintly at 83V dc and became more pronounced at lower voltages. At 77V dc the bright portions almost saturated the PPI while the darkened portions were almost black. The display was judged to be unserviceable below -27% M.A. input.
2. M.G. stalled below 73V dc.
3. Motor alternator regulation specified as t10%.
The use of the Transformer Rectifier degrades regulation considerably. For example, for an input drop of 15.4% the output will be down 20%. The full regulation curve may be down from data in the above table.
4. ()n page 3. PRF is recorded as 1215 pps, \'lL:!.le nominal value recorded above is 1108 pps. PRF was affected by small input voltage variations which accounts for PRF yielding different values at nominally the same input at different times. The instaneous input voltage would only need be 1% high to account for the difference, and line voltage was only regulated within about ±l.5%.
Page 10 of 14 - ----

Kelvin Hughes T~Ee 17 Fquipmf'nt 'loJel.
Run " 1 Run Ii 2 Notes
20.0 Field Te~
.1 Maximwn Range 1,2 Stern aspect - no reflector 2.25 mL Bow aspect - no reflector 2.0 mL
Stern aspect with SC3 4.25 mi. reflector
Bow aspect with SC3 4.1 mi. reflector
-- I---
Measured Spec.
.2 Minimum Range 74' 60' 3,5 to
128'
.3 Resolution
.1 Range 40' < 60' 3
.2 Azimuth 1.190 < 1.2 0
3
.4 Bearing Accuracy Better Better 4. 0 than ±lo than ±l
1--------. ---.-------.....l-----'-----~-----L.--_t Notes
1. Tests were conducted with radar scanner 20' above sea level. Range was measured on an 18' wooden boat with maximum height 6' above WL except for a temporary wooden mast on which a Radar Reflectors Ltd type SC3 reflector was mounted 20' above WL as required.
2. See B/S ratio vs range on page 2 for details.
3. See Appendix A for test procedure.
4. Bearing accuracy checked by taking simultaneous bearings with radar and transit on two targets at a range of 0.4 miles. Radar measurements were taken on the 0.5 mile range.
5. Initial Measurement gave 128' New Modulator gave 74' New Modulator + New TR cell 79'
Page ..ll... of..l!L...

o o
Run No 1 ----- Date Aug 29/70 time: from 0930 to 1053 ---
Temperature ----- Visibility 24 miles Wind North 8 mph
Relative Humtdity Sea State 3 - Moderate
Notes: (a) (b)
-------Stern aspect - with reflector Bow aspect - with reflector
,. , h. f. , ! 'Hi1"~- f . I I • . L j ~ . i. . 1- ; '-'If fl ':tiJ1' IJ~ .1 Jj~ -J ~ I-f 1 .
o . ~ ~
~ 0.5 d t'I) U til
0-~ .-l ~
o
I I ,I, r t [ . ~ \ : -f ~ r HJt '1 ' ,i t l_ ,
t ' ..... 1 iT
... I I + '- . .~~ ,. r t .• ' t ' - ~
~r ~ ':f . -t·
~ .1 -i .~ , ', ... - :t - . I--r i h ~ , .' ,I ! 1'1 I . !. i- r I . • ,
~ ~l - ,I
\, .; J r I I t, , I I' I : It: I • t J r I ! t " _. . - - .: " t;, I • ... ! - : , I. '1 . ~ t .\ l' .. ..
-'1 d T ~' r tJ I' ' "~l- ' . . ~ . -t ~,.i.~ r H· .. . + j . .. L. . -i +- .. t , I , I
. W ! I : L t J:.
~ .,+ .. ;. .. r'jf 'If 1-' .. -t- j~
. . 'I-, - 1 - t t rl r - t t r I r , ~ . -, ' , I, -tit '. I' T ' . r +-
~t t r'
--r . (t-Lt. ' I . , ! ~ I ' .f-.bl ~,1~ ·,tl 'l I t 1 I : , : ; I 1, - i I I., ", t I-
f l , ' 1'; "I L ' I ..I . . I ..
I' t I ' ' l I, t I ~.l -t', ~t 1 J '- -t.t .... r tf I i : I l' .J i I ... I ,
~'~r ~ . \,!! 1 ~ llll' fi l l tJ · r ~' • r t t r : 1 .' , I ij
j ! . t I·t I[ fl '1 ['1:' j- 'll . ~ 1 ,: i L j' - - I i [ ' j " "M- 1 r t , i ! r ( 1 2 3 4 5
Range Nautical Miles
2 Date Aug 29/70 time: from 1055 1142 Run No ----- to
Temperature ----- Visibility 24 miles Wind North 8 mph
Relative Humidity _____ _ Sea State
Notes: (a) (b)
Stern aspect - no reflector' Bow aspect - no reflector
2 - Slight -------
Page 12 of 14
6
6
Kelvin Hughes Type 17 Equipment Model
21.0 General Comments
.1 Installation - The type 17 consists basically of four units when operated from d.c.; a motor - alternator, display unit, transmitter! receiver unit and an aerial unit. In addition, a fifth unit was required to operate from a.c. The transmitter/receiver unit is interconnected to the other units with multi-conductor cables and waveguide is required between the T/R and aerial units. The only difficulty encountered during installation was determining the terminal jac~ for the "lock pulse" coaxial cable from the transmitter. The difficulty arose because the time base circuit board was of a recent type whose schematic and component·diagrams were not included in the handbook supplied. Time required for installation was above average for sets of this size because of the large number of units and cable runs required •
• 2 Mechanical Construction - All units appeared to be quite rugged and well built. While no qualititative tests were made, the radar generally seemed to be of a type that would stand up well in the marine environment. One exception was the timebase and calibrator printed circuit board which flexed a great deal when connecting the coaxial leads to jacks on the board which could result in cracking either the printed circuit board, or one of the etchings. A slight modification in the mounting configuration could reduce the possibility of trouble from this source •
• 3 Servicing - The interior of the display unit is readily accessible by loosening 4 captive screws which allows the front of the display unit to hinge downwards. There are four major printed circuit boards and several smaller tagboards in the display unit, all of which are easily reached for servicing. A minor inconvenience when servicing the type 17 is that constant reference must be made to the printed circuit board component layout illustrations, as well as the schematic diagrams, because components are not identified on the boards. If components were identified, the service technician· ~ould only need to refer to the schematic, thus making his work easier and servicing more efficient.
The transmitter unit cover is easily removed and the printed circuit boards are of the plug in variety and are easily replaced for servicing. All boards are secured by screws to overcome loosening by vibration. Access to the aerial unit motor is obtained by removing seven bolts and a cover plate, whereupon cqnnections may be made to the motor. The motor may be completely removed for servicing upon removal of an additional 4 bolts.
The manual is very complete and well laid out, with a section .. devoted to each unit of the radar. Illustrations are clear and legible with exploded views showing mechanical relationships where necessary. The only problem encountered· with the manual was that it did not include the correct information for the timebase and calibrator circuits as already noted.
Page 13 of 14
Kelvin Hughes Type 17
Equipment Model
21.0 General Comments - Cont'd
.4 ~erator Convenience - With the viewing hood attached, or in semidarkness with the hood removed, the orange-phosphour 9" CRT gave an excellent picture. The display is large enough for use without a magnifier but one could be used, depending on the operators preference. A disadvantage with the type 17 (in common with the 17/12) is the ease with which the PPI can be burned - great care must be exercised to maintain the brilliance at a low level if burns are to be avoided. The number and type of panel controls are such as to give the operator full control of the display. The controls are arranged in two groupings, with the most used controls on the top of the display unit, and the lesser used controls on a recessed panel on the front.
Numerous options are available on t~f Type 17 such as; receiver and transmitter monitor, compass stabil~ation and remote s~itch box but none of these were tested as they were not fitted on the test radar.
Page 14 of 14
MARINE ELECTRONICS EVALUATION PROJECT
- RADAR -
Conducted Jointly
by
CANADA DEPARTMENT OF FISHERIES & FORESTRY
and the
COLLEGE OF FISHERIES, NAVIGATION, MARINE ENGINEERING
and ELECTRONICS
July - August 1970
Test Results for Canadian Marconi lN55

Canadian Marconi LN55
Equipment Model
1.
2.
3.
4.
5.
6.
7.
8.
9.
10.
11.
12.
13.
14.
15.
16.
17.
18.
19.
20.0
.1
.2
.3
.4
21.
. CONTENTS
Abstract .............................................. Unit Serial Numbers
Peak Pulse Power
, ......... . . .... Pulse Width .... · . Pulse Rise-time . . Average Output Power
Average Reflected Power · ..... . ............ · .. . ..... . ...
Standing-wave Ratio · ........ . . .. Pulse Repetition Frequency
Minimum Discernible Signal
. . . . . · . . . . . . . · .......... .
. . ' . . · . . , ... • • . . ....
Sens it i vity
Noise Figure
I.F. Bandwidth
Video Bandwidth
. . . . . . . . . . . . . . . . . . . . · .. , .......... . . . . .
Limited Signa1-to-noise Ratio
Input Supply Line •••••••••••• · ...
· ................ . . ................ .
· . . . Sensitivity Time Control
Range Ring Accuracy
. . . . . . . . · .... , ..... . . .
. . . . . .......... . Effect of Input Voltage Variations on Performance . , ... a.c. Power Supply Performance . ................... . Field Tests . . . Maximum Range
Minimum Range
. . . Resolution . . . .
. . ........... , ........... . . . . . . . ..... , ••• t •••••••••••••
· ................ . .......... .. ' .. · ............................ , ....... . · . . . . . . . . . . . . . . . . . . . ..... . , .. .1
.2
Range
Azimuth .............................. . ......... . Bearing Accuracy ••••••••••• • •• _ ••••• t •••••••• '" •••••
General Comments · .............................. , ..... . Page
I
Page
ii
1
2
2
2
2
3
3
3
3
3
4
4 & 5
4 & 5
6
6
7
8
9
9
10
10
10
10
10
10
10
12 & 13
i of ii
..
Canadian Marconi LN55
Equipment Model
Abstract
The Canadian Marconi LN55 is a low priced set with a 10 inch PPI which is large enough for effective viewing without a magnifier. Peak power was below specification - the output being 4.11 Kw on long pulse and 5.62 Kw on short pulse, whereas the specification required 6 Kw. Pulse repetition frequency was within 1.5% of specification.
Noise figure was 1.7 db short of specification and the IF bandwidth was considerably narrower measuring at 3 MHz as opposed to the specified bandwidth which was 5 MHz. The video amplifier had poor high frequency response but as no value was specified, a comparison couldn't be made. Power required at 36 volt input was 207 watts which was near the specified value which was 198 watts.
The STC control was very effective and when fully on, attenuation began at 2000 yards, rising to 65 db at 260 yards. The specified range ring accuracy was ±2% which was easily met on all, ranges.
The specified regulation of ± 20% was met except that MDS was reduced to -81 dbm at -20% input which represents a 12 db drop in receiver sensitivity. The set continued to work down to ~30% input but as MDS was reduced by 47 db and bri1lance was noticeably affected the set was considered inoperative at this voltage. MDS could be optimized however down to -25% input using the front panel tune control and when retuned the set functioned with no reduction in MDS but the set couldn't be retuned by the front panel control at -30% input. Power Output was down only 0.3 db at -20% but was down 5.3 db at -30%. PRF was relatively independent of input voltage and was only slightly reduced at -30% input. The 'a.c. power supply was well regulated at reduced input but regulation progressively deteriorated for inputs above nominal.
Range resolution was measured as 90' feet which was better than the specification of 105 feet. Minimum range was 120 feet but no value was specified for comparison. Both azimuth resolution and bearing accuracy were better than specification.
Most of the installation wiring was performed by the company and no problems were experienced. The unit tested was wired for 36 volts but the operating voltage may be changed by replacing a plug in adaptor and one resistor. Operation from a.c requires a separate rectifier which had excellent low voltage regulation. The radar was judged reasonably well built and ~.gged without being unduly bulky and should be able to stand up well in the marine environment. Servicing was judged to be convenient as all components were clearly labeled and readily accessible.
The orange phosphor 10 inch CRT provided an excellent radar picture with the viewing hood in place but some light filtered in around the bottom of the hood which was objectionable because it tended to obscure weak signals. The control illumination al~o interfered with the PPI presentation and the bearing cursor was positioned too far from the bearing scale 80 that it was difficult to take an accurate bearing.
Page ...i!.- of....!!....

-_.
Canadian Marconi LN55 Equipment :!otiel
l. Unit Serial Numbers Type Serial Nwnber Notes
T/R Unit LN55/2/40 1290
Display Unit LN55/1 1510
A. C. Power Supply Unit 189-790/20 155 Antenna Drive Unit LN66 336
Scanner '(4' ) LN66 446
Page.--L..of .Jl... .

Canadian Marconi LN55
Equipment Model
Measured Spec. Notes
2. Peak Pulse Power l Ptl Kw 2
long pulse 4.11 6 short pulse 5.62 6
3. Pulse Width l TEl Ilsec 1
long pulse 0.29 N/S short pulse 0.11 N/S
4. Pulse Rise-time l lJsec 1
long pulse 0.01 N/S short pulse 0.01 N/S
5. Average OutEut Power, POI Watts 1
long pulse (+32.45 dbm) 1,.76 N/S short pulse (+30.12 dbm) 1.03 N/S
.
N/S Not SPE cified
NOTES
1. See Appendix A for test procedure. For these tests d. 0'". supply voltage was maintained at 36.0V de.
2. Calculated from pulse width, PRF and average output power.
2 of 13
'.Pege - -

Canadian Marconi LN55
Equipment Hodel
Measured Spec. Notes
6. Average Reflected Power z Pr z mw 1
long pulse (-3.7 dbm) 0.427 N/S short pulse (-6.6 dbm) 0.219 N/S
7. Standing-wave Ratio z VSWR 2
long pulse 1.03: 1 short pulse 1.03 :1
8. Pulse Repetition Frequency, Fr z pps 1477 1500 1
9. Minimum Discernible Signal, - MDS, dbm -94 N/S 1
10. iensitivit~t Pr z dbm -95.5 -95 3-
N/S Not Sp cified
::UTES
1. See Appendix A for test procedure.
2. The VSWR is that of the ent-ire antenna sub-system, consisting of the following W.G. sections in addition to the directional couplers.
1 - E bend 2 - 24" sections of rectangular W.G. 1 - 10' section" " " II
1 - 24" section of flexible waveguide
3. "Measured" value calculated from measured values of Noise Figure and LF. Bandwidth "Specified" value calculated from given values of I.F. Bandwidth and Noise Figure.
-Page 2-of ~

Canadian Marconi LN55
Equipment Model
Measured Spec. Notes
11. Noise Figure, N.F. , db 13.7 12 1
12. I.F. Bandwidth, BW, MHz 3 5 2
13. ~deo Bandwidth, ±3 db 500 Hz N/S 3. (Reference 100 KHz) to
580 KHz
N/S Not Sp4cified
~WTES
1. Measured directly with H.P. 340B Noise Figure Meter and H.P. X370A Noise Source.
2. See page 5 for I.F. response curve. Measurements made with constant 50%, 1000 Hz modulated signal applied to J301 from 50n source. Output level monitored at J303 with H.P. 3400A T.R.M.S V.T.V.M. and maintained at O.15V rms. Response was read from the calibrated attenuator of the H.P. 608-C Generator.
3. See page 5 for video response curve. Measurements made with video input applied to P303 from constant voltage son source and output measured at PPI cathode with T.R.M.S. V.T.V.M.
'Page -Lof -ll
I~ o Hi
It;
10 KHz 100Hz 10Hz
1 KHz .1 KHz Frequency
Video Bandwidth I.f. Bandwidth
V·d· 1 MH 0.4SV. A.P. f 30 MHz l. eo 1nput at ,Z . Centre requency
Output at CRT 3.1V. rms -3db Bandwidth 4.5 MHz
I.f. input at centre frequency -84 dbm
Output at centre frequency Q«1~V« rms
o
-20
-40
-60
~t-' t- .U I I-f-ttH-f
,
f+-!~ r-tJ . I--r-- .i. - -I .. :
-+ • , _ t ,
1.+ ---M i
! 1 I
. t
-T ,
-+-
I
t-i 10
;
100 KHz
;
, I I}
.L I
, , I
,
+
rT
20 30
I
1 MHz I.f. Bandwidth
,
1
:
40
Frequency MHz
.. (.oJ . < .... 0.
3 &'
1 8. ~. ~ rt ::r
50
10MHz
.. N . I-i $ (".I . 0) HI C ::s « .... 0)
i 0.-Q:I ..... III CD
0) .
::s ::s ::s 0. rt :x :( ....
~ III 0. 1'1 rt 0. n ::r CD § t-J ....
~ ~ ~

Canadian Marconi LN55
Equipment Model
Measured Spec. Notes
14. ~i~!igna1-to-Noise Ratio, (S/N) lim db 16.7 N/S 1
15. Input Supply Line
input volts d.c. 36.0 36.0 input amps d.c. 5.75 5.5 input watts 207 198
d.c. Supp1X
input volts a.c. 118 115 input amps a.c. 2.68 2.1 input watts 243 N/S input VA 316 N/S input pf 0.77
output volts d.c. 36.0 36.0 output amps d.c. 5.75 5.5. output watts 207 198
N/S Not Sp cified
NOTES
1. See Appendix A for test procedure.
•
-Page --L of 13 -

Canadian Marconi LN55
Equipment Nodel.
16. Sensitivity Time Constant Measured Spec. Notes
,I
Sea Clutter Control On (Fully C.W.) 1,2 Attenuation Measured in I.F. Amplifier at the following ranges:
260 yards 65 db 300 yards 62 db 400 yards 49 db 500 yards 46 db 600 yards 33 db 700 yards 13 db 800 yards 8 db
1000 yards 5 db 1500 yards 1 db 2000 yards o db
NOTES
1. See Appendix A for test procedure
2. Measured on 4 mile range
'Page -1-of .J..l...
~

Canadian Marconi LN55
r:quil'mt:'nt Model
17. RANCE RINC ACCURACY
i{ange Ring % VRM p, lu
N.~I. Error Error Note~
N. Hi. pS Meas \15 pS ~1eas 115
1 1/4 3.0918 3.1285 +1.2 1,2,3 1/2 6.1837 6.1462 -0.6 3/4 9.2755 9.2164 -0.6 1 12.367 12.371 0
4. 1 12.367 12.653 +2.3 2 24.735 24.980 +1.0 3 37.102 37.327 +0.6 4 49.469 49.675 +0.4
8 2 24.753 25.164 +1. 7 4 49.469 49.848 +0.8 6 74 .. 204 74.526 +0.4 8 98.939 99.246 +0.3
16 2 24.735 25.147 +1. 7 4 49.469 49.822 +0.7 6 74.204 74.506 +0.4 . 8 98.939 99.230 +0.3
10 123.67 123.81 +0.1 12 148.41 148.55 +0.1 14 173.139 173.27 +0.1 16 197.88 197.98 +0.1
1. See Appendix A for test procedure.
2. Calibration ring trigger delay adjusted for best accuracy using preset control R29 on the Time Delay Circuit Board.
3. Specified accuracy of ±2% of range in uSe was easily met for all range rings.
PagE:' 8 of 13
, I I I t I I
18. Effect of Input Voltage Variations on Performance Canadian Marconi LN55
19, a.c, Power Supply Performance Equipment Model
a.c. Power Supply Input Radar Input - {a.c. Supply Out)
Radar Parameters
% Var % Var , Scan a.c. d.c. PRF Po MDS IRate Input Vac Aac VA W Pf Input Vdc Idc W pps dbm. dbm rpm
-28.0 85 2.22 188 145 0.772 -30 25.2 4.95 125 1456 'J7.P (2) 18
-22.8 91 2.35 214 163 0.761 -25 27 5.25 142 1465 '9.2<; (3)
-16.1 99 2.5 248 193 0.778 -20 28.8 5.6 161 1475 32 .1~ (4)
-13.5 102 2.52 257 198 0.775 -15 30.6 5.6 171 1477 32.3c -93
-9.3 1b7 2.56 274 213 0.78 -10 32.4 5.7 185 1477 32.4c -93
-4.2 113 2.62 296 225 0.76 -5 34.2 5.75 197 1477 32.4c -93
0 118 2.68 316 243 0.77 · 0 36 5.75 207 1477 32.4c -93 22.5
+4.2 123 2.7 332 253 0.763 +5 37.8 5.8 219 1477 ~2 .4c -93
+8.5 128 2.75 352 265 0.575 +10 39.6 5.85 232 1477 32.5 -:-93
+11.9 132 2.77 362 275 0.76 +15 41.4 5.85 242 1477 ~2.5 -93
+15.7 136.5 2.8 382 285 0.746 +20 43.2 5.9 254 1477 ~2.5 -93
+21.2 143 2.86 409 305 0.745 +25 45 6 270 1477 ~2.5 -93
+22.S 150 2.92 438 330 0.754 +30 46.8 6.15 288 1477 ~2.5t -93 26.5
NOTES: 1. See Appendix A for test procedure. 2. At -30% input, bri11ance was noticeably reduced and MDS was down to -46 dbm.
MDS couldn't be optimized by the front panel tune control but was adjusted to optimum (-90 dbm)by use of the Klystron tune control, but as this wasn't a normal operating adjustment, the radar was considered inoperative at this voltage.
3. At -25% input, MDS was reduced to -68 dbm but was adjustable to -93 dbm by use of the front panel tune control.
4. At -20% input, MDS was reduced to -81 dbm but was adjustable as above to -93 dbm.
5. Specified regulation ±20%.
6. The a.c. power supply unit was well regulated at reduced input but regulation progressively deteriorated for inputs above nominal. The full regulation curve may be drawn from the above data.
Page 9 of 13

Canadian Marconi LN55
Fo u.i pment 'lodf'.l
Run 111 Run 112 Notes
20.0 Field Tests 1,2
.1 Maximum Range
Stern aspect - no reflector 2.28 mi Bow aspect - no reflector 1.9 mi. Stern aspect with SC3 reflector 7.5 mi. Bow aspect with SC3 6.8 m1. reflector
I Measured Spec.
.2 Minimum Range 120' Nls
.3 Resolution
.1 Range 90' 105' 3
.2 Azimuth 1.670 1.80 3
.4 Bearing Accuracy Bettero Than ±l ±lo 4.
1-------0
___ o __ o _____ '--___ -'-___ -.JL-------"---j
NOTES
1. Tests were conducted with radar scanner 20' above sea level. Range was measured on an 18' wooden boat with maximum height 6' above WL except for a temporary wooden mast on which a Radar Reflectors type SC3 reflector was mounted as required. The boat was tracked well beyond range of the last hit in all cases.
2. See Bls ratio vs. range on page 11 for details.
3. Measurement made at 7/16 mile.
4. Angular separation of two targets measured at 1/2 mile and checked by transit.
Page ~ of --11.

Canadian Marconi LN55
. ]_.,- ~-1
. t .. ~- ~ : '·1 . .f •• ~ .I , :
I I
1 -. i
.~t·r· 1 ,j :'
,-t .. i
+J .•. -.,. ... t-. I· ... -, '
~ t· L-! ,-! .i- - ,-~ ~ .. l:~ I:, .
m 0.5 ~ __ ~~_4r~ __ ~~~ __ ~~~~~ __ -+_r+~~~~.~~~~~~~~~;~.i~· t_~_!_-!~~j-: -~; ~ ~ L1: : . i;:·~l··t ~~. : 1: : . ~~ 1: i-rt~--l t·_!.,;:. ,1.·1 :-~- ; : j
f-J ~-I; !.~_L -)-~i-I :- !---'-I - I- -t'Tf"!' l··J· . ' : . I :. I I
a • .-4 ~ ~
o
1
~ 0.5
~ u til
0-.~
...-I t:Q
o
. 'I ; L J • 1-1':- : r: . : . ! I I -r·L- f ' .. : -r ·l~ - I::l;-_~ . .i" I,' . ,: '1' l . . t-!t; .. : !~.l"i:.it···t··L. + ' .. ;' -! • : -I·! ' : : j. : 1'--·\' , ' I i L 1 -- +')'--f I''''' :': i : - i -j ': ' : t ' , ! : : ~ ~ -: - :. _ " ' ! i : :. +-.- '-1 --, . JI ·-1 -t : j , -; - ,. i, t t· ... ·t t I·r ·, • t-1 ; -, .- ~ •. . t · · - t · ~·,...L. , •. ~ .. I.. i .. t-~ ~ l'j' ! , : l-~ ,.J .-! . -:- . - 1 I • j., '; :'--·,·t- L1 ~·-'-'r -! - - I_ -I, ' '. -
. !, • I • I , ' . I l ' ' •.••
2 4 6 10 Range Nautical Miles
1 Date Sept. 3/70 time: from 1445 1720 Run No ----- to
T 54°F emperature Visibility 22 miles Wind North - 15 mph -----Relative Humidity Sea State 3 - moderate --------Notes: (a) Stern aspect-with reflector.
(b) Bow aspect - with reflector.
A A A I\/\.
1 2 3 Range N~utical Miles
4 5
Date Sept. 4/70 time: from 1015 to 1107 ·2 Run No ---:..--- ---Temperature ----- Visibility 22 miles , Wind North 3-5 mph
Relative Humidity _________ ___ Sea State 1 - smooth
Notes: (a) (b)
Stern aspect - no reflector Bow aspect - no reflector.
12
Page -1l....of..lL
Canadian Marconi LN55
Equipment Model
21. General Comments
21.1 Installation - The LN55 was received pre-mounted on a rack and panel with the interconnection between display unit and TIR unit made by the local representative, so installation at our test site was confined to connecting waveguide and a cable from TIR unit to scanner. This was done according to the manufacturers instructions and no problems were encountered. The unit tested was wired for 36V and operation from l3.6V or 26.4V d.c. ±20% is possible by changing plug-in adapters and one resistor, while 110 or 220V a.c. operation requires a rectifier unit •
. 2 Mechanical Construction - The display, TIR, and antenna units all appear to be reasonably well built and rugged without being unduly bulky, and should be able to stand up well in the marine environment .
• 3 Servicing - The front portion of the display hinges downwards upon release of two pressure clamps, to expose the printed circuit boards and preset controls. The printed circuit boards are of the plug-in variety, held in place with screws to prevent loosening by vibration.
All components were clearly labelled with their schematic designation for easy identification when -servicing the unit. The circuit boards are well spaced, easily accessible, and may be changed quite quickly for servicing.
In the I/R unit, the klystron, crystal and several test points are exposed by releasing two pressure clamps and removing the cover. Removal of a further cover is ~ecessary to service the modulator section. A good feature is inclusion of an additional Antenna motor "On-Off' : Switch and a High Voltage "0n-Qff" Switch in the TIR unit, which could be a great convenience when servicing the unit.
Removal of four screws in the scanner unit provides access to the antenna drive motor and gear box, the synchro generator and heading marker switch •
• 4- qperator Convenience - The 10" diameter, orange phosphor display was visible though slightly "washed out" under lighting conditions in our trailer, but provided an excellent display in semidarkness or with the viewing hGod in place. It was noticed that there was some light filtering in around the bottom of the viewing heod which could obscure weak signals in the presence of strong sunlight.
Page ...J.L.of ll.-
---'-~'---'
I r'-I
"~anadian Marconi LN55 ,', ._--------------- , I ~quipment Model (.0- •. -....:..--=-----------------------------.. ---........ --. L--~ __ ~_j_ .• __ G_'e_.n_e_r_a_l __ c_o_mm __ e_n_t_s ___ c_o_n_t_'_d _________________________________________________ -;
21. 4 Cant. ' d
The control grouping was found to be convenient, although the lack of a front panel antenna motor "On-Off" Switch was noted, (the antenna motor switch was located on the preset control unjt inside the hinged cover of the display unit), The besring cursor was difficult to use in that it was positioned [sbout 3/16" from the bearing scale, which made it difficult to take au accurate bearing. The edge lighting of the top panel plexiglass for control name illumination was very effective, but partly obscured the p.p.i. image for about 1 1/4" inward from the edges when adjusted for adequate control illum:l.nation which required that the control illumination be kep~ very low.
Page 13 of..11-
APPENDIX A
TEST PROCEDURES
1. Average Output Power .....••..•.....•.................... 1
2 ·. Reflected Power .........•..................•..........•. 1
3. Calculation of VSWR •.............•.....•.........•..... 2
4. Calculation of Peak Pulse Power ...•.....••........•..... 2
5. Pulse Vo'idth ........................•..............•.... 3
(; . Pulse Rise Time ..........................•...........•.. 3
7. PRF - Pulse Repitition Frequency .......•.•............... 3
8. MDS - Minimum Discernible Signal ........•.••.•......•.... 4
· 9. Receiver Sensisivity ...•.................•....•.•.•.... 5
10. I. F. :Bandwidth ......................••.•••.•.....•..•... 6
11. Video Band\l,ldth ....................••.•.••.•••.••.....•. 7
12. Limited Signal-to-Noise Ratio .•.•..•....•......•..•..... 8
13. Power Supply Measurements ...•••••...••..••..•••••...•.•• 9
14. SensHivity Time Constant ..••....•..•.••..•...••....••.• ·10
15. Range Ring Accuracy ..••.•..••••••. • •••••.•..••••.••.•••. 11
16. Effect of Input Voltage Variations On Performance •••.••. 12
Ii. Test Procedures For Field Tests ••.••..••.•••..•..•••.••• 13
APPENDIX B
1. Mclp of Test Site ....• . .....••.••.•.......•......• , ...••. 1
2.0 Photographs
.1 Overall View of Test Site ....•.............••..••.....•. 2
.2 Radar Platform and Test Bench Area ........•...•......•. 3
.3 Bow and Sterri. View of Test Boat .....•...•....•...••....• 4
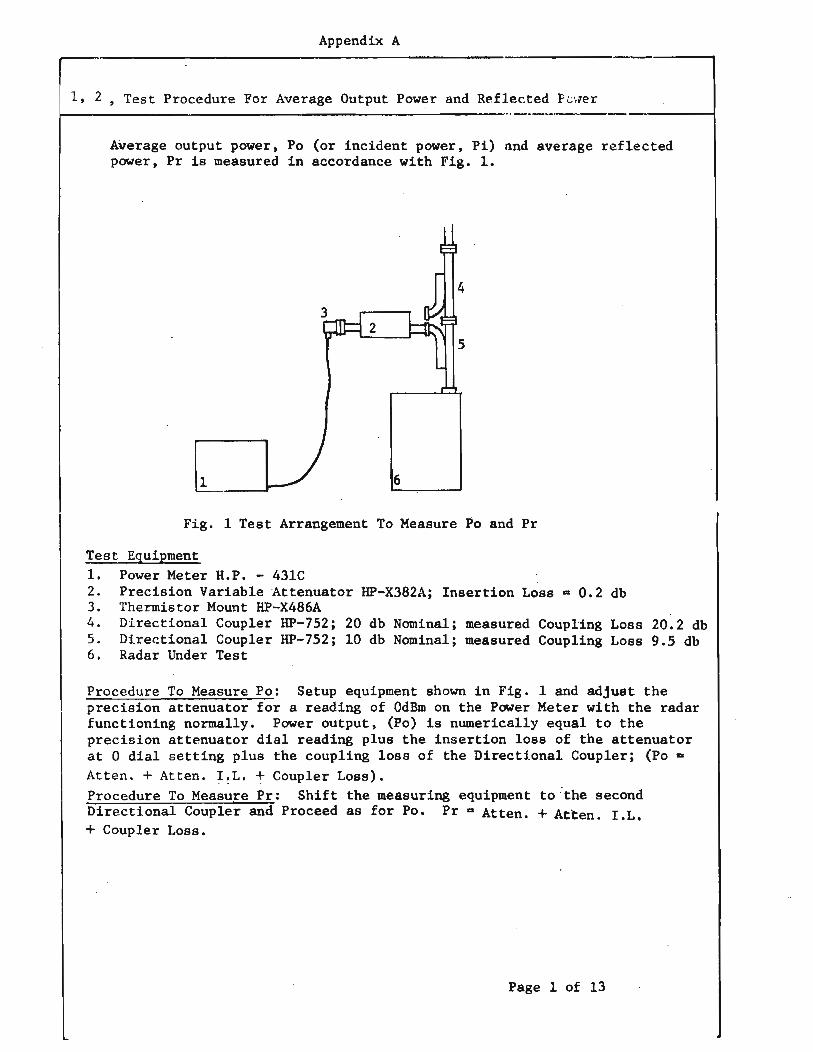
Appendix A
1, 2 , Test Procedure For Average Output Power and Reflected PU.ler ~--------------------------.. -.--------
Average output power, Po (or incident power, Pi) Bnd average reflected power, Pr is measured in accordance with Fig. 1.
1 6
Fig. 1 Test Arrangement To Measure Po and Pr
Test Equipment 1. Power Meter H.P. - 43lC 2. Precision Variable Attenuator HP-X382A; Insertion Loss - 0.2 db 3. Thermistor Mount HP-X486A 4. Directional Coupler HP-752; 20 db Nominal; measured Coupling Loss 20.2 db 5. Directional Coupler HP-752; 10 db Nominal; measured Coupling Loss 9.5 db 6. Radar Under Test
Procedure To Measure Po: Setup equipment shown in Fig. 1 and adjust the precision attenuator for a reading of OdBm on the Power Meter with the radar functioning normally. Power output, (Po) is numerically equal to the precision attenuator dial reading plus the insertion loss of the attenuator at 0 dial setting plus the coupling loss of the Directional Coupler; (Po -Atten. + Atten. I~L. + Coupler Loss). Procedure To Measure Pr: Shift the measuring equipment to :the second Directional Coupler and Proceed as for Po. Pr - Atten. + Atten. r.L. + Coupler Loss.
Page 1 of 13

Appendix A
3. Calculation Of VSWR
At the point of measurement, power output is equal to the incident
power into the antenna system, hence Pi for VSWR calculation is
taken equal to Po measured in section 1.
VSWR .. .{Pi + nr ./Pi - ~
where Pi and Pr are expressed in watts
4. Calculation Of Peak Pulse Power
Pt was calculated using measured values of average output power, pulse
repetition frequency and pulse width as:
Po Pt • Tp x Fr
where Pt is peak transmitted power in watts
Po is average output power in watts
Tp is pulse width in seconds
Fr is pulse repetition frequency in pulses/second
Page 2 of 13
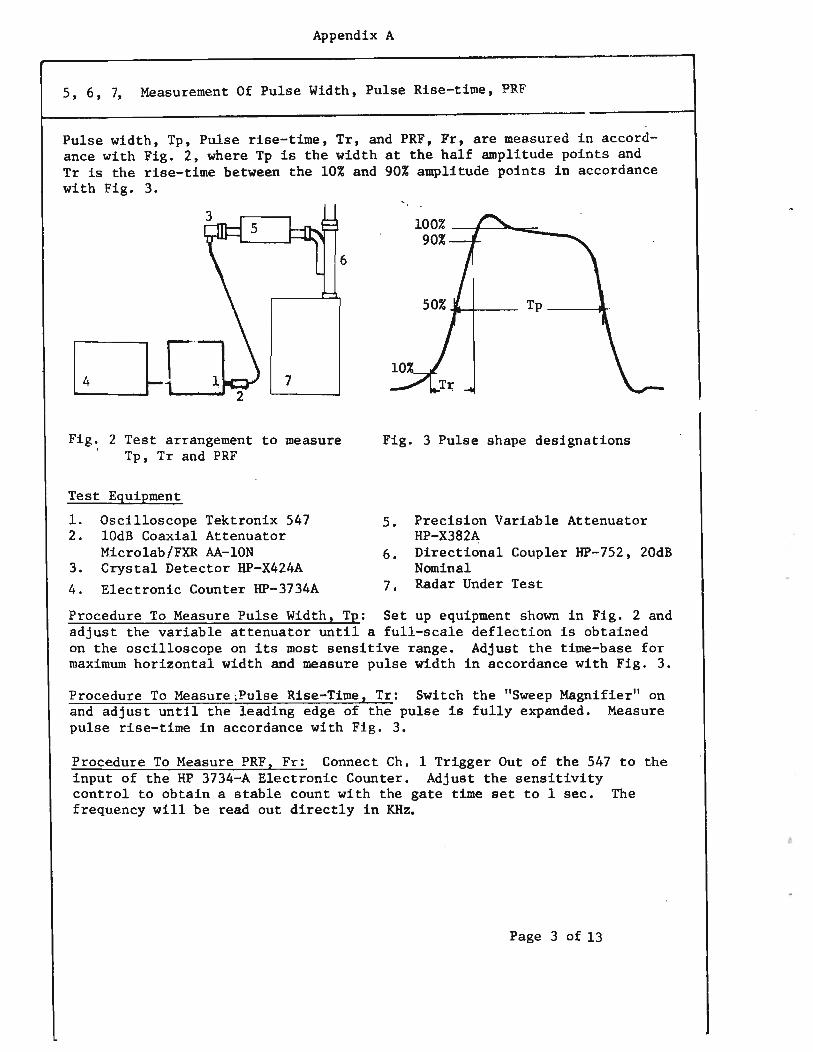
Appendix A
5, 6, 7, Measurement Of Pulse Width, Pulse Rise-time, PRF
Pulse width, Tp, Pulse rise-time, Tr, and PRF, Fr, are mea.sured in accordance with Fig. 2, where Tp is the width at the half amplitude points and Tr is the rise-time between the 10% and 90% amplitude points in accordance with Fig. 3.
6
Fig. 2 Test arrangement to measure Tp, Tr and PRF
Test Equipment
1. Oscilloscope Tektronix 547 2. lOdB Coaxial Attenuator
Microlab/FXR AA-lON 3. Crystal Detector HP-X424A 4. Electronic Counter HP-3734A
100% --:t---. ..... _~ 90%
Tp ----ill-
Fig. 3 Pulse shape designations
5. Precision Variable Attenuator HP-X382A
6. Directional Coupler HP-752, 20dB Nominal
7. Radar Under Test
Procedure To Measure Pulse Width, Tp: Set up equipment shown in Fig. 2 and adjust the variable attenuator until a full-scale deflection is obtained on the oscilloscope on its most sensitive range. Adjust the time-bas.e for maximum horizontal width and measure pulse width in accordance with Fig. 3.
Procedure To Measure ,Pulse Rise-Time, Tr: Switch the "Sweep Magnifier" ·on and adjust until the leading edge of the pulse is fully expanded. Measure pulse rise-time in accordance with Fig. 3.
Procedure To Measure PRF, Fr: Connect Ch. 1 Trigger Out of the 547 to the input of the HP 3734-A Electronic Counter. Adjust the sensitivity control to obtain a stable count with the gate time set to 1 sec. The frequency will be read out directly in KHz.
Page 3 of 13
Appendix A
8. Test Procedure For Minimum Discernible Signal, MOS
The Minimum Discernible Signal, MDS, is measured in accordance with Fig 4
R.F. Out
1 - - --,
Trig. , 5 6 7
, , I
L- ________ -----__ ...I
Heading Marker
10 Modulator Trigger Pulse
Fig. 4. Test Arrangement To Measure MOS
Te!,t Equipment
1. Radar Test Set HP-X624C. Attenuator Accuracy; t2 dB 2. Six foot Coaxial Cable RG-214/u, HP-11500A, measured insertion
loss 2.6 dB. 3. Waveguide-to-coaxia1 transformer, HP-X28LA measured insertion
loss 0.25 dB. 4. Ferrite Isolator - M1cro1ab/FXR X157A 5. T/R Unit 6. Display Unit 7. Modulator Unit 8. Directional Coupler, HP-752, 20 dB nominal 9 • Dummy Load
10. Modular Pulse Generator, General Radio 1395-A
Procedure To Measure MOS
Set up equipment as shown in figure 4. Adjust the HP-X624C to provide a 0.5 ~sec pulse to the receiver input. Adjust the GR1395A to provide the same number of pulses as a point target (P.T.) return - which is given by Ant. B.W. x PRF Adjust the X624C until the synthetic
6 x Scan Rate (rpm) target is visible on the PPI and position it to within 1/3 of the PPI radius of the edge of the PPI. Reduce the input level until the target is not visible and shift its position on the PPI. Slowly increase the input level until the target is just discernible in the noise. MOS is the generator attenuator reading minus the loss of the coaxial cable. waveguide-to-coaxia1 transformer, ferrite isolator and directional coupler. The HP X624X generator has an accuracy of t2 dB from -10 to -100 dbm.
Ant BW is Antenna beamwidth in 0 between 1/2 power points. PRF is pulse repitition frequency in pulses per second.
Page 4 of 13
I
.1 i
I .:
L-___________________________________________________________________________ -~
•
Appendix A
9. Test Procedure For Receiver Sensitivity, Pr
The Sensitivity, Pr, is measured in accordance with Fig, 5
4
1,- --' .
i 61-----------1 I I
3
I I
~ ~ ~:--~ I I
2 I 7 8. I L..-.--r--t,-i'fodulator Trigger PUla ...... ---------'- - - - -..- - - - ..
9 1
B __ M. Pulse
Fig. 5. Test· Arrangement To Measure Pr
Test Equipment
1. 2. 3.
4.
5. 6. 7. 8. 9.
Modular Pulse Generator, General Radio l395A Radar Test Set HP-X624C. Attenuator Accuracy; ±2 db. Six foot Coaxial Cable, RG-2l4/u, HP-11500A; measured insertion loss ·2.6 db. Waveguide-to-coaxial adapter, HP-X28lA measured insertion loss 0.25 dB Termination HP-X9l0B Radar Under Test T/R Unit Display Unit Oscilloscope Tektronix 547
Procedure To Measure Pr: D~~able tQe transmitter and set up the equipment shown in Fig. 5. Set the generator for 2 lJsec pulse and adjust 'the generator for minimum output. Measure the noise level with the receiver input terminated first with the HP~X9l0B and then with the generator. The difference is the generator noise, Ng. With the generator connected, increase the generator signal level until the detected pulse level is increased by an amount equai to (3 db - Ng). The sensitivity is the generator attenuator reading minus the loss of the coaxial cable. minus the loss of the waveguide-to-coaxial transformer.
Page 5 of 13

Appendix A
10. Test Procedure For I.F. Bandwidth, Bw.
The I.F. Bandwidth, Bw,is measured in accordance with 118. 6.
1_- __
Fig. 6. Test Arrangement To Measure leF. Bw
Test Equipment
1. Signal Generator HP-608C. Attenuator Accuracy = ±l db. 2. Radar Under Test 3. I.F. Amplifier 4. Video Detector 5. True RMS V.T.V.M., HP-3400A 6. Signal Generator, HP-X624C 7. Waveguide-to-coaxial Transformer, HP-X28!A 8. Ferrite Isolator, MicroLab/FXR X157A . 9. Oscilloscope, Textronix 547 with !AI Plug-in.
10. Frequency Counter, Beckman 6120.
Procedure To Measure Bw: Disable the transmitter and set up the equipment shown in Fig. 6. Tune the generator to the I.F. frequency and adjust the attenuator to give a video detector output signal of about 6 db above noise. Record the input and output levels. Vary the input frequency in 1 MHz increments above and below the center frequency while adjusting the input level to maintain the reference level established at the center frequency. Plot the I.F. re~ponse as:
Response at ~f = Input at Center Frequency in dbm - Input at ~f.
Alternate Procedu~e (used when input to I.F. Amplifier is inaccessible): Disable the transmitter and set up the equipment shown by the dotted lines in Fig. 6. Set Radar tune control to midpoint. Adjust the HP-X624C frequency, C.W. signal, for maximum. indication on oscilloscope. Measure the I.F. frequency on the counter using .1 sec gate time or less and record 624C reference attenuator setting. Maintain a constant level on the oscilloscope with the 624C attenuator as the generator frequency is adjusted to give the desired I.F. check points. Plot the I.F. response as above.
Page 6 o~ 13

Appendix A
11. Test Procedure For Video Bandwidth
The Video Bandwidth is measured in accordance with Fig. 7
. ...... r------,
13 I 1 I I
I I I I ~ 1
I 4 I 5 I I L ______ ..J
-2
Fig. 7. Test Arrangement To Measure Video Bandwidth
Test Eguipment
1. Signal Generator GR-1001A and HP 209-A 2. Oscilloscope Tektronix 547 3. Radar Under Test 4. Viedo Amplifier 5. RMS Voltmeter, HP-3400A
Procedure To Measure Video Bandwidth: Disable the transmitter and s~t up the equipment shown in Fig. 7. Tune the generator to 1 MHz and adjust the attenuator to give a video amplifier output level just below limiting. Record the input and output levels. Vary the frequency above and below the reference frequency in a 1, 2, 5 sequence while maintaining the input level constant. Measure the output level in db below or above the reference level with the 3400 A VTVM.
Response at 6f - output at reference frequency (db) - output at 6f (db)
Page 7 of 13
Appendix A
12. Test Procedure For Limited Signa1-To-Noise Ratio
The Limited Signa1-to-noise Ratio is measured in accordance with Fig. 8.
4
3
2 1
Fig. 8. Test Arrangement To Measure (S/N)ltm
Test Equipment
1. Oscilloscope Tektronix 547 2. Radar Under Test set for normal operation 3. VTVM, HP-3400A 4. Dummy Load
Procedure To Measure (SIN) lim: Set up the equipment shown in Fig. 8 with the oscilloscope connected after the video limiters with Radar gain set for normal viewing. Adjust the oscilloscope to measure the limited signal from the TX pulse that appears at the start of the trace. Measure the RMS noise with the 3400A. The limited signa1-to-noise ratio is:
(SiN) .. (20 10 peak signal vOltage) -3 db lim g rms noise voltage
Page 8 of 13
~ _________________________________________________ _______ I
Appendix A
13. Test Procedure For Power Supply Measurements
The performance of the d.c. power supply is measured in accordance with Fig. 9.
Fig. 9. Test Arrangement To Measure d.c. Power Supply Performance -
Test Equipment
1. Variable Auto-transformer 2. Industrial Analyzer Weston 639 3. d.c. Power Supply Under Test 4. d.c. Ammeter Stark 523 5. d.c. Voltmeter Simpson 270 6. Radar Under Test
Procedure To Measure d.c. Power ~uEPly Performance:
Set up the equipment shown in Fig. 9. With the d.c. power ' supply strapped "NOMINAL", adjust and measure the a.c. input quantities required for rated d.c. output. If necessary, restrap the d.c. supply to obtain rated d.c. output. Vary the a.c. input in ± 5% increments and measure both a.c. input and d.c. output quantities. Minimum a.c. input voltage variation should be ± 30% or until radar detection performance shows marked deterioration. For d.c. operated radars replace item 3 with a variable d.c. supply of suitable rating and proceed as above but only measuring d.c. output quantities.
Page 9 of 13

•
Appendix A
14. Test Procedure For Sensitivity Time Constant, STC
The performance of the sensitivity time constant is measured in accordance with Fig. 10.
6
,- - - --, Sync I
Out I I
Pulse I 1 In 2 I 4 5
I I
I I ---1---Modulator Trigger Pulse
Fig. 10. Test Arrangement To Measure STC
Test Equipment
1. Modular Pulse Generator GR 1395-A 2. Radar Test Set HP-X624C 3. Radar Under Test 4. Preamplifier, I.F. amplifier and video detector 5. Oscilloscope Tektronix 547 6. WG to Coaxial Adapter lIP X-28lA
Procedure To Measure STC: Disable the transmitter and set up the equipment shown:tn Fig. 10 and apply a trigger from the modulator simultaneously to the l395-A "sync-in" and the 547 "Ext. Trig". Measure the pulse amplitude with the STC control first off and then fully on. Adjust the pulse position to the range at which there is no attenuation with the STC on. Note the pulse amplitude and the X624C reference attenuator 'setting. Position the pulse at successively closer intervals to the start of the timebase and increase the generator output to 'maintain the pulse amplitude constant. The STC attenuation at each position is given by the HP-X624C attenuator setting minus the reference level.
Page 10 of 13
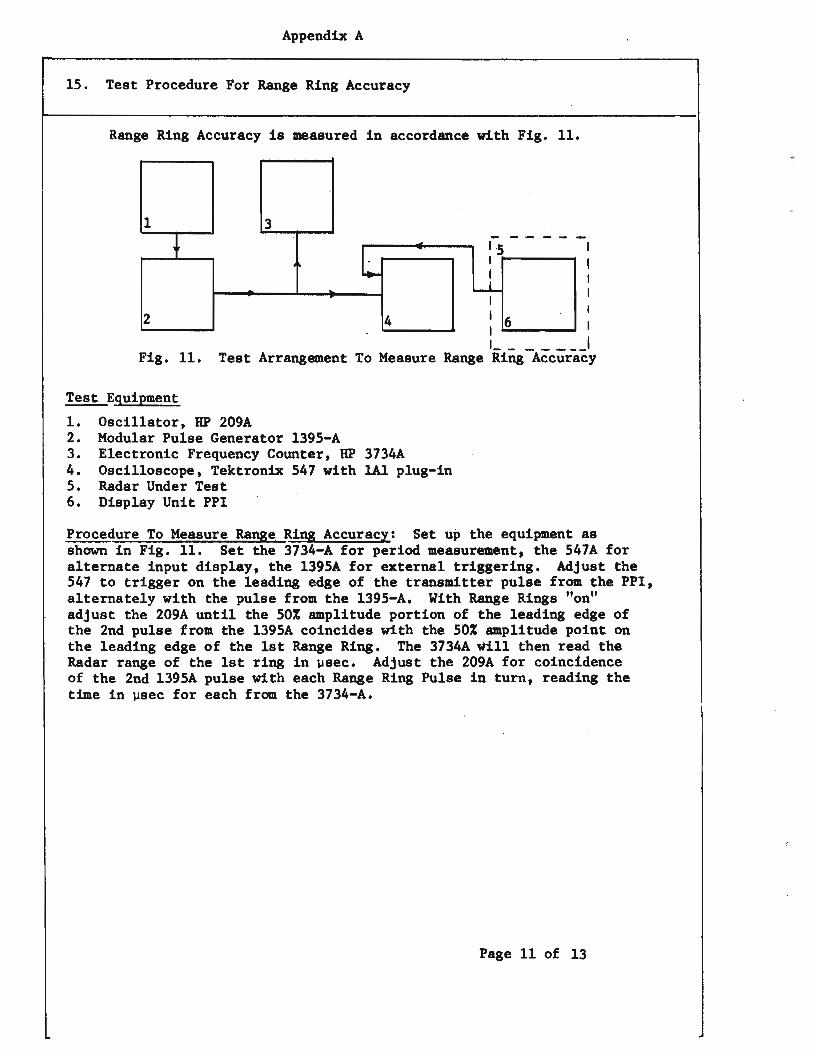
Appendix A
15. Test Procedure For Range Ring Accuracy
Range Ring Accuracy is measured in accordance with Fig. 11.
1 3
L I·S
. ~.------
~--~--~--~----~ I
2 4 I 6 t ~ __ ....J
'- ___ ---' Fig. 11. Test Arrangement To Measure Range Ring Accuracy
Test Equipment
1. Oscillator, HP 209A 2. Modular Pulse Generator l395-A 3. Electronic Frequency Counter, HP 3734A 4. Oscilloscope, Tektronix 547 with !AI plug-in 5. Radar Under Test 6. Display Unit PPI
Procedure To Measure Range Ring Accuracy: Set up the equipment as shown in Fig. 11. Set the 3734-A for period measurement, the 547A for alternate input display, the l395A for .externa1 triggering. Adjust the 547 to trigger on the leading edge of the transmitter puise from the PPI, alternately with the pulse from the l395-A. With Range Rings "on" adjust the 209A until the 50% amplitude portion of the leading edge of the 2nd pulse from the 1395A coincides with the 50% amplitude point on the leading edge of the 1st Range Ring. The 3734A will then read th~ Radar range of the 1st ring in ~sec. Adjust the 209A for coincidence of the 2nd l395A pulse with each Range Ring Pulse in turn, reading the time in ~sec for each from the 3734-A.
Page 11 of 13
•
Appendix A
16. Test Procedure For Effect Of Input Voltage Variations On Performance
The effect of input voltage variations on performance is measured in accordance with Figures 1, 2, 4 and 9. Each of the performance parameters is monitored as the a.c. input is varied in 5% increments over the range of ± 30%.
Page 12 of 13

Appendix A
~~-~~--~----~--l 17. Test Procedures For Field Tests
17.1.0 Resolution - Resolution tests were carried out using the 18' wooden boat as one target and a towed reflector as tIle 2nd target. Tests were made with the targets stationary or moving at about 1 knot maximum. All controls normally available to the operator were optimized for best results during these tests. Two targets w~re deemed to be visible when the outer edges of the tWQ targets on the PPI just barely merged, or were on the point of diverging into two completely separate targets •
• 1 Range Resolution - Range resolution was determined by towing a radar reflector behind the boat near the manufacturers specified value of range resolution as the boat travelled out from the radar. The separation between reflector and boat was then increased or decreased upon command of the radar operator until the minimum distance (measured by tape) at which the two targets could be resolved was determined •
. 2 Azimuth Resolution - Azimuth resolution was determined by towing a radar reflector behind the boat as the boat travelled at right angles to the radar beam, at a range of approximately 1/2 N. Mile, measured from the PPI. The separation between reflector and boat was increased or decreased upon command of the radar operator until the minimum separation (measured by tape) at which the two targets could be resolved was determined.
Azimuth resolution, ~ m 2 arc sine ( Separation )
Range
.2 Minimum Range - Minimum range was determined by approaching the radar scanner with a radar reflector until the target on the PPI could no longer be tracked by the operator. The distance from the scanner to the point where the target was last visible was then measured by tape. All controls normally available to the operator were optimized for best results during the test •
• 3 Bearing Accuracy - Bearing accuracy was checked by simultaneously measuring the angle between two stationary targets with the radar and with a surveyors transit. A minimum of 5 simultaneous readings were taken for verification. The targets were positioned as near as possible to the outer edge of the PPI or at least in the outer third of the range in use.
Page 13 of 13

APPENDIX B
Photographs Of Test Facilities
INDEX
1.0 Radar Mounting Platform .................. I
2.0 Test Boat With Radar Reflector In Place.. I
3.0 View Of Test Equipment In The Trailer •••• 2
4.0 Test Equipment and LN66 Radar On The Rack 2
Page i of i

1.0 Radar Mounting Platform 2.0 Test Boat With Radar Reflector In Place

• • •
3.0 View Of Test Equipment In The Trailer 4.0 Test Equipment and LN66 Radar On The Rack

APPENDIX C
NOMOGRM1 FOR WIND AND WAVES AT SEA
This is a simplified nomogram to show the relation between wind velocity and the ~larious parameters in wind and waves at sea. It was developed by Vine and Volkmann of the Woods Hole Oceanographic Institution and it appeared in Undersea Technology, May 1964, on page 37.
'1011 : (.1 ~~t~CJ~~:~!,~r: .~(h~~:'·;-. ·_ .. '·w~~'e;: ' ::ilr .. ~ ~:<:~; ;: ::~." : ~ ! ,,;;"::, .~ :, f;'~,~ ir;~C:!n'ia .. :~~/~" ,:~ .~', .', ~ t· . ~. :, "" r , •. VI: ; ( . 1.:. - ,r I.y
lid 0,,1), 1:,.."" , I , " .. 1/ P ..,rr. ' oj I·!·. ,:,t-:~ ro. , ... d l to, , ~!I ( I' ... , " " .. "
Id '1.0 f't!h~" C V'f.h -: s f" " n'i q . ;, .... , I.", ro· ('1''' ,.""" 10 h. el- c~ r"'cho tfnrn (' II I h· f'. =, ,;,rti cyl ! y ;.. (.),!,. ~,~I.:iJ it it: n II .·~ '. 1"",'( ,," OI i .
fdr 1I ·· ' " w " "] II" I c' ;(' .,.,. .... ·uv,· " "" ;" " f ' l' u('n t~' l:,. I " I " , C'''' fl' J" ,,{ CI I • " .... , • .., : :~" (' f~ ' I '" ' ,, ·, t . ' '', t., C" , , ·n r. ti' (I 'H cr • .J (,," II , r ••.. " c ,f ' I t •• Irt(, (-n tf'J OUIlIfU)' c •• "/I" ... h."'''', "'r ,I •. ~j, J .
• . o r'· .. •· .. . ; ~ ·n , .. ... " . d, II •• tu, ... ,,,: '"'c I.U:I .. !I .... ,,"v U!.
..
c
..
•
RIBLIGGP..APlfl
1. Albero, v.a., TJl";.d<>.t"(.101\:c:;!1" l· ... -:otr.GtieB h.;;;'"G.rn.:,,)ok -, :n, i?el'lOsylvania State Ul.'liversity PreiiS ,-'1965, PennsyJ.va.."lii~---
2. Barl:Gn, J).R., Kc .. dh.l: . ::;¥6t\"1fU A: .. i.a1~"siS_, Prentica-He.l1 Inc., i964, New Jersey. ~ -
3. Skolnik. M. I., !ntroducti0n To Radai: Systerols: ~kGraw-Hill Book Company. 1962, Ne~-;York:
4. Te(;hnicn.1. M&1.t.lal!::?lcr.>~~y K=orii.le Radar ~fln2, i.f;.:m~ 1. Plesscy Radar Ltc., Weybridga, Surrey, Engl.al',d.
5. Ser"i~e :t1anual, LN66, Q!C 919131957001, Cai.1adififl Marconi Co., Montreal, Canada.
6. Irlstruction l1anua:" c.-..,:c 131··914 ~ ISS<l:!! t+, for LN55 Marine Radar Ullit, Canadia..."l M.1rconi Ce., Montreal. Canada.
7. Sperry MK-7 Radar Operators Manual, Pub. No. JA-23-G124, 2nd Edition, Sperry !~aT.:tI:' • .! Syeten'ls Divis:ton, Gh9.rl,)t:teBvi11e, Virginia.
8. Installation ~~nual fur Sperry Marine Radar MK-7-6, Issue # C2-180, Mar 25, 1970, Tokyo Keiki Seizosho Co., Ltd. Tokyo, .Japan.
9. 011e:rator 1 s Manual for }farii:.c Radar Type 17. Publication KH 458R2, Kebrin Hughes, Esse:x, England.
10. Servic:l\lg ~tanual for rn'..at'il1e Radar Type 179 Publication KH 490Rl , Kelvin Hughes, ESf,ex, England.
11. I~tstal1atior.. Instru,;ti .. )118 fOl" Marin(~ Radar Type 17/9 and 17/12, Pub1ic~tion KH 581Rl, Kelvin Hughes, Essex, England.
12. Operators Handbook for ?{arine Radar Type 17/12, Publication KH600, Kelvin Hughes, Essex, England.
13. Operator's Manual l"or Furunc FRA-IO~ Publication No. Oli-l085b Furuno Electric Go. t Ltd., Uishir(omiya, Japai.'l, Revision Nov./69 •