quarterly report q1 2016 - philips · pdf filequarterly report q1 2016 3 philips key data in...
TRANSCRIPT

Philips reports Q1 comparable sales growth of 3% to EUR 5.5 billion and a 14%improvement in Adjusted EBITA to EUR 374 million
Amsterdam, April 25, 2016
First-quarter highlights
• Comparable sales growth driven by 5% growth in HealthTech portfolio• Adjusted EBITA amounted to EUR 374 million, or 6.8% of sales, compared to 6.1% of sales in Q1 2015• EBITA totaled EUR 290 million, or 5.3% of sales, compared to 4.3% of sales in Q1 2015• Net income amounted to EUR 37 million, compared to EUR 100 million in Q1 2015, mainly impacted
by tax charges related to the separation• Free cash outflow of EUR 177 million, compared to an outflow of EUR 443 million in Q1 2015• Philips Lighting separation process well on track
Frans van Houten, CEO:
“Philips’ first-quarter 2016 results reflect solid comparable sales growth across our HealthTech businesses and our LED Lighting business,bolstered by the successful launch of several new products. We also delivered continued operational improvements throughout thecompany, driven by higher volume and improved product mix. Our overall performance strengthened, supported by the ongoing benefitsof our multi-year Accelerate! transformation program, despite challenging macro-economic conditions in several markets.
Our outlook for 2016 remains unchanged, as we continue to expect earnings improvements in the year to be back-end loaded, takinginto account ongoing macro-economic headwinds and the phasing of costs and sales.”
HealthTech
“Our HealthTech portfolio delivered another strong quarter, with 5% comparable sales growth overall, despite anticipated lower royaltyincome. We also achieved significant operational improvements, which were partly offset by ongoing investments in high-growthbusinesses, such as wearable patient monitoring solutions, digital pathology and health informatics. Equipment-order intake in thequarter declined by 3% on a comparable basis, after a quarter with double-digit order growth, largely reflecting the unevenness of ourorder intake dynamics.”
In Personal Health, comparable sales growth was 6%, with the Adjusted EBITA margin improving by 130 basis points. Diagnosis &Treatment showed 5% comparable growth, and the Adjusted EBITA margin improved by 80 basis points. Connected Care & HealthInformatics grew 9%, while the Adjusted EBITA margin improved by 310 basis points.
• Philips’ new integrated Dream Family solution, which is designed to improve the sleep therapy experience for people withobstructive sleep apnea, is showing strong traction in Europe and the US, with more than 200,000 Dream Family users since itsintroduction in 2015, and is now being launched in Japan.
• Building on the synergies of the Volcano acquisition, the Image-Guided Therapy business posted a strong first quarter across itsmarkets, supported by the expansion of its Phoenix Atherectomy catheter product range and the strong synergies between its smartcatheter and systems sales forces.
Q1 2016Quarterly report
• In line with our strategy of building multi-year strategic partnerships, Philips signed a 15-year, USD 90 million agreement with SanFrancisco Bay-based Marin General Hospital that includes a managed services agreement for imaging systems, patient monitoringand clinical informatics solutions.
• Strengthening its Health Informatics portfolio, Philips partnered with Hitachi Data Systems to introduce a next-generation VendorNeutral Archive system, supporting rapid access to medical imaging and digital health records across the enterprise. Philips alsoteamed up with Amazon Web Services to deliver a new cloud-based, enterprise-wide rapid and secure data recovery solution.
• Philips’ Oral Healthcare business continued its growth trajectory, with a strong performance in Greater China where the PhilipsSonicare Essence+ was recently launched, providing consumers with a high-quality brushing experience at affordable price points.
Lighting
“Philips Lighting’s first-quarter performance improvement signals its great future as a focused, stand-alone company. Lighting posted itssixth consecutive quarter of year-on-year operational improvements, underpinning the strong potential of our LED business and thetransformation from individual products to connected lighting systems and services. As a result of our market success in LED and itsgrowing share of the overall business, Philips Lighting is expected to return to positive comparable sales growth in the course of 2016.”
LED lighting sales grew strongly by 27% and now account for 50% of overall Lighting sales. Conventional lamps sales continued theiranticipated decline, contracting 15% year-on-year. The Home business delivered double-digit growth for the second consecutivequarter, while Professional in North America returned to positive growth in the quarter. The Adjusted EBITA margin at Philips Lightingincreased by 60 basis points, driven by cost productivity and product mix.
• Philips Lighting introduced great innovations at Light + Building, a leading industry trade show, showcasing its connected LED lightinggrowth platforms for smart cities, smart retailing, smart offices and smart homes.
• Philips Lighting has partnered with Vodafone to help increase adoption of connected LED street lighting for smart cities. Currently, ofthe over 300 million street lights globally, less than 12% are LED and less than 2% are connected. Philips Lighting introducedDigiStreet, its new range of LED street lighting luminaires which can wirelessly connect to CityTouch, enabling the street lights to bemonitored, controlled and managed remotely for additional savings on energy and maintenance.
• To further fuel its LED growth, Philips Lighting continues to innovate with the introduction of three new LED lamp families: the Philipsclassic LED spot range to replace the popular halogen spotlight, the Philips SceneSwitch LED lamp range with its unique three lightsettings in one light bulb, and the Philips classic LED with DimTone.
• Underlining its market leadership in dynamic connected LED lighting to transform building facades and monuments, Philips Lightinglit up two iconic landmarks in Spain: the CEPSA Tower, one of Spain’s tallest buildings, and Baño de la Cava, a World Heritage site inToledo.
Separation UpdateAs previously communicated, Philips continues to simultaneously prepare for an initial public offering (IPO) or a private sale of PhilipsLighting. With equity markets’ sentiment improving compared to the first couple of months of the year, an IPO increasingly appears amore likely outcome, subject to further market developments and other relevant circumstances. However, the company has not yetconcluded on all proposals in the private sale process and continues to assess the attractiveness of this route compared to the IPO, bothin terms of value and conditions, while taking into account the best interests of Philips and its stakeholders. As such, Philips expects toupdate the market on conclusions and next steps shortly.
Costs related to the separation amounted to EUR 52 million in the first quarter of 2016. For 2016, Philips now expects separation costs tobe in the range of EUR 200 - 225 million.
Cost SavingsOverhead cost savings amounted to EUR 19 million in the first quarter. The Design for Excellence (DfX) program generated EUR 67million of incremental procurement savings in the quarter. The End2End improvement program achieved EUR 41 million in productivitygains.
MiscellaneousAs of March 31, 2016, Philips had completed 82% of the 3-year EUR 1.5 billion share buy-back program.
This first-quarter 2016 results publication is based on Philips’ new segment reporting structure. The related historical key figures for 2014and 2015 have been published on the Investor Relations website.
Conference call and audio webcastFrans van Houten, CEO, and Abhijit Bhattacharya, CFO, will host a conference call for investors and analysts at 10:00 am CET to discussthe results. A live audio webcast of the conference call will be available on the Philips Investor Relations website.
Philips Q1 2016 Earnings call
Quarterly report Q1 2016 3
Philips
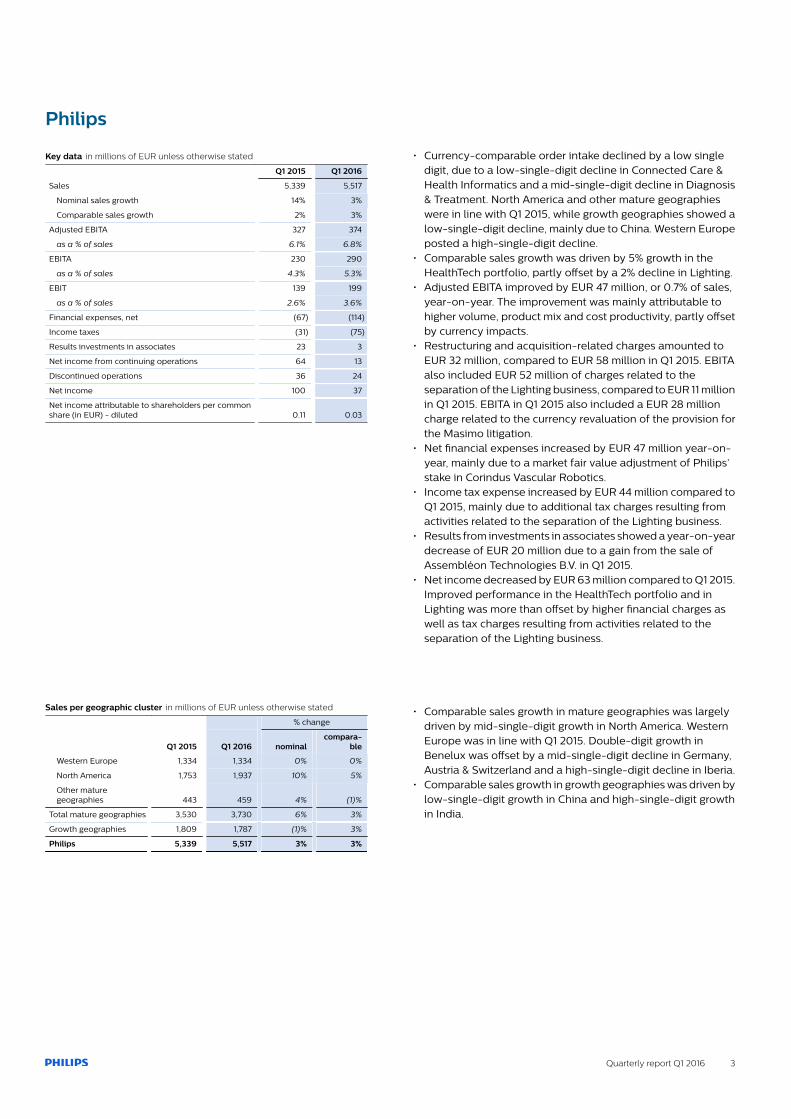
Key data in millions of EUR unless otherwise stated
Q1 2015 Q1 2016
Sales 5,339 5,517
Nominal sales growth 14% 3%
Comparable sales growth 2% 3%
Adjusted EBITA 327 374
as a % of sales 6.1% 6.8%
EBITA 230 290
as a % of sales 4.3% 5.3%
EBIT 139 199
as a % of sales 2.6% 3.6%
Financial expenses, net (67) (114)
Income taxes (31) (75)
Results investments in associates 23 3
Net income from continuing operations 64 13
Discontinued operations 36 24
Net income 100 37
Net income attributable to shareholders per commonshare (in EUR) - diluted 0.11 0.03
Sales per geographic cluster in millions of EUR unless otherwise stated
% change
Q1 2015 Q1 2016 nominal compara-
ble
Western Europe 1,334 1,334 0% 0%
North America 1,753 1,937 10% 5%
Other maturegeographies 443 459 4% (1)%
Total mature geographies 3,530 3,730 6% 3%
Growth geographies 1,809 1,787 (1)% 3%
Philips 5,339 5,517 3% 3%
• Currency-comparable order intake declined by a low singledigit, due to a low-single-digit decline in Connected Care &Health Informatics and a mid-single-digit decline in Diagnosis& Treatment. North America and other mature geographieswere in line with Q1 2015, while growth geographies showed alow-single-digit decline, mainly due to China. Western Europeposted a high-single-digit decline.
• Comparable sales growth was driven by 5% growth in theHealthTech portfolio, partly offset by a 2% decline in Lighting.
• Adjusted EBITA improved by EUR 47 million, or 0.7% of sales,year-on-year. The improvement was mainly attributable tohigher volume, product mix and cost productivity, partly offsetby currency impacts.
• Restructuring and acquisition-related charges amounted toEUR 32 million, compared to EUR 58 million in Q1 2015. EBITAalso included EUR 52 million of charges related to theseparation of the Lighting business, compared to EUR 11 millionin Q1 2015. EBITA in Q1 2015 also included a EUR 28 millioncharge related to the currency revaluation of the provision forthe Masimo litigation.
• Net financial expenses increased by EUR 47 million year-on-year, mainly due to a market fair value adjustment of Philips’stake in Corindus Vascular Robotics.
• Income tax expense increased by EUR 44 million compared toQ1 2015, mainly due to additional tax charges resulting fromactivities related to the separation of the Lighting business.
• Results from investments in associates showed a year-on-yeardecrease of EUR 20 million due to a gain from the sale ofAssembléon Technologies B.V. in Q1 2015.
• Net income decreased by EUR 63 million compared to Q1 2015.Improved performance in the HealthTech portfolio and inLighting was more than offset by higher financial charges aswell as tax charges resulting from activities related to theseparation of the Lighting business.
• Comparable sales growth in mature geographies was largelydriven by mid-single-digit growth in North America. WesternEurope was in line with Q1 2015. Double-digit growth inBenelux was offset by a mid-single-digit decline in Germany,Austria & Switzerland and a high-single-digit decline in Iberia.
• Comparable sales growth in growth geographies was driven bylow-single-digit growth in China and high-single-digit growthin India.
4 Quarterly report Q1 2016
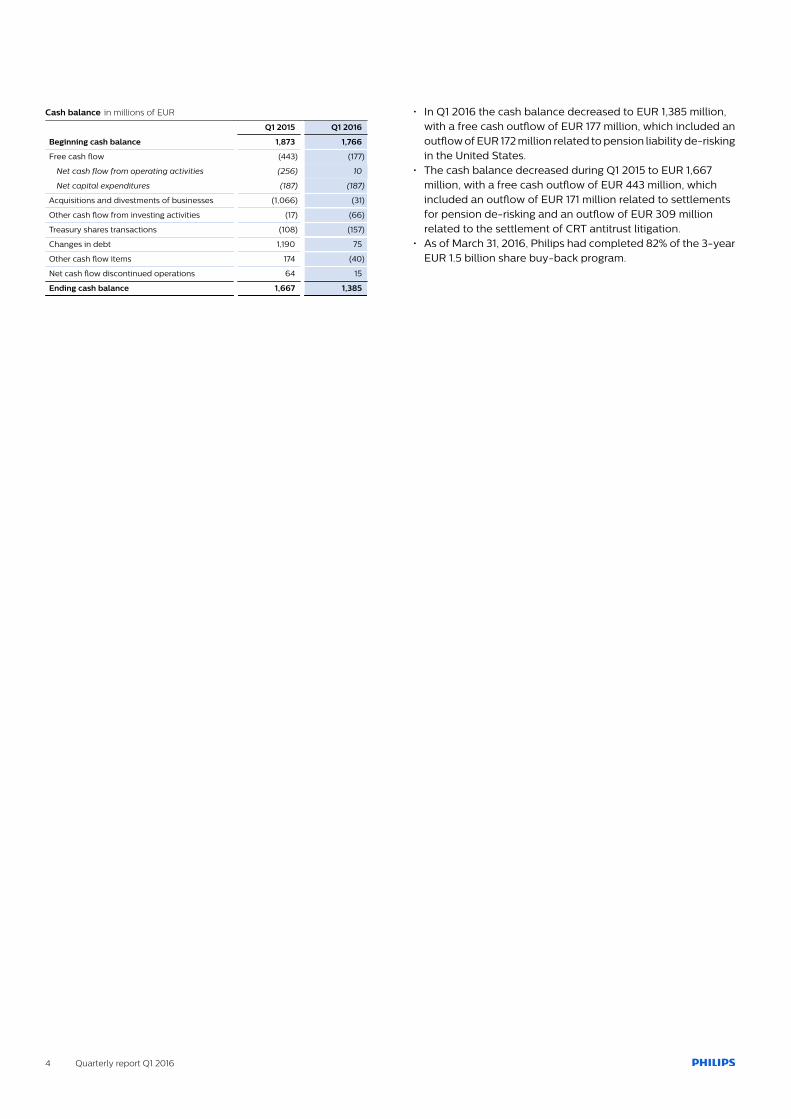
Cash balance in millions of EUR
Q1 2015 Q1 2016
Beginning cash balance 1,873 1,766
Free cash flow (443) (177)
Net cash flow from operating activities (256) 10
Net capital expenditures (187) (187)
Acquisitions and divestments of businesses (1,066) (31)
Other cash flow from investing activities (17) (66)
Treasury shares transactions (108) (157)
Changes in debt 1,190 75
Other cash flow items 174 (40)
Net cash flow discontinued operations 64 15
Ending cash balance 1,667 1,385
• In Q1 2016 the cash balance decreased to EUR 1,385 million,with a free cash outflow of EUR 177 million, which included anoutflow of EUR 172 million related to pension liability de-riskingin the United States.
• The cash balance decreased during Q1 2015 to EUR 1,667million, with a free cash outflow of EUR 443 million, whichincluded an outflow of EUR 171 million related to settlementsfor pension de-risking and an outflow of EUR 309 millionrelated to the settlement of CRT antitrust litigation.
• As of March 31, 2016, Philips had completed 82% of the 3-yearEUR 1.5 billion share buy-back program.
Quarterly report Q1 2016 5
Performance per segment
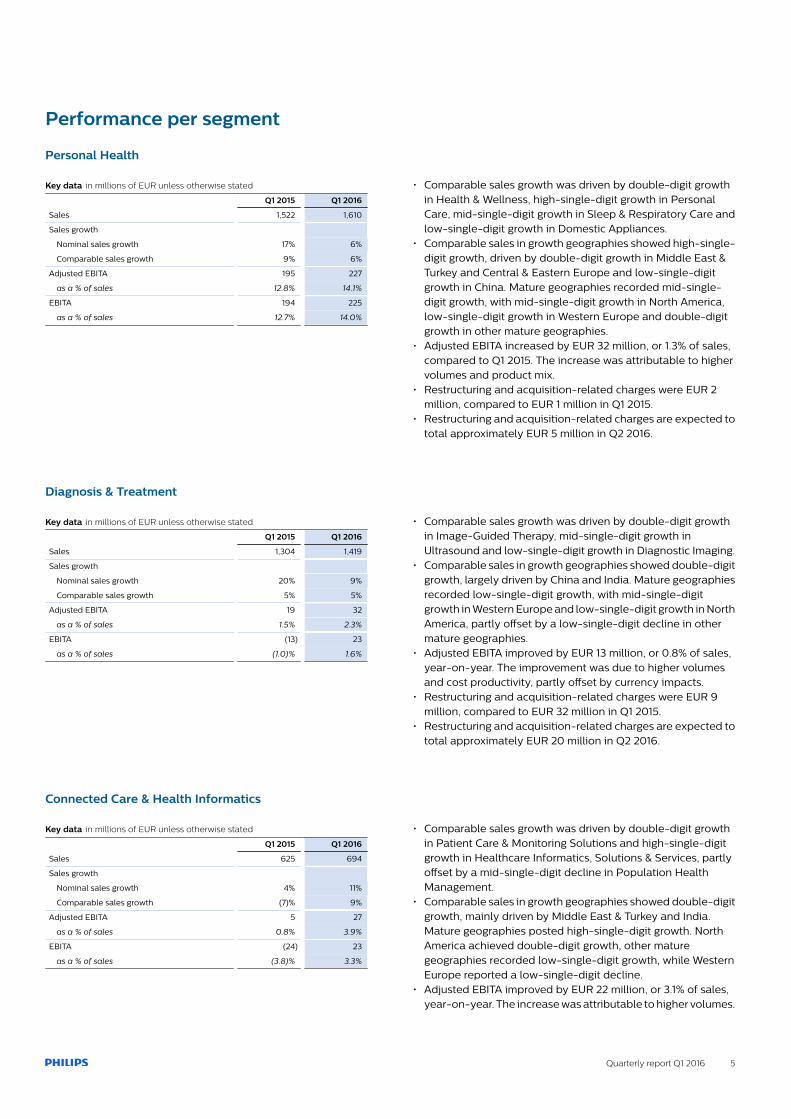
Personal Health
Key data in millions of EUR unless otherwise stated
Q1 2015 Q1 2016
Sales 1,522 1,610
Sales growth
Nominal sales growth 17% 6%
Comparable sales growth 9% 6%
Adjusted EBITA 195 227
as a % of sales 12.8% 14.1%
EBITA 194 225
as a % of sales 12.7% 14.0%
Diagnosis & Treatment
Key data in millions of EUR unless otherwise stated
Q1 2015 Q1 2016
Sales 1,304 1,419
Sales growth
Nominal sales growth 20% 9%
Comparable sales growth 5% 5%
Adjusted EBITA 19 32
as a % of sales 1.5% 2.3%
EBITA (13) 23
as a % of sales (1.0)% 1.6%
Connected Care & Health Informatics
Key data in millions of EUR unless otherwise stated
Q1 2015 Q1 2016
Sales 625 694
Sales growth
Nominal sales growth 4% 11%
Comparable sales growth (7)% 9%
Adjusted EBITA 5 27
as a % of sales 0.8% 3.9%
EBITA (24) 23
as a % of sales (3.8)% 3.3%
• Comparable sales growth was driven by double-digit growthin Health & Wellness, high-single-digit growth in PersonalCare, mid-single-digit growth in Sleep & Respiratory Care andlow-single-digit growth in Domestic Appliances.
• Comparable sales in growth geographies showed high-single-digit growth, driven by double-digit growth in Middle East &Turkey and Central & Eastern Europe and low-single-digitgrowth in China. Mature geographies recorded mid-single-digit growth, with mid-single-digit growth in North America,low-single-digit growth in Western Europe and double-digitgrowth in other mature geographies.
• Adjusted EBITA increased by EUR 32 million, or 1.3% of sales,compared to Q1 2015. The increase was attributable to highervolumes and product mix.
• Restructuring and acquisition-related charges were EUR 2million, compared to EUR 1 million in Q1 2015.
• Restructuring and acquisition-related charges are expected tototal approximately EUR 5 million in Q2 2016.
• Comparable sales growth was driven by double-digit growthin Image-Guided Therapy, mid-single-digit growth inUltrasound and low-single-digit growth in Diagnostic Imaging.
• Comparable sales in growth geographies showed double-digitgrowth, largely driven by China and India. Mature geographiesrecorded low-single-digit growth, with mid-single-digitgrowth in Western Europe and low-single-digit growth in NorthAmerica, partly offset by a low-single-digit decline in othermature geographies.
• Adjusted EBITA improved by EUR 13 million, or 0.8% of sales,year-on-year. The improvement was due to higher volumesand cost productivity, partly offset by currency impacts.
• Restructuring and acquisition-related charges were EUR 9million, compared to EUR 32 million in Q1 2015.
• Restructuring and acquisition-related charges are expected tototal approximately EUR 20 million in Q2 2016.
• Comparable sales growth was driven by double-digit growthin Patient Care & Monitoring Solutions and high-single-digitgrowth in Healthcare Informatics, Solutions & Services, partlyoffset by a mid-single-digit decline in Population HealthManagement.
• Comparable sales in growth geographies showed double-digitgrowth, mainly driven by Middle East & Turkey and India.Mature geographies posted high-single-digit growth. NorthAmerica achieved double-digit growth, other maturegeographies recorded low-single-digit growth, while WesternEurope reported a low-single-digit decline.
• Adjusted EBITA improved by EUR 22 million, or 3.1% of sales,year-on-year. The increase was attributable to higher volumes.

6 Quarterly report Q1 2016
HealthTech Other
Key data in millions of EUR
Q1 2015 Q1 2016
Sales 135 103
Adjusted EBITA 20 (9)
IP Royalties 87 57
Emerging Businesses (12) (20)
Innovation (32) (24)
Central costs (18) (21)
Other (5) (1)
EBITA 24 (7)
Lighting
Key data in millions of EUR unless otherwise stated
Q1 2015 Q1 2016
Sales 1,722 1,691
Sales growth
Nominal sales growth 9% (2)%
Comparable sales growth (3)% (2)%
Adjusted EBITA 113 121
as a % of sales 6.6% 7.2%
EBITA 85 102
as a % of sales 4.9% 6.0%
• Restructuring and acquisition-related charges were EUR 4million, compared to EUR 1 million in Q1 2015. EBITA in Q1 2015included charges of EUR 28 million related to the currencyrevaluation of the provision for the Masimo litigation.
• Restructuring and acquisition-related charges are expected tototal approximately EUR 5 million in Q2 2016.
• Sales reflected lower royalty income due to the expiration oflicenses, as anticipated, partly offset by strong double-digitgrowth in Emerging Businesses.
• The Adjusted EBITA decline was mainly due to lower royaltyincome and higher investments in Emerging Businesses.
• EBITA included a EUR 2 million net release of restructuringcharges, while Q1 2015 included a net release of EUR 4 million.
• Restructuring and acquisition-related charges are expected tototal approximately EUR 10 million in Q2 2016.
• Comparable sales reflected double-digit growth in LED andHome, which was more than offset by a double-digit declinein Lamps and a low-single-digit decline in Professional.
• Total LED lighting sales grew 27% year-on-year and nowrepresent 50% of total Lighting sales, compared to 39% in Q12015. Conventional lighting sales declined 20% year-on-year,in line with the industry trend, and now represent 50% of totalLighting sales, compared to 61% in Q1 2015.
• With the continued growth of LED within the total portfolio,Philips Lighting is expected to return to growth in the course of2016.
• Mature geographies recorded low-single-digit growth, withmid-single-digit growth in North America and low-single-digitgrowth in other mature geographies, while Western Europereported a mid-single-digit decline. Growth geographiesrecorded a mid-single-digit decline, mainly due to Middle East& Turkey and Latin America.
• Adjusted EBITA improved year-on-year for the sixthconsecutive quarter. The increase of EUR 8 million, or 0.6% ofsales, was attributable to cost productivity and product mix,partly offset by currency impacts.
• Restructuring and acquisition-related charges were EUR 19million, compared to EUR 28 million in Q1 2015.
• Restructuring and acquisition-related charges are expected tototal approximately EUR 60 million in Q2 2016.

Quarterly report Q1 2016 7
Legacy Items• ‘Legacy Items’ consists mainly of separation costs, legacy legal
items and stranded costs.• Q1 2016 EBITA largely included EUR 52 million of charges
related to the separation of the Lighting business, EUR 12million of charges related to movements in environmentalprovisions, and EUR 8 million of stranded costs related to thecombined Lumileds and Automotive businesses.
• Charges related to the separation of the Lighting business areexpected to total approximately EUR 70 million in Q2 2016.

8 Quarterly report Q1 2016
Additional information on the combined businesses of Lumileds and
Automotive
Results of combined Lumileds and Automotive businesses in millions of EUR
Q1 2015 Q1 2016
EBITA as previously reported in Lighting 33 (1)
Adjustment of amortization and depreciationfollowing assets held for sale reclassification 42 41
Disentanglement costs (19) (1)
Former net costs allocated to Lighting (1) -
Former net costs allocated to Legacy Items 23 8
EBIT of discontinued operations 78 47
Financial expenses, net - (1)
Income taxes (41) (14)
Net income of discontinued operations 37 32
The combined businesses of Lumileds and Automotive arereported as discontinued operations in the Consolidatedstatements of income and cash flows. As a result, Lumileds andAutomotive sales and EBITA are no longer included in theLighting and Group results of continuing operations. Theapplicable assets and liabilities of the combined businesses arereported under Assets and Liabilities classified as held for sale inthe Condensed consolidated balance sheets as per November2014.
EBITA decreased by EUR 34 million, mainly due to lower salesimpacting gross margins. Net income of discontinued operationsattributable to the combined businesses of Lumileds andAutomotive decreased by EUR 5 million, mainly due to loweroperational performance, partly offset by lower income taxcharges.
Philips is actively engaging with other parties that haveexpressed an interest in the businesses and will continue toreport the Lumileds and Automotive businesses as discontinuedoperations.
Overhead and other indirect costs of Philips that were previouslyallocated to Lumileds and Automotive and were not affected bythe transfer to Discontinued operations have been allocated toLighting and Legacy Items.
Quarterly report Q1 2016 9
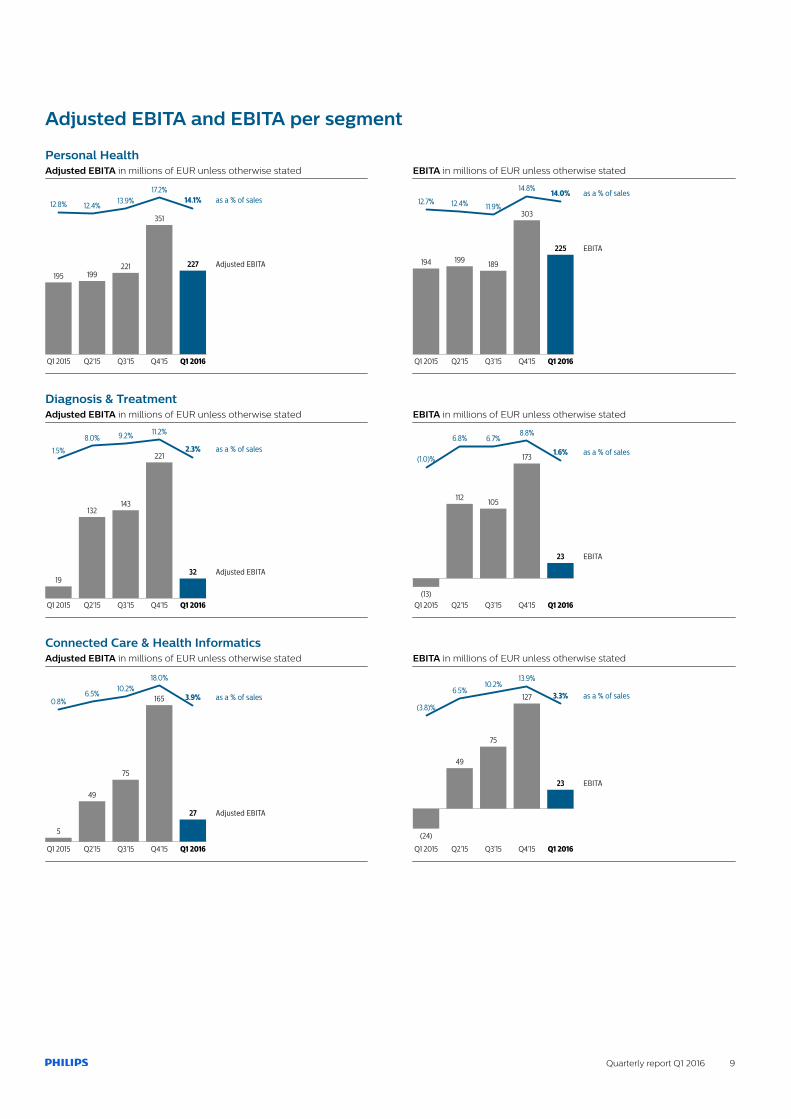
Adjusted EBITA and EBITA per segment
Personal HealthAdjusted EBITA in millions of EUR unless otherwise stated
195
Q1 2015
199
Q2’15
221
Q3’15
351
Q4’15
227 Adjusted EBITA
Q1 2016
12.8% 12.4%13.9%
17.2%14.1% as a % of sales
Diagnosis & TreatmentAdjusted EBITA in millions of EUR unless otherwise stated
19
Q1 2015
132
Q2’15
143
Q3’15
221
Q4’15
32 Adjusted EBITA
Q1 2016
1.5%
8.0% 9.2% 11.2%
2.3% as a % of sales
Connected Care & Health InformaticsAdjusted EBITA in millions of EUR unless otherwise stated
5
Q1 2015
49
Q2’15
75
Q3’15
165
Q4’15
27 Adjusted EBITA
Q1 2016
0.8%6.5%
10.2%18.0%
3.9% as a % of sales
EBITA in millions of EUR unless otherwise stated
194
Q1 2015
199
Q2’15
189
Q3’15
303
Q4’15
225 EBITA
Q1 2016
12.7% 12.4% 11.9%
14.8% 14.0% as a % of sales
EBITA in millions of EUR unless otherwise stated
(13)Q1 2015
112
Q2’15
105
Q3’15
173
Q4’15
23 EBITA
Q1 2016
(1.0)%
6.8% 6.7%8.8%
1.6% as a % of sales
EBITA in millions of EUR unless otherwise stated
(24)
Q1 2015
49
Q2’15
75
Q3’15
127
Q4’15
23 EBITA
Q1 2016
(3.8)%
6.5%10.2%
13.9%
3.3% as a % of sales
10 Quarterly report Q1 2016
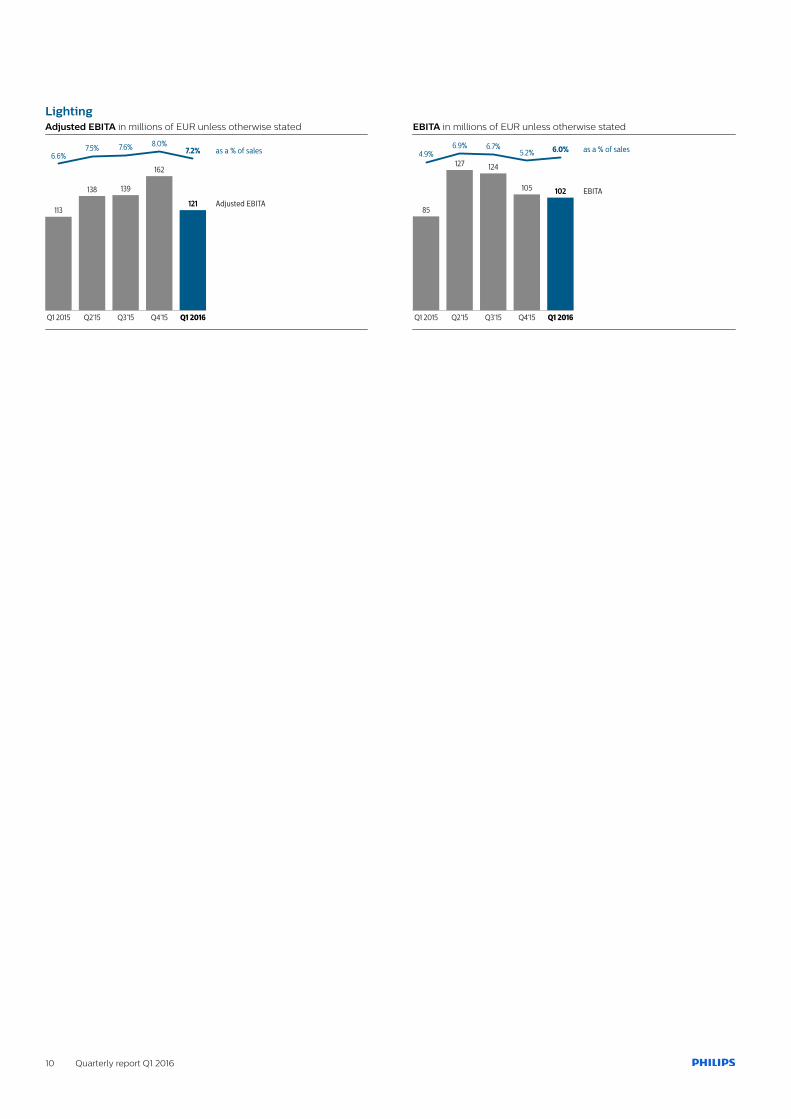
LightingAdjusted EBITA in millions of EUR unless otherwise stated
113
Q1 2015
138
Q2’15
139
Q3’15
162
Q4’15
121 Adjusted EBITA
Q1 2016
6.6%7.5% 7.6% 8.0%
7.2% as a % of sales
EBITA in millions of EUR unless otherwise stated
85
Q1 2015
127
Q2’15
124
Q3’15
105
Q4’15
102 EBITA
Q1 2016
4.9%6.9% 6.7%
5.2% 6.0% as a % of sales
Quarterly report Q1 2016 11
Forward-looking statements and other presentation matters
Forward-looking statementsThis document and the related oral presentation, includingresponses to questions following the presentation, containcertain forward-looking statements with respect to the financialcondition, results of operations and business of Philips andcertain of the plans and objectives of Philips with respect to theseitems. Examples of forward-looking statements includestatements made about the strategy, estimates of sales growth,future EBITA, future developments in Philips’ organic businessand the completion of acquisitions and divestments. By theirnature, these statements involve risk and uncertainty becausethey relate to future events and circumstances and there aremany factors that could cause actual results and developmentsto differ materially from those expressed or implied by thesestatements.
These factors include but are not limited to domestic and globaleconomic and business conditions, developments within theeuro zone, the successful implementation of Philips’ strategy andthe ability to realize the benefits of this strategy, the ability todevelop and market new products, changes in legislation, legalclaims, changes in exchange and interest rates, changes in taxrates, pension costs and actuarial assumptions, raw materialsand employee costs, the ability to identify and completesuccessful acquisitions, and to integrate those acquisitions intothe business, the ability to successfully exit certain businesses orrestructure the operations, the rate of technological changes,political, economic and other developments in countries wherePhilips operates, industry consolidation and competition and thestate of international capital markets as they may affect thetiming and nature of the dispositions by Philips of its interests inthe Lighting business and the Lumileds and Automotive business.As a result, Philips’ actual future results may differ materially fromthe plans, goals and expectations set forth in such forward-looking statements. For a discussion of factors that could causefuture results to differ from such forward-looking statements, seethe Risk management chapter included in the Annual Report2015.
Third-party market share dataStatements regarding market share, including those regardingPhilips’ competitive position, contained in this document arebased on outside sources such as research institutes, industryand dealer panels in combination with management estimates.Where information is not yet available to Philips, thosestatements may also be based on estimates and projectionsprepared by outside sources or management. Rankings arebased on sales unless otherwise stated.
Use of non-GAAP informationIn presenting and discussing the Philips Group financial position,operating results and cash flows, management uses certain non-GAAP financial measures. These non-GAAP financial measuresshould not be viewed in isolation as alternatives to the equivalentIFRS measures and should be used in conjunction with the mostdirectly comparable IFRS measures. Non-GAAP financialmeasures do not have standardized meaning under IFRS andtherefore may not be comparable to similar measures presentedby other issuers. A reconciliation of these non-GAAP measures
to the most directly comparable IFRS measures is contained inthis document. Further information on non-GAAP measures canbe found in the Annual Report 2015.
Use of fair-value measurementsIn presenting the Philips Group financial position, fair values areused for the measurement of various items in accordance withthe applicable accounting standards. These fair values are basedon market prices, where available, and are obtained from sourcesthat are deemed to be reliable. Readers are cautioned that thesevalues are subject to changes over time and are only valid at thebalance sheet date. When quoted prices or observable marketdata are not readily available, fair values are estimated usingappropriate valuation models and unobservable inputs. Such fairvalue estimates require management to make significantassumptions with respect to future developments, which areinherently uncertain and may therefore deviate from actualdevelopments. Critical assumptions used are disclosed in theAnnual Report 2015. Independent valuations may have beenobtained to support management’s determination of fair values.
PresentationAll amounts are in millions of euros unless otherwise stated. Allreported data is unaudited. Financial reporting is in accordancewith the accounting policies as stated in the Annual Report 2015,unless otherwise stated.
12 Quarterly report Q1 2016
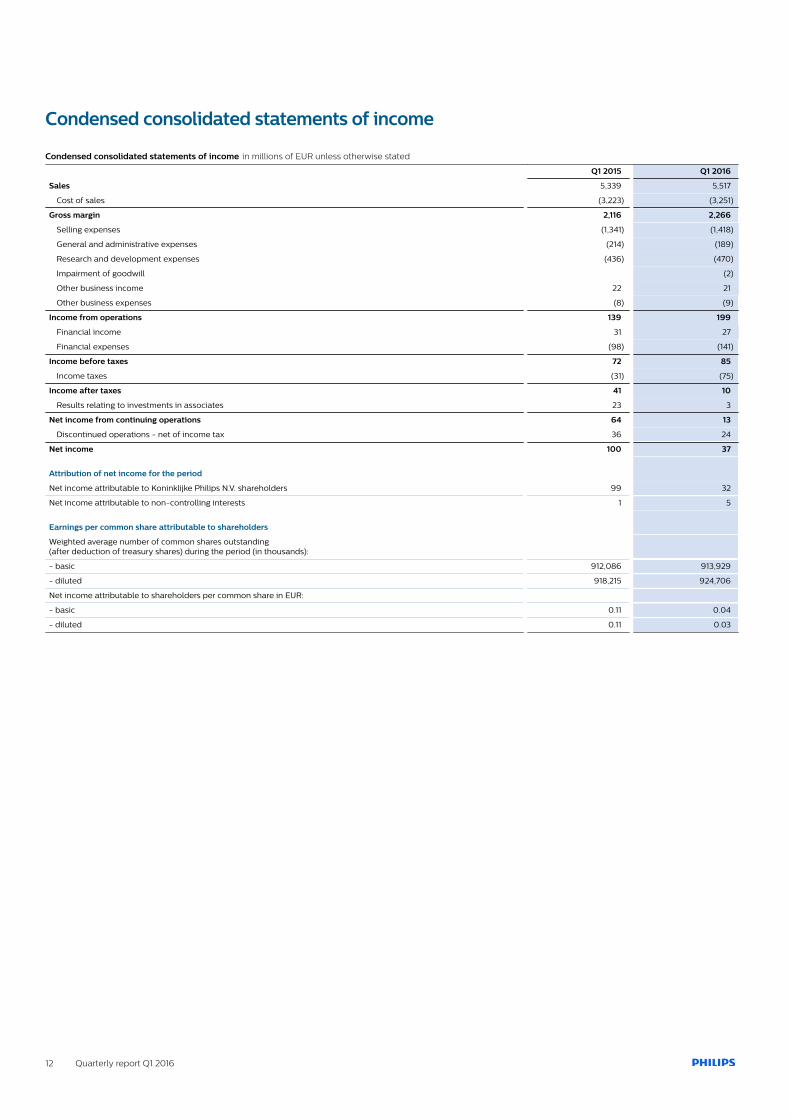
Condensed consolidated statements of income
Condensed consolidated statements of income in millions of EUR unless otherwise stated
Q1 2015 Q1 2016
Sales 5,339 5,517
Cost of sales (3,223) (3,251)
Gross margin 2,116 2,266
Selling expenses (1,341) (1,418)
General and administrative expenses (214) (189)
Research and development expenses (436) (470)
Impairment of goodwill (2)
Other business income 22 21
Other business expenses (8) (9)
Income from operations 139 199
Financial income 31 27
Financial expenses (98) (141)
Income before taxes 72 85
Income taxes (31) (75)
Income after taxes 41 10
Results relating to investments in associates 23 3
Net income from continuing operations 64 13
Discontinued operations - net of income tax 36 24
Net income 100 37
Attribution of net income for the period
Net income attributable to Koninklijke Philips N.V. shareholders 99 32
Net income attributable to non-controlling interests 1 5
Earnings per common share attributable to shareholders
Weighted average number of common shares outstanding (after deduction of treasury shares) during the period (in thousands):
- basic 912,086 913,929
- diluted 918,215 924,706
Net income attributable to shareholders per common share in EUR:
- basic 0.11 0.04
- diluted 0.11 0.03
Quarterly report Q1 2016 13
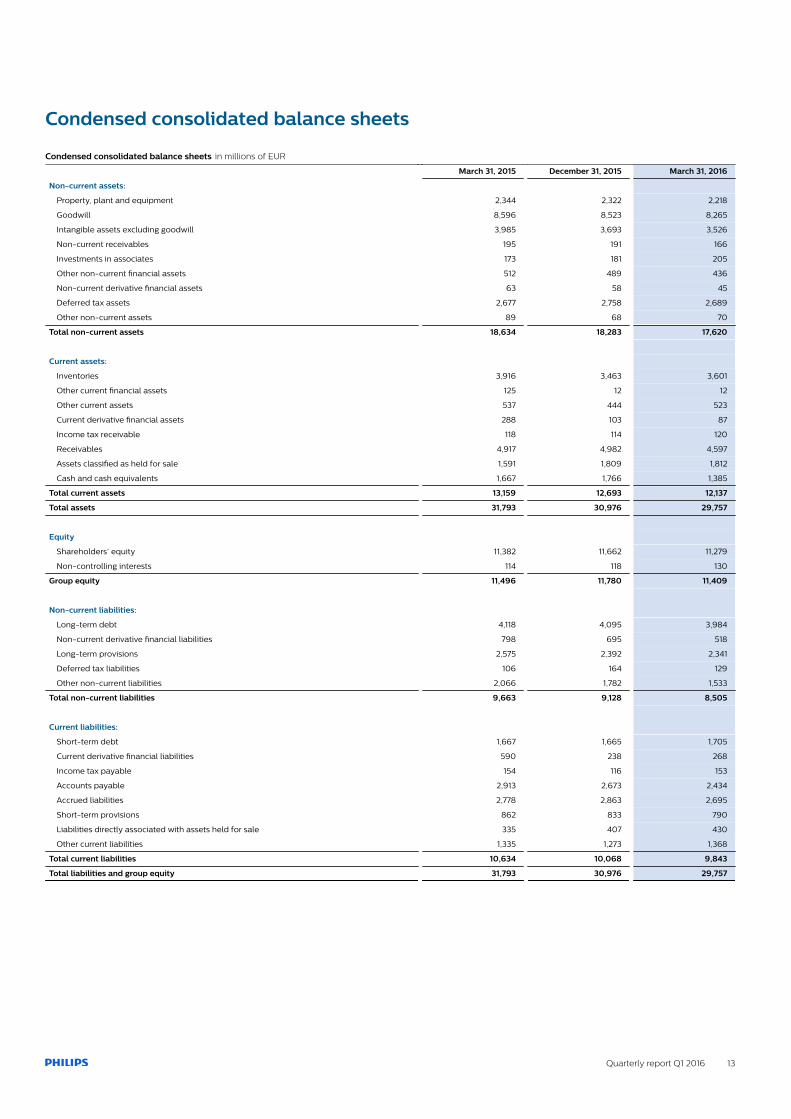
Condensed consolidated balance sheets
Condensed consolidated balance sheets in millions of EUR
March 31, 2015 December 31, 2015 March 31, 2016
Non-current assets:
Property, plant and equipment 2,344 2,322 2,218
Goodwill 8,596 8,523 8,265
Intangible assets excluding goodwill 3,985 3,693 3,526
Non-current receivables 195 191 166
Investments in associates 173 181 205
Other non-current financial assets 512 489 436
Non-current derivative financial assets 63 58 45
Deferred tax assets 2,677 2,758 2,689
Other non-current assets 89 68 70
Total non-current assets 18,634 18,283 17,620
Current assets:
Inventories 3,916 3,463 3,601
Other current financial assets 125 12 12
Other current assets 537 444 523
Current derivative financial assets 288 103 87
Income tax receivable 118 114 120
Receivables 4,917 4,982 4,597
Assets classified as held for sale 1,591 1,809 1,812
Cash and cash equivalents 1,667 1,766 1,385
Total current assets 13,159 12,693 12,137
Total assets 31,793 30,976 29,757
Equity
Shareholders’ equity 11,382 11,662 11,279
Non-controlling interests 114 118 130
Group equity 11,496 11,780 11,409
Non-current liabilities:
Long-term debt 4,118 4,095 3,984
Non-current derivative financial liabilities 798 695 518
Long-term provisions 2,575 2,392 2,341
Deferred tax liabilities 106 164 129
Other non-current liabilities 2,066 1,782 1,533
Total non-current liabilities 9,663 9,128 8,505
Current liabilities:
Short-term debt 1,667 1,665 1,705
Current derivative financial liabilities 590 238 268
Income tax payable 154 116 153
Accounts payable 2,913 2,673 2,434
Accrued liabilities 2,778 2,863 2,695
Short-term provisions 862 833 790
Liabilities directly associated with assets held for sale 335 407 430
Other current liabilities 1,335 1,273 1,368
Total current liabilities 10,634 10,068 9,843
Total liabilities and group equity 31,793 30,976 29,757
14 Quarterly report Q1 2016
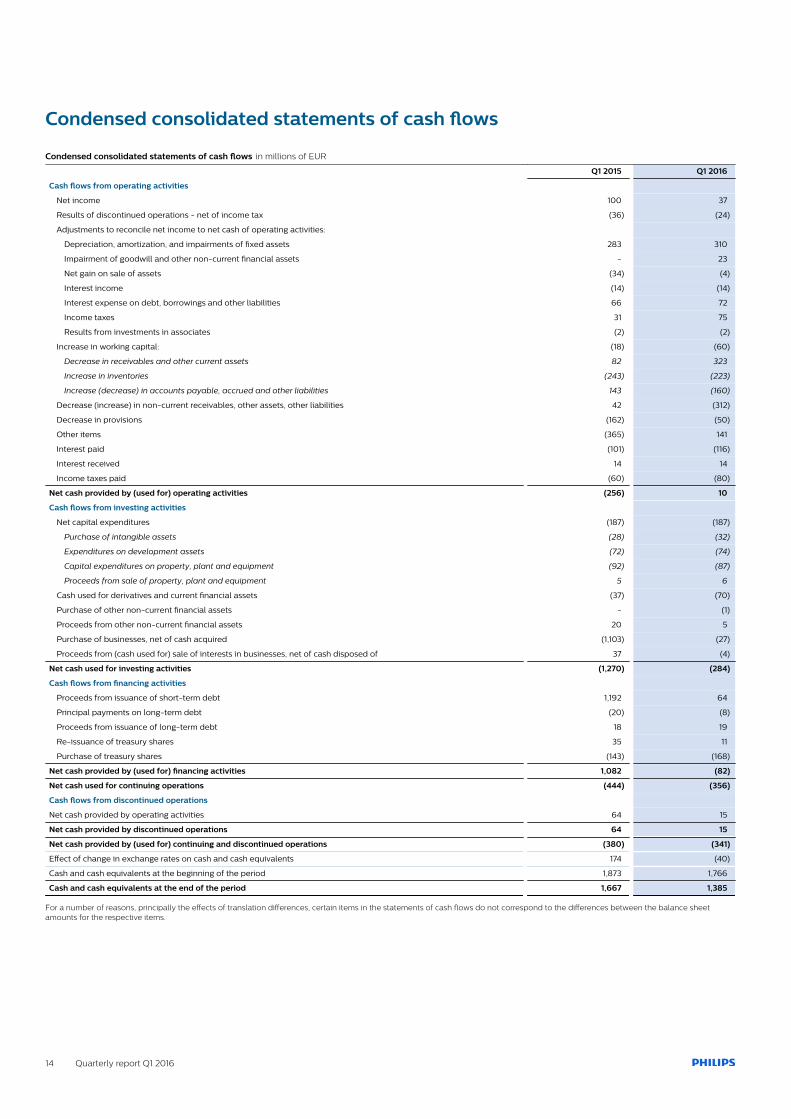
Condensed consolidated statements of cash flows
Condensed consolidated statements of cash flows in millions of EUR
Q1 2015 Q1 2016
Cash flows from operating activities
Net income 100 37
Results of discontinued operations - net of income tax (36) (24)
Adjustments to reconcile net income to net cash of operating activities:
Depreciation, amortization, and impairments of fixed assets 283 310
Impairment of goodwill and other non-current financial assets - 23
Net gain on sale of assets (34) (4)
Interest income (14) (14)
Interest expense on debt, borrowings and other liabilities 66 72
Income taxes 31 75
Results from investments in associates (2) (2)
Increase in working capital: (18) (60)
Decrease in receivables and other current assets 82 323
Increase in inventories (243) (223)
Increase (decrease) in accounts payable, accrued and other liabilities 143 (160)
Decrease (increase) in non-current receivables, other assets, other liabilities 42 (312)
Decrease in provisions (162) (50)
Other items (365) 141
Interest paid (101) (116)
Interest received 14 14
Income taxes paid (60) (80)
Net cash provided by (used for) operating activities (256) 10
Cash flows from investing activities
Net capital expenditures (187) (187)
Purchase of intangible assets (28) (32)
Expenditures on development assets (72) (74)
Capital expenditures on property, plant and equipment (92) (87)
Proceeds from sale of property, plant and equipment 5 6
Cash used for derivatives and current financial assets (37) (70)
Purchase of other non-current financial assets - (1)
Proceeds from other non-current financial assets 20 5
Purchase of businesses, net of cash acquired (1,103) (27)
Proceeds from (cash used for) sale of interests in businesses, net of cash disposed of 37 (4)
Net cash used for investing activities (1,270) (284)
Cash flows from financing activities
Proceeds from issuance of short-term debt 1,192 64
Principal payments on long-term debt (20) (8)
Proceeds from issuance of long-term debt 18 19
Re-issuance of treasury shares 35 11
Purchase of treasury shares (143) (168)
Net cash provided by (used for) financing activities 1,082 (82)
Net cash used for continuing operations (444) (356)
Cash flows from discontinued operations
Net cash provided by operating activities 64 15
Net cash provided by discontinued operations 64 15
Net cash provided by (used for) continuing and discontinued operations (380) (341)
Effect of change in exchange rates on cash and cash equivalents 174 (40)
Cash and cash equivalents at the beginning of the period 1,873 1,766
Cash and cash equivalents at the end of the period 1,667 1,385
For a number of reasons, principally the effects of translation differences, certain items in the statements of cash flows do not correspond to the differences between the balance sheetamounts for the respective items.

Quarterly report Q1 2016 15
Condensed consolidated statement of changes in equity
Condensed consolidated statement of changes in equity in millions of EUR
com
mon sh
ares
capita
l in e
xcess
of p
ar valu
e
reta
ined e
arnin
gs
reva
luatio
n rese
rve
curre
ncy tr
anslatio
n diff
erence
s
availa
ble-f
or-sa
le fi
nancial a
ssets
cash
flow
hedges
treasu
ry sh
ares a
t cost
tota
l share
holders
’ equity
non-contro
lling in
tere
sts
tota
l equity
Balance as of December 31,2015 186 2,669 8,040 4 1,058 56 12 (363) 11,662 118 11,780
Total comprehensive income(loss) 36 (2) (263) (20) (4) (253) 5 (248)
Movement non-controllinginterest 7 7
Purchase of treasury shares (174) (174) (174)
Re-issuance of treasury shares (1) (8) 20 11 11
Share call options1) (77) 77 - -
Share-based compensationplans 28 28 28
Income tax share-basedcompensation plans 5 5 5
Total other equity movements 32 (85) (77) (130) 7 (123)
Balance as of March 31, 2016 186 2,701 7,991 2 795 36 8 (440) 11,279 130 11,409
1) During the first quarter of 2016 Philips bought call options to hedge a part of the commitments under share based payment plans. The call option premiums paid (EUR 64 million) arededucted from retained earnings and were settled in Philips shares (representing a historical cost of EUR 77 million based on a FIFO method) held by the company. The differencebetween the option premiums and the historical cost of the Philips shares is recorded in retained earnings.

16 Quarterly report Q1 2016
Segments and main countries
Sales and income (loss) from operations in millions of EUR unless otherwise stated
Q1 2015 Q1 2016
sales income from operations sales income from operations
as a % of sales as a % of sales
Personal Health 1,522 157 10.3% 1,610 190 11.8%
Diagnosis & Treatment 1,304 (24) (1.8)% 1,419 10 0.7%
Connected Care & Health Informatics 625 (37) (5.9)% 694 11 1.6%
HealthTech Other 135 21 103 (9)
Lighting 1,722 59 3.4% 1,691 73 4.3%
Legacy Items 31 (37) - (76)
Philips 5,339 139 2.6% 5,517 199 3.6%
Sales and tangible and intangible assets in millions of EUR
sales long-lived assets1)
Q1 March 31, March 31,
2015 2016 2015 2016
Netherlands 142 157 950 974
United States 1,627 1,813 9,693 8,893
China 615 649 1,255 1,140
Germany 317 308 147 174
Japan 247 283 425 473
France 186 189 50 47
India 171 174 146 119
Other countries 2,034 1,944 2,259 2,189
Philips 5,339 5,517 14,925 14,009
1) Includes property, plant and equipment, intangible assets excluding goodwill, and goodwill
Quarterly report Q1 2016 17
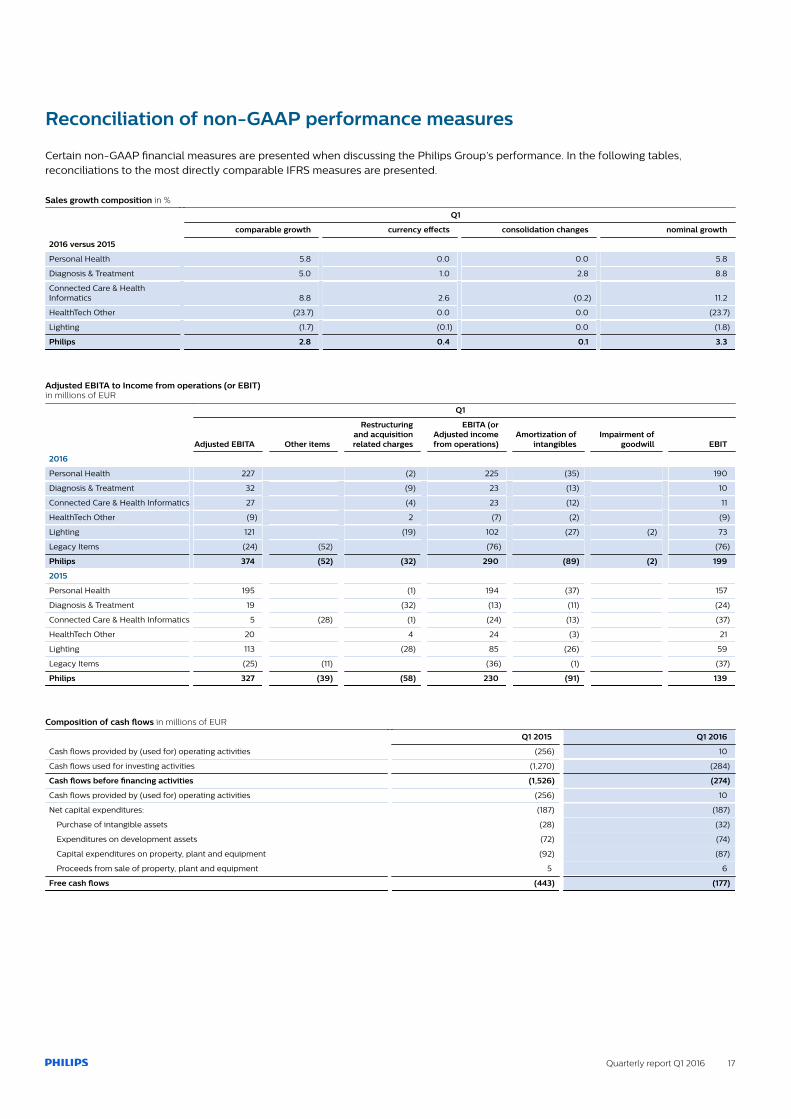
Reconciliation of non-GAAP performance measures
Certain non-GAAP financial measures are presented when discussing the Philips Group’s performance. In the following tables,reconciliations to the most directly comparable IFRS measures are presented.
Sales growth composition in %
Q1
comparable growth currency effects consolidation changes nominal growth
2016 versus 2015
Personal Health 5.8 0.0 0.0 5.8
Diagnosis & Treatment 5.0 1.0 2.8 8.8
Connected Care & HealthInformatics 8.8 2.6 (0.2) 11.2
HealthTech Other (23.7) 0.0 0.0 (23.7)
Lighting (1.7) (0.1) 0.0 (1.8)
Philips 2.8 0.4 0.1 3.3
Adjusted EBITA to Income from operations (or EBIT) in millions of EUR
Q1
Adjusted EBITA Other items
Restructuringand acquisitionrelated charges
EBITA (orAdjusted incomefrom operations)
Amortization ofintangibles
Impairment ofgoodwill EBIT
2016
Personal Health 227 (2) 225 (35) 190
Diagnosis & Treatment 32 (9) 23 (13) 10
Connected Care & Health Informatics 27 (4) 23 (12) 11
HealthTech Other (9) 2 (7) (2) (9)
Lighting 121 (19) 102 (27) (2) 73
Legacy Items (24) (52) (76) (76)
Philips 374 (52) (32) 290 (89) (2) 199
2015
Personal Health 195 (1) 194 (37) 157
Diagnosis & Treatment 19 (32) (13) (11) (24)
Connected Care & Health Informatics 5 (28) (1) (24) (13) (37)
HealthTech Other 20 4 24 (3) 21
Lighting 113 (28) 85 (26) 59
Legacy Items (25) (11) (36) (1) (37)
Philips 327 (39) (58) 230 (91) 139
Composition of cash flows in millions of EUR
Q1 2015 Q1 2016
Cash flows provided by (used for) operating activities (256) 10
Cash flows used for investing activities (1,270) (284)
Cash flows before financing activities (1,526) (274)
Cash flows provided by (used for) operating activities (256) 10
Net capital expenditures: (187) (187)
Purchase of intangible assets (28) (32)
Expenditures on development assets (72) (74)
Capital expenditures on property, plant and equipment (92) (87)
Proceeds from sale of property, plant and equipment 5 6
Free cash flows (443) (177)
18 Quarterly report Q1 2016
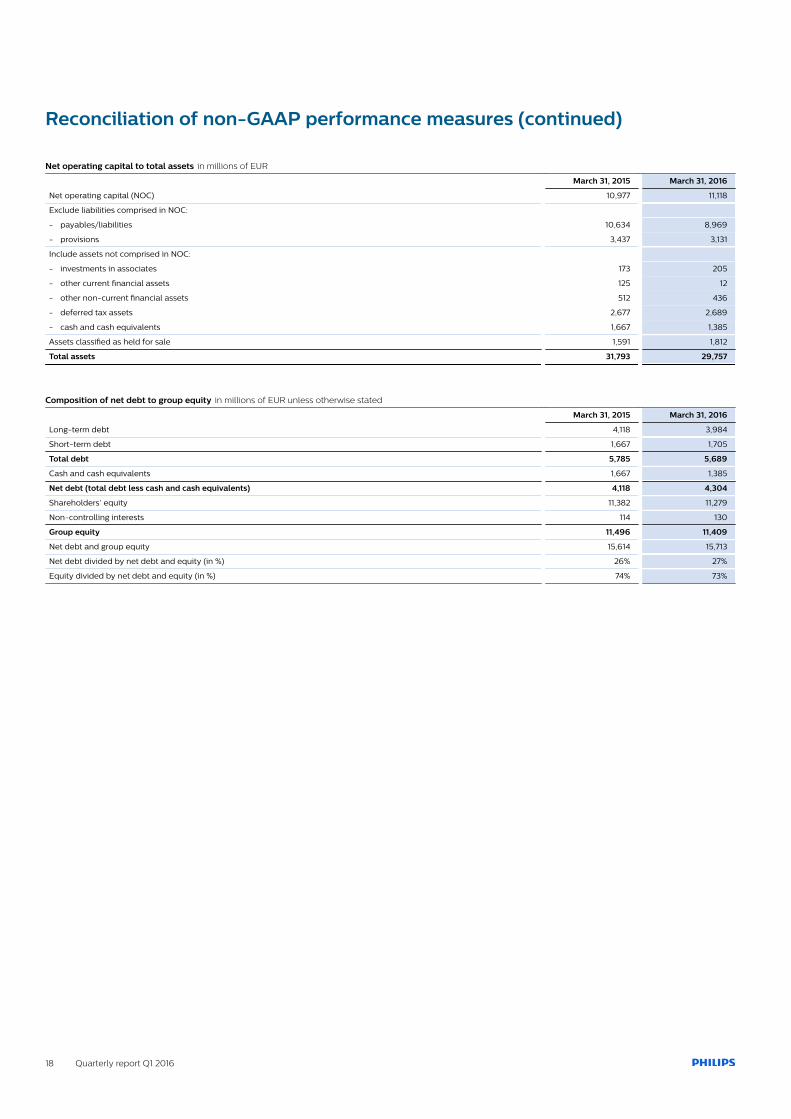
Reconciliation of non-GAAP performance measures (continued)
Net operating capital to total assets in millions of EUR
March 31, 2015 March 31, 2016
Net operating capital (NOC) 10,977 11,118
Exclude liabilities comprised in NOC:
- payables/liabilities 10,634 8,969
- provisions 3,437 3,131
Include assets not comprised in NOC:
- investments in associates 173 205
- other current financial assets 125 12
- other non-current financial assets 512 436
- deferred tax assets 2,677 2,689
- cash and cash equivalents 1,667 1,385
Assets classified as held for sale 1,591 1,812
Total assets 31,793 29,757
Composition of net debt to group equity in millions of EUR unless otherwise stated
March 31, 2015 March 31, 2016
Long-term debt 4,118 3,984
Short-term debt 1,667 1,705
Total debt 5,785 5,689
Cash and cash equivalents 1,667 1,385
Net debt (total debt less cash and cash equivalents) 4,118 4,304
Shareholders’ equity 11,382 11,279
Non-controlling interests 114 130
Group equity 11,496 11,409
Net debt and group equity 15,614 15,713
Net debt divided by net debt and equity (in %) 26% 27%
Equity divided by net debt and equity (in %) 74% 73%
Quarterly report Q1 2016 19
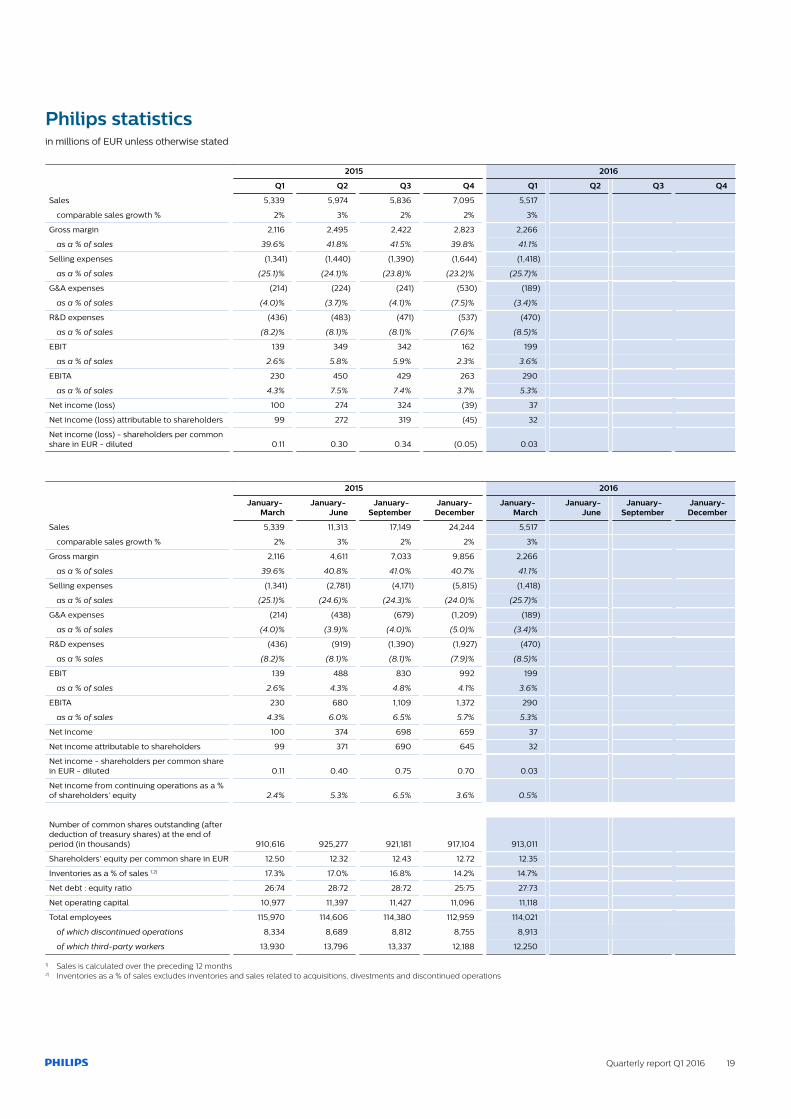
Philips statisticsin millions of EUR unless otherwise stated
2015 2016
Q1 Q2 Q3 Q4 Q1 Q2 Q3 Q4
Sales 5,339 5,974 5,836 7,095 5,517
comparable sales growth % 2% 3% 2% 2% 3%
Gross margin 2,116 2,495 2,422 2,823 2,266
as a % of sales 39.6% 41.8% 41.5% 39.8% 41.1%
Selling expenses (1,341) (1,440) (1,390) (1,644) (1,418)
as a % of sales (25.1)% (24.1)% (23.8)% (23.2)% (25.7)%
G&A expenses (214) (224) (241) (530) (189)
as a % of sales (4.0)% (3.7)% (4.1)% (7.5)% (3.4)%
R&D expenses (436) (483) (471) (537) (470)
as a % of sales (8.2)% (8.1)% (8.1)% (7.6)% (8.5)%
EBIT 139 349 342 162 199
as a % of sales 2.6% 5.8% 5.9% 2.3% 3.6%
EBITA 230 450 429 263 290
as a % of sales 4.3% 7.5% 7.4% 3.7% 5.3%
Net income (loss) 100 274 324 (39) 37
Net income (loss) attributable to shareholders 99 272 319 (45) 32
Net income (loss) - shareholders per commonshare in EUR - diluted 0.11 0.30 0.34 (0.05) 0.03
2015 2016
January- March
January- June
January- September
January- December
January- March
January-June
January- September
January- December
Sales 5,339 11,313 17,149 24,244 5,517
comparable sales growth % 2% 3% 2% 2% 3%
Gross margin 2,116 4,611 7,033 9,856 2,266
as a % of sales 39.6% 40.8% 41.0% 40.7% 41.1%
Selling expenses (1,341) (2,781) (4,171) (5,815) (1,418)
as a % of sales (25.1)% (24.6)% (24.3)% (24.0)% (25.7)%
G&A expenses (214) (438) (679) (1,209) (189)
as a % of sales (4.0)% (3.9)% (4.0)% (5.0)% (3.4)%
R&D expenses (436) (919) (1,390) (1,927) (470)
as a % sales (8.2)% (8.1)% (8.1)% (7.9)% (8.5)%
EBIT 139 488 830 992 199
as a % of sales 2.6% 4.3% 4.8% 4.1% 3.6%
EBITA 230 680 1,109 1,372 290
as a % of sales 4.3% 6.0% 6.5% 5.7% 5.3%
Net income 100 374 698 659 37
Net income attributable to shareholders 99 371 690 645 32
Net income - shareholders per common sharein EUR - diluted 0.11 0.40 0.75 0.70 0.03
Net income from continuing operations as a %of shareholders’ equity 2.4% 5.3% 6.5% 3.6% 0.5%
Number of common shares outstanding (afterdeduction of treasury shares) at the end ofperiod (in thousands) 910,616 925,277 921,181 917,104 913,011
Shareholders’ equity per common share in EUR 12.50 12.32 12.43 12.72 12.35
Inventories as a % of sales 1,2) 17.3% 17.0% 16.8% 14.2% 14.7%
Net debt : equity ratio 26:74 28:72 28:72 25:75 27:73
Net operating capital 10,977 11,397 11,427 11,096 11,118
Total employees 115,970 114,606 114,380 112,959 114,021
of which discontinued operations 8,334 8,689 8,812 8,755 8,913
of which third-party workers 13,930 13,796 13,337 12,188 12,250
1) Sales is calculated over the preceding 12 months2) Inventories as a % of sales excludes inventories and sales related to acquisitions, divestments and discontinued operations

http://www.philips.com/investorrelations© 2016 Koninklijke Philips N.V. All rights reserved.