q1 2017 philips reports sales of eur 5.7 billion in …...full details about the financial...
TRANSCRIPT
Philips reports sales of EUR 5.7 billion in Q1, with the HealthTech portfoliogrowing at 3% on a comparable basis; net income improved to EUR 259 million,driven by an 18% increase in Adjusted EBITA to EUR 442 million
Amsterdam, April 24, 2017
First-quarter highlights
• Sales increased to EUR 5.7 billion, with comparable sales growth of 3% in the HealthTech portfolioand 2% for the Group
• Net income amounted to EUR 259 million, compared to EUR 37 million in Q1 2016• Income from operations (EBIT) amounted to EUR 348 million, compared to EUR 199 million in Q1
2016• EBITA improved to EUR 437 million, or 7.6% of sales, compared to EUR 290 million, or 5.3% of
sales, in Q1 2016• Adjusted EBITA improved to EUR 442 million, or 7.7% of sales, compared to EUR 374 million, or
6.8% of sales, in Q1 2016• Operating cash flow totaled EUR 343 million, compared to EUR 10 million in Q1 2016; free cash flow
of EUR 295 million, compared to an outflow of EUR 177 million in Q1 2016
Frans van Houten, CEO:
“We had a solid start to the year, with 2% Group comparable sales growth and a 90-basis-point improvement in the Adjusted EBITAmargin. Despite continued volatility in the markets in which we operate, our HealthTech portfolio grew 3% and achieved furtheroperational improvements, resulting in an 80-basis-point increase in the Adjusted EBITA margin.
Our Diagnosis & Treatment businesses and our Personal Health businesses delivered strong margin improvements, while ourConnected Care & Health Informatics businesses reflected the unevenness of sales from large hospital informatics deals.Comparable order intake growth was 2%, driven by mid-single-digit growth in the Diagnosis & Treatment businesses.
During what was a very active quarter, in line with our strategic plan we decreased our shareholding in Philips Lighting to 55%. Wecontinued to strengthen our position as a leader in health technology by launching several breakthrough innovations, forgingstrategic partnerships and winning various integrated solutions deals. The recent STOXX Europe 600 Index reclassification ofPhilips’ shares to ‘Health Care’ from ‘Industrial Goods & Services’ acknowledges our transformation into a health technologycompany.
As we execute our strategy, we will further improve our underlying performance and target to deliver 4-6% comparable sales growthand an improvement in Adjusted EBITA margin of around 100 basis points per year. Our outlook for 2017 remains unchanged as weexpect further operational improvements and comparable sales growth in the year to be back-end loaded.”
HealthTechIn the first quarter, the Personal Health businesses increased sales by 5% on a comparable basis, with growth across the portfolio asHealth & Wellness and Sleep & Respiratory Care recorded high-single-digit growth; the Adjusted EBITA margin improved by 150basis points. The Diagnosis & Treatment businesses posted comparable sales growth of 2%, and the Adjusted EBITA marginimproved by 190 basis points, driven by Diagnostic Imaging. In the Connected Care & Health Informatics businesses, comparablesales increased 1%, while the Adjusted EBITA margin was 30 basis points lower than in the same period last year, mainly reflectinglower growth and higher channel investments.
Q1 2017Quarterly report
The continued focus and investments in R&D led to a number of breakthrough innovations and strategic collaborations:
• Philips reinforced its leadership in image-guided therapy solutions with the global launch of Philips Azurion, the next-generationimage-guided therapy platform that enables clinicians to perform a wide range of routine and complex procedures, helping themto optimize interventional lab performance and provide superior care.
• Philips Volcano continued its strong performance as the business reached an important milestone with the results of two largeclinical trials demonstrating the benefits of Philips’ Instant Wave-Free Ratio (iFR) technology compared to Fractional FlowReserve (FFR), the current standard, removing a critical barrier for the use and adoption of iFR to decide, guide and confirmappropriate therapies.
• B. Braun and Philips entered into a strategic alliance to innovate and accelerate growth in ultrasound-guided regional anesthesiaand vascular access. The alliance launched Xperius, a new co-branded mobile ultrasound system specifically designed as theplatform to support current and future integrated solutions in this fast-growing market.
• Building on its strategy to deliver relevant solutions and business models, Philips signed an agreement to acquire AustralianPharmacy Sleep Services (APSS), a pioneer in pharmacy sleep testing. APSS will complement Philips’ sleep and respiratory careportfolio and will help to accelerate the business’s home sleep testing offering through the pharmacy channel in Australia.
• At the International Dental Show in Germany, the world’s leading trade fair for the dental sector, Philips revealed the PhilipsSonicare DiamondClean Smart toothbrush and Philips Sonicare Breath care system with breath analyzer, an all-in-oneconnected oral care platform. Philips also presented the results of a new clinical study demonstrating the effectiveness of PhilipsSonicare power toothbrushes and Philips AirFloss Ultra.
• Demonstrating the success of telehealth technologies, Emory Healthcare (US) achieved savings of USD 4.6 million over a periodof 15 months by using Philips’ eICU platform. Similarly, with the help of Philips’ Intensive Ambulatory Care program, BannerHealth (US) reduced hospitalizations for chronically ill patients with multiple conditions by nearly 50%, reducing overall cost ofcare by more than one third.
• Expanding its health informatics portfolio, Philips launched its IntelliSpace Enterprise Edition, an industry-first managed servicesolution for hospital-wide clinical informatics and data management. The high-performance, secure and scalable healthinformatics platform enables health systems to manage the growth and cost of their clinical enterprise with a pay-per-use model.
• Further strengthening its portfolio of imaging solutions, Philips received FDA 510(k) clearance for its ElastQ ultrasound imagingtechnology for non-invasive assessment of liver conditions. Philips also launched Access CT, a new CT system designed forhealthcare organizations seeking to establish or enhance CT imaging capabilities at affordable cost.
Cost savingsIn the first quarter, procurement savings amounted to EUR 41 million. Other productivity programs resulted in savings of EUR 54million.
Philips Lighting
In the first quarter, the Adjusted EBITA margin improved by 130 basis points to 8.5% of sales, while comparable sales were flat, andfree cash flow amounted to EUR 2 million. Full details about the financial performance of Philips Lighting in the first quarter werepublished on April 21, 2017. The related report can be accessed here.
On February 8, 2017, Philips sold 26 million shares in Philips Lighting, of which 3.5 million shares were acquired by Philips Lighting(and will be cancelled). Philips’ shareholding in Philips Lighting decreased to 55.18% of Philips Lighting’s issued and outstandingshare capital, down from 71.225% prior to the transaction. Philips continues to consolidate the financial results of Philips Lighting andmaintains its aim of fully selling down over the coming years.
Philips Group other
As previously reported, Philips continues to be in discussions on a civil matter with the US Department of Justice representing theFDA, arising from past inspections by the FDA in and prior to 2015, focusing primarily on the external defibrillator business in the US.
FinancingOn January 20, 2017, Philips completed the redemption of the outstanding 5.750% Notes due 2018 with an aggregate principalamount of USD 1.250 billion. The transaction resulted in a cash outflow in the first quarter of 2017 of EUR 1.247 billion excludingaccrued interest. The transaction contributed to Philips’ plan to reduce its annual interest expenses by approximately EUR 100million.
Conference call and audio webcastFrans van Houten, CEO, and Abhijit Bhattacharya, CFO, will host a conference call for investors and analysts at 10:00 am CET todayto discuss the results. A live audio webcast of the conference call will be available on the Philips Investor Relations website and canbe accessed here.

Quarterly report Q1 2017 3
Philips Group performance
Key data in millions of EUR unless otherwise stated
Q1 2016 Q1 2017
Sales 5,517 5,724
Nominal sales growth 3% 4%
Comparable sales growth* 3% 2%
Income from operations (EBIT) 199 348
as a % of sales 3.6% 6.1%
EBITA* 290 437
as a % of sales 5.3% 7.6%
Adjusted EBITA* 374 442
as a % of sales 6.8% 7.7%
Financial expenses, net (114) (61)
Investments in associates 3 (1)
Income taxes (75) (91)
Income from continuing operations 13 195
Discontinued operations 24 64
Net income 37 259
Net income attributable to shareholders per commonshare (in EUR) - diluted 0.03 0.25
• Sales increased by 4% on a nominal basis. Excluding currencyimpact and consolidation changes, the 2% comparable salesgrowth was driven by 3% growth in the HealthTech portfolio.
• Comparable order intake* showed 2% growth, driven by mid-single-digit growth in the Diagnosis & Treatment businessesand a low-single-digit decline in the Connected Care & HealthInformatics businesses.
• EBITA improved by EUR 147 million and the margin improvedby 230 basis points compared to Q1 2016.
• Adjusted EBITA improved by EUR 68 million and the marginimproved by 90 basis points compared to Q1 2016. Theimprovement was mainly attributable to higher volume,procurement savings and overhead cost reductions.
• Restructuring and acquisition-related charges amounted toEUR 34 million, compared to EUR 32 million in Q1 2016. EBITAalso included EUR 12 million of charges related to theseparation of the Lighting business, EUR 17 million of chargesrelated to quality and regulatory actions, and a EUR 59 millionnet gain from the sale of real estate assets. EBITA in Q1 2016included EUR 52 million of charges related to the separation ofthe Lighting business.
• Net financial expenses decreased by EUR 53 million year-on-year, mainly due to lower net interest expenses and the fairmarket value adjustment in Q1 2016 of Philips’ stake in CorindusVascular Robotics.
• Income tax expense increased by EUR 16 million mainly due tohigher income; Q1 2016 included tax charges resulting fromactivities related to the separation of the Lighting business.
• Net income from discontinued operations increased by EUR 40million year-on-year, mainly due to improved operationalperformance in the combined Lumileds and Automotivebusinesses.
• Net income increased by EUR 222 million compared to Q1 2016,driven by improved income from operations and lowerfinancial charges.
Sales per geographic cluster in millions of EUR unless otherwise stated
% change
Q1 2016 Q1 2017 nominal comparable*
Western Europe 1,334 1,372 3% 5%
North America 1,937 1,958 1% (2)%
Other maturegeographies 459 474 3% (3)%
Total maturegeographies 3,730 3,804 2% 0%
Growth geographies 1,787 1,920 7% 6%
Philips Group 5,517 5,724 4% 2%
• Sales in mature geographies increased by 2% on a nominalbasis. Excluding currency impact and consolidation changes,comparable sales were flat year-on-year and reflected mid-single-digit growth in Western Europe, offset by a low-single-digit decline in North America (due to Lighting) and othermature geographies. In growth geographies, sales increased by7% on a nominal basis. Excluding currency impact andconsolidation changes, the 6% growth on a comparable basiswas largely driven by high-single-digit growth in Latin Americaand mid-single-digit growth in China and India.
• Comparable order intake* in mature geographies showed low-single-digit growth, reflecting double-digit growth in WesternEurope and low-single-digit growth in North America andother mature geographies. In growth geographies, comparableorder intake* was flat year-on-year, reflecting double-digitgrowth in China, offset by a double-digit decline in LatinAmerica.
* Non-GAAP financial measure. Refer to Reconciliation of non-GAAP information, of this document.

4 Quarterly report Q1 2017
Cash balance in millions of EUR
Q1 2016 Q1 2017
Beginning cash balance 1,766 2,334
Free cash flow* (177) 295
Net cash flows from operating activities 10 343
Net capital expenditures (187) (48)
Other cash flows from investing activities (97) (104)
Treasury shares transactions (157) (57)
Changes in debt 75 (268)
Sale of shares of Philips Lighting, net 523
Other cash flow items (40) (28)
Net cash flows from discontinued operations 15 36
Ending cash balance 1,385 2,731
• Net cash flows from operating activities increased by EUR 333million, mainly due to improvements in income fromoperations and the outflow of EUR 172 million in Q1 2016related to pension liability de-risking. This was partly offset bya EUR 64 million premium payment related to the bondredemption completed on January 20, 2017.
• Net capital expenditures decreased by EUR 139 million, mainlydue to proceeds from the sale of real estate assets.
• The change in debt reflects a new borrowing of EUR 949million and a EUR 1,184 million cash outflow related to the bondredemption completed on January 20, 2017.
• The cash balance includes EUR 523 million net cash proceedsfrom the sale of a stake in Philips Lighting N.V.
* Non-GAAP financial measure. Refer to Reconciliation of non-GAAP information, of this document.
Quarterly report Q1 2017 5
Performance per segment
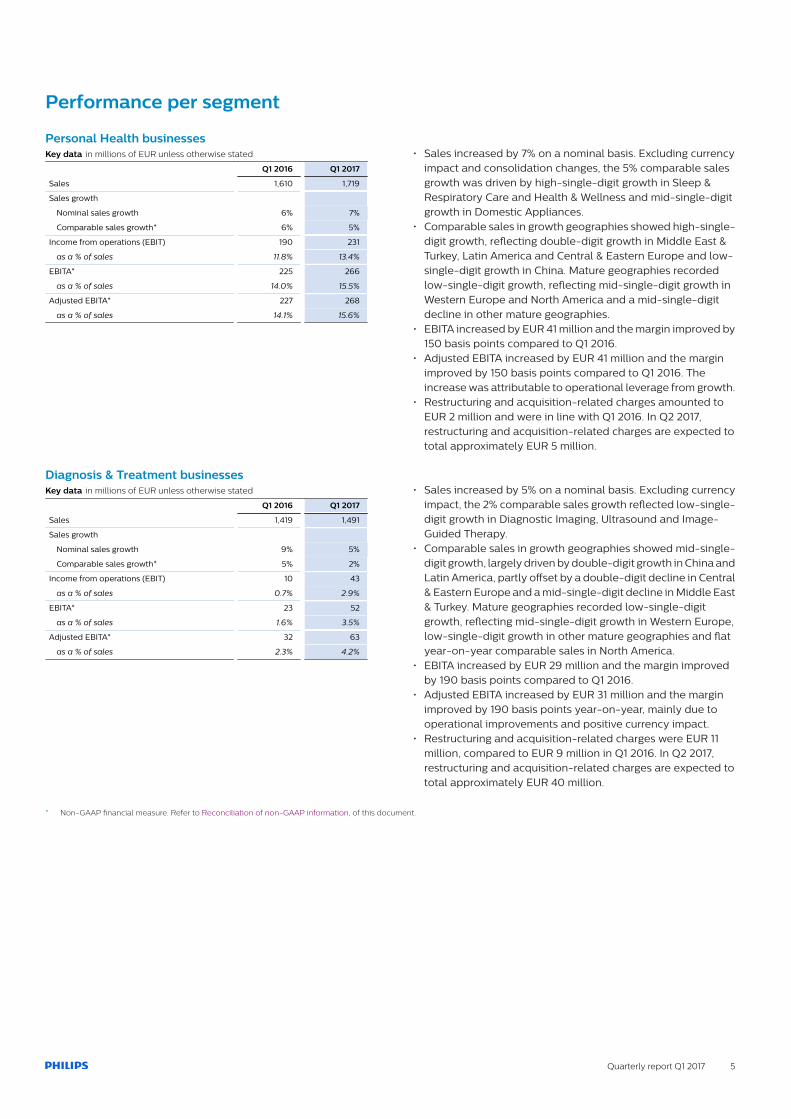
Personal Health businessesKey data in millions of EUR unless otherwise stated
Q1 2016 Q1 2017
Sales 1,610 1,719
Sales growth
Nominal sales growth 6% 7%
Comparable sales growth* 6% 5%
Income from operations (EBIT) 190 231
as a % of sales 11.8% 13.4%
EBITA* 225 266
as a % of sales 14.0% 15.5%
Adjusted EBITA* 227 268
as a % of sales 14.1% 15.6%
• Sales increased by 7% on a nominal basis. Excluding currencyimpact and consolidation changes, the 5% comparable salesgrowth was driven by high-single-digit growth in Sleep &Respiratory Care and Health & Wellness and mid-single-digitgrowth in Domestic Appliances.
• Comparable sales in growth geographies showed high-single-digit growth, reflecting double-digit growth in Middle East &Turkey, Latin America and Central & Eastern Europe and low-single-digit growth in China. Mature geographies recordedlow-single-digit growth, reflecting mid-single-digit growth inWestern Europe and North America and a mid-single-digitdecline in other mature geographies.
• EBITA increased by EUR 41 million and the margin improved by150 basis points compared to Q1 2016.
• Adjusted EBITA increased by EUR 41 million and the marginimproved by 150 basis points compared to Q1 2016. Theincrease was attributable to operational leverage from growth.
• Restructuring and acquisition-related charges amounted toEUR 2 million and were in line with Q1 2016. In Q2 2017,restructuring and acquisition-related charges are expected tototal approximately EUR 5 million.
Diagnosis & Treatment businessesKey data in millions of EUR unless otherwise stated
Q1 2016 Q1 2017
Sales 1,419 1,491
Sales growth
Nominal sales growth 9% 5%
Comparable sales growth* 5% 2%
Income from operations (EBIT) 10 43
as a % of sales 0.7% 2.9%
EBITA* 23 52
as a % of sales 1.6% 3.5%
Adjusted EBITA* 32 63
as a % of sales 2.3% 4.2%
• Sales increased by 5% on a nominal basis. Excluding currencyimpact, the 2% comparable sales growth reflected low-single-digit growth in Diagnostic Imaging, Ultrasound and Image-Guided Therapy.
• Comparable sales in growth geographies showed mid-single-digit growth, largely driven by double-digit growth in China andLatin America, partly offset by a double-digit decline in Central& Eastern Europe and a mid-single-digit decline in Middle East& Turkey. Mature geographies recorded low-single-digitgrowth, reflecting mid-single-digit growth in Western Europe,low-single-digit growth in other mature geographies and flatyear-on-year comparable sales in North America.
• EBITA increased by EUR 29 million and the margin improvedby 190 basis points compared to Q1 2016.
• Adjusted EBITA increased by EUR 31 million and the marginimproved by 190 basis points year-on-year, mainly due tooperational improvements and positive currency impact.
• Restructuring and acquisition-related charges were EUR 11million, compared to EUR 9 million in Q1 2016. In Q2 2017,restructuring and acquisition-related charges are expected tototal approximately EUR 40 million.
* Non-GAAP financial measure. Refer to Reconciliation of non-GAAP information, of this document.

6 Quarterly report Q1 2017
Connected Care & Health Informatics businessesKey data in millions of EUR unless otherwise stated
Q1 2016 Q1 2017
Sales 694 732
Sales growth
Nominal sales growth 11% 5%
Comparable sales growth* 9% 1%
Income from operations (EBIT) 11 (12)
as a % of sales 1.6% (1.6)%
EBITA* 23 0
as a % of sales 3.3% 0.0%
Adjusted EBITA* 27 26
as a % of sales 3.9% 3.6%
• Sales increased by 5% on a nominal basis. Excluding currencyimpact and consolidation changes, the 1% comparable salesgrowth was driven by low-single-digit growth in Patient Care& Monitoring Solutions, partly offset by a low-single-digitdecline in Healthcare Informatics, Solutions & Services.
• Comparable sales in growth geographies were in line with Q12016, reflecting double-digit growth in China, offset by adouble-digit decline in India and Middle East & Turkey. Maturegeographies posted low-single-digit growth, driven by high-single-digit growth in Western Europe and low-single-digitgrowth in North America, partly offset by a mid-single-digitdecline in other mature geographies.
• EBITA decreased by EUR 23 million and the margin declinedby 330 basis points compared to Q1 2016.
• The Adjusted EBITA margin decreased by 30 basis points year-on-year, mainly reflecting lower growth and higher channelinvestments.
• Restructuring and acquisition-related charges amounted toEUR 8 million, compared to EUR 4 million in Q1 2016. EBITA alsoincluded EUR 17 million of charges related to quality andregulatory actions. Restructuring and acquisition-relatedcharges are expected to total approximately EUR 10 million inQ2 2017.
HealthTech OtherKey data in millions of EUR
Q1 2016 Q1 2017
Sales 103 92
Income from operations (EBIT) (9) 12
EBITA* (7) 18
Adjusted EBITA* (9) (38)
IP Royalties 57 50
Innovation 1) (44) (54)
Central costs (21) (32)
Other (1) (2)
1) Innovation includes Emerging Businesses
• Sales reflected EUR 14 million lower royalty income due to theforeseen expiration of licenses.
• EBITA increased by EUR 25 million year-on-year.• The Adjusted EBITA decline was mainly attributable to lower
royalty income, phasing of costs in Innovation and Centralcosts, as well as investments in rationalizing the IT landscape.
• Restructuring and acquisition-related charges amounted toEUR 3 million. EBITA included a EUR 59 million gain on the saleof real estate assets. EBITA in Q1 2016 included a EUR 2 millionnet release of restructuring charges. In Q2 2017, restructuringand acquisition-related charges are expected to totalapproximately EUR 5 million.
LightingKey data in millions of EUR unless otherwise stated 1)
Q1 2016 Q1 2017
Sales 1,691 1,689
Sales growth
Nominal sales growth (2)% 0%
Comparable sales growth* (2)% 0%
Income from operations (EBIT) 73 105
as a % of sales 4.3% 6.2%
EBITA* 102 133
as a % of sales 6.0% 7.9%
Adjusted EBITA* 121 144
as a % of sales 7.2% 8.5%
1) The Lighting segment results differ from the stand-alone Philips Lighting reportingmainly due to the exclusion of intercompany sales and the reporting within LegacyItems of Philips Lighting separation costs incurred.
• Sales were flat year-on-year on both a nominal andcomparable basis, reflecting double-digit growth in LED andHome, low-single-digit growth in Professional and a double-digit decline in Lamps, in line with the industry trend.
• Total LED lighting sales grew 19% and now represent 61% oftotal Lighting sales.
• EBITA increased by EUR 31 million and the margin improved by190 basis points compared to Q1 2016.
• Adjusted EBITA continued to improve year-on-year. The EUR23 million increase was largely driven by procurement savingsand currency impact, partly offset by price erosion.
• Restructuring and acquisition-related charges were EUR 10million, compared to EUR 19 million in Q1 2016. For informationregarding the restructuring and acquisition-related chargesguidance, please refer to the Philips Lighting Q1 2017 pressrelease.
* Non-GAAP financial measure. Refer to Reconciliation of non-GAAP information, of this document.
Quarterly report Q1 2017 7
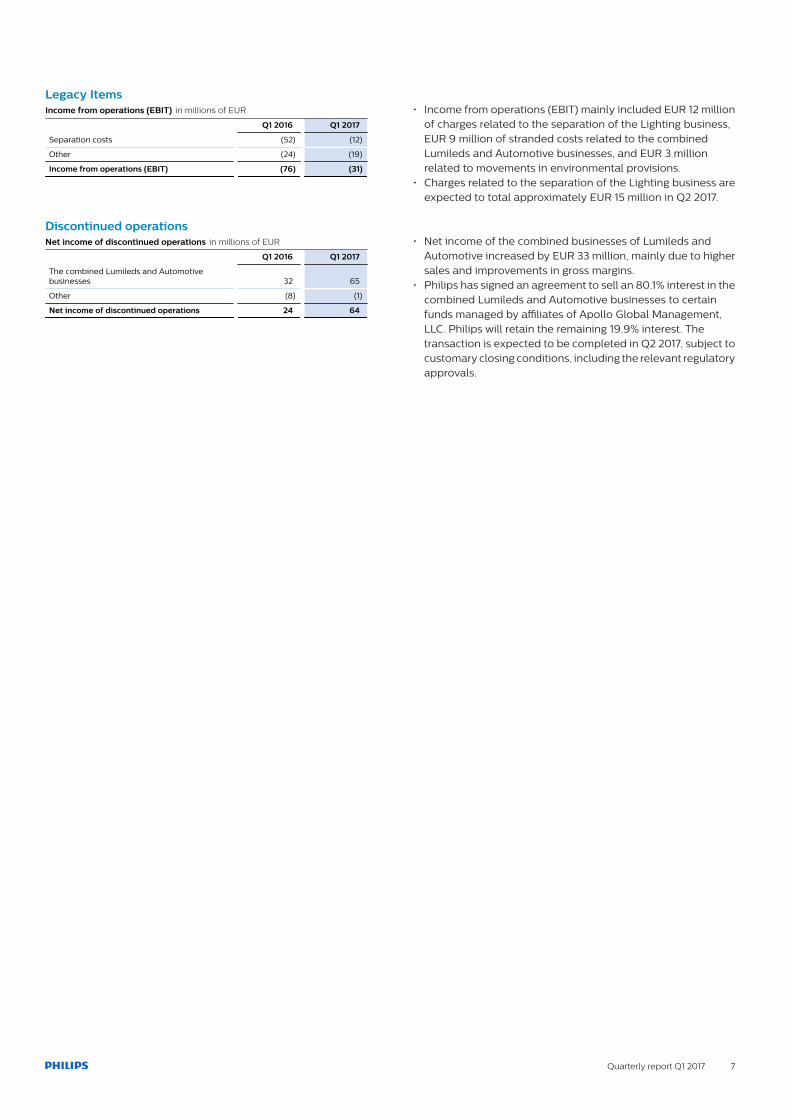
Legacy ItemsIncome from operations (EBIT) in millions of EUR
Q1 2016 Q1 2017
Separation costs (52) (12)
Other (24) (19)
Income from operations (EBIT) (76) (31)
• Income from operations (EBIT) mainly included EUR 12 millionof charges related to the separation of the Lighting business,EUR 9 million of stranded costs related to the combinedLumileds and Automotive businesses, and EUR 3 millionrelated to movements in environmental provisions.
• Charges related to the separation of the Lighting business areexpected to total approximately EUR 15 million in Q2 2017.
Discontinued operationsNet income of discontinued operations in millions of EUR
Q1 2016 Q1 2017
The combined Lumileds and Automotivebusinesses 32 65
Other (8) (1)
Net income of discontinued operations 24 64
• Net income of the combined businesses of Lumileds andAutomotive increased by EUR 33 million, mainly due to highersales and improvements in gross margins.
• Philips has signed an agreement to sell an 80.1% interest in thecombined Lumileds and Automotive businesses to certainfunds managed by affiliates of Apollo Global Management,LLC. Philips will retain the remaining 19.9% interest. Thetransaction is expected to be completed in Q2 2017, subject tocustomary closing conditions, including the relevant regulatoryapprovals.
8 Quarterly report Q1 2017
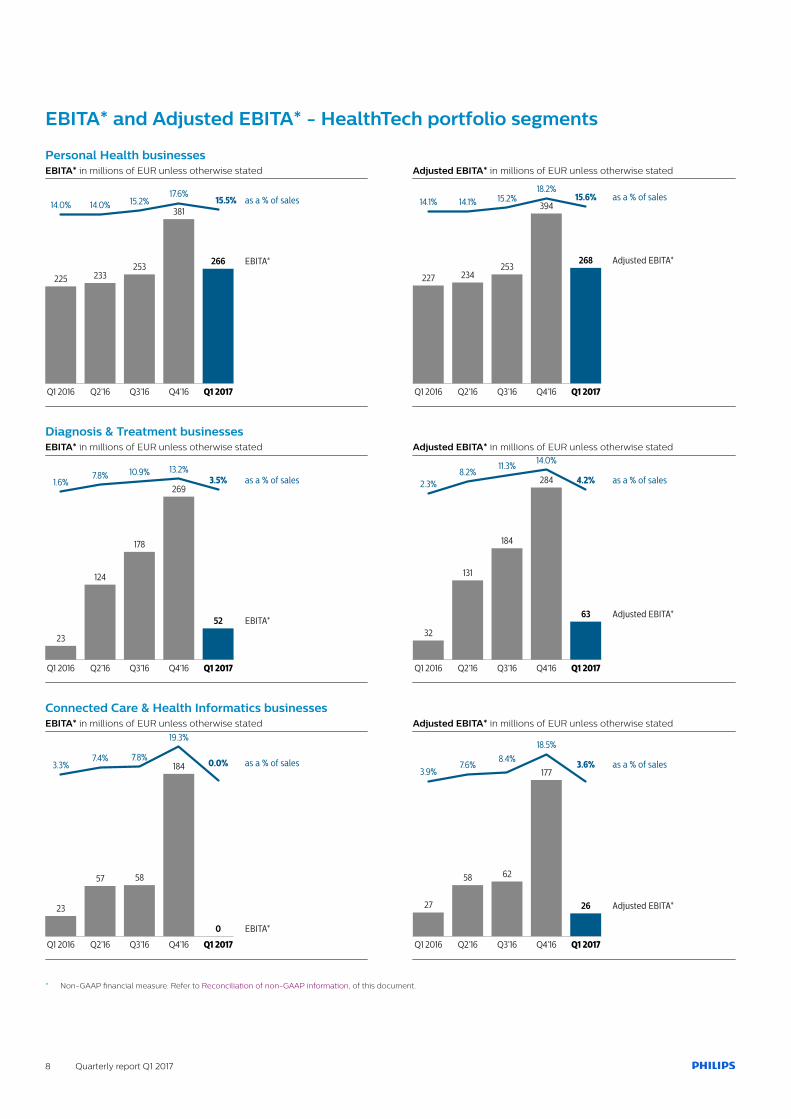
EBITA* and Adjusted EBITA* - HealthTech portfolio segments
Personal Health businessesEBITA* in millions of EUR unless otherwise stated
225
Q1 2016
233
Q2’16
253
Q3’16
381
Q4’16
266 EBITA*
Q1 2017
14.0% 14.0% 15.2%17.6%
15.5% as a % of sales
Adjusted EBITA* in millions of EUR unless otherwise stated
227
Q1 2016
234
Q2’16
253
Q3’16
394
Q4’16
268 Adjusted EBITA*
Q1 2017
14.1% 14.1% 15.2%18.2%
15.6% as a % of sales
Diagnosis & Treatment businessesEBITA* in millions of EUR unless otherwise stated
23
Q1 2016
124
Q2’16
178
Q3’16
269
Q4’16
52 EBITA*
Q1 2017
1.6%7.8% 10.9% 13.2%
3.5% as a % of sales
Adjusted EBITA* in millions of EUR unless otherwise stated
32
Q1 2016
131
Q2’16
184
Q3’16
284
Q4’16
63 Adjusted EBITA*
Q1 2017
2.3%8.2%
11.3% 14.0%
4.2% as a % of sales
Connected Care & Health Informatics businessesEBITA* in millions of EUR unless otherwise stated
23
Q1 2016
57
Q2’16
58
Q3’16
184
Q4’16
0 EBITA*
Q1 2017
3.3%7.4% 7.8%
19.3%
0.0% as a % of sales
Adjusted EBITA* in millions of EUR unless otherwise stated
27
Q1 2016
58
Q2’16
62
Q3’16
177
Q4’16
26 Adjusted EBITA*
Q1 2017
3.9%7.6%
8.4%
18.5%
3.6% as a % of sales
* Non-GAAP financial measure. Refer to Reconciliation of non-GAAP information, of this document.
Quarterly report Q1 2017 9
Forward-looking statements and other important information
Forward-looking statementsThis document and the related oral presentation, includingresponses to questions following the presentation, containcertain forward-looking statements with respect to the financialcondition, results of operations and business of Philips andcertain of the plans and objectives of Philips with respect to theseitems. Examples of forward-looking statements includestatements made about the strategy, estimates of sales growth,future EBITA, future developments in Philips’ organic businessand the completion of acquisitions and divestments. By theirnature, these statements involve risk and uncertainty becausethey relate to future events and circumstances and there aremany factors that could cause actual results and developmentsto differ materially from those expressed or implied by thesestatements.
These factors include but are not limited to: domestic and globaleconomic and business conditions; developments within theeuro zone; the successful implementation of Philips’ strategy andthe ability to realize the benefits of this strategy; the ability todevelop and market new products; changes in legislation; legalclaims; changes in exchange and interest rates; changes in taxrates; pension costs and actuarial assumptions; raw materialsand employee costs; the ability to identify and completesuccessful acquisitions, and to integrate those acquisitions intothe business; the ability to successfully exit certain businesses orrestructure the operations; the rate of technological changes;political, economic and other developments in countries wherePhilips operates; industry consolidation and competition; andthe state of international capital markets as they may affect thetiming and nature of the dispositions by Philips of its interests inPhilips Lighting and the combined Lumileds and Automotivebusinesses. As a result, Philips’ actual future results may differmaterially from the plans, goals and expectations set forth insuch forward-looking statements. For a discussion of factors thatcould cause future results to differ from such forward-lookingstatements, see the Risk management chapter included in theAnnual Report 2016.
Third-party market share dataStatements regarding market share, including those regardingPhilips’ competitive position, contained in this document arebased on outside sources such as research institutes, industryand dealer panels in combination with management estimates.Where information is not yet available to Philips, thosestatements may also be based on estimates and projectionsprepared by outside sources or management. Rankings arebased on sales unless otherwise stated.
Use of non-GAAP informationIn presenting and discussing the Philips Group financial position,operating results and cash flows, management uses certain non-GAAP financial measures. These non-GAAP financial measuresshould not be viewed in isolation as alternatives to the equivalentIFRS measures and should be used in conjunction with the mostdirectly comparable IFRS measures. Non-GAAP financialmeasures do not have standardized meaning under IFRS andtherefore may not be comparable to similar measures presentedby other issuers. A reconciliation of these non-GAAP measures
to the most directly comparable IFRS measures is contained inthis document. Further information on non-GAAP measures canbe found in the Annual Report 2016.
Use of fair-value measurementsIn presenting the Philips Group financial position, fair values areused for the measurement of various items in accordance withthe applicable accounting standards. These fair values are basedon market prices, where available, and are obtained from sourcesthat are deemed to be reliable. Readers are cautioned that thesevalues are subject to changes over time and are only valid at thebalance sheet date. When quoted prices or observable marketdata are not readily available, fair values are estimated usingappropriate valuation models and unobservable inputs. Such fairvalue estimates require management to make significantassumptions with respect to future developments, which areinherently uncertain and may therefore deviate from actualdevelopments. Critical assumptions used are disclosed in theAnnual Report 2016. Independent valuations may have beenobtained to support management’s determination of fair values.
PresentationAll amounts are in millions of euros unless otherwise stated. Dueto rounding, amounts may not add up precisely to totalsprovided. All reported data is unaudited. Financial reporting is inaccordance with the accounting policies as stated in the AnnualReport 2016, unless otherwise stated.
As part of the financial reporting improvement process, thepresentation of the line item Investments in associates wasmoved into the subtotal Income before taxes in the Condensedconsolidated statements of income. This change did not impactthe results of operations or financial position.
In addition, we have simplified our Q1 and Q3 reporting byexcluding the cash flow statement, the statement of changes inequity and certain other tables in the detailed financialinformation section not required to be disclosed. In our semi-annual and annual reporting we will continue to present thesestatements and tables. Summary cash flow information isprovided in the Philips performance section of this document.
Prior-period financial statements have been restated to reflect areclassification of Net defined-benefit post-employment planobligations to Long-term provisions in accordance with theaccounting policies as stated in the Annual Report 2016.Accordingly, Q1 2016 has been restated and presented for thefirst time in this press release.
Market Abuse RegulationThis press release contains inside information within the meaningof Article 7(1) of the EU Market Abuse Regulation.

10 Quarterly report Q1 2017
Condensed consolidated statements of income
Condensed consolidated statements of income in millions of EUR unless otherwise stated
Q1
2016 2017
Sales 5,517 5,724
Cost of sales (3,251) (3,280)
Gross margin 2,266 2,444
Selling expenses (1,418) (1,466)
General and administrative expenses (189) (199)
Research and development expenses (470) (518)
Impairment of goodwill (2) -
Other business income 21 91
Other business expenses (9) (5)
Income from operations 199 348
Financial income 27 25
Financial expenses (141) (86)
Investments in associates 3 (1)
Income before taxes 88 286
Income taxes (75) (91)
Income from continuing operations 13 195
Discontinued operations - net of income taxes 24 64
Net income 37 259
Attribution of net income for the period
Net income attributable to Koninklijke Philips N.V. shareholders 32 232
Net income attributable to Non-controlling interests 5 27
Earnings per common share attributable to shareholders
Weighted average number of common shares outstanding (after deduction of treasury shares) during the period (in thousands):
- basic 913,929 921,917
- diluted 924,706 937,102
Net income attributable to shareholders per common share in EUR:
- basic 0.04 0.25
- diluted 0.03 0.25
Amounts may not add up due to rounding.

Quarterly report Q1 2017 11
Condensed consolidated balance sheets
Condensed consolidated balance sheets in millions of EUR
March 31, 2016 December 31, 2016 March 31, 2017
Non-current assets:
Property, plant and equipment 2,218 2,155 2,122
Goodwill 8,265 8,898 8,751
Intangible assets excluding goodwill 3,526 3,552 3,441
Non-current receivables 166 155 167
Investments in associates 205 190 189
Other non-current financial assets 436 335 373
Non-current derivative financial assets 45 59 56
Deferred tax assets 2,689 2,792 2,766
Other non-current assets 70 92 92
Total non-current assets 17,620 18,228 17,956
Current assets:
Inventories 3,601 3,392 3,629
Other current financial assets 12 101 97
Other current assets 523 486 541
Current derivative financial assets 87 101 54
Income tax receivable 120 154 157
Receivables 4,597 5,327 4,660
Assets classified as held for sale 1,812 2,180 2,038
Cash and cash equivalents 1,385 2,334 2,731
Total current assets 12,137 14,075 13,908
Total assets 29,757 32,303 31,864
Equity
Shareholders’ equity 11,279 12,601 12,698
Non-controlling interests 130 907 1,3322)
Group equity 11,409 13,508 14,030
Non-current liabilities:
Long-term debt 3,984 4,021 3,969
Non-current derivative financial liabilities 518 590 433
Long-term provisions 3,2341) 2,926 2,888
Deferred tax liabilities 129 66 68
Other non-current liabilities 7171) 719 675
Total non-current liabilities 8,582 8,322 8,032
Current liabilities:
Short-term debt 1,705 1,585 1,375
Current derivative financial liabilities 268 283 269
Income tax payable 153 146 192
Accounts payable 2,434 2,848 2,900
Accrued liabilities 2,6781) 3,034 2,629
Short-term provisions 7301) 680 632
Liabilities directly associated with assets held for sale 430 525 490
Other current liabilities 1,368 1,372 1,315
Total current liabilities 9,766 10,473 9,802
Total liabilities and group equity 29,757 32,303 31,864
1) Adjusted to reflect a reclassification of net defined-benefit obligations into long-term provisions.2) The increase in Non-controlling interests is due to the sale of 26 million shares of Philips Lighting in February 2017 which increased the percentage of Non-controlling interests from
28.775% to 44.820%.
Amounts may not add up due to rounding.
12 Quarterly report Q1 2017
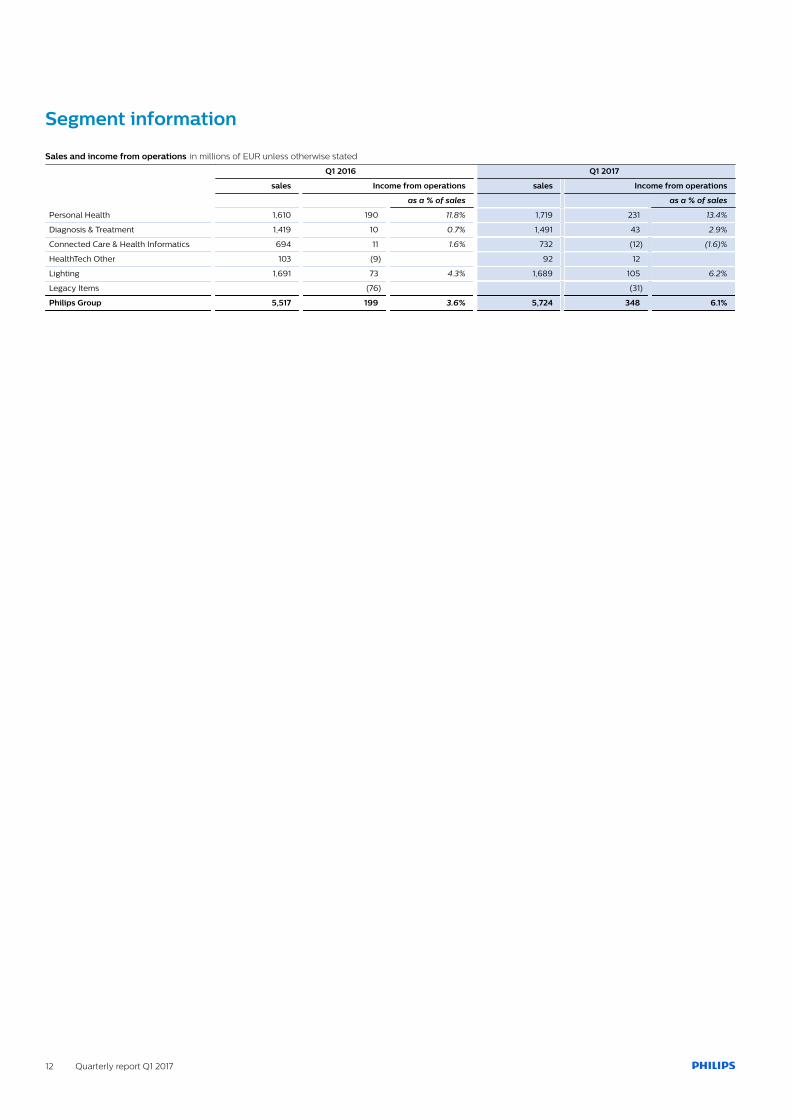
Segment information
Sales and income from operations in millions of EUR unless otherwise stated
Q1 2016 Q1 2017
sales Income from operations sales Income from operations
as a % of sales as a % of sales
Personal Health 1,610 190 11.8% 1,719 231 13.4%
Diagnosis & Treatment 1,419 10 0.7% 1,491 43 2.9%
Connected Care & Health Informatics 694 11 1.6% 732 (12) (1.6)%
HealthTech Other 103 (9) 92 12
Lighting 1,691 73 4.3% 1,689 105 6.2%
Legacy Items (76) (31)
Philips Group 5,517 199 3.6% 5,724 348 6.1%

Quarterly report Q1 2017 13
Reconciliation of non-GAAP information
Certain non-GAAP financial measures are presented when discussing the Philips Group’s performance:
• Comparable sales growth• EBIT• EBITA• Adjusted EBITA• Free cash flow• Net debt : group equity ratio• Order intake
The term EBIT has the same meaning as Income from operations.
Adjusted EBITA is defined as Income from operations (EBIT) excluding amortization of intangible assets (excluding software anddevelopment expenses), impairment of goodwill and other intangible assets, restructuring charges, acquisition-related costs and othersignificant items.
Free cash flow is defined as Net cash from operating activities minus net capital expenditures. Net capital expenditures are comprised ofthe purchase of intangible assets, expenditures on development assets, capital expenditures on property, plant and equipment andproceeds from disposal of property, plant and equipment.
Order intake is reported for equipment and software and is defined under our policy as the total contractually committed amount to bedelivered within a specified timeframe. Order intake does not derive from the financial statements and thus a quantitative reconciliation isnot provided. Order intake is calculated on a comparable basis, which excludes the effects of currency movements and changes inconsolidation.
For the definitions of the remaining non-GAAP financial measures listed above, refer to the Annual Report 2016.
In the following tables, reconciliations to the most directly comparable IFRS measures are presented.
Sales growth composition in %
Q1 2017
nominal growth consolidation changes currency effects comparable growth
2017 versus 2016
Personal Health 6.8% 0.5% (2.1)% 5.2%
Diagnosis & Treatment 5.1% 0.0% (3.0)% 2.1%
Connected Care & HealthInformatics 5.5% (0.7)% (3.3)% 1.5%
HealthTech Other (10.7)% 0.0% (0.1)% (10.8)%
Lighting1) (0.1)% 0.9% (1.2)% (0.4)%
Philips Group 3.8% 0.3% (2.1)% 2.0%
1) The Lighting segment results differ from the stand-alone Philips Lighting reporting mainly due to the exclusion of intercompany sales
14 Quarterly report Q1 2017
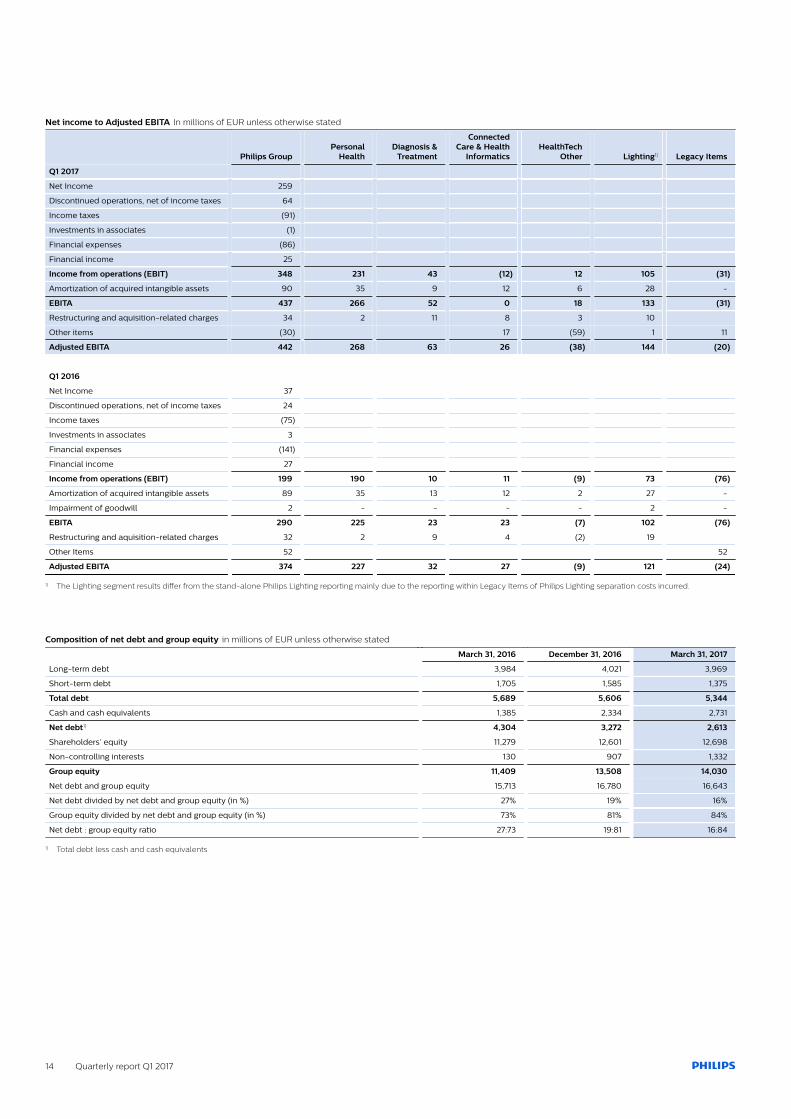
Net income to Adjusted EBITA In millions of EUR unless otherwise stated
Philips Group Personal
Health Diagnosis &
Treatment
ConnectedCare & Health
Informatics HealthTech
Other Lighting1) Legacy Items
Q1 2017
Net Income 259
Discontinued operations, net of income taxes 64
Income taxes (91)
Investments in associates (1)
Financial expenses (86)
Financial income 25
Income from operations (EBIT) 348 231 43 (12) 12 105 (31)
Amortization of acquired intangible assets 90 35 9 12 6 28 -
EBITA 437 266 52 0 18 133 (31)
Restructuring and aquisition-related charges 34 2 11 8 3 10
Other items (30) 17 (59) 1 11
Adjusted EBITA 442 268 63 26 (38) 144 (20)
Q1 2016
Net Income 37
Discontinued operations, net of income taxes 24
Income taxes (75)
Investments in associates 3
Financial expenses (141)
Financial income 27
Income from operations (EBIT) 199 190 10 11 (9) 73 (76)
Amortization of acquired intangible assets 89 35 13 12 2 27 -
Impairment of goodwill 2 - - - - 2 -
EBITA 290 225 23 23 (7) 102 (76)
Restructuring and aquisition-related charges 32 2 9 4 (2) 19
Other Items 52 52
Adjusted EBITA 374 227 32 27 (9) 121 (24)
1) The Lighting segment results differ from the stand-alone Philips Lighting reporting mainly due to the reporting within Legacy Items of Philips Lighting separation costs incurred.
Composition of net debt and group equity in millions of EUR unless otherwise stated
March 31, 2016 December 31, 2016 March 31, 2017
Long-term debt 3,984 4,021 3,969
Short-term debt 1,705 1,585 1,375
Total debt 5,689 5,606 5,344
Cash and cash equivalents 1,385 2,334 2,731
Net debt1) 4,304 3,272 2,613
Shareholders’ equity 11,279 12,601 12,698
Non-controlling interests 130 907 1,332
Group equity 11,409 13,508 14,030
Net debt and group equity 15,713 16,780 16,643
Net debt divided by net debt and group equity (in %) 27% 19% 16%
Group equity divided by net debt and group equity (in %) 73% 81% 84%
Net debt : group equity ratio 27:73 19:81 16:84
1) Total debt less cash and cash equivalents

Quarterly report Q1 2017 15
Philips statisticsin millions of EUR unless otherwise stated
2016 2017
Q1 Q2 Q3 Q4 Q1 Q2 Q3 Q4
Sales 5,517 5,861 5,898 7,240 5,724
Comparable sales growth* 3% 3% 2% 3% 2%
Gross margin 2,266 2,538 2,603 3,205 2,444
as a % of sales 41.1% 43.3% 44.1% 44.3% 42.7%
Selling expenses (1,418) (1,427) (1,411) (1,632) (1,466)
as a % of sales (25.7)% (24.3)% (23.9)% (22.5)% (25.6)%
G&A expenses (189) (234) (203) (219) (199)
as a % of sales (3.4)% (4.0)% (3.4)% (3.0)% (3.5)%
R&D expenses (470) (501) (514) (536) (518)
as a % of sales (8.5)% (8.5)% (8.7)% (7.4)% (9.0)%
Income from operations (EBIT) 199 376 481 826 348
as a % of sales 3.6% 6.4% 8.2% 11.4% 6.1%
EBITA* 290 464 567 914 437
as a % of sales 5.3% 7.9% 9.6% 12.6% 7.6%
Net income 37 431 383 640 259
Net income attributable to shareholders 32 420 370 626 232
Net income - shareholders per common sharein EUR - diluted 0.03 0.46 0.40 0.67 0.25
2016 2017
January- March
January- June
January- September
January- December
January- March
January-June
January- September
January- December
Sales 5,517 11,378 17,276 24,516 5,724
Comparable sales growth* 3% 3% 3% 3% 2%
Gross margin 2,266 4,804 7,407 10,612 2,444
as a % of sales 41.1% 42.2% 42.9% 43.3% 42.7%
Selling expenses (1,418) (2,845) (4,256) (5,888) (1,466)
as a % of sales (25.7)% (25.0)% (24.6)% (24.0)% (25.6)%
G&A expenses (189) (423) (626) (845) (199)
as a % of sales (3.4)% (3.7)% (3.6)% (3.4)% (3.5)%
R&D expenses (470) (971) (1,485) (2,021) (518)
as a % sales (8.5)% (8.5)% (8.6)% (8.2)% (9.0)%
Income from operations (EBIT) 199 575 1,056 1,882 348
as a % of sales 3.6% 5.1% 6.1% 7.7% 6.1%
EBITA* 290 754 1,321 2,235 437
as a % of sales 5.3% 6.6% 7.6% 9.1% 7.6%
Net income 37 468 851 1,491 259
Net income attributable to shareholders 32 452 822 1,448 232
Net income - shareholders per common sharein EUR - diluted 0.03 0.49 0.89 1.56 0.25
Number of common shares outstanding (afterdeduction of treasury shares) at the end ofperiod (in thousands) 913,011 927,316 924,271 922,437 920,276
Shareholders’ equity per common share in EUR 12.35 12.39 12.57 13.66 13.80
Net debt : group equity ratio* 27:73 24:76 24:76 19:81 16:84
Total employees 114,021 113,356 113,627 114,731 114,188
of which discontinued operations 8,913 9,158 9,531 9,508 9,381
of which third-party workers 12,250 11,604 11,822 12,774 12,779
* Non-GAAP financial measure. Refer to Reconciliation of non-GAAP information, of this document.

http://www.philips.com/investorrelations© 2017 Koninklijke Philips N.V. All rights reserved.