quarterly groundwater monitoring report june 2003 …
TRANSCRIPT

QUARTERLY GROUNDWATER MONITORING REPORT
JUNE 2003 FORMER JAMESTOWN LANDFILL JAMESTOWN, RHODE ISLAND PREPARED FOR: Town of Jamestown Jamestown, Rhode Island PREPARED BY: GZA GeoEnvironmental, Inc. Providence, Rhode Island September 2003 File No. 32220.08 Copyright© 2003 GZA GeoEnvironmental, Inc.

September 29, 2003 Job No. 32220.08-C Mr. Chris Walusiak Rhode Island Department of Environmental Management Office of Waste Management 235 Promenade Street Providence, Rhode Island 02908 Re: June 2003 Groundwater Monitoring Report Former Jamestown Landfill Jamestown, Rhode Island Dear Mr. Walusiak: On behalf of our client, the Town of Jamestown, GZA GeoEnvironmental, Inc. (GZA) is pleased to submit two copies of this Groundwater Monitoring Report (GMR). The report presents the results of the June 2003 post-closure sampling round conducted at the former Jamestown Landfill (the Site) located on North Main Road in Jamestown, Rhode Island. Groundwater monitoring was conducted in accordance with the RIDEM’s January 1997 Solid Waste Regulation No. 2 (Solid Waste Landfills). We trust that this report fulfills your present needs. Please feel free to call us at (401) 421-4140 if you have any questions or comments. Very truly yours, GZA GEOENVIRONMENTAL, INC. Brian M Menard Anthony L. Gomez Project Engineer Assistant Project Manager Edward A. Summerly, P.G. Associate Principal Cc: Mr. Steve Goslee, Town of Jamestown J:\ENV\32220-8.alg\June03\report\June2003CovLet.doc
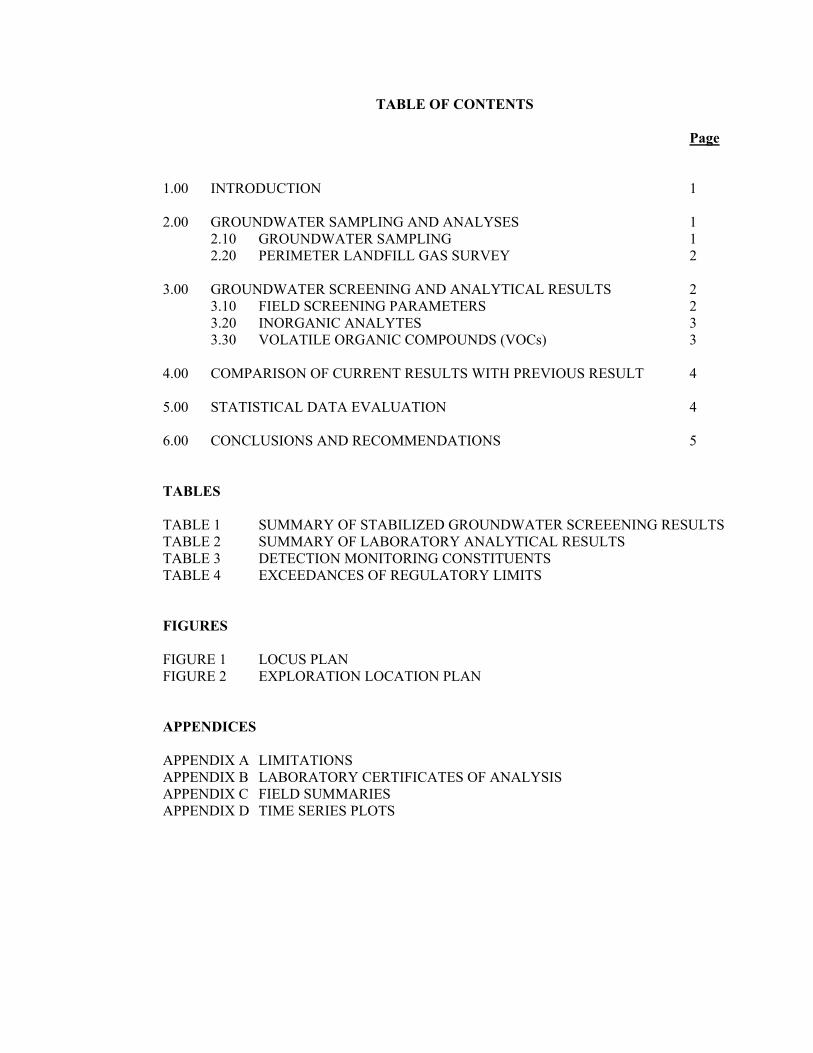
TABLE OF CONTENTS
Page 1.00 INTRODUCTION 1 2.00 GROUNDWATER SAMPLING AND ANALYSES 1 2.10 GROUNDWATER SAMPLING 1 2.20 PERIMETER LANDFILL GAS SURVEY 2 3.00 GROUNDWATER SCREENING AND ANALYTICAL RESULTS 2
3.10 FIELD SCREENING PARAMETERS 2 3.20 INORGANIC ANALYTES 3 3.30 VOLATILE ORGANIC COMPOUNDS (VOCs) 3
4.00 COMPARISON OF CURRENT RESULTS WITH PREVIOUS RESULT 4 5.00 STATISTICAL DATA EVALUATION 4 6.00 CONCLUSIONS AND RECOMMENDATIONS 5 TABLES TABLE 1 SUMMARY OF STABILIZED GROUNDWATER SCREEENING RESULTS TABLE 2 SUMMARY OF LABORATORY ANALYTICAL RESULTS TABLE 3 DETECTION MONITORING CONSTITUENTS TABLE 4 EXCEEDANCES OF REGULATORY LIMITS FIGURES FIGURE 1 LOCUS PLAN FIGURE 2 EXPLORATION LOCATION PLAN APPENDICES APPENDIX A LIMITATIONS APPENDIX B LABORATORY CERTIFICATES OF ANALYSIS APPENDIX C FIELD SUMMARIES APPENDIX D TIME SERIES PLOTS
Page 1 - File No. 32220.08 – September 2003
1.00 INTRODUCTION This report describes the June 2003 round of quarterly post-closure groundwater and methane monitoring performed at the former Jamestown Landfill (Site) located off North Main Road in Jamestown, Rhode Island (see Figure 1-Locus Plan). GZA GeoEnvironmental, Inc. (GZA) performed this monitoring on behalf of the Town of Jamestown for their submission to the Rhode Island Department of Environmental Management (RIDEM) to address applicable requirements of the RIDEM’s Rules and Regulations for Composting Facilities and Solid Waste Management Facilities, (Solid Waste Regulations) dated January 1997. The purpose of this monitoring is to assess the groundwater quality in the vicinity of the Site including detection and evaluation of contaminants (if any) derived from the former operations of the Site and to evaluate the potential for off-site migration of methane. This report includes: well-specific field measurements; a summary of sampling and analytical results; soil gas survey results; a statistical evaluation of the data; and conclusions and recommendations for future monitoring. This report is subject to the Limitations contained in Appendix A.
2.00 GROUNDWATER SAMPLING AND LANDFILL GAS SURVEY GZA personnel collected groundwater samples on May 29 and 30, 2003 and performed a perimeter landfill gas survey on June 3, 2003. The following paragraphs briefly describe our field procedures. 2.10 GROUNDWATER SAMPLING
Samples were collected from thirteen on-site monitoring wells shown on Figure 2. Groundwater sampling was conducted in substantive accordance with EPA’s July 30, 1996 Low Stress (low flow) purging and Sampling Procedure (Low Flow SOP). The samples were screened and/or analyzed for five field-screening parameters (pH, specific conductance, temperature, dissolved oxygen and turbidity), and the fifteen metals and 47 volatile organic compounds specified for detection monitoring in Appendix A of RIDEM’s Solid Waste Regulations. Groundwater levels were recorded prior to sampling each monitoring well and are presented on Table 1 along with the field screening results. Samples were collected in preserved containers supplied by the laboratory and placed on ice for transportation under chain-of-custody (attached in Appendix B) to GZA’s Environmental Chemistry Laboratory (ECL) of Hopkinton, Massachusetts for testing. The ECL is an EPA certified and RIDOH licensed laboratory facility.
Page 2 - File No. 32220.08 – September 2003
2.20 PERIMETER LANDFILL GAS SURVEY
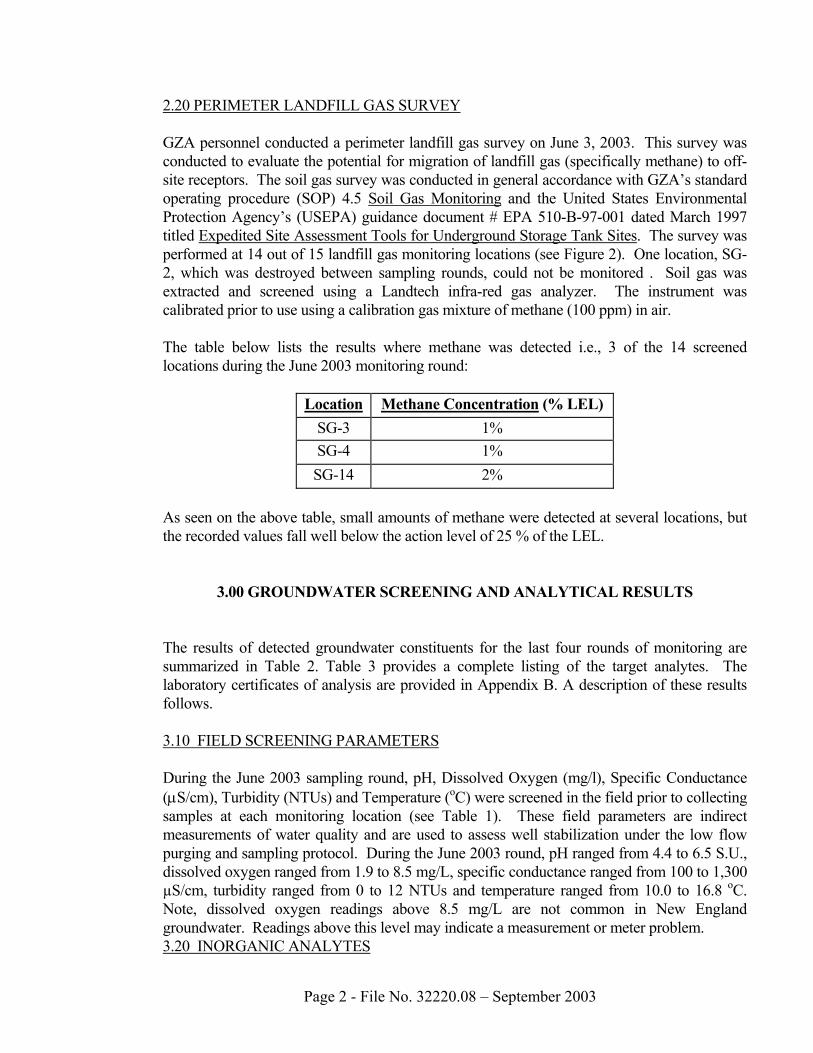
GZA personnel conducted a perimeter landfill gas survey on June 3, 2003. This survey was conducted to evaluate the potential for migration of landfill gas (specifically methane) to off-site receptors. The soil gas survey was conducted in general accordance with GZA’s standard operating procedure (SOP) 4.5 Soil Gas Monitoring and the United States Environmental Protection Agency’s (USEPA) guidance document # EPA 510-B-97-001 dated March 1997 titled Expedited Site Assessment Tools for Underground Storage Tank Sites. The survey was performed at 14 out of 15 landfill gas monitoring locations (see Figure 2). One location, SG-2, which was destroyed between sampling rounds, could not be monitored . Soil gas was extracted and screened using a Landtech infra-red gas analyzer. The instrument was calibrated prior to use using a calibration gas mixture of methane (100 ppm) in air. The table below lists the results where methane was detected i.e., 3 of the 14 screened locations during the June 2003 monitoring round:
Location Methane Concentration (% LEL) SG-3 1% SG-4 1% SG-14 2%
As seen on the above table, small amounts of methane were detected at several locations, but the recorded values fall well below the action level of 25 % of the LEL.
3.00 GROUNDWATER SCREENING AND ANALYTICAL RESULTS The results of detected groundwater constituents for the last four rounds of monitoring are summarized in Table 2. Table 3 provides a complete listing of the target analytes. The laboratory certificates of analysis are provided in Appendix B. A description of these results follows. 3.10 FIELD SCREENING PARAMETERS During the June 2003 sampling round, pH, Dissolved Oxygen (mg/l), Specific Conductance (µS/cm), Turbidity (NTUs) and Temperature (oC) were screened in the field prior to collecting samples at each monitoring location (see Table 1). These field parameters are indirect measurements of water quality and are used to assess well stabilization under the low flow purging and sampling protocol. During the June 2003 round, pH ranged from 4.4 to 6.5 S.U., dissolved oxygen ranged from 1.9 to 8.5 mg/L, specific conductance ranged from 100 to 1,300 µS/cm, turbidity ranged from 0 to 12 NTUs and temperature ranged from 10.0 to 16.8 oC. Note, dissolved oxygen readings above 8.5 mg/L are not common in New England groundwater. Readings above this level may indicate a measurement or meter problem. 3.20 INORGANIC ANALYTES

Page 3 - File No. 32220.08 – September 2003
As shown in Table 2, seven of the 15 target metals were detected in the groundwater samples collected during this sampling round. These included barium, cadmium, chromium, cobalt, copper, nickel, and zinc. The frequency of detection for each metal, as well as minimum/maximum concentrations for each are listed in the table below:
Metal No. of Wells Detected
Minimum Concentration
Maximum Concentration
Barium 12 / 13 .0063 mg/L .0745 mg/L Cadmium 2 / 13 .0057 mg/L .0066 mg/L Chromium 4 / 13 .0084 mg/L .0158 mg/L Cobalt 7 / 13 .011 mg/L .249 mg/L Copper 2 / 13 .017 mg/L 1.35 mg/L Nickel 5 / 13 .029 mg/L .049 mg/L Zinc 10 / 13 .01 mg/L .758 mg/L
The June 2003 monitoring well samples each contained between two and five metals, with the highest number of detected metals (5 of 15) observed in samples from 3 down-gradient wells (GZ-2, EA-2D, and DEEP WELL). There were 3 exceedances of the Federal Safe Drinking Water Maximum Contaminant Levels (MCLs) reported during the June 2003 monitoring round. Cadmium was reported above its MCL of .005 mg/L at both locations (GZ-2 and DEEP WELL) where it was detected. Also, copper was detected above its MCL of 1.3 mg/L at one down-gradient location, MW-3, with a concentration of 1.35 mg/L. The results of statistical data evaluation for these exceedances can be found in Table 4. Note that, inorganic elements are naturally occurring; therefore, variability in concentrations across the site are to some degree the result of natural variations in soil and bedrock characteristics, and the amount of suspended particles within individual samples. 3.30 VOLATILE ORGANIC COMPOUNDS (VOCs)
Volatile organic compounds (VOC) were analyzed by EPA Method 8260B. The June 2003 results show one to four VOCs detected in samples from four wells located hydraulically down gradient of the Site (i.e., MW-2, EA-1B, EA-2D and GZ-2). These VOCs are 1,1-dichloroethane, 1,4-dichlorobenzene, chlorobenzene, chloroethane, cis-1,2-dichlorethane, and toluene. Consistent with the previous monitoring results, the highest frequency and concentrations of detected organics were observed in samples from down gradient wells EA-1B and GZ-2. For more detailed information on specific detects and the monitoring history refer to Table 2. There were no exceedances of any state or federal groundwater standards for VOCs during June 2003 sampling round.
4.00 COMPARISON OF CURRENT RESULTS WITH PREVIOUS RESULTS

Page 4 - File No. 32220.08 – September 2003
A summary table which presents data for detected analytes from the four most recent sampling rounds (September 2002 through June 2003) is included as Table 2. This table also presents the applicable regulatory groundwater quality standards, where available. As shown in Table 2, five of 18 previously detected organic parameters, 1 new organic parameter (toluene), and 7 of the 15 target inorganic parameters were identified in the groundwater samples for the June 2003 monitoring round. As shown on the Time Series Plots in Appendix D. The detected concentrations of inorganic and organic parameters were generally within historic ranges with exceptions of cadmium, copper, cis-1,2-dichloroethane, toluene, and zinc. In order to view variability in concentration with respect to time and season, time series plots were generated using the sample results from seven most recent sampling rounds for the detected constituents at all sampling locations. Sen’s tests were performed to evaluate if there are any statistically significant trends in the data with respect to time or season. Six VOCs and seven inorganics were evaluated which resulted in 54 time series plots that are presented in Appendix D. One statically significant decreasing trend was identified by Sen’s Test: the concentration of cobalt in samples from well EA-2D. Time series plots were also visually evaluated for seasonality and “outliers” (defined as data that appears to be incongruent with respect to historical results). Seasonal fluctuations in some contaminant concentrations at several locations may be present (e.g., cadmium at GZ-2 and DEEP WELL, copper at MW-3). However a longer data record will be necessary to increase the certainty of this visual observation. Toluene was detected for the first time in the sample from monitoring well MW-2, during the June 2003 round and may represent a potential outlier. The cause of this outlier is not clear. However, we believe that the observed concentrations of cadmium and copper could reflect background levels, or seasonal fluctuations. This observation is further supported by the time series plots in Appendix D, where both cadmium exceedances and the exceedance for copper all appear as outliers at the wells in which they were detected.
5.00 STATISTICAL DATA EVALUATION
A statistical analysis is required for all detected constituents that are observed at concentrations above the EPA’s Maximum Contaminant Levels (MCLs). A review of the June 2003 results indicated three exceedances of the MCLs for the June 2003 round; therefore, a statistical data evaluation was conducted, and the results can be seen in Table 4. Cadmium which exceeded EPA’s MCLs at two locations, GZ-2 and the DEEP WELL, show both exceedances to be statistically significant. Similarly, the exceedance for copper

Page 5 - File No. 32220.08 – September 2003
at MW-3 was proven to be statistically significant despite its presence above MCLs for the first time at MW-3. These exceedances are most likely caused by seasonal fluctuations of groundwater, or an increase in particulate matter within the samples.
6.00 CONCLUSIONS AND RECOMMENDATIONS
Thirteen (13) monitoring wells were screened in the field and sampled and analyzed for 15 metals and 47 VOCs listed in Appendix A of the RIDEM’s January 1997 Solid Waste Regulations. Fourteen of the 15 landfill soil gas monitoring wells were screened during this round. The following conclusions were developed based on the results obtained from this and previous sampling rounds:
• Seven inorganic and six organic parameters were detected in the groundwater samples collected during the June 2003 round: There were 3 exceedances of MCLs for two inorganic parameters during this monitoring round: cadmium in the samples from GZ-2 and the DEEPWELL, and copper in the sample from MW-3. All three exceedances were found to be statistically significant, but all three also appear as outliers on time series plots. The presence of these outliers were most likely caused by an increase in particulate matter within the samples, or by the seasonal fluctuation in the level of groundwater
• Time series plots indicate that the concentration of one inorganic parameter, cobalt in
EA-2D, has a statistically significant decreasing trend for the last seven monitoring rounds. Other sample results from the June 2003 round generally fall within the range of prior monitoring results. We believe that with exception of Cobalt, the contaminant concentrations at the monitoring locations are not changing significantly with time.
• Methane was detected at 3 soil gas monitoring locations for this sampling round; SG-
3, SG-4, and SG-14. All detected concentrations (< 2% of the LEL) fall below RIDEM’s action level of 25% of the lower explosive limit (LEL).
• The soil gas monitoring location, SG-2, was found to be destroyed, and locations SG-9
and SG-11 were found to be damaged (bent). These locations should be repaired/replaced prior to the next monitoring round.
J:\ENV\32220-8.alg\June03\report\REP-June2003 .DOC

TABLES

TABLE 1
SUMMARY OF STABILIZED GROUNDWATER SCREENING RESULTS
Former Jamestown Landfill - Jamestown, Rhode Island
Location ID:Sampling Date: UNIT 9/12/2002 12/10/2002 3/14/2003 5/29/2003 9/11/2002 12/10/2002 3/13/2003 5/30/2003Field Screening Parameters: pH SU 4.6 5.0 5.5 5.0 6.1 5.9 6.0 6.2Conductivity mS/cm 0.1 0.1 0.1 0.1 0.5 0.6 0.5 0.7Dissolved Oxygen mg/l 6.1 4.3 10.0* 7.2 9.7* 0.9 1.2 2.5Turbidity NTU 9.0 31.0 132.0 12.0 11.0 0.0 4.0 0.0Depth to Water FT 26.3 16.0 7.8 8.6 12.7 9.1 6.0 6.6
Location ID:Sampling Date: UNIT 9/11/2002 12/10/2002 3/13/2003 5/30/2003 9/11/2002 12/10/2002 3/13/2003 5/29/2003Field Screening Parameters: Temperature °C 14.0 11.8 10.0 10.3 12.0 10.3 9.5 10.9Conductivity mS/cm 0.1 0.1 0.1 0.2 0.1 0.1 0.1 0.1Dissolved Oxygen mg/l 5.3 3.6 3.6 5.6 4.0 5.3 9.7* 9.0*Turbidity NTU 1.0 0.0 2.0 3.0 0.0 0.0 1.0 5.0Depth to Water FT 13.8 9.9 6.8 7.2 16.6 9.5 5.0 7.0
Location ID:Sampling Date: UNIT 9/12/2002 12/9/2002 3/13/2003 5/29/2003 9/12/2002 12/10/2002 3/14/2003 5/29/2003Field Screening Parameters: Temperature °C 15.0 12.3 9.9 13.6 13.0 9.7 9.0 13.5pH SU 5.0 5.1 5.5 4.6 4.8 4.9 5.4 4.8Dissolved Oxygen mg/l 3.6 3.7 3.4 5.7 16.5* 9.5* 7.6 8.5Turbidity NTU 85.0 15.0 5.0 5.0 18.0 9.0 29.0 3.0Depth to Water FT 35.4 27.6 15.4 7.7 30.1 21.8 11.8 12.8
Notes:1. Temperature, pH, Conductivity, Dissolved Oxygen, and Turbidity were measured in the field using a Horiba multimeter.2. ND indicates not detected.3. NR indicates not readable.* Indicates disolved oxygen results outside of typical range for groundwater. These may be indicative of measurement error or a meter malfunction.
GZ-1 GZ-2
GZ-3 GZ-4
GZ-6GZ-5
J:\ENV\32220-8.alg\June03\report tables\TABLE1.XLS 1 of 3 June 2003
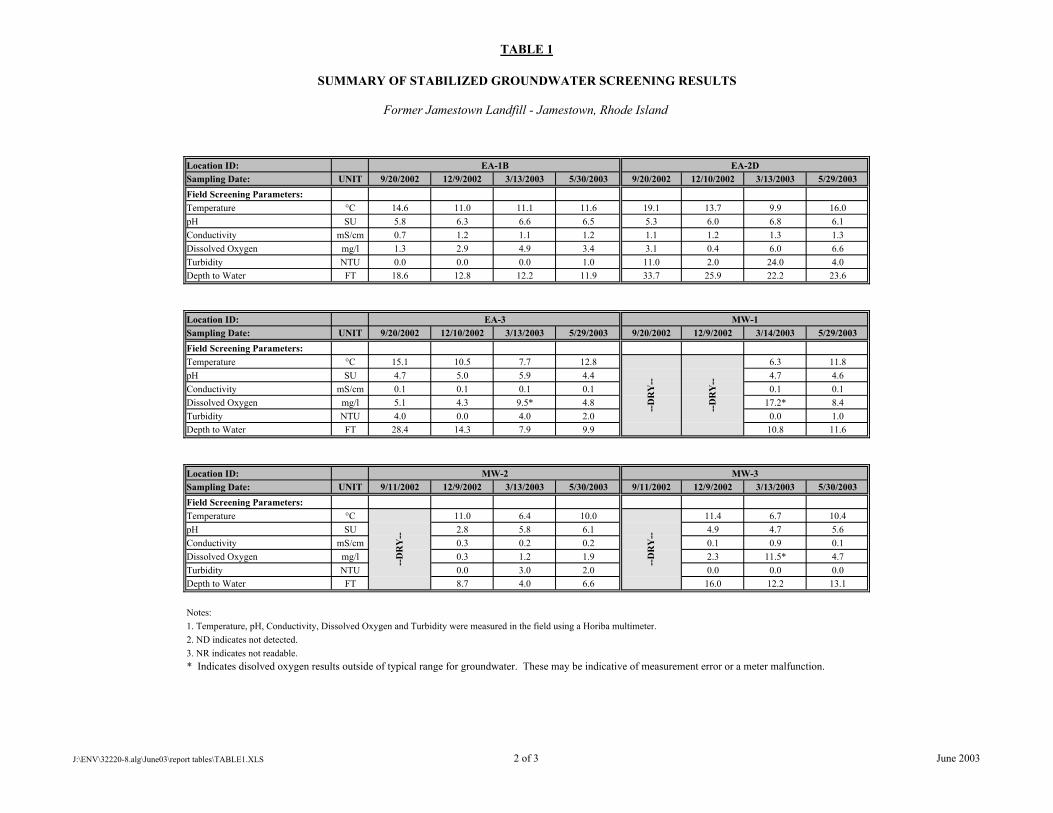
TABLE 1
SUMMARY OF STABILIZED GROUNDWATER SCREENING RESULTS
Former Jamestown Landfill - Jamestown, Rhode Island
Location ID:Sampling Date: UNIT 9/20/2002 12/9/2002 3/13/2003 5/30/2003 9/20/2002 12/10/2002 3/13/2003 5/29/2003Field Screening Parameters: Temperature °C 14.6 11.0 11.1 11.6 19.1 13.7 9.9 16.0pH SU 5.8 6.3 6.6 6.5 5.3 6.0 6.8 6.1Conductivity mS/cm 0.7 1.2 1.1 1.2 1.1 1.2 1.3 1.3Dissolved Oxygen mg/l 1.3 2.9 4.9 3.4 3.1 0.4 6.0 6.6Turbidity NTU 0.0 0.0 0.0 1.0 11.0 2.0 24.0 4.0Depth to Water FT 18.6 12.8 12.2 11.9 33.7 25.9 22.2 23.6
Location ID:Sampling Date: UNIT 9/20/2002 12/10/2002 3/13/2003 5/29/2003 9/20/2002 12/9/2002 3/14/2003 5/29/2003Field Screening Parameters: Temperature °C 15.1 10.5 7.7 12.8 6.3 11.8pH SU 4.7 5.0 5.9 4.4 4.7 4.6Conductivity mS/cm 0.1 0.1 0.1 0.1 0.1 0.1Dissolved Oxygen mg/l 5.1 4.3 9.5* 4.8 17.2* 8.4Turbidity NTU 4.0 0.0 4.0 2.0 0.0 1.0Depth to Water FT 28.4 14.3 7.9 9.9 10.8 11.6
Location ID:Sampling Date: UNIT 9/11/2002 12/9/2002 3/13/2003 5/30/2003 9/11/2002 12/9/2002 3/13/2003 5/30/2003Field Screening Parameters: Temperature °C 11.0 6.4 10.0 11.4 6.7 10.4pH SU 2.8 5.8 6.1 4.9 4.7 5.6Conductivity mS/cm 0.3 0.2 0.2 0.1 0.9 0.1Dissolved Oxygen mg/l 0.3 1.2 1.9 2.3 11.5* 4.7Turbidity NTU 0.0 3.0 2.0 0.0 0.0 0.0Depth to Water FT 8.7 4.0 6.6 16.0 12.2 13.1
Notes:1. Temperature, pH, Conductivity, Dissolved Oxygen and Turbidity were measured in the field using a Horiba multimeter.2. ND indicates not detected.3. NR indicates not readable.* Indicates disolved oxygen results outside of typical range for groundwater. These may be indicative of measurement error or a meter malfunction.
--D
RY
--
MW-2 MW-3
EA-1B EA-2D
EA-3 MW-1
--D
RY
--
--D
RY
--
--D
RY
--
J:\ENV\32220-8.alg\June03\report tables\TABLE1.XLS 2 of 3 June 2003

TABLE 1
SUMMARY OF STABILIZED GROUNDWATER SCREENING RESULTS
Former Jamestown Landfill - Jamestown, Rhode Island
Location ID:Sampling Date: UNIT 9/20/2002 12/9/2002 3/13/2003 5/29/2003Field Screening Parameters: Temperature °C 14.9 13.1 7.3 16.8pH SU 5.5 6.0 6.6 5.8Conductivity mS/cm 0.4 0.7 0.5 0.6Dissolved Oxygen mg/l 2.6 0.4 9.2* 6.4Turbidity NTU 1.0 5.0 55.0 9.0Depth to Water FT 30.6 25.7 19.8 20.6
Notes:1. Temperature, pH, Conductivity, Dissolved Oxygen, Turbidity and solinity were measured in the field using a Horiba multimeter.2. ND indicates not detected.3. NR indicates not readable.* Indicates disolved oxygen results outside of typical range for groundwater. These may be indicative of measurement error or a meter malfunction.
Deep Well
J:\ENV\32220-8.alg\June03\report tables\TABLE1.XLS 3 of 3 June 2003

TABLE 2SUMMARY OF GROUNDWATER ANALYTICAL RESULTS
September 2002 through June 2003Former Jamestown Landfill - Jamestown, Rhode Island
MethodParameters Detection MCL* 9/11//02 12/10/2002 3/14/2003 5/29/2003 9/11/2002 12/10/2002 3/13/2003 5/30/2003 9/11/2002 12/10/2002 3/13/2003 5/30/2003 9/11/2002 12/10/2002 3/13/2003
Limit 3/20/03** 3/20/03** 3/20/03**
Volatile Organics: (ug/L)Dichlorodifluoromethane 2 ND ND ND ND ND ND ND ND ND ND ND ND ND ND ND
Naphthalene 1 7 ND ND ND ND ND ND ND ND ND ND ND ND ND ND NDBenzene 1 5 ND ND ND ND ND ND ND ND ND ND ND ND ND ND ND
Dichloromethane 1 ND ND ND ND ND ND ND ND ND ND ND ND ND ND NDMTBE 2 40 ND ND ND ND ND ND ND ND ND ND ND ND ND ND ND
Chlorobenzene 1 100 ND ND ND ND 5.4 6.1 6.5 9.1 ND ND ND ND ND ND ND1,4-Dichlorobenzene 1 75 ND ND ND ND ND 1 ND 1.1 ND ND ND ND ND ND ND
Chloroethane 1 ND ND ND ND 9.9 11 10 12 ND ND ND ND ND ND NDDiethylether 5 ND ND ND ND 5 5.8 ND ND ND ND ND ND ND ND ND
1,1-Dichloroethane 1 ND ND ND ND 8.8 9.2 8.8 13 ND ND ND ND ND ND NDm&p-Xylene 1 ND ND ND ND ND ND ND ND ND ND ND ND ND ND ND
Xylenes 1 10,000 ND ND ND ND ND ND ND ND ND ND ND ND ND ND NDChloroform 1 ND ND ND ND ND ND ND ND ND ND ND ND ND ND ND
1,2-dichloropropane 1 5 ND ND ND ND ND ND ND ND ND ND ND ND ND ND NDTrichloroethene 1 5 ND ND ND ND ND ND ND ND ND ND ND ND ND ND ND
cis-1,2-Dichloroethene 1 ND ND ND ND ND ND ND ND ND ND ND ND ND ND ND1,2,4-Trimethylbenzene 1 ND ND ND ND ND ND ND ND ND ND ND ND ND ND ND
Acetone 1 ND ND ND ND ND ND ND ND ND ND ND ND ND ND NDToluene 1 1000 ND ND ND ND ND ND ND ND ND ND ND ND ND ND ND
Total Metals: (mg/L)ANTIMONY 0.025 0.006 ND ND ND ND ND ND ND ND ND ND ND ND ND ND ND
ARSENIC 0.01 0.05 ND ND ND ND ND ND ND ND ND ND ND ND ND ND NDBARIUM 0.005 2 0.0093 0.0054 0.0064 0.0063 0.0525 0.0044 0.0325 0.0511 0.0127 0.0108 0.0162 0.0146 0.0065 0.0069 0.0075
BERYLLIUM 0.005 0.004 ND ND ND ND ND ND ND ND ND ND ND ND ND ND NDCADMIUM 0.005 0.005 ND ND ND ND ND ND ND 0.0057 ND ND ND ND ND ND ND
CHROMIUM 0.005 0.1 ND ND ND ND 0.0149 0.0092 0.0081 0.0158 ND ND ND ND ND ND NDCOBALT 0.01 NONE 0.0049 0.003 ND 0.014 0.286 0.24 0.161 0.249 ND ND ND ND ND ND NDCOPPER 0.015 1.3 ND ND ND ND ND ND ND ND ND ND ND ND ND ND ND
LEAD 0.01 0.015 ND ND ND ND ND ND ND ND ND ND ND ND ND ND NDNICKEL 0.02 NONE 0.018 0.015 0.014 0.032 0.0518 0.043 0.0255 0.049 ND ND ND ND ND ND ND
SELENIUM 0.02 0.05 ND ND ND ND ND ND ND ND ND ND ND ND ND ND NDSILVER 0.005 NONE ND ND ND ND ND ND ND ND ND ND ND ND ND ND ND
THALLIUM 0.025 0.002 ND ND ND ND ND ND ND ND ND ND ND ND ND ND NDVANADIUM 0.005 NONE 0.0019 0.0011 ND ND ND ND ND ND ND ND ND ND ND ND ND
ZINC 0.01 NONE 0.02 ND 0.0205 0.034 ND ND 0.0115 ND ND ND 0.0227 0.014 ND ND 0.019
Notes:(1) * Results are compared to USEPA's Safe Drinking Water Act maximum allowable contaminant levels (MCLs) because the Site is located in an area that the RIDEM has classified the groundwater as a GA Groundwater resource. GA groundwater is presumed to be potable without treatment.(2) ** Groundwater VOC analysis samples were collected on 3/20/2003.(3) Shaded results exceed the Maximum Contaminant Limit (MCL).(4) ND indicates the parameter was non-detected; NT indicates that the parameter or suite of parameters were not tested.
GZ-1 GZ-2 GZ-3 GZ-4
J:\ENV\32220-8.alg\June03\report tables\TABLE2.xls Page 1 of 4 June 2003
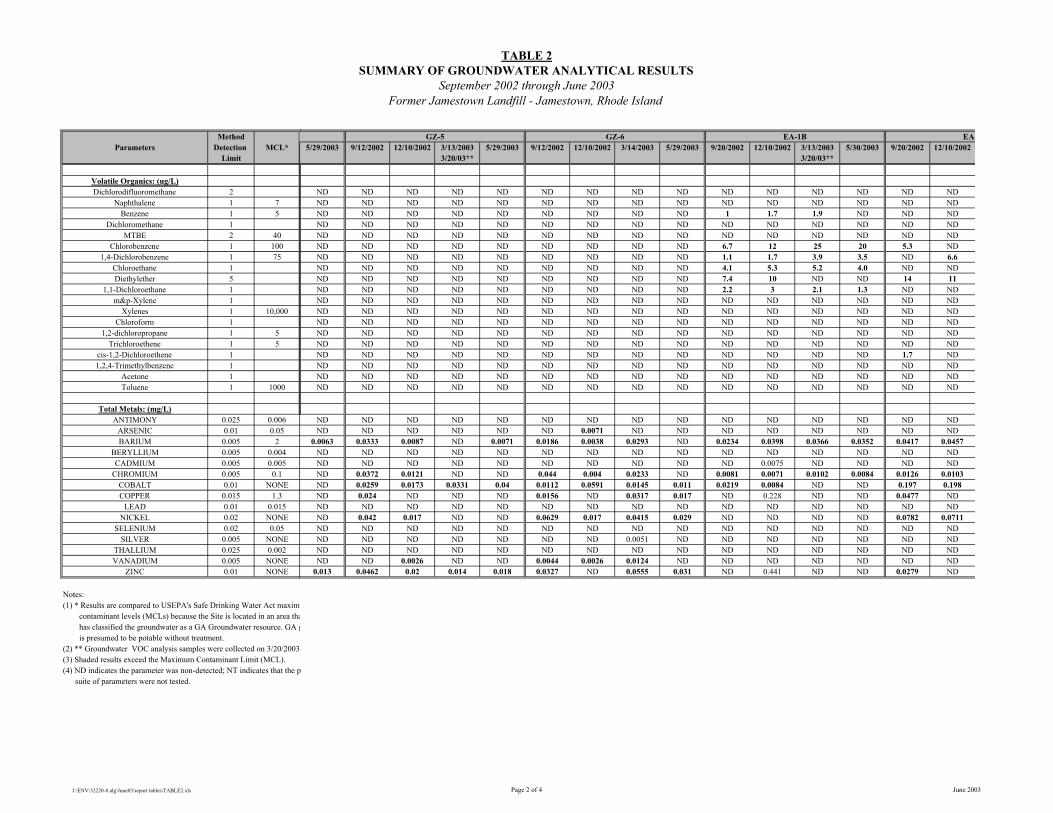
TABLE 2SUMMARY OF GROUNDWATER ANALYTICAL RESULTS
September 2002 through June 2003Former Jamestown Landfill - Jamestown, Rhode Island
MethodParameters Detection MCL*
Limit
Volatile Organics: (ug/L)Dichlorodifluoromethane 2
Naphthalene 1 7Benzene 1 5
Dichloromethane 1MTBE 2 40
Chlorobenzene 1 1001,4-Dichlorobenzene 1 75
Chloroethane 1Diethylether 5
1,1-Dichloroethane 1m&p-Xylene 1
Xylenes 1 10,000Chloroform 1
1,2-dichloropropane 1 5Trichloroethene 1 5
cis-1,2-Dichloroethene 11,2,4-Trimethylbenzene 1
Acetone 1Toluene 1 1000
Total Metals: (mg/L)ANTIMONY 0.025 0.006
ARSENIC 0.01 0.05BARIUM 0.005 2
BERYLLIUM 0.005 0.004CADMIUM 0.005 0.005
CHROMIUM 0.005 0.1COBALT 0.01 NONECOPPER 0.015 1.3
LEAD 0.01 0.015NICKEL 0.02 NONE
SELENIUM 0.02 0.05SILVER 0.005 NONE
THALLIUM 0.025 0.002VANADIUM 0.005 NONE
ZINC 0.01 NONE
Notes:(1) * Results are compared to USEPA's Safe Drinking Water Act maximu contaminant levels (MCLs) because the Site is located in an area tha has classified the groundwater as a GA Groundwater resource. GA g is presumed to be potable without treatment.(2) ** Groundwater VOC analysis samples were collected on 3/20/2003.(3) Shaded results exceed the Maximum Contaminant Limit (MCL).(4) ND indicates the parameter was non-detected; NT indicates that the p suite of parameters were not tested.
5/29/2003 9/12/2002 12/10/2002 3/13/2003 5/29/2003 9/12/2002 12/10/2002 3/14/2003 5/29/2003 9/20/2002 12/10/2002 3/13/2003 5/30/2003 9/20/2002 12/10/20023/20/03** 3/20/03**
ND ND ND ND ND ND ND ND ND ND ND ND ND ND NDND ND ND ND ND ND ND ND ND ND ND ND ND ND NDND ND ND ND ND ND ND ND ND 1 1.7 1.9 ND ND NDND ND ND ND ND ND ND ND ND ND ND ND ND ND NDND ND ND ND ND ND ND ND ND ND ND ND ND ND NDND ND ND ND ND ND ND ND ND 6.7 12 25 20 5.3 NDND ND ND ND ND ND ND ND ND 1.1 1.7 3.9 3.5 ND 6.6ND ND ND ND ND ND ND ND ND 4.1 5.3 5.2 4.0 ND NDND ND ND ND ND ND ND ND ND 7.4 10 ND ND 14 11ND ND ND ND ND ND ND ND ND 2.2 3 2.1 1.3 ND NDND ND ND ND ND ND ND ND ND ND ND ND ND ND NDND ND ND ND ND ND ND ND ND ND ND ND ND ND NDND ND ND ND ND ND ND ND ND ND ND ND ND ND NDND ND ND ND ND ND ND ND ND ND ND ND ND ND NDND ND ND ND ND ND ND ND ND ND ND ND ND ND NDND ND ND ND ND ND ND ND ND ND ND ND ND 1.7 NDND ND ND ND ND ND ND ND ND ND ND ND ND ND NDND ND ND ND ND ND ND ND ND ND ND ND ND ND NDND ND ND ND ND ND ND ND ND ND ND ND ND ND ND
ND ND ND ND ND ND ND ND ND ND ND ND ND ND NDND ND ND ND ND ND 0.0071 ND ND ND ND ND ND ND ND
0.0063 0.0333 0.0087 ND 0.0071 0.0186 0.0038 0.0293 ND 0.0234 0.0398 0.0366 0.0352 0.0417 0.0457ND ND ND ND ND ND ND ND ND ND ND ND ND ND NDND ND ND ND ND ND ND ND ND ND 0.0075 ND ND ND NDND 0.0372 0.0121 ND ND 0.044 0.004 0.0233 ND 0.0081 0.0071 0.0102 0.0084 0.0126 0.0103ND 0.0259 0.0173 0.0331 0.04 0.0112 0.0591 0.0145 0.011 0.0219 0.0084 ND ND 0.197 0.198ND 0.024 ND ND ND 0.0156 ND 0.0317 0.017 ND 0.228 ND ND 0.0477 NDND ND ND ND ND ND ND ND ND ND ND ND ND ND NDND 0.042 0.017 ND ND 0.0629 0.017 0.0415 0.029 ND ND ND ND 0.0782 0.0711ND ND ND ND ND ND ND ND ND ND ND ND ND ND NDND ND ND ND ND ND ND 0.0051 ND ND ND ND ND ND NDND ND ND ND ND ND ND ND ND ND ND ND ND ND NDND ND 0.0026 ND ND 0.0044 0.0026 0.0124 ND ND ND ND ND ND ND
0.013 0.0462 0.02 0.014 0.018 0.0327 ND 0.0555 0.031 ND 0.441 ND ND 0.0279 ND
EA-1B EA-GZ-5 GZ-6
J:\ENV\32220-8.alg\June03\report tables\TABLE2.xls Page 2 of 4 June 2003

TABLE 2SUMMARY OF GROUNDWATER ANALYTICAL RESULTS
September 2002 through June 2003Former Jamestown Landfill - Jamestown, Rhode Island
MethodParameters Detection MCL*
Limit
Volatile Organics: (ug/L)Dichlorodifluoromethane 2
Naphthalene 1 7Benzene 1 5
Dichloromethane 1MTBE 2 40
Chlorobenzene 1 1001,4-Dichlorobenzene 1 75
Chloroethane 1Diethylether 5
1,1-Dichloroethane 1m&p-Xylene 1
Xylenes 1 10,000Chloroform 1
1,2-dichloropropane 1 5Trichloroethene 1 5
cis-1,2-Dichloroethene 11,2,4-Trimethylbenzene 1
Acetone 1Toluene 1 1000
Total Metals: (mg/L)ANTIMONY 0.025 0.006
ARSENIC 0.01 0.05BARIUM 0.005 2
BERYLLIUM 0.005 0.004CADMIUM 0.005 0.005
CHROMIUM 0.005 0.1COBALT 0.01 NONECOPPER 0.015 1.3
LEAD 0.01 0.015NICKEL 0.02 NONE
SELENIUM 0.02 0.05SILVER 0.005 NONE
THALLIUM 0.025 0.002VANADIUM 0.005 NONE
ZINC 0.01 NONE
Notes:(1) * Results are compared to USEPA's Safe Drinking Water Act maximu contaminant levels (MCLs) because the Site is located in an area tha has classified the groundwater as a GA Groundwater resource. GA g is presumed to be potable without treatment.(2) ** Groundwater VOC analysis samples were collected on 3/20/2003.(3) Shaded results exceed the Maximum Contaminant Limit (MCL).(4) ND indicates the parameter was non-detected; NT indicates that the p suite of parameters were not tested.
12/10/2002 3/13/2003 5/30/2003 9/20/2002 12/10/2002 3/13/2003 5/29/20033/20/03** 3/20/03**
ND ND ND ND ND ND NDND ND ND ND ND ND NDND ND ND ND ND ND NDND ND ND ND ND ND NDND ND ND ND 4.4 ND NDND ND ND ND ND ND NDND ND ND ND ND ND NDND ND ND ND 3.6 2.3 NDND ND ND ND 7.7 ND NDND ND ND ND ND ND NDND ND ND ND ND ND NDND ND ND ND ND ND NDND ND ND ND ND ND NDND ND ND ND ND ND NDND ND ND ND ND ND NDND ND ND ND ND ND NDND ND ND ND ND ND NDND ND ND ND ND ND NDND ND ND ND ND ND ND
ND ND ND ND ND ND ND0.0157 ND ND ND ND ND ND
ND 0.0146 0.0148 0.0173 0.0239 0.0129 0.0245ND ND ND ND ND ND NDND ND ND ND ND ND 0.0066ND ND ND 0.0069 0.0786 ND 0.0118ND ND ND 0.155 0.167 0.0904 0.184ND ND 1.35 ND 0.468 ND NDND ND ND ND 0.0162 ND NDND ND ND 0.0424 0.044 0.0158 0.032ND ND ND ND ND ND NDND ND ND ND 0.0239 ND NDND ND ND ND ND ND NDND ND ND ND ND ND NDND 0.0198 0.758 ND 0.309 0.0247 ND
MW-3 DEEP WELL
J:\ENV\32220-8.alg\June03\report tables\TABLE2.xls Page 4 of 4 June 2003

TABLE 2SUMMARY OF GROUNDWATER ANALYTICAL RESULTS
September 2002 through June 2003Former Jamestown Landfill - Jamestown, Rhode Island
MethodParameters Detection MCL*
Limit
Volatile Organics: (ug/L)Dichlorodifluoromethane 2
Naphthalene 1 7Benzene 1 5
Dichloromethane 1MTBE 2 40
Chlorobenzene 1 1001,4-Dichlorobenzene 1 75
Chloroethane 1Diethylether 5
1,1-Dichloroethane 1m&p-Xylene 1
Xylenes 1 10,000Chloroform 1
1,2-dichloropropane 1 5Trichloroethene 1 5
cis-1,2-Dichloroethene 11,2,4-Trimethylbenzene 1
Acetone 1Toluene 1 1000
Total Metals: (mg/L)ANTIMONY 0.025 0.006
ARSENIC 0.01 0.05BARIUM 0.005 2
BERYLLIUM 0.005 0.004CADMIUM 0.005 0.005
CHROMIUM 0.005 0.1COBALT 0.01 NONECOPPER 0.015 1.3
LEAD 0.01 0.015NICKEL 0.02 NONE
SELENIUM 0.02 0.05SILVER 0.005 NONE
THALLIUM 0.025 0.002VANADIUM 0.005 NONE
ZINC 0.01 NONE
Notes:(1) * Results are compared to USEPA's Safe Drinking Water Act maximu contaminant levels (MCLs) because the Site is located in an area tha has classified the groundwater as a GA Groundwater resource. GA g is presumed to be potable without treatment.(2) ** Groundwater VOC analysis samples were collected on 3/20/2003.(3) Shaded results exceed the Maximum Contaminant Limit (MCL).(4) ND indicates the parameter was non-detected; NT indicates that the p suite of parameters were not tested.
3/13/2003 5/29/2003 9/20/2002 12/10/2002 3/13/2003 5/29/2003 9/11/2002 12/10/2002 3/14/2003 5/29/2003 9/11/2002 12/10/2002 3/13/2003 5/30/2003 9/11/20023/20/03** DRY DRY DRY 3/20/03** DRY
ND ND 2 ND ND ND ND ND ND ND NDND ND ND ND ND ND ND ND ND ND NDND ND ND ND ND ND ND ND ND ND NDND ND ND ND ND ND ND ND ND ND NDND ND ND ND ND ND ND ND ND ND ND7.5 12 ND ND ND ND ND ND ND ND NDND ND ND ND ND ND ND ND ND ND ND1.5 1.3 ND ND ND ND ND ND ND ND NDND ND ND ND ND ND ND ND ND ND NDND ND ND ND ND ND ND ND ND ND NDND ND ND ND ND ND ND ND ND ND NDND ND ND ND ND ND ND ND ND ND NDND ND ND ND ND ND ND ND ND ND NDND ND ND ND ND ND ND ND ND ND NDND ND ND ND ND ND ND ND ND ND NDND 1 ND ND ND ND ND ND ND ND NDND ND ND ND ND ND ND ND ND ND NDND ND ND ND ND ND ND ND ND ND NDND ND ND ND ND ND ND ND ND ND 2.1
ND ND ND ND ND ND ND ND ND ND NDND ND ND ND ND ND ND ND ND ND ND
0.0665 0.0745 0.0086 0.0097 0.0073 0.0096 0.0095 0.0103 0.0593 0.0208 0.0457ND ND ND ND ND ND ND ND ND ND NDND ND ND ND ND ND ND ND ND ND ND
0.0165 0.0138 0.0114 ND ND ND ND ND ND ND ND0.181 0.177 0.0141 0.0079 ND 0.012 ND ND 0.0123 ND NDND ND ND 0.141 ND ND ND ND ND ND NDND ND ND ND ND ND ND ND ND ND ND
0.0389 0.047 0.0354 0.018 ND ND ND ND ND ND NDND ND ND ND ND ND ND ND ND ND NDND ND ND ND ND ND ND ND ND ND NDND ND ND ND ND ND ND ND ND ND NDND ND ND ND ND ND ND ND 0.0015 ND ND
0.0202 0.01 0.0384 0.429 0.0183 0.021 0.0187 0.015 0.0597 0.0134 0.013
-2D MW-1EA-3 MW-2
J:\ENV\32220-8.alg\June03\report tables\TABLE2.xls Page 3 of 4 June 2003
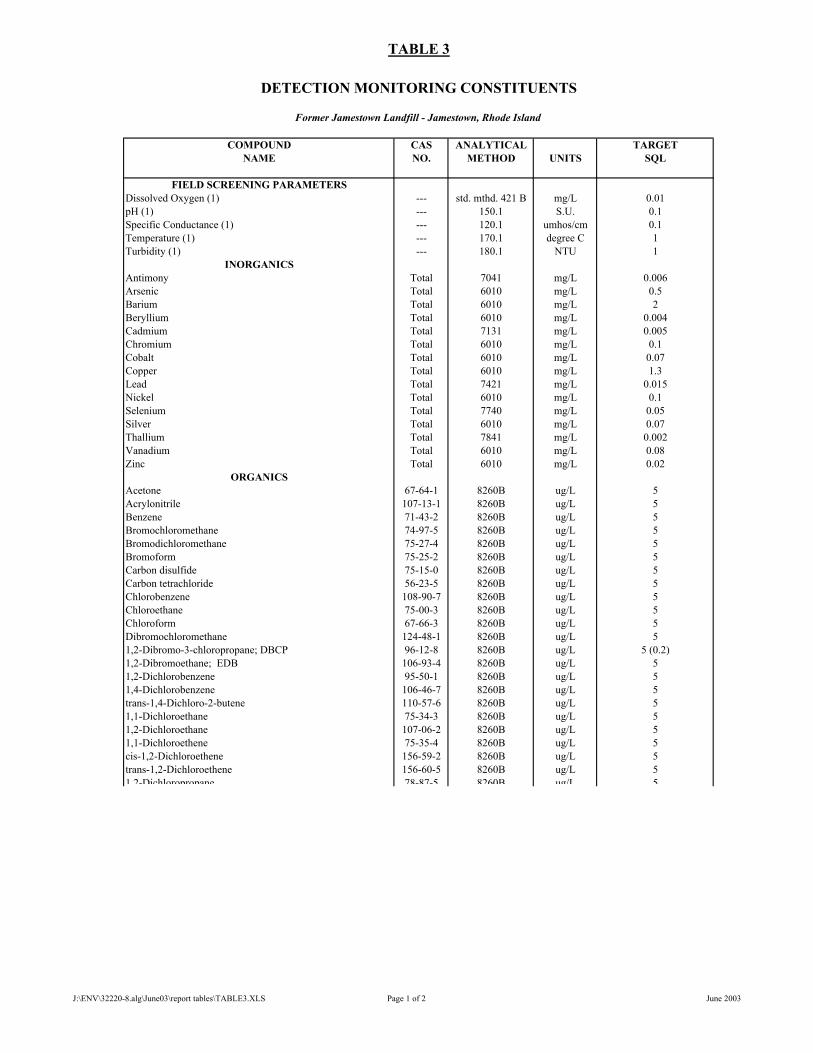
TABLE 3
DETECTION MONITORING CONSTITUENTS
Former Jamestown Landfill - Jamestown, Rhode Island
COMPOUND CAS ANALYTICAL TARGETNAME NO. METHOD UNITS SQL
FIELD SCREENING PARAMETERS
Dissolved Oxygen (1) --- std. mthd. 421 B mg/L 0.01pH (1) --- 150.1 S.U. 0.1Specific Conductance (1) --- 120.1 umhos/cm 0.1Temperature (1) --- 170.1 degree C 1Turbidity (1) --- 180.1 NTU 1
INORGANICSAntimony Total 7041 mg/L 0.006Arsenic Total 6010 mg/L 0.5Barium Total 6010 mg/L 2Beryllium Total 6010 mg/L 0.004Cadmium Total 7131 mg/L 0.005Chromium Total 6010 mg/L 0.1Cobalt Total 6010 mg/L 0.07Copper Total 6010 mg/L 1.3Lead Total 7421 mg/L 0.015Nickel Total 6010 mg/L 0.1Selenium Total 7740 mg/L 0.05Silver Total 6010 mg/L 0.07Thallium Total 7841 mg/L 0.002Vanadium Total 6010 mg/L 0.08Zinc Total 6010 mg/L 0.02
ORGANICSAcetone 67-64-1 8260B ug/L 5Acrylonitrile 107-13-1 8260B ug/L 5Benzene 71-43-2 8260B ug/L 5Bromochloromethane 74-97-5 8260B ug/L 5Bromodichloromethane 75-27-4 8260B ug/L 5Bromoform 75-25-2 8260B ug/L 5Carbon disulfide 75-15-0 8260B ug/L 5Carbon tetrachloride 56-23-5 8260B ug/L 5Chlorobenzene 108-90-7 8260B ug/L 5Chloroethane 75-00-3 8260B ug/L 5Chloroform 67-66-3 8260B ug/L 5Dibromochloromethane 124-48-1 8260B ug/L 51,2-Dibromo-3-chloropropane; DBCP 96-12-8 8260B ug/L 5 (0.2)1,2-Dibromoethane; EDB 106-93-4 8260B ug/L 51,2-Dichlorobenzene 95-50-1 8260B ug/L 51,4-Dichlorobenzene 106-46-7 8260B ug/L 5trans-1,4-Dichloro-2-butene 110-57-6 8260B ug/L 51,1-Dichloroethane 75-34-3 8260B ug/L 51,2-Dichloroethane 107-06-2 8260B ug/L 51,1-Dichloroethene 75-35-4 8260B ug/L 5cis-1,2-Dichloroethene 156-59-2 8260B ug/L 5trans-1,2-Dichloroethene 156-60-5 8260B ug/L 51 2-Dichloropropane 78-87-5 8260B ug/L 5
J:\ENV\32220-8.alg\June03\report tables\TABLE3.XLS Page 1 of 2 June 2003
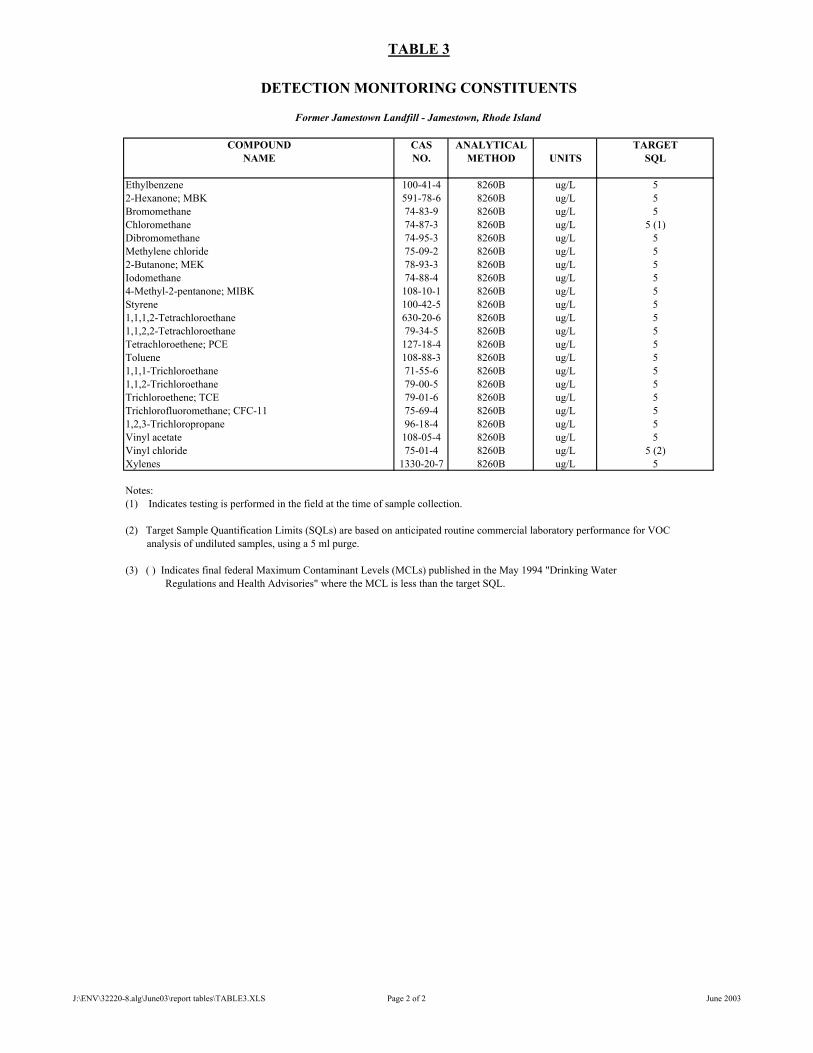
TABLE 3
DETECTION MONITORING CONSTITUENTS
Former Jamestown Landfill - Jamestown, Rhode Island
COMPOUND CAS ANALYTICAL TARGETNAME NO. METHOD UNITS SQL
Ethylbenzene 100-41-4 8260B ug/L 52-Hexanone; MBK 591-78-6 8260B ug/L 5Bromomethane 74-83-9 8260B ug/L 5Chloromethane 74-87-3 8260B ug/L 5 (1)Dibromomethane 74-95-3 8260B ug/L 5Methylene chloride 75-09-2 8260B ug/L 52-Butanone; MEK 78-93-3 8260B ug/L 5Iodomethane 74-88-4 8260B ug/L 54-Methyl-2-pentanone; MIBK 108-10-1 8260B ug/L 5Styrene 100-42-5 8260B ug/L 51,1,1,2-Tetrachloroethane 630-20-6 8260B ug/L 51,1,2,2-Tetrachloroethane 79-34-5 8260B ug/L 5Tetrachloroethene; PCE 127-18-4 8260B ug/L 5Toluene 108-88-3 8260B ug/L 51,1,1-Trichloroethane 71-55-6 8260B ug/L 51,1,2-Trichloroethane 79-00-5 8260B ug/L 5Trichloroethene; TCE 79-01-6 8260B ug/L 5Trichlorofluoromethane; CFC-11 75-69-4 8260B ug/L 51,2,3-Trichloropropane 96-18-4 8260B ug/L 5Vinyl acetate 108-05-4 8260B ug/L 5Vinyl chloride 75-01-4 8260B ug/L 5 (2)Xylenes 1330-20-7 8260B ug/L 5
Notes:(1) Indicates testing is performed in the field at the time of sample collection.
(2) Target Sample Quantification Limits (SQLs) are based on anticipated routine commercial laboratory performance for VOC analysis of undiluted samples, using a 5 ml purge.
(3) ( ) Indicates final federal Maximum Contaminant Levels (MCLs) published in the May 1994 "Drinking Water Regulations and Health Advisories" where the MCL is less than the target SQL.
J:\ENV\32220-8.alg\June03\report tables\TABLE3.XLS Page 2 of 2 June 2003

FIGURES
