nvca provincial groundwater monitoring network groundwater
TRANSCRIPT
1
NVCA Provincial Groundwater Monitoring Network Groundwater Quality Overview, 2002-2013
Ryan Post, Ryan Mueller, and Bill Kidd Nottawasaga Valley Conservation Authority
October 2, 2013 1.0 Introduction
Ambient groundwater quality monitoring is useful for establishing baseline groundwater characteristics and for investigating long-term trends or impacts to groundwater quality from human activities. It also provides an early warning system for changes in water quality from natural causes or anthropogenic influences. Designed to gather long-term baseline data on groundwater levels and quality in key aquifers across Ontario, the Provincial Groundwater Monitoring Network (PGMN) was established in 2002 and presently consists of over 450 monitoring wells, sampled both for groundwater levels and water quality. Data from the PGMN is used for:
1. Water resource development, management and protection, 2. Land development and landuse management, and 3. Assessing causes and sources of pollution.
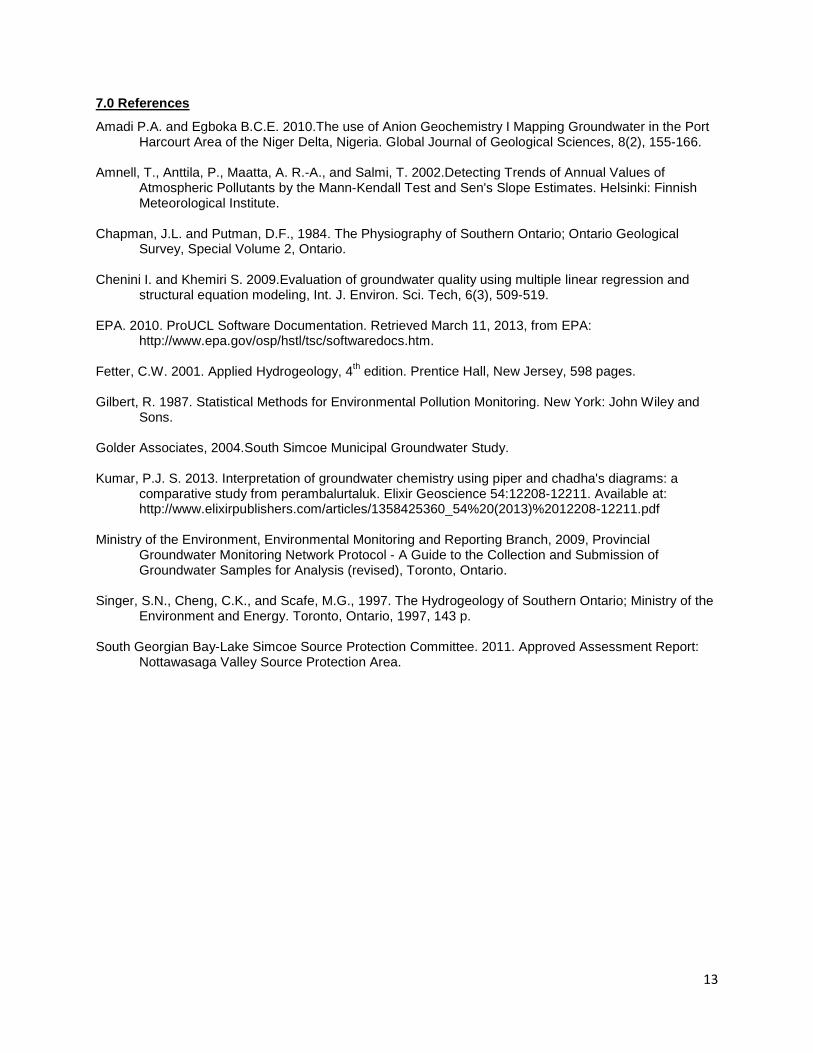
The Nottawasaga Valley Conservation Authority (NVCA) in partnership with the Ministry of the Environment (MOE) maintains 16 PGMN wells at 10 locations (Figure 1). Regional groundwater quality characterization was recently completed through the source water protection process via the NVSPA Assessment Report (South Georgian Bay-Lake Simcoe Source Protection Committee, 2011). This provided a generalized snapshot of groundwater quality based on PGMN data for 2002-2008. Since the program inception at the NVCA, groundwater data have been collected from 2002 to 2013 which has been used to track groundwater quality and provide important groundwater information to decision makers and local communities. To date, limited groundwater quality analysis has been completed in support of regional aquifer characterization. This report provides a baseline evaluation of ambient groundwater quality in the NVCA based on data comprising strictly the PGMN program. It is noted that the availability of information to describe long-term trends in ambient groundwater quality is limited due to the relatively few sites for long-term monitoring in the NVCA. The purpose of this project is to:
1. Summarize the available PGMN groundwater chemistry data at the NVCA. 2. Characterize the regional groundwater facies and associated flow paths. 3. Characterize individual wells’ chemistry. 4. Statistically define trends in ambient groundwater quality where exceedances of the Ontario
Drinking Water Standards (ODWS) are noted.
2.0 Watershed Physiographic and Hydrostratigraphic Overview
The NVCA watershed, located in south-central Ontario, is approximately 3,300 km2 in area.The overall relief of the watershed is approximately 350 m, from a high of approximately 535 metres above sea level (masl) on the top of the Niagara Escarpment in the west to a low of approximately 175 masl along the shores of Georgian Bay. The overburden thickness ranges from 0 m to over 230m and records several glacial advances and retreats. A brief description of the significant physiographic regions, summarized from Chapman and Putman (1984), is followed by a discussion of the hydrostratigraphic units. Oro Moraine: located northwest of Lake Simcoe, a broad belt of sand hills referred to as the Oro Moraine extends from near Midhurst through the northern part of Oro Medonte Township to Bass Lake. It forms the highest land in the eastern margin of the NVCA watershed, rising to approximately 400 masl. The sands are largely derived from Precambrian rocks, with little local limestone intermixed. It is a regional recharge area (South Georgian Bay-Lake Simcoe Source Protection Committee, 2011).
2
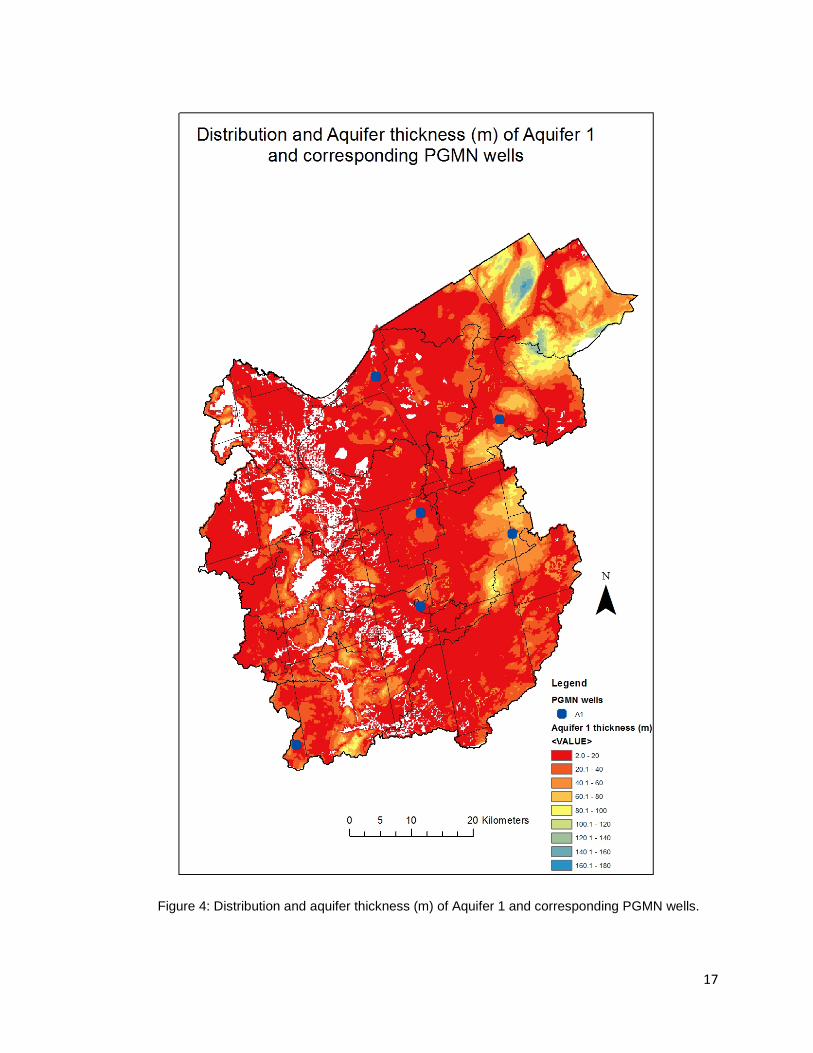
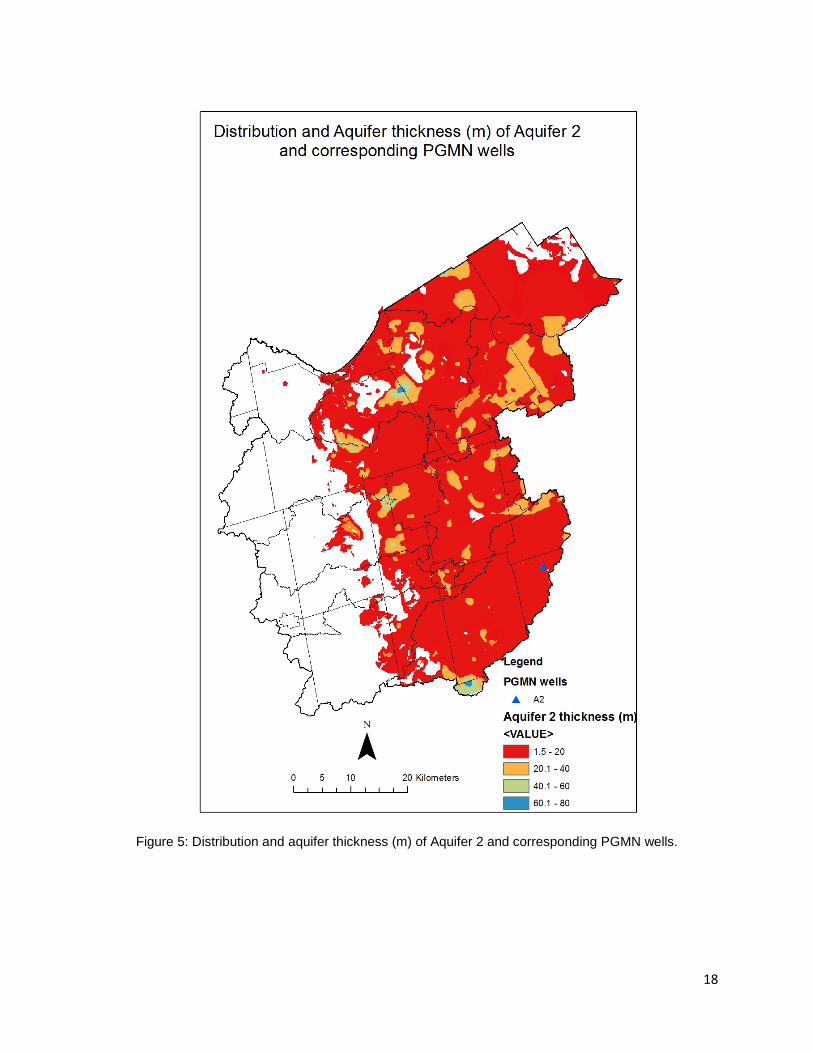
Niagara Escarpment: This prominent physiographic feature runs north-south through the western side of the watershed. The Niagara Escarpment is a cuesta which was formed by differential erosion, i.e. the underlying, soft rocks (shale) eroded away relatively quickly and the more resistant cap rock (limestone and dolostone) was undermined and broke off, creating a cliff-like slope. Significant groundwater discharge is noted along the Niagara Escarpment. Simcoe Lowlands: The Simcoe Lowlands physiographic region includes the flat-lying plains extending south from the Nottawasaga Bay (Georgian Bay) shoreline. Most of the surface elevations within the Simcoe Lowlands are below 230 m. The surface deposits consist mainly of fine to medium grained sands and thin clay lenses which were deposited in glacial Lake Algonquin (~12,500 ybp). Evidence of glacial Lake Algonquin and its successors is provided by numerous shore cliffs, wave-cut notches, terraces and beach ridges throughout the area. Extensive sections of this region are comprised of sandy soils of glacial origin, although some localized areas are dominated by less permeable soils associated with more recent deposits of mud and muck (e.g. Minesing Wetlands). Simcoe Uplands: Comprising a series of broad, rolling drumlinized till plains that are separated by numerous steep-walled, flat-floored valleys; the uplands are located south of the community of Barrie, north of Alliston and in the northern portions of Oro-Medonte and Springwater townships. The uplands are commonly encircled by numerous shorelines and other morphological features associated with glacial Lake Algonquin and its successors. The hydrostratigraphy of the NVCA watershed is characterized by a series of four progressively deeper, regional aquifers denoted as A1, A2, A3 and A4 and defined below (Golder Associates, 2004). The aquifers are situated largely in overburden sediment. Figures 2 and 3 provide a regional cross-sectional delineation of the NVCA hydrostratigraphy. Regional A1 Aquifer Unit: Aquifer A1 is a regional, typically unconfined, relatively continuous unit located throughout the watershed. It is typically found at elevations above 250 masl, although in some lowland areas it is mapped as low as 220 masl. Unit thickness is typically from 10 to over 50 m. It is generally associated with coarse-grained glacial and interglacial sediments mapped as contact stratified drift. In some places, it is confined or interbedded with silt till materials, particularly in the upland locations. Where it is mapped in the vicinity of the Niagara Escarpment to the west, the upper aquifer is a thin discontinuous unit, disconnected from the other aquifer systems and often discharging to surface along the slopes. This aquifer unit corresponds to the Singer et al. (1997) Kame and Outwash Aquifer Complex and the Lake Algonquin Sand Aquifer, both of which are unconfined shallow aquifers. The unconfined Lake Algonquin sand aquifer is an extensive sand deposit from glacial Lake Algonquin found at the surface at elevation of 225 to 230 masl in the Simcoe Lowlands with an average thickness of about 10 m. A1 regionally correlates to the Oak Ridges Moraine deposits. Figure 4 outlines the distribution and aquifer thickness of A1 and the corresponding PGMN wells. Regional A2 Aquifer Unit: The underlying A2 regional aquifer unit is typically found at elevations between 180 and 250 masl, although it is mapped as low as 150 masl in some lowland areas. Aquifer thickness ranges from 25 m to over 100 m. This regional aquifer is commonly used for private water supplies, as well as some of the smaller municipal water supply wells. A2 is predominantly a confined aquifer; however, is limitedly unconfined where the overlying units are thin. It also incorporates the generally confined bedrock AmabelAquifer, located above the Escarpment and which may have karst features. The regional A2 aquifer is partly analogous to the Oro Medonte Aquifer (cf. Singer et al. 1997) and corresponds to the extensive surficial ice-contact sand deposits that occur at the surface at elevations between 275 and 360 masl within Springwater and Oro-Medonte.Further, A2 is hydrostratigraphically equivalent to the Thorncliffe Formation. Figure 5 outlines the distribution and aquifer thickness of aquifer 2 and the corresponding PGMN wells.
3
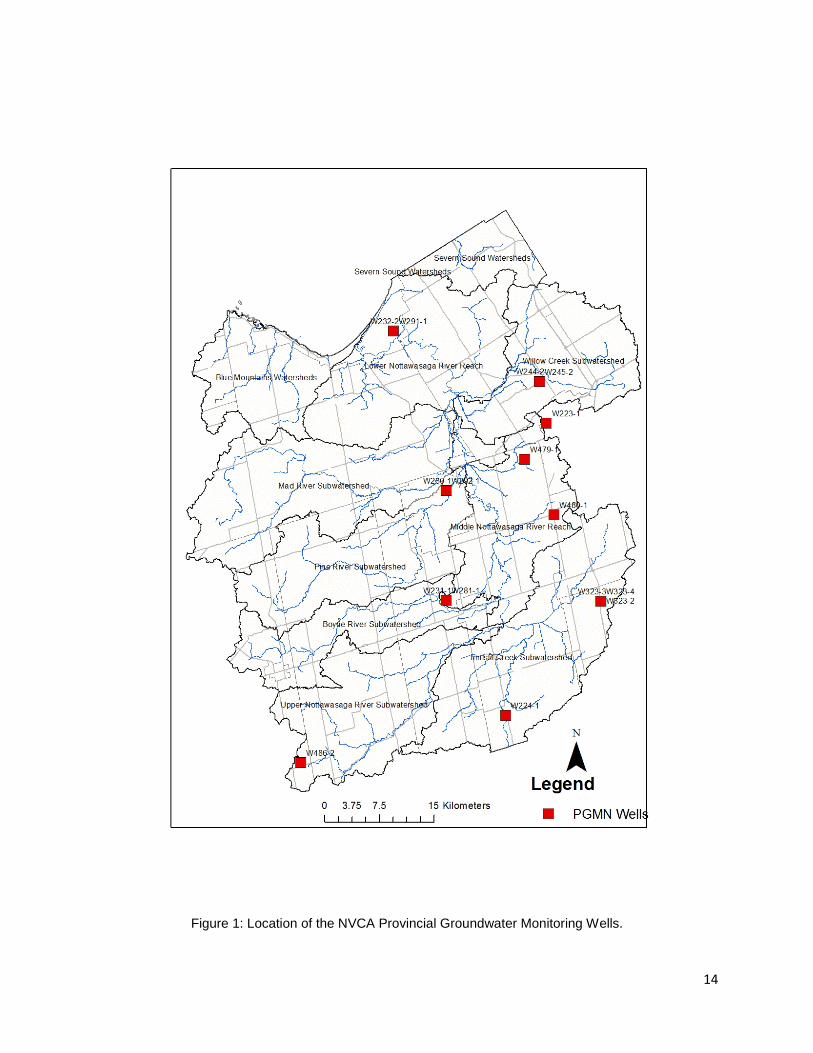
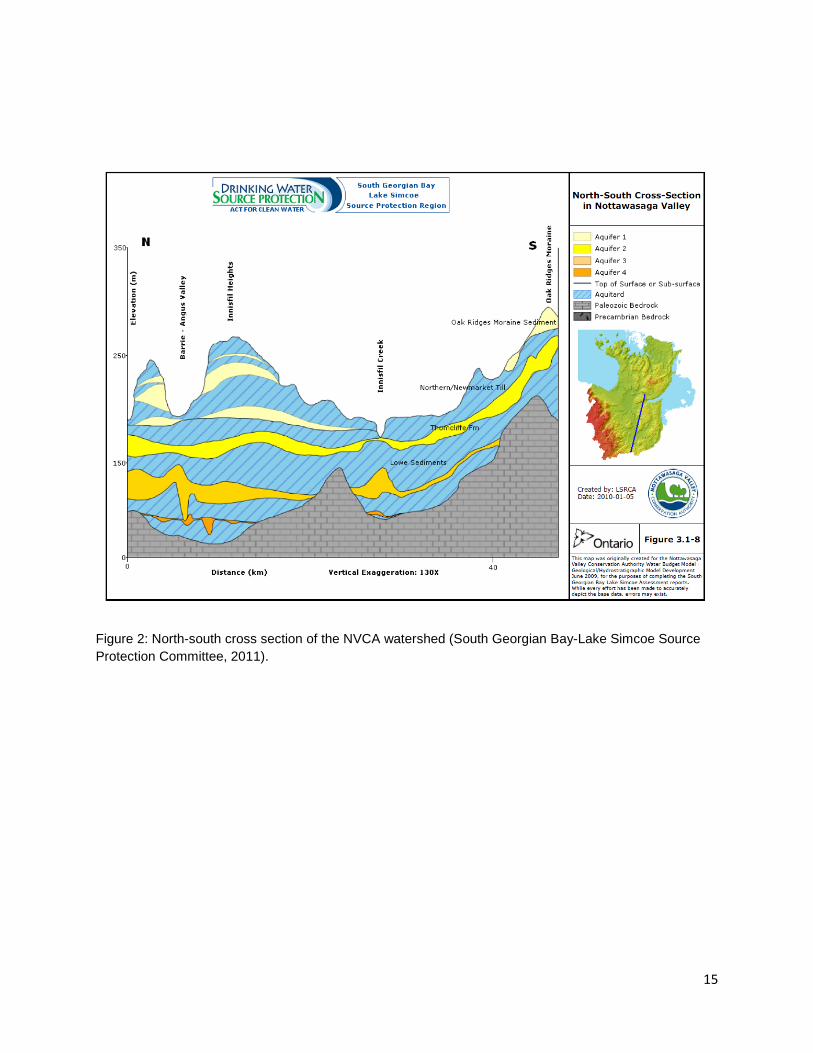
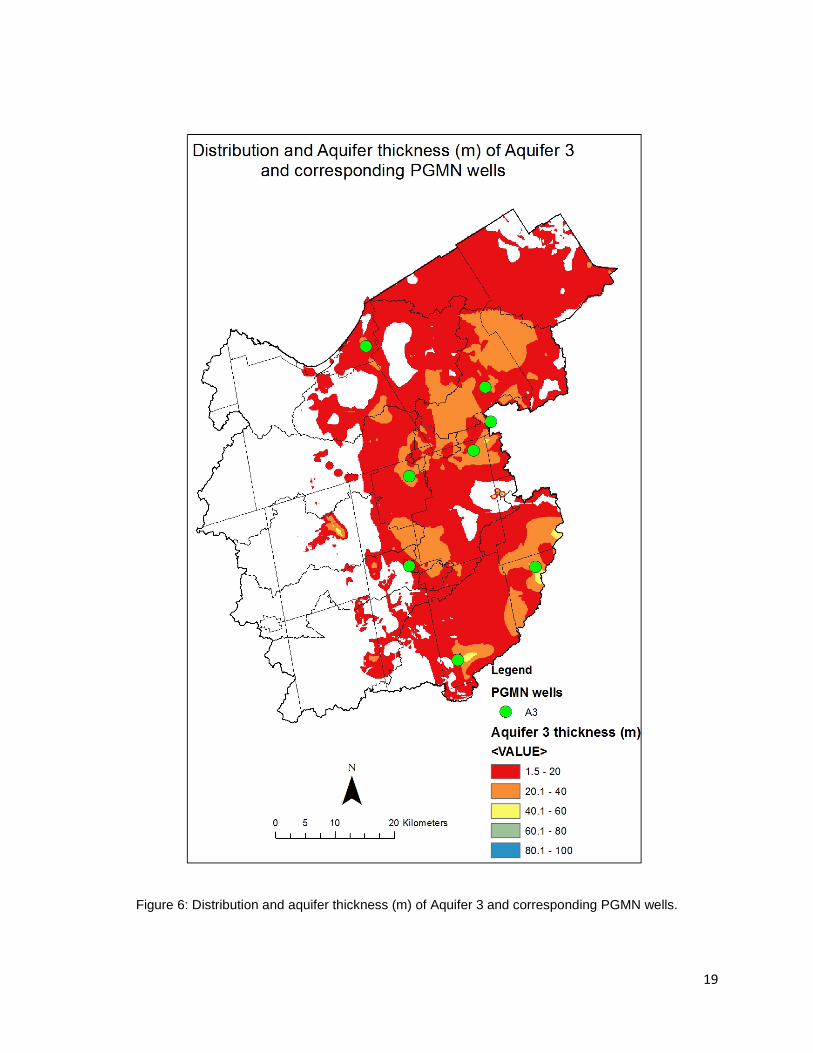
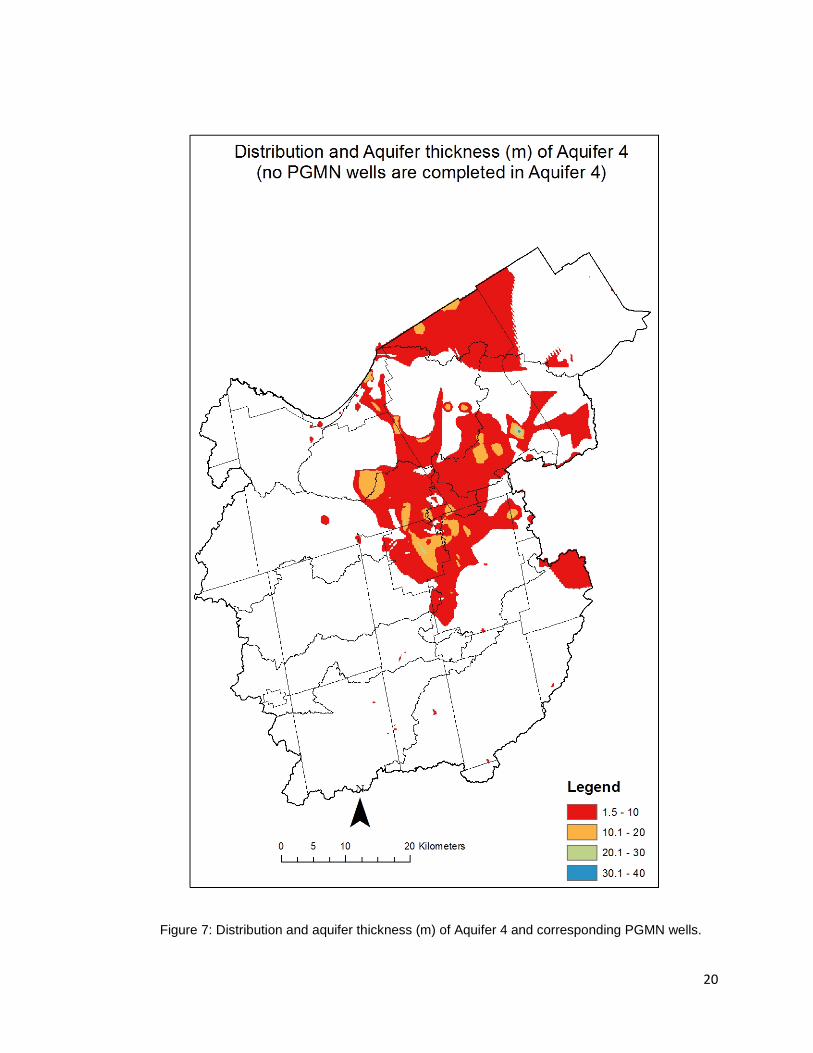
Regional A3 Aquifer Unit: The confined A3 is typically found at elevations between 130 and 210 masl and is the supply source for several municipalities. The A3 aquifer is thickest in the Barrie-Borden area, where it is observed to be up to 40 or 50 m in thickness in the deeper parts of the channel aquifer (elevations below 150 masl), corresponding to the combined A3 and A4 units (Golder, 2004). It is also found to the south of CFB Borden extending to Alliston, and in the Tottenham area. The aquifer materials in A3 are typically medium to coarse sand, with some gravel and silty layers. These thick deposits generally correspond to the confluence of the Laurentian Channel with buried tunnel channel deposits. Regional Aquifers A3 & A4 is equivalent to the Scarborough Formation. Figure 6 outlines the distribution and thickness of A3 and the corresponding PGMN wells. Regional A4 Aquifer Unit: Typically found at elevations below 150 masl, aquifer A4 is focused in the area of the tunnel channels and deeper part of the Laurentian Channel. In the Barrie area, this aquifer consists of the deeper tunnel channel sediments, which are intersected by the deepest municipal water supply wells. Where it is defined as a regional unit, the aquifer materials in A4 are typically reported to consist of fine to medium sand with minor gravel in some areas. Where A4 is within a tunnel channel, it typically consists of medium to coarse grained sand and gravel and is highly productive. Figure 7 outlines the distribution and aquifer thickness of A4. The general groundwater flow directions in the shallow and deep aquifer regime generally mimic the local surface drainage, with flow regionally towards the Nottawasaga River and its tributaries, or Georgian Bay, or the area corresponding to the north-south trending Laurentian Channel. The groundwater divides generally mimic the surface water divides. However, interbasin groundwater movement is noted (South Georgian Bay-Lake Simcoe Source Protection Committee, 2011). 3.0 Monitoring Network Dataset: NVCA Provincial Groundwater Monitoring Network Program
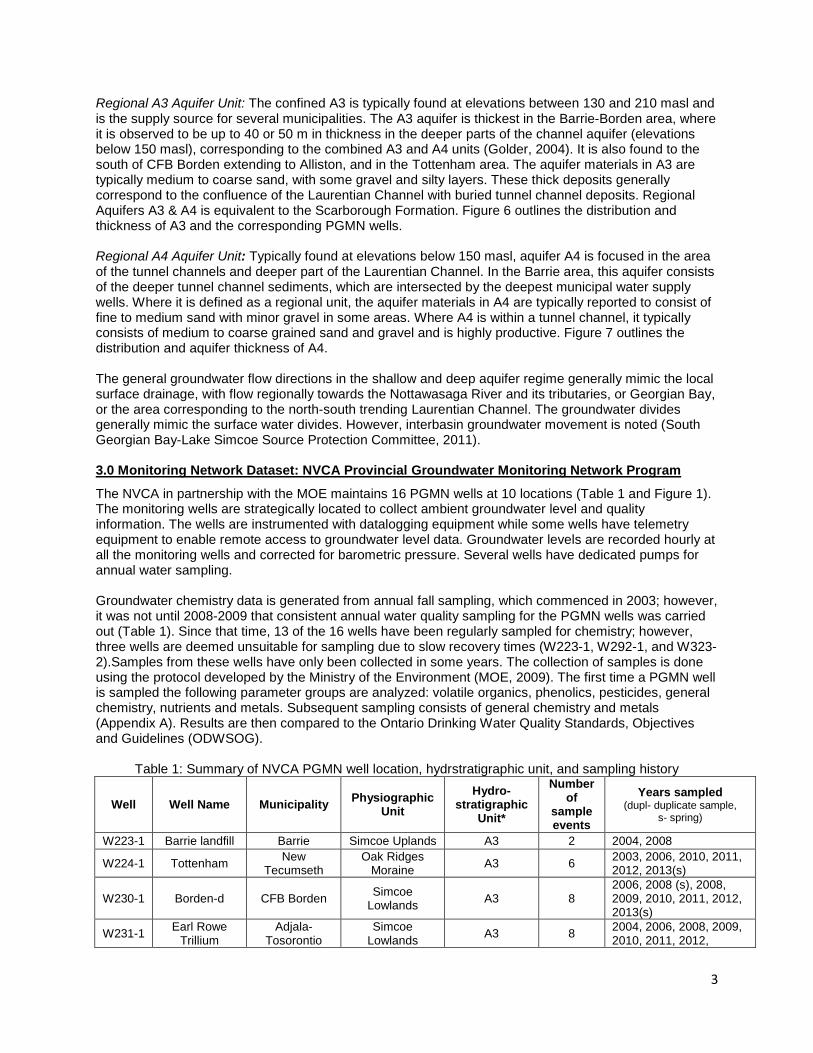
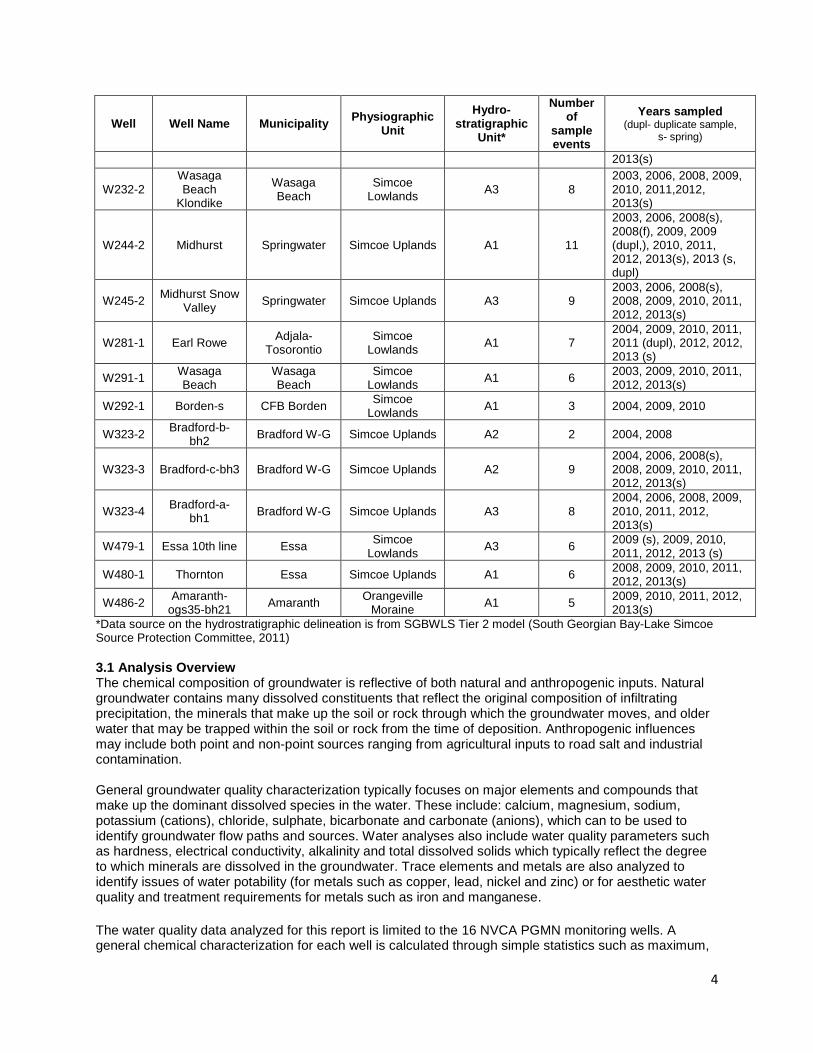
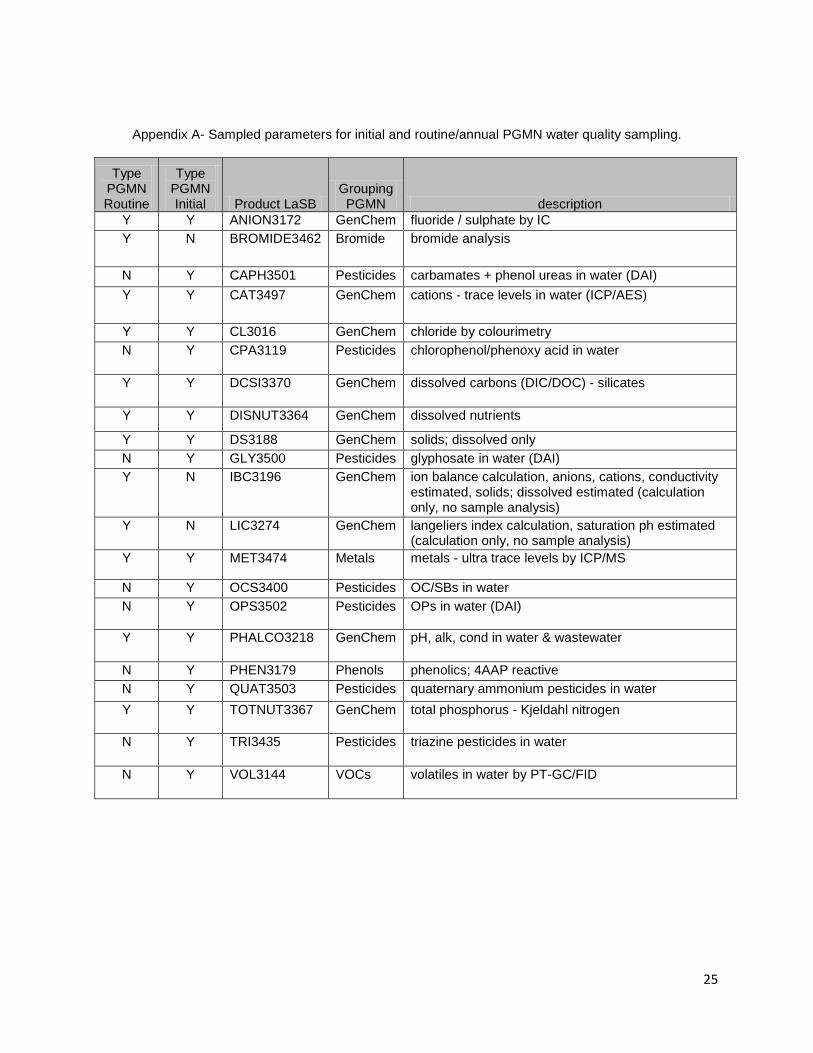
The NVCA in partnership with the MOE maintains 16 PGMN wells at 10 locations (Table 1 and Figure 1). The monitoring wells are strategically located to collect ambient groundwater level and quality information. The wells are instrumented with datalogging equipment while some wells have telemetry equipment to enable remote access to groundwater level data. Groundwater levels are recorded hourly at all the monitoring wells and corrected for barometric pressure. Several wells have dedicated pumps for annual water sampling. Groundwater chemistry data is generated from annual fall sampling, which commenced in 2003; however, it was not until 2008-2009 that consistent annual water quality sampling for the PGMN wells was carried out (Table 1). Since that time, 13 of the 16 wells have been regularly sampled for chemistry; however, three wells are deemed unsuitable for sampling due to slow recovery times (W223-1, W292-1, and W323-2).Samples from these wells have only been collected in some years. The collection of samples is done using the protocol developed by the Ministry of the Environment (MOE, 2009). The first time a PGMN well is sampled the following parameter groups are analyzed: volatile organics, phenolics, pesticides, general chemistry, nutrients and metals. Subsequent sampling consists of general chemistry and metals (Appendix A). Results are then compared to the Ontario Drinking Water Quality Standards, Objectives and Guidelines (ODWSOG).
Table 1: Summary of NVCA PGMN well location, hydrstratigraphic unit, and sampling history
Well Well Name Municipality Physiographic Unit
Hydro-stratigraphic
Unit*
Number of
sample events
Years sampled (dupl- duplicate sample,
s- spring)
W223-1 Barrie landfill Barrie Simcoe Uplands A3 2 2004, 2008
W224-1 Tottenham New Tecumseth
Oak Ridges Moraine A3 6 2003, 2006, 2010, 2011,
2012, 2013(s)
W230-1 Borden-d CFB Borden Simcoe Lowlands A3 8
2006, 2008 (s), 2008, 2009, 2010, 2011, 2012, 2013(s)
W231-1 Earl Rowe Trillium
Adjala-Tosorontio
Simcoe Lowlands A3 8 2004, 2006, 2008, 2009,
2010, 2011, 2012,
4
Well Well Name Municipality Physiographic Unit
Hydro-stratigraphic
Unit*
Number of
sample events
Years sampled (dupl- duplicate sample,
s- spring)
2013(s)
W232-2 Wasaga Beach
Klondike
Wasaga Beach
Simcoe Lowlands A3 8
2003, 2006, 2008, 2009, 2010, 2011,2012, 2013(s)
W244-2 Midhurst Springwater Simcoe Uplands A1 11
2003, 2006, 2008(s), 2008(f), 2009, 2009 (dupl,), 2010, 2011, 2012, 2013(s), 2013 (s, dupl)
W245-2 Midhurst Snow Valley Springwater Simcoe Uplands A3 9
2003, 2006, 2008(s), 2008, 2009, 2010, 2011, 2012, 2013(s)
W281-1 Earl Rowe Adjala-Tosorontio
Simcoe Lowlands A1 7
2004, 2009, 2010, 2011, 2011 (dupl), 2012, 2012, 2013 (s)
W291-1 Wasaga Beach
Wasaga Beach
Simcoe Lowlands A1 6 2003, 2009, 2010, 2011,
2012, 2013(s)
W292-1 Borden-s CFB Borden Simcoe Lowlands A1 3 2004, 2009, 2010
W323-2 Bradford-b-bh2 Bradford W-G Simcoe Uplands A2 2 2004, 2008
W323-3 Bradford-c-bh3 Bradford W-G Simcoe Uplands A2 9 2004, 2006, 2008(s), 2008, 2009, 2010, 2011, 2012, 2013(s)
W323-4 Bradford-a-bh1 Bradford W-G Simcoe Uplands A3 8
2004, 2006, 2008, 2009, 2010, 2011, 2012, 2013(s)
W479-1 Essa 10th line Essa Simcoe Lowlands A3 6 2009 (s), 2009, 2010,
2011, 2012, 2013 (s)
W480-1 Thornton Essa Simcoe Uplands A1 6 2008, 2009, 2010, 2011, 2012, 2013(s)
W486-2 Amaranth-ogs35-bh21 Amaranth Orangeville
Moraine A1 5 2009, 2010, 2011, 2012, 2013(s)
*Data source on the hydrostratigraphic delineation is from SGBWLS Tier 2 model (South Georgian Bay-Lake Simcoe Source Protection Committee, 2011) 3.1 Analysis Overview The chemical composition of groundwater is reflective of both natural and anthropogenic inputs. Natural groundwater contains many dissolved constituents that reflect the original composition of infiltrating precipitation, the minerals that make up the soil or rock through which the groundwater moves, and older water that may be trapped within the soil or rock from the time of deposition. Anthropogenic influences may include both point and non-point sources ranging from agricultural inputs to road salt and industrial contamination. General groundwater quality characterization typically focuses on major elements and compounds that make up the dominant dissolved species in the water. These include: calcium, magnesium, sodium, potassium (cations), chloride, sulphate, bicarbonate and carbonate (anions), which can to be used to identify groundwater flow paths and sources. Water analyses also include water quality parameters such as hardness, electrical conductivity, alkalinity and total dissolved solids which typically reflect the degree to which minerals are dissolved in the groundwater. Trace elements and metals are also analyzed to identify issues of water potability (for metals such as copper, lead, nickel and zinc) or for aesthetic water quality and treatment requirements for metals such as iron and manganese. The water quality data analyzed for this report is limited to the 16 NVCA PGMN monitoring wells. A general chemical characterization for each well is calculated through simple statistics such as maximum,
5
minimum, average and standard deviation for the targeted parameter values. For parameter concentration values less than the reported method detection limit, half the analytical method detection limit was used to determine the statistical values. This is an accepted industry practice and recommended by Environment Canada. Definition of the groundwater facies along with associated regional flow path delineation is completed through the analysis of major cations/anions via a piper plot. The available groundwater quality data is compared to the applicable Ontario Drinking Water Quality Standards including aesthetic objectives for each well. Parameters that exceed the ODWQS values within an individual well were identified. Further, Mann-Kendall trend analysis was completed on the wells where exceedances were noted to detect if a trend is present. This analysis is contingent on a sample size greater than seven. For the analysis, it is noted that where only alkalinity values were available, the alkalinity values were assumed to represent the concentration of bicarbonate, and the carbonate concentration was considered to be zero. This is a reasonable assumption for natural groundwater quality when pH is in the range between 6.5 and 8.5. It is noted that the PGMN water quality dataset fell within this range. 4.0 Ambient Groundwater Characterization
4.1 Groundwater Facies Facies are identifiable parts of different nature belonging to any related system (Amadi and Egboka, 2010). Hydrogeochemical facies are distinct zones that have cation and anion concentrations describable within a defined composition category (Chenini and Khemiri, 2009). The chemical composition of groundwater is influenced by factors such as composition of precipitation, mineralogy of the aquifers, climate, topography and anthropogenic activities.As groundwater moves along its flow paths in the saturated zone, increases of total dissolved solids (TDS) and most of the major ions normally occur. Insomuch, groundwater chemistry zones can be generically subdivided into:
– Upper: active groundwater circulation, relatively weathered (leached) rocks, Ca2+ - HCO3-
dominate, low TDS • Usually not a lot of soluble minerals (like halite and gypsum) • HCO3
- dominant anion, Ca2+ commonly dominant cation, relatively low TDS (<500 mg/L)
– Intermediate: less active flow, unweathered rocks, SO42- dominant anion, Na+ increases
but Ca2+- usually still important, higher TDS – Lower: slow circulation, unweathered rocks, Na+ - Cl- dominant ions, high TDS
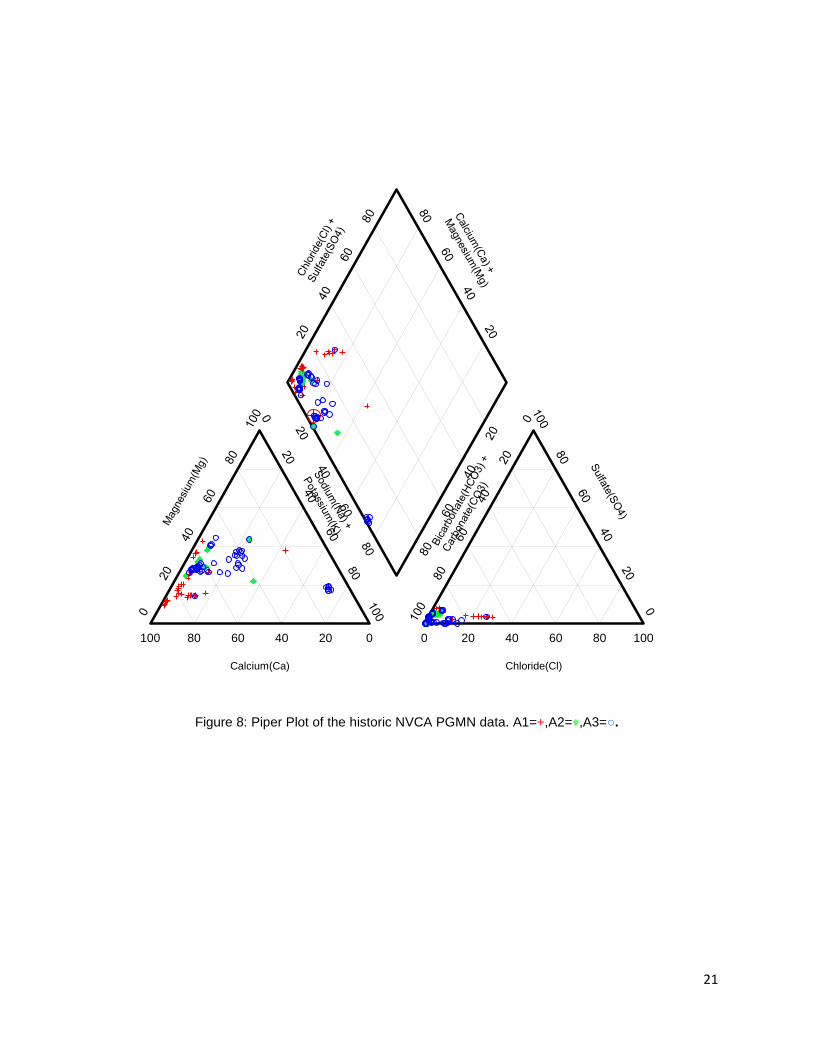
• Highly soluble minerals common (Fetter, 2001) As a natural tracer, the use of major cations and anions are a common method to delineate flow paths in aquifers in order to determine the groundwater chemistry zones or groundwater facies. This is completed by delineating the weight (meq/L) of the dominant major cation and major anion for each location. It is herein deemed that the cation/anion is dominant when the respective weight is 50% or more of the total. From this, groups of samples with similar chemical characteristics or groundwater facies can then be correlated together and the change in hydrogeochemical facies is in response to its flow path. In general, there are six fields: Ca-HCO3, Na-Cl, Ca-Mg-Cl, Ca-Na-HCO3, Ca-Cl, and Na-HCO3 (Kumar, 2013). Through the use of piper plots, relatively fresh water typically plots in the central left corner (third base) of the diamond field. Groundwater types in the other corners represent extreme conditions typically dominated by single cation or anion species. For example, the central right corner (first base) would be dominantly sodium/potassium and chloride or sulphate. The predominant groundwater facies in the NVCA is calcium-bicarbonate; secondary groundwater facies include sodium-bicarbonate and mixed-bicarbonate (Figure 8). The calcium bicarbonate facies is present in hydrostratigraphic units A1, A2, and A3 (Table 2). This groundwater facies is representative of relatively fresh water influenced by meteoric recharge water. The sodium bicarbonate facies is from W323-4, which is a deep well located on the Simcoe Uplands. The mixed-bicarbonate facies is present in
6
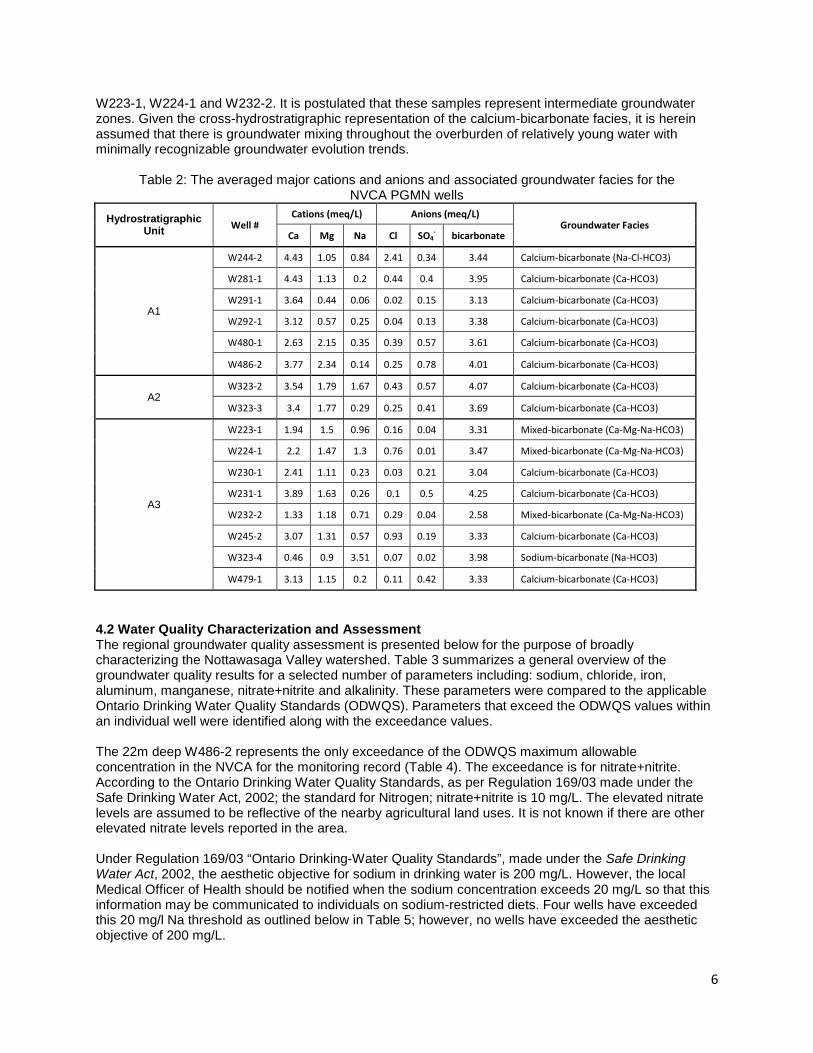
W223-1, W224-1 and W232-2. It is postulated that these samples represent intermediate groundwater zones. Given the cross-hydrostratigraphic representation of the calcium-bicarbonate facies, it is herein assumed that there is groundwater mixing throughout the overburden of relatively young water with minimally recognizable groundwater evolution trends.
Table 2: The averaged major cations and anions and associated groundwater facies for the NVCA PGMN wells
Hydrostratigraphic Unit Well #
Cations (meq/L) Anions (meq/L) Groundwater Facies
Ca Mg Na Cl SO4- bicarbonate
A1
W244-2 4.43 1.05 0.84 2.41 0.34 3.44 Calcium-bicarbonate (Na-Cl-HCO3)
W281-1 4.43 1.13 0.2 0.44 0.4 3.95 Calcium-bicarbonate (Ca-HCO3)
W291-1 3.64 0.44 0.06 0.02 0.15 3.13 Calcium-bicarbonate (Ca-HCO3)
W292-1 3.12 0.57 0.25 0.04 0.13 3.38 Calcium-bicarbonate (Ca-HCO3)
W480-1 2.63 2.15 0.35 0.39 0.57 3.61 Calcium-bicarbonate (Ca-HCO3)
W486-2 3.77 2.34 0.14 0.25 0.78 4.01 Calcium-bicarbonate (Ca-HCO3)
A2 W323-2 3.54 1.79 1.67 0.43 0.57 4.07 Calcium-bicarbonate (Ca-HCO3)
W323-3 3.4 1.77 0.29 0.25 0.41 3.69 Calcium-bicarbonate (Ca-HCO3)
A3
W223-1 1.94 1.5 0.96 0.16 0.04 3.31 Mixed-bicarbonate (Ca-Mg-Na-HCO3)
W224-1 2.2 1.47 1.3 0.76 0.01 3.47 Mixed-bicarbonate (Ca-Mg-Na-HCO3)
W230-1 2.41 1.11 0.23 0.03 0.21 3.04 Calcium-bicarbonate (Ca-HCO3)
W231-1 3.89 1.63 0.26 0.1 0.5 4.25 Calcium-bicarbonate (Ca-HCO3)
W232-2 1.33 1.18 0.71 0.29 0.04 2.58 Mixed-bicarbonate (Ca-Mg-Na-HCO3)
W245-2 3.07 1.31 0.57 0.93 0.19 3.33 Calcium-bicarbonate (Ca-HCO3)
W323-4 0.46 0.9 3.51 0.07 0.02 3.98 Sodium-bicarbonate (Na-HCO3)
W479-1 3.13 1.15 0.2 0.11 0.42 3.33 Calcium-bicarbonate (Ca-HCO3)
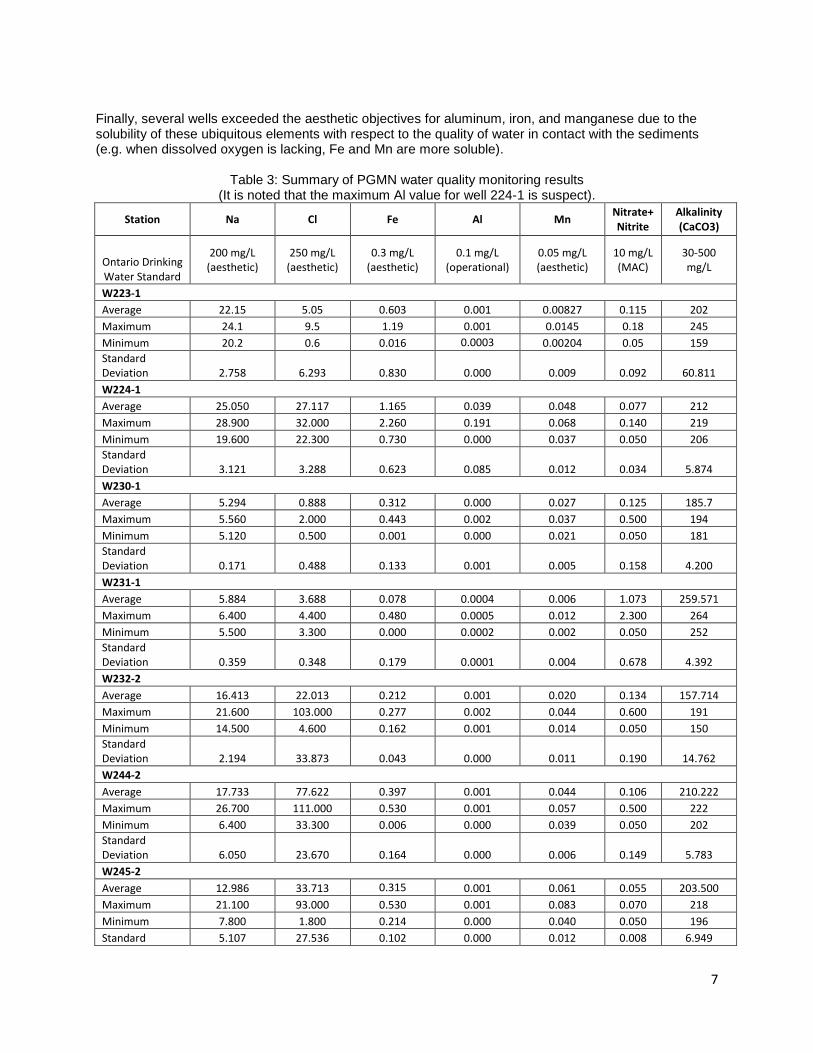
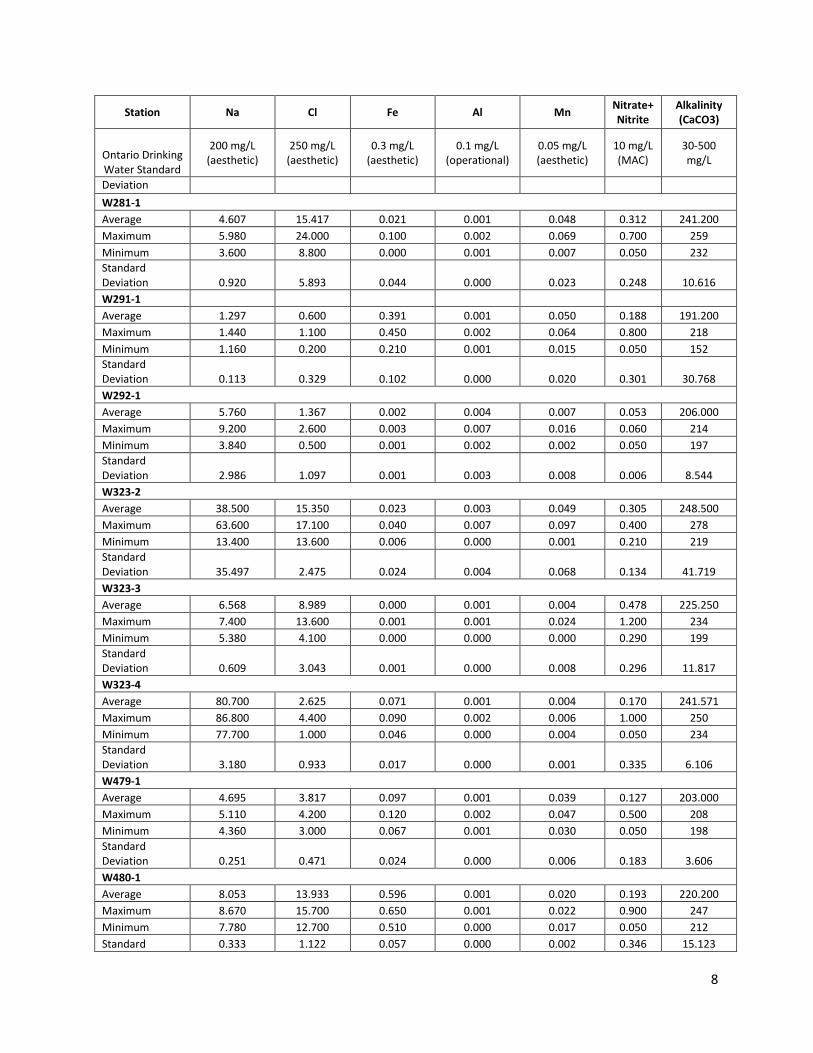
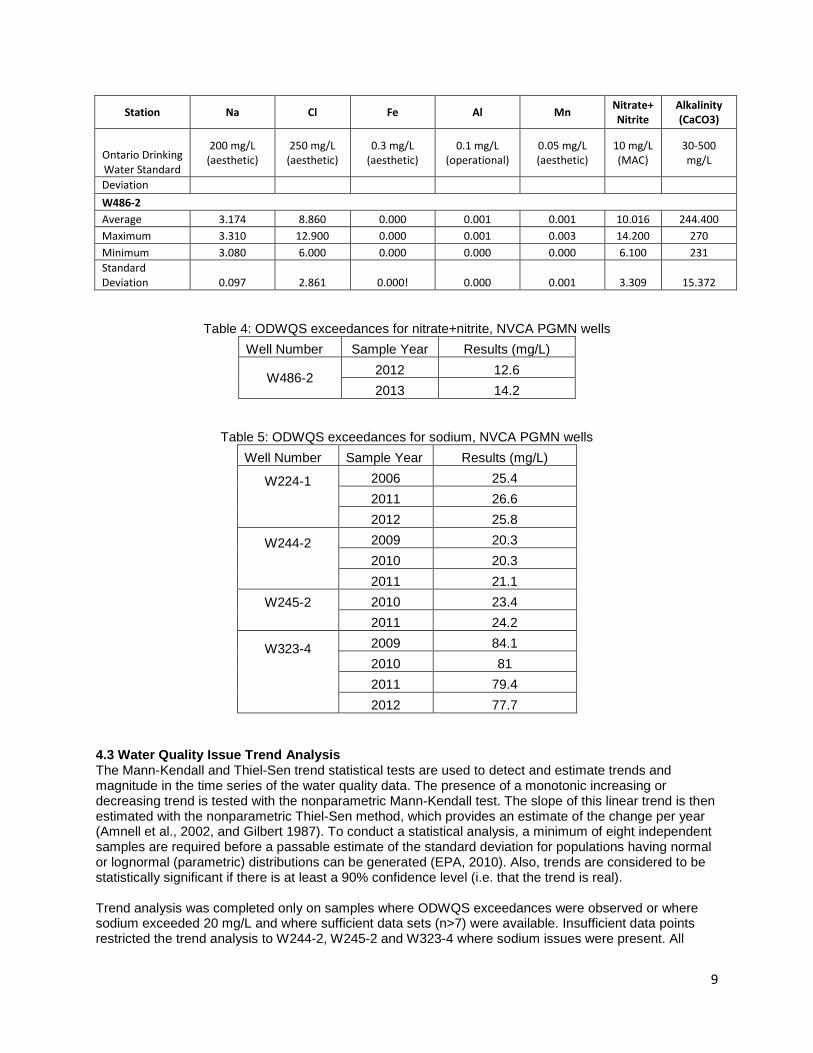
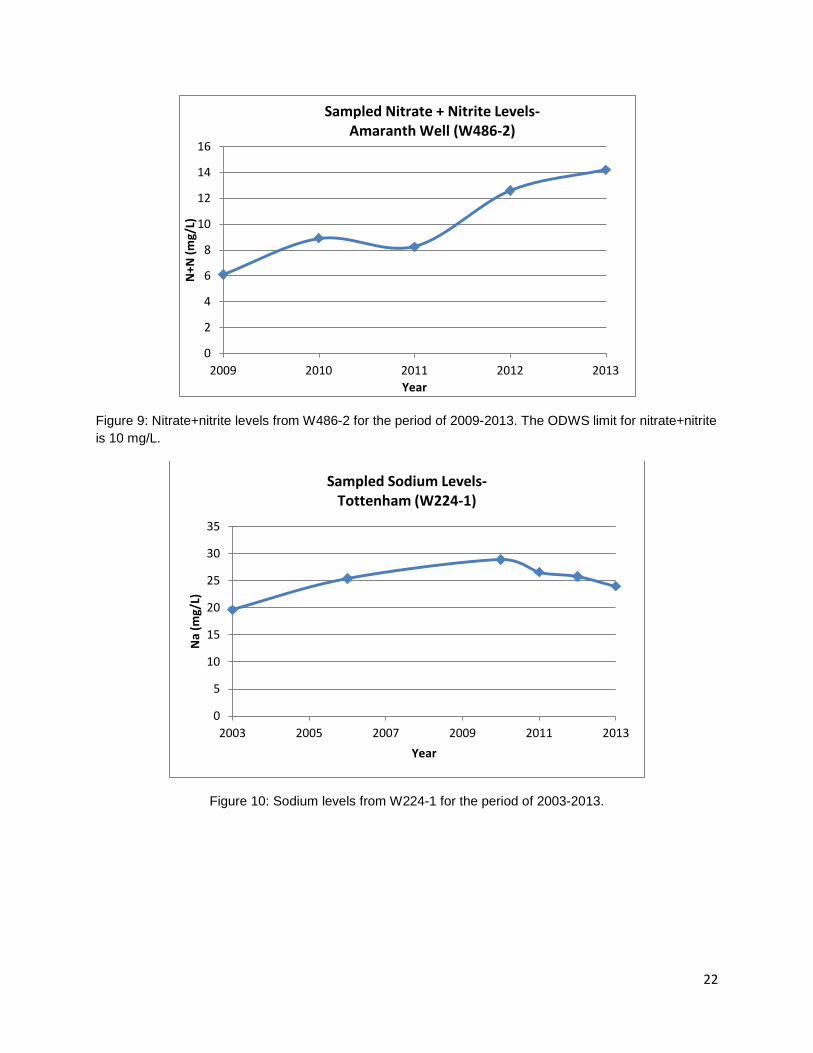
4.2 Water Quality Characterization and Assessment The regional groundwater quality assessment is presented below for the purpose of broadly characterizing the Nottawasaga Valley watershed. Table 3 summarizes a general overview of the groundwater quality results for a selected number of parameters including: sodium, chloride, iron, aluminum, manganese, nitrate+nitrite and alkalinity. These parameters were compared to the applicable Ontario Drinking Water Quality Standards (ODWQS). Parameters that exceed the ODWQS values within an individual well were identified along with the exceedance values. The 22m deep W486-2 represents the only exceedance of the ODWQS maximum allowable concentration in the NVCA for the monitoring record (Table 4). The exceedance is for nitrate+nitrite. According to the Ontario Drinking Water Quality Standards, as per Regulation 169/03 made under the Safe Drinking Water Act, 2002; the standard for Nitrogen; nitrate+nitrite is 10 mg/L. The elevated nitrate levels are assumed to be reflective of the nearby agricultural land uses. It is not known if there are other elevated nitrate levels reported in the area. Under Regulation 169/03 “Ontario Drinking-Water Quality Standards”, made under the Safe Drinking Water Act, 2002, the aesthetic objective for sodium in drinking water is 200 mg/L. However, the local Medical Officer of Health should be notified when the sodium concentration exceeds 20 mg/L so that this information may be communicated to individuals on sodium-restricted diets. Four wells have exceeded this 20 mg/l Na threshold as outlined below in Table 5; however, no wells have exceeded the aesthetic objective of 200 mg/L.
7
Finally, several wells exceeded the aesthetic objectives for aluminum, iron, and manganese due to the solubility of these ubiquitous elements with respect to the quality of water in contact with the sediments (e.g. when dissolved oxygen is lacking, Fe and Mn are more soluble).
Table 3: Summary of PGMN water quality monitoring results (It is noted that the maximum Al value for well 224-1 is suspect).
Station Na Cl Fe Al Mn Nitrate+Nitrite
Alkalinity (CaCO3)
Ontario Drinking Water Standard
200 mg/L (aesthetic)
250 mg/L (aesthetic)
0.3 mg/L (aesthetic)
0.1 mg/L (operational)
0.05 mg/L (aesthetic)
10 mg/L (MAC)
30-500 mg/L
W223-1 Average 22.15 5.05 0.603 0.001 0.00827 0.115 202 Maximum 24.1 9.5 1.19 0.001 0.0145 0.18 245 Minimum 20.2 0.6 0.016 0.0003 0.00204 0.05 159 Standard Deviation 2.758 6.293 0.830 0.000 0.009 0.092 60.811 W224-1 Average 25.050 27.117 1.165 0.039 0.048 0.077 212 Maximum 28.900 32.000 2.260 0.191 0.068 0.140 219 Minimum 19.600 22.300 0.730 0.000 0.037 0.050 206 Standard Deviation 3.121 3.288 0.623 0.085 0.012 0.034 5.874 W230-1 Average 5.294 0.888 0.312 0.000 0.027 0.125 185.7 Maximum 5.560 2.000 0.443 0.002 0.037 0.500 194 Minimum 5.120 0.500 0.001 0.000 0.021 0.050 181 Standard Deviation 0.171 0.488 0.133 0.001 0.005 0.158 4.200 W231-1 Average 5.884 3.688 0.078 0.0004 0.006 1.073 259.571 Maximum 6.400 4.400 0.480 0.0005 0.012 2.300 264 Minimum 5.500 3.300 0.000 0.0002 0.002 0.050 252 Standard Deviation 0.359 0.348 0.179 0.0001 0.004 0.678 4.392 W232-2 Average 16.413 22.013 0.212 0.001 0.020 0.134 157.714 Maximum 21.600 103.000 0.277 0.002 0.044 0.600 191 Minimum 14.500 4.600 0.162 0.001 0.014 0.050 150 Standard Deviation 2.194 33.873 0.043 0.000 0.011 0.190 14.762 W244-2 Average 17.733 77.622 0.397 0.001 0.044 0.106 210.222 Maximum 26.700 111.000 0.530 0.001 0.057 0.500 222 Minimum 6.400 33.300 0.006 0.000 0.039 0.050 202 Standard Deviation 6.050 23.670 0.164 0.000 0.006 0.149 5.783 W245-2 Average 12.986 33.713 0.315 0.001 0.061 0.055 203.500 Maximum 21.100 93.000 0.530 0.001 0.083 0.070 218 Minimum 7.800 1.800 0.214 0.000 0.040 0.050 196 Standard 5.107 27.536 0.102 0.000 0.012 0.008 6.949
8
Station Na Cl Fe Al Mn Nitrate+Nitrite
Alkalinity (CaCO3)
Ontario Drinking Water Standard
200 mg/L (aesthetic)
250 mg/L (aesthetic)
0.3 mg/L (aesthetic)
0.1 mg/L (operational)
0.05 mg/L (aesthetic)
10 mg/L (MAC)
30-500 mg/L
Deviation W281-1 Average 4.607 15.417 0.021 0.001 0.048 0.312 241.200 Maximum 5.980 24.000 0.100 0.002 0.069 0.700 259 Minimum 3.600 8.800 0.000 0.001 0.007 0.050 232 Standard Deviation 0.920 5.893 0.044 0.000 0.023 0.248 10.616 W291-1 Average 1.297 0.600 0.391 0.001 0.050 0.188 191.200 Maximum 1.440 1.100 0.450 0.002 0.064 0.800 218 Minimum 1.160 0.200 0.210 0.001 0.015 0.050 152 Standard Deviation 0.113 0.329 0.102 0.000 0.020 0.301 30.768 W292-1 Average 5.760 1.367 0.002 0.004 0.007 0.053 206.000 Maximum 9.200 2.600 0.003 0.007 0.016 0.060 214 Minimum 3.840 0.500 0.001 0.002 0.002 0.050 197 Standard Deviation 2.986 1.097 0.001 0.003 0.008 0.006 8.544 W323-2 Average 38.500 15.350 0.023 0.003 0.049 0.305 248.500 Maximum 63.600 17.100 0.040 0.007 0.097 0.400 278 Minimum 13.400 13.600 0.006 0.000 0.001 0.210 219 Standard Deviation 35.497 2.475 0.024 0.004 0.068 0.134 41.719 W323-3 Average 6.568 8.989 0.000 0.001 0.004 0.478 225.250 Maximum 7.400 13.600 0.001 0.001 0.024 1.200 234 Minimum 5.380 4.100 0.000 0.000 0.000 0.290 199 Standard Deviation 0.609 3.043 0.001 0.000 0.008 0.296 11.817 W323-4 Average 80.700 2.625 0.071 0.001 0.004 0.170 241.571 Maximum 86.800 4.400 0.090 0.002 0.006 1.000 250 Minimum 77.700 1.000 0.046 0.000 0.004 0.050 234 Standard Deviation 3.180 0.933 0.017 0.000 0.001 0.335 6.106 W479-1 Average 4.695 3.817 0.097 0.001 0.039 0.127 203.000 Maximum 5.110 4.200 0.120 0.002 0.047 0.500 208 Minimum 4.360 3.000 0.067 0.001 0.030 0.050 198 Standard Deviation 0.251 0.471 0.024 0.000 0.006 0.183 3.606 W480-1 Average 8.053 13.933 0.596 0.001 0.020 0.193 220.200 Maximum 8.670 15.700 0.650 0.001 0.022 0.900 247 Minimum 7.780 12.700 0.510 0.000 0.017 0.050 212 Standard 0.333 1.122 0.057 0.000 0.002 0.346 15.123
9
Station Na Cl Fe Al Mn Nitrate+Nitrite
Alkalinity (CaCO3)
Ontario Drinking Water Standard
200 mg/L (aesthetic)
250 mg/L (aesthetic)
0.3 mg/L (aesthetic)
0.1 mg/L (operational)
0.05 mg/L (aesthetic)
10 mg/L (MAC)
30-500 mg/L
Deviation W486-2 Average 3.174 8.860 0.000 0.001 0.001 10.016 244.400 Maximum 3.310 12.900 0.000 0.001 0.003 14.200 270 Minimum 3.080 6.000 0.000 0.000 0.000 6.100 231 Standard Deviation 0.097 2.861 0.000! 0.000 0.001 3.309 15.372
Table 4: ODWQS exceedances for nitrate+nitrite, NVCA PGMN wells Well Number Sample Year Results (mg/L)
W486-2 2012 12.6 2013 14.2
Table 5: ODWQS exceedances for sodium, NVCA PGMN wells Well Number Sample Year Results (mg/L)
W224-1
2006 25.4 2011 26.6 2012 25.8
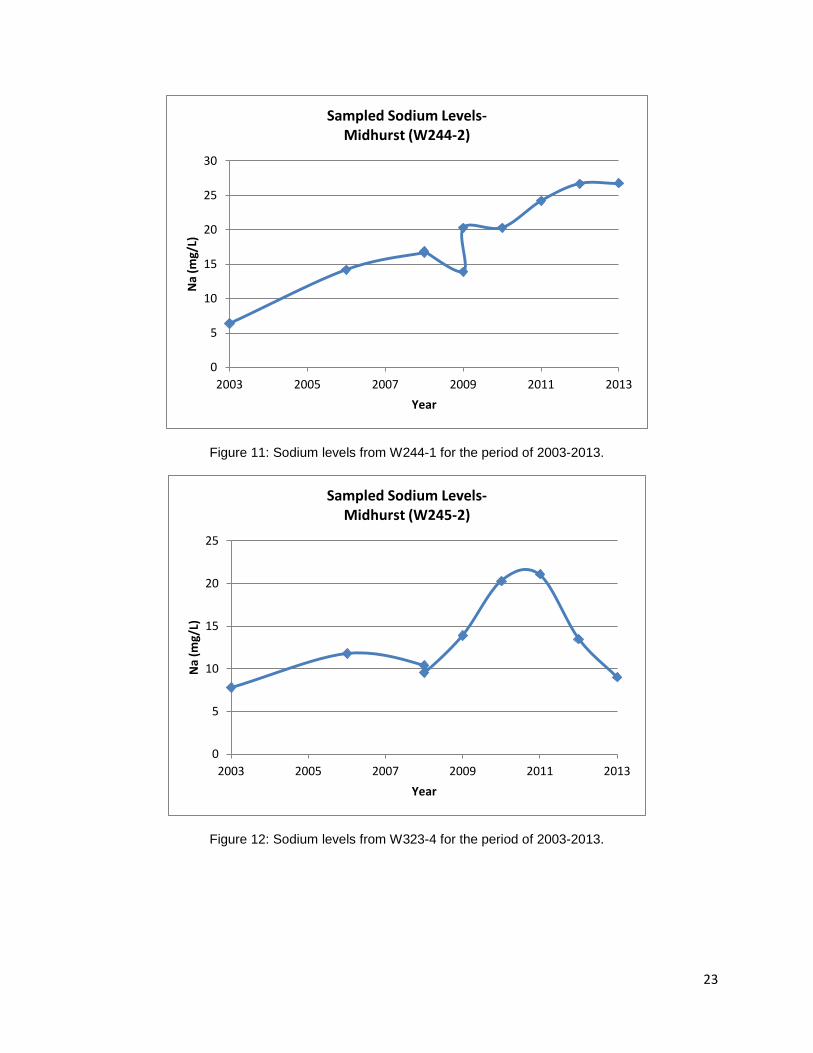
W244-2
2009 20.3 2010 20.3 2011 21.1
W245-2
2010 23.4 2011 24.2
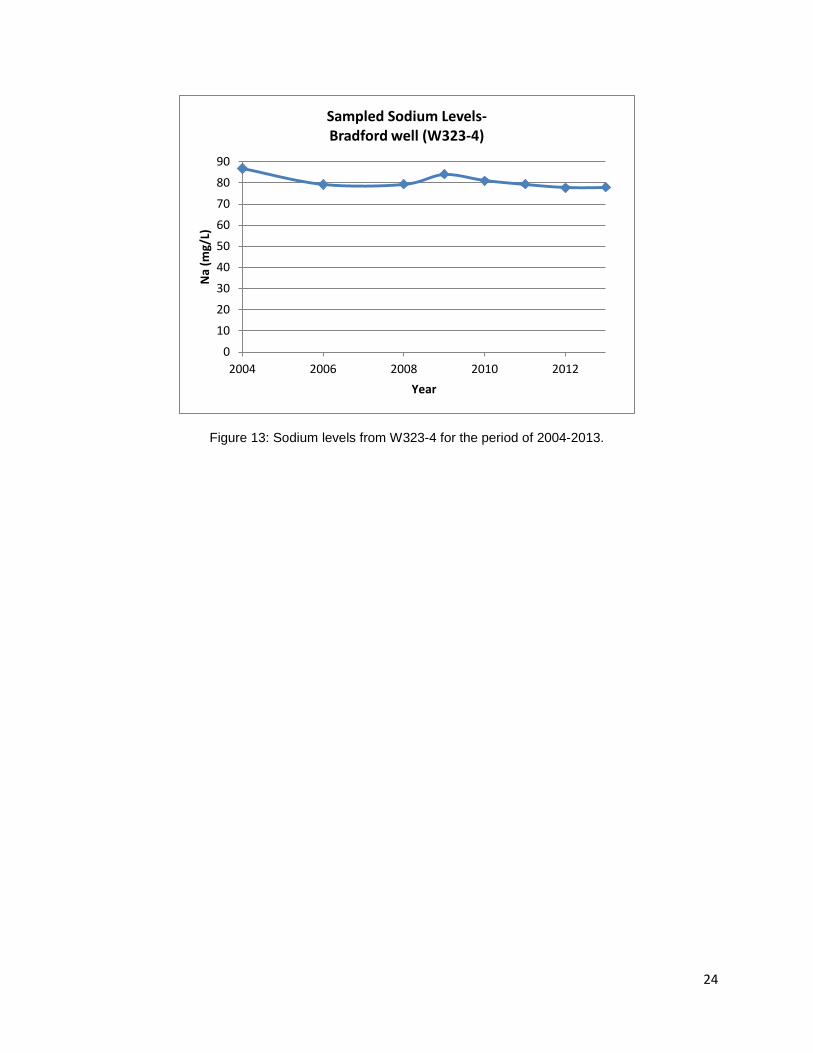
W323-4
2009 84.1 2010 81 2011 79.4 2012 77.7
4.3 Water Quality Issue Trend Analysis The Mann-Kendall and Thiel-Sen trend statistical tests are used to detect and estimate trends and magnitude in the time series of the water quality data. The presence of a monotonic increasing or decreasing trend is tested with the nonparametric Mann-Kendall test. The slope of this linear trend is then estimated with the nonparametric Thiel-Sen method, which provides an estimate of the change per year (Amnell et al., 2002, and Gilbert 1987). To conduct a statistical analysis, a minimum of eight independent samples are required before a passable estimate of the standard deviation for populations having normal or lognormal (parametric) distributions can be generated (EPA, 2010). Also, trends are considered to be statistically significant if there is at least a 90% confidence level (i.e. that the trend is real). Trend analysis was completed only on samples where ODWQS exceedances were observed or where sodium exceeded 20 mg/L and where sufficient data sets (n>7) were available. Insufficient data points restricted the trend analysis to W244-2, W245-2 and W323-4 where sodium issues were present. All
10
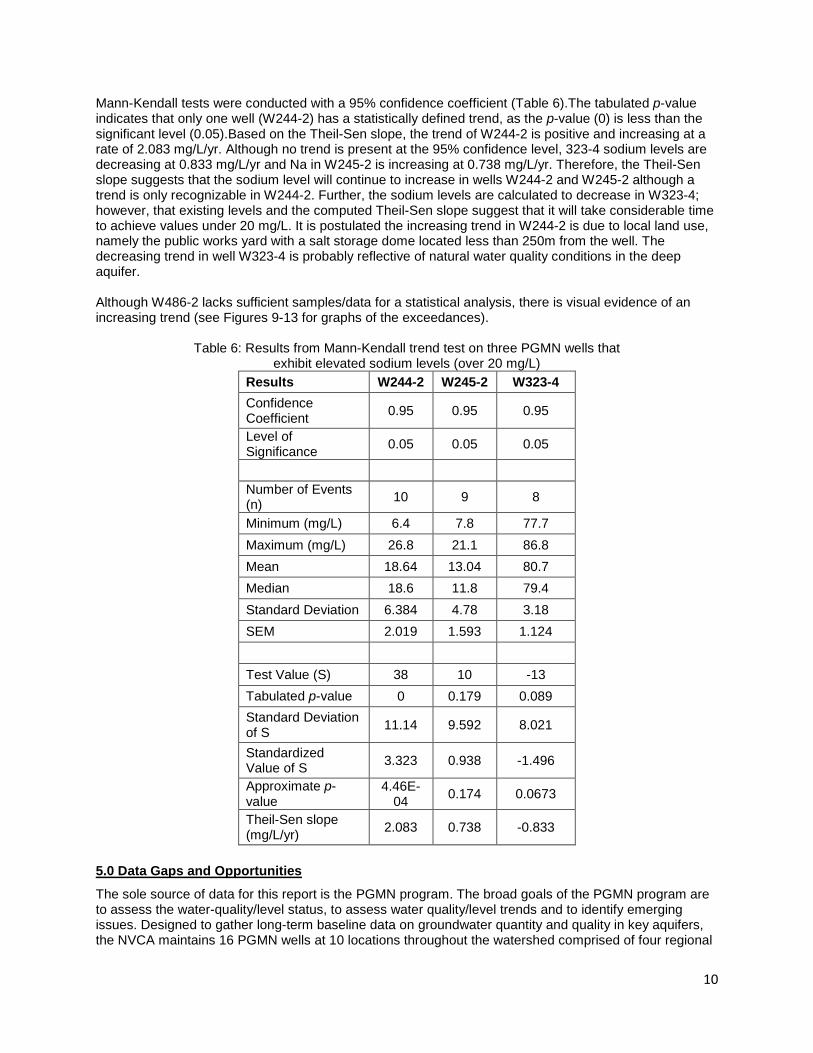
Mann-Kendall tests were conducted with a 95% confidence coefficient (Table 6).The tabulated p-value indicates that only one well (W244-2) has a statistically defined trend, as the p-value (0) is less than the significant level (0.05).Based on the Theil-Sen slope, the trend of W244-2 is positive and increasing at a rate of 2.083 mg/L/yr. Although no trend is present at the 95% confidence level, 323-4 sodium levels are decreasing at 0.833 mg/L/yr and Na in W245-2 is increasing at 0.738 mg/L/yr. Therefore, the Theil-Sen slope suggests that the sodium level will continue to increase in wells W244-2 and W245-2 although a trend is only recognizable in W244-2. Further, the sodium levels are calculated to decrease in W323-4; however, that existing levels and the computed Theil-Sen slope suggest that it will take considerable time to achieve values under 20 mg/L. It is postulated the increasing trend in W244-2 is due to local land use, namely the public works yard with a salt storage dome located less than 250m from the well. The decreasing trend in well W323-4 is probably reflective of natural water quality conditions in the deep aquifer. Although W486-2 lacks sufficient samples/data for a statistical analysis, there is visual evidence of an increasing trend (see Figures 9-13 for graphs of the exceedances).
Table 6: Results from Mann-Kendall trend test on three PGMN wells that exhibit elevated sodium levels (over 20 mg/L)
Results W244-2 W245-2 W323-4 Confidence Coefficient 0.95 0.95 0.95
Level of Significance 0.05 0.05 0.05
Number of Events (n) 10 9 8
Minimum (mg/L) 6.4 7.8 77.7 Maximum (mg/L) 26.8 21.1 86.8 Mean 18.64 13.04 80.7 Median 18.6 11.8 79.4 Standard Deviation 6.384 4.78 3.18 SEM 2.019 1.593 1.124
Test Value (S) 38 10 -13 Tabulated p-value 0 0.179 0.089 Standard Deviation of S 11.14 9.592 8.021
Standardized Value of S 3.323 0.938 -1.496
Approximate p-value
4.46E-04 0.174 0.0673
Theil-Sen slope (mg/L/yr) 2.083 0.738 -0.833
5.0 Data Gaps and Opportunities
The sole source of data for this report is the PGMN program. The broad goals of the PGMN program are to assess the water-quality/level status, to assess water quality/level trends and to identify emerging issues. Designed to gather long-term baseline data on groundwater quantity and quality in key aquifers, the NVCA maintains 16 PGMN wells at 10 locations throughout the watershed comprised of four regional
11
aquifers. This distribution requires infilling to provide a more comprehensive characterization of groundwater quality on a regional, 3D hydrostratigraphic scale. Additional groundwater quality data is available from the Simcoe and Dufferin counties' landfill sites. It is understood that background monitoring wells have been added to this monitoring network over time; however, the location and the associated datasets (parameters, time series length, number of samples analyzed) are unknown. Further, various lower tiered municipalities throughout the NVCA watershed may have individual monitoring networks with background monitoring wells. Similar to the landfill wells, the location and associated datasets for these networks is presently unknown. Agencies are presently faced with an interesting and challenging situation where advancing technologies (e.g. monitoring equipment, data processing power and new technology) are coupled with a shrinking monitoring budget and ever-increasing demands on groundwater resources. There is an opportunity, through a collaborative approach with member municipalities and counties, to collect long-term water resources data, cultivate effective management of the data and promote easy access to data and information. This could be completed by establishing a single, consistent database and analysis toolkit for hosting and working with the groundwater quality data for this type of assessment, e.g. CUASHI or ArcHydroGroundwater for agencies within the NVCA jurisdiction. Some benefits that could be realized from adopting a similar process would be:
1. Reduced effort for updates to this analysis process (following an initial set-up process). 2. Consistency of data storage and general preparedness for automated analysis (over the current
process of amalgamating and updating spreadsheet data) to determine statistics and trends. 3. Availability of automated routines for filtering, querying, and reporting from the data set. This
would include greater flexibility and ease in preparing data sets that are directly related to spatial locations and also to the physical information (locations, depths, and aquifer types) associated with the well intake.
4. Ability to provide more detailed statistics and analysis on subsets of the overall data sets. 5. Ability to use GIS tools directly to create spatial plots of individuals parameters, and other data
presented in the entire datasets (including analysis products). 6. A likelihood of improved data quality, particularly if a quality control step is included in the
process to upload raw data from the sources to the database. 6.0 Conclusion
This report should be considered a starting point for a long-term initiative to better understand and monitor ambient groundwater quality. This understanding can be built upon and improved through a coordinated program/approach with partnering agencies to expand the available groundwater quality data to better reflect the groundwater used as a drinking water source in the NVCA and also to illustrate the evolution of groundwater quality along the typical flowpaths within the watershed or subwatershed that govern groundwater movement. The following conclusions are provided: The predominant groundwater facies is calcium-carbonate present in aquifers A1, A2 and A3, representative of relatively fresh water influenced by meteoric recharge water. Secondary groundwater facies include sodium-bicarbonate facies limitedly present in W323-4 (A3) and the mixed-bicarbonate facies present in wells W223-1, W224-1 and W232-2 (collectively unit A3). Given the cross-hydrostratigraphic representation of the calcium-carbonate facies, it is assumed that there is groundwater mixing throughout the stratigraphy of relatively young water with minimally recognizable groundwater evolution trends and possibly to faster groundwater travel times. Several wells exceeded the aesthetic objectives for aluminum, iron and manganese. These exceedances are attributed to natural background levels. Sodium levels in wellsW223-1, W224-1, W232-2 and W323-4 were above the guideline of 20 mg/L for those on a sodium-restricted diet but below the 200 mg/L (aesthetic objective). Trend analysis of the exceeded parameters per well where enough data is available indicates that one well has a statistically definable increasing sodium level (W244-2), while no trend is defined in well W245-2 and W323-4.
12
The limited hydrostratigraphic and the geographic distribution of the NVCA PGMN network is recognized, resulting in a limited understanding of the location and extent of groundwater issues, although it could be argued that the groundwater quality in the NVCA, based exclusively on the PGMN data, is good. The sole data source for this report is generated from the NVCA PGMN 16 monitoring wells at 10 locations throughout the watershed comprised of four regional aquifers. This distribution requires infilling to provide a more comprehensive characterization of groundwater quality on a regional, 3D hydrostratigraphic scale. Given the limited spatial distribution of the wells, there is an opportunity through a collaborative approach to collect, manage and analyze integrated groundwater resource data. This could be completed by establishing a single, consistent database and analysis toolkit for hosting and working with the groundwater quality data for this type of assessment in order to provide a more robust analysis of regional groundwater quality.
13
7.0 References
Amadi P.A. and Egboka B.C.E. 2010.The use of Anion Geochemistry I Mapping Groundwater in the Port Harcourt Area of the Niger Delta, Nigeria. Global Journal of Geological Sciences, 8(2), 155-166.
Amnell, T., Anttila, P., Maatta, A. R.-A., and Salmi, T. 2002.Detecting Trends of Annual Values of
Atmospheric Pollutants by the Mann-Kendall Test and Sen's Slope Estimates. Helsinki: Finnish Meteorological Institute.
Chapman, J.L. and Putman, D.F., 1984. The Physiography of Southern Ontario; Ontario Geological
Survey, Special Volume 2, Ontario. Chenini I. and Khemiri S. 2009.Evaluation of groundwater quality using multiple linear regression and
structural equation modeling, Int. J. Environ. Sci. Tech, 6(3), 509-519. EPA. 2010. ProUCL Software Documentation. Retrieved March 11, 2013, from EPA:
http://www.epa.gov/osp/hstl/tsc/softwaredocs.htm. Fetter, C.W. 2001. Applied Hydrogeology, 4th edition. Prentice Hall, New Jersey, 598 pages. Gilbert, R. 1987. Statistical Methods for Environmental Pollution Monitoring. New York: John Wiley and
Sons. Golder Associates, 2004.South Simcoe Municipal Groundwater Study. Kumar, P.J. S. 2013. Interpretation of groundwater chemistry using piper and chadha's diagrams: a
comparative study from perambalurtaluk. Elixir Geoscience 54:12208-12211. Available at: http://www.elixirpublishers.com/articles/1358425360_54%20(2013)%2012208-12211.pdf
Ministry of the Environment, Environmental Monitoring and Reporting Branch, 2009, Provincial
Groundwater Monitoring Network Protocol - A Guide to the Collection and Submission of Groundwater Samples for Analysis (revised), Toronto, Ontario.
Singer, S.N., Cheng, C.K., and Scafe, M.G., 1997. The Hydrogeology of Southern Ontario; Ministry of the
Environment and Energy. Toronto, Ontario, 1997, 143 p. South Georgian Bay-Lake Simcoe Source Protection Committee. 2011. Approved Assessment Report:
Nottawasaga Valley Source Protection Area.
14
Figure 1: Location of the NVCA Provincial Groundwater Monitoring Wells.
15
Figure 2: North-south cross section of the NVCA watershed (South Georgian Bay-Lake Simcoe Source Protection Committee, 2011).
16
Figure 3: East-west cross-section of the NVCA watershed (South Georgian Bay-Lake Simcoe Source Protection Committee, 2011).
17
Figure 4: Distribution and aquifer thickness (m) of Aquifer 1 and corresponding PGMN wells.
18
Figure 5: Distribution and aquifer thickness (m) of Aquifer 2 and corresponding PGMN wells.
19
Figure 6: Distribution and aquifer thickness (m) of Aquifer 3 and corresponding PGMN wells.
20
Figure 7: Distribution and aquifer thickness (m) of Aquifer 4 and corresponding PGMN wells.
21
Figure 8: Piper Plot of the historic NVCA PGMN data. A1=+,A2=♦,A3=○.
Calcium(Ca) Chloride(Cl)
100 80 60 40 20 0 0 20 40 60 80 100
22
Figure 9: Nitrate+nitrite levels from W486-2 for the period of 2009-2013. The ODWS limit for nitrate+nitrite is 10 mg/L.
Figure 10: Sodium levels from W224-1 for the period of 2003-2013.
0
2
4
6
8
10
12
14
16
2009 2010 2011 2012 2013
N+N
(mg/
L)
Year
Sampled Nitrate + Nitrite Levels- Amaranth Well (W486-2)
0
5
10
15
20
25
30
35
2003 2005 2007 2009 2011 2013
Na
(mg/
L)
Year
Sampled Sodium Levels- Tottenham (W224-1)
23
Figure 11: Sodium levels from W244-1 for the period of 2003-2013.
Figure 12: Sodium levels from W323-4 for the period of 2003-2013.
0
5
10
15
20
25
30
2003 2005 2007 2009 2011 2013
Na
(mg/
L)
Year
Sampled Sodium Levels- Midhurst (W244-2)
0
5
10
15
20
25
2003 2005 2007 2009 2011 2013
Na
(mg/
L)
Year
Sampled Sodium Levels- Midhurst (W245-2)
24
Figure 13: Sodium levels from W323-4 for the period of 2004-2013.
0
10
20
30
40
50
60
70
80
90
2004 2006 2008 2010 2012
Na
(mg/
L)
Year
Sampled Sodium Levels- Bradford well (W323-4)
25
Appendix A- Sampled parameters for initial and routine/annual PGMN water quality sampling.
Type PGMN Routine
Type PGMN Initial Product LaSB
Grouping PGMN description
Y Y ANION3172 GenChem fluoride / sulphate by IC Y N BROMIDE3462 Bromide bromide analysis
N Y CAPH3501 Pesticides carbamates + phenol ureas in water (DAI) Y Y CAT3497 GenChem cations - trace levels in water (ICP/AES)
Y Y CL3016 GenChem chloride by colourimetry N Y CPA3119 Pesticides chlorophenol/phenoxy acid in water
Y Y DCSI3370 GenChem dissolved carbons (DIC/DOC) - silicates
Y Y DISNUT3364 GenChem dissolved nutrients
Y Y DS3188 GenChem solids; dissolved only N Y GLY3500 Pesticides glyphosate in water (DAI) Y N IBC3196 GenChem ion balance calculation, anions, cations, conductivity
estimated, solids; dissolved estimated (calculation only, no sample analysis)
Y N LIC3274 GenChem langeliers index calculation, saturation ph estimated (calculation only, no sample analysis)
Y Y MET3474 Metals metals - ultra trace levels by ICP/MS
N Y OCS3400 Pesticides OC/SBs in water N Y OPS3502 Pesticides OPs in water (DAI)
Y Y PHALCO3218 GenChem pH, alk, cond in water & wastewater
N Y PHEN3179 Phenols phenolics; 4AAP reactive N Y QUAT3503 Pesticides quaternary ammonium pesticides in water Y Y TOTNUT3367 GenChem total phosphorus - Kjeldahl nitrogen
N Y TRI3435 Pesticides triazine pesticides in water
N Y VOL3144 VOCs volatiles in water by PT-GC/FID