quantitative study on access to internet services market
TRANSCRIPT

THE GALLUP ORGANIZATIONROMANIA
Quantitative Study on Access to Internet Services Market
•• PopulationPopulation Sample Sample ••
Report on behalf of:
November 2006

2THE GALLUP ORGANIZATIONROMANIA
TABLE OF CONTENTS
General frameworkand objectives p. 3
Research methodology p. 4
Social and demographic profile of the sample p. 6
RESEARCH REPORT
I. Size of the Romanian Internet access market p. 9
II. Awareness of the main Internet access connections types p. 17
III. Internet access market structure depending on the connection type used p. 20
IV. Internet usage habits p. 33
V. Expenses related to Internet access services p . 43
VI. Dial-up Internet access connections market p. 48
a. Dial-up access connections types and usage levels p. 49
b. Level of satisfaction with the providers of dial-up Internet access services p. 58
c. Intentions to change the providers or the types of Internet dial-up accessconnections- p. 67
VII. Dedicated Internet access connections market p. 78
a. Types of dedicated access connections used and usage level p. 79
b. Level of satisfaction with the providers of dedicated Internet access p. 94
c. Intentions to change the providers or types of dedicated Internet accessconnections p. 105
VIII. Existence of previous connections in the household p. 114
IX. Intention to purchase a new Internet access connection p. 124
X. Profile -Internet users vs. non-users p. 132
3THE GALLUP ORGANIZATIONROMANIA
GENERAL FRAMEWORK AND OBJECTIVES
During the period October 2006 – January 2007, The Gallup Organization România conducted a research which is part of ANRC’s (National Regulatory Authority for Communications) objective to monitor tendencies in the behavior related to the use of Internet access services, in order to analyze the changes occurring in the structure and operation of specific relevant retail markets identified by ANRC.
The object of this research was:
level of penetration of Internet access services at the level of population and households
used providers of Internet access services and barriers to/reasons for changing the provider
used services of fixed Internet access and criteria applied for the selection thereof
average monthly expenses related to these services
level of awareness of Internet access services
domains and habits related to the use of Internet services
level of satisfaction with the Internet access services used; reasons for not using these services and substitute electronic
communication services
intention to change the services used – connection type, band width, reasons
reaction to the increase in prices and tariffs

4THE GALLUP ORGANIZATIONROMANIA
RESEARCH METHODOLOGY
Research target group: population over the age of 16.
Poll unit: household members selected based on Kish sampling (representative sample) and user of Internet in the household, for the users sample.
Sample size: 10929 people for the representative sample and 1351 people – Internet users in the household.
Sample type: probabilistic, stratified sample
Sampling: representative sample selected based on two stratification criteria: regional development areas and type of settlement. Regional development areas consist of counties belonging to the same geographic region and having a similar economic and social development level. According to the sampling methodology used by Gallup, 18 such development areas are taken into consideration. There are 8 types of settlements: developed communes, medium developed commune, poorly developed communes, towns with a population under 50 thousand, towns with a population between 50 and 100 thousand, cities with a population between 100 and 200 thousand, cities with a population over 200 thousand (including Bucharest). The households were selected randomly, the people in the households were selected based on Kish sampling and the selection questionnaire.
The interviews were conducted face-to-face, at the respondents’ domicile.
Field study: October 26 – November 8, 2006

5THE GALLUP ORGANIZATIONROMANIA
A population representative sample was established for this research and, based on its filtration, the final sample of Internet services users was obtained. The representative sample was used to obtain data related to the penetration of the Internet at the level of the total target group. The users sample was used to obtain data providing answers to the other study objectives.
The interviews were conducted at the respondents’ domicile, based on a standardized questionnaire applied by the interview operators who received special training for this purpose.
Response rate for eligible persons (who meet the sampling conditions):
This report, in a graphical format, presents the main results of this study.
1 35192%
Valid main questionnairesRate of response to the main questionnaire
119- refusal to answer the main questionnaire
1 470Eligible persons
9 28312848
of which : - no Internet in the household- the respondent does not know, refuses to answer- the respondent does not use the Internet in the household
10 929Valid recruitment questionnaires
RESEARCH METHODOLOGY

6THE GALLUP ORGANIZATIONROMANIA
SOCIAL AND DEMOGRAPHIC PROFILE OF THE SAMPLE
(N=10929)Gender % Occupation %
Male 45.2 DNK 0.9Female 54.8 Business (Co-) Owner 1.8
Free lance Professional 1.6Manager / Director 1.0
Age % Engineer, doctor, architect, professor, economist,etc 5.7DNK 0.8 Public Administration 2.616-24 12.3 Technical staff, assistant, school teacher etc 3.725-34 14.3 Skilled Worker 13.335-44 15.5 Non-skilled Worker 2.745-54 16.8 Housewife 11.055-64 16.7 Maternity leave 0.865-74 15.0 Retired 39.275+ 8.7 Student 7.7
Unemployed 2.4Other 5.5
Marital Status %DNK 0.8 Household Size %Married 63.3 DNK 0.4Single 18.7 1 person 11.6Widowed / divorced 17.2 2 persons 33.1
3 persons 23.14 persons 18.0
Education (last graduated level % 5+ persons 13.9DNK 0.8Primary school 11.2 Household Income per Person %Secondary school(5-8 grades) 19.4 DNK 11.7Crafts school 15.1 100 RON or less 13.8
10 grades (under high school level) 8.0 101-200 RON 22.3High school 26.4 201-300 RON 18.7Technical undergraduate school 7.4 301-400 RON 12.0University degree 11.7 401-600 RON 12.3
Over 600 RON 9.1

7THE GALLUP ORGANIZATIONROMANIA
SOCIAL AND DEMOGRAPHIC PROFILE OF THE SAMPLE
(N=10929)
Development Areas % Type of Location %NORTH-EAST 16.6 Village, town 47.6SOUTH-EAST 12.8 City under 30 thousand inhabitants 12.1SOUTH 15.5 City between 30-99 thousand inhabitants 11.4SOUTH-WEST 10.7 City between 100-199 thousand inhabitants 8.0WEST 9.3 City over 200 thousand inhabitants 12.0
NORTH-WEST 13.1 Bucharest 8.8CENTRE 11.5BUCHAREST (+ Ilfov county) 10.4

RESEARCH REPORT

I. Size of the Romanian Internet access market

10THE GALLUP ORGANIZATIONROMANIA
Size of the Romanian Internet access market
21% of the people aged over 16 stated that they had used the Internet during the past 6 months. The Internetusage level is higher in the urban areas (34%) and lower in the rural areas (7%). Extrapolating at the level of the entire target group, this means that 3,962,986 people aged over 16 used the Internet during the past 6 months.
Regarding the level of penetration of Internet access services at the household level, 14% of the respondents stated that there is at least one Internet connection in their household, i.e. approximately 1,052,000 households in Romania are connected to the Internet. In the urban areas, approximately one household out of 4 has an Internetconnection, while in the rural areas only 3% of the households use this facility.
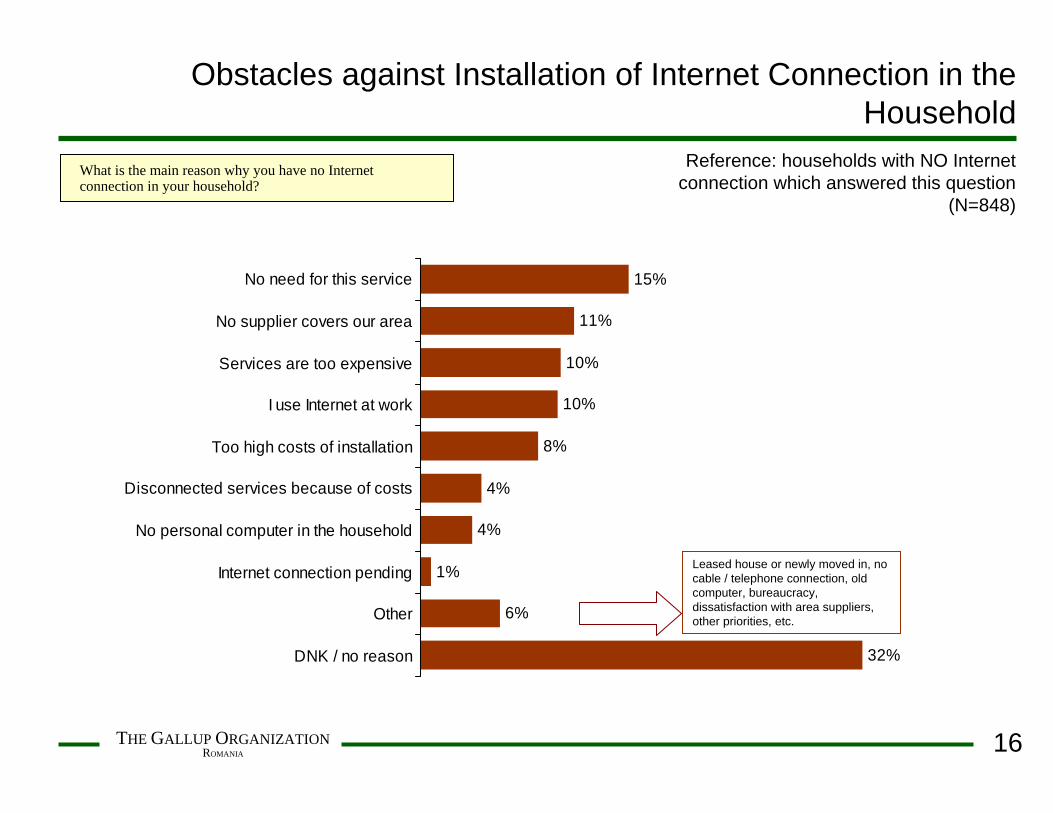
However, if we discuss the households that are not connected to the Internet, 15% of the respondents stated that “they do not need these services”, while 32% of them are unable to provide a reason for this situation. Other obstacles invoked regarding the absence of an Internet connection were: “lack of a provider in the area they live in” (11%), “high tariffs for the use of the service” (10%), the fact that “they have an Internet connection at the work place” (10%) and the “high installation costs” (8%).
The use of the Internet is significantly higher in Bucharest (40%), the North-West (27%), the South-East (26%) and the West (23%), as compared to an average of 21% of the representative sample. The same regions have a rate of penetration of Internet services in the households that is higher than the average rate.

11THE GALLUP ORGANIZATIONROMANIA
Internet Service Consumption over the last 6 months – overalloverall and average per household*
Have you personally used Internet services, irrespectively of location, over the last 6 months?
21%
34%
7%
National representativesample (N=10929)
Urban area (N=5728)
Rural area (N=5201)
Estimated number of persons over 16 year-old per total
population, who have used Internet services over the last 6
months*
3.962.986** (17.833.567)
3.375.616 (9.991.261)
587.370 (7.842.306)
*The number in parenthesis includes total number of persons over 16 year-old(Source: Annual Statistics of Romania, 2004)
* 128 persons were excluded from the estimation because they did not answer this question**The estimation was weighted against location because of the high number of respondents from the rural area

12THE GALLUP ORGANIZATIONROMANIA
21%
17%
26%
13%
13%
23%
27%
17%
40%
National representative sample (N=10929)
NORTH-EAST (N=1818)
SOUTH-EAST (N=1400)
SOUTH (N=1695)
SOUTH-WEST (N=1171)
WEST (N=1018)
NORTH-WEST (N=1433)
CENTRE (N=1259)
BUCHAREST (N=1135)
Internet Service Consumption over the last 6 months per area
Have you personally used Internet services, irrespectively of location, over the last 6 months?

13THE GALLUP ORGANIZATIONROMANIA
Level of Penetration of Internet Services in Householdsoverall and average per household
Does your household have an Internet connection?
14%
24%
3%
National representativesample (N=10929)
Urban area (N=5728)
Rural area (N=5201)
Estimated number of Romanian households with an Internet
connection*
1.052.084 (7.320.202)
943.891 (3.958.342)
108.193 (3.361.860)
*The number in parenthesis represent the total number of Romanian households(Source: Census 2002)
* 128 persons were excluded from the estimation because they did not answer to this question** The estimation was weighted against location because of the high number of respondents from the rural area

14THE GALLUP ORGANIZATIONROMANIA
14%
12%
17%
7%
8%
14%
17%
11%
31%
National representative sample (N=10929)
NORTH-EAST (N=1818)
SOUTH-EAST (N=1400)
SOUTH (N=1695)
SOUTH-WEST (N=1171)
WEST (N=1018)
NORTH-WEST (N=1433)
CENTRE (N=1259)
BUCHAREST (N=1135)
Level of Penetration of Internet Services in Householdsper area
Does your household have an Internet connection?

15THE GALLUP ORGANIZATIONROMANIA
Number of Internet Users per Householdper size of household
How many persons from your household use the Internet connection?
100%
21%
7%
79%
36%
30%
34%
19%
22% 7%
14%
4%
6%
19%
35%
26%
32%
10%
0% 20% 40% 60% 80% 100%
1 person
2 persons
3 persons
4 persons
5 persons or more
1 person 2 persons 3 persons 4 persons 5 persons DNK/refusal
Reference: households with Internet connection (N=1518)
Households of...
(N=63)
(N=332)
(N=548)
(N=410)
(N=160)
16THE GALLUP ORGANIZATIONROMANIA
Obstacles against Installation of Internet Connection in the Household
What is the main reason why you have no Internet connection in your household?
15%
11%
10%
10%
8%
4%
4%
1%
6%
32%
No need for this service
No supplier covers our area
Services are too expensive
I use Internet at work
Too high costs of installation
Disconnected services because of costs
No personal computer in the household
Internet connection pending
Other
DNK / no reason
Reference: households with NO Internet connection which answered this question
(N=848)
Leased house or newly moved in, no cable / telephone connection, old computer, bureaucracy, dissatisfaction with area suppliers, other priorities, etc.

II. Awareness of the main Internet access connections types

18THE GALLUP ORGANIZATIONROMANIA
Awareness of the Main Internet Access Connections Types
When asked what types of Internet connections they know, 83% of the Internet services users immediately mentioned at least one dedicated connection, while 67% of them mentioned at least one dial-up connection. The TV cable connection (51%) and the telephone line connection (50%) were mentioned most frequently.
Then the respondents were asked to choose from a list the types of Internet connections known by them. 82% of them mentioned the fixed telephone line connection, 79% the TV cable connection, 75% the optical fiber connection, 65% the connection through mobile telephony operators and 59% the UTP/FTP cable access (using a residential area network). On the whole, 96% of the Internet services users know at least one dedicated connection, while 87% of them have heard at least of one dial-up connection.

19THE GALLUP ORGANIZATIONROMANIA
Brand Recognition of Main Types of Internet Connection
What type of Internet connection do you know? Out of the connection types from the list below, which ones have you heard of, even if you do not currently use them?
Reference: Internet users in households
N = 1351
96%
82%
65%
36%
79%75%
22% 25%
44%
59%
2%
67%
83%
50%
29%
9%
51%
37%
8% 8%
16%
34%
1%4%
87%
0%
20%
40%
60%
80%
100%
DIA
L U
P
DE
DIC
ATE
D
Fixe
dte
leph
one
line
Mob
ileac
cess
ISD
N
TV c
able
Fibr
e op
tics
xDS
L
Rad
io
Sat
ellit
e
UTP
, FTP
cabl
e
Oth
er
DN
K b
rand
Assisted
Spontaneous

III. Internet access market structure depending on the
connection type used

21THE GALLUP ORGANIZATIONROMANIA
Dedicated access connections have definitely superseded dial-up connections lately. In 83% of the households that have an Internet connection, there is one dedicated access connection, and only 19% of them have a dial-upconnection. Extrapolating to the level of the entire target group studied, this means that approximately 881 thousand households have a dedicated access connection and approximately 206 thousand households have a dial-up connection.
The most frequent dial-up connection type is the fixed telephone line connection, which is present in 14% of the households that are connected to the Internet. As far as dedicated access connections are concerned, TV cable connections are the most frequently used (in 33% of the households connected to the Internet), UTP/FTP cable (26%) and optical fiber (20%).
An analysis by residential areas indicates that fixed telephony line connections prevail in the rural areas, while TV cable, UTP/FTP cable and optical fiber connections prevail in the urban areas.
Income does not result in significant differences among the types of connections used. However, one may notice a slight preference for optic fiber of those whose income exceeds RON 200 per capita, as compared to those whose income is below RON 200 per capita, who use the fixed telephone line connection more frequently.
The Romanian market of Internet access connections is very dynamic. At least 68% of the total number of dedicated access connections and at least 54% of dial-up connections have been purchased during the last 2 years.
Structure of the Internet Access Market Depending on the Connection Type

22THE GALLUP ORGANIZATIONROMANIA
Structure of the Internet Access Market Depending on the Connection Type
Among the households using dial-up Internet, 85% of them use a single account. 6% of the respondents from these households stated that they use two dial-up accounts, and 2% of them stated that there are three or more accounts (6% were unable to tell that).
Almost all of the households (97%) using dial-up Internet access use only one dedicated access connection, and 2% of them use two connections.
Romtelecom is the main supplier of dial-up Internet access provider. 50% of the respondents who have a dial-upconnection in their household mentioned Romtelecom as the service provider. This company was followed by RDS (20%), Zapp (11%), Vodafone (7%), Orange (5%) and Xnet (3%). Romtelecom is by far a leader on the market of fixed telephone line connections, while Zapp is a leader on the mobile line access connections market.
Regarding dedicated access connections, the main provider is RDS (used in 32% of the household using such connections), followed by UPC / Astral (15%) and Romtelecom (2%). RDS is a leader both on the TV cable connections market (53%), and on the optical fiber connections market (43%).

23THE GALLUP ORGANIZATIONROMANIA
Type of Internet Connections in Households
What type(s) of Internet connection(s) do you have in yourhousehold?
Reference: households with Internet connections, N=1351
19%
14%
1%
2%
2%
83%
33%
26%
20%
3%
1%
1%
0,1%
0,2%
DIAL UP CONNECTION
Fixed telephone line
ISDN
GSM-CSD/GPRS/WAP mobile access
CDMA/EVDO (Zapp) mobile access
EDGE/3G mobile access
DEDICATED CONNECTION
TV cable
UTP/FTP cable (neighbourhood network)
Fibre optics
xDSL(ADSL, SDSL, HDSL)
Radio (radiomodem or microwave)
Satellite
OtherMore than one answer

24THE GALLUP ORGANIZATIONROMANIA
Estimated Number of Romanian Households that Have the Following Types of Internet Connections
200.916
150.298
9.345
24.920
21.805
873.751
348.878
271.003
207.146
31.150
11.681
7.009
1.557
2.336
0 200.000 400.000 600.000 800.000 1.000.000 1.200.000
DIAL UP CONNECTION
Fixed telephone line
ISDN
GSM-CSD/GPRS/WAP mobile access
CDMA/EVDO (Zapp) mobile access
EDGE/3G mobile access
DEDICATED CONNECTION
TV cable
UTP/FTP cable (neighbourhood network)
Fibre optics
xDSL(ADSL, SDSL, HDSL)
Radio (radiomodem or microwave)
Satellite
Other
More than one answer
What type(s) of Internet connection(s) do you have in yourhousehold?

25THE GALLUP ORGANIZATIONROMANIA
Urban area (N=1201)
12%
1%
2%
35%
%
27%
%
2,8%
20,9%
1,9%
,2%
%
DIAL UP CONNECTION
Fixed telephone line
ISDN
GSM-CSD/GPRS/WAP mobile
CDMA/EVDO (Zapp) mobile
EDGE/3G mobile
DEDICATED CONNECTION
TV cable
Fibre optics
xDSL(ADSL, SDSL, HDSL)
Radio
Satellite
UTP/FTP cable
Other
Type of Internet Connections of Households- by residential area -
(more than one answer)
Rural area (N=150)
35%
2%
6%
1%
3%
15%
10%
4%
7%
4%
16%
DIAL UP CONNECTION
Fixed telephone line
ISDN
GSM-CSD/GPRS/WAP mobile
CDMA/EVDO (Zapp) mobile
EDGE/3G mobile
DEDICATED CONNECTION
TV cable
Fibre optics
xDSL(ADSL, SDSL, HDSL)
Radio
Satellite
UTP/FTP cable
Other
What type(s) of connection(s) do you have in your household?

26THE GALLUP ORGANIZATIONROMANIA
200 RON or less (N=139)
17%
1%
2%
38%
1%
21%
1,4%
17%
2,9%
DIAL UP CONNECTION
Fixed telephone line
ISDN
GSM-CSD/GPRS/WAP mobile
CDMA/EVDO (Zapp) mobile
EDGE/3G mobile
DEDICATED CONNECTION
TV cable
Fibre optics
xDSL(ADSL, SDSL, HDSL)
Radio
Satelitte
UTP/FTP cable
Other
Type of Internet Connections of Householdsby household income per capita
(more than one answer)
201-400 RON (N=311)
%
3%
2%
31%
21%
1%
27%
%
12,9%
,3%
2,6%
DIAL UP CONNECTION
Fixed telephone line
ISDN
GSM-CSD/GPRS/WAP mobile
CDMA/EVDO (Zapp) mobile
EDGE/3G mobile
DEDICATED CONNECTION
TV cable
Fibre optics
xDSL(ADSL, SDSL, HDSL)
Radio
Satelitte
UTP/FTP cable
Other
What type(s) of connection(s) do you have in your household?

27THE GALLUP ORGANIZATIONROMANIA
401-600 RON (N=257)
15%
1%
2%
31%
28%
3%
20,6%
3,1%
1,2%
1%
DIAL UP CONNECTION
Fixed telephone line
ISDN
GSM-CSD/GPRS/WAP mobile
CDMA/EVDO (Zapp) mobile
EDGE/3G mobile
DEDICATED CONNECTION
TV cable
Fibre optics
xDSL(ADSL, SDSL, HDSL)
Radio
Satelitte
UTP/FTP cable
Other
Type of Internet Connections of Householdsby household income per capita
(more than one answer)
over 600 RON (N=329)
13%
1%
%
2%
38%
20%
1%
23%
%
4,0%
,3%
2,1%
DIAL UP CONNECTION
Fixed telephone line
ISDN
GSM-CSD/GPRS/WAP mobile
CDMA/EVDO (Zapp) mobile
EDGE/3G mobile
DEDICATED CONNECTION
TV cable
Fibre optics
xDSL(ADSL, SDSL, HDSL)
Radio
Satelitte
UTP/FTP cable
Other
What type(s) of connection(s) do you have in your household?

28THE GALLUP ORGANIZATIONROMANIA
Age of Household Connections
Since when has your household used each type of connection you mentioned?
15%
6%
9%
8%
14%
14%
20%
31%
34%
37%
9%
5%
0% 20% 40% 60% 80% 100%
Households with dial-up connections *
Households withdedicated
connections*
Before 2003 2003
2004 2005
2006 DNK
Reference: households with dial-up (N=258) / dedicated connection (N=1122)
* For more than one dial-up or dedicated connections, the oldest connection was taken into account

29THE GALLUP ORGANIZATIONROMANIA
Market Structure according to Number of Accounts / Internet Ports
Reference: dial-up connection households, N = 258
Number of dial-up accounts
One; 85%
DNK; 6%Three of
more; 2%
Two; 6%
Number of dedicated ports
One; 97%
DNK; 6%
Three; 0,4%
Two; 3%
Reference: dedicated connection households, N = 1122
How many dial-up Internet accounts does your household use?How many dedicated Internet ports does you household have?

30THE GALLUP ORGANIZATIONROMANIA
DIAL UP
20%
11%
7%
5%
3%
3%
6%
50%Romtelecom/Artelecom
RDS-RCS
Zapp
Vodafone
Orange
Xnet
Other suppliers*
DNK
DEDICATED
15%
2%
40%
11%
32%RDS-RCS
UPC(Astral)
Romtelecom/Artelecom
Other suppliers*
DNK
Internet Service Suppliers- per type of connection -
* Under 2% answers* Under 2% answers
Reference: dial-up connection households, N = 258 Reference: dedicated connection households, N = 1122
Who are your current Internet suppliers for each type of connection? (open-ended question with more than one answer)

31THE GALLUP ORGANIZATIONROMANIA
Fixed telephone line
26%
4%
4%
2%
2%
4%
64%Romtelecom/Artelecom
RDS-RCS
Xnet
DNK
UPC(Astral)
Other suppliers*
DNK
Mobile phone
31%
19%
7%
45%Zapp
Vodafone(Connex)
Orange
DNK
Internet Service Suppliers- per dial-up connection -
Reference: households with dial-up connection via fixed telephone line, N = 193
Reference: households with dial-up connection via mobile telephone line, N = 62

32THE GALLUP ORGANIZATIONROMANIA
TV cable
35%
10%
2%
53%RDS-RCS
UPC(Astral)
Othersuppliers
DNK
Fibre optics
5%
4%
2%
2%
2%
30%
14%
43%RDS-RCS
UPC (Astral)
SyncoTelecom
Evolva
IT 4 WEB
Pronet
Othersuppliers
DNK
Internet Service Suppliers- per dedicated connection -
Reference: households with TV cable Internet connection, N = 448
Reference: households with fibre optics dedicated connection, N = 266

IV. Internet usage habits

34THE GALLUP ORGANIZATIONROMANIA
Internet Usage Habits
Almost two thirds of the total number of persons that used the Internet during the past 6 months, irrespective of their location, stated that they accessed to the Internet in their household, 42% at the work place or at school, 20% at the friends’ or relatives’ domicile, and 16% from Internet Cafes. In the urban areas, most users access the Internet from home (68%), then from the work place or school (42%). In the rural areas, the percentage of those who use the Internet in their household decreases, while the percentage of those who frequently go to Internet Cafes for this purpose increases.
Most Internet users (87%) use this service in the household for e-mail correspondence. Approximately 8 respondents out of 10 access the Internet for information purposes, and approximately two thirds mentioned that they use it to play games, to download music and films and for chatting.
The maximum level of Internet usage is between 18:00 and 22:00, both during the week and in the weekend, the absolute peak being between 20:00 and 21:00. 60% of the respondents stated that they use the Internet during this time interval (20:00-21:00) during the week, and approximately half of them stated that they do this on weekend.

35THE GALLUP ORGANIZATIONROMANIA
Locations of Internet Service Consumption
Where do you usually use Internet services?
Location
64%
42%
20%
16%
3%
At home
At work /school
Friends /acquiantances
Internet café
Other placesN=2301
By Residential Area
68%
42%
14%
20%
3%
42%
42%
24%
23%
6%
At homeAt work /school
Friends /acquiantances
Internet café
Other places
At homeAt work /school
Friends /acquiantances
Internet café
Other places
UrbanInternetUsers(N=1917)
RuralInternetUsers(N=384)
Reference: persons who have used Internet over the last 6
months

36THE GALLUP ORGANIZATIONROMANIA
Frequency of Internet Consumption per Location
Where do you usually use Internet services?How often do you use Internet services in an average month, irrespectively of purpose?
26
11
18
8
1
4
3
1
6
8
3
4
3
6
3
4
3
5
8
10
36
56
83
79
4
3
1
20,3
0,5
1
0% 20% 40% 60% 80% 100%
At home
At work / school
Internet café
Friends /acquiantances
More than once a day
Once a day
4-6 times a week
2-3 times a week
Once a week
Less than once a week*
Have not used Internet at thislocation
DNK
Reference: persons who have used Internet over the last 6 months
(N=2301)
*Percentages for “less than once a month",“once a month" and "2-3 times a month” were added

37THE GALLUP ORGANIZATIONROMANIA
Purpose of Internet Service Consumption in Households
For what purpose / activity do you use your household Internet connection?
87%
79%
77%
66%
65%
29%
24%
13%
1%
To send and receive mail
To read news, get information and updates for various events
To get necessary information for work or school
For entertainment, to play or download games / music / movies)
To chat, including via web camera
To listen to Internet radio
To use Internet based telephony
E-commerce (online shopping)
Other
Reference: household Internet users, N = 1351
More than one answer

38THE GALLUP ORGANIZATIONROMANIA
Purpose of Internet Service Consumption in Householdsper respondent occupation
For what purpose / activity do you use your Internet household connection?What is your current occupation?
Reference: household Internet users
N=97
N=40N=261N=63N=91N=118
N=56N=73N=387N=140
More than one answer
For what purpose/activity do you use your Internet household connection?
90% 73% 73% 60% 25% 33% 70% 29% 3%
93% 80% 83% 60% 13% 20% 65% 30% 3%89% 89% 81% 58% 16% 25% 54% 28% 1%81% 75% 84% 56% 21% 41% 62% 25%88% 78% 76% 58% 11% 12% 53% 20%77% 61% 74% 69% 10% 16% 59% 11% 1%79% 61% 71% 61% 11% 25% 64% 23%81% 42% 74% 37% 1% 11% 45% 19% 3%91% 86% 82% 83% 13% 41% 81% 26% 1%84% 71% 78% 61% 9% 26% 64% 25% 1%
Occupation:Business (co) ownerFree lance professional Manager
(manager, director)Engineer, doctor, architectprofesor, economist, etcPublic administrationTechnician, assistantînvãtãtor, etcWorkerHousewifeRetired Student Other
%
To send and receiveemails
%
To getnecessaryinformation
for workor
school
%
To readnewsto get
informationand updatesfor various
events%
Forentertainment
to playor
downloadgames/
music/ movies
%
E-commerce(online
shopping)%
To listento
radio onInternet
%
To chatincluding
viaweb
cameras
%
ForInternet
telephony
%Other

39THE GALLUP ORGANIZATIONROMANIA
Household Internet Consumption per Period
When do you personally use Internet in your household?
Maximumconsumption
More than one answer
Reference: household Internet users, N = 1351
6% 7%4% 6%3% 4%2% 3%1% 2%2% 2%2% 2%4% 3%7% 7%11% 12%14% 24%14% 26%13% 28%12% 26%15% 28%18% 29%23% 32%31% 35%41% 42%49% 46%60% 49%50% 43%37% 33%22% 22%
%between 0.00-1.00%1.00-2.00%2.00-3.00%3.00-4.00%4.00-5.00%5.00-6.00%6.00-7.00%7.00-8.00%8.00-9.00%9.00-10.00%10.00-11.00%11.00-12.00%12.00-13.00%13.00-14.00%14.00-15.00%15.00-16.00%16.00-17.00%17.00-18.00%18.00-19.00%19.00-20.00%20.00-21.00%21.00-22.00%22.00-23.00%23.00-24.00
Weekdays Weekend

40THE GALLUP ORGANIZATIONROMANIA
7% 7%5% 6%3% 4%2% 3%2% 2%2% 2%2% 2%4% 3%7% 7%
11% 12%15% 25%15% 28%13% 30%13% 28%16% 31%19% 31%25% 34%33% 36%43% 42%51% 47%61% 50%51% 44%37% 34%23% 23%
%From 0.00 to 1.00%1.00-2.00%2.00-3.00%3.00-4.00%4.00-5.00%5.00-6.00%6.00-7.00%7.00-8.00%8.00-9.00%9.00-10.00%10.00-11.00%11.00-12.00%12.00-13.00%13.00-14.00%14.00-15.00%15.00-16.00%16.00-17.00%17.00-18.00%18.00-19.00%19.00-20.00%20.00-21.00%21.00-22.00%22.00-23.00%23.00-24.00
Weekdays Weekend
Household Internet Consumption per Period- dedicated connections -
When do you personally use Internet in your household?
More than one answer
Reference: household Internet users with dedicated connection, N = 1122
Dedicated connection

41THE GALLUP ORGANIZATIONROMANIA
11% 10%6% 10%5% 6%3% 5%5% 6%5% 6%3% 5%8% 5%
11% 5%18% 13%19% 26%16% 29%15% 23%16% 24%19% 23%18% 23%21% 21%34% 27%42% 42%42% 44%65% 48%42% 42%35% 29%24% 21%
%From 0.00 to 1.00%1.00-2.00%2.00-3.00%3.00-4.00%4.00-5.00%5.00-6.00%6.00-7.00%7.00-8.00%8.00-9.00%9.00-10.00%10.00-11.00%11.00-12.00%12.00-13.00%13.00-14.00%14.00-15.00%15.00-16.00%16.00-17.00%17.00-18.00%18.00-19.00%19.00-20.00%20.00-21.00%21.00-22.00%22.00-23.00%23.00-24.00
Weekdays Weekend7% 7%5% 6%3% 4%2% 3%2% 2%2% 2%2% 2%4% 3%7% 7%
11% 12%15% 25%15% 28%13% 30%13% 28%16% 31%19% 31%25% 34%33% 36%43% 42%51% 47%61% 50%51% 44%37% 34%23% 23%
%From 0.00 to 1.00%1.00-2.00%2.00-3.00%3.00-4.00%4.00-5.00%5.00-6.00%6.00-7.00%7.00-8.00%8.00-9.00%9.00-10.00%10.00-11.00%11.00-12.00%12.00-13.00%13.00-14.00%14.00-15.00%15.00-16.00%16.00-17.00%17.00-18.00%18.00-19.00%19.00-20.00%20.00-21.00%21.00-22.00%22.00-23.00%23.00-24.00
Weekdays Weekend
Household Internet Consumption per Period- dial-up connections -
When do you personally use Internet in your household?
More than one answer
Reference: household Internet users with fixed line dial-up (N = 205) and mobile line (N=62)
Fixed line / ISDN Mobile line

42THE GALLUP ORGANIZATIONROMANIA
Household Internet Consumption per Period- per amount paid for Internet services over the last month -
When do you personally use Internet in your household?More than one answer
Reference: household Internet users
Weekdays Weekend
N=869 N=381 N=869 N=381
6.0 6.83.5 5.82.1 3.41.2 2.4.9 2.9
1.0 2.42.1 2.13.3 3.96.2 9.4
10.2 12.913.0 17.812.1 18.610.9 16.311.0 14.714.6 15.518.2 17.123.5 21.832.3 28.642.9 36.751.3 44.461.8 57.551.7 47.537.9 33.922.2 22.0
%Between 0.00-1.00%1.00-2.00%2.00-3.00%3.00-4.00%4.00-5.00%5.00-6.00%6.00-7.00%7.00-8.00%8.00-9.00%9.00-10.00%10.00-11.00%11.00-12.00%12.00-13.00%13.00-14.00%14.00-15.00%15.00-16.00%16.00-17.00%17.00-18.00%18.00-19.00%19.00-20.00%20.00-21.00%21.00-22.00%22.00-23.00%23.00-24.00
Answers Answers
40 RON orless
Over 40RON
Amount paid for Internetservices last month
6.7 7.35.4 6.83.6 5.52.3 3.91.8 3.71.5 3.12.0 2.93.0 3.97.2 6.6
11.9 12.323.9 24.426.7 27.329.2 28.125.5 27.028.4 28.627.6 31.831.6 33.935.3 36.541.8 42.847.1 46.550.6 49.144.6 42.032.8 35.222.4 23.4
%Between 0.00-1.00%1.00-2.00%2.00-3.00%3.00-4.00%4.00-5.00%5.00-6.00%6.00-7.00%7.00-8.00%8.00-9.00%9.00-10.00%10.00-11.00%11.00-12.00%12.00-13.00%13.00-14.00%14.00-15.00%15.00-16.00%16.00-17.00%17.00-18.00%18.00-19.00%19.00-20.00%20.00-21.00%21.00-22.00%22.00-23.00%23.00-24.00
Answers Answers
40 RON orless
Over 40RON
Amount paid for Internetservices last month

V. Expenses related to Internet access services

44THE GALLUP ORGANIZATIONROMANIA
Expenses Related to Internet Access Services
On the average, a household connected to the Internet spent RON 43 in the last month for these services. Approximately 6 households out of 10 spent between RON 21 and 40.
The expenses related to dedicated Internet services are higher than those related to dial-up services. On the average, a household using a dedicated access connection spent RON 44.1 monthly for this connection, while the average expense of a household using dial-up Internet connections was up to RON 37.6.

45THE GALLUP ORGANIZATIONROMANIA
1%4%
31%28%
13%
5% 4%2% 1% 2% 2%
7%
0%
20%
40%
10 RONor less
11-20RON
21-30RON
31-40RON
41-50RON
51-60RON
61-70RON
71-80RON
81-90RON
91-100RON
over100RON
DNK
Total Internet Services Monthly Expenses
Average amount paid for last month: 43,0 RON
What is the approximate amount that your household paid for all Internet services used over the last month, irrespectively of type of connection (RON, including VAT)?
Reference: household Internet users, N = 1351

46THE GALLUP ORGANIZATIONROMANIA
4%
12%
23%
13% 12%
6% 6%
2% 0,4%
21%
0,4%0%
20%
40%
10 RONor less
11-20RON
21-30RON
31-40RON
41-50RON
51-60RON
61-70RON
71-80RON
81-90RON
91-100RON
DNK
Internet Dial-up Service Monthly Expenses
Average amount paid last month: 37,6 RON
What is the average amount you pay monthly for Internet access for this connection? (RON, including VAT)?
Reference: household with Internet dial-up connection, N = 258

47THE GALLUP ORGANIZATIONROMANIA
3%
32% 31%
13%
5%3% 2% 1%
8%
0,4% 2%0,6%0%
20%
40%
10 RONor less
11-20RON
21-30RON
31-40RON
41-50RON
51-60RON
61-70RON
71-80RON
81-90RON
91-100RON
over100RON
DNK
Internet Dedicated Connection Monthly Expenses
Average amount paid last month: 44,1 RON
How much do you pay on average for Internet services via this connection (RON including VAT)? If your Intennet services are part of a bigger package of services (TV cable, telephony) please refer only to Internet costs.
Reference: households with dedicated Internet connection, N = 1122
VI. Dial-up Internet access connections market

VI.a. Dial-up access connections types and usage levels

50THE GALLUP ORGANIZATIONROMANIA
Dial-up Connection Types and Usage Level
Three quarters of the households using dial-up connections use classical dial-up services, by fixed telephone line. In 12% of the households, the Internet is accessed from the mobile telephone using CSD/GPRS/WAP connections, from Vodafone or Orange, and in 11% of the households through Zapp mobile connections.
The most frequently used type of subscription for dial-up connections existing in households is the unlimited access subscription, which is used in 59% of the households having such connections. 12% of the households use services under a subscription including a limited number of hours or limited traffic (limited access), and another 12% have subscriptions with partly limited access (payment of additional number of hours or additionalnumber of MB). 17% of the respondents from these households are unable to indicate the type of subscription they use for their connection/connections.
Most of the respondents (74%) are unable to tell which is their weekly traffic on the dial-up connection they use (most often). Calculated based on the valid answers received, the average traffic in a regular week is 364 MB.
The respondents estimated that, on a regular week, they use the dial-up connection for an average number of 16.4 hours, i.e. a little more than 2 hours daily. However, 21% of the respondents stated that they use this connection intensively (more than 20 hours/week).

51THE GALLUP ORGANIZATIONROMANIA
Types of Internet Dial-up Connections
What type(s) of connection(s) does your household have?
75%
5%
12%
1%
11%
Fixed phone line
ISDN
GSM-CSD/GPRS/WAPmobile access
EDGE/3G mobile access
CDMA/EVDO mobileaccess
Reference: dial-up connection households (N=258)
More than one answer

52THE GALLUP ORGANIZATIONROMANIA
Number of Internet Dial-up Accounts
Number of dial-up accounts
One; 85%
DNK; 6%Three or more; 2%
Two; 6%
How many Internet dial-up connections does your household use?How many of those do you pay for?
Number of paid dial-up accounts
None; 2%DNK; 19%
Three or more; 1%
Two; 5%
One; 73%
Reference: households with dial-upconnections (N=258)

53THE GALLUP ORGANIZATIONROMANIA
Types of Subscriptions for Internet Dial-up Connections
What type of subscription do you have for your householddial-up connection(s)?
59%
12%
12%
4%
17%
Unlimited subscription
Subscription for limitedtime or traffic (limited
access)
Subscription with limitedaccess and payment foradditional hours or MB
Pre-paid card
DNK
Reference: households with dial-upconnections (N=258)
More than one answer

54THE GALLUP ORGANIZATIONROMANIA
53%
13%
16%
6%
13%
55%
19%
17%
68%
6%
14%
2%
18%
64%
10%
9%
3%
19%
15%
Unlimited subscription(unlimited access)
Subscription for limitedhours or traffic (limited
access)
Subscription for partiallylimited access and pay for
additional hours or MB
Pre-paid card
DNK
200 RON or less (N=32)
201-400 RON (N=53)
401-600 RON (N=50)
600+ RON (N=58)
Type of Subscriptions for Internet Dial-up Connectionsby household income per capita
What type of subscription do you have for the dial-up connection(s) in your household?
Reference: households with dial-up connections (N=258)

55THE GALLUP ORGANIZATIONROMANIA
DNK; 74%
11-50 MB; 5%
51-100 MB; 4%
101-500 MB; 3%
10 MB or less; 10%
over 1 GB; 2%
501-1000 MB; 4%
Weekly Traffic on Internet Dial-Up Connection
Please tell me the approximate traffic (Megabytes / MB) your household uses in an average week on your Dial-up connection (the one you use mostly)?
Reference: households with Internet dial-up connection, N = 258
Weekly average traffic: 364 MB

56THE GALLUP ORGANIZATIONROMANIA
170,5 MB
497,4 MB
281,1 MB
0 100 200 300 400 500 600 700
Subscription for limitedtime or traffic
Partially limitedsubscription with pay for
additional hours
Unlimited subscription(unlimited access)
average value
[N=30]
[N=32]
[N=152]
Average Weekly Traffic per Type of Dial-up Subscription
Please tell me the approximate traffic (Megabytes / MB) you personally use in your household in an average week on your Dial-up connection (the one you use mostly)?
Reference: household with subscription for Internet dial-up connection

57THE GALLUP ORGANIZATIONROMANIA
DNK; 29%
3-5 hours; 9%
6-10 hours; 17%
11-20 hours; 15%
1-2 hours; 9%
over 30 hours; 9%
21-30 hours; 12%
Weekly Number of Internet Hours on Dial-up Connection
How many hours do you personally use your household dial-up connection in an average week?
Reference: households with dial-upconnections, N = 258
Average number of Internet hours per week: 16,4 hours

VI.b. Level of satisfaction with the providers of dial-up
Internet access services

59THE GALLUP ORGANIZATIONROMANIA
Level of Satisfaction with Dial-up Access Providers
There is no clear difference regarding the importance of the criteria considered when choosing a dial-upconnection in the household. There are two criteria mentioned as important or very important by more than half of the respondents who use dial-up connections: the network availability and the log-in time, and the subscription price. In fact, except for the network availability and log-in time (3.9 on the average) and promotional offers (3.2), the other criteria measured have obtained medium rates of importance, comprised between 3.4 and 3.7 on a scale from 1 to 5, where 1=not at all important criterion and 5=very important criterion.
Both in terms of general satisfaction, and in terms of satisfaction with the quality of services, RDS connections through fixed telephone line and Zapp connections (mobile access) generate the highest average scores among the users.
Although it is the most important provider on the dial-up connections market, Romtelecom has the lowest satisfaction scores, both in the case of fixed telephony line connections, and in the case of ISDN connections.

60THE GALLUP ORGANIZATIONROMANIA
55% 52%48% 45% 46%
43% 44% 45% 43% 44% 41%36%
3,23,43,43,53,53,63,63,6
3,9 3,73,73,7
0
20
40
60
80
100
Ava
ilabi
lity
of n
etw
ork
/ tim
e to
logo
n
Pric
e of
sub
scrip
tion
Type
of t
echn
olog
y us
ed
Qua
lity
of c
usto
mer
ass
ista
nce
and
time
to e
mer
genc
y tro
uble
shoo
ting
Ban
dwid
th (t
rans
fer s
peed
)
Exi
sten
ce a
nd a
vaila
bilit
y of
cus
tom
erse
rvic
e
Leve
l of p
rote
ctio
n ag
ains
t viru
s, s
pam
and
hack
ing
Sup
plie
r rep
utat
ion
Tele
phon
y ta
riffs
Cos
ts o
f ins
talla
tion
Flex
ibili
ty o
f pric
es a
nd c
ontra
ctco
nditi
ons P
rom
otio
ns
1
2
3
4
5
Top 2 Box (%important + veryimportant)
average values (1= not at all ... 5 =very important)
%
Importance of Criteria for Selecting a Dial-up Internet Service
When you selected your Internet dial-up service that you currently use, how important were for you each of the following criteria?
Reference: households with dial-up Internet connection, N = 258

61THE GALLUP ORGANIZATIONROMANIA
19 13
37 4021 14
3537
31
26 46
16 21
10
109
4
10 12 8
109
7
7
20 94
14 615 20 26 2511
0%
20%
40%
60%
80%
100%
Ove
rall
satis
fact
ion
with
dial
-up
Inte
rnet
pro
vide
rs
Rom
tele
com
cla
ssic
tele
phon
e lin
e
RD
S c
lass
ic te
leph
one
line
Rom
tele
com
ISD
N
GS
M-
CS
D/G
PR
S/W
AP
/ED
GE
/3G
mob
ile a
cces
s
CD
MA
- Za
pp m
obile
acce
ss
DNK
Not at all satisfied
2
3
4
Very satisfied
General Satisfaction with Dial-up Internet Providers
Overall how satisfied are you with your dial-up Internet suppliers? Please use a scale from 1 to 5 where “5” = very satisfied and “1” = not at all.
Reference: households with dial-up connections from respective suppliers
[N = 258] [N = 34] [N = 28][N = 123] [N = 52] [N = 10]

62THE GALLUP ORGANIZATIONROMANIA
3,55 3,29
4,14
3,38 3,56 3,81
1
2
3
4
5
Ove
rall
satis
fact
ion
with
dial
-up
Inte
rnet
pro
vide
rs
Rom
tele
com
cla
ssic
tele
phon
e lin
e
RD
S c
lass
ic te
leph
one
line
Rom
tele
com
ISD
N
GS
M-
CS
D/G
PR
S/W
AP
/ED
GE
/3G
mob
ile a
cces
s
CD
MA
- Za
pp m
obile
acce
ss
General Satisfaction with Dial-up Internet Providersaverage values (1=not at all...5=very satisfied)
Overall how satisfied are you with your dial-up Internet suppliers? Please use a scale from 1 to 5 where “5” = very satisfied and “1” = not at all
[N = 258] [N = 34] [N = 28][N = 123] [N = 52] [N = 10]
Reference: households with dial-upInternet connections from respective
suppliers

63THE GALLUP ORGANIZATIONROMANIA
21 1635 40
21 25
3029
33
24
39
16 21
8
12
1110 1310
206
4720
6
17 10 15 2032
2111
0%
20%
40%
60%
80%
100%
Sat
isfa
ctio
n w
ith s
ervi
cequ
ality
of d
ial-u
p In
tern
etsu
pplie
r
Rom
tele
com
cla
ssic
tele
phon
e lin
e
RD
S c
lass
ic te
leph
one
line
Rom
tele
com
ISD
N
GS
M-
CS
D/G
PR
S/W
AP
/ED
GE
/3G
mob
ile a
cces
s
CD
MA
- Za
pp m
obile
acce
ss
DNK
Not at all satisfied
2
3
4
Very satisfied
Satisfaction with Service Quality of Internet Dial-up Connection
Using the same scale, how satisfied are you with the service quality of this supplier?
[N = 258] [N = 34] [N = 28][N = 123] [N = 52] [N = 10]
Reference: households with dial-up connections from respective suppliers

64THE GALLUP ORGANIZATIONROMANIA
3,59 3,31
4,09
3,25 3,70
4,09
1
2
3
4
5
Sat
isfa
ctio
n w
ith s
ervi
cequ
ality
of d
ial-u
p In
tern
etsu
pplie
rs
Rom
tele
com
cla
ssic
tele
phon
e lin
e
RD
S c
lass
ic te
leph
one
line
Rom
tele
com
ISD
N
GS
M-
CS
D/G
PR
S/W
AP
/ED
GE
/3G
mob
ile a
cces
s
CD
MA
- Za
pp m
obile
acce
ss
Satisfaction with Service Quality of Internet Dial-up Connectionaverage value (1=not at all...5=very satisfied)
[N = 258] [N = 34] [N = 28][N = 123] [N = 52] [N = 10]
Using the same scale, how satisfied are you with the service quality of these suppliers?
Reference: households with Internet dial-up connections from respective
suppliers

65THE GALLUP ORGANIZATIONROMANIA
3,1 3,23,1
3,2
3,63,3
4,0 4,0 4,1 4,14,3
4,2
3,23,4 3,5
3,1
3,43,6
3,03,1
4,1
2,5
3,5 3,4
3,13,3
3,6
3,2
3,8 3,8
4,1
3,7
4,0
4,3
4,04,2
3,6
4,03,7
4,1
3,73,9
1
2
3
4
5
Bandwidth Quality of technicalsupport and emergency
troubleshooting time
Price of subscription Network availability /time to logon
Costs of installation Supplier reputation
Romtelecom classic telephone line (N=109) RDS classic telephone line (N=42)Other classic telephone line (N=13) Romtelecom ISDN (N=8)Vodafone - GSM-CSD/GPRS/WAP/EDGE/ 3G (N=17) Orange - GSM-CSD/GPRS/WAP/EDGE/ 3G (N=7)Zapp - CDMA (N=22)
Satisfaction with Internet Dial-up Connections (1) average value (1=not at all...5=very satisfied)
Please indicate how satisfied you are with your dial-up Internet supplier(s) on any of the following criteria; please use a scale from 1 to 5, where 1 is not at all and 5 is very satisfied.
Reference: households with Internet dial-up connection from respective
suppliers*
* Analysis does not include DNK. Interpret the results with care because the number of respondents was small

66THE GALLUP ORGANIZATIONROMANIA
3,03,3
2,82,9
2,83,1
3,73,8
3,7
4,3
4,0
4,2
3,3
3,1
2,3
3,13,2
3,4
3,1
3,3
2,8
3,4
3,0
2,7
2,5
3,6
2,9 2,9 2,9
3,4
3,8
4,0
2,8
3,73,8
4,1
3,7
3,9
3,5
3,9
3,7
4,3
1
2
3
4
5
Protection against virus,spam and hacking
Existence andavailability of customer
service
Promotions Telephone call tariffs Flexibility of prices andcontract conditions
Used technology
Romtelecom classic telephone line (N=109) RDS classic telephone line (N=42)Other classic telephone line (N=13) Romtelecom ISDN (N=8)Vodafone - GSM-CSD/GPRS/WAP/EDGE/ 3G (N=17) Orange - GSM-CSD/GPRS/WAP/EDGE/ 3G (N=7)Zapp - CDMA (N=22)
Satisfaction with Internet Dial-up Connections(2) average value (1=not at all...5=very satisfied)
Please indicate how satisfied you are with your dial-up Internet supplier(s) on any of the following criteria; please use a scale from 1 to 5, where 1 is not at all and 5 is very satisfied.
Reference: households with Internet dial-up connection from respective
suppliers*
* Analysis does not include DNK. Interpret the results with care because the number of respondents was small

VI.c. Intentions to change the providers or the types of
Internet dial-up access

68THE GALLUP ORGANIZATIONROMANIA
Intentions to Change the Providers or the Types of Dial-up Internet Access Connections
42% of the respondents who are not satisfied with the services supplied by the dial-up Internet provider consider that “there is no alternative provider in the area I live in” and, for this reason, they did not renounce its services. Other obstacles against renouncing the providers’ services are the fact that “they do now know other offers”(11%), “the high cost of changing the provider” (11%), and also “respondents’ idleness” (15%).
However, the intention to renounce the services of dial-up Internet providers has a rather high level: 30% of the dial-up connections users stated that, within the next 12 months, they are likely or very likely to renounce their provider (or at least one of the connections, if they have several connections), and 33% of them do not know yet if they would renounce these services or not. As expected, most of the respondents (74%) who stated their intention to renounce a connection, indicated this to be the connection through Romtelecom fixed telephone line.
There are 3 major reasons that generate the intention to renounce a dial-up connection: “insufficient speed for their needs” (mentioned as the main reason by 38% of the respondents who want to renounce), “high tariffs as compared to the services quality” (21%), and “in order to use a more advanced technology” (19%).
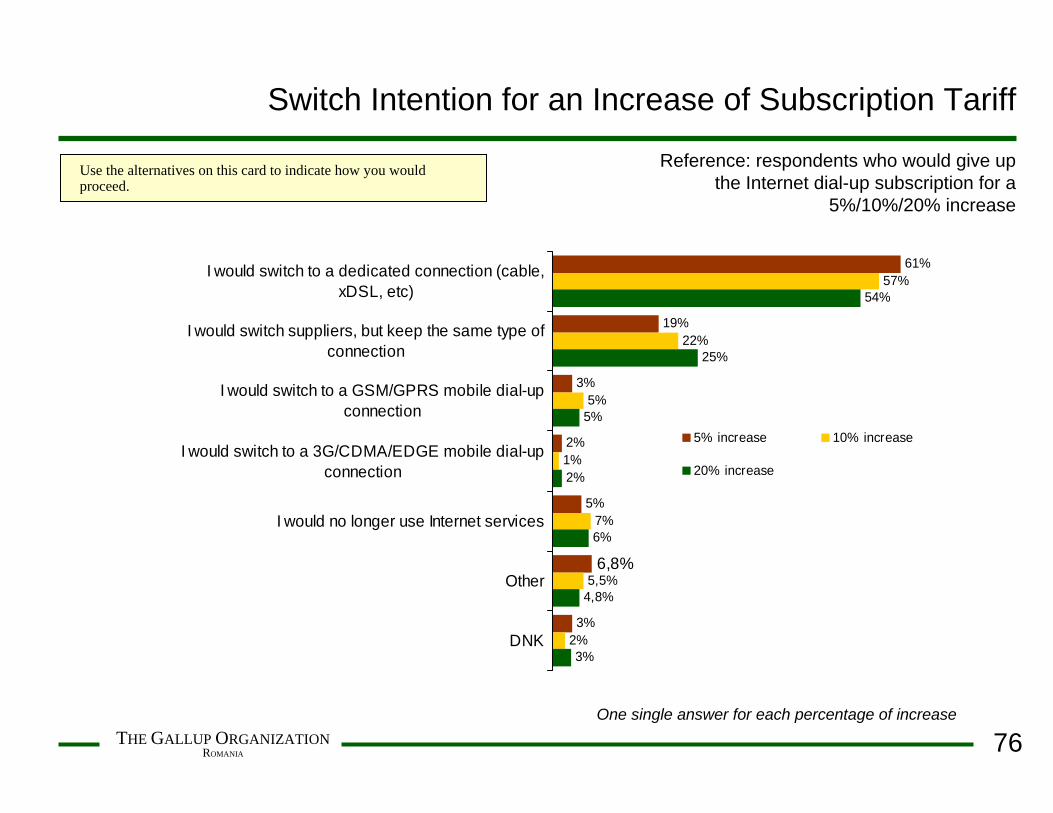
In case of dial-up connections based on subscription, the increase in the subscription tariff by 5% generates the intention to renounce the provider’s services among 25% of the respondents. Taking into consideration the percentage of those who stated their intention to renounce the dial-up connection within the next year, one may conclude that a 5% increase in the subscription price does not lead directly to the decision to renounce the provider’s services.

69THE GALLUP ORGANIZATIONROMANIA
Things are different in case of a 10% or 20% increase in the subscription tariff, in which cases 42%, respectively58% of the respondents stated that it was probable or even certain that they would renounce the provider’s services.
In case of an increase in the tariffs of telephone calls for dial-up Internet access (for example, Internet special access tariffs, ClickNet Start tariffs), 41% of those using fixed telephone line or ISDN connections stated that they would change the connection with a dedicated access connection. 14% of the would choose a mobile access connection, 12% would not do anything and 11% stated that they would no longer use Internet services.
Intentions to Change the Providers or the Types of Dial-up Internet Access Connections

70THE GALLUP ORGANIZATIONROMANIA
Obstacles against Switching to other Internet Dial-up Supplier
You indicated that you are disatisfied with the services of yourcurrent Internet supplier(s). Why have you not given up on theirservice so far?
42%
15%
11%
11%
7%
2%
2%
6%
6%
I have no alternative in the area
Out of convenience
I am not aware of other offers
Cost of change is too high
All suppliers offer low service quality
All suppliers have high tariffs
Too long to instal a dedicated connection
Other
DNK
Reference: respondents who are dissatisfied with their Internet dial-up
supplier (N=88)
Restrictions in the contractThis connection is used as a back-upNo time to switchA member of household is againstDebts owed to current supplier
More than one question, assisted answer

71THE GALLUP ORGANIZATIONROMANIA
Intention to Giving Up the Internet Dial-up Connection in the following 12 Months
Do you intend to give up your household dial-up connection(s) in the following 12 months? [IF probably yes or certainly yes] Which one of them?
74%
7%
6%
6%
4%
1%
1%
Romtelecom - fixed line
Vodafone - GPRS/WAP
Romtelecom - ISDN
RDS
Zapp
Orange - GPRS/WAP
Xnet
Certainly yes19%
Certainly no21% Probably no
16%
Probably yes11%
DNK33%
Reference: households with dial-upInternet connection, N = 258
Which connection?
N=68
Open-ended question with more than one answer

72THE GALLUP ORGANIZATIONROMANIA
13%
16%
10%
30%
16%
15%
17%
25%
23%
23%
31%
40%
17%
13%
12%
0% 20% 40% 60% 80% 100%
Limited hours or trafficsubscription
Partially limitedsubscription and pay for
additional hours
Unlimited subscription(unlimited access)
Certainly yes Probably yes Probably no Certainly no DNK
Intention to Giving Up Internet Dial-up Connection in the following 12 Months - per Type of Subscription
Do you intend to give up your household dial-up connection(s) over the following 12 months?
What type of subscriptions do you have in your household for dial-up connections?
Reference: households with Internet dial-up connection
[N=30]
[N=32]
[N=152]

73THE GALLUP ORGANIZATIONROMANIA
Main Reason for Giving Up an Internet Dial-up Connection
What is the main reason why you consider giving up thisconnection?
37%
21%
19%
4%
4%
3%
3%
3%
1%
4%
Speed too low for need
Too high tariffs compared to quality
To use more advanced technology
Line too busy
Cannot use line simultaneously for Internet andphone
Difficulties in downloading big files
Unstable connection, with frequent interruptions
A better offer
No one in the households use the connectionanymore
DNK
Reference: respondents who indicated that they would probably or certainly give up a dial
up connection over the following 12 months(N=68)
One single answer

74THE GALLUP ORGANIZATIONROMANIA
31%
23%
8%
8%
8%
23%
50%
20%
10%
10%
10%
37%
18%
26%
5%
5%
3%
5,3%
Speed too low for need
To use a more advanced technology
Too high tariffs for offered quality
Line is busy too often
Difficulties in downloading big files
Unstable connection with frequent interruptions
I cannot use the line for Internet and phonesimultaneously
Other
DNK
Limited hour or traffic subscription
Partially limited access subscription, withpay for additional hours
Unlimited subscription (unlimited access)
Main Reason for Giving Up an Internet Dial-up Connection– per Type of Subscription
What is the main reason why you consider giving up this connection?
What type of subscription do you have for the household dial-up connection (s)?
[N=13]
[N=10]
[N=38]
Reference: respondents who indicated that they will probably or certainly give up a dial-up
connection over the following 12 month, according to type of subscription they have
One single answer*Interpret results with care because of small number of respondents

75THE GALLUP ORGANIZATIONROMANIA
Would Respondents Give Up the Services of their Current Supplier if Subscription Tariffs Increased by 5% / 10% / 20%?
Would you give up the services of your current Internet dial-up supplier if they increased tariffs by 5%? What about 10%? What about 20%?
Reference: households with Internet dial-upsubscription (N=214)
18%
22%
37%
10%
20%
22%
27%
20%
9%
25%
17%
12%
21%
21%
20%
0% 20% 40% 60% 80% 100%
5% increase
10% increase
20% increase
Certainly YES Probably YES Probably NO Certainly NO DNK
76THE GALLUP ORGANIZATIONROMANIA
61%
19%
3%
2%
5%
3%
57%
22%
5%
1%
2%
54%
25%
5%
2%
6%
3%
6,8%5,5%
7%
4,8%
I would switch to a dedicated connection (cable,xDSL, etc)
I would switch suppliers, but keep the same type ofconnection
I would switch to a GSM/GPRS mobile dial-upconnection
I would switch to a 3G/CDMA/EDGE mobile dial-upconnection
I would no longer use Internet services
Other
DNK
5% increase 10% increase
20% increase
Switch Intention for an Increase of Subscription Tariff
Use the alternatives on this card to indicate how you wouldproceed.
Reference: respondents who would give up the Internet dial-up subscription for a
5%/10%/20% increase
One single answer for each percentage of increase

77THE GALLUP ORGANIZATIONROMANIA
Switch Intentions for a Increase of Telephone Tariffs for Internet Dial-up Connections
What if the telephone tariffs for Internet dial-up connection (for example, special Internet access tariffs or ClickNet Start) increased, how would you proceed?
41%
14%
11%
1%
1%
12%
20%
I would switch to a dedicated connection
I would switch to a GSM/GPRS mobile dial-upconnection
I would no longer use Internet services
I would switch to a 3G/CDMA/EDGE mobile dial-up connection
Other
I would do nothing
DNK
Reference: households with dial-upconnection via fixed phone line or ISDN
(N=205)
One single answer

VII. Dedicated Internet access connections market

VII.a. Types of dedicated access connections used and usage level

80THE GALLUP ORGANIZATIONROMANIA
Types of Dedicated Access Connections Used and Usage Level
40% of the households using the Internet through dedicated access have a TV cable connection, 31% of them have a UTP/FTP cable connection (local network), and 24% of them have an optical fiber connection
83% of the households using the Internet through dedicated access pay a monthly subscription with unlimited traffic and only 6% of them pay a monthly subscription with limited traffic, with the payment of additional traffic. The average traffic volume included in the subscription with limited traffic is 1136 Mb. One may notice the very high percentage (more than 60%) of those who do not know the traffic volume included in the subscription.
The average amount of the expenses related to dedicated Internet services was RON 44.1 during the last month.
The weekly average traffic on a dedicated connection is 934 Mb. Again, one may notice the very high percentage (65%) of dedicated Internet users who do not know their weekly traffic.
The average number of navigation hours within one week is 23. One may notice that the easiest measuring unit for the use of Internet is the hour, the percentage of non-answers being much lower, below 20%.

81THE GALLUP ORGANIZATIONROMANIA
40%
31%
24%
4%
1%
0,2%
1%
TV cable
UTP/FTP cable(neighbourhood network)
Fiber optics
xDSL(ADSL, SDSL,HDSL)
Radio (radiomodem ormicrowave)
Satellite
Other
Type of Dedicated Connections in Households
What type(s) of Internet connections do you have in yourhousehold?
Reference: households with dedicated Internet connections, N=1122
More than one answer

82THE GALLUP ORGANIZATIONROMANIA
83%
6%
1%
10%
0,3%
Monthly unlimitedsubscription
Monthly limitedsubscription and pay for
additional traffic
Subscription for trafficpay as you go
Other
DNK
Type of Dedicated Connection Subscriptions
What type of subscription do you currently have for yourdedicated connection?
Reference: households with dedicated Internet connections, N=1122
More than one answer

83THE GALLUP ORGANIZATIONROMANIA
86%
4%
1%
9%
82%
7%
2%
86%
6%
9%
84%
7%
%
1%
9%
Monthly unlimitedsubscription
Monthly limitedsubscription and pay for
additional traffic
Subscription for traffic payas you go
Other
DNK
200 RON or less (N=109)
201-400 RON (N=259)
401-600 RON (N=213)
600+ RON (N=282)
Type of Subscription Used for Dedicated Connectionsby household income per capita
Reference: households with dedicated Internet connections, N=1122
What type of subscription do you currently have for the dedicated connection?
*259 respondents did not disclose their income

84THE GALLUP ORGANIZATIONROMANIA
1 GB; 14%
Over 1 GB; 10%
DNK/refusal; 62%
Under 1 GB; 13%
Traffic Included in Monthly Limited Subscriptions
How many MB are included in your subscription?
Reference: households with limited traffic subscriptions,
N = 69
Average traffic included in subscription: 1136 MB

85THE GALLUP ORGANIZATIONROMANIA
2048 kbps (2Mb/s); 5%
>2048 kbps (>2Mb/s); 2%1024 kbps (1Mb/s);
9%
32 kbps; 9%
64 kbps; 8%
128 kbps; 20%
<32 kbps; 10%
512 kbps; 21%
256 kbps; 17%
Minimum Guaranteed Speed
Please indicate the minimum guaranteed speed of data transfer (kbps) for your dedicated Internet connection.
Reference: households with dedicated Internet connections, N=1122
Answer; 49%
DNK; 51%
N=576
N=546

86THE GALLUP ORGANIZATIONROMANIA
2048 kbps (2Mb/s); 5%
>2048 kbps (>2Mb/s); 5%
Other; 1%
1024 kbps (1Mb/s); 12%
32 kbps; 7%
64 kbps; 13%
128 kbps; 18%
<32 kbps; 6%
512 kbps; 19%
256 kbps; 14%
Real Speed
Please indicate the real speed of transfer for your dedicated Internet connection (kbps)?
Answer; 46%
DNK; 54%
N=606
N=516
Reference: households with dedicated Internet connection, N=1122

87THE GALLUP ORGANIZATIONROMANIA
2048 kbps (2Mb/s); 5%
>2048 kbps (>2Mb/s); 17% Other; 1%
1024 kbps (1Mb/s); 15%
32 kbps; 3%
64 kbps; 6%
128 kbps; 13%
512 kbps; 24%
256 kbps; 17%
Maximum Guaranteed Speed (best effort) per Contract
What is the maximum guaranteed speed (best effort) (kbps) for your dedicated Internet connection?
Answer; 42%
DNK; 58%
N=650
N=472
Reference: households with dedicated Internet connection, N=1122

88THE GALLUP ORGANIZATIONROMANIA
Comparison between Maximum Guaranteed (best effort) and Real Speed
What is the maximum guaranteed speed (best effort) (kbps) for your dedicated Internet connection?
What is the real speed for your dedicated Internet connection(kbps)?
Reference: households with dedicated Internet connections, N=1122
Number of cases (N)
Count
573 12 5 9 9 8 18 11 4 1 0 6500 0 1 0 0 0 0 0 0 0 0 10 3 9 0 0 0 0 0 0 0 0 121 4 10 14 0 1 0 0 0 0 0 301 4 7 27 20 1 0 0 0 0 0 604 1 1 7 37 26 3 0 0 0 0 79
11 4 2 5 16 21 54 1 0 0 0 11410 0 2 2 3 13 17 20 0 0 2 692 0 0 0 1 1 2 13 4 1 0 244 0 0 2 7 1 2 18 19 25 0 780 2 0 1 0 0 0 0 0 0 2 5
606 30 37 67 93 72 96 63 27 27 4 1122
DNK<32 kbps32 kbps64 kbps128 kbps256 kbps512 kbps1024 kbps (1Mb/s)2048 kbps (2Mb/s)>2048 kbps (>2Mb/s)Other
maximumguaranteed
(best effort)
Total
DNK<32kbps
32kbps
64kbps
128kbps
256kbps
512kbps
1024 kbps(1Mb/s)
2048 kbps(2Mb/s)
>2048 kbps(>2Mb/s) Other
Real Speed
Total

89THE GALLUP ORGANIZATIONROMANIA
3%
32% 31%
13%
5%3% 2% 1%
8%
0,4% 2%0,6%0%
20%
40%
10 RONor less
11-20RON
21-30RON
31-40RON
41-50RON
51-60RON
61-70RON
71-80RON
81-90RON
91-100RON
over100RON
DNK
Internet Dedicated Connection Monthly Expenses
Average amount paid last month: 44,1 RON
What is the approximate amount that your household paid last month for all Internet services used, irrespectively of type of connection (RON, including VAT)?
Reference: households with dedicated Internet connections, N = 1122

90THE GALLUP ORGANIZATIONROMANIA
42,9 RON
42,2 RON
46,2 RON
42,4 RON
0 10 20 30 40 50 60 70
200 RON or less
201-400 RON
401-600 RON
600+ RON
average value
[N=109]
Internet Dedicated Connection Monthly Expenses by household income per capita
How much do you pay monthly for Internet access on this connection (RON including VAT)? If Internet services are part of a bigger package of services (TV cable, telephony) please refer only to Internet costs
Reference: households with dedicated Internet connection
[N=259]
[N=213]
[N=282]
Income per householdmember:
*259 respondents did not disclose their income

91THE GALLUP ORGANIZATIONROMANIA
101-500 MB; 7%
501-1000 MB; 6%
over 1 GB; 6%
100 MB or less; 16%
DNK; 65%
Weekly Traffic on Dedicated Internet Connection
Please indicate the approximate traffic that you use on your dedicated Internet connection in an average week (megabytes - MB).
Average Weekly Traffic: 934 MB
Reference: households with dedicated Internet connection, N=1122

92THE GALLUP ORGANIZATIONROMANIA
DNK; 19%
3-5 hours; 7%
6-10 hours; 15%
11-20 hours; 21%
1-2 hours; 4%
over 30 hours; 19%
21-30 hours; 15%
Number of Hours of Internet Use for Dedicated Connections per Week
How many hours do you personally use the dedicated connection in your household in an average week?
Average number of Internet use hours per week: 23 hours
Reference: households with dedicated Internet connections, N=1122
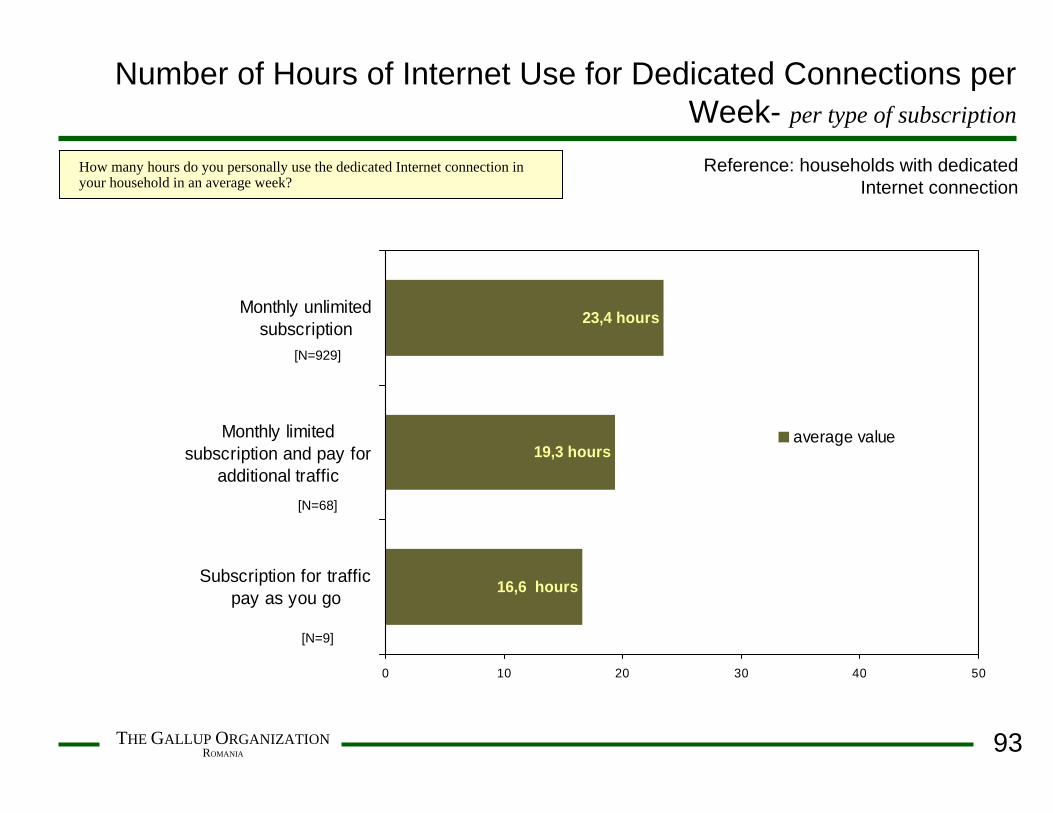
93THE GALLUP ORGANIZATIONROMANIA
16,6 hours
19,3 hours
23,4 hours
0 10 20 30 40 50
Monthly unlimitedsubscription
Monthly limitedsubscription and pay for
additional traffic
Subscription for trafficpay as you go
average value
[N=929]
Number of Hours of Internet Use for Dedicated Connections per Week- per type of subscription
[N=68]
[N=9]
How many hours do you personally use the dedicated Internet connection in your household in an average week?
Reference: households with dedicated Internet connection

VII.b. Level of satisfaction with the providers of
dedicated Internet access

95THE GALLUP ORGANIZATIONROMANIA
Level of Satisfaction with Dedicated Internet Access Providers
The three most important criteria based on which dedicated Internet access services are chosen are “the real transfer speed”, “subscription price” and “band width”.
The general satisfaction with the providers of dedicated Internet access services is similar for the three main providers existing on the market (UPC/Astral, RCS/RDS and Romtelecom), more than 70% of the users of each provider being satisfied or very satisfied. However, the percentage of those who are very satisfied is significantly higher among RCS users (48%) than among the other users (27% Romtelecom, 33% UPC/Astral).
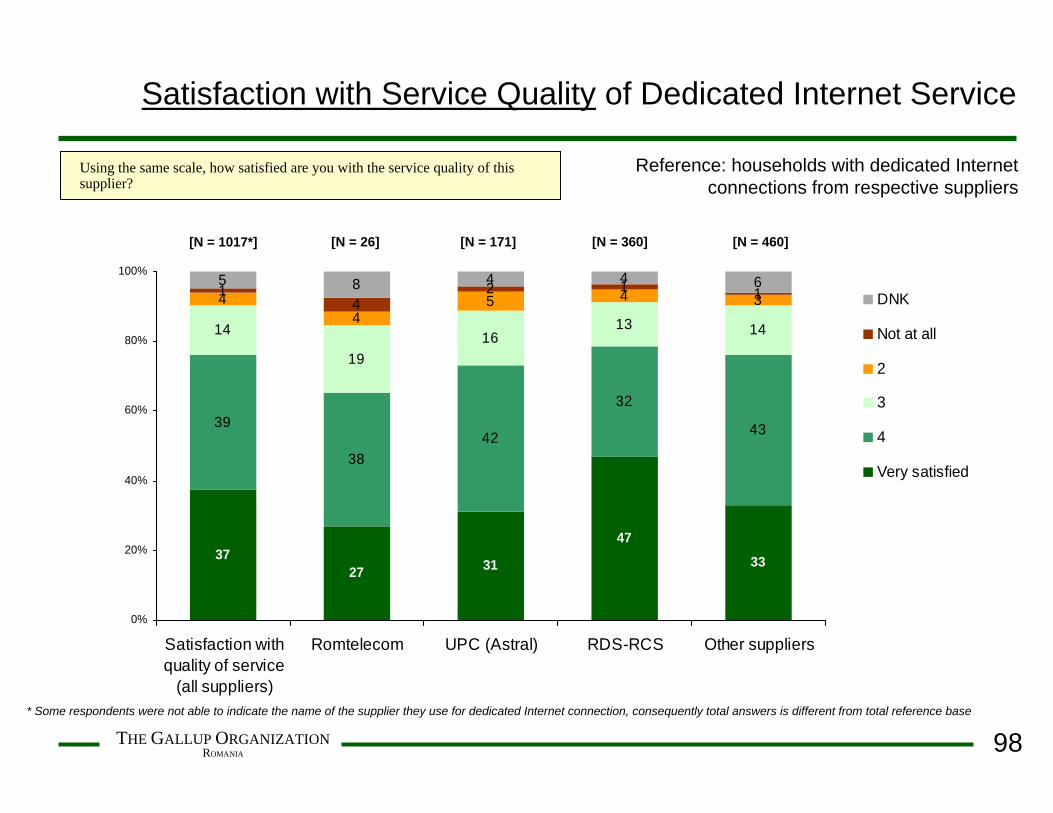
The analysis of users’ satisfaction by connection types reveals that the highest percentage of very satisfied users is recorded in the case of TV cable and optical fiber connections (43%, respectively 41%), however, if we discuss into detail the quality of the services for the two connection types, the level of satisfaction for the TV cable connection is higher than that for the optical fiber connection (44%, compared to 35%). In the case of local networks, even if the level of usage is higher, the satisfaction is a little lower, the percentage of very satisfied users being approximately 34%.
The analysis of satisfaction with the services offered by the providers of dedicated access connections indicates that the highest scores are recorded in relation to the “subscription price”, “speed” (real speed and band width), “installation cost” and time required for the installation of this type of connection.
Among the providers of dedicated access connections, RCS/RDS has the highest satisfaction scores for all services offered, being followed by UPC/Astral.

96THE GALLUP ORGANIZATIONROMANIA
73% 72%66% 64% 62% 60% 59% 58% 56% 55% 54% 52%
47%43%
3,43,2
3,63,73,73,73,83,93,83,94,3
3,94,14,2
0
20
40
60
80
100
Rea
l spe
ed o
f tra
nsfe
r
Pric
e of
sub
scrip
tion
Ban
dwid
th
Ava
ilabi
lity
of s
ervi
ce in
the
area
Tim
e to
inst
alla
tion
Cos
ts o
f ins
talla
tion
Con
tract
gua
rant
ees
of s
ervi
cepa
ram
eter
s
Tech
nica
l sup
port
and
emer
genc
ytro
uble
shoo
ting
time
Flex
ibili
ty o
f pric
e an
d co
nditi
ons
Pro
tect
ion
agai
nst v
irus,
spa
m a
ndha
ckin
g
Sup
plie
r rep
utat
ion
Exi
sten
ce a
nd a
vaila
bilit
y of
cus
tom
erse
rvic
e
Pro
mot
ions
Oth
er b
undl
ed s
ervi
ces
(fixe
d te
leph
ony,
CA
TV)
1
2
3
4
5
Top 2 Box (%important + veryimportant)
average value (1 =not at all ... 5 =very important)
%
Importance of Selection Criteria for Dedicated Internet Services
When you selected your dedicated Internet conneciton, how important were the following criteria for you? Please use a scale from 1 to 5 where 1 is not at all and 5 is very important.
Reference: households with dedicated Internet connections, N = 1122
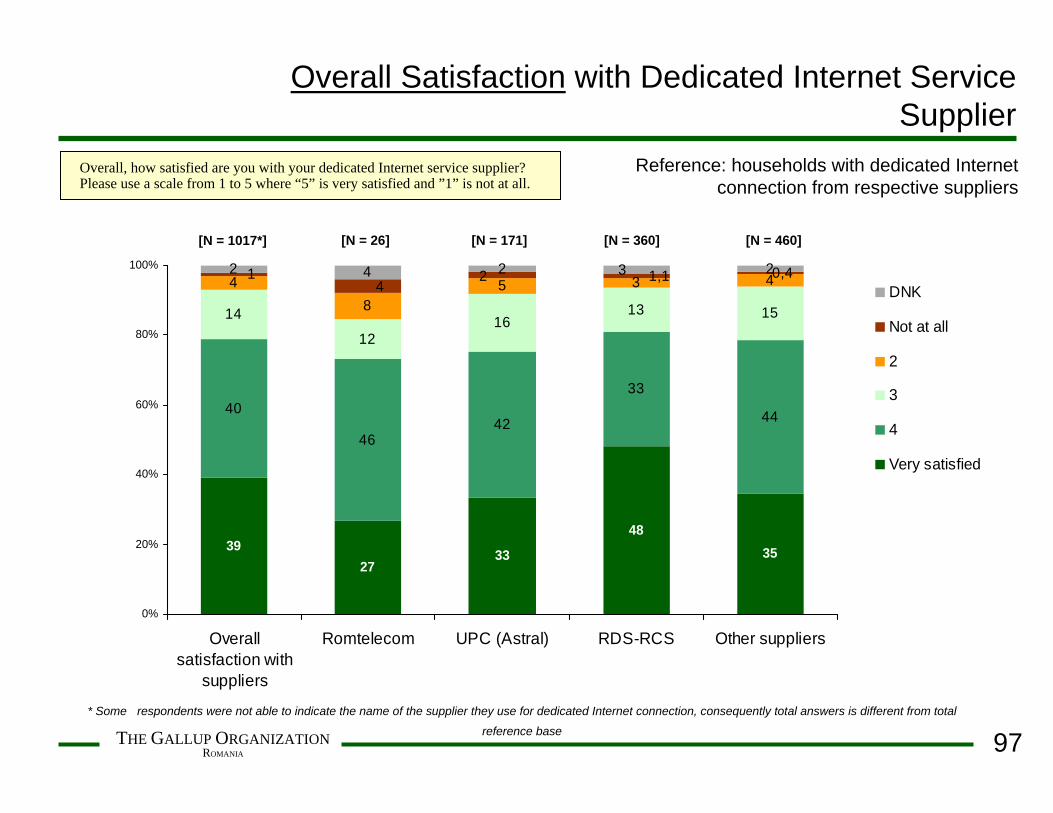
97THE GALLUP ORGANIZATIONROMANIA
3927
33
4835
40
4642
33
44
14
1216
13 15
48
5 3 42 4 2 20,41 2 1,1
43
0%
20%
40%
60%
80%
100%
Overallsatisfaction with
suppliers
Romtelecom UPC (Astral) RDS-RCS Other suppliers
DNK
Not at all
2
3
4
Very satisfied
Overall Satisfaction with Dedicated Internet Service Supplier
Overall, how satisfied are you with your dedicated Internet service supplier? Please use a scale from 1 to 5 where “5” is very satisfied and ”1” is not at all.
Reference: households with dedicated Internet connection from respective suppliers
[N = 26] [N = 171] [N = 360] [N = 460][N = 1017*]
* Some respondents were not able to indicate the name of the supplier they use for dedicated Internet connection, consequently total answers is different from total
reference base
98THE GALLUP ORGANIZATIONROMANIA
3727 31
47
33
39
3842
32
43
14
1916
13 14
44
5 4 31 2 1 15 8 4 4 6
4
0%
20%
40%
60%
80%
100%
Satisfaction withquality of service
(all suppliers)
Romtelecom UPC (Astral) RDS-RCS Other suppliers
DNK
Not at all
2
3
4
Very satisfied
Satisfaction with Service Quality of Dedicated Internet Service
Using the same scale, how satisfied are you with the service quality of this supplier?
[N = 26] [N = 171] [N = 360] [N = 460][N = 1017*]
* Some respondents were not able to indicate the name of the supplier they use for dedicated Internet connection, consequently total answers is different from total reference base
Reference: households with dedicated Internet connections from respective suppliers

99THE GALLUP ORGANIZATIONROMANIA
43 4132
38 33 34
34 3946
25
5644
14 1410
13
11
15
4 25
6
41 213
3 4 5 6 30,51
0%
20%
40%
60%
80%
100%
TV cable Fiber optics xDSL(ADSL,SDSL, HDSL)
Radio Satellite UTP/FTPcable
DNK
Not at all
2
3
4
Very satisfied
Overall Satisfaction with Dedicated Internet Supplierper type of connection
Overall, how satisfied are you with your dedicated Internet connection supplier? Please use a scale from 1 to 5 where “5” is very satisfied and “1” is not at all.
[N = 365] [N = 9] [N = 421][N = 273] [N = 41] [N = 16]
Reference: households with dedicated Internet connection

100THE GALLUP ORGANIZATIONROMANIA
4435
24
38 33 33
3142
49 25
56
41
15 1315
13
11
14
5 3 5 31
19
4 6 7 6 81
0%
20%
40%
60%
80%
100%
TV cable Fiber optics xDSL(ADSL,SDSL, HDSL)
Radio Satellite UTP/FTPcable
DNK
Not at all
2
3
4
Very satisfied
Satisfaction with Service Quality from Dedicated Internet Suppliersper type of connection
Using the same scale, how satisfied are you with the service quality from the respective supplier?
[N = 365] [N = 9] [N = 421][N = 273] [N = 41] [N = 16]
Reference: households with dedicated Internet connections

101THE GALLUP ORGANIZATIONROMANIA
Overall Satisfaction with Dedicated Internet Supplier – all suppliers -
Please indicate on a scale from 1 to 5 where 1 is not at all and 5 is very satisfied, how satisfied you are with your dedicated Interned supplier services in relation to the following criteria:
31
30
25
32
36
24
23
26
22
34
25
34
32
30
27
30
24
29
27
19
28
27
16
18
15
13
16
16
17
18
19
17
15
19
5
5
7
4
9
5
4
9
9
7
12
6
7
1
2
3
1
12
5
3
8
5
3
11
4
5
14
13
14
21
16
12
17
16
18
19
13
17
38
27
32
20
18
10
0% 20% 40% 60% 80% 100%
Bandwidth
Real speed of transfer
Technical support and emergency troubleshooting time
Price of subscription
Bundled services (fixed telephony, CATV)
Service availability in the area (offers available)
Costs of installation
Protection against virus, spam, hacking
Existence and availability of customer service
Contractual gurantees of service parameters
Promotions
Time to installation
Flexibility of prices and conditions
very satisfied 4 3 2 not at all DNK
Reference: households with dedicated Internet connections, N=1122
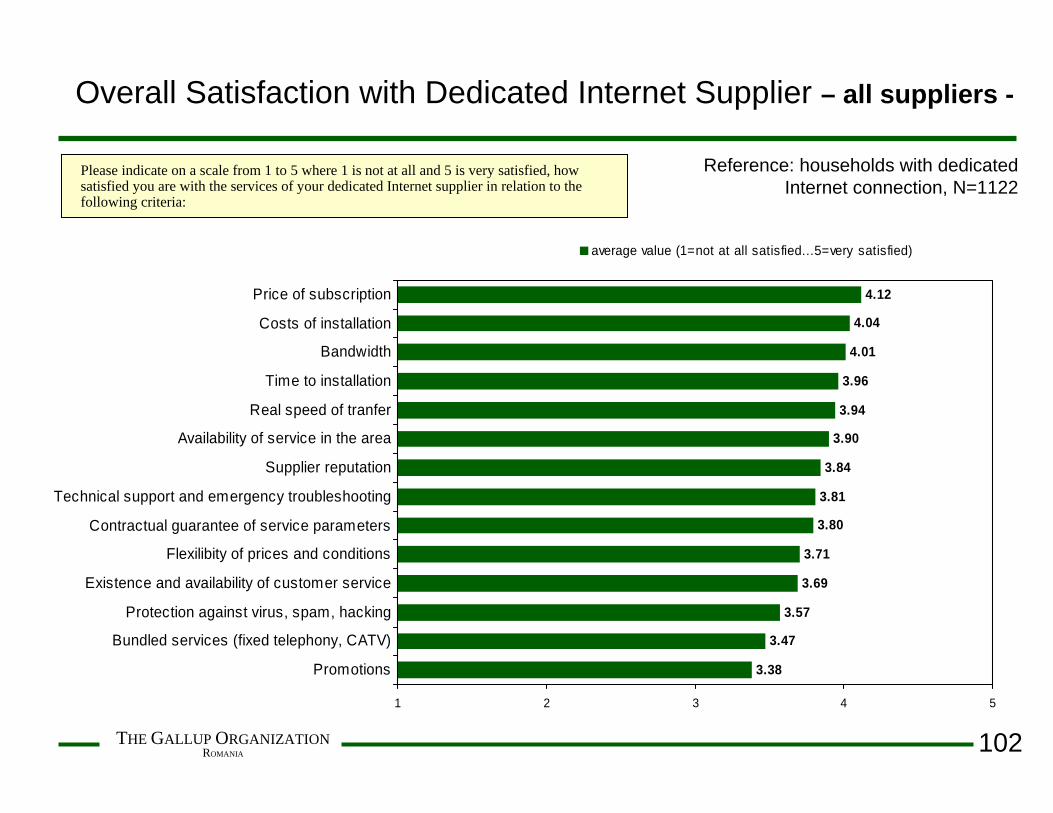
102THE GALLUP ORGANIZATIONROMANIA
Please indicate on a scale from 1 to 5 where 1 is not at all and 5 is very satisfied, how satisfied you are with the services of your dedicated Internet supplier in relation to the following criteria:
4.12
4.04
3.94
3.90
3.84
3.81
3.80
3.71
3.69
3.57
3.47
3.38
3.96
4.01
1 2 3 4 5
Price of subscription
Costs of installation
Bandwidth
Time to installation
Real speed of tranfer
Availability of service in the area
Supplier reputation
Technical support and emergency troubleshooting
Contractual guarantee of service parameters
Flexilibity of prices and conditions
Existence and availability of customer service
Protection against virus, spam, hacking
Bundled services (fixed telephony, CATV)
Promotions
average value (1=not at all satisfied...5=very satisfied)
Overall Satisfaction with Dedicated Internet Supplier – all suppliers -
Reference: households with dedicated Internet connection, N=1122

103THE GALLUP ORGANIZATIONROMANIA
Overall Satisfaction with Dedicated Internet Supplier (1) average value (1=not at all...5=very satisfied)
Please indicate on a scale from 1 to 5 where 1is not at all and 5 is very satisfied, how satisfied you are with your dedicated Internet supplier in relation to the following criteria:
4,14
4,05
3,75
4,20
3,96
3,80
3,72
3,81
3,51
3,88
3,64
3,56
3,38
3,32
3,12
3,42
3,89
3,99
1 2 3 4 5
Bandwidth
Real speed of transfer
Contractual guarantee of serviceparameters
Teechnical support andemergency troubleshooting time
Protection against virus, spam andhacking
Availability of service in the area(offers)
RDS (N=360) UPC-Astral (N=171) Romtelecom (N=26)
Reference: households with dedicated Internet connection

104THE GALLUP ORGANIZATIONROMANIA
Overall Satisfaction with Dedicated Internet Supplier(2) average value (1=not at all...5=very satisfied)
Please indicate on a scale from 1 to 5 where 1is not at all and 5 is very satisfied, how satisfied you are with your dedicated Internet supplier in relation to the following criteria:
4,43
3,93
3,88
3,89
3,84
3,27
3,80
3,90
3,53
3,31
3,35
3,00
3,46
3,23
3,60
2,88
4,40
3,94
1 2 3 4 5
Subscription price
Flexibility of prices and conditions
Time to installation
Costs of installation
Existence and availability ofcustomer service
Promotions
RDS (N=360) UPC-Astral (N=171) Romtelecom (N=26)
Reference: households with dedicated Internet connection

VII.c. Intentions to change the providers or types of
dedicated Internet access

106THE GALLUP ORGANIZATIONROMANIA
Intentions to Change the Providers or Types of Dedicated Internet Access Connections
The main obstacle against changing the dedicated Internet access connection in case of dissatisfaction with the providers’ services is the lack of an alternative (almost half of the respondents stating that they do not have anyother alternative in the area they live in). The next reason is “idleness” (15%) and, almost equally important (11%), the fact that “they do not know other offers” and “the too high cost of changing the provider”.
Only 9% of the dedicated connection users intend to change their current connection within the next 12 months.Among them, 41% intend to purchase a TV cable connection, and 36% have a UTP/FTP cable connection from a local network.
The main reasons for changing the provider are related to the “insufficient speed for the current needs”, “instability of the current connection” and financial reasons (high tariffs practiced by the current provider and emergence of more profitable offers).
In case of a 5% increase in the tariffs for dedicated access connection, only 10% of the users consider renouncing the current connection. In case of a 10% increase in the tariffs for the dedicated connection, only 20% of the users consider renouncing the current connection. But in case of a 20% increase in the tariffs for the dedicated access connection, the percentage of those users who consider renouncing the current connection is significantly higher -40%.
The typical behavior in case of tariff increase is changing the provider and maintaining the current type of connection. Only 13% of the respondents intend to change their current dedicated access connection type.
Only 4% of the users will no longer use the Internet in case of tariff increase.

107THE GALLUP ORGANIZATIONROMANIA
42%
15%
11%
11%
7%
6%
6%
2%
2%
No alternative in my area
Out of convenience
I am not aware of other offers
Costs of switching is too high
All suppliers offer low quality
All suppliers offer high tariffs
Too much time to installation
Other
DNK
You indicated that you were disatisfied with the services of your currentInternet dedicated supplier. Why have you not given up their services sofar?
Reference: respondents who indicated their dissatisfaction with their Internet dedicated
supplier (answers 1, 2 or 3 to satisfaction to supplier question), N=212
Obstacles against Switching Internet Dedicated Connection Suppliers
Low tariffs (4 answers)Contractual restrictions (2 answers)Good data transfer speedOther household member makes this decisionNew connectionI need InternetI will give up (2 answers)
More than one answer

108THE GALLUP ORGANIZATIONROMANIA
Intention to Giving Up the Dedicated Connection over the following 12 Months
41%
36%
12%
7%
4%
TV cableUTP/FTP cable(neighbourhood
Fiber optics
xDSL(ADSL,SDSL, HDSL)
Radio
Certainly yes3%
Certainly no65%
Probably no26%
Probably yes6%
Which connection?
N=100
Reference: households with Internet dedicated connection, N=1122
Do you intend to give up any of dedicated connections of your household in the following 12 months?
What type(s) of connection do you have in your household?
More than one answer, assisted answer

109THE GALLUP ORGANIZATIONROMANIA
3%
3%
4%
6%
32%
26%
60%
65%
100%
0% 20% 40% 60% 80% 100%
Monthly unlimitedsubscription
Monthly limited subscriptionand pay for additional traffic
Subscription for traffic payas you go
Certainly yes Probably yes Probably no Certainly no
Intention to Giving Up Internet Dedicated Connection over the following 12 Months per Type of Subscription
Do you intend to give up your Internet dedicated connection over the following 12 months?
What type of subscription do you currently have for your Internet dedicated connection?
Reference: households with Internet dedicated connections, per type of
subscription
[N=68]
[N=928]
[N=9]

110THE GALLUP ORGANIZATIONROMANIA
Main Reason for Giving Up the Internet Dedicated Connection
What is the main reason why you intend to give up this connection?
22%
17%
14%
10%
8%
7%
4%
5%
13%
Speed too low for need
Unstable connection
Too high tariffs as compared to benefits
Better alternative offers
Personal reasons (change of residence, etc.)
Low quality of technical support
Difficulties in downloading big files
Other
DNK
Reference: respondents who indicated that they probably or certainly give up the Internet
dedicated connection over the following 12 months (N=100)
One single answer, assisted

111THE GALLUP ORGANIZATIONROMANIA
29%
5%
15%
17%
5%
5%
2%
15%
23%
15%
8%
8%
14%
14%
43%
14%
23%
3%
11%
14%
6%
9%
11%
9%
14%
7%23%
23%
14,3%
Speed too low for need
Difficulties in downloadingbig files
Unstable connection
Too high tariffs ascompared to benefits
Low quality of technicalsupport
Better alternative offers
Personal reasons
Other
DNK
TV cable (N=41)
Fiber optics
xDSL(ADSL. SDSL, HDSL) (N=7)
UTP/FTP cable (N=35)
Main Reason for Giving Up the Internet Dedicated Connection per Type of Connection
What is the main reason why you are considering giving up this connection?
What type of Internet connection does your household have?
Reference: respondents who indicated that they would probably or certainly give up an Internet
dedicated connection over the following12 months
One single answer, assisted
Probably or certainly giving up to...

112THE GALLUP ORGANIZATIONROMANIA
Intention to Giving Up Supplier for a Subscription Increase by 5% / 10% / 20%?
Would you give up the services of your Internet dedicated supplier if they increased tariffs by 5%? What about 10%? What about 20%?
5%
7%
17%
5%
13%
23%
26%
34%
24%
49%
31%
20%
14%
14%
16%
0% 20% 40% 60% 80% 100%
5% increase
10% increase
20% increase
Certainly YES Probably YES Probably NO Certainly NO DNK
Reference: households with Internet dedicated connection, N=1122

113THE GALLUP ORGANIZATIONROMANIA
Intention to Switch Suppliers if Internet Dedicated Supplier Increased Tariffs
Using the alternatives on this card, how do you think you would proceed?
50%
26%
5%
5%
1%
12%
57%
17%
6%
4%
13%
60%
13%
5%
4%
2%
16%
,4%
2%
,2%
I would switch suppliers and keep the same type ofconnection
I would switch to a dedicated connection (cable,xDSL, etc)
I would switch to a fixed line or ISDN dial-upconnection
I would no longer use Internet services
I would switch to a GSM-CSD/GPRS mobile dial-upconnection
I would switch to a EDGE/3G/CDMA mobile dial-upconnection
DNK
5% increase(N=111)
10% increase (N=233)
20% increase (N=450)
Reference: respondents who would give up Internet dedicated connection subscription for an increase of tariff by 5%/10%/20% (N=450)
One single answer

VIII. Existence of previous connections in the household

115THE GALLUP ORGANIZATIONROMANIA
Existence of Previous Connections in the Households
23% of the Internet users have had, before the current connection, other connections which they renounced in time. The maximum speed of the connections they have renounced was below 64 kbps for one quarter of these, and below 256 kbps for more than half of these.
The highest level of renouncing Internet connections is recorded in the case of fixed line dial-up connection (51%), followed by the dedicated access connection through UTP/FTP cable (21%).
Those who renounced the fixed line dial-up connection chose the TV cable connection (34%), the UTP/FTP cable connection (28%) and the optical fiber connection (20%).
We find the same structure of options in the case of those who renounced the UTP/FTP cable connection. This market of UTP/FTP cable connections provided by local networks is the most dynamic of all dedicated access connections markets, with a high level of provide renunciation, but a high level of fidelity for the connection type.

116THE GALLUP ORGANIZATIONROMANIA
No; 71%
DNK; 6%
YES, I used another connection I gave up;
23%
Have you Ever Given Up an Internet Connection?
Before the current Internet connection you use, did you use other types of connections that you have given up in the meantime?
Reference: household Internet users, N=1351

117THE GALLUP ORGANIZATIONROMANIA
0,3%
0,7%
0,3%
0,7%
4%
2,0%
20,7%
4,6%
6,9%
2,3%
51,3%
6,6%
fixed line dial-up
ISDN
GSM-CSD/GPRS mobile dial-up
dedicated (unspecified)
CATV
fiber optics
radio
satellite
xDSL
UTP/FTP cable for neighbourhood network
other
DNK
Type of Internet Connection Respondents Gave Up
What type of Internet connection did you use before (the last one you gave up, if you used more than one)?
Reference: respondents who previously used another connection and gave it up, N=304
Total dedicated connections:
35%
Total dial-upconnections :
61%
One single answer

118THE GALLUP ORGANIZATIONROMANIA
1%
2%
6%
3%
28%
20%
2%
3%
8%
34%
Fixed telephone line
ISDN
GSM-CSD/GPRS/WAP mobile access
CDMA/EVDO (Zapp) mobile access
TV cable
Fiber optics
xDSL(ADSL, SDSL, HDSL)
Radio (radiomodem or microwave)
Satellite
UTP/FTP cable (neighbourhood network)
Types of Connections that Respondents Who Gave Up Fixed Dial-Up Connection Currently Have
What type(s) of connection(s) does your household have? Reference: respondents who used to use a dial-up connection before and gave up, N=156
10% have fixed dial-up/ISDN connection
5% have mobile connection
90% have dedicated connection
More than one answer

119THE GALLUP ORGANIZATIONROMANIA
28%
28%
1%
2%
1%
6%
1%
4%
7%
27%
Fixed telephone line
GSM-CSD/GPRS/WAP mobile access
CDMA/EVDO (Zapp) mobile access
TV cable
Fiber optics
xDSL(ADSL, SDSL, HDSL)
Radio (radiomodem or microwave)
Satellite
UTP/FTP cable(neighbourhood network)
Other
Types of Connections that Respondents Who Gave Up Dedicated Connection Currently Have
What type(s) of connection(s) does your household have? Reference: respondents who previously used dedicated connection and gave up, N=109
7% have fixed dial-up connection
5% have mobile connection
92% have dedicated connection
More than one answer

120THE GALLUP ORGANIZATIONROMANIA
33%
2%
5%
2%
2%
17%
3%
10%
30%
fixed dial-up
GSM-CSD/GPRS mobile dial-up
3G/CDMA/EDGE mobile dial-up
TV cable
Fiber optics
xDSL(ADSL, SDSL, HDSL)
Satellite
UTP/FTP cable (neighbourhood network)
Other
Type of Connections Owned by Respondents Who Gave Up an UTP/FTP Cable Connection
What type(s) of connection(s) does your household have? Reference: respondents who previously used UTP/FTP cable connection and gave up, N=63
More than one answer

121THE GALLUP ORGANIZATIONROMANIA
DNK; 26%
2048 kbps (2Mb/s); 5%
Other width; 2%
64 kbps; 9%
128 kbps; 8%
256 kbps; 18%
<64 kbps; 17%
1024 kbps (1Mb/s); 6%
512 kbps; 9%
Maximum Speed of Dedicated Connection Previously Owned
What was the maximum speed (best effort) of your previousconnection?
Reference: respondents who used to use a dedicated connection in the household and gave up,
N=109

122THE GALLUP ORGANIZATIONROMANIA
Maximum Speed of Dedicated Connection Previously Owned As Compared to Current Speed
What was the maximum speed (best effort) of your previous connection?
For the dedicated Internet connection you indicated, please tell me the bandwidth or the maximum guaranteed speed.
Reference: respondents who used to use a dedicated connection in the household and
gave up
Numer of cases (N)
3 4 4 7 3 3 2 2 20211 2 13 6 12 2 2 4 11 1 1 3 1 2 1
11 2 2 1 2 1 1 2
114 10 9 19 10 6 5 25
Maximum guaranteed(best effort) speed ofcurrent connection
DNK 32 kbps64 kbps128 kbps256 kbps512 kbps1024 kbps (1Mb/s)2048 kbps (2Mb/s)>2048 kbps (>2Mb/s)OtherTotal
ValidN N N N N N N N N
<64 kbps 64 kbps 128 kbps 256 kbps 512 kbps
1024kbps
(1Mb/s)
2048kbps
(2Mb/s) Other DNK
What was the maximum speed (best effort) of your previous connection?

123THE GALLUP ORGANIZATIONROMANIA
Reasons for Giving Up the Last Internet Dedicated Connection
Think about the last Internet dedicated connection you gave up; what are the main reasons why you gave it up?
37%
24%
10%
7%
7%
6%
3%
3%
10%
6,4%
speed too low for need
too high costs compared to benefits
change of residence
increase in subscription
supplier bankruptcy
technical problems with the connection
better alternative offers
low quality of services
supplier increased tariffs for additional traffic
other
Reference: respondents who previously used an Internet dedicated connection in the household,
N=109
More than one answer

IX. Intention to purchase a new Internet access
connection

125THE GALLUP ORGANIZATIONROMANIA
Intention to Purchase a New Internet Access Connection
11% of the Internet users intend to purchase a new Internet connection within the next 6 months.
Among them, 30% currently use a fixed line dial-up connection, 31% use a TV cable dedicated access connection, and 20% use a UTP/FTP cable dedicated access connection. The type of connection that is preferred by the users who want to purchase a new connection is the TV optical fiber (34%), followed by CATV (14%).
More than 60% of those who want to purchase a new connection would choose a broadband connection.

126THE GALLUP ORGANIZATIONROMANIA
NO; 81%
DNK; 8%
YES; 11%
Intention to Acquire a New Internet Connection over the following 6 months
Do you intend to acquire a new Internet connection over the following 6 months? Reference: household internet users, N=1351

127THE GALLUP ORGANIZATIONROMANIA
1%
2%
5%
3%
20%
4%
7%
2%
31%
30%
fixed dial-up
ISDN
GSM-CSD/GPRS mobile dial-up
3G/CDMA/EDGE mobile dial-up
TV cable
Fiber optics
xDSL(ADSL, SDSL, HDSL)
Radio (radiomodem or microwave)
Satellite
UTP/FTP cable (neighbourhood network)
Type of Connections Owned by Respondents Who Intend to Acquire a New Internet Connection
Do you intend to acquire a new Internet connection over the following 6 months?What type(s) of connection(s) does your household have?
Reference: respondents who intend to acquire a new connection over the following
6 months, N=151
More than one answer

128THE GALLUP ORGANIZATIONROMANIA
3%
1%
34%
2%
19%
3%
11%
14%
2%
5%
1%
5%
fixed dial-up
ISDN
GSM-CSD/GPRS mobile dial-up
3G/CDMA/EDGE mobile dial-up
dedicated (unspecified)
CATV
fiber optics
satellite
xDSL
UTP/FTP cable neighbourhood network
other
DNK, did not decide
Types of Connections Respondents Intend to Acquire
What type of connection do you intend to acquire?
Reference: respondents who intend to acquire a new Internet connection over the following 6 months, N=151
One single answer

129THE GALLUP ORGANIZATIONROMANIA
74%
48%
7%
23%
35%
84%
94%
3%
17%
9%
4%3%
0% 20% 40% 60% 80% 100%
Certainly YES
Probably YES
Probably NO
Certainly NO
Yes, intends to acquire a new connection No DNK
Intention to acquire a new dedicated connection over the following 6 months as compared to intention to give up current connection
Do you intend to give up your dedicated connection over the following 12 months?Do you intend to acquire another Internet connection over the following 6 months?
Reference: Internet users of dedicated connections, N=1122
Does the respondent intend to give up the current connection?
N=35
N=65
N=290
N=732

130THE GALLUP ORGANIZATIONROMANIA
DNK; 11%
2048 kbps (2Mb/s); 15%
Other width; 7%64 kbps; 4%
128 kbps; 5%
256 kbps; 10%
<64 kbps; 2%
1024 kbps (1Mb/s); 24%
512 kbps; 22%
Real Speed of Data Transfer Desired for the New Dedicated Connection
What guaranteed (real) speed of transfer do you want from your new connection ?
Reference: respondents who intend to acquire an Internet dedicated connection over the following 6
months, N=107

131THE GALLUP ORGANIZATIONROMANIA
Real Speed of Data Transfer Desired for the New Dedicated Connection as Compared to the Current Real Speed
Please tell me the real speed of your Internet dedicated connection.
What is the guaranteed (real) speed of transfer you wuold like from the new connection ?
Number of cases (N)
Reference: respondents who intend to acquire an Internet dedicated connection over the following 6
months, N=107
1 11 1 12 2 15 1 4 2 3 1 1
11 1 1 1 2 4
1 1 1 2 1 11 1 1 1 48
30 4 8 6 8 3 5 4 2
Desired speed for new connection
At least 64 kbpsAt least 128 kbpsAt least 256 kbpsAt least 512 kbpsAt least 1024kbps (1Mb/s)2048 kbps (2Mb/s)Other
DNKTotal
ValidN N N N N N N N N
DNK <32 kbps 32 kbps 64 kbps 128 kbps 256 kbps 512 kbps
>2048kbps
(>2Mb/s) Other
Current real speed

X. Profile -- Internet users vs. Non-users

133THE GALLUP ORGANIZATIONROMANIA
Profile of Internet Users vs. Non-Users
No significant gender-based differences.
A significantly higher percentage of Internet users (inside and outside the household) are single, compared to non-users, and the highest percentage are young (the average age of the person who uses the Internet at home is 32 years old, and of the person who uses the Internet in general is 30 years old, compared to 53 years old – the non-user’s average age).
Internet users are mainly from the urban areas (89% of those who use the Internet at home and 74% of those who use the Internet in general).
More than 85% of Internet users have high-school and higher education, the percentage of those with higher education being over 30%, compared to 6% - the percentage of non-users with higher education.
The Internet user lives mainly in households consisting of 3 or 4 members.
The income per capita of the households including Internet users is significantly higher that that of non-users (RON 272). Also among the Internet users, the income per capita makes the difference between those who use the Internet at home (RON 589) and those who use the Internet in general (RON 497).
The age, education and income make the difference between the Internet user and non-user.

134THE GALLUP ORGANIZATIONROMANIA
Gender of Respondents
45%
51%
50%
44%
55%
49%
50%
56%
0% 20% 40% 60% 80% 100%
Total sample (N=10929)
Household Internet Users(N=1470)
Internet Users out ofHousehold (N=831)
Non-users (N=8500)
Male Female
Note: Out of total sample (representative for entire population), 128 persons did not answer the question “Have you personally used the Internet over the last 6 months, irrespectively of location?” and “Do you personally use Internet in your household?” and consequently could not be qualified as either user or non-user

135THE GALLUP ORGANIZATIONROMANIA
Marital Status of Respondents
What is your marital status?
63%
49%
40%
68%
19%
45%
54%
11%
17%
4%
5%
21%
1
1
1
1
0% 20% 40% 60% 80% 100%
Total sample (N=10929)
Household Internet users(N=1470)
Internet users out ofhousehold (N=831)
Non-users (N=8500)
married single widowed/divorced DNK

136THE GALLUP ORGANIZATIONROMANIA
Age of Respondents
How old are you?
27%
58%
67%
17%
32%
33%
26%
33%
40%
7%
7%
49%
1
2
1
1
0% 20% 40% 60% 80% 100%
Total sample (N=10929)
Household Internetusers (N=1470)
Internet users out ofhousehold (N=831)
Non-users (N=8500)
16-34 years 35-54 years over 54 years DNK Average age
48,3 years
30,62 years
52,74 years
32,28 years

137THE GALLUP ORGANIZATIONROMANIA
Residential area
52%
89%
73%
44%
48%
11%
27%
56%
0% 20% 40% 60% 80% 100%
Total sample (N=10929)
Household Internet users(N=1470)
Internet users out ofhousehold (N=831)
Non-users (N=8500)
Urban Rural
Do you live in the urban or rural area?

138THE GALLUP ORGANIZATIONROMANIA
Area of Development
17%
14%
13%
18%
13%
16%
15%
12%
16%
8%
13%
17%
11%
6%
7%
11%
9%
10%
11%
9%
13%
16%
18%
12%
12%
9%
10%
12%
10%
23%
13%
8%
0% 20% 40% 60% 80% 100%
Total sample (N=10929)
Household Internet users(N=1470)
Internet users out ofhousehold (N=831)
Non-users (N=8500)
NORTH-EAST SOUTH-EAST SOUTH SOUTH-WEST WEST NORTH-WEST CENTRE BUCHAREST

139THE GALLUP ORGANIZATIONROMANIA
Respondents’ Level of Education
What is the last level of schooling you have graduated?
11%
%
%
14%
19%
6%
9%
23%
15%
4%
7%
18%
8%
7%
6%
9%
26%
40%
40%
23%
7%
8%
8%
7%
12%
35%
30%
6%
1
1
1
1
0% 20% 40% 60% 80% 100%
Total sample (N=10929)
Household Internet users(N=1470)
Internet users out ofhousehold (N=831)
Non-users (N=8500)
primary school/none secondary school (5-8 grades)crafts school 10 grades (no high school diploma)high school professional or technical undergraduate schooluniversity DNK

140THE GALLUP ORGANIZATIONROMANIA
Respondents’ Occupation
What is your current occupation?
4% 3%3%
3%
6%
19%
16%
3%
5%
7%
4%
7%
8%
3%
13%
8%
10%
14%
13%
5%
6%
16%
8%
28%
29%
2%
39%
6%
5%
48%
9%
10%
10%
9%
1
2
11%
2%
2%
1%
2%
2%1%
2%2%
1
0% 20% 40% 60% 80% 100%
Total sample (N=10929)
Household Internet users(N=1470)
Internet users out ofhousehold (N=831)
Non-users (N=8500)
Business (co) owner Free lance professional Manager/directorEngineer, doctor, architect, professor, economist Public adminstration Technician, assistant, school teacher
Skilled worker Housewife/Unemployed StudentRetired Other DNK

141THE GALLUP ORGANIZATIONROMANIA
Size of Households
How many persons live in your household, including yourself ?
12%
4%
9%
13%
33%
22%
24%
36%
23%
36%
31%
20%
18%
27%
22%
16%
14%
11%
13%
15%
0% 20% 40% 60% 80% 100%
Total sample (N=10929)
Household Internet users(N=1470)
Internet users out ofhousehold (N=831)
Non-users (N=8500)
1 person 2 persons 3 persons 4 persons more than 4 persons DNK

142THE GALLUP ORGANIZATIONROMANIA
Average Income per Household Member
14%
4%
6%
16%
22%
7%
12%
26%
19%
11%
14%
21%
12%
12%
11%
12%
12%
19%
21%
10%
9%
24%
20%
6%
12%
24%
16%
9%
0% 20% 40% 60% 80% 100%
Total sample (N=10929)
Household Internetusers (N=1470)
Internet users out ofhousehold (N=831)
Non-users (N=8500)
100 RON or less 101-200 RON 201-300 RON 301-400 401-600 RON 600+ RON DNKAverage income per household
member
326 RON
497 RON
272 RON
589 RON