quantitative replicon analysis of dna synthesis in...
TRANSCRIPT

J. Cell Set. 40, 125-144 (1979)Printed in Great Britain © Company of Biologist} Limited 1979
QUANTITATIVE REPLICON ANALYSIS OF
DNA SYNTHESIS IN CANCER-PRONE
CONDITIONS AND THE DEFECTS IN
BLOOM'S SYNDROME
C. H. OCKEYPaterson Laboratories, Christie Hospital, Withington,Manchester M20 <)BX, England
SUMMARY
A quantitative method of replicon analysis of DNA fibre autoradiographs has been usedto study the relationship between mean rate of DNA chain growth (R) and distance betweenadjacent replicons (ID) in fibroblasts from cancer-prone conditions. Results are expressedin terms of the mean linear regression R = 8 + (K.lD) io~*. When replicon behaviour wasexamined in cells from patients with ataxia telangiectasia, basal cell naevus and Bloom'ssyndromes grown at high density after 48 h in culture, no significant differences could befound in replicon behaviour between these syndromes and normal cultures. However whenBloom's cells were grown at low density and examined 24 h earlier, the mean rate of chaingrowth R was reduced compared to normal cells at the same density. Both cell types at highdensities at 24 h showed equal but lower R values than at 48 h after plating the cultures. Thelower rate of chain growth in Bloom's was accompanied by a longer 5-period and cell cycle.
Studies of cell proliferation kinetics using consecutive mitoses after bromodeoxyuridine(BUdR) incorporation and harlequin banding showed that Bloom's cells at low cell densityrequire a longer period to recover a normal cell cycle length after plating than do normalcells at the same density. Plating at higher densities and using conditioned media shortenthe recovery period in Bloom's cells, and when foetal calf serum/MEM is replaced by humanAB serum/McCoy 5a medium as the growth media, cell cycle behaviour of low densityBloom's and normal cells are equal at a much earlier time. It is concluded that the slow rateof DNA chain growth in Bloom's cells is an artefact introduced by culture conditions andalso may be present in normal cells at an earlier period. The behaviour of replicons duringthis recovery period appears to be similar in Bloom's and normal cells except for the timelag. As recovery proceeds, the DNA chain growth in the associated replicon pairs recoverprogressively. This alters both the mean R value from 0-4 to O'8 /tm/min, the slope of theregression K from < r o to ~ 10 while the distance between initiation sites (ID) remainsconstant throughout. Pretreatment of all cultures with fluorodeoxyuridine (FUdR) producedthe same differential effect on release from DNA synthesis inhibition, that is a similar increasein the activation of normally inactive replicons and a slightly slower rate of chain growth overall replicons.
No evidence of a substance released by Bloom's cells in culture capable of increasing the8ister-chromatid frequency in normal cells could be found. Since SCE frequencies were foundto increase with fixation time after BUdR introduction it is concluded that some of thereported changes could be due to differences in cell cycle kinetics brought about by thedifferent media conditions.
CEL 40

126 C. H. Ockey
INTRODUCTION
Many cancer-prone syndromes show a high spontaneous incidence of chromosomeaberrations (German & Crippa, 1966). These include Fanconi's anaemia, ataxiatelangiectasia, Bloom's syndrome (German & Crippa, 1966; Harnden, 1974), andcells derived from the lesion areas of basal cell naevus syndrome (Happle & Hoehn,1973). Often specific chromosomes are involved as in ataxia and Bloom's syndrome(Oxford, Harnden, Parrington & Delhanty, 1975; German, Crippa & Bloom, 1974).Increased sensitivity to various mutagenic agents has also been found in some ofthese syndromes. Ataxia cells are sensitive to y-rays (Taylor et al. 1975), xerodermapigmentosum to ultraviolet irradiation (Cleaver, 1968) and Fanconi's anaemia tomitomycin C (Sasaki & Tonomura, 1973), while evidence has been presented tosuggest that Bloom's syndrome cells may be sensitive to u.v. irradiation (Giannelli,Benson, Pawsey & Polani, 1977). Defects in the cellular mechanisms of repair ofDNA in some of these cases have been found (Setlow, 1978). In Bloom's syndrome,unlike the other cancer-prone conditions examined, there is a high incidence ofspontaneous sister-chromatid exchanges (Chaganti, Schonberg & German, 1974)and a reduced rate of DNA chain growth along the replicons has been reported(Hand & German, 1975, 1977)- Giannelli et al. (1977), have also shown that culturedfibroblasts possess a poor plating efficiency and a decreased rate of DNA chainmaturation. These groups of workers concluded that Bloom's syndrome cells pos-sessed a defect involving some step in DNA synthesis. Other studies have suggestedthat Bloom's cells in culture release a substance capable of increasing the level ofsister-chromatid exchanges in normal cells (Tice, Windier & Rary, 1978).
The treatment of cells for replicon analysis in autoradiographs of DNA normallyinvolves pretreatment for various periods before labelling with the DNA synthesisinhibitor 5-nuorodeoxyuridine (FUdR) (Huberman & Riggs, 1968; Huberman &Tsai, 1973; Hand & German, 1975, 1977; Hand, 1977). Since this agent was foundto reduce the mean rate of DNA chain growth and replicon size (Ockey & Saffhill,1976), it might be expected that Bloom's cells react differentially to DNA inhibition.We have therefore analysed replicon behaviour in both FUdR-treated and untreatedcells to eliminate this possibility. Investigations into cell cycle kinetics of Bloom'scells grown at low and high cell densities led to a further study of replicon behaviourat different cell densities. Attempts to confirm the presence of a DNA damagingfactor released by Bloom's cells into the medium have also been made.
MATERIALS AND METHODSDermal fibroblasts established from primary skin explants were grown in Eagle's MEM +
non-essential amino acids containing 15% foetal calf serum (Flow). These were obtainedfrom 4 normal individuals (C1-4), 3 ataxia telangiectasia (AT3-5) one of which (AT37-)possessed a y-endonuclease defect (M. C. Paterson, personal communication), 2 basal cellnaevus cases (BCN1-2) and 3 Bloom's syndrome cases (BL1-3). BL1/HG916 and BL3(GM 1492/19) were kindly provided by Dr Colin Arlett, MRC Cell Mutation Unit, Universityof Sussex. BLi was originally obtained from Dr James German, New York Blood Center.BL2/43 was provided by Drs B. G. A. ter Haar and J. A. J. M. Bakkeren of the Katholicke

Replicon analysis in cancer-prone syndromes 127
Universiteit Klinick voor Kindergene-kunde sint, Radboudziekenhuis, Nijmegan. Ci-3, BCNand AT cases were kindly provided by Professor D. G. Harnden and Dr A. M. R. Taylor ofthe Department of Cancer Studies, University of Birmingham. C4 cultures were establishedfrom dermal cells derived from a normal foetus.
DNA autoradiography
In the first series of experiments at high cell densities, cells were plated in Corning plasticT30 flasks to reach concentrations of 20-40 x io'/cm1 48 h later at the time of pulse labelling.The medium was changed 24 h prior to pulse labelling. The coded cultures were pulse-labelled for 15 min with 20 /tCi/ml pH]thymidine (sp. act. 59 Ci/mmol) and 20/tCi/mlofPH]deoxycytidine (sp. act. 24 Ci/mmol). On a later occasion a second culture of Ci wasincluded in the normal cultures but was labelled with only 40 ^Ci/ml fHJthymidine (sp. act.46 Ci/mmol). The 15-min pulse-labelling period was terminated by replacing the labelledmedium with prewarmed medium containing 10/Jg/ml each of thymidine and deoxycytidine(or 10 fig/ml thymidine) for 15 min. Replicate cultures were pretreated for 4 h with 0-2 fig/m\(8 x io~7 M) FUdR prior to a similar pulse/chase-labelling protocol. Cells were then removedwith ice-cold o-1 % trypsin containing ioo/ig/mlhydroxyureatopreventfurtherDNAsynthesis.A drop of saline containing 5000-1000 cells was gently mixed on a subbed slide with a dropof 2 % sodium dodecylsulphate in 0-2 mM EDTA and the DNA gently teased out over theslide (Lark, Consigli & Toliver, 1971; Huberman & Tsai, 1973). Eight slides from eachflask were then processed for autoradiography and exposed to Ilford L4 emulsion for 6 months.
In a second series of experiments, Bloom's (BLi, 2) and normal (Ci, 2) fibroblasts weregrown at 2 cell densities, a high density (23-44 x io'/cm1) similar to that in the first seriesand a low density (1-9-3-2 x io'/cm1). The latter density was comparable to that used byHand & German (1975-7) of 5 x io'/cm1. DNA autoradiographs were also prepared 24 hafter plating compared to the 48-h period used in the first series. The labelling protocol andsubsequent treatment were identical in both series.
Approximately 100 pairs of randomly selected adjacent replicons were analysed fromcoded slides in each case using the criteria for analysis set out previously (Ockey & Saffhill,1976; Ockey, 1978). Briefly this entails the selection of pairs of adjacent bidirectional replicons,one or both showing a pre-pulse replicated unlabelled centre. The length of DNA replicatedduring the pulse in both directions was measured (with a micrometer eyepiece) from the 2 or4 of the diverging pairs of dense pulse tracks and the mean i-way value calculated. The distancebetween the 2 initiation sites (ID) was also recorded for each pair. These values were thenconverted to fim/min one way for rate of chain growth (r) and fim for distance betweeninitiation sites (ID). The increase in the measured length of dense track in the autoradiographover the true length replicated due to the spread of silver grains in the emulsion from the3H ionization scatter was then subtracted from the r value to give the true rate of chain growth(R). This value approximates to 1 /im in autoradiographs with this labelling protocol. Themean values of R and ID were then calculated from the 100 scores and the mean linearregression of ID against R and R against ID established from the values for the individualreplicon pairs. In the linear regression
R = S + (K.ID) io-«
5 represents the point of intercept on the R (y) axis while K represents the slope of theregression. Under normal conditions of growth of mammalian cells in culture, labelled witha 15-min pulse/chase protocol, K ~ 10 (Ockey & Saffhill, 1976; Ockey, 1978) and this valueis still maintained when cells are labelled after a 4-h FUdR pre-treatment. The value of 10for the slope of the regression indicates that as the ID value doubles, the rate R also doublesusing this protocol. Therefore, in a tandem array of para-synchronized replicons, DNA ofthe same length will be replicated approximately in the same time, irrespective of the numberof activated replicons it contains. From these findings it was suggested that the rate of DNAsynthesis in a tandem array was controlled by a balance between the initiating complexes andthe DNA chain elongating complexes.
9-2

128 C. H. Ockey
This compensatory mechanism with K ~ i'O however only occurs for replicon pairsanalysable after a 10-20 min pulse protocol (Ockey, in preparation). Since initiation andfusion of replicons occurs during longer pulses between closely associated pairs, the meanID values increase with length of pulse protocol as these fused pairs become undetected andthus removed the analyses. With shorter pulse protocols on the other hand there will becorresponding increase in the number of closely associated replicons analysed and thereforethe mean ID value will be reduced. The mean R values however do not alter significantlyover a much wider range of pulse protocols (5-30 min). The outcome of these findings showsthat the distribution of ID/i? values over the whole range of replicon pairs analysable withdifferent pulse/chase length protocols is non-linear but consists of a multi-component curvewith K increasing > i-o at pulse protocols < 10 min to values < i-o at pulse protocols> 20 min. The range of replicon pairs analysable following a 15-min pulse however consistentlygive K values of ~ 1 -o for mammalian cells grown under optimum culture conditions.
The advantage of this method of approach in replicon analyses is that changes in thebehaviour of replicon synthesis can be seen which would otherwise remain undetected underthe method of independent analysis of R and ID usually practised (Hand & German, 1975,1977) and where results are expressed solely as mean ID and R values. Since the previousresults of rates of chain growth in Bloom's fibroblasts were however arrived at using theindependent methods of analysis, we have also analysed some of our material in this wayfor comparison.
Plating efficiencies
Plating efficiencies were calculated for BLi, 2 and Ci, 4 in both fresh medium and mediumcontaining various proportions of conditioned media derived from confluent cultures of BL2and C4. 300 cells were plated in each of 4 replicate T30 plastic Corning flasks. Flasks wereincubated at 37 °C for 12 days and then fixed and stained with Giemsa. Clones > 50 cellswere scored and the means calculated for each treatment.
Sister-chromatid exchanges (SCE)
Replicate fibroblast cultures of BL3 and Ci were set up in fresh medium or mediumcontaining 75 % conditioned medium derived from 2-day confluent cultures of either Ci orBL3 cells. Cells were plated at 1 x io^/cm1 and 5-bromodeoxyuridine (BUdR) at 1 x io~s Mimmediately added. Cultures were grown in the dark at 37 °C for 42 or 50 h. Colcemid(0-06 fig/ml) was added and cells fixed 4 h later after hypotonic treatment. Slides were preparedand treated for harlequin banding using a modification of the original method described byPerry & Wolff (1974). Fifty cells from each treatment were analysed for SCE frequency intheir second mitosis after BUdR incorporation. Consecutive mitoses following BUdR in-corporation can be recognised by their banding patterns (Wolff & Perry, 1974).
Chromosomes following one round of semi-conservative replication in BUdR mediumshow unifiliarly substituted DNA (TB: TB) where T corresponds to the original thymidine-containing strand and B the newly synthesized BUdR-containing strand. At the subsequentmitoses both chromatids stain dark with Giesma after harlequin banding. A second mitosisshows chromosomes with one chromatid bifiliarly substituted (BB:TB), while a third mitosiswill show some chromosomes where both chromatids are substituted in both strands (BB: BB)together with BB:TB. After banding TB and BB chromatids stain differently with Giesmaand therefore consecutive mitoses can be recognized. The frequencies of these 1st, 2nd or3rd mitosis were calculated from 200 metaphases in each preparation.
Cell proliferation kinetics
Cell cycle kinetics. Cell cycle analyses for BLi, 2 together with Ci, 2, 3 were measured at2 levels of cell density. Leighton tubes were set up for a final density at the time of pulse-labelling of 2-7-6-5 x io3 cells/cm1 and 220-34-0 x io3 cells/cm1. The cells 24 h later werepulse-labelled for 15 min with PHJthymidine (05/tCi/ml spec. act. 1-5 Ci/mmol), washedand allowed to continue growth in pre-warmed medium containing 4 fig/ml thymidine. Pairs

Replicon analysis in cancer-prone syndromes 129
of Leighton tubes were treated for consecutive periods of 2 h with colcemid and coverslipsthen gently fixed in 3 :1 methanol: acetic. After mounting, coverslips were exposed to Ilford L4for 10 days, developed and then stained with Giemsa. One hundred metaphases were scoredfrom each coverslip and the mean percentage of labelled metaphases at each time pointplotted. The S-period was calculated as the time interval between the two 50% levels ofthe first peak of labelled metaphases. The cell cycle time was calculated from the first 50 %level of the first peak to that of the second peak of labelled mitosis. The percentage of labelledcells and the mean grain count per nucleus were calculated from the first samples fixed afterpulse labelling.
Rates of cell proliferation. Ci and BL2 cultures were set up at high and low cell densitiesin fresh medium. BUdR at 1 x io"5 M was added at intervals ranging from o to 48 h afterplating and the cultures allowed to continue growth in the dark for a further 48 h. C4 andBL3 cultures were set up at high and low densities in medium containing BUdR.
C4 and BL2 cultures were set up in BUdR medium containing 50 % conditioned mediumderived from half-confluent 22-day-old cultures of the parent cells. Ci andBL.2 cultures wereset up in BUdR medium consisting of different combinations of Eagle's MEM + non-essentialamino acids or McCoy 5a medium and containing 15 % of either foetal calf serum (Flow) orhuman AB serum. In all cases, after 46 h of BUdR incorporation, colcemid at 0-06 /ig/mlwas added for 2 h. Cells were removed with trypsin, treated with hypotonic KC1 and fixed.Slides were prepared and harlequin banded as before. The frequency of metaphases in their1st, 2nd or 3rd mitosis after BUdR incorporation were scored.
RESULTS
DNA replicon behaviour
The DNA parameters obtained from the replicon pairs in the cells of the varioussyndromes when grown at high density and examined 48 h after plating are givenin Table 1. The distribution of the individual ID and R values in the replicon pairsfrom representative examples of each syndrome are shown in Fig. 1. In all thecases analysed there are no significant differences in the mean values for the para-meters R, ID, 8 or K between individual cases of a syndrome or between the meansfor the different syndromes. The values obtained of ID (52-62/im), R (0-7-0-9/an/min), 8 (0-13-0-32) and K (0-74-1-18) fall into the categories expected for repliconbehaviour of mammalian fibroblasts growing under normal conditions in culturewhen this labelling protocol is used (Ockey & Saffhill, 1976).
When cells were pulse-labelled after a 4-h pretreatment with FUdR, there wasan overall reduction in the mean values for ID (32-50/tm), R (0-36-0-53 /tm/min)and 8 (0-07-0-16), while K (0-73-1-00) remained relatively unchanged (Table 2).The percentage reduction between R and ID however was disproportionate, amountingto a greater percentage decrease in mean R than in mean ID values from theuntreated cell values (Fig. 1). There was also no differential behaviour betweenany of the cultures in this respect and all reacted to the FUdR pretreatment in amore or less similar manner although the ataxia cases gave lower K values (0-73-0-82)than the others (0-84-1-00). Since a disproportionate reduction in R was alsoobserved previously, but to a lesser degree following a lower concentration of FUdRover the same time period (Ockey & Saffhill, 1976), a more detailed analysis of thiseffect was carried out. This reduced rate, after FUdR could be due either to a delayin initiation of DNA chain growth after introduction of the pulse or to an overall

130 C. H. Ockey
1-5
10
0-5
n
/ •
J/
i i
' c
I I50 100 150 200 100 150 200
ID,
Fig. 1. Distribution of R and ID values for the separate pairs of adjacent repliconsanalysed in fibroblast cultures representative of each syndrome under normal growthconditions. The continuous line represents the mean linear regression. The brokenline shows the mean linear regression when the cultures were pretreated for 4 h withFUdR before pulse-labelling. Arrowheads show the mean ID and R values ineach case, A, C I ; B, AT 3(7-); c, BCN 2; D, BL I.
reduced rate of chain growth over the whole 30-min labelling period. The formercondition would give a ratio of pulse/chase autoradiograph in the replicons of< 1:1, while in the latter state a 1:1 ratio would be expected if all the chase labelledproduced an autoradiograph. Measurements of 100 individual replicons from eachculture gave a range of ratios between 0-96-1-06:1 for control and 0-91-1-11:1 forpretreated cells. It can be concluded therefore that the rate of chain growth overallis reduced following a 4-h pretreatment with FUdR, with the level of reductionrelated to the concentration of FUdR used. This overall effect is most likely to beat the nuclear or cellular level rather than at that of the replicon and may well beconcerned with the levels of DNA precursors or enzymes involved in DNA chainelongation in the nucleus. A suggested cause of the decrease in mean ID value andthe resulting reduction in mean R values after FUdR treatment has been discussed

Replicon analysis in cancer-prone syndromes
Table i. Linear regression parameters of replicon synthesis in DNA fromfibroblasts pulse-labelled toith 3H-DNA precursors for 15 tnin
PassageSyndrome
C iC2
c3• C iMean
BCNiBCN2
Mean
A T S
A T S
A T 4
AT3(y-)Mean
B L iBL2
Mean
no.
51 0
IO
9
66
6674
IS5
Pairs ofreplicons
IOO
9799
IOO
IOO
IOO
IOO
9998
1 0 3
IOO
99
ID, /tm
52-6±2-8611 ±276i-5±2754'9±2-2
5 7 5
6i-8±2-9620 ±2-5
61-9
60-9 ±2-46 I O ± 3 - I
54-1 ±2-456-9 ± 2 5
5 8 2
57-8 ±2-3557±2-i
568Calculated from the i• Pulse-labelled with
R, fim/min
071 ±0-030-85 ±0-03
o-88±o-o30-74 ± 0 0 2
0 8 0
0-84 ±O"O2O-89 ±O-O3
O87
0-79 ±0-02079 ±0-030-73 ±0-020-83 ±0-02
0 7 9
0-76 ± 0 0 20-74 ±O-O2
O75:ormula R = 8-\1 |7H]thymidine
8
023 ±0030-13 ±004O'2O±O-O3
0-26 ±0-03O'ZI
0-32 ±0-03O-2O±O-O4
0-26
0-17 ±0040-23 ±004O-2I ±O-030-27 ± 0 0 4
o-aaO22±OO4O-27 ±O-O4
0 2 5
-(KID) io- ' .only.
K
0-91 ±0-05I-I8±O-O6
I-IO±O-O5
0-74 ±0-05
0 9 5
0-84 ±0-051-i 1 ±0-06
0 9 8
i-oi ±0-060-91 ±0-060-95 ±0-060-98 ±0-06
0-96
0-93 ±0-070-85 ±0-07
0 8 9
Table 2. Linear regression parameters of replicon synthesis in DNA from fibroblastspretreated for 4 h with 8 x io~7 M FUdR prior to pulse-labelling with 3H-DNA pre-cursors for 15 min
PassageSyndrome
C iC2
c3• C i
MeanBCNiBCN2
MeanATSAT S
A T 4
AT3(y-)Mean
B L iBL2
Mean
no.
S1 0
1 0
6
66
6674
ISS
Pairs ofreplicons
1 0 0
1 0 0
1 0 0
1 0 0
1 0 0
1 0 0
1 0 0
1 0 0
1 0 0
1 0 0
1 0 0
1 0 0
ID, fim
328 ±1-946-4 ±2-642-8 ±2-4
457 ±2-84 1 9
3 3 3 ± 1 942-1 ± 2 4
377
47-8±3"i50-8 ±2-939-4 ±2743'6 ±2-5
45 444-1 ±2-3495 ±27
468
Calculated from the
R, /tm/min
o-38±o-o20-53 ±0-02O'42±O-O20-48 ±003
0 4 5
o-38±o-O2O43 ± 0 0 2
0 4 1
0-46 ±0-020-50 ±0-020-36 ± 0 0 20'52±CVO2
0-46
O'48±o-O20'53 ±O'O2
0 5 0
8
0-O7±0-02O-IO ±0-02O-O5 ±O-O20-06 ±0-03
0-07
O-O4±O'O2OOS ±O-O2
0 0 5
O-II ±0-03013 ±0-03O'O4±O-O2o-i6±o-O3
O-II
0-05 ±0-040-05 ±0-04
0 0 5
formula R = <J + (K.ID) io"1.• Pulse-labelled with thymidine only.
K
0-94 ±006093 ±0050-84 ±0-05093 ±005
0-91
i-oo±o-o60-90 ±0-05
0 9 5
0-73 ±0-05074 ±0-050-82 ±0-040-82 ±0-06
0 7 8
097 ± 0-07
o-95±oo80-96

132 C. H. Ockey
previously in connexion with an increase in DNA synthesis initiation complexes(Ockey & Saffhill, 1976).
Although the results indicate that FUdR affects all the cultures in essentiallythe same manner, slightly lower K values were experienced in the ataxia cases.This reduced K value was found to be caused by a change in the shape of the lineardistribution at the higher ID values. This effectively converted the linear distributionof ID/R values into a multi-component curve and when ID values > 100/imwere excluded from the calculations, the K values returned to the normal range(o-86-o-95).
In order to investigate the low rate of DNA chain growth in Bloom's cells, aseries of experiments was carried out where different cell densities were pulse-labelled at different times. When the Bloom's cells and normal cells were grownat high densities similar to those examined in the first series of experiments butpulse-labelled 24 h earlier, the mean R values overall were significantly decreased.These values were reduced from 071-0-88 to 0-55-0-67 /tm/min (Table 3). Thereare also indications that the K values were reduced in both Bloom's but in only onenormal culture (C2). This effect appears to resemble that found in the FUdR-pre-treated ataxia cultures in that exclusion of ID values > 100 /tm brings the K valuesto within the normal range (0-85-0-93). In both cell types at low densities, thisreduction in the K value is experienced in both normal cultures, where the values0-73 and 0-91 are reduced to 0-55 and 0-74 respectively. The Bloom's cells on theother hand retain the same K values found at high density at this time, but show anoverall reduction in the R values not only at the high ID values, but including themore closely associated pairs of replicons with ID values < 100 /tm (Table 3, Fig. 2).The mean ID values of both Bloom's and normal cells retain values between 50 and65 /tm in all these experiments. Therefore if the mean R values are considered inisolation, then there is a significant reduction in the Bloom's cells over thenormal cells only when cells grown at < 5 x io3/cm2 are pulse-labelled 24 b afterplating.
Cell cycle kinetics
The cell cycle parameters of these cells at similar densities and labelled 24 hoursafter plating are shown in Table 4, Fig. 3. When the pairs in each separate experimentare compared there is no significant difference between cell cycle or 5-period lengthin the high density cultures of Bloom's and normal cells when the rates of DNAchain growth are similar (Table 3). At low densities Bloom's cells show an extended5-period and to some degree an extension of the cell cycle over normal cells atthe time they also show a reduced rate of DNA chain growth. It may be seen thatthis is reflected in the mean grain count values, although the variation of eachindividual mean is too great to obtain a significant difference. Although, the per-centages of labelled cells in each experimental pair are similar, the values forhigh-density growth are lower due to the removal of cycling cells through contactinhibition at these densities.

Tab
le 3
. Par
amet
ers
of r
eplic
on s
ynth
esir
in D
NA
from
Blo
om's
and
non
nal
Mob
last
s gr
own
at h
igh
and
loeo
cel
l dm
n'ty
using
alte
rnat
ive
met
hods
of
anal
ysis
BL
1 (1
9)
BL
2 (1
2)
CI
(12)
(1
5)
Cul
ture
(pa
ssag
e no
.)
7------
f C
ell
dens
ity,
x ~
o~
/cm
l 1'
9 23
'0
2.7
40.0
2.
8 44'0
3'
2 33
'0
9 U (a) R
ate
of c
hain
gro
wth
, 0.
48
0.61
0.
44
0.61
0.
59
0.63
0.
66
0.67
Q
p
m/m
in
f 0
.01
f 0
.01
f 0
.01
f 0
.01
f 0
.01
_+ 0
.01
f 0
.01
f 0
.01
2.
(b)
Rat
e of
cha
in g
row
th,
0.58
0.
67
0.53
0.
60
0.58
prn
/rnin
f 0
.02
f 0
.02
f 0
.02
f 0
.02
f 0
.02
ID v
alue
K v
alue
8 va
lue
(a) 3-
re
plic
ons
(Han
d &
Ger
man
, 19
75).
(b
) I-
ad
jace
nt r
epli
con
pail
s (O
ckey
& S
afii
ll,
1976
).

134 C. H. Ockey
10
50 100 150
E£a.
10 -
0-5 -
•H
* •
* * * • ^
4 r \ * ' ^ ^ ^
• >+*yi\ X- 't****•*•>+'' *r , - ' • • *
^+ •
1
\+
1
B
•
50 100 150ID,
Fig. 2. Distribution of R and ID values for the separate pairs of adjacent repliconsin BLi (B) and C2 (A) at high ( + ) and low (#) density. Broken line shows themean linear regression for low-cell-density growth, the continuous line from high-cell-density growth. Cell densities/cm1: C2: low, 3-2 x io3; high, 33-0 xio3; BLi;low, 1-9 x io*; high, 23-0 x io3.

Cell density,x io3/cma
Cell cycle, hS period, h% Labelling indexMean grain counts
(60 nuclei)
6-S
18-6I0'23°3
135
25-4
16-86-8
18-8130
La(i 9)c
34°
16-96 7
25-3123
Cl(l2)A
4 6
16-96-8
378161
CI(I6)D
2 7 0
15-86-S
1 9 8
132
C3ds)B
2 8
1 8 07 2
33-6183
C2(i6)c
2 2 0
16-96 7
27-0128
Replicon analysis in cancer-prone syndromes 135
Cell proliferation kinetics
These changes in cell cycle kinetics were followed in more detail by the exami-nation of metaphase harlequin-banding patterns after 48 h of BUdR incorporationat various times after plating, at different cell densities and in different combinationsof media particularly in relation to plating efficiency of the cell types.
Table 4. Cell cycle parameters in Bloom's fibroblastsgrown at low and high cell density
BLi(i7) BLI ( I 9 ) BL2(i3) BL2(i9)A D fl
27
8-6
170
Values in parentheses indicate passage nos.Pairs of cultures which were labelled and autoradiographed at the same time are indicated
A-D.
The use of conditioned media in increasing the plating efficiency of primarycell cultures is well known and in general Bloom's cells plated in fresh media showa poor efficiency (Giannelli et al. 1977 and Table 5). The effects of various con-centrations of conditioned media from normal or Bloom's cells are also shown inTable 5. The enhancing effect was similar with both cell sources and decreased tothe control level as the conditioned media content decreased. There was also someevidence that Bloom's cells showed a slightly greater improvement when grown inBloom's conditioned media, while the reverse was the case with normal cells wherethe enhancement was greater in conditioned media from normal cells.
The progression of cells at different densities through consecutive mitoses overa longer time period is shown in Table 6. Cultures of Ci and BL2 48 h after platingshow that at high densities, there is little difference in proliferation rate for bothcell types. At low densities, however, BL2 cells show a considerable delay overtheir normal counterpart with a lower frequency of 3rd and a higher frequency of1st mitosis since BUdR incorporation. C4 and BL3 cells on the other hand showa greater delay overall at both densities and a difference in the rate of cell proliferationbetween high and low densities (Table 6b). Although BL3 cells repeat the differencesobserved in BL2 cells, the C4 cells which were diluted to a greater extent than theC2 cells show a delay previously experienced only in Bloom's cells at this intervalfrom plating.
Addition of either source of conditioned media to C4 cells at plating improvedtheir rate of proliferation only to a limited extent, the greatest improvement beingfound with Bloom's conditional medium.

i 3 6 C. H. Ockey
20 -
28 32
%
80
60
40
20
rrsxi l l
-
-
1 i >
1
11I1
A
1
I1A
i11t1
\\ t\11 / / V\
12 16 20 24Time after labelling, h
28 32
Fig. 3. Percent labelled mitosis curve for BLi and Ci grown at different cell densitiesand pulse-labelled for 15 min with 05 /tCi/ml (1-5 Ci/mol) [3H]thymidine. A: B L I ,broken line, 65 x io'/cm'; Ci, continuous line, 46 x io'/cm*. B: BLi, brokenline, 25-4 x io'/cm1; Ci, continuous line, 270 x io'/cm1.
When cells treated with BUdR 24 h after plating are examined at 72 h, the pro-liferation rates of Cr cells are again similar at both densities while BL2 cells at lowdensity show a proliferation rate approaching that found at high density and withless delay than that experienced in the previous 48-h sample. When BL2 cells weregrown at low density in 50% conditioned media from normal cells, this delay wasovercome.

RepKcon analysis in cancer-prone syndromes 137
Table 5. Plating efficiency of BLi, 2, Ci , 4 in various combinations ofconditioned medium from BL2 cells (CB), Ci cells (CC) and fresh medium (F)
% plating efficiencyin fresh medium
F3CB:iF3CC:iFICB:IFICC: IF
iCB:3FiCC:3F
BLi (19)
o-5
i - o
4 64 0
4 62 - 2
I-O
1-2
Values in parentheses indicate passage nos.Results are related to i-o as plating efficiency in
BL2 (8)
2 3
i - o3-0
2 3i - 8
i -51-7
i - o
Ci (1a)
5'5
i - o
2-7
3 12-22-9
i -5i - 4
fresh medium at 300
C4(5)
6 2
i - o
3-84-43 0
3 12-O
1 9
cells per T30.
Table 6. Cell proliferation rates of Bloom's and normal fibroblasts at various periodsafter plating at different densities from exponentially growing cultures
Cell type
(a) CiC I
B L 2B L 2C iC I
B L 2BL2(C)BL2C iC I
BL2BL2
(b) C4
C 4BL3BL3
c4C4(C)C4(B)
Finaldensity,x io'/cm1
0-94-82-O
7-9i - o
6-52-O
2 - 0
8 0
i - 4IO-2
2-5io-o
o-55-oo-55-o3 0
3'°3-o
Period ofBUdR incorp.,
h
0-480-480-480-48
24-7224-7224^7224-7224-7248-9648-9648-9648-960-480-480-480-480-480-480-48
N o .of cellsscored
811 0 0
371 0 0
1 0 0
1 0 0
1 0 0
1 0 0
1 0 0
1 0 0
1 0 0
1 0 0
1 0 0
2 41 0 0
431 0 0
1 0 0
1 0 0
1 0 0
0//o
1
1st
2 0
16
2 9 71716162618
172 0
1716
14
29-2
7936 01 0
88
frequency of mitoses
2nd
768767 ° 373767 2
68726874777376
70-8937
4 0
888578
3rd
3'2
8—1 0
81 2
61 0
1566
1 1
1 0
—
—
—
—
2
714
(a) Ci (9) and BL2 (9) at high and low cell densities.(6) C4 (6) and BL3 (20) at different densities with C4 (6) in 50 % conditioned medium
from half-confluent cultures of Bloom's (B) or normal (C) cells.BUdR at 1 x io~* M introduced for 48 h at various times after plating.
138 C. H. Ockey
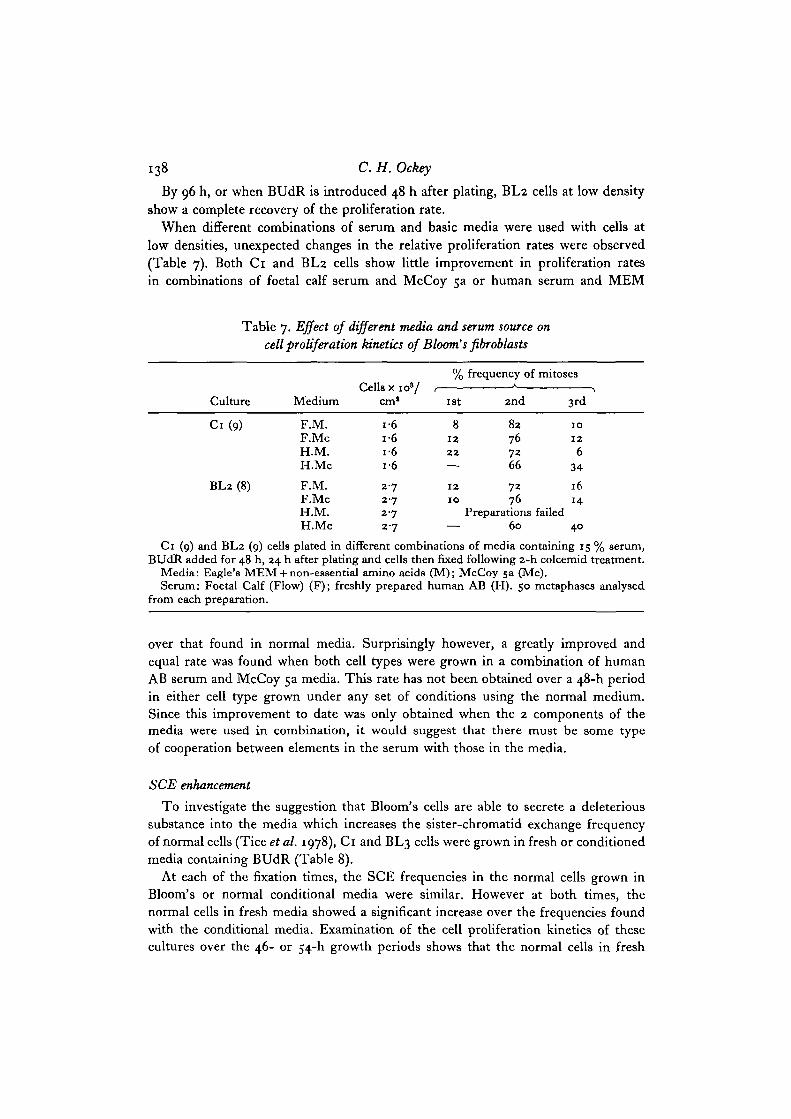
By 96 h, or when BUdR is introduced 48 h after plating, BL2 cells at low densityshow a complete recovery of the proliferation rate.
When different combinations of serum and basic media were used with cells atlow densities, unexpected changes in the relative proliferation rates were observed(Table 7). Both Ci and BL2 cells show little improvement in proliferation ratesin combinations of foetal calf serum and McCoy 5a or human serum and MEM
Table 7. Effect of different media and serum source oncell proliferation kinetics of Bloom's fibroblasts
% frequency of mitosesCells x 103/ r
Culture Medium cm1 1st 2nd 3rd
Ci (9) F.M. i-6 8 82 10F.Mc 16 12 76 12H.M. i-6 22 72 6H.Mc i-6 — 66 34
BL2 (8) F.M. 2-7 12 72 16F.Mc 2-7 10 76 14H.M. 2-7 Preparations failedH.Mc 2-7 — 60 40
Ci (9) and BL2 (9) cells plated in different combinations of media containing 15 % serum,BUdR added for 48 h, 24 h after plating and cells then fixed following 2-h colcemid treatment.
Media: Eagle's MEM + non-essential amino acids (M); McCoy 5a (Me).Serum: Foetal Calf (Flow) (F); freshly prepared human AB (H). 50 metaphases analysed
from each preparation.
over that found in normal media. Surprisingly however, a greatly improved andequal rate was found when both cell types were grown in a combination of humanAB serum and McCoy 5a media. This rate has not been obtained over a 48-h periodin either cell type grown under any set of conditions using the normal medium.Since this improvement to date was only obtained when the 2 components of themedia were used in combination, it would suggest that there must be some typeof cooperation between elements in the serum with those in the media.
SCE enhancement
To investigate the suggestion that Bloom's cells are able to secrete a deleterioussubstance into the media which increases the sister-chromatid exchange frequencyof normal cells (Tice et al. 1978), Ci and BL3 cells were grown in fresh or conditionedmedia containing BUdR (Table 8).
At each of the fixation times, the SCE frequencies in the normal cells grown inBloom's or normal conditional media were similar. However at both times, thenormal cells in fresh media showed a significant increase over the frequencies foundwith the conditional media. Examination of the cell proliferation kinetics of thesecultures over the 46- or 54-h growth periods shows that the normal cells in fresh

Replicon analysis in cancer-prone syndromes 139
media have progressed at a faster rate demonstrated by the higher frequency of3rd and lower frequency of ist mitoses than cells in conditioned media. This increasein SCE frequency in 2nd mitoses with time of fixation is borne out by the significantdifferences seen between the 46- and 54-h fixations of normal cells grown in freshmedia and which is also seen in the BL3 cell data. The importance of this findingwill be discussed later; however its relevance to the data of Tice et al. (1978) indicatesthat comparisons between SCE frequencies without the information of the stagein cell proliferation can be misleading.
Table 8. SCE frequencies in Bloom's and control fibroblasts grownin different conditioned media
Cells
C i42-46 h
SO-54 h
BL342-46 h
SO-54 h
Medium
MEMBL3C i
MEMBL3C i
MEMBL3C i
MEMBL3C i
% istmetaphase
18
2 94 0
5263 i - 5
16
15-514151 0 5
7-5
% 2ndmetaphase
647 0 56o-o597 i66
8384-5847082
87-5
% 3rdmetaphase
18
o-50
3632-5
1
0 52
157-55-o
Mean SCE/cell
6-o±o-2 (i , 2)4 8 ± 0 2 (2)4 7 ± 0 27 1 ±0-4 (1, 3)5'4±o-3 (3)5'3 ± 0 3
33'6 ±o-6 (4)36-6 ± 0 535'4±o-541-3-1-1 (4)40-3 ± 0 939-8 ±1-2
BL3 (20) and Ci (8) fibroblasts were plated at 10 x io3 cells/cm8 in MEM (15 % FCS) orm 75 % MEM previously conditioned for 48 h in confluent cultures of BL3 or Ci cells.BUdR at 3 /ig/ml was added at the time of plating. Metaphases were accumulated withColcemid for 4 h over 2 time periods. Slides of the fixed cells were processed for sister-chromatid exchanges. Two hundred metaphases were analysed for first, second or thirddivision since plating; 50 metaphases were analysed for SCE. Significant differences betweenmean SCE values indicated by similar numbers in parentheses (P < o-oi).
The greater delay of cells in conditioned media obtained here is in contrast to thedata for C4 cells shown in Table 6 where the cells were found to proliferate fasterin the conditioned media. This difference can be attributed to the quality of themedia used. The SCE data were obtained from cells at high density grown in 75 %conditioned media derived from 2-day confluent cultures, where the media werelikely to be depleted of essential growth components. This compares with the 50%conditioned media derived from 2-day half confluent cultures used for the C4 cellsat a lower cell density and where the growth components were presumably sufficient.
140 C. H. Ockey
DISCUSSION
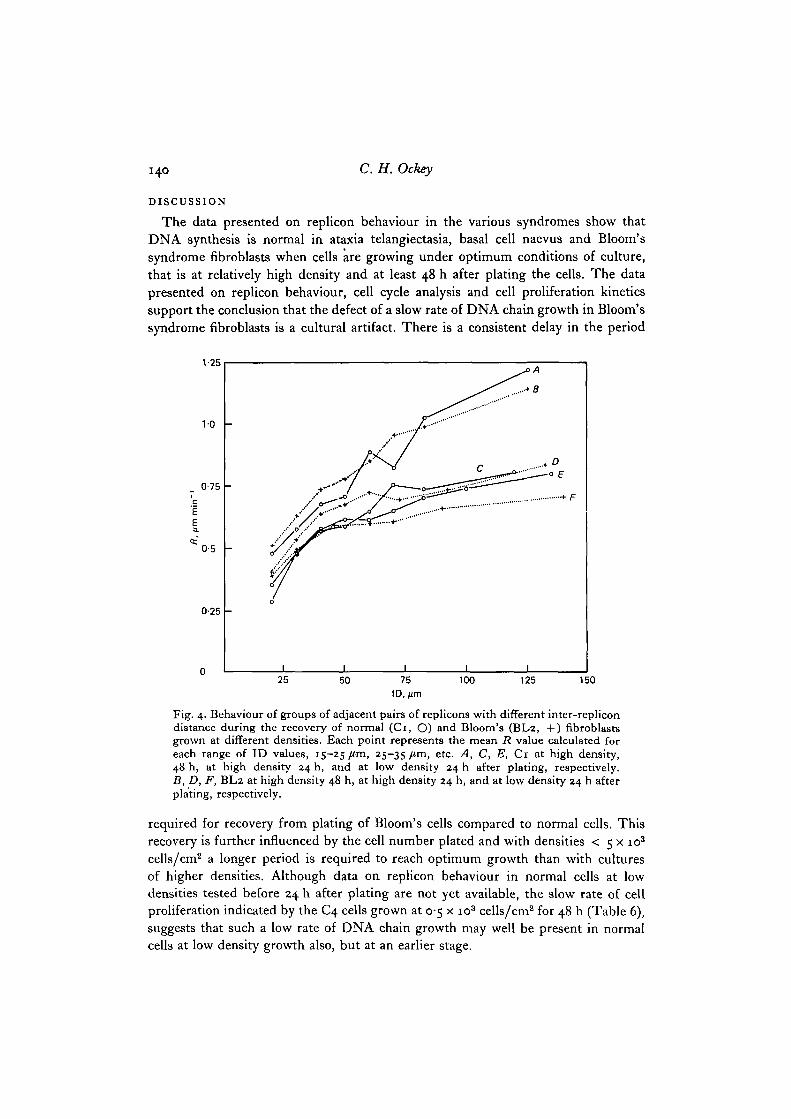
The data presented on replicon behaviour in the various syndromes show thatDNA synthesis is normal in ataxia telangiectasia, basal cell naevus and Bloom'ssyndrome fibroblasts when cells are growing under optimum conditions of culture,that is at relatively high density and at least 48 h after plating the cells. The datapresented on replicon behaviour, cell cycle analysis and cell proliferation kineticssupport the conclusion that the defect of a slow rate of DNA chain growth in Bloom'ssyndrome fibroblasts is a cultural artifact. There is a consistent delay in the period
1-25
10 -
0-75 -
E
0-5 -
0-25 -
150
Fig. 4. Behaviour of groups of adjacent pairs of replicons with different inter-replicondistance during the recovery of normal (Ci, O) and Bloom's (BL2, +) fibroblastsgrown at different densities. Each point represents the mean R value calculated foreach range of ID values, 15-25 /tm, 25-35/tm, etc. A, C, E, Ci at high density,48 h, at high density 24 h, and at low density 24 h after plating, respectively.B, D, F, BL2 at high density 48 h, at high density 24 h, and at low density 24 h afterplating, respectively.
required for recovery from plating of Bloom's cells compared to normal cells. Thisrecovery is further influenced by the cell number plated and with densities < 5 x io3
cells/cm2 a longer period is required to reach optimum growth than with culturesof higher densities. Although data on replicon behaviour in normal cells at lowdensities tested before 24 h after plating are not yet available, the slow rate of cellproliferation indicated by the C4 cells grown at 0-5 x io3 cells/cm2 for 48 h (Table 6),suggests that such a low rate of DNA chain growth may well be present in normalcells at low density growth also, but at an earlier stage.

Replicon analysis in cancer-prone syndromes 141
Throughout the comparisons between Bloom's and normal cells at differentdensities and at different times after plating, the replicons show a distinct orderof events during this recovery period. This behaviour is shown in Fig. 4 in moredetail, where the distributions of ID//? values have been plotted to demonstratethe nature of the multi-component curves rather than as the linear regression. At thelow cell densities 24 h after plating, the Bloom's cells show a reduced rate of chaingrowth particularly in the widely spaced replicon pairs compared either to thenormal cells or the Bloom's cells and normal cells, at high density at this time. The•S-period and the cell cycle are extended and proliferation is slow with an overallmean rate of chain growth between 0-4 and 0-55 /im/min. As recovery progresseswith time, an ever increasing number of more widely spaced or longer adjacentreplicons will achieve their optimum rates until eventually the ID//? relationshipwill become close to linear with mean R values of between 0-7 and 0-9 /im/min.Over this whole period, the distribution of distances between adjacent repliconswill maintain the normal skewed distribution towards larger values (Hand, 1977)and with a mean ID value at this labelling protocol of 50-60 /tm.
Under the mean linear regression method of expressing results, the slope K willreflect these changes in the multi-component curves if the same labelling protocolof a 10—20 min pulse is maintained. Longer or shorter pulse lengths will alter therange of pairs available for analysis which will in itself alter the value of slope K(Ockey, in preparation). Under optimum conditions of growth, the ID//? values,will be distributed linearly with a slope of approximately i-o for a 10-20 min labellingprotocol. As the more widely spaced pairs of replicons reach the optimum rate ofchain growth the slope K will increase to unity and the S value show a decrease atits point of intersect on the R axis.
The finding that the ataxia cultures at high density pretreated with FUdR showeda low K value may indicate that these cells are more sensitive to FUdR. A similarlow K value was also experienced previously in shrew S3 cells in mid-5 without thepresence of FUdR (Ockey, 1978). It was suggested there that a limitation in the ele-ments required for DNA chain growth occurred when the maximum number of in-itiation sites in the cells were in synthesis in mid-S. This would be most likely to reducethe rate of chain growth in the faster elongating replicons, that is, those with thelargest ID values.
Comparisons with the results reported here for Bloom's and normal cells at lowdensities labelled 24 h after plating agree with those obtained by Hand & German(1977). These authors plated at 5 x io3/cm2 in similar media and pulse labelled24 h later for 30 min and after a 30-min pretreatment with FUdR (2 x io"6 M). Theyobtained mean rates of chain growth of 0-51 /im/min and a median replicon size of65 /tm in Bloom's fibroblasts and 0-65 /im/min with a median replicon size of 70 /tmin normal cells.
Variation in the length of the 5-period has been described for various tissues ofamphibia (Callan, 1972). The control of the length of S was found to be governedby the number of initiation sites activated rather than a variation in the rate ofDNA chain growth. In the recovery stages of the mammalian cells described here, it
10 CEL 40

142 C.H. Ockey
appears that the number of replicons remains stable and any slight variation in Slength is provided by changes in rates of chain growth.
The effect of the FUdR pretreatment on the cells from the various syndromes isessentially identical. The disproportionate reduction in mean R and ID value con-firms our previous finding where a series of different cell lines expressed the sameeffect (Ockey & Saffhill, 1976). At that time it was suggested that DNA synthesisin a tandem array is controlled by the balance between a series of components whichresult in initiation of synthesis in the DNA at the replicon origins and a series ofcomponents concerned with replication or elongation of the new strands at thereplication fork. With DNA synthesis inhibition by FUdR, the rate of chain growthis reduced to 2-3% of its normal value (Amaldi, Carnevali, Leoni & Mariotti, 1972),as the DNA elongating complexes are reduced by the depletion in thymidine tri-phosphate. This depletion allows either an accumulation of initiating componentsin the tandem array or leaves that section of DNA exposed and vulnerable to initiationof origins for a longer period. On release from inhibition, origins of repliconsnormally inactivated become initiated into replication in the tandem arrays, so thatthe distances between adjacent pairs (ID values) become shorter. The compensatorymechanism maintaining the 1D/R relationship comes into play as the restoredDNA-elongating complexes are now shared with more replication forks or initiationsites in the tandem arrays. This effectively reduces the mean R value but maintainsa K value of ~ i-o and no evidence of a reduced rate in the widely spaced repliconscould be found apart from the ataxia cases already mentioned.
Bloom's cells recover and show an increased rate of cell proliferation by 72 hsimilar to that in normal cells after growth in human AB serum and McCoy 5 amedium and it appears likely that recovery may be complete at the time of BUdRintroduction, i.e. 24 h. This greatly increased rate was not observed in the cellcultures grown in foetal calf serum and MEM at any stage and would suggest thatcomponents necessary for optimum growth were missing from either or both ofthese sera or media. Experiments are therefore in progress with different media toestablish improved growth of Bloom's cells and early restoration of a normal rate ofDNA chain growth similar to normal cells. The reason for this sensitivity of Bloom'scells to culturing conditions is unknown and perhaps is related to some specificmetabolic requirement. It would appear that the process of trypsinization is notinvolved since not only do Bloom's cells quickly re-attach to the flask at the samerate as normal cells but the same low rate of chain growth has been found in non-trypsin-treated phyto-stimulated lymphocytes (Hand & German, 1975, 1977).
The high frequency of SCEs present in the fibroblasts were found to be unalteredin the cells whether they grow in BUdR medium with a normal or reduced rate ofDNA chain growth, suggesting that there is unlikely to be a direct relationshipbetween these two phenomena.
Evidence of the release of a substance from Bloom's cells capable of increasingthe SCE frequencies in normal cells could not be confirmed (Tice et al. 1978).However, the finding that SCE frequencies increase with time of fixation afterBUdR introduction, also has serious implications in the use of changes in SCE

Replicon analysis in cancer-prone syndromes 143
frequency as a test system for mutagenic or carcinogenic activity of certain chemicalor environmental agents (Wolff, 1977). Although further experiments in fibroblastsand lymphocytes will be reported elsewhere in this connexion, it is apparent thatthe stage of cell proliferation must be taken into account when determining theevidence of significant increases in SCE frequencies following weak mutagenictreatments.
The authors are grateful to Drs James German, Colin Arlett and B. G. A. ter Haar forproviding the cultures of Bloom's fibroblasts, to Dr A. M. R. Taylor and Professor D. G.Harnden for the ataxia and basal cell naevus fibroblasts used in these experiments and toMiss P. West and Mr N. Barron for autoradiographic assistance. This work was supportedby grants from the MRC, Cancer Research Campaign and the Leukaemia Research Fund.
REFERENCESAMALDI, F., CARNEVALI, F., LEONI, L. & MARIOTTI, D. (1972). Replicon origins in Chinese
hamster cell DNA. Expl Cell Res. 74, 367-374.CALLAN, H. G. (1972). Replication of DNA in chromosomes of eukaryotes. Proc. R. Soc. B
181, 205-223.CHACANTI, R. S. K., SCHONEERC, S. & GERMAN, J. (1974). A many fold increase in sister
chromatid exchanges in Bloom's syndrome lymphocytes. Proc. natn. Acad. Set. U.S.A. 71,4508-4512.
CLEAVER, J. E. (1968). Defective repair replication of DNA in xeroderma pigmentosum.Nature, Lond. 218, 652-656.
GERMAN, J. & CRIPPA, L. P. (1966). Chromosomal breakage in diploid cell lines from Bloom'ssyndrome and Fanconi's anaemia. Arm. /turn. Genet. 9, 143-154.
GERMAN, J., CRIPPA, L. P. & BLOOM, D. (1974). Bloom's syndrome. IV. Analysis of 101chromatid exchange figures. Chromosoma 48, 361-366.
GIANMELLI, F., BENSON, P. F., PAWSEY, S. A. & POLANI, P. E. (1977). Ultraviolet lightsensitivity and delayed DNA-chain maturation in Bloom's syndrome fibroblasts. Nature,Lond. 265, 466-469.
HAND, R. (1977). Human DNA replication: Fiber autoradiographic analysis of diploid cellsfrom normal adults and from Fanconi's anaemia and ataxia telangiectasia. Hum. Genet.37- 55-64-
HAND, R. & GERMAN, J. (1975). A retarded rate of DNA chain growth in Bloom's syndrome.Proc. natn. Acad. Set. U.S.A. 72, 758-762.
HAND, R. & GERMAN, J. (1977). Bloom's syndrome: DNA replication in cultured fibroblastsand lymphocytes. Hum. Genet. 38, 297-306.
HAPPLE, R. & HoEHN, H. (1973). Cytogenetic studies on cultured fibroblast-like cells, derivedfrom basal cell carcinoma tissue. Clin. Genet. 4, 17-24.
HARNDEN, D. G. (1974). Ataxia telangiectasia syndrome: Cytogenetic and cancer aspects. InChromosomes and Cancer (ed. J. German), pp. 619-636. New York: Wiley.
HUBERMAN, J. A. & RiCGS, A. D. (1968). On the mechanism of DNA replication in mammalianchromosomes. .7. molec. Biol. 32, 327-341.
HUBERMAN, J. A. & TSAI, A. (1973). The direction of DNA replication in mammalian cells.J. molec. Biol. 75, 5-12.
LARK, K. G., CONSIGLI, R. & TOLIVER, A. (1971). DNA replication in Chinese hamstercells: Evidence for a single replication fork per replicon. J. molec. Biol. 58, 873-875.
OCKEY, C. H. (1978). Changes in replicon behaviour during the S period in Sorex araneuscells in culture. Expl Cell Res. 114, 446-451.
OCKEY, C. H. & SAFFHILL, R. (1976). The comparative effects of short-term DNA inhibitionon replicon synthesis in mammalian cells. Expl Cell Res. 103, 361-373.
OXFORD, J. M., HARNDEN, D. G., PARRINGTON, J. M. & DELHANTY, J. D. A. (1975). Specificchromosomal aberrations in ataxia telangiectasia. J. med. Genet. 12, 251-262.

144 C.H. Ockey
PERRY, P. & WOLFF, S. (1974). New giemsa method for the differential staining of sisterchromatids. Nature, Lond. 251, 156-158.
SASAKI, M. S. & TONOMURA, A. (1973). A high susceptibility of Fanconi's anaemia to chromo-some breakage by DNA cross-linking agents. Cancer Res. 33, 1829—1836.
SETLOW, R. B. (1978). Repair deficient human disorders and cancer. Nature, Lond. 272,7I3-7I7-
TAYLOR, A. M. R., HARNDEN, D. G., ARLETT, C. F., HARCOURT, S. A., LEHMANN, A. R.,STEVENS, S. & BRIDGES, B. A. (1975). Ataxia telangiectasia: A human mutation with abnormalradiation sensitivity. Nature, Lond. 258, 427-429.
TICE, R., WINDLER, G. & RARY, J. M. (1978). Effect of co-cultivation on sister-chromatidexchange frequencies in Bloom's syndrome and normal fibroblast cells. Nature, Lond.273. 538-54°-
WOLFF, S. (1977). Sister-chromatid exchange. A. Rev. Genet. 11, 183-201.WOLFF, S. & PERRY, P. (1974). Differential giemsa staining of sister chromatids and the
study of sister chromatid exchange without autoradiography. Chromosoma 48, 341-353.
(Received 10 May 1979)