quantifying location sociality - université du luxembourg
TRANSCRIPT

Quantifying Location SocialityJun PangFSTC & SnT
University of [email protected]
Yang ZhangCISPA, Saarland UniversitySaarland Informatics [email protected]
ABSTRACTThe emergence of location-based social networks provides an un-precedented chance to study the interaction between human mo-bility and social relations. This work is a step towards quantifyingwhether a location is suitable for conducting social activities, andthe notion is named location sociality. Being able to quantify loca-tion sociality creates practical opportunities such as urban planningand location recommendation. To quantify a location’s sociality,we propose a mixture model of HITS and PageRank on a heteroge-neous network linking users and locations. By exploiting millionsof check-in data generated by Instagram users in New York and LosAngeles, we investigate the relation between location sociality andseveral location properties, including location categories, ratingand popularity. We further perform two case studies, i.e., friend-ship prediction and location recommendation, experimental resultsdemonstrate the usefulness of our quantification.
CCS CONCEPTS• Information systems→ Social networking sites; •Human-centered computing → Ubiquitous and mobile computing;
KEYWORDSOnline social networks; location-based social networks; data min-ing; friendship prediction; location recommendationACM Reference format:Jun Pang and Yang Zhang. 2017. Quantifying Location Sociality. In Proceed-ings of HT ’17, Prague, Czech Republic, July 04-07, 2017, 10 pages.DOI: http://dx.doi.org/10.1145/3078714.3078729
1 INTRODUCTIONOnline social networks (OSNs) have been the most successful webapplications during the past decade. Leading companies, includingFacebook,1 Twitter2 and Instagram,3 have gained a large number ofusers. More recently, with the development of positioning technol-ogy on mobile devices, OSNs have been extended to geographicalspace. Nowadays, it is quite common for OSN users to share theirgeographical locations, i.e., check-ins. Moreover, a special type of1https://www.facebook.com/2https://twitter.com/3https://www.instagram.com/
Permission to make digital or hard copies of all or part of this work for personal orclassroom use is granted without fee provided that copies are not made or distributedfor profit or commercial advantage and that copies bear this notice and the full citationon the first page. Copyrights for components of this work owned by others than ACMmust be honored. Abstracting with credit is permitted. To copy otherwise, or republish,to post on servers or to redistribute to lists, requires prior specific permission and/or afee. Request permissions from [email protected] ’17, Prague, Czech Republic© 2017 ACM. 978-1-4503-4708-2/17/07. . . $15.00DOI: http://dx.doi.org/10.1145/3078714.3078729
OSNs dedicated to location sharing are created, namely location-based social networks (LBSNs). Foursquare and Yelp are two repre-sentative companies.With the emergence of LBSNs, a large quantityof data concerning human mobility become available. This gives usan unprecedented opportunity to understand human mobility andmoreover to study the interaction between social relations and mo-bility. Some previous works have been focused on inferring socialrelationships from mobility, such as [13, 28, 32, 37, 41], others ex-ploit users’ social information to predict their future locations, suchas [1, 3]. More recently, researchers propose new understandingsof locations by using user generated data such as happiness [30]and walkability [29].
Location has been recognized as an important factor for socialactivities back in 1950s. In his seminal work [10], Erving Goffmandescribed social interactions as a series of performance given bysocial actors, and physical setting, i.e., location, is an importantaspect of a social actor’s performance. In [10], Goffman stated that“A setting tends to stay put, geographically speaking, so that those whowould use a particular setting as a part of their performance cannotbegin their act until they have brought themselves to the appropriateplace”. Based on Goffmann’s study, Milligan [21] further proposedthat “physical sites (however defined by the participants) becomethe stages for social interaction, stages that are both physically andsocially constructed”. She explained that not only being physicallyconstructed (by architects, facility managers, property owners andothers), a location will also be socially constructed by people whoconduct social interactions there. Following this theory, we arguethat social construction will make some locations more suitable forsocial activities than others.
In the current work, we aim to quantify whether a location isa suitable for conducting social activities. The notion we quantifyis named location sociality. We define a location’s sociality as thedegree to which individuals tend to conduct social activities at thatlocation. A location is considered social if friends frequently visit,especially for the purpose of socializing or recreation, and viceversa. Studying location sociality could advance the boundary ofour understanding on the interaction between social relations andmobility. It can also help us to solve challenging problems such asurban planning and traffic control. In practice, location socialitycan be also used to build appealing applications such as locationrecommendation.
Contributions. In the current work, we make the following con-tributions:
• We propose a framework to quantify location sociality (Sec-tion 2). Our framework is based on the assumption that alocation’s sociality and its visitors’ social influence are mu-tually reinforced. To model this assumption, we constructa heterogeneous network consisting of users (in a social

HT ’17, July 04-07, 2017, Prague, Czech Republic Jun Pang and Yang Zhang
network) and locations (a user-location network). Then,we propose a mixture model of HITS [16] and PageRank toquantify location sociality on this heterogeneous network.
• Following our solution, we exploit millions of check-in datafrom Instagram in New York and Los Angeles to quantifylocation sociality (Section 3). We then study the relationbetween location sociality and several location proper-ties including location categories, rating and popularity.Our discoveries include: certain types of locations (musicvenues and nightclubs) are more social than others; loca-tion sociality shares a positive relation with location ratinggiven by users; social locations distribute more uniformlyw.r.t. geographical space than popular locations.
• To demonstrate the usefulness of our quantification of loca-tion sociality, we perform a case study on friendship predic-tion in Section 4.1. We extract two users’ common locationsand define features based on these common locations’ so-ciality for machine learning classification. Experimentalresults show that with very simple location sociality fea-tures, we are able to achieve a strong prediction. Moreover,adding location sociality into a state-of-the-art predictionmodel achieves a 5% performance gain.
• We perform another case study on using location socialityfor location recommendation in Section 4.2. We integrateour quantification into a random walk with restart frame-work. Experimental results show that the recommenderbased on location sociality achieves a better recommen-dation performance (at least 5%) than the baseline recom-mender that does not consider location sociality.
We discuss some implications and limitations of the current workin Section 5. Related works are discussed in Section 6 and Section 7concludes the paper.
2 PROPOSED SOLUTIONIn this section, we first discuss the intuition of our solution on quan-tifying location sociality (Section 2.1), then we formally describethe solution (Section 2.2).
2.1 IntuitionOur intuition on quantifying location sociality in this paper is basedon the assumption that a location’s sociality and its visitors’ socialinfluence are mutually reinforced. To explain this intuition, we startby addressing socially influential users. In the society, if a person isconsidered socially influential, he must visit different social placesfrequently to organize or participate in different social activitiesand events. On the other hand, if a location is frequently visitedby influential users, then it must be suitable for conducting socialactivities, i.e., it is a social place. Following this, we establish amutual reinforcement relation between user influence and locationsociality, i.e., more social a location is, more socially influential usersvisit it, and vice versa. In addition to visiting many social places,an influential user should also occupy an important position inthe social network, e.g., he should have many friends who are alsosocially influential. Following the above discussion, our intuition onquantifying location sociality can be summarized as the followingtwo assumptions.
`1
`2
`3
`4
u1 u2
u3u4
Figure 1: A model of the network.
Assumption 1. Location sociality and users’ social influence aremutually reinforced.Assumption 2. Users’ social influence can be quantified from thesocial network.
The first intuition can be naturally formulated into a HITS-styleframework [16]. For the second intuition, we apply PageRank onthe social graph to quantify each user’s influence. In the rest of thepaper, we use location sociality and sociality interchangeably.
2.2 Our frameworkWe start by modeling users, locations and their relationships intotwo types of networks including social network and user-locationnetwork.Social network. A social network, denoted as G𝒰 = (𝒰 , ℰ𝒰 ), isan unweighted graph with nodes in set 𝒰 representing all users.ℰ𝒰 ⊆ 𝒰 × 𝒰 is a symmetric relation containing the edges in G𝒰 .If ui and uj are friends, then (ui ,uj ) ∈ ℰ𝒰 and (uj ,ui ) ∈ ℰ𝒰 . Weuse matrix X to represent G𝒰 where Xi, j = 1 if (ui ,uj ) ∈ ℰ𝒰and Xi, j = 0 otherwise. It is easy to see that X is symmetric. Wefurther use X to denote the column stochastic matrix of X whereX i, j =
Xi, j∑k Xk, j
.
User-location network.A user-location network, denoted asG𝒰,ℒ= (𝒰 ,ℒ, ℰ𝒰,ℒ), is a weighted bipartite graph. ℰ𝒰,ℒ ⊆ 𝒰×ℒ consistsof the edges in G𝒰,ℒ. Each edge (ui , ℓj ) ∈ ℰ𝒰,ℒ, also written ase𝒰,ℒi, j , is associated with a weight w𝒰,ℒ
i, j defined as the numberof times that the user ui has visited (checked in) the location ℓj(denoted by |ci(ui , ℓj )|). We use matrix Y to represent G𝒰,ℒ withYi, j = w𝒰,ℒ
i, j . The transpose of Y is further denoted by YT . In the
end, we use Y and YT to denote the column stochastic matrices ofY and YT , respectively.
Figure 1 shows an example of the heterogeneous graph. Withinour framework two sets of values, locations’ sociality and users’
Quantifying Location Sociality HT ’17, July 04-07, 2017, Prague, Czech Republic
social influence, can be obtained. Each location ℓ’s sociality is de-fined as κ(ℓ) and η(u) for each user’s social influence. Following theintuition in Section 2.1, our model is formulated into the followingequations:
η(ui ) =∑jX i, j · η(uj ) (1)
η(ui ) =∑jY i, j · κ(ℓj ) (2)
κ(ℓj ) =∑iYT j,i · η(ui ) (3)
Equations 1 is the PageRank implementation for quantifyingusers’ social influence from G𝒰 . Equations 2 and 3 are an instanceof the HITS framework which establishes the mutual reinforcementrelationship between locations and users. We then linearly combinethe above equations as
η(ui ) = α ·∑jX i, j ·η(uj )+(1−α) ·
∑jY i, j ·κ(ℓj ) (4)
κ(ℓj ) =∑iYT j,i · η(ui ) (5)
where α specifies the contributions of each component to users’social influence. In our experiments, α is set to 0.5 which indicatesthe social network structure and usermobility are equally importanton quantifying users’ social influence. Note that α = 0.5 is a typicalsetting inmany fields such as [36] where the authors aim to discoversalient sentences for document summarization.
We further use two vectors η and κ to denote users’ social in-fluence and locations’ sociality. Then the above equations can bewritten into the following matrix form.
η = α · X · η + (1 − α) · Y · κ (6)κ = YT · η (7)
Equations 6 and 7 can be computed through an iterative updatingprocess. We set all locations’ (users’) initial sociality (social influ-ence) to be 1
|ℒ |( 1|𝒰 |
). According to our experiments, the computa-tion stops after around 10 iterations, when the maximal differencebetween κs of two consecutive iterations is less than 0.00001.
3 EXPERIMENTSIn this section, we first introduce the dataset used for our experi-ments. Then, we present the results of our quantification: we startby discussing the top social locations and location categories; thenwe focus on the relation between location sociality and locationrating; in the end, the correlation between location sociality andpopularity is discussed.
3.1 Dataset descriptionInstagram is a photo-sharing social network with a fast growinguser number. By now, it has 400M monthly active users and with75M photos published everyday. Similar to other social networkservices such as Facebook and Twitter, Instagram allows users toshare their locations when publishing photos. Moreover, unlikeTwitter where only a small amount of tweets are geo-tagged, theauthors of [19] have shown that Instagram users are much morewilling to share their locations (31 times more than Twitter users),
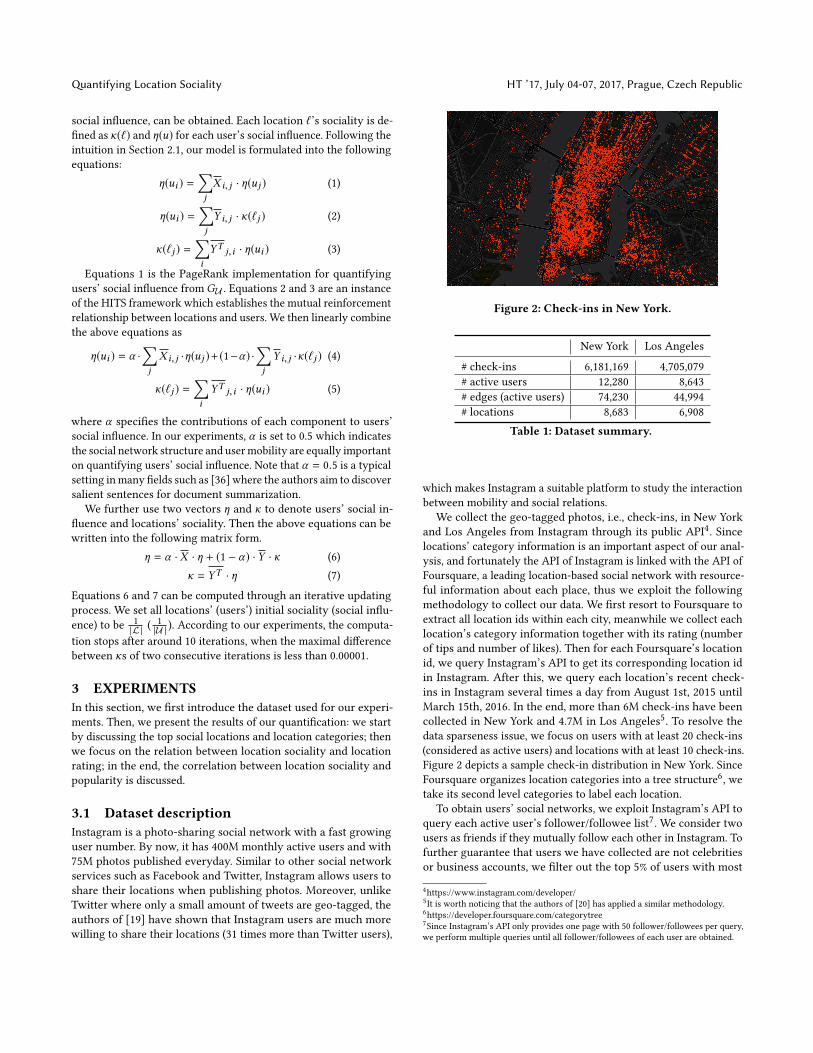
Figure 2: Check-ins in New York.
New York Los Angeles
# check-ins 6,181,169 4,705,079# active users 12,280 8,643# edges (active users) 74,230 44,994# locations 8,683 6,908
Table 1: Dataset summary.
which makes Instagram a suitable platform to study the interactionbetween mobility and social relations.
We collect the geo-tagged photos, i.e., check-ins, in New Yorkand Los Angeles from Instagram through its public API4. Sincelocations’ category information is an important aspect of our anal-ysis, and fortunately the API of Instagram is linked with the API ofFoursquare, a leading location-based social network with resource-ful information about each place, thus we exploit the followingmethodology to collect our data. We first resort to Foursquare toextract all location ids within each city, meanwhile we collect eachlocation’s category information together with its rating (numberof tips and number of likes). Then for each Foursquare’s locationid, we query Instagram’s API to get its corresponding location idin Instagram. After this, we query each location’s recent check-ins in Instagram several times a day from August 1st, 2015 untilMarch 15th, 2016. In the end, more than 6M check-ins have beencollected in New York and 4.7M in Los Angeles5. To resolve thedata sparseness issue, we focus on users with at least 20 check-ins(considered as active users) and locations with at least 10 check-ins.Figure 2 depicts a sample check-in distribution in New York. SinceFoursquare organizes location categories into a tree structure6, wetake its second level categories to label each location.
To obtain users’ social networks, we exploit Instagram’s API toquery each active user’s follower/followee list7. We consider twousers as friends if they mutually follow each other in Instagram. Tofurther guarantee that users we have collected are not celebritiesor business accounts, we filter out the top 5% of users with most
4https://www.instagram.com/developer/5It is worth noticing that the authors of [20] has applied a similar methodology.6https://developer.foursquare.com/categorytree7Since Instagram’s API only provides one page with 50 follower/followees per query,we perform multiple queries until all follower/followees of each user are obtained.
HT ’17, July 04-07, 2017, Prague, Czech Republic Jun Pang and Yang Zhang
location socialtiy (log)-10 -8 -6
pro
babili
ty
0
0.01
0.02
0.03
0.04
0.05
0.06
(a) New York
location socialtiy (log)-10 -9 -8 -7 -6
pro
babili
ty
0
0.02
0.04
0.06
0.08
(b) Los Angeles
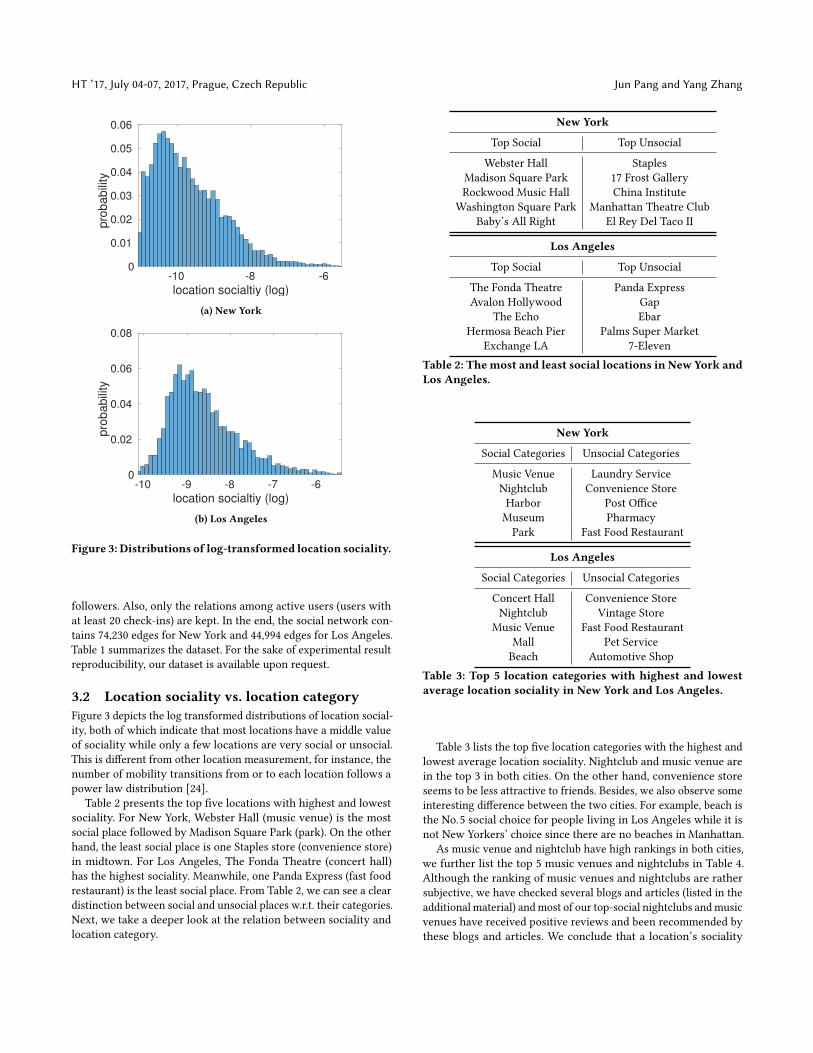
Figure 3: Distributions of log-transformed location sociality.
followers. Also, only the relations among active users (users withat least 20 check-ins) are kept. In the end, the social network con-tains 74,230 edges for New York and 44,994 edges for Los Angeles.Table 1 summarizes the dataset. For the sake of experimental resultreproducibility, our dataset is available upon request.
3.2 Location sociality vs. location categoryFigure 3 depicts the log transformed distributions of location social-ity, both of which indicate that most locations have a middle valueof sociality while only a few locations are very social or unsocial.This is different from other location measurement, for instance, thenumber of mobility transitions from or to each location follows apower law distribution [24].
Table 2 presents the top five locations with highest and lowestsociality. For New York, Webster Hall (music venue) is the mostsocial place followed by Madison Square Park (park). On the otherhand, the least social place is one Staples store (convenience store)in midtown. For Los Angeles, The Fonda Theatre (concert hall)has the highest sociality. Meanwhile, one Panda Express (fast foodrestaurant) is the least social place. From Table 2, we can see a cleardistinction between social and unsocial places w.r.t. their categories.Next, we take a deeper look at the relation between sociality andlocation category.
New York
Top Social Top Unsocial
Webster Hall StaplesMadison Square Park 17 Frost GalleryRockwood Music Hall China Institute
Washington Square Park Manhattan Theatre ClubBaby’s All Right El Rey Del Taco II
Los Angeles
Top Social Top Unsocial
The Fonda Theatre Panda ExpressAvalon Hollywood Gap
The Echo EbarHermosa Beach Pier Palms Super Market
Exchange LA 7-ElevenTable 2: Themost and least social locations in New York andLos Angeles.
New York
Social Categories Unsocial Categories
Music Venue Laundry ServiceNightclub Convenience StoreHarbor Post OfficeMuseum PharmacyPark Fast Food Restaurant
Los Angeles
Social Categories Unsocial Categories
Concert Hall Convenience StoreNightclub Vintage Store
Music Venue Fast Food RestaurantMall Pet ServiceBeach Automotive Shop
Table 3: Top 5 location categories with highest and lowestaverage location sociality in New York and Los Angeles.
Table 3 lists the top five location categories with the highest andlowest average location sociality. Nightclub and music venue arein the top 3 in both cities. On the other hand, convenience storeseems to be less attractive to friends. Besides, we also observe someinteresting difference between the two cities. For example, beach isthe No.5 social choice for people living in Los Angeles while it isnot New Yorkers’ choice since there are no beaches in Manhattan.
As music venue and nightclub have high rankings in both cities,we further list the top 5 music venues and nightclubs in Table 4.Although the ranking of music venues and nightclubs are rathersubjective, we have checked several blogs and articles (listed in theadditional material) andmost of our top-social nightclubs andmusicvenues have received positive reviews and been recommended bythese blogs and articles. We conclude that a location’s sociality

Quantifying Location Sociality HT ’17, July 04-07, 2017, Prague, Czech Republic
New York
Social Music Venues Social Nightclubs
Webster Hall Stage 48Rockwood Music Hall Marquee
Baby’s All Right Pacha NYCBowery Ballroom 1 OAK
Music Hall of Williamsburg VIP Room NYC
Los Angeles
Social Music Venus Social Nightclubs
Avalon Hollywood Exchange LAThe Echo OHM NightclubThe Roxy Sound Nightclub
The Troubadour Club Los GlobosThe Hollywood Bowl Create Nightclubs
Table 4: Top 5 music venues and nightclubs with highest lo-cation sociality in New York and Los Angeles.
is related to its category. Normally, location category itself is notsufficient to judge whether a location is social or not. Next, we studyother properties of locations and their relationship with locationsociality.
3.3 Location sociality vs. rating, tips and likesFor each location, Foursquare provides us with not only its categoryinformation, but also other properties including rating8, numberof tips and number of likes generated by Foursquare users. Next,we study whether it is possible to use these properties to explainlocation sociality. To proceed, we build a linear regression modelwith rating, number of tips and number of likes as explanatoryvariables while location sociality as the dependent variable. Byfitting the model with ordinary least square method, we obtain acoefficient of determination (R2) of 0.192 in New York and 0.280in Los Angeles, meaning that 19.2% (28.0%) of the variability oflocation sociality in New York (Los Angeles) can be explained bythese properties. By checking the parameters of our linear model,we discover that the major predictive power is driven by locationrating.
We further plot the average location sociality as a function ofrating in Figure 4: the two variables share a positive relation. Espe-cially when location rating is high (≥ 8), location sociality increasessharply for both cities. This indicates that social places are assignedwith high ratings by users.
3.4 Location sociality vs. location popularityA social location is often popular in the sense that it attracts manypeople. On the other hand, to conduct social activities, everyone hashis own preference on choosing locations. For example, one mayprefer to go to a bar near his home, which might not be well-knownat the city level. The relationship between a location’s sociality andits popularity is worth investigation: a location’s sociality should be
8In Foursquare, rating is in the range from 1 to 10.
rating4 6 8 10
location s
ocia
lity
×10-4
0
1
2
3
(a) New York.
rating4 6 8 10
location s
ocia
lity
×10-4
0
1
2
3
4
5
(b) Los Angeles.
Figure 4: Location sociality vs. location rating.
correlated with its popularity, while the two notions should exhibitdifference.
By far, the most common notion for quantifying a location’spopularity is location entropy [4], it is formally defined as
le(ℓ) = −∑ |ci(u, ℓ)|
|ci(ℓ)|log
|ci(u, ℓ)||ci(ℓ)|
,
where |ci(u, ℓ)| is user u’s number of check-ins at location ℓ (Sec-tion 2) and |ci(ℓ)| is the total number of check-ins of location ℓ.More popular a location is, higher location entropy it has.
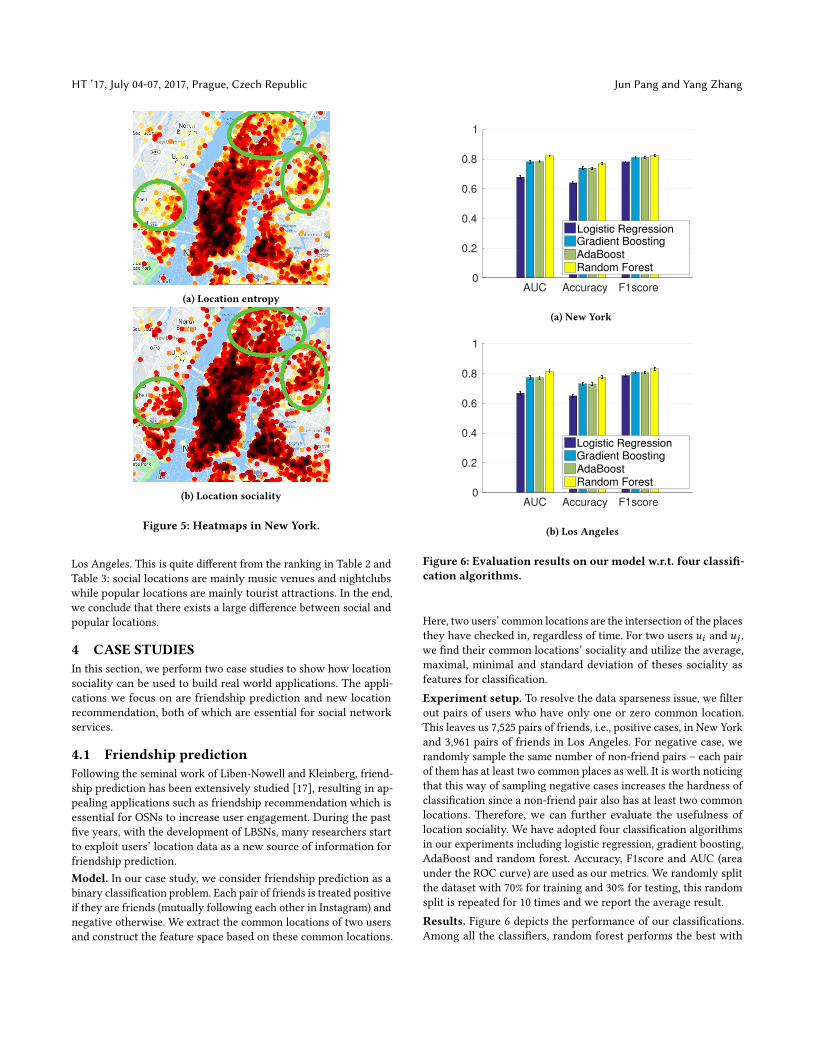
To check the difference between the two measurements, we plotthe heatmaps w.r.t. location entropy and sociality of New York. Asexpected, midtown and downtown New York are “hot” areas inboth maps. On the other hand, we observe that location socialityis more uniformly distributed than location entropy. For example,the areas marked by green circles in Figure 5a are obviously lighterthan those in Figure 5b. After having a close look, we discover thatbars and restaurants are the “hot” locations inside these areas. Datain Los Angeles exhibits a similar result and is not shown.
We further extract the top 20 popular locations in both cities(listed in the additional material). In New York, the most popu-lar locations are parks and museums (e.g., The MET, MoMA andGuggenheim). On the other hand, in Los Angeles, the most popularlocations concentrate on malls followed by museums. Moreover, inboth cities, famous landmarks have high location entropy, such asRockefeller Center in New York and Hollywood Walk of Fame in
HT ’17, July 04-07, 2017, Prague, Czech Republic Jun Pang and Yang Zhang
(a) Location entropy
(b) Location sociality
Figure 5: Heatmaps in New York.
Los Angeles. This is quite different from the ranking in Table 2 andTable 3: social locations are mainly music venues and nightclubswhile popular locations are mainly tourist attractions. In the end,we conclude that there exists a large difference between social andpopular locations.
4 CASE STUDIESIn this section, we perform two case studies to show how locationsociality can be used to build real world applications. The appli-cations we focus on are friendship prediction and new locationrecommendation, both of which are essential for social networkservices.
4.1 Friendship predictionFollowing the seminal work of Liben-Nowell and Kleinberg, friend-ship prediction has been extensively studied [17], resulting in ap-pealing applications such as friendship recommendation which isessential for OSNs to increase user engagement. During the pastfive years, with the development of LBSNs, many researchers startto exploit users’ location data as a new source of information forfriendship prediction.Model. In our case study, we consider friendship prediction as abinary classification problem. Each pair of friends is treated positiveif they are friends (mutually following each other in Instagram) andnegative otherwise. We extract the common locations of two usersand construct the feature space based on these common locations.
AUC Accuracy F1score0
0.2
0.4
0.6
0.8
1
Logitstic RegressionGradient BoostingAdaBoostRandom Forest
Logistic Regression
(a) New York
AUC Accuracy F1score0
0.2
0.4
0.6
0.8
1
Logitstic RegressionGradient BoostingAdaBoostRandom Forest
Logistic Regression
(b) Los Angeles
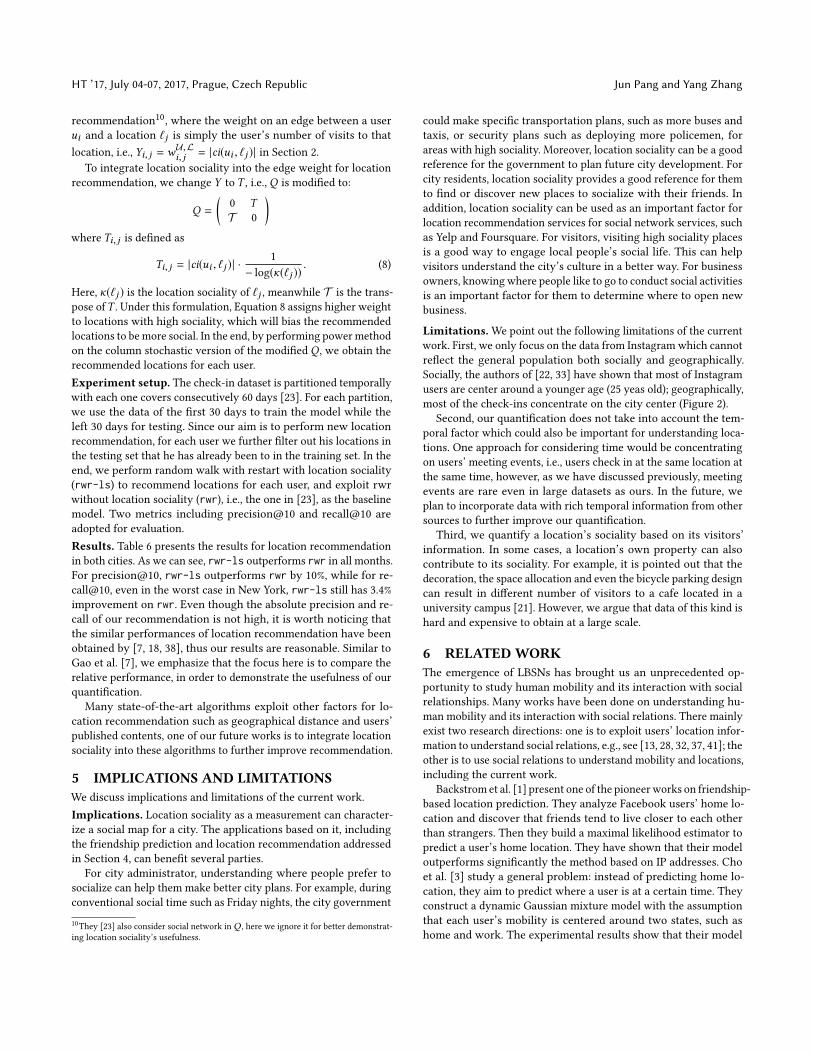
Figure 6: Evaluation results on our model w.r.t. four classifi-cation algorithms.
Here, two users’ common locations are the intersection of the placesthey have checked in, regardless of time. For two users ui and uj ,we find their common locations’ sociality and utilize the average,maximal, minimal and standard deviation of theses sociality asfeatures for classification.Experiment setup. To resolve the data sparseness issue, we filterout pairs of users who have only one or zero common location.This leaves us 7,525 pairs of friends, i.e., positive cases, in New Yorkand 3,961 pairs of friends in Los Angeles. For negative case, werandomly sample the same number of non-friend pairs – each pairof them has at least two common places as well. It is worth noticingthat this way of sampling negative cases increases the hardness ofclassification since a non-friend pair also has at least two commonlocations. Therefore, we can further evaluate the usefulness oflocation sociality. We have adopted four classification algorithmsin our experiments including logistic regression, gradient boosting,AdaBoost and random forest. Accuracy, F1score and AUC (areaunder the ROC curve) are used as our metrics. We randomly splitthe dataset with 70% for training and 30% for testing, this randomsplit is repeated for 10 times and we report the average result.Results. Figure 6 depicts the performance of our classifications.Among all the classifiers, random forest performs the best with

Quantifying Location Sociality HT ’17, July 04-07, 2017, Prague, Czech Republic
FPR0 0.2 0.4 0.6 0.8 1
TP
R
0
0.2
0.4
0.6
0.8
1
Common Location CountLogitstic RegressionGradient BoostingAdaBoostRandom Forest
Logistic Regression
(a) New York
FPR0 0.2 0.4 0.6 0.8 1
TP
R
0
0.2
0.4
0.6
0.8
1
Common Location CountLogitstic RegressionGradient BoostingAdaBoostRandom Forest
Logistic Regression
(b) Los Angeles
Figure 7: ROC curves for our classification and the numberof common locations.
AUC = 0.82 and Accuracy = 0.77 in the two cities. Meanwhile, wehave F1score = 0.82 in New York and F1score = 0.83 in Los Angeles.AdaBoost and gradient boosting have a comparable performance.On the other hand, logistic regression performs the worst.
The number of common locations is further adopted as a naivebaseline model for comparison, i.e., we tune the threshold (thenumber of common locations) for classification to obtain the ROCcurve. Figure 7 plots the results. As we can see, all our classifiersbased on location sociality outperform this naive baseline.
Next, we check whether adding location sociality into a state-of-the-art model as proposed in [32] 9 can increase prediction per-formance. The model in [32] (location feature setting) extracts twousers’ common locations and design features mainly with thesecommon locations’ entropies (see Section 3.4 for location entropy),such as the minimal location entropy. In our experiments, we com-bine our four location sociality features with the features in [32]and fit them into our best performing classifier random forest. Theresults in Table 5 show that the classification with location social-ity improves [32] by around 5% among all three metrics in both
9Most of the recent solutions focus on two users’ meeting events i.e., two users atthe same location at roughly the same time, while [32] and our model only exploitcommon locations.
New York AUC Accuracy F1score
[32] 0.83 0.77 0.82sociality+[32] 0.87 0.81 0.85
Los Angeles AUC Accuracy F1score
[32] 0.82 0.77 0.82sociality+[32] 0.86 0.80 0.85
Table 5: Evaluation result on [32] and locationsociality+[32] .
New York and Los Angeles. This further demonstrates that locationsociality is useful for friendship prediction.
Indeed, there exist other solutions for friendship prediction suchas considering two users’ meeting events [13, 28, 37]. However,the main issue for this method is that meeting events (reflected inOSNs) are rare, for example, with 6M check-ins in New York, weonly observe around 100 meeting events. Moreover, we want toemphasize that friendship prediction is not the focus of the currentwork. Therefore, we choose the most straightforward features fortraining our classifiers. Nevertheless, our prediction still achieves astrong performance showing that location sociality is a good indica-tor for recommending friends. Further investigation on integratinglocation sociality into the state-of-the-art friendship predictionmodels is worth studying and we leave it as a future work.
4.2 Location recommendationThe second case study we perform is recommending new locationsfor users to visit. Location recommendation has a great potentialto build appealing applications. During the past five years, it hasattracted academia a lot of attention (e.g. [2, 6, 7, 42]). Our goalhere is to demonstrate the usefulness of location sociality in recom-mending new locations. In order to integrate location sociality intoa location recommender, we adopt a classical approach, namelyrandom walk with restart [34].Model. In a typical setting of random walk with restart for recom-mendation, in the beginning we define a matrix Q as
Q =
(0 Y
YT 0
)where Y and YT represent user-location network (location-usernetwork) (Section 2). Meanwhile, Q̄ denotes the column stochasticversion of Q [39]. Then to recommend locations to a user ui , wemodify Q̄ to allow every node in the graph having a certain proba-bility (15% in the experiments) to jump to the node representing ui .Formally, for every Qa,b ∈ Q , Q̄a,b is defined as
Q̄a,b =
(1 − c) ·
Qa,b∑j Q j,b
+ c · 1 if the ath row represents ui
(1 − c) ·Qa,b∑j Q j,b
otherwise
where c = 0.15. By applying the same method of solving PageRank,e.g., power method, we can obtain the steady state distribution overQ̄ , which is the relevance score of all nodes (both locations andusers) toui . Locations with high relevance scores are recommendedto ui . Noulas et al. [23] have exploited this approach for location
HT ’17, July 04-07, 2017, Prague, Czech Republic Jun Pang and Yang Zhang
recommendation10, where the weight on an edge between a userui and a location ℓj is simply the user’s number of visits to thatlocation, i.e., Yi, j = w𝒰,ℒ
i, j = |ci(ui , ℓj )| in Section 2.To integrate location sociality into the edge weight for location
recommendation, we change Y to T , i.e., Q is modified to:
Q =
(0 T𝒯 0
)where Ti, j is defined as
Ti, j = |ci(ui , ℓj )| ·1
− log(κ(ℓj )). (8)
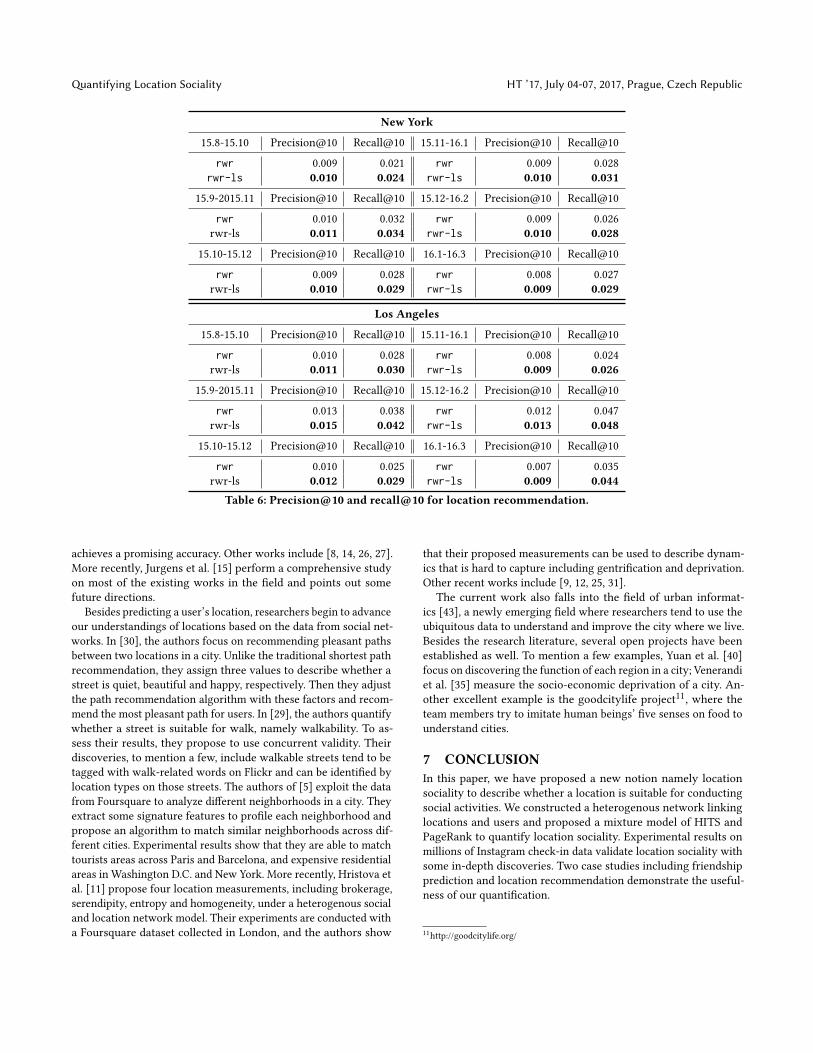
Here, κ(ℓj ) is the location sociality of ℓj , meanwhile 𝒯 is the trans-pose ofT . Under this formulation, Equation 8 assigns higher weightto locations with high sociality, which will bias the recommendedlocations to be more social. In the end, by performing power methodon the column stochastic version of the modified Q , we obtain therecommended locations for each user.Experiment setup. The check-in dataset is partitioned temporallywith each one covers consecutively 60 days [23]. For each partition,we use the data of the first 30 days to train the model while theleft 30 days for testing. Since our aim is to perform new locationrecommendation, for each user we further filter out his locations inthe testing set that he has already been to in the training set. In theend, we perform random walk with restart with location sociality(rwr-ls) to recommend locations for each user, and exploit rwrwithout location sociality (rwr), i.e., the one in [23], as the baselinemodel. Two metrics including precision@10 and recall@10 areadopted for evaluation.Results. Table 6 presents the results for location recommendationin both cities. As we can see, rwr-ls outperforms rwr in all months.For precision@10, rwr-ls outperforms rwr by 10%, while for re-call@10, even in the worst case in New York, rwr-ls still has 3.4%improvement on rwr. Even though the absolute precision and re-call of our recommendation is not high, it is worth noticing thatthe similar performances of location recommendation have beenobtained by [7, 18, 38], thus our results are reasonable. Similar toGao et al. [7], we emphasize that the focus here is to compare therelative performance, in order to demonstrate the usefulness of ourquantification.
Many state-of-the-art algorithms exploit other factors for lo-cation recommendation such as geographical distance and users’published contents, one of our future works is to integrate locationsociality into these algorithms to further improve recommendation.
5 IMPLICATIONS AND LIMITATIONSWe discuss implications and limitations of the current work.Implications. Location sociality as a measurement can character-ize a social map for a city. The applications based on it, includingthe friendship prediction and location recommendation addressedin Section 4, can benefit several parties.
For city administrator, understanding where people prefer tosocialize can help them make better city plans. For example, duringconventional social time such as Friday nights, the city government
10They [23] also consider social network inQ , here we ignore it for better demonstrat-ing location sociality’s usefulness.
could make specific transportation plans, such as more buses andtaxis, or security plans such as deploying more policemen, forareas with high sociality. Moreover, location sociality can be a goodreference for the government to plan future city development. Forcity residents, location sociality provides a good reference for themto find or discover new places to socialize with their friends. Inaddition, location sociality can be used as an important factor forlocation recommendation services for social network services, suchas Yelp and Foursquare. For visitors, visiting high sociality placesis a good way to engage local people’s social life. This can helpvisitors understand the city’s culture in a better way. For businessowners, knowing where people like to go to conduct social activitiesis an important factor for them to determine where to open newbusiness.
Limitations.We point out the following limitations of the currentwork. First, we only focus on the data from Instagram which cannotreflect the general population both socially and geographically.Socially, the authors of [22, 33] have shown that most of Instagramusers are center around a younger age (25 yeas old); geographically,most of the check-ins concentrate on the city center (Figure 2).
Second, our quantification does not take into account the tem-poral factor which could also be important for understanding loca-tions. One approach for considering time would be concentratingon users’ meeting events, i.e., users check in at the same location atthe same time, however, as we have discussed previously, meetingevents are rare even in large datasets as ours. In the future, weplan to incorporate data with rich temporal information from othersources to further improve our quantification.
Third, we quantify a location’s sociality based on its visitors’information. In some cases, a location’s own property can alsocontribute to its sociality. For example, it is pointed out that thedecoration, the space allocation and even the bicycle parking designcan result in different number of visitors to a cafe located in auniversity campus [21]. However, we argue that data of this kind ishard and expensive to obtain at a large scale.
6 RELATEDWORKThe emergence of LBSNs has brought us an unprecedented op-portunity to study human mobility and its interaction with socialrelationships. Many works have been done on understanding hu-man mobility and its interaction with social relations. There mainlyexist two research directions: one is to exploit users’ location infor-mation to understand social relations, e.g., see [13, 28, 32, 37, 41]; theother is to use social relations to understand mobility and locations,including the current work.
Backstrom et al. [1] present one of the pioneerworks on friendship-based location prediction. They analyze Facebook users’ home lo-cation and discover that friends tend to live closer to each otherthan strangers. Then they build a maximal likelihood estimator topredict a user’s home location. They have shown that their modeloutperforms significantly the method based on IP addresses. Choet al. [3] study a general problem: instead of predicting home lo-cation, they aim to predict where a user is at a certain time. Theyconstruct a dynamic Gaussian mixture model with the assumptionthat each user’s mobility is centered around two states, such ashome and work. The experimental results show that their model
Quantifying Location Sociality HT ’17, July 04-07, 2017, Prague, Czech Republic
New York
15.8-15.10 Precision@10 Recall@10 15.11-16.1 Precision@10 Recall@10
rwr 0.009 0.021 rwr 0.009 0.028rwr-ls 0.010 0.024 rwr-ls 0.010 0.031
15.9-2015.11 Precision@10 Recall@10 15.12-16.2 Precision@10 Recall@10
rwr 0.010 0.032 rwr 0.009 0.026rwr-ls 0.011 0.034 rwr-ls 0.010 0.028
15.10-15.12 Precision@10 Recall@10 16.1-16.3 Precision@10 Recall@10
rwr 0.009 0.028 rwr 0.008 0.027rwr-ls 0.010 0.029 rwr-ls 0.009 0.029
Los Angeles
15.8-15.10 Precision@10 Recall@10 15.11-16.1 Precision@10 Recall@10
rwr 0.010 0.028 rwr 0.008 0.024rwr-ls 0.011 0.030 rwr-ls 0.009 0.026
15.9-2015.11 Precision@10 Recall@10 15.12-16.2 Precision@10 Recall@10
rwr 0.013 0.038 rwr 0.012 0.047rwr-ls 0.015 0.042 rwr-ls 0.013 0.048
15.10-15.12 Precision@10 Recall@10 16.1-16.3 Precision@10 Recall@10
rwr 0.010 0.025 rwr 0.007 0.035rwr-ls 0.012 0.029 rwr-ls 0.009 0.044
Table 6: Precision@10 and recall@10 for location recommendation.
achieves a promising accuracy. Other works include [8, 14, 26, 27].More recently, Jurgens et al. [15] perform a comprehensive studyon most of the existing works in the field and points out somefuture directions.
Besides predicting a user’s location, researchers begin to advanceour understandings of locations based on the data from social net-works. In [30], the authors focus on recommending pleasant pathsbetween two locations in a city. Unlike the traditional shortest pathrecommendation, they assign three values to describe whether astreet is quiet, beautiful and happy, respectively. Then they adjustthe path recommendation algorithm with these factors and recom-mend the most pleasant path for users. In [29], the authors quantifywhether a street is suitable for walk, namely walkability. To as-sess their results, they propose to use concurrent validity. Theirdiscoveries, to mention a few, include walkable streets tend to betagged with walk-related words on Flickr and can be identified bylocation types on those streets. The authors of [5] exploit the datafrom Foursquare to analyze different neighborhoods in a city. Theyextract some signature features to profile each neighborhood andpropose an algorithm to match similar neighborhoods across dif-ferent cities. Experimental results show that they are able to matchtourists areas across Paris and Barcelona, and expensive residentialareas in Washington D.C. and New York. More recently, Hristova etal. [11] propose four location measurements, including brokerage,serendipity, entropy and homogeneity, under a heterogenous socialand location network model. Their experiments are conducted witha Foursquare dataset collected in London, and the authors show
that their proposed measurements can be used to describe dynam-ics that is hard to capture including gentrification and deprivation.Other recent works include [9, 12, 25, 31].
The current work also falls into the field of urban informat-ics [43], a newly emerging field where researchers tend to use theubiquitous data to understand and improve the city where we live.Besides the research literature, several open projects have beenestablished as well. To mention a few examples, Yuan et al. [40]focus on discovering the function of each region in a city; Venerandiet al. [35] measure the socio-economic deprivation of a city. An-other excellent example is the goodcitylife project11, where theteam members try to imitate human beings’ five senses on food tounderstand cities.
7 CONCLUSIONIn this paper, we have proposed a new notion namely locationsociality to describe whether a location is suitable for conductingsocial activities. We constructed a heterogenous network linkinglocations and users and proposed a mixture model of HITS andPageRank to quantify location sociality. Experimental results onmillions of Instagram check-in data validate location sociality withsome in-depth discoveries. Two case studies including friendshipprediction and location recommendation demonstrate the useful-ness of our quantification.
11http://goodcitylife.org/
HT ’17, July 04-07, 2017, Prague, Czech Republic Jun Pang and Yang Zhang
Location data do not only come from LBSNs, but many othersources, such as GPS traces and WIFI points. In the future, we areinterested in establishing more connections between LBSN dataand other sources to gain a deep understanding of cities.
REFERENCES[1] Lars Backstrom, Eric Sun, and Cameron Marlow. 2010. Find me if you can:
improving geographical prediction with social and spatial proximity. In Proc.19th International Conference on World Wide Web (WWW). ACM, 61–70.
[2] Jie Bao, Yu Zheng, David Wilkie, and Mohamed Mokbel. 2015. Recommendationsin location-based social networks: a survey. GeoInformatica 19, 3 (2015), 525–565.
[3] Eunjoon Cho, Seth A. Myers, and Jure Leskovec. 2011. Friendship and mobility:user movement in location-based social networks. In Proc. 17th ACM Conferenceon Knowledge Discovery and Data Mining (KDD). ACM, 1082–1090.
[4] Justin Cranshaw, Eran Toch, Jason Hone, Ankiet Kittur, and Norma Sadeh. 2010.Bridging the gap between physical location and online social networks. In Proc.12th ACM International Conference on Ubiquitous Computing (UbiComp). ACM,119–128.
[5] Geraud Le Falher, Aristides Gionis, and Michael Mathioudakis. 2015. Where Isthe soho of Rome? Measures and algorithms for finding similar neighborhoodsin cities. In Proc. 9th AAAI Conference on Weblogs and Social Media (ICWSM).The AAAI Press, 228–237.
[6] Huiji Gao, Jiliang Tang, Xia Hu, and Huan Liu. 2013. Exploring temporal effectsfor location recommendation on location-based social networks. In Proc. 7thACM Conference on Recommender Systems (RecSys). ACM, 93–100.
[7] Huiji Gao, Jiliang Tang, Xia Hu, and Huan Liu. 2015. Content-Aware Point ofInterest Recommendation on Location-Based Social Networks. In Proc. 29th AAAIConference on Artificial Intelligence (AAAI). The AAAI Press, 1721–1727.
[8] Huiji Gao, Jiliang Tang, and Huan Liu. 2012. Exploring social-historical ties onlocation-based social networks. In Proc. 6th AAAI Conference on Weblogs andSocial Media (ICWSM). The AAAI Press, 114–121.
[9] Petko Georgiev, Anastasios Noulas, and Cecilia Mascolo. 2014. Where businessesthrive: predicting the impact of the Olympic games on local retailers throughlocation-based services data. In Proc. 8th AAAI Conference on Weblogs and SocialMedia (ICWSM). The AAAI Press, 151–160.
[10] Erving Goffman. 1959. The Presentation of Self in Everyday Life. Random House.[11] Desislava Hristova, Matthew J. Williams, Mirco Musolesi, Pietro Panzarasa, and
Cecilia Mascolo. 2016. Measuring Urban Social Diversity Using InterconnectedGeo-Social Networks. In Proc. 25th International Conference on World Wide Web(WWW). ACM, 21–30.
[12] Hsun-Ping Hsieh, Cheng-Te Li, and Shou-De Lin. 2015. Estimating PotentialCustomers Anywhere and Anytime Based on Location-Based Social Networks.In Proc. 2015 European Conference on Machine Learning and Principles and Practiceof Knowledge Discovery in Databases (ECML/PKDD). Springer, 576–592.
[13] Hsun-Ping Hsieh, Rui Yan, and Cheng-Te Li. 2014. Where You Go Reveals WhoYou Know: Analyzing Social Ties from Millions of Footprints. In Proc. 24th ACMInternational Conference on Information and Knowledge Management (CIKM).ACM, 1839–1862.
[14] David Jurgens. 2013. That’s what friends are for: Inferring location in onlinesocial media platforms based on social relationships. In Proc. 7th AAAI Conferenceon Weblogs and Social Media (ICWSM). The AAAI Press.
[15] David Jurgens, Tyler Finethy, James McCorriston, Yi Tian Xu, and Derek Ruths.2015. Geolocation prediction in Twitter using social networks: a critical analysisand review of current practice. In Proc. 9th AAAI Conference on Weblogs andSocial Media (ICWSM). The AAAI Press, 188–197.
[16] Jon Kleinberg. 1999. Authoritative sources in a hyperlinked environment. J.ACM 46, 5 (1999), 604–632.
[17] David Liben-Nowell and Jon Kleinberg. 2007. The link-prediction problem forsocial networks. Journal of the American Society for Information Science andTechnology 58, 7 (2007), 1019–1031.
[18] Bin Liu and Hui Xiong. 2013. Point-of-interest recommendation in locationbased social networks with topic and location awareness. In Proc. 13th SIAMInternational Conference on Data Mining (SDM). SIAM, 396–404.
[19] Lydia Manikonda, Yuheng Hu, and Subbarao Kambhampati. 2014. Analyzing useractivities, demographics, social network structure and user-generated contenton Instagram. CoRR abs/1410.8099 (2014).
[20] Yelena Mejova, Hamed Haddadi, Anastasios Noulas, and Ingmar Weber. 2015.#FoodPorn: obesity patterns in culinary interactions. In Proc. the 5th InternationalConference on Digital Health (DH). ACM, 51–58.
[21] Melinda J Milligan. 1998. Interactional past and potential: The social constructionof place attachment. Symbolic Interaction 21, 1 (1998), 1–33.
[22] Minyue Ni, Yang Zhang, Weili Han, and Jun Pang. 2016. An Empirical Study onUser Access Control in Online Social Networks. In Proc. 21st ACM Symposiumon Access Control Models and Technologies (SACMAT). ACM, 13–23.
[23] Anastasios Noulas, Salvatore Scellato, Neal Lathia, and Cecilia Mascolo. 2012. ARandom Walk around the City: New Venue Recommendation in Location-BasedSocial Networks. In Proc. 2012 International Confernece on Social Computing(SocialCom). IEEE, 144–153.
[24] Anastasios Noulas, Blake Shaw, Renaud Lambiotte, and Cecilia Mascolo. 2015.Topological properties and temporal dynamics of place networks in urban en-vironments. In Proc. 24th International Conference on World Wide Web (WWWCompanion). ACM, 431–441.
[25] Alexandra-Mihaela Olteanu, Kévin Huguenin, Reza Shokri, Mathias Humbert,and Jean-Pierre Hubaux. 2017. Quantifying interdependent privacy risks withlocation data. IEEE Transactions on Mobile Computing 3 (2017), 829–842.
[26] Jun Pang and Yang Zhang. 2015. Exploring communities for effective locationprediction (poster paper). In Proc. 24th International Conference on World WideWeb Conference (Companion Volume) (WWW). ACM, 87–88.
[27] Jun Pang and Yang Zhang. 2015. Location prediction: Communities speak louderthan friends. In Proc. 3rd ACM Conference on Online Social Networks (COSN).ACM, 161–171.
[28] Huy Pham, Cyrus Shahabi, and Yan Liu. 2013. EBM: an entropy-based model toinfer social strength from spatiotemporal data. In Proc. 2013 ACM InternationalConference on Management of Data (SIGMOD). ACM, 265–276.
[29] Daniele Quercia, Luca Maria Aiello, Rossano Schifanella, and Adam Davies. 2015.The digital life of walkable streets. In Proc. 24th International Conference on WorldWide Web (WWW). ACM, 875–884.
[30] Daniele Quercia, Rossano Schifanella, and Luca Maria Aiello. 2014. The shortestpath to happiness: recommending beautiful, quiet, and happy routes in the city.In Proc. 25th ACM Conference on Hypertext and Social Media (HT). ACM, 116–125.
[31] Daniele Quercia, Rossano Schifanella, Luca Maria Aiello, and Kate McLean. 2015.Smelly maps: the digital life of urban smellscapes. In Proc. 9th AAAI Conferenceon Weblogs and Social Media (ICWSM). The AAAI Press, 237–236.
[32] Salvatore Scellato, Anastasios Noulas, and Cecilia Mascolo. 2011. Exploiting placefeatures in link prediction on location-based social networks. In Proc. 17th ACMConference on Knowledge Discovery and Data Mining (KDD). ACM, 1046–1054.
[33] Flavio Souza, Diego de Las Casas, Vinicius Flores, SunBum Youn, MeeyoungCha, Daniele Quercia, and Virgilio Almeida. 2015. Dawn of the selfie era: thewhos, wheres, and hows of selfies on Instagram. In Proc. 3rd ACM on Conferenceon Online Social Networks (COSN). ACM, 221–231.
[34] Hanghang Tong, Christos Faloutsos, and Jia yu Pan. 2006. Community detectionin networks with node attributes. In Proc. 6th IEEE International Conference onData Mining (ICDM). IEEE CS, 613–622.
[35] Alessandro Venerandi, Giovanni Quattrone, Licia Capra, Daniele Quercia, andDiego Saez-Trumper. 2015. Measuring urban deprivation from user generatedcontent. In Proc. 18th ACM Conference on Computer Supported Cooperative Work& Social Computing (CSCW). ACM, 254–264.
[36] Xiaojun Wan, Jianwu Yang, and Jianguo Xiao. 2007. Towards an iterative rein-forcement approach for simultaneous document summarization and keywordextraction. In Proc. 45th Annual Meeting of the Association of ComputationalLinguistics (ACL). 552–559.
[37] Hongjian Wang, Zhenhui Li, and Wang-Chien Lee. 2014. PGT: Measuringmobility relationship using personal, global and temporal factors. In Proc. 14thIEEE International Conference on Data Mining (ICDM). IEEE, 570–579.
[38] Mao Ye, Xingjie Liu, and Wang-Chien Lee. 2012. Exploring social influencefor recommendation: a generative model approach. In Proc. 35th ACM SIGIRconference on Research and Development in Information Retrieval (SIGIR). ACM,671–680.
[39] Mao Ye, Dong Shou, Wang-Chien Lee, Peifeng Yin, and Krzysztof Janowicz. 2011.On the semantic annotation of places in location-based social networks. In Proc.17th ACM Conference on Knowledge Discovery and Data Mining (KDD). ACM,520–528.
[40] Jing Yuan, Yu Zheng, and Xing Xie. 2012. Discovering regions of differentfunctions in a city using human mobility and POIs. In Proc. 18th ACM Conferenceon Knowledge Discovery and Data Mining (KDD). ACM, 186–194.
[41] Yang Zhang and Jun Pang. 2015. Distance and friendship: A distance-based modelfor link prediction in social networks. In Proc. 17th Asia-Pacific Web Conference(APWeb). Springer, 55–66.
[42] Vincent W. Zheng, Yu Zheng, Xing Xie, and Qiang Yang. 2010. Collaborativelocation and activity recommendations with GPS history data. In Proc. 19thInternational Conference on World Wide Web (WWW). ACM, 1029–1038.
[43] Yu Zheng, Licia Capra, Ouri Wolfson, and Hai Yang. 2014. Urban computing:concepts, methodologies, and applications. ACM Transactions on IntelligentSystems and Technology 5, 3 (2014), 1–55.