quantify risk tolerance to guide risk policy - rims handouts/rims 15/erm009...quantify risk...
TRANSCRIPT

Quantify Risk Tolerance to Guide Risk Policy ERM009
Speakers: Joseph W. Mayo, President, J.W. Mayo Consulting, LLC
Jeff Vernor, Sr. Director, ERM and Internal Audit, TPG Global, LLC

Learning Objectives
At the end of this session, you will: • Understand how to use tolerance and appetite to shape ERM
policy
• Learn tools and techniques that can be used to objectively quantify risk impact
• Understand the relationships between risk policy, tolerance, appetite, and reserve budgets
• Understand the impact of ineffective Enterprise Risk Management by reviewing two real-world case studies
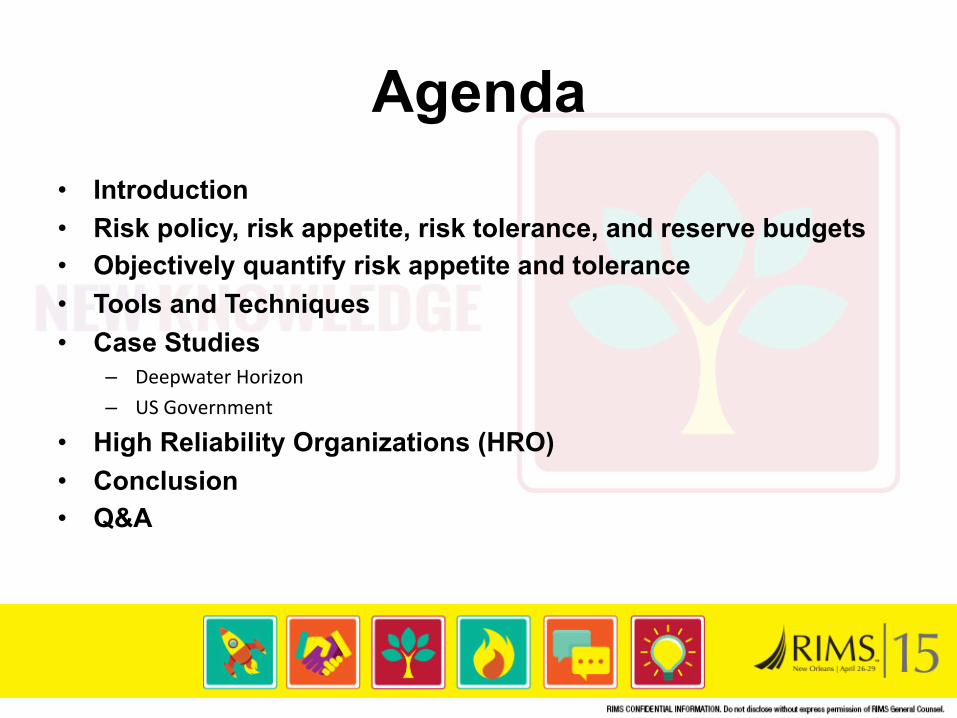
Agenda • Introduction • Risk policy, risk appetite, risk tolerance, and reserve budgets • Objectively quantify risk appetite and tolerance • Tools and Techniques • Case Studies
– Deepwater Horizon – US Government
• High Reliability Organizations (HRO) • Conclusion • Q&A

Introduction • Joseph Mayo, PMP, RMP, CRISC • 30 years in the IT industry primarily focused on risk and project
management • Career highlights include:
– Program Manager for Project #7 of InfoWorld's Top 100 IT Projects of 2006 – Developed a risk management maturity roadmap for a U.S. Government Agency – Instrumental in the development and approval of Government Agency risk policy – Developed an IV&V Program that was recognized by the Government AccounOng Office
(GAO) as a model for large complex Government programs – Author of Chaos to Clarity – The Tao of Risk Management
Introduction • Jeff Vernor, MBA, CCSA, ARM • 20 years in the risk management field with the last 16 in
financial services ERM • Career highlights include:
– Chair of RIMS ERM CommiYee; contribuOng author to several RIMS publicaOons – Guest lecturer at ten different universiOes with specialOes in ERM and insurance – Helped build ERM from scratch at two leading financial services firms – ExperOse on operaOonal risk, enterprise risk, insurance, and safety – Prior to TPG, served as Director of Global OperaOonal Risk at Russell Investments in
SeaYle and ExecuOve Director, ERM at USAA in San Antonio
Audience Query 1. Who has an established risk appetite?
o If yes what was the hardest part? o What was the key to success?
2. For those who have tried and failed, where do you think it went wrong?
3. What do you believe is the most valuable aspect of establishing a formalized risk appetite?

Policy, Appetite, and Tolerance • Risk Policy or Risk Principles – a statement describing the
types of risk and the amount of risk exposure an organization is willing to entertain
– Policy statement – Risk appeOte – Risk tolerance – Roles and responsibiliOes – Governance
• Risk Appetite – Desire or craving for taking risk – Risk appeOte is conceptually similar to human appeOte – Risk appeOte cannot exceed the organizaOon’s risk capacity – Six risk contexts; Budget, Schedule, Quality, Mission, ReputaOon, and Safety
• Risk Tolerance – degree of variance from a stated appetite or threshold
Policy, Appetite, Tolerance, and Budgets
• Risk appetite, risk tolerance, and reserve budgets guide the development of risk policy or risk principles
– These can and should change over Ome as market condiOons change
• Appetite and tolerance drive all aspects of risk management including Governance, treatment strategies, prioritization, reserve budgets, and risk management processes
– These are strategic risk management elements
• Mandating that project teams manage risk is insufficient and does not constitute ERM
• Effective risk management requires a risk policy or principles that clearly establishes appetite, tolerance, and waiver-ability
Risk Appetite and Tolerance • Risk policy or principles must explicitly state appetite
– Enterprise appeOte – Project appeOte – Regional/business line differences
• Risk policy or principles must state whether the organization allows waivers
– If waivers are allowed, risk policy must define or reference pre-‐defined waiver and governance processes
– Waivers and tolerance go hand-‐in-‐hand
• If possible, objectively quantify appetite and tolerance – Based on organizaOonal goals and objecOves
• Risk impact must be properly valued and may include impact bands
Risk Appetite and Tolerance
University of Edinburgh Risk Policy and Risk AppeOte. (20013). Retrieved from hYp://www.docs.sasg.ed.ac.uk/GaSP/Governance/RiskManagement/RiskAppeOte.pdf
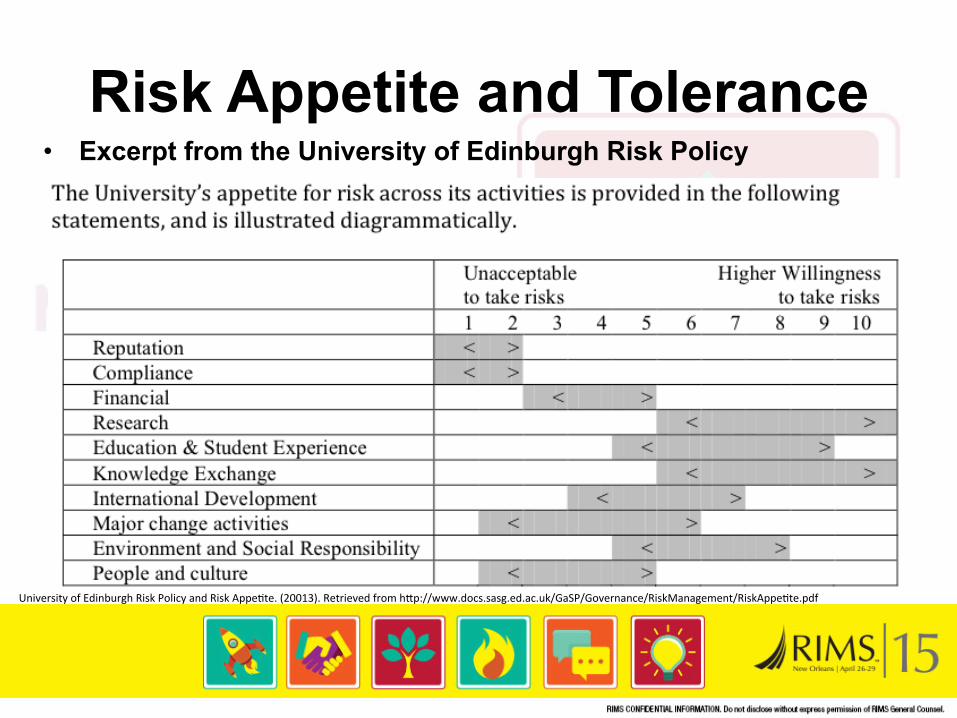
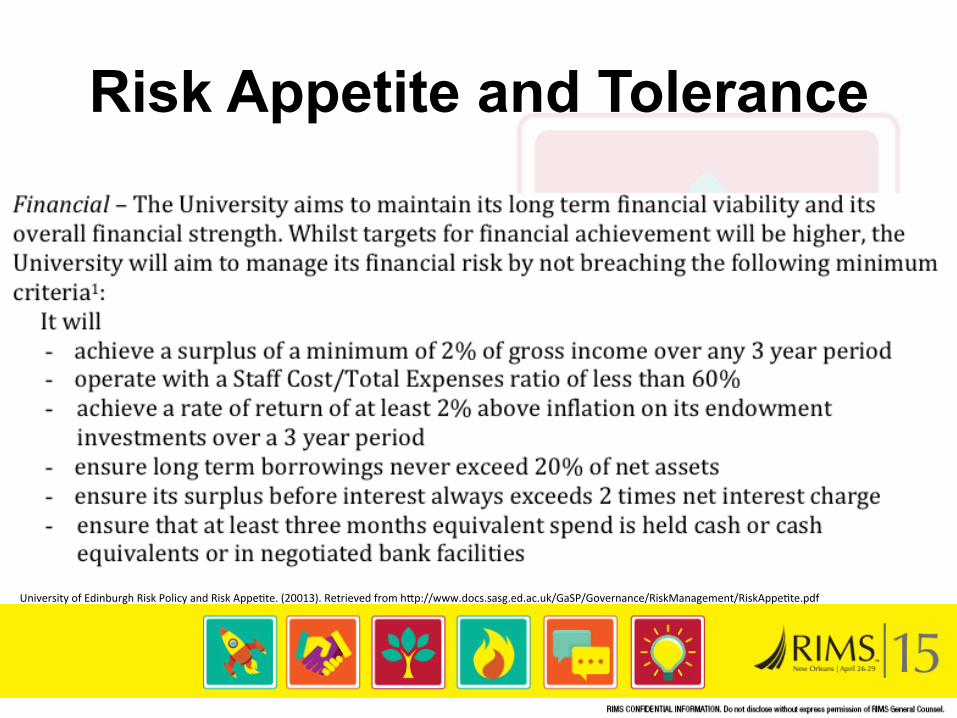
• Excerpt from the University of Edinburgh Risk Policy
Risk Appetite and Tolerance
University of Edinburgh Risk Policy and Risk AppeOte. (20013). Retrieved from hYp://www.docs.sasg.ed.ac.uk/GaSP/Governance/RiskManagement/RiskAppeOte.pdf
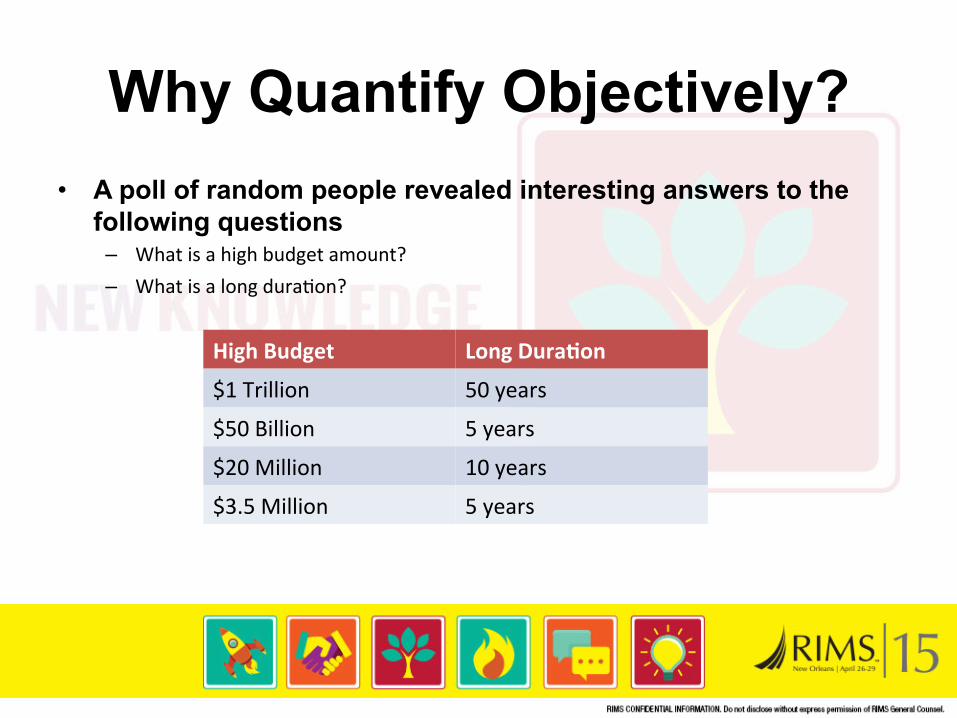
Why Quantify Objectively? • A poll of random people revealed interesting answers to the
following questions – What is a high budget amount? – What is a long duraOon?
High Budget Long Dura1on
$1 Trillion 50 years
$50 Billion 5 years
$20 Million 10 years
$3.5 Million 5 years

Why Quantify Objectively? • Large government agency normalizes risks using a concept
called a Risk Adjusted Cost (RAC) – $225,000 impact and “High” probability yields the same RAC as $175,000 impact and
“Very High” probability – The RACs are equal however, there is more than 20% difference in the impact – In this case the RAC causes equal treatment when in fact, the $175,000 risk should have
a higher priority because of the higher probability of occurrence
• NASA normalized foam strikes as a simple ‘‘maintenance” issue, and not a concern for mission success of Space Shuttle Columbia1
– Foam from the fuel tank had struck the wing on at least 12 previous shuYle flights, each Ome causing gouges or other damage
– Acquiescence to recurring risks has been termed “normalized deviance”
1NORMALIZED DEVIANCE. (2003, May 24). St.Louis Post -‐ Dispatch Retrieved from hYp://search.proquest.com/docview/402298524?accounOd=458
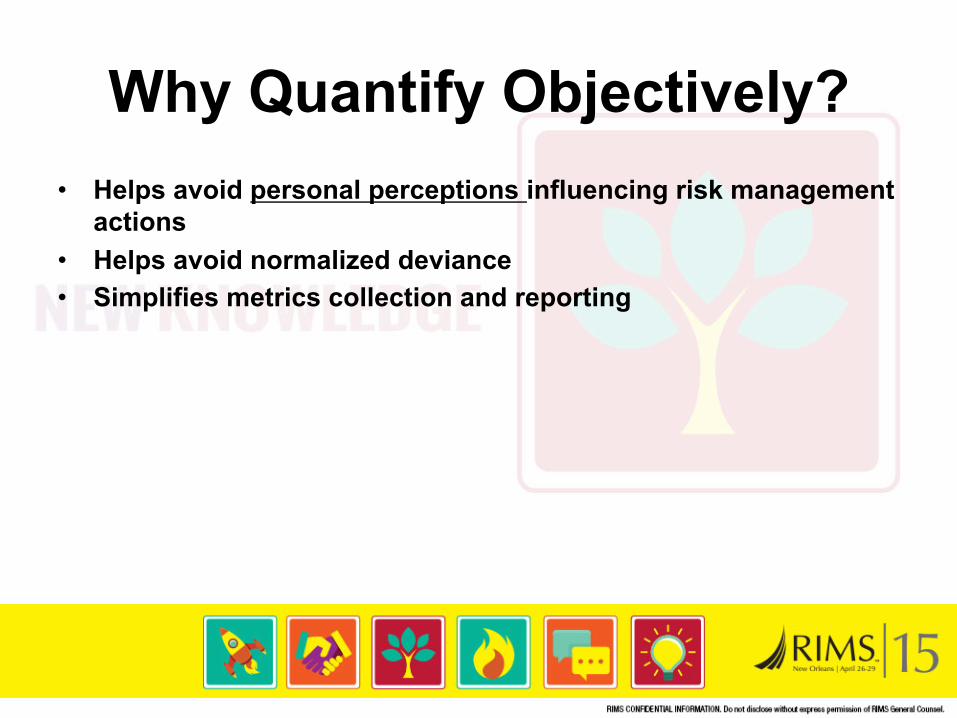
Why Quantify Objectively? • Helps avoid personal perceptions influencing risk management
actions • Helps avoid normalized deviance • Simplifies metrics collection and reporting

Risk Budgets • Management reserve used to
manage opportunities and Black Swan events
• Contingency reserve used for all risk management activities
• Project budget of for executing planned activities
• Reserve budgets are separate from project budgets
• Risk governance is the mechanism for transferring risk budget to project budget through RRB
Project Budget
ManagementReserve
Contingency Reserve
Project Manager
Senior Management
Project Sponsor
Risk Premium
Budget Element Owner
Project or Business Unit
Budget
Project or Business Unit Owner
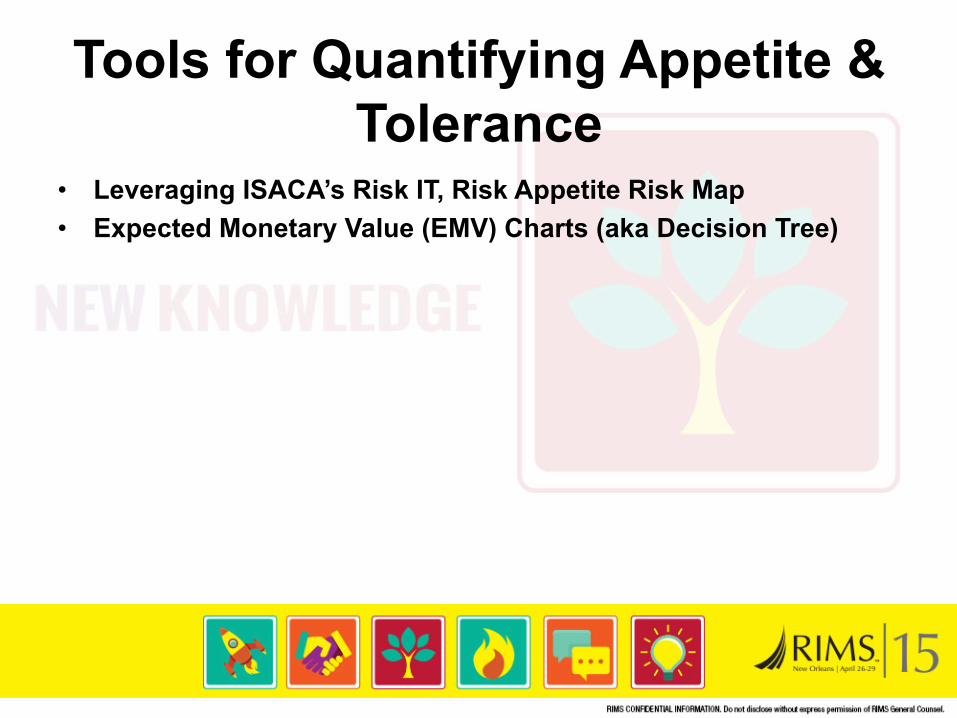
Tools for Quantifying Appetite & Tolerance
• Leveraging ISACA’s Risk IT, Risk Appetite Risk Map • Expected Monetary Value (EMV) Charts (aka Decision Tree)

Risk IT Risk Map • ISACA’s RiskIT is an
excellent guide • Understand what constitutes
acceptable vs unacceptable risks
Information Systems Audit and Control Association (ISACA). (2009). The Risk IT Practitioner Guide. Rolling Meadows, IL: Information Systems and Control Association (ISACA).

Risk IT Risk Map • ISACA’s RiskIT is an
excellent guide • Understand what constitutes
acceptable vs unacceptable risks
• Understand how much stakeholders are willing to spend for risk treatment
• Objectively quantify appetite • Properly value risk impact • Understand risk tolerance
thresholds
Information Systems Audit and Control Association (ISACA). (2009). The Risk IT Practitioner Guide. Rolling Meadows, IL: Information Systems and Control Association (ISACA).
l

Risk IT Risk Map
High Risk AppeOte Low Risk AppeOte
Risk Context Measure
Budget Dollars
Schedule Day, Weeks, Months
Quality Defects, Rework Dollars/hours
Mission OperaOonal Impact (e.g. # Enterprise goals not met)
ReputaOon Customer SaOsfacOon Survey results
Safety Accident impact (e.g. loss of life, lost work days)
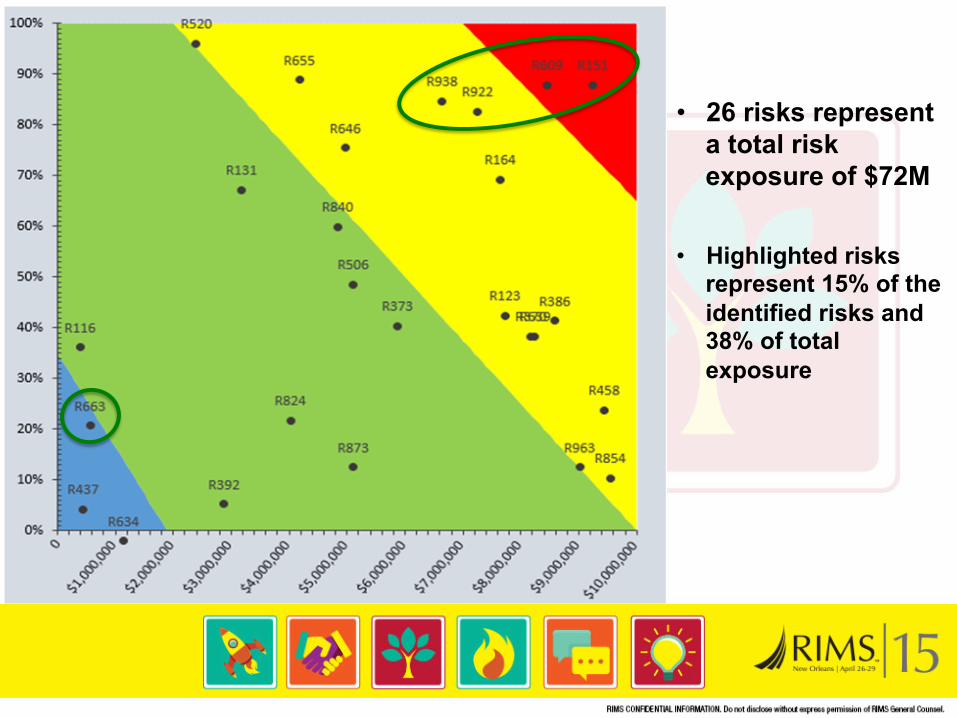
• 26 risks represent a total risk exposure of $72M
• Highlighted risks represent 15% of the identified risks and 38% of total exposure
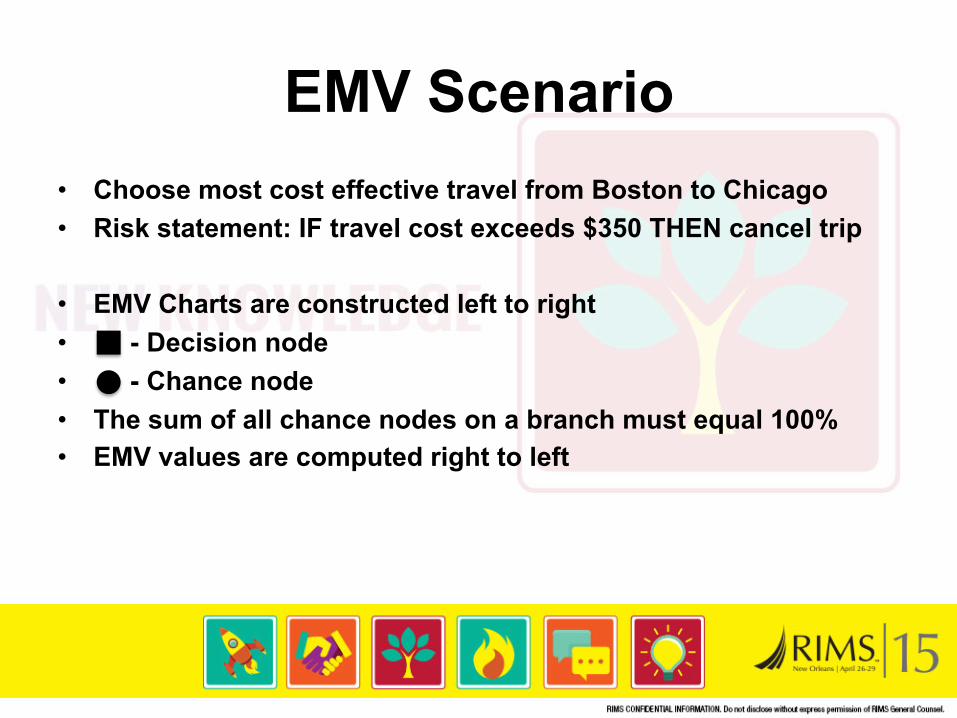
EMV Scenario • Choose most cost effective travel from Boston to Chicago • Risk statement: IF travel cost exceeds $350 THEN cancel trip
• EMV Charts are constructed left to right • - Decision node • - Chance node • The sum of all chance nodes on a branch must equal 100% • EMV values are computed right to left
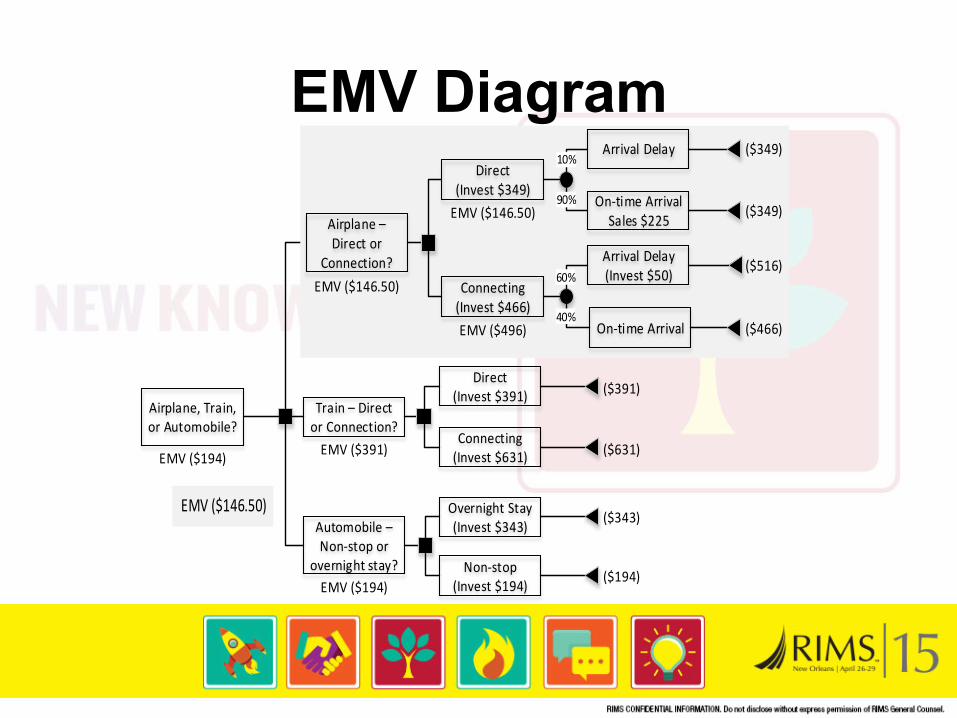
Airplane, Train, or Automobile?
Airplane – Direct or
Connection?
Train – Direct or Connection?
Automobile – Non-‐stop or
overnight stay?
Direct(Invest $349)
Connecting(Invest $466)
Arrival Delay
On-‐time Arrival
10%
90%
Arrival Delay(Invest $50)
On-‐time Arrival
60%
40%
($349)
($349)
($516)
($466)
Direct(Invest $391)
Connecting(Invest $631)
($391)
($631)
Overnight Stay(Invest $343)
Non-‐stop(Invest $194)
($343)
($194)
EMV ($349)
EMV ($349)
EMV ($496)
EMV ($391)
EMV ($194)
EMV ($194)
Airplane – Direct or
Connection?
Direct(Invest $349)
Connecting(Invest $466)
Arrival Delay
On-‐time ArrivalSales $225
10%
90%
Arrival Delay(Invest $50)
On-‐time Arrival
60%
40%
($349)
($349)
($516)
($466)
EMV ($146.50)
EMV ($146.50)
EMV ($496)
EMV ($146.50)
EMV Diagram
EMV Diagram

Case Studies

Deepwater Horizon • Deepest oil well in history at more than 35,000 feet • Spill cleanup procedures and technology in 2009 were
essentially unchanged since the 1960s • Prior to the Deepwater Horizon disaster, BP considered deep
water blowouts in the Gulf of Mexico a high-level risk
Davis, M. (2012). Lessons Unlearned: The Legal and Policy Legacy of the BP Deepwater Horizon Spill. Washington and Lee Journal of Energy, Climate, and the Environment, 3(2), 155-170 Eilperin, J. (2010). "U.S. exempted BP's Gulf of Mexico drilling from environmental impact study". The Washington Post (The Washington Post Company)..
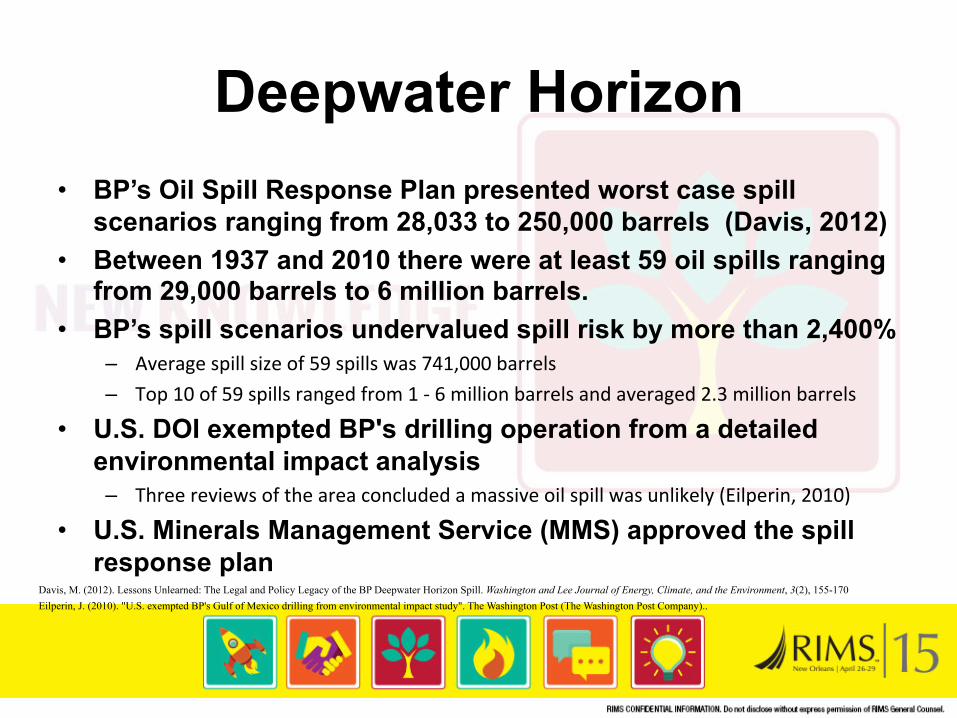
Deepwater Horizon • BP’s Oil Spill Response Plan presented worst case spill
scenarios ranging from 28,033 to 250,000 barrels (Davis, 2012) • Between 1937 and 2010 there were at least 59 oil spills ranging
from 29,000 barrels to 6 million barrels. • BP’s spill scenarios undervalued spill risk by more than 2,400%
– Average spill size of 59 spills was 741,000 barrels – Top 10 of 59 spills ranged from 1 -‐ 6 million barrels and averaged 2.3 million barrels
• U.S. DOI exempted BP's drilling operation from a detailed environmental impact analysis
– Three reviews of the area concluded a massive oil spill was unlikely (Eilperin, 2010)
• U.S. Minerals Management Service (MMS) approved the spill response plan
Davis, M. (2012). Lessons Unlearned: The Legal and Policy Legacy of the BP Deepwater Horizon Spill. Washington and Lee Journal of Energy, Climate, and the Environment, 3(2), 155-170 Eilperin, J. (2010). "U.S. exempted BP's Gulf of Mexico drilling from environmental impact study". The Washington Post (The Washington Post Company)..
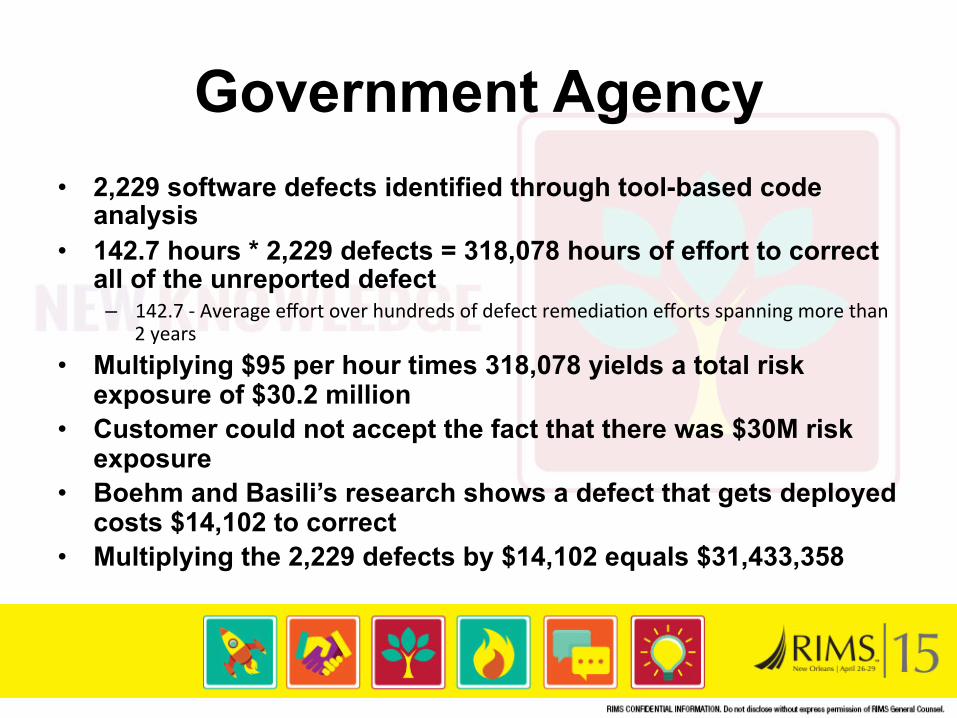
Government Agency • 2,229 software defects identified through tool-based code
analysis • 142.7 hours * 2,229 defects = 318,078 hours of effort to correct
all of the unreported defect – 142.7 -‐ Average effort over hundreds of defect remediaOon efforts spanning more than
2 years
• Multiplying $95 per hour times 318,078 yields a total risk exposure of $30.2 million
• Customer could not accept the fact that there was $30M risk exposure
• Boehm and Basili’s research shows a defect that gets deployed costs $14,102 to correct
• Multiplying the 2,229 defects by $14,102 equals $31,433,358

High reliability Organizations (HRO)
• Operate in environments where potential for disaster is high • Very high risk tolerance • Top priority is effective performance • Avoid disasters through collective learning • Develop a culture of reliability • Even firms without such catastrophic outcomes from risk
events can leverage the models used by HROs
Sullivan, J., & Beach, R. (2009, February). Improving project outcomes through operaOonal reliability: A conceptual model. Interna5onal Journal of Project Management, (27), 765-‐775.
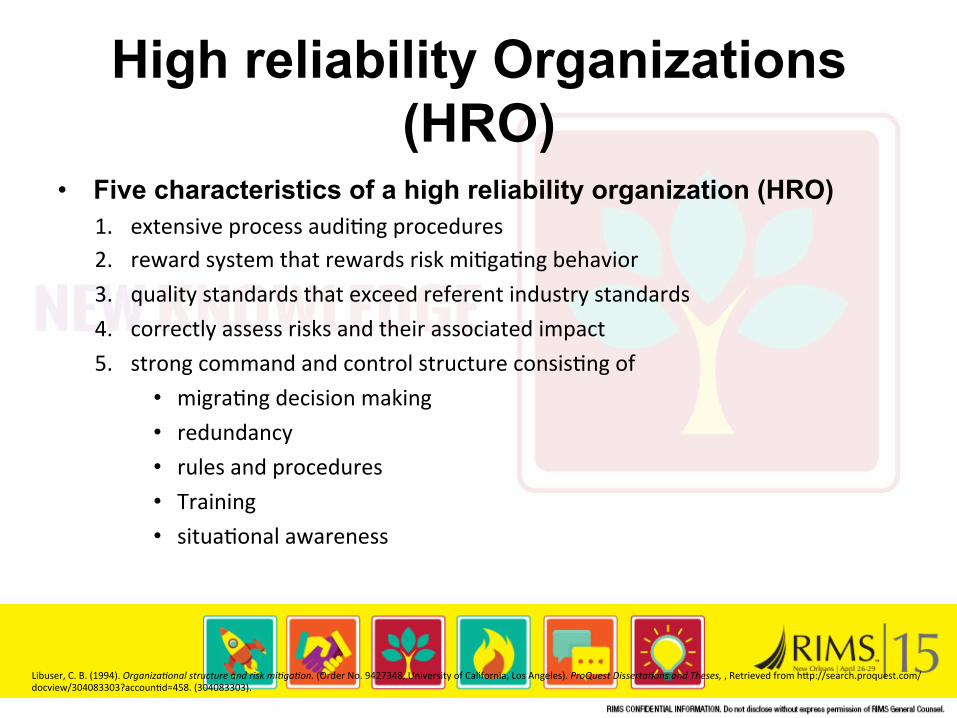
High reliability Organizations (HRO)
• Five characteristics of a high reliability organization (HRO) 1. extensive process audiOng procedures 2. reward system that rewards risk miOgaOng behavior 3. quality standards that exceed referent industry standards 4. correctly assess risks and their associated impact 5. strong command and control structure consisOng of
• migraOng decision making • redundancy • rules and procedures • Training • situaOonal awareness
Libuser, C. B. (1994). Organiza5onal structure and risk mi5ga5on. (Order No. 9427348, University of California, Los Angeles). ProQuest Disserta5ons and Theses, , Retrieved from hYp://search.proquest.com/docview/304083303?accounOd=458. (304083303).
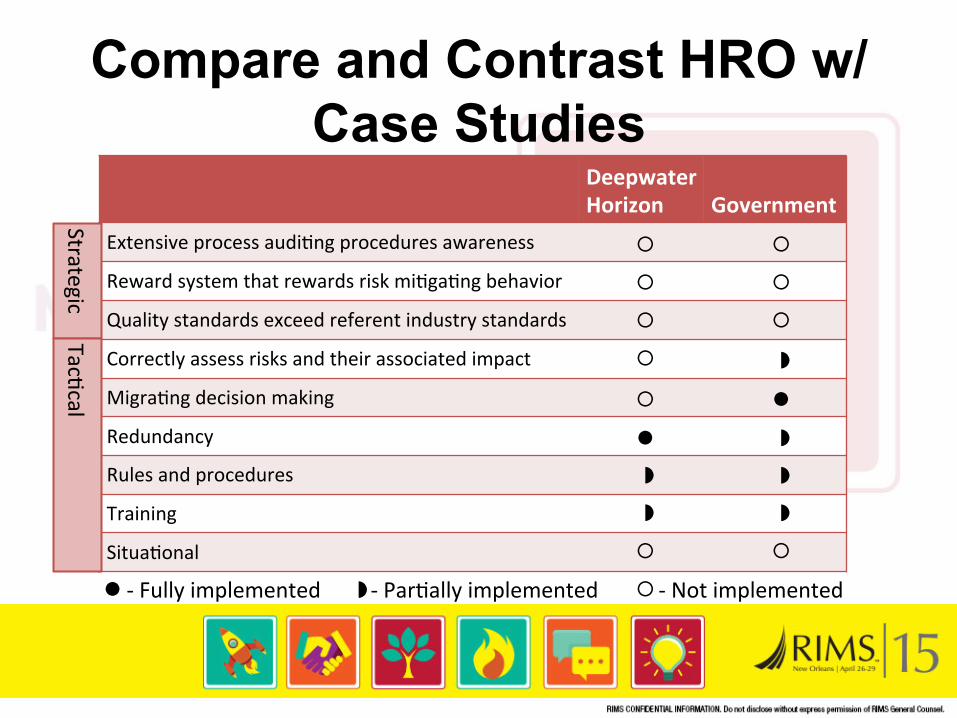
Compare and Contrast HRO w/Case Studies
Deepwater Horizon
Government
Extensive process audiOng procedures awareness
Reward system that rewards risk miOgaOng behavior
Quality standards exceed referent industry standards
Correctly assess risks and their associated impact
MigraOng decision making
Redundancy
Rules and procedures
Training
SituaOonal
Strategic TacOcal
◗
◗ ◗ ◗
◗ ◗
¡ ¡
l
l
l -‐ Fully implemented -‐ ParOally implemented -‐ Not implemented ◗ ¡
¡ ¡
¡ ¡
¡
¡ ¡
¡
Conclusion • Simplicity is the key to success • Quantifying risk elements does not require sophisticated tools
– EffecOve process and disciplined execuOon are criOcal success factors
• If possible, quantitative appetite, tolerance, and impact help avoid normalized deviance (lean toward science and away from art)
– Imitate HROs (e.g. effecOve performance, collecOve learning, culture of reliability)
• Proper risk valuation can avoid catastrophic risk impacts – Imitate HROs (e.g. reward risk miOgaOng behavior, correctly assess risks and their
associated impact)
• Effective ERM requires strategic and tactical elements that are complementary
Q&A • Joseph Mayo • www.jwmc-llc.com • [email protected] • @TaoOfRisk • 571-314-6661
• Jeff Vernor • [email protected] • 817-871-4822